stock time series pattern matching_ template-based vs_ rule-based approaches.pdf
TRANSCRIPT

7/25/2019 Stock time series pattern matching_ Template-based vs_ rule-based approaches.pdf
http://slidepdf.com/reader/full/stock-time-series-pattern-matching-template-based-vs-rule-based-approachespdf 1/18
Engineering Applications of Artificial Intelligence 20 (2007) 347–364
Stock time series pattern matching:
Template-based vs. rule-based approaches
Tak-chung Fua,, Fu-lai Chunga, Robert Luka, Chak-man Ngb
aDepartment of Computing, The Hong Kong Polytechnic University, Hunghom, Kowloon, Hong KongbDepartment of Computing and Information Management, Hong Kong Institute of Vocational Education Chai Wan,
30 Shing Tai Road, Chai Wan, Hong Kong
Received 23 February 2006; received in revised form 1 July 2006; accepted 19 July 2006
Available online 26 September 2006
Abstract
One of the major duties of financial analysts is technical analysis. It is necessary to locate the technical patterns in the stock price
movement charts to analyze the market behavior. Indeed, there are two main problems: how to define those preferred patterns (technical
patterns) for query and how to match the defined pattern templates in different resolutions. As we can see, defining the similarity between
time series (or time series subsequences) is of fundamental importance. By identifying the perceptually important points (PIPs) directly
from the time domain, time series and templates of different lengths can be compared. Three ways of distance measure, including
Euclidean distance (PIP-ED), perpendicular distance (PIP-PD) and vertical distance (PIP-VD), for PIP identification are compared in
this paper. After the PIP identification process, both template- and rule-based pattern-matching approaches are introduced. The
proposed methods are distinctive in their intuitiveness, making them particularly user friendly to ordinary data analysts like stock market
investors. As demonstrated by the experiments, the template- and the rule-based time series matching and subsequence searching
approaches provide different directions to achieve the goal of pattern identification.
r 2006 Elsevier Ltd. All rights reserved.
Keywords: Stock time series; Technical pattern; Whole series pattern matching; Subsequence pattern matching; Perceptually important point identification
1. Introduction
A time series is a collection of observations chronologi-
cally made. Time series data can be easily obtained from
various domains such as scientific, medical and financial
applications, e.g. daily temperatures, daily sales totals, and
prices of mutual funds and stocks. The time series data has
the nature of includes: large data size and high dimension-
ality. Therefore, researchers have been interested in findingsimilar time series (Das et al., 1997) and querying time
series database (Agrawal et al., 1993). Thus, defining the
similarity between time series (or time series segments) is of
fundamental importance. Abundant algorithms are existed
for measuring similarity between time series measuring the
Euclidean distance (ED).
Indeed, a large amount of time series data is from the
stock market. Stock time series has its own characteristics
over other time series data like electrocardiogram (ECG).
For example, technical analysis is usually used to identify
patterns of market behavior, which have a high probability
to repeat themselves. These patterns are similar in the
overall shape but with different amplitudes and/or dura-
tions. Moreover, these patterns can be characterized by a
few data points. For example, Fig. 1 shows the time seriespatterns that belong to the same technical pattern (i.e.
head-and-shoulder pattern) but with different outlooks.
Although these patterns may have a large ED, they should
also be strictly considered as similar.
In this paper, a flexible time series pattern matching
scheme that is customized to handle stock time series
patterns is introduced. Emphasis of this work is on stock
pattern matching and is generally referred to the technical
(analysis) patterns, such as head-and-shoulder or double
tops patterns. The proposed scheme adopts the time
ARTICLE IN PRESS
www.elsevier.com/locate/engappai
0952-1976/$ - see front matterr 2006 Elsevier Ltd. All rights reserved.
doi:10.1016/j.engappai.2006.07.003
Corresponding author. Tel.: +852 27667310; fax: +852 27740842.
E-mail address: [email protected] (T.-c. Fu).

7/25/2019 Stock time series pattern matching_ Template-based vs_ rule-based approaches.pdf
http://slidepdf.com/reader/full/stock-time-series-pattern-matching-template-based-vs-rule-based-approachespdf 2/18
domain approach, which is more intuitive to stock market
analysts since those critical points will not be smoothed out
as in other domains after transformation. It is able to carry
out matching between time series (or time series segments)
and query patterns of different lengths effectively and
efficiently. The approach will be explained with two sample
queries. Considering stock time series, one may expect
having queries like: Q1:Find all stocks which behave
‘‘similarly’’ to stock A.
Q2:Find all 1-week ‘‘head-and-shoulder’’ patterns in the
closing prices of a high-tech stock.
The query results are expected to provide useful
information for different stock analysis activities. Q1 is a
whole time series matching process and it can be considered
as follows. Given a query sequence Q ¼ (q1,y,qn) and a set
of data sequences P ¼ ( p1,y, pm) extracted from a dataset,
we want to identify a set of P that is similar to Q.
As for queries like Q2 in fact, are tightly coupled with the
patterns frequently used in technical analysis, e.g. head-
and-shoulder, double tops, triple tops, spike top, rounded
top, and it is a subsequence pattern-matching process.
We have a query sequence Q ¼ (q1,y,qn) and a longer
sequence P ¼ ( p1,y
, pm). The task is to find all thesubsequences S ¼ (s1,y,sw) in P , which match Q and
woom. Subsequence matching requires that the query Q
be placed at every possible offset. The sliding window is
commonly used, m-w+1 subsequences will be searched and
those fulfill the pattern-matching criteria will be located.
In this paper, our main focus is on stock time series
pattern matching, while both the whole time series and
subsequence matching will be discussed. The paper is
divided into five sections. Section 2 contains a discussion of
related works. The proposed stock time series pattern-
matching schemes is introduced in Section 3. The simula-
tion results are reported in Section 4 and the conclusion
will be in the final section.
2. Related works
A simple method to deal with pattern matching between
series is to compute the point-to-point distance so that the
average error among the data points in the sequences can
be measured. For mean-squared error distance measure,
the distance between sequences P ¼ ( p1,y, pm) and
Q ¼ (q1,y,qm) is computed as
DistðP ; QÞ ¼ 1
mX
m
k ¼1
ð pk qk Þ2. (1)
The main problem of point-to-point distance measure is
that the number of data points in the sequences has to be
the same, which cannot be satisfied by most applications.
A direct solution is to compress the longer time series by
evenly dividing it into segments of the same number as the
data points in the shorter time series and use the mean of
data points in each segment to represent the whole
segment. Mathematically, for sequences P ¼ ( p1,y, pm)
and Q ¼ (q1,y,qn) where npm, the distance measure is
DistðP ; QÞ ¼1
n
Xn
k ¼1
1
ek sk þ 1
Xek
i ¼sk
pi
! qk
" #2
, (2)
where sk and ek , respectively denote the starting and ending
data points of the k th segment in the longer sequence P (Yi
and Faloutsos, 2000; Keogh and Pazzani, 2000) and this
method is called piecewise aggregate approximation (PAA)
in (Keogh and Pazzani, 2000). However, this method may
not capture the general shape (structure) of the sequence
after the compression of the longer sequence due to the
potential of smoothing out the critical (perceptual im-
portant) points.
Therefore, devising an appropriate similarity function isby no means trivial. While the statistical literature on time
series analysis is vast, it has not addressed the similarity
notions that are applicable to specific domain directly. For
example, stock analysis. Recent works in time series
pattern matching can be categorized into two general
approaches. The first approach maps time sequences into
other domains while the second one processes the time
sequences directly in time domain. The transformation
approach, pioneered by Faloutsos et al. (1994), in general
computes a discrete Fourier transform (DFT) for each
sequence and selects the first few coefficients to index their
respective original sequences. Sequences with matching
coefficients are considered similar. While the focus of
Faloutsos et al. (1994) is on whole sequence matching, the
work of Agrawal et al. (1993) allows subsequence match-
ing. A framework based on wavelet decomposition is
presented by Struzik and Siebes (1998). Chan and Fu
(1999) applied discrete wavelet transform (DWT) for time
series pattern matching. For the time domain approach,
Keogh and Smyth (1997) proposed a probabilistic model
based on linear segmentation of time sequence in accor-
dance with prior knowledge for efficient representation.
Xia (1997) proposed methods for efficient retrieval of all
the series in the time series dataset with a shape similar to a
search template (in time domain).
ARTICLE IN PRESS
Fig. 1. Head-and-shoulder time series patterns.
T.-c. Fu et al. / Engineering Applications of Artificial Intelligence 20 (2007) 347–364348
7/25/2019 Stock time series pattern matching_ Template-based vs_ rule-based approaches.pdf
http://slidepdf.com/reader/full/stock-time-series-pattern-matching-template-based-vs-rule-based-approachespdf 3/18
Fast similarity searching in large time sequences typically
adopts ED as a dissimilarity measure. It is required to
permit local accelerations and decelerations in the rate of
sequences, leading to a popular, field-tested dissimilarity
measure called the ‘‘time warping’’ distance. Based on the
dynamic time warping (DTW) technique, the proposed
method predefines some patterns to serve as templates forthe purpose of pattern detection (Berndt and Clifford,
1994).
In this paper, we proposed two time series pattern-
matching approaches: template- and rule-based ap-
proaches. The pattern-matching methods focus on time
domain integrating the prior knowledge intuitively and are
relatively suitable in financial time series analysis literature
(i.e. technical analysis). In the next section, our proposed
stock time series pattern-matching methods will be
described in detail.
3. Stock time series pattern matching
The proposed scheme adopts the time domain approach,
which is more intuitive and understandable to stock market
analysts and investors. Time series pattern matching based
on perceptually important point (PIP) identification is first
introduced by Chung et al. (2001). As to the technical
analysis of stock data, the frequently used stock patterns
are typically characterized by a few critical points. For
example, the head-and-shoulder pattern should at least
consist of a head point, two shoulder points and a pair of
neck points. These points are perceptually important in the
human identification process and should also be taken intoaccounts in the pattern-matching process. The proposed
scheme follows this idea by locating those PIPs in the data
sequence P in accordance with the query sequence Q. The
whole time series pattern retrieval process can be divided
into two phrases, i.e. PIP identification and similarity
measure. Also, a controlled mechanism on the width of the
matching results, instead of fixing the length, during the
subsequence time series pattern-matching process will be
given at the end of this section.
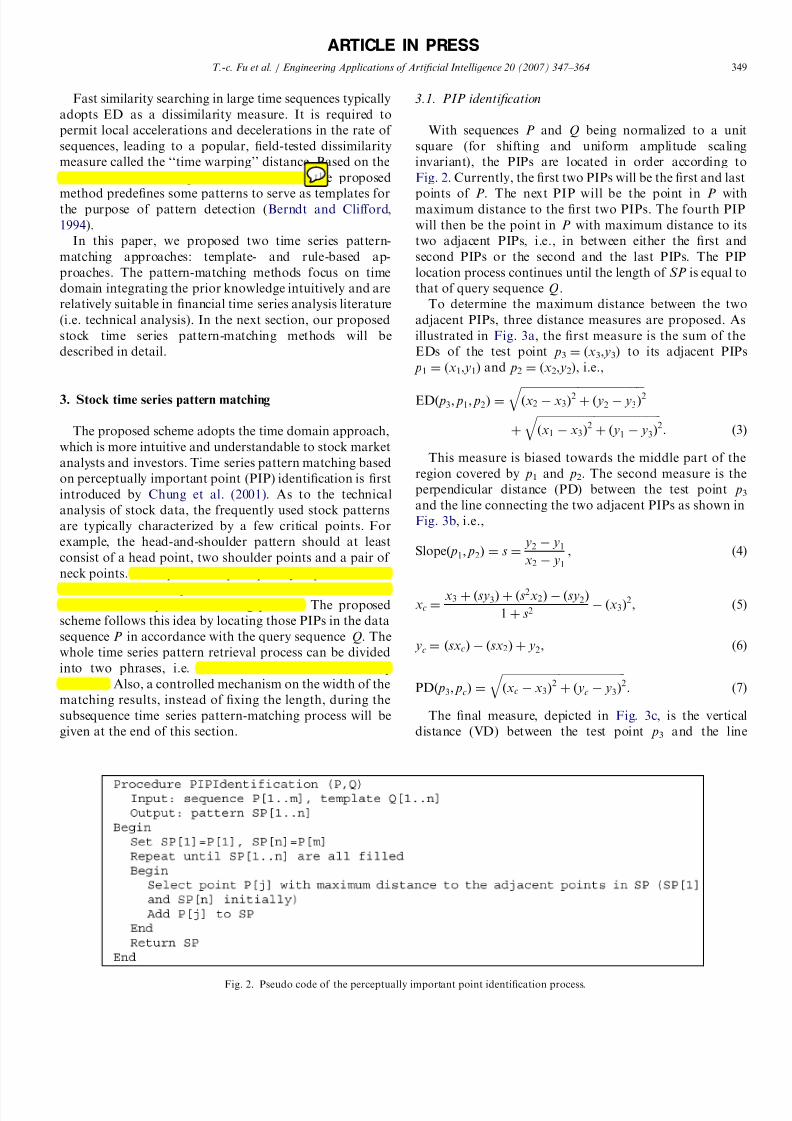
3.1. PIP identification
With sequences P and Q being normalized to a unit
square (for shifting and uniform amplitude scaling
invariant), the PIPs are located in order according to
Fig. 2. Currently, the first two PIPs will be the first and last
points of P . The next PIP will be the point in P withmaximum distance to the first two PIPs. The fourth PIP
will then be the point in P with maximum distance to its
two adjacent PIPs, i.e., in between either the first and
second PIPs or the second and the last PIPs. The PIP
location process continues until the length of SP is equal to
that of query sequence Q.
To determine the maximum distance between the two
adjacent PIPs, three distance measures are proposed. As
illustrated in Fig. 3a, the first measure is the sum of the
EDs of the test point p3 ¼ (x3, y3) to its adjacent PIPs
p1 ¼ (x1, y1) and p2 ¼ (x2, y2), i.e.,
EDð p3; p1; p2Þ ¼ ffiffiffiffiffiffiffiffiffiffiffiffiffiffiffiffiffiffiffiffiffiffiffiffiffiffiffiffiffiffiffiffiffiffiffiffiffiffiffiffiffiffiffiffiffiffiðx2 x3Þ
2 þ ð y2 y3Þ2
q þ
ffiffiffiffiffiffiffiffiffiffiffiffiffiffiffiffiffiffiffiffiffiffiffiffiffiffiffiffiffiffiffiffiffiffiffiffiffiffiffiffiffiffiffiffiffiffiðx1 x3Þ
2 þ ð y1 y3Þ2
q . ð3Þ
This measure is biased towards the middle part of the
region covered by p1 and p2. The second measure is the
perpendicular distance (PD) between the test point p3and the line connecting the two adjacent PIPs as shown in
Fig. 3b, i.e.,
Slopeð p1; p2Þ ¼ s ¼ y2 y1
x2 y1
, (4)
xc ¼x3 þ ðsy3Þ þ ðs2x2Þ ðsy2Þ
1 þ s2 ðx3Þ
2, (5)
yc ¼ ðsxcÞ ðsx2Þ þ y2, (6)
PDð p3; pcÞ ¼
ffiffiffiffiffiffiffiffiffiffiffiffiffiffiffiffiffiffiffiffiffiffiffiffiffiffiffiffiffiffiffiffiffiffiffiffiffiffiffiffiffiffiffiffiffiffiðxc x3Þ
2 þ ð yc y3Þ2
q . (7)
The final measure, depicted in Fig. 3c, is the vertical
distance (VD) between the test point p3 and the line
ARTICLE IN PRESS
Fig. 2. Pseudo code of the perceptually important point identification process.
T.-c. Fu et al. / Engineering Applications of Artificial Intelligence 20 (2007) 347–364 349

7/25/2019 Stock time series pattern matching_ Template-based vs_ rule-based approaches.pdf
http://slidepdf.com/reader/full/stock-time-series-pattern-matching-template-based-vs-rule-based-approachespdf 4/18
connecting the two adjacent PIPs, i.e.,
VDð p3; pcÞ ¼ yc y3
¼ y1 þ ð y2 y1Þ
xc x1
x2 x1
y3
,
(8)
where xc ¼ x3. It is intended to capture the fluctuation of
the sequence and the highly fluctuated points would then
be considered as PIPs.
To illustrate the identification process, the head-and-
shoulder pattern is used and Fig. 4 shows the step-by-step
result from the ED measure. Here, the number of data
points in the input sequence P and query sequence Q
are 29 and 7, respectively, i.e., m ¼ 29 and n ¼ 7. By using
the perpendicular and VD measures, the same set of
PIPs can be identified but the order in locating the fifth and
sixth points, corresponding to the lower right two figure
blocks, is interchanged. In both cases, the located PIPs
correspond pretty well to the shape of the head-and-
shoulder pattern.
After identifying the PIPs of the subsequence, a
similarity measuring mechanism is essential for pattern
matching. Two different approaches are introduced in the
following subsections.
3.2. Template-based pattern-matching approach
The direct way to achieve the goal of similarity measure
is template matching. By defining the shape of the
query patterns (pattern templates) visually, point-to-
point direct comparisons can be carried out. We termed
this process as the template-based approach. Together
with PIP identification, it was first introduced by Chung
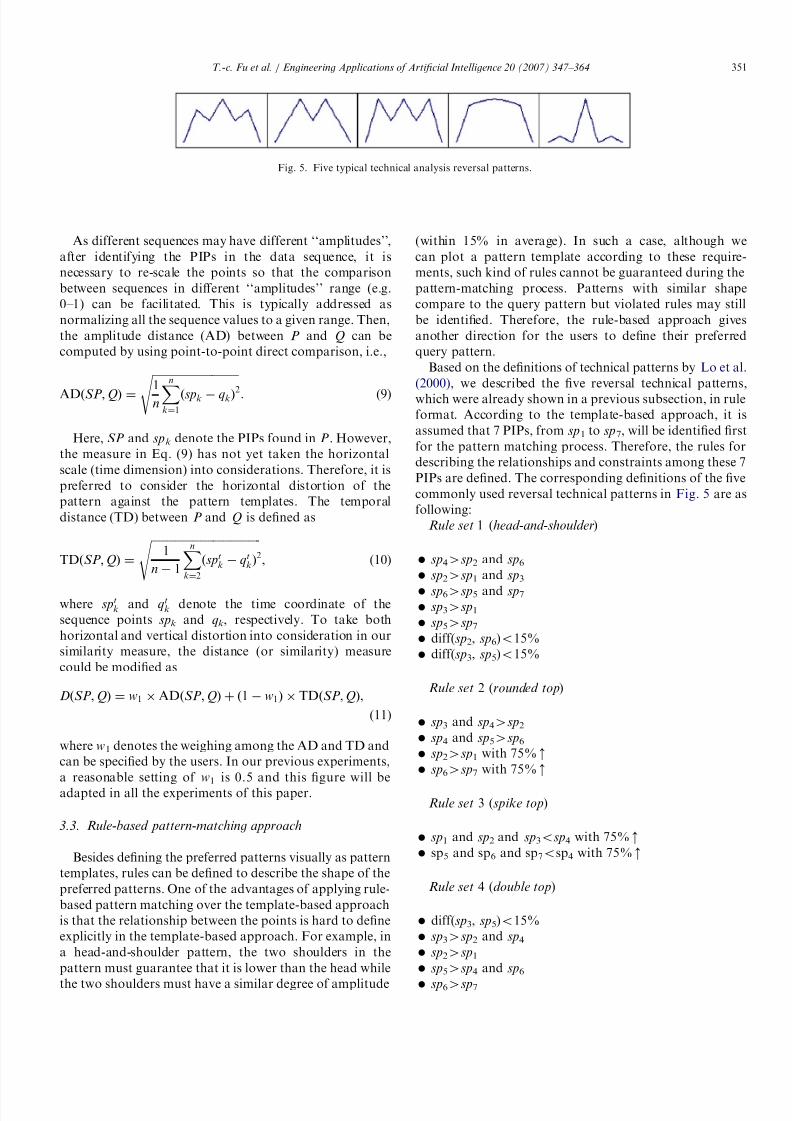
et al. (2001). Fig. 5 shows a set of typical reversal
technical analysis pattern templates with lengths equal to
7 PIPs.
ARTICLE IN PRESS
p3 (x3, y3) p3 (x3, y3)
p3 (x3, y3)
p3 (x2, y2) p3 (x2, y2)
p3 (x2, y2)
p1 (x1, y1) p1 (x1, y1)
p1 (x1, y1)
pc (xc, yc)
pc (xc, yc)
(a) (b)
(c)
a
b
d
d
Fig. 3. Distance measure for PIP Identification: (a) Euclidean distance based: PIP-ED, (b) perpendicular distance based: PIP-PD and (c) vertical distance
based: PIP-VD.
Fig. 4. Identification of 7 perceptually important points (head-and-shoulder pattern).
T.-c. Fu et al. / Engineering Applications of Artificial Intelligence 20 (2007) 347–364350
7/25/2019 Stock time series pattern matching_ Template-based vs_ rule-based approaches.pdf
http://slidepdf.com/reader/full/stock-time-series-pattern-matching-template-based-vs-rule-based-approachespdf 5/18
As different sequences may have different ‘‘amplitudes’’,
after identifying the PIPs in the data sequence, it is
necessary to re-scale the points so that the comparison
between sequences in different ‘‘amplitudes’’ range (e.g.
0–1) can be facilitated. This is typically addressed as
normalizing all the sequence values to a given range. Then,
the amplitude distance (AD) between P and Q can be
computed by using point-to-point direct comparison, i.e.,
ADðSP ; QÞ ¼ ffiffiffiffiffiffiffiffiffiffiffiffiffiffiffiffiffiffiffiffiffiffiffiffiffiffiffiffiffiffiffiffi1
nXn
k ¼1ðspk qk Þ2
s . (9)
Here, SP and spk denote the PIPs found in P . However,
the measure in Eq. (9) has not yet taken the horizontal
scale (time dimension) into considerations. Therefore, it is
preferred to consider the horizontal distortion of the
pattern against the pattern templates. The temporal
distance (TD) between P and Q is defined as
TDðSP ; QÞ ¼
ffiffiffiffiffiffiffiffiffiffiffiffiffiffiffiffiffiffiffiffiffiffiffiffiffiffiffiffiffiffiffiffiffiffiffiffiffiffiffiffiffi1
n 1Xn
k ¼2
ðsptk qt
k Þ2
s , (10)
where sptk and qt
k denote the time coordinate of the
sequence points spk and qk , respectively. To take both
horizontal and vertical distortion into consideration in our
similarity measure, the distance (or similarity) measure
could be modified as
DðSP ; QÞ ¼ w1 ADðSP ; QÞ þ ð1 w1Þ TDðSP ; QÞ,
(11)
where w1 denotes the weighing among the AD and TD and
can be specified by the users. In our previous experiments,
a reasonable setting of w1 is 0.5 and this figure will be
adapted in all the experiments of this paper.
3.3. Rule-based pattern-matching approach
Besides defining the preferred patterns visually as pattern
templates, rules can be defined to describe the shape of the
preferred patterns. One of the advantages of applying rule-
based pattern matching over the template-based approach
is that the relationship between the points is hard to define
explicitly in the template-based approach. For example, in
a head-and-shoulder pattern, the two shoulders in the
pattern must guarantee that it is lower than the head while
the two shoulders must have a similar degree of amplitude
(within 15% in average). In such a case, although we
can plot a pattern template according to these require-
ments, such kind of rules cannot be guaranteed during the
pattern-matching process. Patterns with similar shape
compare to the query pattern but violated rules may still
be identified. Therefore, the rule-based approach gives
another direction for the users to define their preferred
query pattern.
Based on the definitions of technical patterns by Lo et al.
(2000), we described the five reversal technical patterns,
which were already shown in a previous subsection, in rule
format. According to the template-based approach, it is
assumed that 7 PIPs, from sp1 to sp7, will be identified first
for the pattern matching process. Therefore, the rules for
describing the relationships and constraints among these 7
PIPs are defined. The corresponding definitions of the five
commonly used reversal technical patterns in Fig. 5 are as
following:
Rule set 1 (head-and-shoulder)
sp44sp2 and sp6 sp24sp1 and sp3
sp64sp5 and sp7 sp34sp1 sp54sp7 diff(sp2, sp6)o15%
diff(sp3, sp5)o15%
Rule set 2 (rounded top)
sp3 and sp44sp2 sp4 and sp54sp6 sp24sp1 with 75%m
sp64sp7 with 75%m
Rule set 3 (spike top)
sp1 and sp2 and sp3osp4 with 75%m
sp5 and sp6 and sp7osp4 with 75%m
Rule set 4 (double top)
diff(sp3, sp5)o15%
sp34sp2 and sp4 sp24sp1 sp54sp4 and sp6
sp64sp7
Fig. 5. Five typical technical analysis reversal patterns.
T.-c. Fu et al. / Engineering Applications of Artificial Intelligence 20 (2007) 347–364 351

7/25/2019 Stock time series pattern matching_ Template-based vs_ rule-based approaches.pdf
http://slidepdf.com/reader/full/stock-time-series-pattern-matching-template-based-vs-rule-based-approachespdf 6/18
Rule set 5 (triple top)
diff(sp2, sp4, sp6)o15%
diff(sp3, sp5)o15%
sp24sp1 and sp3 sp44sp3 and sp5
sp64sp5 and sp7
where diff(spx,sp y) denotes the difference between data
points spx and sp y, ‘‘spx and sp y4spz’’ denotes that spz must
be smaller than spx and sp y, ‘‘spx4sp y with z%m’’ specifies
that spx must be greater than sp y with z%.
With the defined rules, the sequences can then be
evaluated. First, the given number of PIPs (i.e. 7 in this
case) are identified from the sequences. Then, those
sequences which can validate all the rules from a given
query pattern are identified as a matching result.
3.4. Dynamic subsequence matching in time series
Direct time series comparison can be applied if it is
focused on whole matching. For subsequence matching, it
requires searching a specified pattern template within a
time series using a sliding window with a fixed window size
w. However, the pattern may appear in a different
resolutions rather than a fixed window size w. To find all
similar patterns within a time series, w must vary from 2 to
the length the time series m and the number of subsequence
needs to search becomes ðmðm 1ÞÞ=2. The similarity
measure between each subsequence and the query pattern
can then be calculated by the proposed time series pattern-matching approaches.
From the above definition, either a given window size w
must be presented or searched for all resolutions for time
series subsequence searching. However, unlike traditional
database queries, which seek for data that exactly matches
the given query exactly, subsequences that only slightly
differ in length from the given query sequence should be
allowed. For example, when a financial analyst querying
using Q1, subsequences with 6–8 trading days may be the
reasonable results but not only limited to 7 trading days.
On the other hand, it is also not possible to create a hugepattern space with all subsequences formed in a time series
(e.g., the co-existence of long-term and short-term sub-
sequences). Therefore, the introduction of a dynamic but
controllable subsequence searching technique is preferred.
To allow the searching of subsequences that are slightly
different from the preferable subsequence length (resolu-
tion), a mechanism that can control the length of the
subsequences towards the length specified by the users
during the searching process is preferred. To achieve this
goal, a temporal control penalty function is proposed and
defined as follows:
TCðSP Þ ¼ 1 expðd 1=y1Þ
2
, (12)
where d 1 ¼ slendlen, that is, the difference between
subsequence length (slen) and the desired subsequence
length (dlen) specified by the users. The parameter y1 is
used to control the sharpness of the function, hence the
strength of the temporal control. It is defined as follows:
y1 ¼ dlen=dlc; (13)
where dlc is the desired length control parameter. Larger
dlc values will lead to smaller y1 values and this will
strengthen the temporal control (i.e., a shorter distance
between a subsequence length and the desired length is
greatly preferred).For example, if the desired subsequence length dlen is
180 (e.g., 180 trading days) and dlc is set to 2, then y1 ¼ 90,
and the temporal control penalty function will look like
Fig. 6a. However, if dlc is set to 6 (y1 ¼ 30), the temporal
ARTICLE IN PRESS
1
0.9
0.8
0.7
0.6
0.5
0.4
0.3
0.2
0.1
0
-200 -150 -100 -50 0 50 100 150 200
1
0.9
0.8
0.7
0.6
0.5
0.4
0.3
0.2
0.1
0-200 -150 -100 -50 0 50 100 150 200
(a) (b)
Fig. 6. Temporal control penalty function (dlen ¼ 180).
T.-c. Fu et al. / Engineering Applications of Artificial Intelligence 20 (2007) 347–364352

7/25/2019 Stock time series pattern matching_ Template-based vs_ rule-based approaches.pdf
http://slidepdf.com/reader/full/stock-time-series-pattern-matching-template-based-vs-rule-based-approachespdf 7/18
control is strengthened (see Fig. 6b) by adding a greater
penalty to the similarity measure for patterns with a length
different from the desired one.
By defining the penalty function, only the lengths of the
subsequence that fulfill the requirement (i.e. below a certain
level of penalty score) are needed to evaluate. On the other
hand, the subsequences that are very similar to the querypattern but with a longer or shorter length (compared to
the preferred length defined by the user) can still be
retrieved given that their penalty scores are within an
acceptable level.
4. Experiment results
In this section, we empirically demonstrate the perfor-mance of the proposed methods. We have adopted five
ARTICLE IN PRESS
Fig. 7. Pseudo code of generating the time series pattern variants.
Fig. 8. Sample synthetic time series: head-and-shoulder (H&S), double top, triple top, rounded top and spike top (from left to right).
Fig. 9. Sample real technical patterns identified from the subsequences of stock time series: (a) head-and-shoulder, (b) double tops and (c) rounded top.
T.-c. Fu et al. / Engineering Applications of Artificial Intelligence 20 (2007) 347–364 353

7/25/2019 Stock time series pattern matching_ Template-based vs_ rule-based approaches.pdf
http://slidepdf.com/reader/full/stock-time-series-pattern-matching-template-based-vs-rule-based-approachespdf 8/18
ARTICLE IN PRESS
0
2000
4000
6000
8000
10000
12000
14000
16000
18000
200 400 600 800 1000 1200 1400 1600 1800 2000 2200 2400 2532
P r o c e s s i n g t i m e ( m
i l l i s e c o n d s ) .
VD ED PD
Number of PIPs
Processing time vs. different number of PIPs identified
Fig. 10. Processing time with different numbers of PIP identified.
20.00%
30.00%
40.00%
50.00%
60.00%
70.00%
80.00%
90.00%
100.00%
10 20 30 40 50 60 70 80 90 100 110 135
A c c u r a c y
Number of series retrieved
120 130
Accuracy vs. number of series retrieved
VD ED PD
Fig. 11. Accuracy of retrieval by different PIP identification methods.
0.00%
10.00%
20.00%
30.00%
40.00%
50.00%
60.00%
70.00%
80.00%
90.00%
30 40 50 60 70 80 90 100 110 120 130 135
A c c u r a c y
Template Rule PAA
100.00%
Number of retrieved series
Average accuracy for the synthetic dataset
Fig. 12. Accuracy of retrieval for the synthetic dataset.
T.-c. Fu et al. / Engineering Applications of Artificial Intelligence 20 (2007) 347–364354

7/25/2019 Stock time series pattern matching_ Template-based vs_ rule-based approaches.pdf
http://slidepdf.com/reader/full/stock-time-series-pattern-matching-template-based-vs-rule-based-approachespdf 9/18
commonly used technical patterns as the query patterns
and for synthetic sequence generations in our experiments.
As shown in Fig. 5, they are of scale equal to seven sample
points, i.e., n ¼ 7. In the first experiment, the performance
of different PIP identification methods (i.e. ED, PD and
VD) is tested. Then, we simulated two sets of experiments,
based on synthetic and real-time series, respectively, tocompare the accuracy of the proposed template- and rule-
based approaches. Accuracy here is defined as the
percentage of the number of correct series retrieved from
the dataset by retrieving a given number of series when a
query pattern is given (i.e. the five technical patterns
are used to serve as the query pattern in the experiments).
That is
Accuracy ¼ number of correctly retrieved seriestotal number of relevant series in the dataset
.
(14)
ARTICLE IN PRESS
Fig. 13. PIP identified by the proposed approach on the sample head-and-shoulder patterns.
T.-c. Fu et al. / Engineering Applications of Artificial Intelligence 20 (2007) 347–364 355

7/25/2019 Stock time series pattern matching_ Template-based vs_ rule-based approaches.pdf
http://slidepdf.com/reader/full/stock-time-series-pattern-matching-template-based-vs-rule-based-approachespdf 10/18
Pattern matching using PAA (Keogh and Pazzani,
2000) is adopted as the benchmarking method. The effect
of fine-tuning the rules is evaluated afterwards. Finally, the
result of subsequence pattern matching by using the
template- and rule-based pattern-matching approaches is
shown.
4.1. Datasets
For the synthetic time series dataset, it consists of
135 time series with different lengths, which includes 25,
43 and 61. Each of them belongs to one of the five
technical patterns, head-and-shoulder, double tops,
ARTICLE IN PRESS
Fig. 14. PAA result on the sample head-and-shoulder patterns.
T.-c. Fu et al. / Engineering Applications of Artificial Intelligence 20 (2007) 347–364356

7/25/2019 Stock time series pattern matching_ Template-based vs_ rule-based approaches.pdf
http://slidepdf.com/reader/full/stock-time-series-pattern-matching-template-based-vs-rule-based-approachespdf 11/18
triple tops, rounded top and spike top (Fig. 5). Each
technical pattern is generated to 27 variants by applying
different levels of scaling, time wrapping and noise.
First, the patterns are uniform time scaling from 7 data
points to 25, 43 and 61 data points. Then, each critical
point of the patterns can be warped between its previous
and next critical points. Finally, noise is added to the set of patterns. The increase of noise is controlled by two
parameters, namely, the probability of adding noise for
each data point a and the level of noise being added to such
point b. The pseudo code of the aforementioned variant
generation process is shown in Fig. 7. Sample synthetic
time series are shown in Fig. 8.
For the real dataset, 50 stock time series subsequences
were identified by human. Each subsequence is labeled byone of the five technical patterns. Their lengths are between
ARTICLE IN PRESS
Fig. 15. PIP identified by the proposed approach on the sample spike top patterns.
T.-c. Fu et al. / Engineering Applications of Artificial Intelligence 20 (2007) 347–364 357

7/25/2019 Stock time series pattern matching_ Template-based vs_ rule-based approaches.pdf
http://slidepdf.com/reader/full/stock-time-series-pattern-matching-template-based-vs-rule-based-approachespdf 12/18
22 and 592 and the average length is 94. Fig. 9 shows three
real technical pattern samples selected from the subse-
quences of stock time series.
4.2. Performance of different PIP identification methods
First, the efficiency and effectiveness of differentPIP identification methods including the measurement of
the VD, the PD and the ED are compared. The point-
to-point similarity measure is then applied. To evaluate
the efficiency, the Hong Kong Hang Seng Index (HSI)
series with 2532 data points is used. Fig. 10 plots the time
needed to identify different numbers of PIP. Measuring
the VD is the fastest method. Measuring the PD is double
in speed of VD while measuring the ED is triple in speedof VD.
ARTICLE IN PRESS
Fig. 16. PAA result on the sample spike top patterns.
T.-c. Fu et al. / Engineering Applications of Artificial Intelligence 20 (2007) 347–364358

7/25/2019 Stock time series pattern matching_ Template-based vs_ rule-based approaches.pdf
http://slidepdf.com/reader/full/stock-time-series-pattern-matching-template-based-vs-rule-based-approachespdf 13/18
ARTICLE IN PRESS
0.00%
10.00%
20.00%
30.00%
40.00%
50.00%
60.00%
70.00%
80.00%
90.00%
100.00%
Head-and-shoulder
Rounded Top Double Top Triple Top Spike Top
A c c u r a c y
Template Rule PAA
Technical Analysis Pattern
Accuracy for different technical analysis patterns
Fig. 18. Accuracy of retrieval (50 out of 135) for different technical patterns.
10.00%
20.00%
30.00%
40.00%50.00%
60.00%
80.00%
90.00%
100.00%
10 20 30 40 50
A c c u
r a c y
Template Rule PAA
70.00%
0.00%
Number of retrieved series
Average accuracy for the real dataset
Fig. 17. Accuracy of retrieval for the real dataset.
30.00%
90.00%
A c c u r a c y
Head-and-shoulder Rounded Top Double Tops Triple Tops Spike Top
100.00%
80.00%
70.00%
60.00%
50.00%
40.00%
20.00%
10.00%
0.00%-10% -5%
Rule tuning
original% +5% +10%
Accuracy of rule tuning
Fig. 19. Accuracy of rule tuning.
T.-c. Fu et al. / Engineering Applications of Artificial Intelligence 20 (2007) 347–364 359

7/25/2019 Stock time series pattern matching_ Template-based vs_ rule-based approaches.pdf
http://slidepdf.com/reader/full/stock-time-series-pattern-matching-template-based-vs-rule-based-approachespdf 14/18
To evaluate the effectiveness of different PIP identifica-
tion methods, they are tested on the accuracy of retrieving
the synthetic dataset. As shown in Fig. 11, PD has the
highest accuracy among all the numbers of series retrieved.
The accuracy of VD is closed to that of PD, the difference
of the accuracy between VD and PD is less than 0.04. ED
has the worst performance compared to that of the PD andthe ED. By considering both efficiency and effectiveness,
VD is the best choice for the PIP identification process and
it will be adopted in the remaining experiments.
4.3. Whole sequence matching
In this section, the accuracy of using different methods
to retrieve different numbers of time series from the
synthetic dataset for measuring the similarity are com-
pared. The proposed template- and rule-based approaches
after the PIP identification process will be tested. VD is
used in the PIP identification process. Also, w1 is set to 0.5
for the template-based approach. The proposed ap-
proaches are benchmarked with a popular time series
pattern-matching method: PAA. By using PAA, thedimension of the time series will be reduced to the same
as the minimum length of the time series in the dataset
(i.e. 25 in this experiment). Fig. 12 shows the average
accuracy of the pattern-matching approaches on the
synthetic dataset. The proposed approaches outper-
formed the traditional pattern-matching method (PAA)
especially when the number of series retrieved is small.
The PIP identification-based methods have outstanding
ARTICLE IN PRESS
0.00%
10.00%
20.00%
30.00%
40.00%
50.00%
60.00%
70.00%
80.00%
90.00%
P r e c i s i o n
Head-and-shoulder Rounded Top Triple Tops Spike Top
Precision during rule tuning
100.00%
-10% -5% original%
Rule tuning
+5% +10%
Double Tops
Fig. 20. Precision of rule tuning.
0
2
4
6
8
10
12
14
16
18
20
90
t i m e ( s e c o n d )
Template Rule
length of subsequence
360180
Fig. 21. Comparison the speed for subsequence searching between template-based and rule-based approaches.
T.-c. Fu et al. / Engineering Applications of Artificial Intelligence 20 (2007) 347–364360

7/25/2019 Stock time series pattern matching_ Template-based vs_ rule-based approaches.pdf
http://slidepdf.com/reader/full/stock-time-series-pattern-matching-template-based-vs-rule-based-approachespdf 15/18
performance in the technical pattern-matching process
because these approaches compare the overall shape of the
series instead of using point-to-point comparison. When
matching the technical pattern, the similarity of the
outlook of the pattern is much more important than the
point-to-point distance of all the data points in the series,
especially when the shape of the pattern is warped.Then, the visualization effect of each approach is
evaluated in detail. First, Fig. 13 shows the sample results
of the PIP identification process for capturing the shape of
the head-and-shoulder pattern. As shown in the figure, all
the three patterns, which the shape were warped and noise
was added, the seven correct PIPs were identified and a
head-and-shoulder shape was captured in the matching
process. However, the shape of the head-and-shoulder
can only be retained in the first sample when using PAA
(Fig. 14a). Smoothing effect can be seen in the second and
third samples (Fig. 14b and c) which the original shape of
the patterns are warped. Similar result can be seen in the
spike top samples as shown in Figs. 15 and 16. By using the
PIP approach, the shape of the spike top pattern can be
captured even the pattern is warped (Fig. 15b and c) while
the PAA smoothed out the spike top when the shape of the
pattern is distorted (Fig. 16b and c). To sum up, the
performance of PAA is worse than the two methods based
on PIPs especially when the number of retrieved series is
small. The problem of PAA is due to its mechanism will
smooth out the critical points of the series.
On the other hand, the accuracy of the rule-based
method kept constant in Fig. 12. It is because the rule-
based method will only be determined if a series fulfils the
criteria set by the rules during the matching process.Therefore, the number of series retrieved would not affect
the accuracy. Instead, the way to increase the accuracy of
the rule-based approach is fine-tuning the rules.
A similar result is obtained by applying the three
pattern-matching approaches on the real dataset as shown
in Fig. 17. The proposed template-based approach out-
performed the benchmarking approach. However, the
performance of the rule-based approach is worse than the
PAA this time. It is because the patterns from the stock
time series identified by human are subjective and the
variation is much higher. Therefore, these time series
patterns are much harder to fulfill the criteria of the rules.
As we can see, the overall performance on the real dataset
is worse than that of the synthetic dataset.
In the last experiment of this subsection, the character-
istics of different pattern-matching approaches on the five
technical patterns were studied. The synthetic dataset was
used. As shown in Fig. 18, the template-based approach
worked well on the head-and-shoulder, rounded top, triple
tops and spike top patterns. However, they were weak at
identifying the rounded top pattern as it is hard to identify
the PIPs in a rounded top pattern. A rounded top pattern is
difficult to characterize by the criteria points. Moreover,
the result shows the strength of the rule-based approach. It
can distinguish the head-and-shoulder, triple tops and
double tops patterns successfully which is a difficult task
for the template-based and PAA approaches.
4.4. Rule tuning
For the rule-based pattern-matching approach, as the
time series will either fulfill or not fulfill the criteria of the
ARTICLE IN PRESS
Fig. 22. Identification of a ‘‘Triple Top’’ pattern using different
approaches (a) PAA, (b) template-based and (c) rule-based (dlen ¼ 90).
T.-c. Fu et al. / Engineering Applications of Artificial Intelligence 20 (2007) 347–364 361

7/25/2019 Stock time series pattern matching_ Template-based vs_ rule-based approaches.pdf
http://slidepdf.com/reader/full/stock-time-series-pattern-matching-template-based-vs-rule-based-approachespdf 16/18
rules, the number of query result will not affect the
accuracy. In this subsection, the accuracy and the precision
are adopted to measure the performance of the rule-based
matching approach. Precision is defined as the percentage
of correct pattern among the time series that fulfilled thecriteria of the rules for describing a query pattern. The
synthetic dataset is used to evaluate the effect of tuning the
rules. The acceptance range in the rules varies from –10%
to 10% to evaluate the effect. For example, the acceptance
of the differences between the data points in the head-and-
shoulder pattern (i.e. rules: diff(sp2, sp6)o15% and diff(sp3,
sp5)o15%) are adjusted to 5%, 10%, 15% (original), 20%
and 25%.
Figs. 19 and 20 show the accuracy and precision. By
tuning the rules, the accuracy for each query pattern is
adjusted, except the rounded top pattern. By relaxing the
rules, the number of correct patterns retrieved increased.
However, the number of wrong patterns retrieved is
also increased. As a result, the precision is almost
unchanged, except that when the acceptance range of the
spike top pattern is adjusted to +10%. The number of
match patterns becomes zero. In conclusion, the tightening
or relaxing of the rules depends on the usage of the
analysts.
4.5. Subsequence matching in stock time series
In the last experiment, the subsequence pattern matching
result based on the proposed approaches is shown. Again,
PAA is adopted as the benchmark. The five commonly
used reversal technical analysis patterns, as shown in
Fig. 5, were used in testing the template-based pattern-
matching approach, while the definitions in Section 3.3
were used for the rule-based approach as the query
patterns. The past 10 years Hong Kong HSI time series isused (2532 data points) for the identification of different
query patterns defined. First, the processing time for
subsequence searching is compared in Fig. 21. Similar time
was needed for subsequence searching in the two proposed
approaches. However, in the rule-based approach, there
was a great variation in speed among different patterns. It
depends on the number of rules needed to be verified. On
the other hand, the speed was nearly the same among
different patterns by using the template-based approach
because the distance is calculated based on the same
number of data points.
From the visualization results (Figs. 22–26), in general,
the PAA approach has more mismatched subsequences.
The template-based approach provides more accurate
results. However, wrong identification is still appeared
and the query results cannot fulfill the criteria of the query
pattern, which is important in technical analysis in the
financial domain. In Fig. 22, we tried to identify the triple
tops pattern with length ¼ 90 but some of the identified
subsequences by template-based approach (Fig. 22b) (also
by PAA approach (Fig. 22a)) were more like a head-and-
shoulder pattern. It is because the shape of the triple tops
and the head-and-shoulder patterns are similar in outlook
when represented by the query patterns. In such a case, the
rule-based approach can facilitate to specify the constraints
ARTICLE IN PRESS
Fig. 23. Zoom-in of the subsequence identified by rule-based approach in Fig. 22 (c) (i.e. ‘‘Triple Top’’ pattern).
T.-c. Fu et al. / Engineering Applications of Artificial Intelligence 20 (2007) 347–364362

7/25/2019 Stock time series pattern matching_ Template-based vs_ rule-based approaches.pdf
http://slidepdf.com/reader/full/stock-time-series-pattern-matching-template-based-vs-rule-based-approachespdf 17/18
and rules can be used for describing the shape of the query
pattern and the relationship among the data points in the
pattern. Therefore, the rule-based approach is more
effective in distinguishing such kinds of pattern template.
As we can see, all the head-and-shoulder-like subsequences
were filtered using the rule-based approach during the
searching of triple tops patterns and another view of
subsequence is identified in Fig. 22c (zoom-in is shown in
Fig. 23).
Furthermore, depending on the complexity and con-
strains of the rules defined, less subsequences can fulfill the
rules when more constraints are applied such as the case in
this experiment. Fig. 24 shows an example with similar
behavior that head-and-shoulder-like patterns were ob-
tained when querying a spike top pattern in dlen ¼ 180
with the template-based approach (Fig. 24b). However,
there is no such problem in the rule-based approach
(Fig. 24c, zoom-in of the subsequence is shown in Fig. 25).
Fig. 26 shows another example for searching head-and-
shoulder subsequences with dlen ¼ 360.
5. Conclusion
In this paper, two flexible time series pattern-matching
approaches, template- and rule-based approaches, based
on perceptually important points are introduced for time
series pattern searching. They follow the time domain
approach to carry out the matching process and are
intuitive to ordinary data analysts. One may find it
particularly attractive in applications like stock data
analysis. The proposed approaches are efficient and also
effective. As demonstrated in the experiments, the tem-
plate-based approach provides an effective time series
pattern matching tool, while the rule-based approach
provides further ability for describing the query patterns
and is constrainable on the shape of the query patterns.
Future work includes developing a hybrid pattern-match-
ing algorithm based on both the template- and rule-based
approaches to obtain their advantages. That is, using a
template-based approach to obtain its visualization flex-
ibility, while the rule-based approach is used to specify the
necessary requirements and constraints of the query
pattern. Moreover, the importance of the data points (the
identification order of the PIPs) can be taken into account
during the similarity measure.
ARTICLE IN PRESS
Fig. 24. Identification of a ‘‘Spike Top’’ pattern using different
approaches (a) PAA, (b) template-based and (c) rule-based (dlen ¼ 180).
Fig. 25. Zoom-in of the subsequence identified by rule-based PIP
approach in Fig. 24(c) (i.e. ‘‘Spike Top’’ pattern).
T.-c. Fu et al. / Engineering Applications of Artificial Intelligence 20 (2007) 347–364 363

7/25/2019 Stock time series pattern matching_ Template-based vs_ rule-based approaches.pdf
http://slidepdf.com/reader/full/stock-time-series-pattern-matching-template-based-vs-rule-based-approachespdf 18/18
References
Agrawal, R., Faloutsos, C., Swami, A.N., 1993. Efficient similarity search
in sequence databases. In: Proceedings of the Fourth International
Conference on Foundations of Data Organization and Algorithms,
pp. 69–84.
Berndt, D.J., Clifford, J. 1994. Using dynamic time warping to find
patterns in time series. In: Working Notes of the Knowledge Discoveryin Databases Workshop, pp. 359–370.
Chan, K.P., Fu, A.C. 1999. Efficient Time Series Matching by Wavelets.
Proceedings of the 15th International Conference on Data Engineering
(ICDE), pp. 126–133.
Chung, F.L., Fu, T.C., Luk, R., Ng, V. 2001. Flexible time series pattern
matching based on perceptually important points. In: International
Joint Conference on Artificial Intelligence (IJCAI) Workshop on
Learning from Temporal and Spatial Data, pp. 1–7.
Das, G., Gunopulos, D., Mannila, H. 1997. Finding similar time series. In:
Proceedings of the European Conference on Principles and Practice of
Knowledge Discovery in Databases (PKDD), pp. 88–95.
Faloutsos, C., Ranganathan, M., Manolopoulos, Y. 1994. Fast subse-
quence matching in time-series databases. In: Proceedings of the 1994
ACM SIGMOD Conference on Management of Data (SIGMOD),
pp. 419–429.Keogh, E., Pazzani, M. 2000. A simple dimensionality reduction technique
for fast similarity search in large time series databases. In: Proceedings
of the Fourth Pacific-Asia Conference on Knowledge Discovery and
Data Mining (PAKDD), pp. 122–133.
Keogh, E., Smyth, P. 1997. A probabilistic approach to fast pattern
matching in time series databases. In: Proceedings of the Third
International Conference on Knowledge Discovery and Data Mining
(KDD), pp. 24–30.
Lo, A.W., Mamaysky, H., Wang, J., 2000. Foundations of technical
analysis: computational algorithms, statistical inference, and empirical
implementation. Journal of Finance 55 (4), 1705–1765.
Struzik, Z.R., Siebes, A.P.J.M. 1998. Wavelet transform in similarity
paradigm. In: Proceedings of the Pacific-Asia Conference on Knowl-
edge Discovery and Data Mining (PAKDD), pp. 295–309.
Xia, B.B. 1997. Similarity search in time series data sets. M.Sc. Thesis,Department of Computing Science, Simon Fraser University.
Yi, B., Faloutsos, C. 2000. Fast time sequence indexing for arbitrary Lp
norms. In: Proceedings of the 26th International Conference on Very
Large Data Bases (VLDB), pp. 385–394.
ARTICLE IN PRESS
Fig. 26. Identification of a ‘‘head and shoulders’’ pattern using different
approaches (a) PAA, (b) template-based and (c) rule-based (dlen ¼ 360).
T.-c. Fu et al. / Engineering Applications of Artificial Intelligence 20 (2007) 347–364364