stochastic analyses of electric vehicle charging impacts on distribution network
TRANSCRIPT

This article has been accepted for inclusion in a future issue of this journal. Content is final as presented, with the exception of pagination.
IEEE TRANSACTIONS ON POWER SYSTEMS 1
Stochastic Analyses of Electric VehicleCharging Impacts on Distribution Network
Rong-Ceng Leou, Member, IEEE, Chun-Lien Su, Member, IEEE, and Chan-Nan Lu, Fellow, IEEE
Abstract—A stochastic modeling and simulation technique foranalyzing impacts of electric vehicles charging demands on distri-bution network is proposed in this paper. Different from the pre-vious deterministic approaches, the feeder daily load models, elec-tric vehicle start charging time, and battery state of charge usedin the impact study are derived from actual measurements andsurvey data. Distribution operation security risk information, suchas over-current and under-voltage, is obtained from three-phasedistribution load flow studies that use stochastic parameters drawnfrom Roulette wheel selection. Voltage and congestion impact indi-cators are defined and a comparison of the deterministic and sto-chastic analytical approaches in providing information requiredin distribution network reinforcement planning is presented. Nu-merical results illustrate the capability of the proposed stochasticmodels in reflecting system losses and security impacts due to elec-tric vehicle integrations. The effectiveness of a controlled chargingalgorithm aimed at relieving the system operation problem is alsopresented.
Index Terms—Controlled charge, distribution feeder operationand planning, electric vehicle impact study, load model, stochasticsimulations.
I. INTRODUCTION
D UE to the advancement of electric vehicle (EV) tech-nology, it has been shown that an EV charge demand
could reach to or higher than that of a regular household. Adop-tion of EV could create high demand level that overloads distri-bution system equipment and cause low voltage to customers.The existing distribution network would face great challengewhen EV penetration is high. In order to mitigate the problemand fulfill the utility’s goals for power distribution, impact anal-ysis and optimal scheduling of operation changes and future re-inforcement are required.EV industry trends, charge and discharge scenarios, and im-
pacts on distribution system are reviewed in [1]. Evaluationmethods and factors to be considered in analyzing the impactsof EV charge on distribution network can be found in [2]–[6].
Manuscript received January 03, 2013; revised June 02, 2013 and September13, 2013; accepted November 14, 2013. The is work was supported by NationalScience Council of Taiwan and Taiwan Power Company under contract NSC100-3113-p-110-004. Paper no. TPWRS-01355-2012.R.-C. Leou is with the Department of Electrical Engineering, Cheng Shiu
University, Niao-Song, Kaohsiung, Taiwan (e-mail: [email protected]).C.-L. Su is with the Department of Marine Engineering, National Kaohsiung
Marine University, Kaohsiung, Taiwan (e-mail: [email protected]).C.-N. Lu is with the Department of Electrical Engineering, National Sun
Yat-Sen University, Kaohsiung, Taiwan (e-mail: [email protected]).Color versions of one or more of the figures in this paper are available online
at http://ieeexplore.ieee.org.Digital Object Identifier 10.1109/TPWRS.2013.2291556
Typical driving patterns, battery characteristics, consumer pref-erences are important factors to be considered. Severl impactfactors are quantified in [2]. An EV charge impact assessmentprocedure includes data collections, statistical clustering, feedermodeling, determination of charging scenarios, feeder analysisand mitigation is presented in [3].EV charge impact is closely related to the load patterns of
existing feeder nodes, charging locations, start charging time,battery state of charge (SOC) during charging, charging modeand capacity of battery. EV charging station measurements haveindicated that these parameters are highly uncertain [7], thus, thecomplexity of distribution system operations and planning willincrease as EV penetration becomes high.Stochastic models are adopted to take into account the uncer-
tainties related to EV charging loads such as charging classes,locations and charging load profiles [8]–[11]. These studiesallow for an estimation of different levels of EV penetration onthe load of the power grid as well as the potentials of mobileenergy storage systems for grid services.Incremental expenditure of network reinforcement required
for serving EV charging loads is described in [12]. Study re-sults indicate that the required network reinforcement can reachvalues up to 19% of total actual network costs in a situationwithout EV. If smart charging is adopted, up to 60%–70% ofthe required incremental investment could be avoided.Power quality and transformer operations concerns due to EV
charging are discussed in [13] and [14]. Charge controls arerecommended to shift the charging time to off-peak periods inorder to avoid excessive impact to the existing system. Com-parisons of the impacts of uncontrolled and controlled charginghave shown that by controlling the charging time and duration,the system loss and replacement of overloaded network compo-nents can be reduced or delayed [15]. Centralized EV chargingcontrol could mitigate the problem.Deterministic models based on average and peak load (worst
case) scenarios are developed in previous impact studies. In-formation required for system operation and planning, such asaverage system loss and feeder loading, risk of under voltageand network congestions, are often unavailable. In order to takevarious uncertainties into account andmake informed decisions,this paper proposes a stochastic modeling and simulation tech-nique that is based on EV charge measurements and load surveydata.The organization of the paper is as follows. Models of EV
charge and the proposed impact analysis procedure are de-scribed in Section II. Assumptions used in the simulations andcomparative cases are described in Section III, and test resultsare presented. Finally, a concluding remark is given.
0885-8950 © 2013 IEEE

This article has been accepted for inclusion in a future issue of this journal. Content is final as presented, with the exception of pagination.
2 IEEE TRANSACTIONS ON POWER SYSTEMS
Fig. 1. Establishment of deterministic and stochastic models of feeder node load profiles.
II. EV CHARGING MODEL AND IMPACT ANALYSES
With proper EV growth estimation and charging scenario as-sumptions, daily load profiles of feeder nodes can be determinedand used for impact analysis.
A. Stochastic Models
1) Feeder Load Profiles: Fig. 1 depicts a procedure ofbuilding deterministic and stochastic feeder nodes daily loadprofiles. A scenario reduction algorithm [16], [17] detailedin Appendix A is used to deduce a set of load profile classesand occurrence probability from historical demand data. Usingsmart meter data in advanced metering infrastructure (AMI)or other measurement at the service entry point, historicalnode load profiles can be recorded. For N historical node loadprofiles shown in Table I, the Kantorovich distance betweenload profiles and can be calculated by
(1)
In step 3 of the proposed procedure shown in Appendix A,based on the calculated Kantorovich distances, representativeload profile classes are conceived and the probability of a load
TABLE IORIGINAL LOAD PROFILES
profile class is calculated based on the number of profiles inthe N historical load profiles that are assigned to the class. Theprobability of each load profile class can be updated by usingmeasurements at different time. To sum up, the process used toselect most representative load profiles is as follows.Step 1) Determine the load profile k to be removed from the
original load profile set by using (2):
(2)
where is the probability of load profile m, and Jis the removed load profiles set.
Step 2) Update the removed load profile set .Step 3) Update the probability of the load profile that is
closest to the removed profile , .
This article has been accepted for inclusion in a future issue of this journal. Content is final as presented, with the exception of pagination.
LEOU et al.: STOCHASTIC ANALYSES OF ELECTRIC VEHICLE CHARGING IMPACTS ON DISTRIBUTION NETWORK 3
TABLE IIDISTANCE MATRIX BETWEEN ALL LOAD PROFILES
Step 4) Return to Step 1 and repeat until the number ofsorted load profile classes reaches a predeterminednumber.
Table II shows examples of Kantorovich distances betweenload profiles. At the completion of the above process, only adesired number of representative load profiles are retained andeach has a probability of occurrence as illustrated in Fig. 1. Dis-tributions of hourly load can be determined based on the loadprofiles in each class. The feeder node load profiles are obtainedby performing customer load survey and aggregating individualload profiles served by each distribution transformer to deduce10 most representative load curves.A distribution based on Roulette wheel selection concept that
depicts the occurrence frequency of the load profiles is usedin the simulations. The Roulette wheel surface is divided intowedges representing the probabilities for each individual. Thewedge k of the stochastic model is calculated by
(3)
where is the probability of the th representative load profile.An example of the unequally divided uniform distribution is
shown at the left hand bottom of Fig. 1. In each Monte Carlosimulation, a number between 0 and 1 is generated by a randomnumber generator for each node to determine the load profileused in the load flow study. If the number is between and, the th representative load profile is selected. A represen-
tative load profile with higher probability is more likely to beselected.2) EV Start Charging Time: The number of EV and their
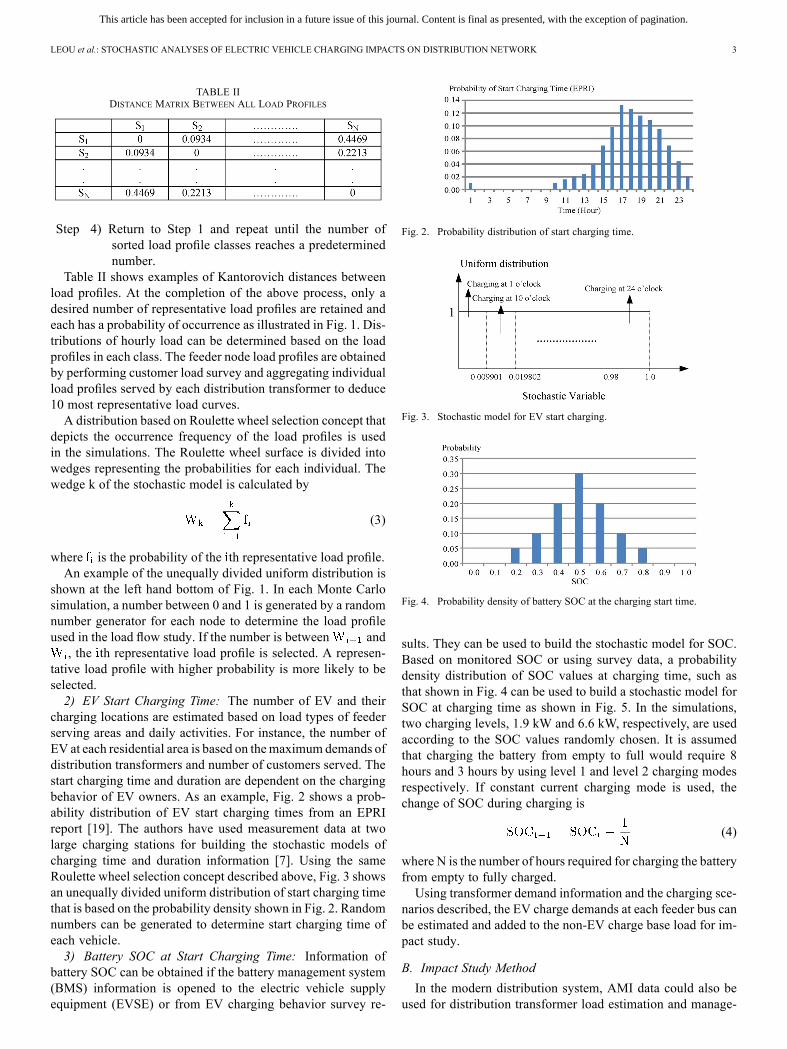
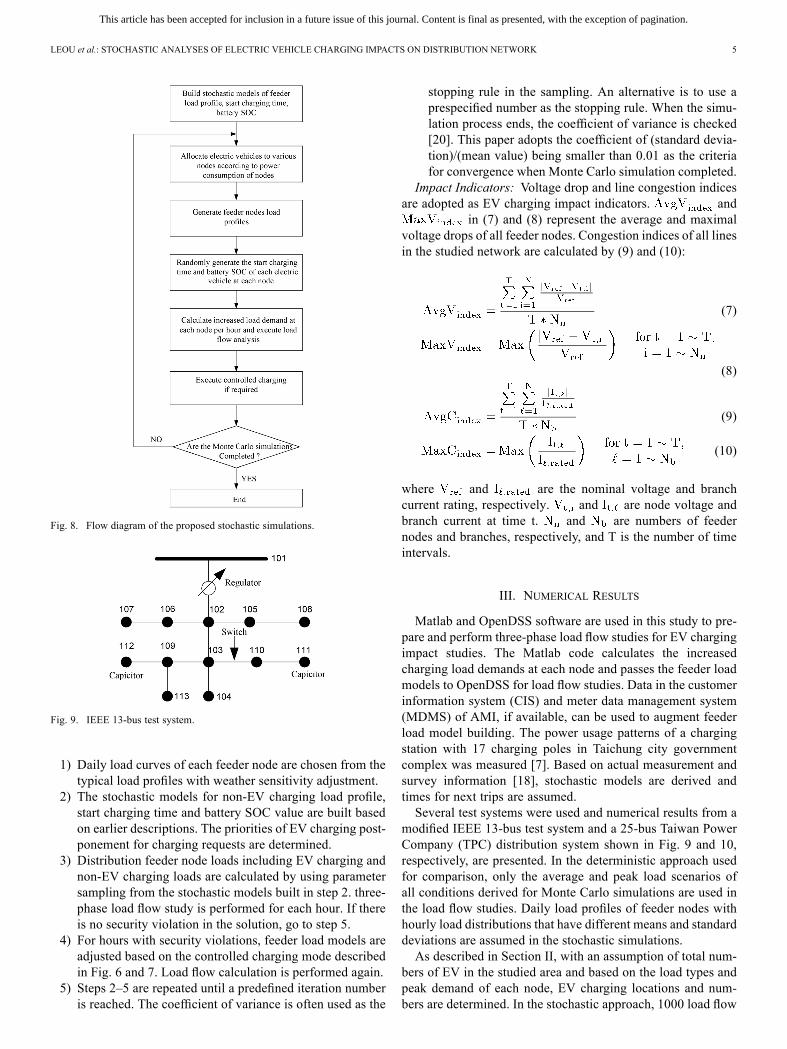
charging locations are estimated based on load types of feederserving areas and daily activities. For instance, the number ofEV at each residential area is based on themaximum demands ofdistribution transformers and number of customers served. Thestart charging time and duration are dependent on the chargingbehavior of EV owners. As an example, Fig. 2 shows a prob-ability distribution of EV start charging times from an EPRIreport [19]. The authors have used measurement data at twolarge charging stations for building the stochastic models ofcharging time and duration information [7]. Using the sameRoulette wheel selection concept described above, Fig. 3 showsan unequally divided uniform distribution of start charging timethat is based on the probability density shown in Fig. 2. Randomnumbers can be generated to determine start charging time ofeach vehicle.3) Battery SOC at Start Charging Time: Information of
battery SOC can be obtained if the battery management system(BMS) information is opened to the electric vehicle supplyequipment (EVSE) or from EV charging behavior survey re-
Fig. 2. Probability distribution of start charging time.
Fig. 3. Stochastic model for EV start charging.
Fig. 4. Probability density of battery SOC at the charging start time.
sults. They can be used to build the stochastic model for SOC.Based on monitored SOC or using survey data, a probabilitydensity distribution of SOC values at charging time, such asthat shown in Fig. 4 can be used to build a stochastic model forSOC at charging time as shown in Fig. 5. In the simulations,two charging levels, 1.9 kW and 6.6 kW, respectively, are usedaccording to the SOC values randomly chosen. It is assumedthat charging the battery from empty to full would require 8hours and 3 hours by using level 1 and level 2 charging modesrespectively. If constant current charging mode is used, thechange of SOC during charging is
(4)
where N is the number of hours required for charging the batteryfrom empty to fully charged.Using transformer demand information and the charging sce-
narios described, the EV charge demands at each feeder bus canbe estimated and added to the non-EV charge base load for im-pact study.
B. Impact Study Method
In the modern distribution system, AMI data could also beused for distribution transformer load estimation and manage-

This article has been accepted for inclusion in a future issue of this journal. Content is final as presented, with the exception of pagination.
4 IEEE TRANSACTIONS ON POWER SYSTEMS
Fig. 5. Stochastic model for EV battery SOC at start charging.
ment. If an EV charging service information platform is estab-lished, data of battery SOC and charging demand available inEV BMS can be used to determine the charging load of a feedernode. Depending on the data availability and accuracy, the fol-lowing analytical approaches is used to study the EV chargingimpacts to the distribution network. If actual data is not avail-able, the estimated numbers of EV at feeder nodes is calculatedbased on distribution transformer ratings:
(5)
where Rated is the transformer rating at node i, TEvNois the estimated total number of EV in the studied feeder, and
is the number of EV at node i.After the number of EV at each node is determined, the in-
creased charging load demand at each feeder node is calculatedaccording to the start charging time and SOC values chosenfrom random number generator. Through Monte Carlo simu-lations, various charging scenarios are simulated in distributionload flow studies. If the load flow study results show that thesystem is under stress with possible low voltage ( 0.95 p.u.) orover current, controlled charging schemes shown in Fig. 6 and 7are conducted to mitigate the problems. For a feeder node withlow voltage, the charging sequence of EV at the node are ad-justed according to their priority indices calculated by (6), whichis based on EV battery SOC and their preferred departure time:
(6)
For vehicles with higher delay charging priority, the chargingwill be postponed first for one time interval (e.g., 1 h), but fullcharge of the battery is guaranteed before the time for nexttrip. A load flow study is then executed and the security vio-lation is re-checked. The process continues until that no viola-tion exists or no EV charging is delayed. Similar to the con-trolled charging described above, at hours when the branch cur-rent is approaching the line limit, the EV charging requests atthe downstream nodes with higher delay priority are postponedfor one time interval.Monte Carlo simulations [20] are conducted to take uncer-
tainties involved into account. Typical load profiles for differentday types can be computed for the simulations. Based on theload profiles assigned to a certain class, the means and standarddeviations of power consumptions at each hour can be derived.
Fig. 6. Controlled charging for low voltage mitigation.
Fig. 7. Controlled charging for line current reduction.
A distribution based on Roulette wheel selection concept thatdepicts the occurrence frequency of the load profiles is used inthe simulations. In each Monte Carlo simulation, a number be-tween 0 and 1 is generated by a random number generator foreach node to determine the load profile used. The randomnessof hourly loads are simulated based on Gaussian distributionswith the hourly averages and standard deviations determined.Therefore, the load profile could change for each Monte Carlosimulation and a representative load profile with higher proba-bility is more likely to be selected. Fig. 8 shows the proposedstochastic approach which is described as follows.
This article has been accepted for inclusion in a future issue of this journal. Content is final as presented, with the exception of pagination.
LEOU et al.: STOCHASTIC ANALYSES OF ELECTRIC VEHICLE CHARGING IMPACTS ON DISTRIBUTION NETWORK 5
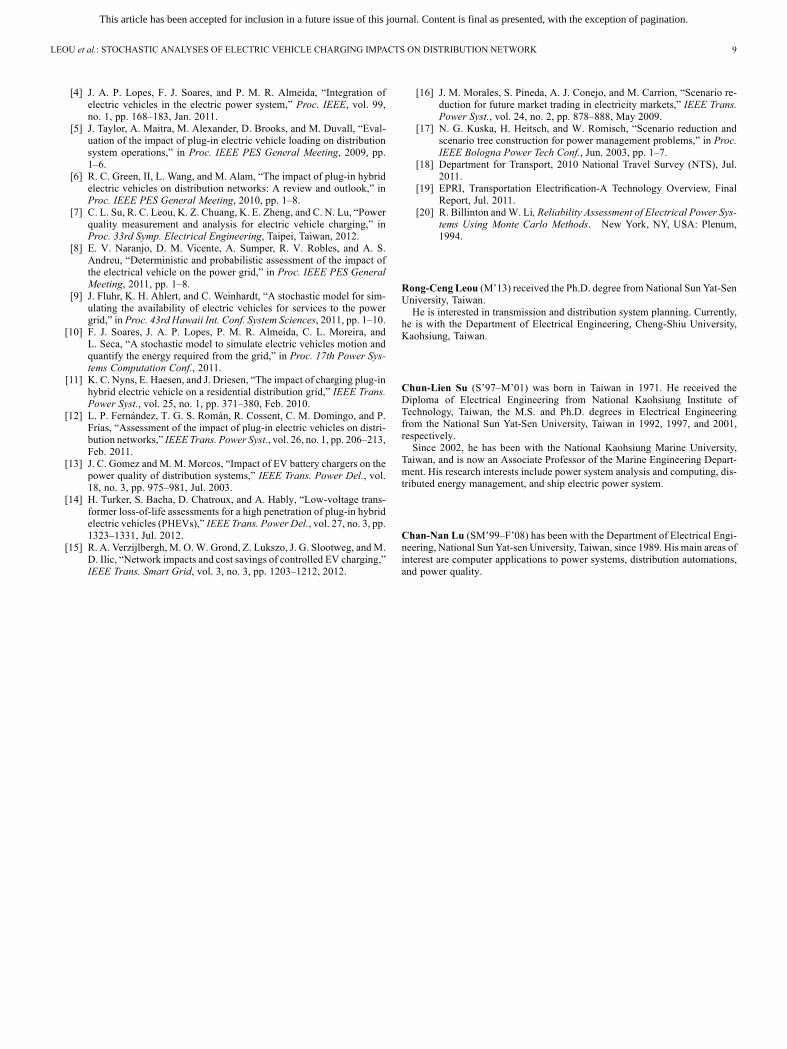
Fig. 8. Flow diagram of the proposed stochastic simulations.
Fig. 9. IEEE 13-bus test system.
1) Daily load curves of each feeder node are chosen from thetypical load profiles with weather sensitivity adjustment.
2) The stochastic models for non-EV charging load profile,start charging time and battery SOC value are built basedon earlier descriptions. The priorities of EV charging post-ponement for charging requests are determined.
3) Distribution feeder node loads including EV charging andnon-EV charging loads are calculated by using parametersampling from the stochastic models built in step 2. three-phase load flow study is performed for each hour. If thereis no security violation in the solution, go to step 5.
4) For hours with security violations, feeder load models areadjusted based on the controlled charging mode describedin Fig. 6 and 7. Load flow calculation is performed again.
5) Steps 2–5 are repeated until a predefined iteration numberis reached. The coefficient of variance is often used as the
stopping rule in the sampling. An alternative is to use aprespecified number as the stopping rule. When the simu-lation process ends, the coefficient of variance is checked[20]. This paper adopts the coefficient of (standard devia-tion)/(mean value) being smaller than 0.01 as the criteriafor convergence when Monte Carlo simulation completed.
Impact Indicators: Voltage drop and line congestion indicesare adopted as EV charging impact indicators. and
in (7) and (8) represent the average and maximalvoltage drops of all feeder nodes. Congestion indices of all linesin the studied network are calculated by (9) and (10):
(7)
(8)
(9)
(10)
where and are the nominal voltage and branchcurrent rating, respectively. and are node voltage andbranch current at time t. and are numbers of feedernodes and branches, respectively, and T is the number of timeintervals.
III. NUMERICAL RESULTS
Matlab and OpenDSS software are used in this study to pre-pare and perform three-phase load flow studies for EV chargingimpact studies. The Matlab code calculates the increasedcharging load demands at each node and passes the feeder loadmodels to OpenDSS for load flow studies. Data in the customerinformation system (CIS) and meter data management system(MDMS) of AMI, if available, can be used to augment feederload model building. The power usage patterns of a chargingstation with 17 charging poles in Taichung city governmentcomplex was measured [7]. Based on actual measurement andsurvey information [18], stochastic models are derived andtimes for next trips are assumed.Several test systems were used and numerical results from a
modified IEEE 13-bus test system and a 25-bus Taiwan PowerCompany (TPC) distribution system shown in Fig. 9 and 10,respectively, are presented. In the deterministic approach usedfor comparison, only the average and peak load scenarios ofall conditions derived for Monte Carlo simulations are used inthe load flow studies. Daily load profiles of feeder nodes withhourly load distributions that have different means and standarddeviations are assumed in the stochastic simulations.As described in Section II, with an assumption of total num-
bers of EV in the studied area and based on the load types andpeak demand of each node, EV charging locations and num-bers are determined. In the stochastic approach, 1000 load flow

This article has been accepted for inclusion in a future issue of this journal. Content is final as presented, with the exception of pagination.
6 IEEE TRANSACTIONS ON POWER SYSTEMS
Fig. 10. TPC 25-bus distribution system.
TABLE IIISIMULATION SCENARIOS
Fig. 11. Comparison of average losses.
studies are performed to take uncertainties into account and de-termine the average losses, ranges of voltages and branch cur-rents variations at feeder nodes and sections. Security violationsand system performance indices are then calculated. The sce-narios simulated and compared are shown in Table III.
A. IEEE 13-Bus Test System
1) System Average Losses: The test system shown in Fig. 9has peak loads of and .Fig. 11 shows the system loss changes when the number ofEV increases from 0 to 500. Cases 1 and 2 have higher systemlosses. Average losses for Cases 5 and 6 are obtained from 1000simulations. The difference between Cases 1 and 5 becomesgreater when the EV penetration is higher. The averages ofsystem losses calculated by using stochastic models (Cases 5and 6) are close to those of Cases 3 and 4 which use averageload models.2) Voltage Drops: Fig. 12 shows the average voltage drop
indices calculated. Cases 1 and 2 have higher average voltagedrops. The average voltage drop indices obtained by MonteCarlo simulations would reflect the actual average voltage dropsof the system. Fig. 13 shows a comparison of maximal voltagedrop indices. It can be seen that the stochastic approach pro-vides the worst case scenarios and index distributions. Con-trolled charging could reduce the level of voltage drop.
Fig. 12. Comparison of the average voltage drops indices.
Fig. 13. Comparison of the maximum voltage drop indices.
Fig. 14. Comparison of the average congestion indices.
Fig. 15. Comparison of the maximal congestion indices.
3) Network Congestion: Fig. 14 shows a comparison of av-erage congestion indices. It can be seen that Cases 1 and 2 givepessimistic estimates on system congestion, and the distributionand average of congestion indices given by stochastic approachwould indicate the actual range of the values. Fig. 15 shows theranges of congestion index values, including worst and averagescenarios obtained from stochastic approach. From Fig. 15 it canbe seen that the proposed smart charging scheme could mitigatesome overcurrent problems due to simultaneous EV charging.4) Undervoltage and Overcurrent Events: Fig. 16 shows an
increase of number of nodes with undervoltage and overcurrentevents during a day in Case 1 (peak load model). Even withshunt compensation added at buses 111 and 112, under voltagestarts to become a problem when the number of EV is greaterthan 200. The overcurrent events occur when the number of EVis higher than 500.

This article has been accepted for inclusion in a future issue of this journal. Content is final as presented, with the exception of pagination.
LEOU et al.: STOCHASTIC ANALYSES OF ELECTRIC VEHICLE CHARGING IMPACTS ON DISTRIBUTION NETWORK 7
Fig. 16. Numbers of undervoltage and overcurrent events at nodes in Case 1.
Fig. 17. Average numbers of undervoltage and overcurrent events at nodes in1000 simulations (Case 5).
TABLE IVOCCURRENCE TIME, POSITION AND PROBABILITYOF UNDERVOLTAGE IN CASE 5 WITH 500 EV
With the controlled charging scheme described in Section II,simulation results indicate that only when the EV numberreaches 500, the low voltage becomes a problem. If the averagefeeder load models are used, no under voltage or over currentevent is found even when the number of EV reaches 500. Thisis an optimistic result and does not reflect the possible impactof EV charging on the distribution network.Fig. 17 shows the variations of average numbers of under-
voltage and overcurrent events in 1000 Monte Carlo simula-tions in Case 5. The average number shown is calculated by thenumber of total violation events at nodes divided by 1000 (simu-lations). Tables IV and V show the occurring locations and timeof undervoltage and overcurrent events, respectively. Comparedto deterministic approach (Cases 1–4), the stochastic approachdetects more undervoltage and overcurrent events and providemore security risk information for the studied system.
TABLE VOCCURRENCE TIME, POSITION AND PROBABILITY OF OVERCURRENT
WHEN NUMBER OF ELECTRIC VEHICLES IN CASE 5
Fig. 18. Average numbers of undervoltage and overcurrent events at nodes in1000 simulations (Case 6).
TABLE VIOCCURRENCE TIME, POSITION AND PROBABILITY OF UNDERVOLTAGE
WHEN NUMBER OF ELECTRIC VEHICLES IN CASE 6
Compared to Fig. 17, Fig. 18 shows a lower number of se-curity violations when controlled charging is performed. Withsmart charging, there is no overcurrent event in case 6. Table VIshows the occurrence time and location of undervoltage. Com-pared with the results obtained in Case 2, the stochastic ap-proach provides undervoltage events information and occur-rence probability that are useful in assessing the impacts of EVcharging loads.Numerical results show that the EV charging period has large
influence on the distribution system loading. If multi vehiclesare charged during peak load hours, distribution transformer ca-pacity upgrade or new ones may be required when EV penetra-tion is high. On the other hand, if EV charging is controlled,utilization factor of the assets can be improved.
B. 25-Bus Test System
A practical TPC 22.8-kV 25-bus system shown in Fig. 10 hasa peak loads of and . Thesimulation scenarios are the same as that shown in Table III.Comparisons of system average losses and voltage drops, areshown below.1) System Average Losses: Fig. 19 shows the average losses
of the six cases tested. Since there is no security violation, re-sults of uncontrolled and controlled chargingmode are the same.System losses increase as the EV penetration becoming high.2) Voltage Drops: Similar to those shown in Fig. 13, Fig. 20
indicates that the stochastic approach is capable of providingmore voltage security concern information under different pen-etration levels of EV. With higher line capability, there is no

This article has been accepted for inclusion in a future issue of this journal. Content is final as presented, with the exception of pagination.
8 IEEE TRANSACTIONS ON POWER SYSTEMS
Fig. 19. Comparison of average losses of the TPC system.
Fig. 20. Comparison of the maximum voltage drop indices of the TPC system.
voltage and branch current violation, the controlled chargingscheme is not executed.
IV. CONCLUSIONS
Distribution system circuit information, car driving patterns,charging characteristics, charging timing, and vehicle penetra-tion are used to conceive system operation scenarios. Whilethe deterministic approach is useful for worst and average casescenario studies, the security violation frequency, average loss,voltage drop and line congestions under largely uncertain con-ditions are unavailable. Roulette wheel selection concept andMonte Carlo simulations are used to take various uncertaintiesinto account. The capability of providing security risk informa-tion by the deterministic and stochastic analytical approachesis compared and impacts due to a controlled and uncontrolledcharging are analyzed. The security risk information obtainedby the proposed stochastic approach allows distribution systemplanner make informed decision to optimize the use of existingdistribution network and accommodate higher EV penetration.Numerical results show that smart charging could mitigate se-curity problems due to widespread adoption of EV.
APPENDIX ASCENARIO REDUCTION ALGORITHM
Many methods have been proposed in the literatures to re-duce probable scenarios of the system with a hope that the re-duced scenarios can represent the original system confidently[16]. Assume the original scenario set P is an n-dimension sto-chastic process as shown in (A1):
(A1)
The element in this set is
(A2)
The probability of each element satisfies
(A3)
The scenario reduction algorithm derives a partial scenarioset Q that is the closest to the original scenario P. Q is also ann-dimensional stochastic process, the probability of scenarioin Q is , , J represents the set deleted from theoriginal scenario set P. For fixed , the scenario setQ based on the scenarios having minimal KantorovichDistance which is calculated by
(A4)
where measures the distance be-tween scenarios on the whole time horizon .The probability of the reduced set element , is as
expressed as follows:
(A5)
where , ,
.For the reduced set Q of fixed number s, the execution steps
of optimal selection of J are as described as follows.Step 1) Determine the scenario to be removed from the
original scenario set
(A6)
Step 2) Update the removed scenario set .Step 3) Update the probability of the scenario closest to
the removed scenario , with
(A7)
where .
Step 4) Return to Step 1 and repeat until the number of thereduced set is the predetermined number.
REFERENCES
[1] R. Liu, L. Dow, and E. Liu, “A survey of PEV impacts on electric util-ities,” in Proc. IEEE PES Innovative Smart Grid Technologies, 2011,pp. 1–8.
[2] S. Srinivasaraghavan and A. Khaligh, “Time management-determin-istic scheduling of a fleet of plug-in hybrid vehicles for distributed gen-eration,” IEEE Power & Energy Mag., pp. 46–53, Jul./Aug. 2011.
[3] L. Dow, M. Marshall, L. Xu, J. R. Aguero, and H. L. Willis, “A novelapproach for evaluating the impact of electric vehicles on the powerdistribution system,” in Proc. IEEE PES General Meeting, 2010, pp.1–6.
This article has been accepted for inclusion in a future issue of this journal. Content is final as presented, with the exception of pagination.
LEOU et al.: STOCHASTIC ANALYSES OF ELECTRIC VEHICLE CHARGING IMPACTS ON DISTRIBUTION NETWORK 9
[4] J. A. P. Lopes, F. J. Soares, and P. M. R. Almeida, “Integration ofelectric vehicles in the electric power system,” Proc. IEEE, vol. 99,no. 1, pp. 168–183, Jan. 2011.
[5] J. Taylor, A. Maitra, M. Alexander, D. Brooks, and M. Duvall, “Eval-uation of the impact of plug-in electric vehicle loading on distributionsystem operations,” in Proc. IEEE PES General Meeting, 2009, pp.1–6.
[6] R. C. Green, II, L. Wang, and M. Alam, “The impact of plug-in hybridelectric vehicles on distribution networks: A review and outlook,” inProc. IEEE PES General Meeting, 2010, pp. 1–8.
[7] C. L. Su, R. C. Leou, K. Z. Chuang, K. E. Zheng, and C. N. Lu, “Powerquality measurement and analysis for electric vehicle charging,” inProc. 33rd Symp. Electrical Engineering, Taipei, Taiwan, 2012.
[8] E. V. Naranjo, D. M. Vicente, A. Sumper, R. V. Robles, and A. S.Andreu, “Deterministic and probabilistic assessment of the impact ofthe electrical vehicle on the power grid,” in Proc. IEEE PES GeneralMeeting, 2011, pp. 1–8.
[9] J. Fluhr, K. H. Ahlert, and C. Weinhardt, “A stochastic model for sim-ulating the availability of electric vehicles for services to the powergrid,” in Proc. 43rd Hawaii Int. Conf. System Sciences, 2011, pp. 1–10.
[10] F. J. Soares, J. A. P. Lopes, P. M. R. Almeida, C. L. Moreira, andL. Seca, “A stochastic model to simulate electric vehicles motion andquantify the energy required from the grid,” in Proc. 17th Power Sys-tems Computation Conf., 2011.
[11] K. C. Nyns, E. Haesen, and J. Driesen, “The impact of charging plug-inhybrid electric vehicle on a residential distribution grid,” IEEE Trans.Power Syst., vol. 25, no. 1, pp. 371–380, Feb. 2010.
[12] L. P. Fernández, T. G. S. Román, R. Cossent, C. M. Domingo, and P.Frías, “Assessment of the impact of plug-in electric vehicles on distri-bution networks,” IEEE Trans. Power Syst., vol. 26, no. 1, pp. 206–213,Feb. 2011.
[13] J. C. Gomez and M. M. Morcos, “Impact of EV battery chargers on thepower quality of distribution systems,” IEEE Trans. Power Del., vol.18, no. 3, pp. 975–981, Jul. 2003.
[14] H. Turker, S. Bacha, D. Chatroux, and A. Hably, “Low-voltage trans-former loss-of-life assessments for a high penetration of plug-in hybridelectric vehicles (PHEVs),” IEEE Trans. Power Del., vol. 27, no. 3, pp.1323–1331, Jul. 2012.
[15] R. A. Verzijlbergh, M. O.W. Grond, Z. Lukszo, J. G. Slootweg, andM.D. Ilic, “Network impacts and cost savings of controlled EV charging,”IEEE Trans. Smart Grid, vol. 3, no. 3, pp. 1203–1212, 2012.
[16] J. M. Morales, S. Pineda, A. J. Conejo, and M. Carrion, “Scenario re-duction for future market trading in electricity markets,” IEEE Trans.Power Syst., vol. 24, no. 2, pp. 878–888, May 2009.
[17] N. G. Kuska, H. Heitsch, and W. Romisch, “Scenario reduction andscenario tree construction for power management problems,” in Proc.IEEE Bologna Power Tech Conf., Jun. 2003, pp. 1–7.
[18] Department for Transport, 2010 National Travel Survey (NTS), Jul.2011.
[19] EPRI, Transportation Electrification-A Technology Overview, FinalReport, Jul. 2011.
[20] R. Billinton andW. Li, Reliability Assessment of Electrical Power Sys-tems Using Monte Carlo Methods. New York, NY, USA: Plenum,1994.
Rong-Ceng Leou (M’13) received the Ph.D. degree from National Sun Yat-SenUniversity, Taiwan.He is interested in transmission and distribution system planning. Currently,
he is with the Department of Electrical Engineering, Cheng-Shiu University,Kaohsiung, Taiwan.
Chun-Lien Su (S’97–M’01) was born in Taiwan in 1971. He received theDiploma of Electrical Engineering from National Kaohsiung Institute ofTechnology, Taiwan, the M.S. and Ph.D. degrees in Electrical Engineeringfrom the National Sun Yat-Sen University, Taiwan in 1992, 1997, and 2001,respectively.Since 2002, he has been with the National Kaohsiung Marine University,
Taiwan, and is now an Associate Professor of the Marine Engineering Depart-ment. His research interests include power system analysis and computing, dis-tributed energy management, and ship electric power system.
Chan-Nan Lu (SM’99–F’08) has been with the Department of Electrical Engi-neering, National Sun Yat-sen University, Taiwan, since 1989. His main areas ofinterest are computer applications to power systems, distribution automations,and power quality.