stochastic analyses as a method to evaluate the robustness
TRANSCRIPT
Stochastic analyses as a method to evaluate the robustness of a light truck wheel pack design
Jaroslav Suchanek *, Johannes Will **
*Timken, Brno, Czech Republic, ** DYNARDO – Dynamic Software and Engineering GmbH,
Weimar, Germany
Abstract The article highlights the benefits of the stochastic procedure used for the robust-ness evaluation in the early stages of the product development cycle. This technique gathers knowledge of how the manufacturing tolerances or other scat-tering input variables affect the final product performance. A limitation of most CAE-based analyzing and optimizing methods, which are used as part of virtual prototyping, is in the use of input parameters as deterministic. Then, the safety margins or quality bounds have to ensure product functionality under scattering load, scattering material values as well as varying production process. The sto-chastic analyses as a method to evaluate the design robustness can be implemented. The analyses goal is to identify the most important scattering input parameter, optimize safety margins and quality bound regarding cost efficiency. Also, the number of prototype tests may be reduced (to minimize the tests’ ex-penses) with the knowledge of worst-case configuration of scattering parameters as it was gathered from stochastic analyses. The use of CAE-based virtual proto-typing enhanced with the robustness evaluation procedures in the early stages of the product development cycle shows promising results. There are documented examples of successful application of this approach for crashworthiness, passive safety, NVH, forming and other applications. This study shows how CAE-based virtual prototyping, enhanced with the robustness evaluation, was used to evaluate the effect of the geometrical manufacturing tolerances of individual components to the final performance of the completed assembly. The study proves that the product satisfied the design requirement prior to any component being built. This was later verified on the statistically significant set of the experimental data from the production. The study also shows ways to change manufacturing tolerances to cut expenses without impacting design requirements. Keywords: Stochastic Analysis, Robustness Evaluation
Weimarer Optimierungs- und Stochastiktage 6.0 – 15./16. Oktober 2009 1
1 Introduction
The development of innovative, high-quality products that are able to succeed in a highly competitive international market, has forced companies to rely on virtual prototyping methods. Virtual prototyping shortens product development cycles, cuts the development costs and satisfies increasing performance and safety re-quirements. But these requirements are often competing and, in many cases, the optimization of product cost, performance and weight without taking into account the scatter of input parameter may lead to highly sensitive (non robust) designs. The robustness is characterized by the system sensitivity to the unavoidable manufacturing scatter (material properties, manufacturing tolerances) and also the scatter of environmental conditions (how is the product used and abused). It is no surprise that the increased use of virtual prototyping, in conjunction with the reduction of hardware tests and development times, and combined with the high innovation speed of new materials and electronic components do have some risks. This can be seen in the increases in recent product recalls, particularly for new cars. Robustness evaluation ensuring safety, minimizing warranty and liabil-ity issues and assuring serviceability, needs be taken into account early in product development cycles. One of the sources of increased risks in the intensive use of virtual prototyping methods is in the omitting of scattering character of input variables. The input parameters taken as deterministic values and inappropriate safety margins com-bined with a very limited set of hardware tests cannot sufficiently check the robustness of virtual designs in relation to the reality of product manufacturing, testing and use. The “real way” leading from the “virtual trap” is based on the stochastic analyses methods used to evaluate product robustness in the virtual product development process. A computational robustness evaluation could be variance-based robust-ness (usually called robustness evaluation) or probability-based robustness (usually called reliability analysis) [1]. In variance-based robustness evaluation, a sample set of possible realizations of input variables are generated by stochastic methods. The scatter of the input variables is described by variation intervals, distribution functions and correlations among the scattering inputs. After scanning the Robustness space with a Latin Hypercube Sampling, the scatter in the system responses, their significance and the correlations between the scattering inputs and the system responses are investigated by statistical methods. In probability-based robustness evaluations, small event probabilities are deter-mined using different methodology of reliability analysis [2]. There are numerous documented successful applications of robustness evaluation. An overview is given at [3]. The robustness evaluation is used for NVH (Noise
Weimarer Optimierungs- und Stochastiktage 6.0 – 15./16. Oktober 2009 2

Vibration and Harshness) [4], passive safety [5], crashworthiness [6], forming processes [7] and other applications. Since all the applications discussed above are automotive applications where it is not necessary to account for very small event probabilities, the variance-based robustness evaluation using Latin Hypercube sampling [8] is the methodology of choice. A common feature to all of the mentioned applications is the role the robustness evaluation played in the product development. It is irreplaceable by any other analytical method what, what could be clearly documented on the AZT insurance crash test at Daimler AG [9]. In that case, the robustness analysis reveals the real-world phenomenon occurred during the hardware test in an early stage of the car development. The plasticity phenomenon was found on the stringer. This phe-nomenon was not observed in the deterministic analyses of the virtual product development and up to now could not be simulated in any other CAE-based vir-tual prototyping method. The robustness analysis was used to simulate how the car stringer is robust against scatters of material properties, sheet metal thickness (after forming operation) and variation of the test constraints (impact velocity and barrier position). The results of the robustness evaluation revealed that the plastic deformation of the stringer was caused by local stiffness scatter resulting from forming processes. Therefore, it was necessary to consider the distribution of sheet metal thinning by mapping forming simulation results to the stringer, as well as to take into account the scatter of the thinning distribution. Only the combination of scatters of the local stiffness, the strength of the stringer and the scatters of the impact angle of barrier could simulate real phenomenon in the virtual model. This study shows how the variance-based robustness evaluation method was used to evaluate the robustness of the front wheel hub for light trucks. The effect of the geometrical manufacturing tolerances of the individual components to the final performance of the completed assembly was investigated.
2 Application: Light Truck Wheel Pack Design The project of robustness evaluation of the wheel pack assembly was initiated by a simple question of the design engineer responsible for wheel pack design. “Are the geometrical and dimensional tolerances of the individual components of the assembly sufficient enough to satisfy the requirements that are put on the runouts of the completed assembly?” This question was asked at the time when none of the assembly components physically existed. The first look at the drawing of the wheel pack assembly shown on Figure 1 re-veals that the assembly tolerances are complex. The simple linear sum of the geometrical tolerances of individual assembly components greatly exceeds the required runouts of the assembly.
Weimarer Optimierungs- und Stochastiktage 6.0 – 15./16. Oktober 2009 3

To produce the individual components so that the linear sum will satisfy the as-sembly tolerance could lead to the increased manufacturing expenses. Fortunately, design guidelines and experiences help to set up the geometrical tolerances for this type of assembly.
Figure 1: Geometrical tolerances of the wheel pack One additional factor plays a significant role in the final runout of the assembly, the elastic deformations of the individual components after they are assembled since both cups are press fitted and the preload is applied to the cones.
2.1 Robustness evaluation of the wheel pack To evaluate wheel pack robutstness, optiSLang variance-based robustness analysis was used. The basic idea of numerical robustness evaluation using stochastic analysis is to create and evaluate set of possible design realizations (sampling set) taking into account all important uncertainties and tolerances of the design setup. The first step is to introduce the scattering input variables with the help of statisti-cal definitions. Because the definition of uncertainties is the essential input to robustness evaluations, the best possible translation of measurements, experience or expectations needs to be found. This methodology results in 43 input parame-ters and 9 output parameters for the analyses of the wheel pack.
Weimarer Optimierungs- und Stochastiktage 6.0 – 15./16. Oktober 2009 4

The challenge is to obtain the statistical definitions of the scattering input vari-ables when none of the assembly components physically exist. So the statistical definitions of the bearing parts were taken from the measurements of the parts with similar dimensions and produced on the identical equipment on which the analyzed parts will be produced. The distribution functions for the hub manufac-turing tolerances were derived as the border ones to satisfy SPC values specified on the drawing. The second step is to generate a representative number of possible design realiza-tions (sampling set). In this application, the Latin Hypercube Sampling with 150 sample points was used.
Figure 2: The robustness study workflow To have a fully parametric and robust FEA model stable enough to converge for all possible combinations of the imperfect functional surface required significant effort. How the geometrical tolerances were modeled and parameterized is de-scribed later. The third step consists of the problem definition within the optiSLang. With the help of the optiSLang parameter editor, 43 independent stochastic input parame-ters and the set of 9 output parameters were created. Part of this step also included process automation by creating the batch script that starts ANSYS analyses with one set of scattering parameters and, when completed, extracts the monitored results (output parameter) and transfers them into the optiSLang via ASCII file. The procedure uses the benefit of direct communication between the general finite element package ANSYS and the CAE-based robustness evaluation, reliability analysis and robust design optimization package optiSLang. Figure 2 shows the workflow used for the analyses.
Weimarer Optimierungs- und Stochastiktage 6.0 – 15./16. Oktober 2009 5

The last step represents statistical evaluation of the 150 analyses results. There are evaluated variations of input parameters, importance coefficients and correlation among all variables with the help of statistical measurements within the op-tiSLang. The statistical measures are also used to ensure that the statistical characteristics of variation, importance and correlation are reliable and condition of certain number of runs was satisfied. These results are presented further.
2.1.1 The FEA model The FEA model used in the simulation is shown in Figure 3. In Figure 4 the model cross section is shown. The model was built on the CAD data of indi-vidual parts and the model consists of a shaft, a hub, a pair of taper bearings and a locking nut.
Figure 3: FEA model used in the simulation The static structural run by ANSYS Mechanical was required to simulate interac-tions between the assembly components. Contact interfaces with the friction were used where individual assembly components meet. The only exception was the interface between the test shaft and the nut where the preload to the bearing cones was applied by numerical means.
Weimarer Optimierungs- und Stochastiktage 6.0 – 15./16. Oktober 2009 6
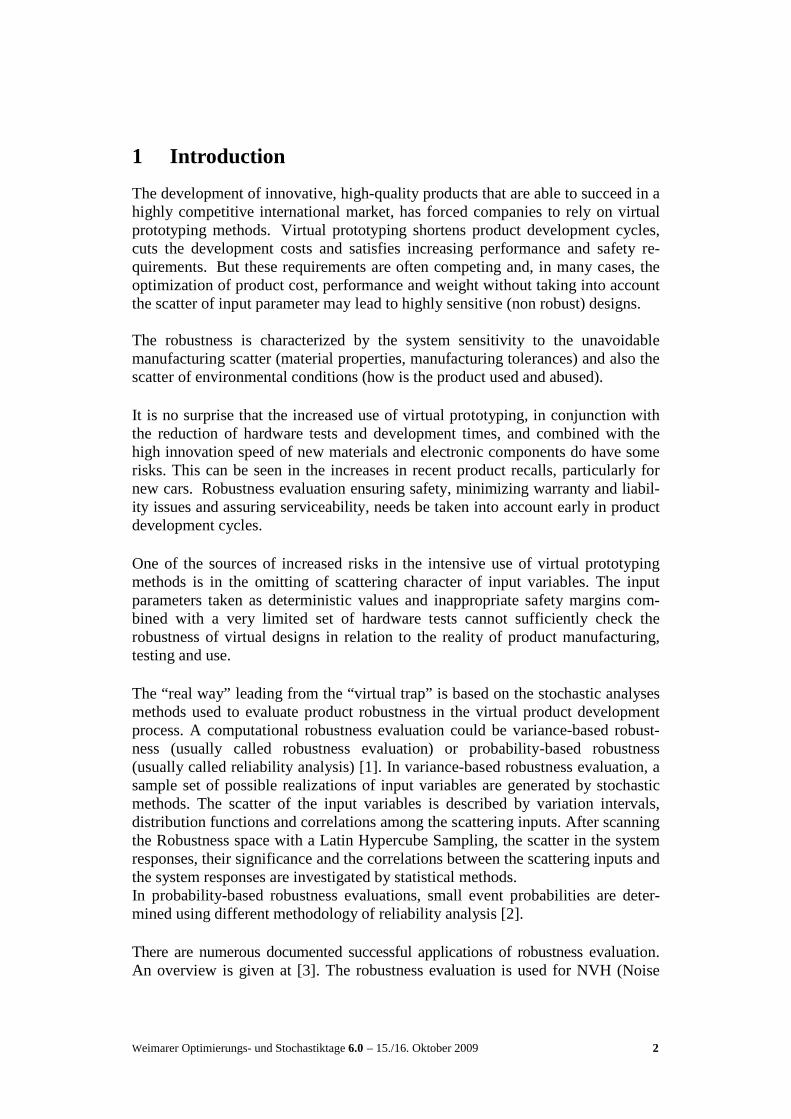
As the section (seen on Fig.4) of the numerical model shows, the rollers of both tapered roller bearings were not modeled as solid bodies, but every individual roller was substituted by set of nonlinear springs. The stiffness includes the impact of the taper stiffness and the race-way profile.
Figure 4: The cross section of the FEA model used in the simulation
2.1.2 FEA model features The most important features of the numerical model used to evaluate the robust-ness of the wheel pack assembly are described in this section. As note, 43 independent stochastic parameters were used in the study. These parameters represent independent stochastic parameters of the geometrical and dimensional tolerances. The geometrical tolerances of the press fitted parts:
• Hub bores cylindricity
• Hub bores concentricity
• Hub bores face runout
• Hub face runout at break flange
• Cup outer diameter runout
• Cup face runout
• Cone outer diameter runout
Weimarer Optimierungs- und Stochastiktage 6.0 – 15./16. Oktober 2009 7

The dimensional stochastic tolerances of press fitted parts:
• Hub bores diameters tolerance
• Cups outer diameter tolerance Also, the scatter of the elastic material properties of individual components such as modulus of elasticity and Poison’s ratio were included among stochastic pa-rameters. The process of how to include the dimensional tolerances and the scatter of the material properties of the individual parts is straightforward. It requires defining the distribution function, mean value, coefficient of variation and the respective part dimension or material property during stochastic sampling.
The procedure of including the geometrical tolerances requires a special method to model geometrical tolerances parametrically.
2.1.3 Parametrical definition of geometrical tolerances The following will provide an example of the geometrical tolerance parameteriza-tion using a cylindricity tolerance. The cylindricity definition, as shown in Figure 5, allows that the real surface may have any shape within the two cylindrical surfaces whose distance is given by the tolerance value. Unfortunately, this definition gives infinite numbers of shape variations. The performed measurements of the similar parts produced on the identical manufacturing equipment revealed that the dominant out of cylindrical shape is oval. To perform the analysis, it was then assumed that the oval shape will produce the conservative results, which means the maximum assembly runout. It should be also noted that the prismatic surface with oval cross section is used for the modeling of the cylindricity.
Figure 5: Cylindricity definition
Weimarer Optimierungs- und Stochastiktage 6.0 – 15./16. Oktober 2009 8

To parameterize the deviation from a nominal cylinder, polar coordinates can be used. The polar coordinate parameters are radial size deviation and angle. The parameters are defined as following:
• Size – This parameter defines the value of the tolerance. Its value may vary from zero to the maximum tolerance defined on the drawing. The Lognormal distribution function is chosen as the best fit of the measured data.
• Angle – This parameter specifies the modification of orientation since the rotational position of two assembled parts may vary and is ran-dom. It may vary from -90° through 90°. The variation of 180° in total is sufficient since the modification is symmetric. The Uniform distri-bution function is chosen.
The oval shape is generated using a sinus function. Fig. 6 shows a sketch of pa-rameterized cylindricity tolerance.
Figure 6: Parameterized cylindrical tolerance
Weimarer Optimierungs- und Stochastiktage 6.0 – 15./16. Oktober 2009 9
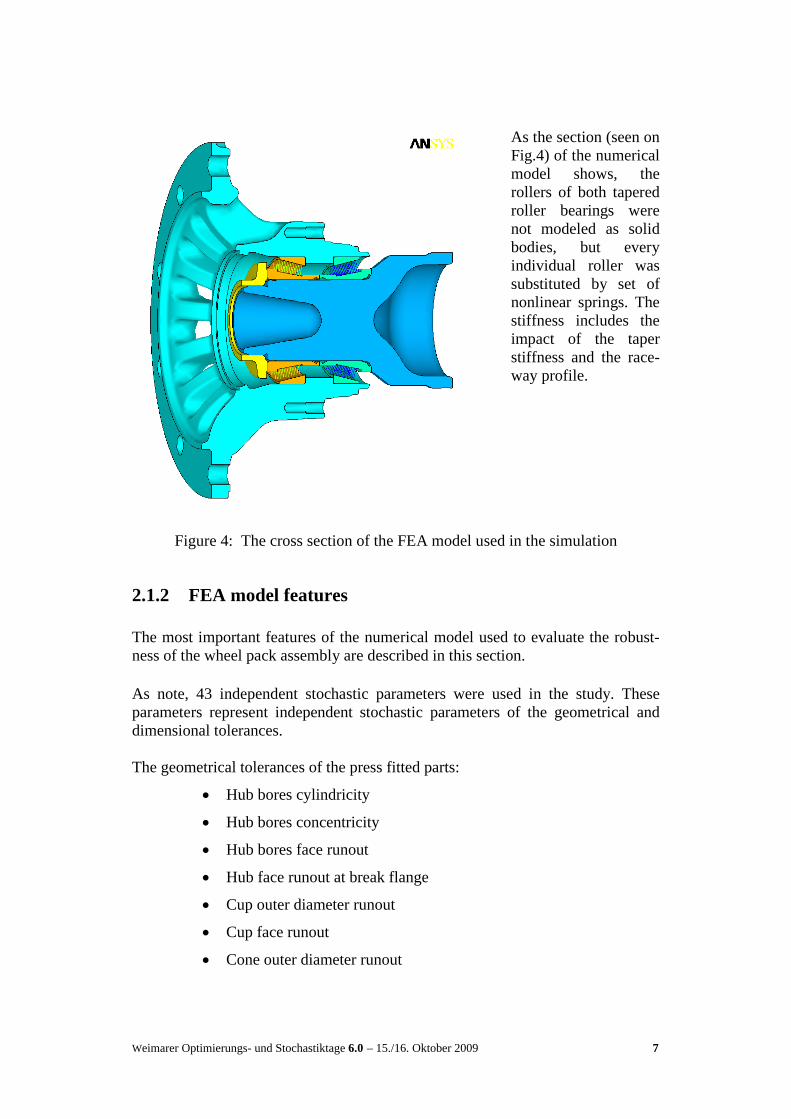
2.1.4 The results The graphs in Fig. 7 show the statistically processed results of the face runout at the break flange location
Figure 7: Statistical results of face runout at brake flange location The maximum variation of the assembly runout is far enough from the maximum allowed value as shown on Figure 7’s upper tolerance limit. The assembly runout represents 6.9 Sigma. The results also show that 91% of the assembly runout comes from the hub face runout. The manufacturing tolerance of the hub face runout has dominant influence to the runout of the assembly. By removing the influence of the hub runout itself, the influence of all the other tolerances on the assembly runout was investigated. The results are showed in Figure 8.
Weimarer Optimierungs- und Stochastiktage 6.0 – 15./16. Oktober 2009 10

Figure 8: Statistical results of face runout at brake flange location without manu-facturing tolerance there
The variation is this case was nearly one order less. Because of the increasing influence of the numerical scatter on that order of variation, only 64% of the response scatter is explained by the linear and quadratic correlation. Also, 38% of response scatter is identified by correlation between the size of hub bore concen-tricity tolerance and the assembly runout.
Weimarer Optimierungs- und Stochastiktage 6.0 – 15./16. Oktober 2009 11

2.2 Results verification To verify the results of the numerical simulation in terms of the mean value and scatter, 250 assemblies were measured as showed in Figure 9. The measurements results showed in Figure 10 indicate that there is good correlation with the numerical simulation results.
Figure 9: Brake flange runout measurement
Figure 10: Histograms of the face runout at brake flange as simulated and as measured
Weimarer Optimierungs- und Stochastiktage 6.0 – 15./16. Oktober 2009 12

2.3 Result Discussion The comparison of numerical and the experimental values of the face runout on the assembly location showed good correlation. The estimated probability of overstepping in the robustness analysis is a bit smaller compared to the probabil-ity based on measurement, but we have to point out that estimation of rare event probabilities using only 150 Latin Hypercube Sampling still has a large estimation error. Between the simulation and measurements there is a shift in mean/max as well as a little bit higher standard deviation. Therefore, the higher overstepping probability of measurements is consistent. The numerical robustness evaluation was able to answer the designer’s question, “Are the geometrical and dimensional tolerances of the individual components of the assembly sufficient enough to satisfy the requirements of the completed as-sembly?” The numerical simulation gives clear answer YES. Furthermore, the experimental measurement showed good correlation between the numerical and the experimental data. As it was mentioned at the beginning of the paper, the geometrical tolerances for individual parts of the assembly are set up according to experience. But are these tolerances fine enough to meet the assembly requirements? Initially, more precise tolerances are chosen to prevent customer complaints. However, tighter manufac-turing tolerances drive manufacturing expenses up. Today, when numerical models capable of predicting final runout of physical assemblies exist, a large space is open to “optimize” the manufacturing tolerance of the assembly. “Optimize” means to set up tolerances in a way that will cut manufacturing costs while maintaining the design requirements of the assembly. Figure 11 shows an example of “What if” scenario.
Figure 11: “What If” scenario for manufacturing tolerances
Weimarer Optimierungs- und Stochastiktage 6.0 – 15./16. Oktober 2009 13
3 Summary and Outlook
The numerical robustness evaluation taking into accounts the geometrical toler-ances and material scatter required from the assembly was proven to be possible. Moreover the correlation with the experimental data based on 250 measurements is good. But there is far greater potential of using such numerical simulations especially for “optimizing” the manufacturing tolerances in order to cut the manu-facturing cost. This way of using the numerical simulation is not very widespread, but has great potential in this currently turbulent economy climate, when the captains of the industry are directing the business toward focusing on activities that generate profit and deliver value “NOW”.
4 References
[1] Bucher, C.: Basic concepts for robustness evaluation using stochastic analysis; Proceedings EUROMECH colloquium Efficient Methods of Ro-bust Design and Optimization, September 2007, London. (www.dynardo.de)
[2] Roos, D.; Adam, U.; Bucher, C.: Robust Design Optimization; Proceed-
ings of Optimization and Stochastic Days 3.0, 2006, Weimar, Germany (www.dynardo.de)
[3] Will, J.: State of the Art – robustness evaluation in CAE-based virtual
prototyping processes of automotive applications, Proceedings Optimiza-tion and Stochastic Days 4.0, 2007, Weimar, Germany, www.dynardo.com
[4] Will, J.; Möller, J-St.; Bauer, E.: Robustness evaluations of the NVH
comfort using full vehicle models by means of stochastic analysis, VDI-Berichte Nr.1846, 2004, S.505-527
[5] Will, J.; Baldauf, H.: Robustness evaluations concerning virtual dimen-
sioning of passive vehicle safety; Proceedings Weimarer Optimierungs- und Stochastiktage 2.0, 2005, Weimar, Germany (www.dynardo.de)
[6] Will, J.; Baldauf, H.; Bucher, C.: Robustness Evaluation in Virtual Dimen-
sioning of Passive Passenger Safety and Crashworthiness, Proceedings of Optimization and Stochastic Days 3.0, 2006, Weimar, Germany (www.dynardo.de)
[7] Will, J; Grossenbacher, K.: Robust Design Optimization of forming proc-
ess simulation using LS-DYNA and optiSLang; Proceedings 25. ANSYS
Weimarer Optimierungs- und Stochastiktage 6.0 – 15./16. Oktober 2009 14
Weimarer Optimierungs- und Stochastiktage 6.0 – 15./16. Oktober 2009 15
Conference & 25. CAD-FEM Users Meeting October 2007, Dresden, Chapter 1., Germany (www.dynardo.de)
[8] Will, J.: Bucher, C.: Statistical Measures for the CAE-based Robustness
Evaluation, Proceedings of Optimization and Stochastic Days 3.0, 2006, Weimar, Germany (www.dynardo.de)
[9] Will, J.; Frank, T.: Robustness analyses of structural crash load cases at
Daimler AG. Proceedings of Optimization and Stochastic Days 5.0, 2008, Weimar, Germany. (www.dynardo.de)