still a man’s labor market - institute for women's
TRANSCRIPT
1
I W PR .ORGStill a Man’s Labor Market: The Slowly Narrowing Gender Wage Gap
Still a Man’s Labor Market
The Slowly Narrowing Gender Wage GapStephen J. Rose, Ph.D., and Heidi I. Hartmann, Ph.D.

HIGHLIGHTSThe commonly used figure to describe the gender wage ratio—that a woman earns 80 cents for every dollar earned by a man—understates the pay inequality problem by leaving many women workers out of the picture. This report argues that a multi-year analysis provides a more comprehensive picture of the gender wage gap and presents a more accurate measure of the income women actually bring home to support themselves and their families.
• Women today earn just 49 cents to the typical men’s dollar, much less than the 80 cents usually reported. When measured by total earnings across the most recent 15 years for all workers who worked in at least one year, women workers’ earnings were 49 percent—less than half—of men’s earnings, a wage gap of 51 percent in 2015. Progress has slowed in the last 15 years relative to the preceding 30 years in the study.
• The penalties of taking time out of the labor force are high—and increasing. For those who took just one year off from work, women’s annual earnings were 39 percent lower than women who worked all 15 years between 2001 and 2015, a much higher cost than women faced in the time period beginning in 1968, when one year out of work resulted in a 12 percent cut in earnings. While men are also penalized for time out of the workforce, women’s earnings losses for time out are almost always greater than men’s.
• Strengthening women’s labor force attachment is critical to narrowing the gender wage gap. Despite considerable progress over the last 50 years, 43 percent of today’s women workers had at least one year with no earnings, nearly twice the rate of men. With high penalties for weak labor force attachment, achieving higher lifetime earnings for women will require strengthening women’s attachment to the labor force. Research has shown that such policies as paid family and medical leave and affordable child care, can increase women’s labor force participation and encourage men to share more of the unpaid time spent on family care.
• Strengthening enforcement of equal employment opportunity policies and Title IX in education is also crucial to narrowing the gender wage gap further. Improved enforcement will help women enter higher paying fields that are now, despite decades of progress, still too often off-limits to women.

1
I W PR .ORG Still a Man’s Labor Market: The Slowly Narrowing Gender Wage Gap
IntroductionThe way the earnings gap between women and men is typically measured uses a snapshot of women and men who worked full-time, year-round in a given year. An examination of the different labor force experiences of women and men across 15-year time periods, as is done in this report, shows that only 28 percent of women and 59 percent of men worked persistently full-time, year-round between 2001 and 2015.
In 2017, the most recent year for which year-round earnings data are available for full-time workers, the gender earnings gap was 20 percent; that is, women earned 20 percent less than men (Hegewisch 2018). This figure is based on the ratio of
women’s to men’s median earnings for full-time, year-round work and is derived from the annual Census Bureau report on income and poverty that is released every fall using data from the Current Population Survey (Fontenenot, Semega, and Kollar 2018).1
This commonly used annual figure, however, understates the problem, especially for women workers, since it leaves so many of them out of the picture. The authors’ 2004 report, which pioneered the analysis of the earnings gap over 15-year periods, found an earnings gap of 62 percent for all women compared with all men (of prime working age) in the period studied, meaning that women made just 38 percent of what men made (Rose and Hartmann 2004).
The current analysis updates and revises the analysis from the authors’ 2004 report and finds that a wide disparity exists between all workers and the smaller group of workers who work full-time, year-round. Although the earnings gap across the most recent 15 years for those who generally work full-time, year-round in this study is similar to the more commonly used one-year numbers from the same years (23 percent), the earnings gap across all 15 years for all women and men with some earnings is very different, a gender earnings gap of 51 percent (meaning that women earn only 49 percent of what men do across a 15-year period). Among women workers in this study, 43 percent had at least one year with no earnings, while only 23 percent of men did, indicating that being out of work for a year is still a common experience for women but unusual for men.
The long-term gender earnings gap has narrowed since 1968, but it has by no means disappeared. In 2015, the gender earnings gap remained large when applied to all female and male workers, including those who work part-time or part-year and have years of not working, and measured over the long term. These results indicate that there is still more to do if women are to have equal pay with men over the course of their working lives.
1 Full-time, year-round work is defined as working 1,750 hours or more per year (working at least 35 hours per week for at least 50 weeks per year; U.S. Bureau of Labor Statistics, 2017a).
2
I W PR .ORGStill a Man’s Labor Market: The Slowly Narrowing Gender Wage Gap
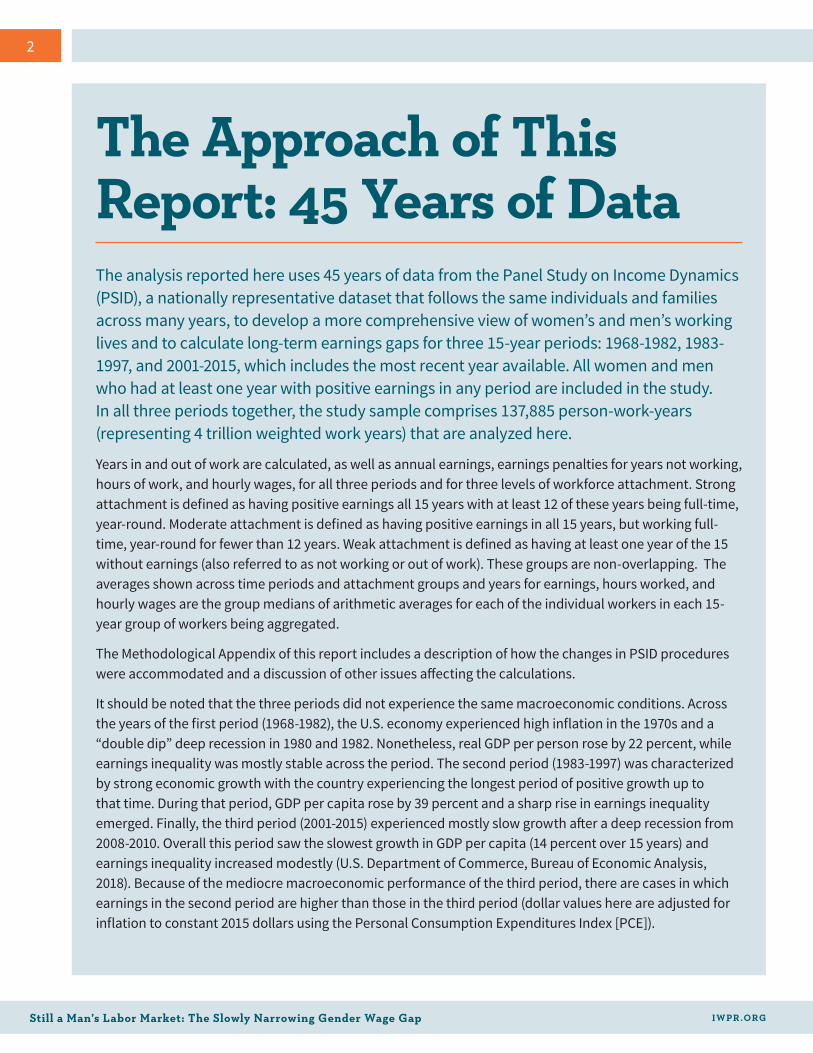
The Approach of This Report: 45 Years of DataThe analysis reported here uses 45 years of data from the Panel Study on Income Dynamics (PSID), a nationally representative dataset that follows the same individuals and families across many years, to develop a more comprehensive view of women’s and men’s working lives and to calculate long-term earnings gaps for three 15-year periods: 1968-1982, 1983-1997, and 2001-2015, which includes the most recent year available. All women and men who had at least one year with positive earnings in any period are included in the study. In all three periods together, the study sample comprises 137,885 person-work-years (representing 4 trillion weighted work years) that are analyzed here.
Years in and out of work are calculated, as well as annual earnings, earnings penalties for years not working, hours of work, and hourly wages, for all three periods and for three levels of workforce attachment. Strong attachment is defined as having positive earnings all 15 years with at least 12 of these years being full-time, year-round. Moderate attachment is defined as having positive earnings in all 15 years, but working full-time, year-round for fewer than 12 years. Weak attachment is defined as having at least one year of the 15 without earnings (also referred to as not working or out of work). These groups are non-overlapping. The averages shown across time periods and attachment groups and years for earnings, hours worked, and hourly wages are the group medians of arithmetic averages for each of the individual workers in each 15-year group of workers being aggregated.
The Methodological Appendix of this report includes a description of how the changes in PSID procedures were accommodated and a discussion of other issues affecting the calculations.
It should be noted that the three periods did not experience the same macroeconomic conditions. Across the years of the first period (1968-1982), the U.S. economy experienced high inflation in the 1970s and a “double dip” deep recession in 1980 and 1982. Nonetheless, real GDP per person rose by 22 percent, while earnings inequality was mostly stable across the period. The second period (1983-1997) was characterized by strong economic growth with the country experiencing the longest period of positive growth up to that time. During that period, GDP per capita rose by 39 percent and a sharp rise in earnings inequality emerged. Finally, the third period (2001-2015) experienced mostly slow growth after a deep recession from 2008-2010. Overall this period saw the slowest growth in GDP per capita (14 percent over 15 years) and earnings inequality increased modestly (U.S. Department of Commerce, Bureau of Economic Analysis, 2018). Because of the mediocre macroeconomic performance of the third period, there are cases in which earnings in the second period are higher than those in the third period (dollar values here are adjusted for inflation to constant 2015 dollars using the Personal Consumption Expenditures Index [PCE]).

3
I W PR .ORG Still a Man’s Labor Market: The Slowly Narrowing Gender Wage Gap
The Long-Term Earnings Gap and Its ImportanceWhen measured by total earnings across 15 years for all workers who worked in at least one year, women workers’ earnings were just 19 percent of those of male workers in the first period, 38 percent in the second period, and 49 percent in the third period (see Table 7). In other words, women who had at least some working years across 15 years did not earn 59 cents on the dollar in the 1970s (as the annual CPS comparisons of full-time, year-round workers show), but just 19 cents on the dollar during these years. And women today do not earn 77 cents on the dollar as they averaged in the Census Bureau one-year data in the period from 2001 to 2015, but only 49 cents on the dollar across these years. Nevertheless, the size of the gap fell substantially during the nearly 50 years covered by this report: women trailed men by 81 cents on the man’s dollar in the first period, but that long-term earnings gap had narrowed to 51 cents by the third period (see Table 7).
With data that cover nearly 50 years (1968-2015), this report shows that women have made significant progress in narrowing the gender gaps in years of work, working hours per year, and wages per hour, all cumulating in narrowing the gap in annual earnings and total earnings across 15 years. In the most recent period, 57 percent of women had earnings in all 15 years, more than double the share in the first period (28 percent), a huge gain in attachment. Similarly, the share of women with strong labor force attachment—those working full-
time, year-round in 12 or more of 15 years—also increased across the three time periods, almost tripling from 11 percent to 28 percent. Hours worked per year increased for women, across all three time periods, regardless of the level of workforce attachment. Those with the weakest attachment to the workforce saw the largest increase, with annual hours worked increasing by 25 percent. Hourly pay grew by nearly 50 percent for all women workers. Likewise, annual earnings (for years with positive earnings) increased substantially for women, by approximately half for all attachment levels. These results are discussed in more detail below. Increases in women’s educational attainment and enforcement of equal opportunity laws, as well as cultural shifts and gains in the political power of women, likely contributed to the gains observed.
This multi-year approach better reflects women’s experiences than the point-in-time earnings comparisons for full-time, year-round workers that

4
I W PR .ORGStill a Man’s Labor Market: The Slowly Narrowing Gender Wage Gap
are most commonly cited.2 The ratio of women’s to men’s total earnings across a 15-year period illustrates how much income women extract from the labor market to support themselves and their families. The three successive 15-year periods also show the substantial advances women have made in the labor market over time. In many ways, these findings reflect the impact of the women’s movement and its demand that women no longer be treated as minor contributors to the economy and the labor force. The long-term earnings gap is a critical indicator of women’s wellbeing because a woman today is more likely to have many years in which she is the sole or primary source of her own or her family’s income.
The data analyzed here show that, despite considerable progress, two in five women workers in the most recent period still do not maintain strong labor force attachment. Strengthening women’s labor force participation would increase their long-term and lifetime earnings. Since many women take time away from paid work to provide unpaid family care, making it easier for these women to juggle work and family responsibilities, and for men to take on a greater share of these responsibilities, would go a long way to further narrowing all the long-term gender gaps that are documented in this report. Economists Francine Blau and Lawrence Kahn (2013) show that the United States lags behind comparably wealthy nations in providing protections and supports, such as paid family leave and subsidized child care, and, as a result, women’s labor force participation lags here compared with other countries. Fewer women work for pay and their time out of the paid workforce reduces their pay when working, as is shown below, as well as their lifetime earnings. The failure of public policies to address the caregiving needs of both women and men leads to lower earnings for anyone who misses a year of work.
2 Blau and Kahn (2017) provide a comprehensive overview of the wage gap literature and econometric analyses of the time period 1980-2010 using annual cross-sectional data from the Current Population Survey and the Panel Study on Income Dynamics. Favreault (2018), using Social Security lifetime earnings records, provides a multiyear approach that calculates a lifetime earnings ratio of women’s to men’s earnings of about 50 percent for the more recent cohort, a similar result to that calculated in this report.

5
I W PR .ORG Still a Man’s Labor Market: The Slowly Narrowing Gender Wage Gap
Continuity, Intensity, and Rewards of WorkBy every measure, women have become more consistent participants in the labor force across the three 15-year periods in this study—compared with previous periods, more women in the most recent period worked in all 15 years and more worked full-time, year-round. Women also worked more hours per year at each attachment level, earned more per hour, and earned much more in annual earnings.
The post-World War II period saw a fairly steady rise in women’s employment. By the time this analysis begins in 1968, the share of all women aged 16 years and older
participating in the labor force (working or looking for work) had grown to 41.6 percent, up from 33.9 percent in 1950. By the 1970s, many women were returning to work after their children entered school. In the 1980s especially, and into the early 1990s, even women with younger children were entering the labor force in large numbers.3 Starting in about 2000, the labor force participation of women plateaued in the United States, reaching 57.0 percent in 2017. The experiences of different racial and ethnic groups have differed, with Black women having consistently higher labor force participation than White, Asian, and Hispanic women for many years. In 2017, Black women had the highest labor force participation rate of all groups of women at 60.3 percent (U.S. Bureau of Labor Statistics 2018). In 1968, women lagged behind men in college education, while today women earn 57.2 percent of all bachelor’s degrees (National Center for Education Statistics 2017).
Figure 1 shows the important changes in women’s and men’s continuity of employment across the three successive 15-year periods. For women, the share working every year doubled, from 28 percent in the first period
3 The decade-by-decade growth rates for the shares of women in the labor force with children peaked in the 1980s, and was highest for mothers with children under age three (27.9 percent growth rate, compared with a 24.4 percent growth rate for mothers of children under age 6 and 16.2 percent for mothers of children ages 6-17 with none younger, and only 8.7 percent for women without children under 18; U.S. Bureau of Labor Statistics 2017b). The labor force participation of women without children and for all women generally did not grow as quickly as that for mothers because mothers tend to be younger, whereas all women include many older women (all women are 16+ years old)—and the younger cohorts of women typically worked more than the cohorts who came of age earlier. Increasing education, availability of birth control, and changing cultural norms all played a part in increasing women’s labor force participation for each successively younger cohort of women until about 2000.

6
I W PR .ORGStill a Man’s Labor Market: The Slowly Narrowing Gender Wage Gap
to 57 percent in the most recent. Although women still trailed men by 20 percentage points on this metric in the last period, this is a far cry from the 60-percentage point gap women experienced in the first period. For men, the default status was to be employed every year. In the first period, 88 percent of men never missed a year of earnings. In the second two periods, 76 and 77 percent respectively worked 15 consecutive years, a drop of 11 percentage points across the three time periods.
Figure 2 shows women and men who had no earnings in at least four years of each successive time period. Slightly more than half (51 percent) of women in the first period had at least 4 years with no work in the 15 years. This share decreased dramatically as women increased their labor force participation and, by the most recent period, the share of women with no work for four or more years had fallen to only 23 percent. This progression contrasts with that of men, for whom it is quite rare to miss four or more years of earnings. Relatively few men (4, 7, and 8 percent over the three periods, respectively) missed earnings in that many years.4
4 Figure 2 and Tables 1 and 2, below, show more detail for women and men with at least one year out of work than is shown for the weak attachment group in the rest of the report.
F IGURE
1F IGURE
2Women and Men with Persistent Earnings in Three Successive Time Periods
Women and Men with Earning Gaps in Three Successive Time Periods
Source: Authors’ calculations based on the Panel Study on Income Dynamics 1968–2015.
0%
20%
40%
60%
80%
100%
2001–151983–971968–82
Perc
ent o
f Wor
kers
88%
28%
47%
57%
76% 77%
0%
20%
40%
60%
80%
100%
2001–151983–971968–82
Perc
ent o
f Wor
kers
51%
4% 7% 8%
27%23%
No years without earningsn Men n Women
4 or more years without earningsn Men n Women

7
I W PR .ORG Still a Man’s Labor Market: The Slowly Narrowing Gender Wage Gap
Labor Force PersistenceTable 1 shows how annual earnings have changed over time for different levels of labor force attachment for women and men. Annual earnings are defined as the personal average over multiple years and count only years with earnings. For example, the average earnings of female workers with one year of no earnings represents the average across the 14 years in which these women had positive earnings. Of the 9 percent of women who worked for 14 years in the third period, the median value of their individual average annual earnings was $23,426 (Table 1).
While women’s earnings grew between the first and third periods, men’s earnings shrank. For women workers taken together, average annual earnings almost exactly doubled from the first period to the third period, from $14,379 to $28,673. As is shown below, this growth was driven by working more years, working more hours per year, and making higher hourly wages. Given the large increase for all women, it is not surprising that there was also strong earnings growth for women with different levels of labor force persistence. Women who worked all 15 years had a huge gain of 57 percent in annual earnings from the first to third period. And, even for women who had four or more years with no earnings, average annual earnings increased 51 percent across the three periods (Table 1).
TABLE
1 Average Annual Earnings of Women and Men in Three Successive Time Periods
Number of Years Without Earnings
Annual Average Earningsa,b
15-Year Time Periods Earnings Growth (%)
(c - a)/a1968–1982
(a)1983–1997
(b)2001–2015
(c)
Fem
ale
Wor
kers All Female Workers $14,379 $21,574 $28,683 99
None $24,558 $32,449 $38,649 571 $21,512 $22,460 $23,426 92 or 3 $15,192 $17,154 $21,192 394 or more $9,001 $9,628 $13,585 51
Mal
e W
orke
rs
All Male Workers $51,575 $50,044 $50,442 -2None $53,863 $56,005 $57,798 71 $45,262 $43,617 $35,475 -222 or 3 $36,193 $35,415 $32,118 -114 or more $29,422 $20,843 $24,832 -16
Notes: aAll dollars are adjusted to 2015 using the Personal Consumption Expenditure (PCE) price deflator. bZero-earnings years are not included; i.e. averages for earnings are calculated only for years when work is reported. Weighted data are used to calculate all figures. See Methodological Appendix for details.
Source: Authors’ calculations based on the Panel Study on Income Dynamics 1968–2015.
8
I W PR .ORGStill a Man’s Labor Market: The Slowly Narrowing Gender Wage Gap
The median value of the individual average annual earnings of all men for the years in which they were working was $51,575 in the first period and $50,442 in the third period, for a decline of two percent. Unlike women, men did not experience strong earnings growth (Table 1). This is in line with other research that finds men’s real cash earnings have not changed much across the last several decades. The value of employer benefits, however, has risen substantially, a phenomenon that applies to both male and female workers. In 2015, employer benefits (health insurance, employer share of FICA, retirement contributions, and other insurance payments) averaged 30 percent of earnings. These benefits were not distributed equally, as one investment advisory group estimated that workers with a salary of $50,000 received an extra 40 percent in benefits. While it is difficult to completely align modern benefit packages with those 30 years earlier (Jeffries 2013; Rose 2018 forthcoming), the increase in the value of employer-provided benefits added about 10 percentage points to the value of total compensation.
Even men who worked all 15 years, saw their earnings rise by only 7 percent from the first period to the third period. In contrast, for those men who did not work all 15 years, annual earnings for years working declined between 11 and 22 percent (Table 1).
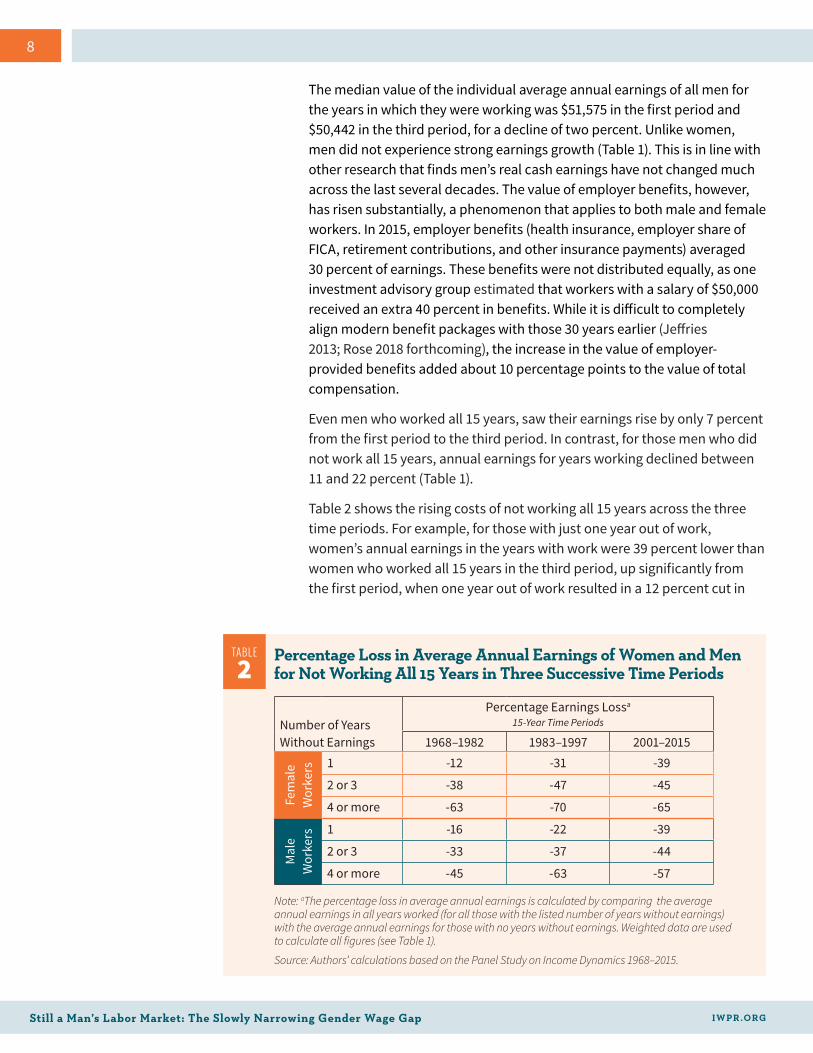
Table 2 shows the rising costs of not working all 15 years across the three time periods. For example, for those with just one year out of work, women’s annual earnings in the years with work were 39 percent lower than women who worked all 15 years in the third period, up significantly from the first period, when one year out of work resulted in a 12 percent cut in
TABLE
2 Percentage Loss in Average Annual Earnings of Women and Men for Not Working All 15 Years in Three Successive Time Periods
Number of Years Without Earnings
Percentage Earnings Lossa
15-Year Time Periods
1968–1982 1983–1997 2001–2015
Fem
ale
Wor
kers 1 -12 -31 -39
2 or 3 -38 -47 -45
4 or more -63 -70 -65
Mal
e W
orke
rs 1 -16 -22 -39
2 or 3 -33 -37 -44
4 or more -45 -63 -57
Note: aThe percentage loss in average annual earnings is calculated by comparing the average annual earnings in all years worked (for all those with the listed number of years without earnings) with the average annual earnings for those with no years without earnings. Weighted data are used to calculate all figures (see Table 1).
Source: Authors’ calculations based on the Panel Study on Income Dynamics 1968–2015.

9
I W PR .ORG Still a Man’s Labor Market: The Slowly Narrowing Gender Wage Gap
earnings for women in the years worked. The comparable earnings losses for male workers were similar: 16 percent lower earnings when missing one year in the first period and 39 percent lower in the most recent period beginning some 30 years later. In all but one case, women’s earnings losses for time out are greater than men’s.5
As in IWPR’s 2004 report, the penalties for not working for one or more years for both male and female workers are high. In fact, the penalties are highest in the most recent period. This development makes it all the more important that women strengthen their attachment to the labor force if they are to achieve higher lifetime earnings.
5 Other factors differing between women and men may contribute to earnings losses for years out of work; this discussion is not meant to convey that all the earnings losses noted here are due to years out of work. Because this sample is based on workers who report their work across all 15 years, selection effects may affect the size of absolute values. However, no information is available about gender differences in selection effects; the authors expect they are small.
Full-Time, Year-Round WorkAnother aspect of workforce continuity and intensity is indicated by working full-time, year-round—a status that often confers access to employer-provided benefits. This study separates the always-working group into two: those with full-time, year-round earnings records for at least 12 of 15 years (the strongly attached) and those who worked every year with fewer than 12 years of full-time, year-round hours (the moderately attached). These two groups are then contrasted with all those who had at least one year without earnings (combining all those who had years with no earnings into one group, the weakly attached, regardless of the number of years without earnings).
TABLE
3 Levels of Labor Force Attachment of Women and Men in Three Successive Time Periods
Level of Labor Force Attachment
Percent of Workers15-Year Time Periods
1968–1982 1983–1997 2001–2015
Fem
ale
Wor
kers Strong 11 23 28
Moderate 17 24 29
Weak 72 53 43
Mal
e W
orke
rs Strong 75 62 59
Moderate 13 14 18
Weak 12 24 23
Source: Authors’ calculations based on the Panel Study on Income Dynamics 1968–2015.
10
I W PR .ORGStill a Man’s Labor Market: The Slowly Narrowing Gender Wage Gap
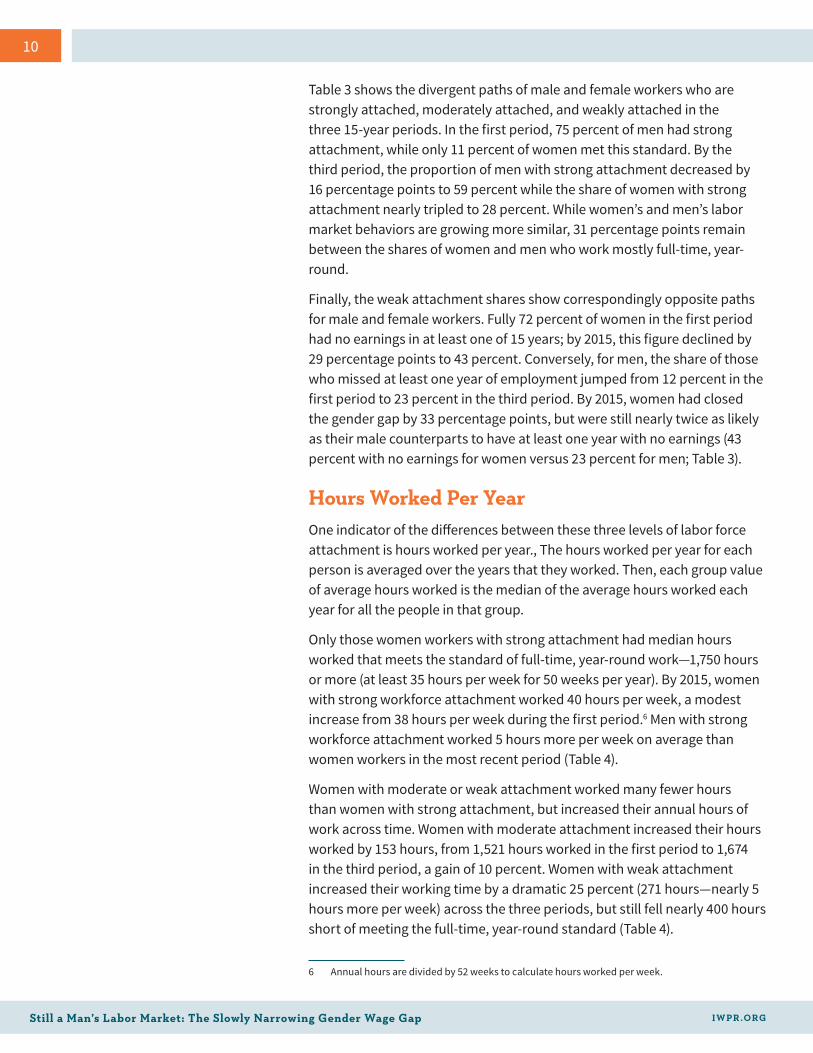
Table 3 shows the divergent paths of male and female workers who are strongly attached, moderately attached, and weakly attached in the three 15-year periods. In the first period, 75 percent of men had strong attachment, while only 11 percent of women met this standard. By the third period, the proportion of men with strong attachment decreased by 16 percentage points to 59 percent while the share of women with strong attachment nearly tripled to 28 percent. While women’s and men’s labor market behaviors are growing more similar, 31 percentage points remain between the shares of women and men who work mostly full-time, year-round.
Finally, the weak attachment shares show correspondingly opposite paths for male and female workers. Fully 72 percent of women in the first period had no earnings in at least one of 15 years; by 2015, this figure declined by 29 percentage points to 43 percent. Conversely, for men, the share of those who missed at least one year of employment jumped from 12 percent in the first period to 23 percent in the third period. By 2015, women had closed the gender gap by 33 percentage points, but were still nearly twice as likely as their male counterparts to have at least one year with no earnings (43 percent with no earnings for women versus 23 percent for men; Table 3).
6 Annual hours are divided by 52 weeks to calculate hours worked per week.
Hours Worked Per YearOne indicator of the differences between these three levels of labor force attachment is hours worked per year., The hours worked per year for each person is averaged over the years that they worked. Then, each group value of average hours worked is the median of the average hours worked each year for all the people in that group.
Only those women workers with strong attachment had median hours worked that meets the standard of full-time, year-round work—1,750 hours or more (at least 35 hours per week for 50 weeks per year). By 2015, women with strong workforce attachment worked 40 hours per week, a modest increase from 38 hours per week during the first period.6 Men with strong workforce attachment worked 5 hours more per week on average than women workers in the most recent period (Table 4).
Women with moderate or weak attachment worked many fewer hours than women with strong attachment, but increased their annual hours of work across time. Women with moderate attachment increased their hours worked by 153 hours, from 1,521 hours worked in the first period to 1,674 in the third period, a gain of 10 percent. Women with weak attachment increased their working time by a dramatic 25 percent (271 hours—nearly 5 hours more per week) across the three periods, but still fell nearly 400 hours short of meeting the full-time, year-round standard (Table 4).

11
I W PR .ORG Still a Man’s Labor Market: The Slowly Narrowing Gender Wage Gap
TABLE
4 Average Annual Hours Worked in Three Successive Time Periods, by Gender and Labor Force Attachment
Level of Labor Force Attachmentb
Average Annual Hours Workeda
15-Year Time Periods
1968–1982 1983–1997 2001–2015
Fem
ale
Wor
kers Strong 1,983 2,011 2,072
Moderate 1,521 1,606 1,674
Weak 1,093 1,407 1,364
Mal
e W
orke
rs Strong 2,305 2,242 2,318
Moderate 1,844 1,885 1,864
Weak 2,074 2,144 1,799
Notes: aYears without work are not included; i.e. averages for hours workerd are calculated only for years when work is reported. Weighted data are used to calculate all figures. Hourls worked are person-weighted rather than hour-weighted so that each person’s weight counts equally in the calculation regardless of how few or many hours the person worked. See Methodological Appendix for details. bFor definition of level of labor force attachment see Methodological Appendix.
Source: Authors’ calculations based on the Panel Study on Income Dynamics.
Men in all periods tend to work enough hours to meet the definition of full-time, year-round work. Those with strong attachment worked 43 to 45 hours per week in the three periods. In contrast, those with moderate attachment worked 35 or 36 hours per week. Finally, men with weak attachment worked an average of 40 hours per week in the first period and experienced a decline in the third period to 35 hours per week. While the growing detachment of men from the labor force, especially men with less education and lower wages when working, is often studied, the lower levels of attachment for similarly situated women are rarely studied. The gender gap is closing, however, as women with weak attachment show the greatest increase in hours of work among women, while their male counterparts show the largest decrease.
Hourly PayAn important indicator of labor market success connected to employment is hourly pay. As expected, pay varies with levels of attachment, and those with strong attachment have the highest hourly wages (Table 5), since they do not experience the lost earnings penalties for zero-earning years shown in Table 2.
Overall, women’s typical hourly wages increased by 45 percent from the first to the third period (from $11.51 per hour to $16.65 per hour), while men’s hourly wages remained almost flat across the nearly 50 years of this study. Table 5 also shows that women workers of all attachment levels had much higher median hourly wages in the third period compared with
12
I W PR .ORGStill a Man’s Labor Market: The Slowly Narrowing Gender Wage Gap
TABLE
5 Hourly Wages of Women and Men by Labor Force Attachment in Three Successive Time Periods
Level of Labor Force Attachmentb
Hourly Wagea
15-Year Time Periods Hourly Wage Growth (%)
(c - a)/a1968–1982
(a)1983–1997
(b)2001–2015
(c)
Fem
ale
Wor
kers
Strong $15.16 $19.03 $20.82 37
Moderate $13.37 $15.50 $19.62 47
Weak $10.55 $11.24 $13.40 27
All Female Workers $11.51 $13.85 $16.65 45
Mal
e W
orke
rs Strong $24.16 $26.31 $25.77 7
Moderate $22.86 $18.50 $21.62 -5
Weak $18.69 $14.94 $17.24 -8
All Male Workers $23.35 $22.84 $23.30 0
Female to Male Hourly Wage Ratioc 49% 61% 71%
Gender Wage Gap for Hourly Earningsd 51% 39% 29%
Notes: aHourly wages are person-weighted rather than hour-weighted so that each person’s weight counts equally in the calculation regardless of how few or many hours the person worked. bFor definition of level of labor force attachment see Methodological Appendix. cThe earnings ratio is calculated as 100 x women’s average annual earnings/men’s average annual earnings. Calculated for all female and male workers. dThe earnings gap = 100.0 - the earnings ratio. Calculated for all female and male workers.
Source: Authors’ calculations based on the Panel Study on Income Dynamics 1968–2015.
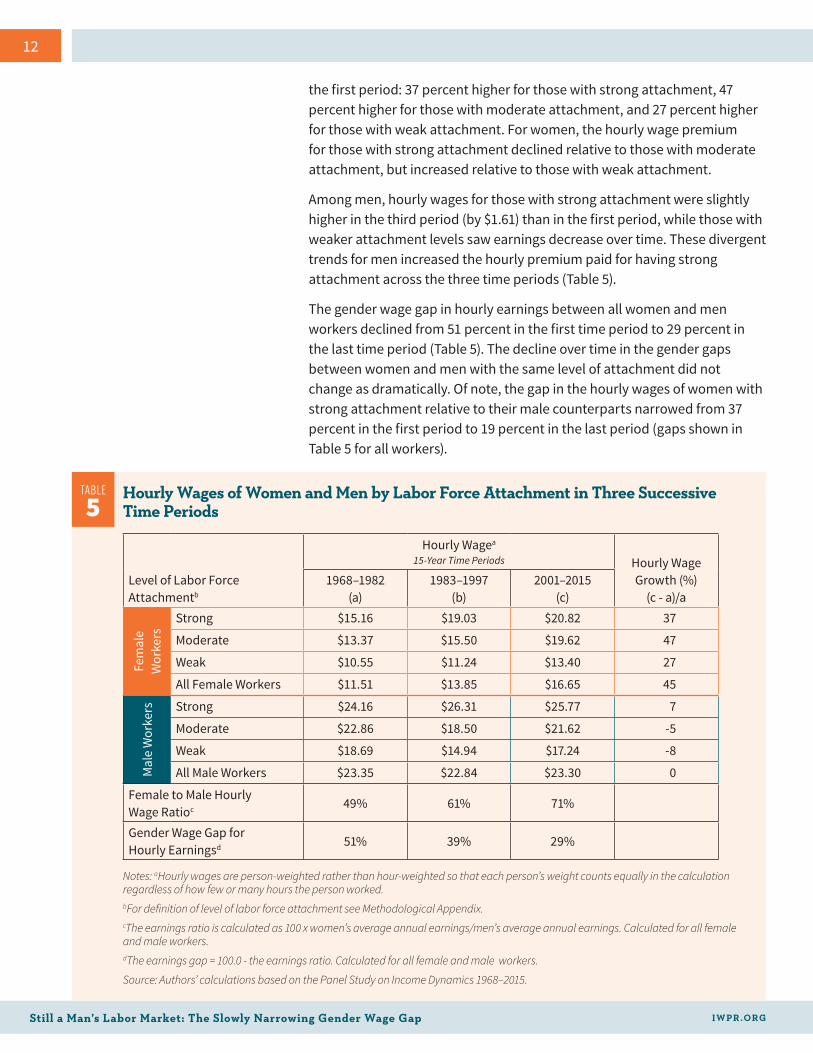
the first period: 37 percent higher for those with strong attachment, 47 percent higher for those with moderate attachment, and 27 percent higher for those with weak attachment. For women, the hourly wage premium for those with strong attachment declined relative to those with moderate attachment, but increased relative to those with weak attachment.
Among men, hourly wages for those with strong attachment were slightly higher in the third period (by $1.61) than in the first period, while those with weaker attachment levels saw earnings decrease over time. These divergent trends for men increased the hourly premium paid for having strong attachment across the three time periods (Table 5).
The gender wage gap in hourly earnings between all women and men workers declined from 51 percent in the first time period to 29 percent in the last time period (Table 5). The decline over time in the gender gaps between women and men with the same level of attachment did not change as dramatically. Of note, the gap in the hourly wages of women with strong attachment relative to their male counterparts narrowed from 37 percent in the first period to 19 percent in the last period (gaps shown in Table 5 for all workers).

13
I W PR .ORG Still a Man’s Labor Market: The Slowly Narrowing Gender Wage Gap
Annual EarningsCombining the effects of hours of work and hourly wages results in differences in real annual earnings (in years with work) by attachment status across the three periods. Table 6 highlights one striking feature, showing that annual earnings decline sharply as attachment weakens for both genders in all periods (moderately attached men in the middle time period are an exception). Growth rates in annual earnings among male workers vary widely by attachment levels, while growth in women’s earnings varies only slightly (all are high for women).
The pattern of wage growth for women across the different 15-year time periods shows that the penalties associated with moderate and weak attachment declined across the three time periods, relative to the most strongly attached women (Table 6). Across the three periods, new laws, increased labor force participation, and broader cultural changes in access to higher education and birth control resulted in women workers of all attachment levels benefitting from growth in hourly wages; in fact, those with lesser attachment benefitted the most. Nevertheless, those with the strongest labor force attachment have the highest level of wages in all periods (Table 6).
For men with strong attachment, real annual earnings increased by 12 percent across the three periods. In contrast, real annual earnings for men with moderate and weak attachment declined by 4 percent and 17 percent, respectively. For men, these trends indicate that the penalties associated with not working persistently full-time, year-round and for having a year with no earnings increased across the three time periods (Table 6).
TABLE
6 Average Annual Earnings of Women and Men by Labor Force Attachment in Three Successive Time Periods
Level of Labor Force Attachmentb
Annual Average Earningsa
15-Year Time Periods Earnings Growth (%)
(c - a)/a1968–1982
(a)1983–1997
(b)2001–2015
(c)
Fem
ale
Wor
kers Strong $31,198 $39,023 $44,560 43
Moderate $21,229 $24,474 $31,320 48Weak $11,377 $15,253 $17,790 56
Mal
e W
orke
rs Strong $55,974 $59,676 $62,454 12Moderate $42,069 $33,460 $40,374 -4Weak $36,949 $35,464 $30,628 -17
Notes: aZero-earnings years are not included; i.e. annual averages for earnings are calculated only for years when work is reported. Weighted data are used to calculate all figures. See Methodological Appendix for details. bFor definition of level of labor force attachment see Methodological Appendix.
Source: Authors’ calculations based on the Panel Study on Income Dynamics 1968–2015.
14
I W PR .ORGStill a Man’s Labor Market: The Slowly Narrowing Gender Wage Gap
This section brings together the analyses of strongly attached, moderately attached, and weakly attached female and male workers (presented above as non-overlapping groups) to illustrate different ways of measuring the wage gap—from a more inclusive measure to a more restricted measure.
These measures correspond to how widely or narrowly the labor force is defined and how many years of workers’ experience are included
in the measure. In the traditional comparison of women’s to men’s median annual earnings for those who work full-time, year-round in one year, the definition of the labor force is quite restricted, with significantly more women than men excluded—women are less likely to work every year and are also more likely to work part-time or part-year (see Tables 3 and 4). This report argues that a multi-year perspective provides a more accurate and comprehensive picture of the gender wage gap that measures the income women actually bring home to their families. For this reason, a multi-year perspective may be more meaningful to women and their families. This view aligns with the provisioning framework of feminist economics, which holds that economics can be considered as the study of how individuals provide for themselves, their families, and communities (Power 2004). This multi-year, comprehensive earnings gap could also be thought of as the ‘bringing home the bacon’ earnings gap.
To provide these more comprehensive and accurate measures of the earnings gap—which are referred to as the long-term earnings gaps—and to broaden the definition of the labor force, the categories of workers with strong, moderate, and weak attachment are combined (as indicated in Table 7). The most inclusive measure of the earnings gap includes earnings for all workers that have at least one year of earnings over the 15-year time period, and is measured in two ways. The earnings gap is then examined for two more restricted groups of workers—those working for all 15 years, and those with full-time, year-round earnings for at least 12 of the 15 years. Table 7 illustrates successively narrower gender earnings gaps, calculated from the earliest to most recent time period and from the broadest definition of the labor force (zero-earnings years included) to more restricted definitions.
Different Measures of the Gender Earnings Gap

15
I W PR .ORG Still a Man’s Labor Market: The Slowly Narrowing Gender Wage Gap
The comprehensive gender earnings gap in the first period, when more than 70 percent of women had at least one year without earnings, was 81 percent. Even in the most recent period when ‘only’ 43 percent of women had one or more years with no earnings, the earnings gap was 51 percent for all workers with any earnings in 15 years (Table 7). Consequently, when it comes to earnings to support oneself or a family, women today earn just 49 cents to the typical men’s dollar, much less than the 80 cents usually reported. If this comprehensive, long-term gender earnings gap were given more prominence in economics literature and in the media, there might be more attention paid to policies aimed at assisting more women workers in being full participants in the labor force across many years.
TABLE
7 Yearly Earnings for Women and Men and Long-Term Gender Earnings Gaps
15-Year Time Periods and Level of Labor Force Attachment
Percent of WorkersAnnual Average
EarningsLong-Term
Earnings Ratioa (%)
Long-Term Earnings Gapb (%)Women Men Women Men
1968–1982
Earnings Across 15-Yearsc 100 100 $8,425 $43,901 19 81
Earnings While Workingd 100 100 $13,376 $46,163 29 71Working All Yearse 28 88 $24,254 $51,096 47 53
Strongly Attachedf 11 75 $31,198 $55,974 56 44
1983–1997
Earnings Across 15-Yearsc 100 100 $15,839 $41,549 38 62
Earnings While Workingd 100 100 $20,309 $48,373 42 58
Working All Yearse 47 76 $32,277 $56,016 58 42
Strongly Attachedf 23 62 $39,023 $59,676 65 35
2001–2015
Earnings Across 15-Yearsc 100 100 $22,752 $46,494 49 51
Earnings While Workingd 100 100 $27,436 $50,135 55 45
Working All Yearse 57 77 $39,071 $58,333 67 33
Strongly Attachedf 28 59 $44,560 $62,454 71 29
Notes: aThe earnings ratio is calculated as 100 x average women’s annual earnings/average men’s annual earnings. bThe Earnings Gap = 100.0 - the earnings ratio. cEarnings across 15 years = 15 year average of annual earnings of all workers (includes the weakly attached). For workers who did not work all 15 years, earnings in the missing years of work are set at 0 dollars. dEarnings while working = average of annual earnings of all workers who had positive earnings in at least one of 15 years (includes the weakly attached). Annual average earnings include only the years when a person is working. eWorking all years = average of annual earnings of workers who have positive earnings in all 15 years. fStrongly attached = average of annual earnings of the workers with positive earnings in all 15 years and who have worked 1,750 hours or more for at least 12 years.
Source: Authors’ calculations based on the Panel Study on Income Dynamics 1968–2015.

16
I W PR .ORGStill a Man’s Labor Market: The Slowly Narrowing Gender Wage Gap
As Table 7 illustrates, as the definition of the labor force for the purpose of earnings comparisons between women and men becomes more restrictive within each time period—progressing from including all workers who had any work across all 15 years and including their zero-earning years in the calculation of the long-term earnings gap to including only those who worked all 15 years and worked full-time, year-round in at least 12 years—the share of the workforce included, especially women, in the calculation falls and the gender gaps narrow. Comparing earnings of only women and men with increasingly similar work patterns produces an overoptimistic and inaccurate view of the earnings most women receive from the labor market across multiple years.
In the first period, the most restricted labor force definition (the last row under every time period shown) yields the narrowest long-term earnings gap of 44 percent, which narrows further as time progresses, declining to 29 percent in the most recent time period. But the most restrictive definition captures relatively few women’s experiences in the labor market: only 11 percent of women in the first period and 23 percent of women in the most recent period are included (Table 7).
As was noted above, women worked more hours and more years in every attachment level across the three successive time periods. This work behavior, coupled with women’s positive trends in achieving higher education and limiting births, combined with demand-side factors to create many more better-paying jobs that women could enter, increasing women’s earnings. As Rose (2018) argues, while the share of skilled manual jobs and employment in the economy declined, the share of skilled ‘high-end service’ employment in office work, education, and health care grew. Some of these jobs were and are available to women who do not work full-time every year.
For each attachment level, women’s earnings grew across all three time periods and their earnings relative to men improved as well. Moreover, as indicated in the first two columns of Table 7, more women were in the stronger attachment categories as the time periods progressed, earning more because they did not have time out of work. Between the first and second time period, the overall gender earnings gap narrowed by nearly 20 percentage points (from 81 percent to 62 percent), and narrowed by 11 percentage points (from 62 percent to 51 percent) between the second and third periods. Despite this significant amount of progress in narrowing the “bringing home the bacon” earnings gap across three 15-year time periods, at no point did men bring home less than twice what women did. In the most recent period, men brought home twice as much as women did, compared with the first period, when men brought home five times more.
Finally, Figure 3 shows trends in the gender earnings gaps across the three levels of labor force attachment. The annual earnings gaps for four different definitions of the labor force decline across the time periods, indicating

17
I W PR .ORG Still a Man’s Labor Market: The Slowly Narrowing Gender Wage Gap
substantial progress in narrowing the wage gap across the board for women. Yet, all the trend lines also show that progress slowed from the second period to the third, a slowdown that, coupled with other indicators, has led some social scientists to conclude that women’s progress in the United States is ending (Cotter, Hermsen, and Vanneman 2011).
For women with strong attachment, the annual earnings gap across 15 years fell to 29 percent in the most recent period from 44 percent in the first period. These gaps are somewhat larger than (but fairly close to) the annual earnings gaps that are calculated yearly from the Current Population Survey; annual gaps averaged 23 percent in the most recent period and 41 percent in the first period (see the Appendix Table for a comparison of the PSID findings with the CPS findings).
In Figure 3, the larger gaps associated with ‘earnings across all years’ and ‘earnings while working,’—both definitions that include those who have years without earning—are likely associated with the kinds of occupations in which women work (Rose and Hartmann 2004). The long history of women
F IGURE
3 Four Declining Earnings Gapsa in Three Successive Time Periods
Notes: aThe Earnings Gap = 100.0 - the earnings ratio. The earnings ratio is calculated as 100 x average women’s annual earnings/average men’s annual earnings. bEarnings across 15 years = 15 year average of annual of earnings of all workers (includes the weakly attached). For workers who did not work all 15 years, earnings in the missing years of work are set at 0 dollars. cEarnings while working = average annual earnings of all workers who had positive earnings in at least one of 15 years (includes the weakly attached). Avereage annual earnings include only the years when a person is working.dWorking all years = annual average earnings of workers who have positive earnings in all 15 years.eStrongly attached = average average earnings of the workers with positive earnings in all 15 years and have worked 1,750 hours or more for at least 12 years.
Source: Authors’ calculations based on the Panel Study on Income Dynamics 1968–2015.
0%
20%
40%
60%
80%
100%
2001–151983–971968–82
Earn
ings
Gap
in P
erce
nt
81%
71%
53%44%
58%45%
62%
35%
42%51%
29%33%
n Earnings Across 15 Yearsb n Earnings While Workingc
n Working All Yearsd n Strongly Attachede

18
I W PR .ORGStill a Man’s Labor Market: The Slowly Narrowing Gender Wage Gap
moving in and out of the labor force means that, in many occupations that are predominantly done by women (e.g., teachers, nurses, social workers, and secretaries), women typically bear the cost of training and retraining and may structure their participation to accommodate taking one or several years out to raise children. A demand-side view suggests that women are crowded into a narrower range of occupations than men, suffering lower wages and little or no wage growth with seniority because the better jobs with higher wages and more wage growth are closed to them (Bergmann 1974; Bergmann 1989). Occupational differences by gender are shown by Francine Blau and Lawrence Kahn (2017) and Ariane Hegewisch and Emma Williams-Baron (2018). In addition, occupations with low wages and lower educational requirements remain more segregated than those with higher educational requirements, and wages in such female-dominated jobs do not tend to grow over time (Hartmann and Hayes 2017; Lovell, Hartmann, and Werschkul 2007).
Finally, Figure 3 shows the widest gender earnings gap for male and female earnings across 15 years for the broadest definition of the labor force, including the years in which they have zero earnings in the calculation. This calculation provides the most comprehensive measure of the rewards from working—in essence, the total pay women earn across 15 years relative to that of men. In the most recent 15-year time period, women earned a total of $341,280, whereas men earned twice as much at $697,410.

19
I W PR .ORG Still a Man’s Labor Market: The Slowly Narrowing Gender Wage Gap
Policy ImplicationsThe persistence of the gender earnings gap across all definitions of the labor force used to compare women’s and men’s earnings points to the need for stronger enforcement of equal opportunity laws in both the labor market and education, so that women can prepare themselves for any job, expect to find employment, and be treated fairly across their lifetimes.
Opening a broader range of occupations to women, including those in which women are underrepresented, would provide more opportunity for women to
pursue occupations with better earnings (Hegewisch, Bendick, Gault, and Hartmann 2016). Women are completing more years of education than men, but women’s and men’s major fields of postsecondary study differ substantially, and some women’s majors lead to lower pay (Carmichael 2017). More training and education are needed to help women enter and remain in traditionally male-dominated occupations, which often pay better. In addition, greater union representation and collective bargaining, along with higher minimum wages, tend to raise women’s wages more than men’s, narrowing the earnings gap (Shaw and Anderson 2018).
The remaining large differences in the years and hours worked between women and men suggest that ways to increase women’s full-time, year-round work and to encourage men to share more of the unpaid time spent on family care are also needed. Policies, such as paid family leave, available to and used by both men and women, would help, as would public subsidies for child care while parents work. Supports for workers who combine elder care with their own careers are also needed, since adults spend more working years with older parents on average than they do with young children. Such supports could include greater subsidies for paid care for the frail and ill elderly, paid family leave to help working caregivers, and improved retirement and Social Security benefits for those who reduce working time in order to provide child or elder care.
Some progress on tackling these issues has emerged in recent years, particularly at the state and local level.
More rigorous standards of equal pay in six states that prevent employers from asking about past pay will hopefully spread across the United States or become superseded by national legislation, establishing a practice that will end the perpetuation of pay discrimination from one job to the next (National Women’s Law Center 2018).

20
I W PR .ORGStill a Man’s Labor Market: The Slowly Narrowing Gender Wage Gap
Six states and the District of Columbia have passed paid family care leave laws (California, New Jersey, Rhode Island, New York, Washington, Massachusetts, and the District of Columbia). Eleven states, the District of Columbia, and more than 30 local jurisdictions require employers to provide paid sick days (usually three to ten days per year), which often include family care as an excused absence (A Better Balance 2018).
Public subsidies of early child care and education are gaining steam. Across the country, 42 states and the District of Columbia have instituted pre-kindergarten for four-year olds, with 10 of those states enrolling more than 50 percent of their jurisdiction’s four-year olds and 28 states and the District of Columbia including some three-year olds. Many of these programs operate as part of the public education system paid for through tax revenues (National Institute for Early Education Research, 2017). Elder care is being subsidized in various states in a variety of ways; Hawaii, for instance, has begun a cash benefit under the Kupuna program, which provides a daily stipend for elder care that allows an adult in the family to participate in paid employment (Hawaii Aging and Disability Resource Center 2018).
Programs and policies such as these can increase work hours and earnings of caregivers who combine work and caregiving and help spread the work of caregiving more equitably among men and women.
Expanding these policies and programs to other parts of the country or adopting national policies could help close the comprehensive, long-term earnings gap in the United States and equalize women’s pay with men’s across the lifetime.
21
I W PR .ORG Still a Man’s Labor Market: The Slowly Narrowing Gender Wage Gap
Methodological AppendixThe approach used in this study to obtain a longitudinal sample of male and female workers is to follow adults from ages 22 to 60 as they age to 36 to 84. The data come from the Panel Study on Income Dynamics (PSID), maintained by the University of Michigan. This longitudinal panel began in 1968 and interviewed study participants every year through 1997. After 1997, the interviews were conducted every other year; a question was asked about earnings for the missing year (see PSID.org for a discussion of their survey methods and sampling procedures). Over time, some participants either stop responding completely or miss one or more cycles of information gathering. Because there was interest in understanding how low-income families moved in and out of poverty and differences in mobility by race, in the original sample African Americans and others with low-incomes were overrepresented. To make the sample representative of the overall population, sample weights are assigned to each respondent at the time of the last wave of questions fielded. To adjust for the survey leavers, sample weights are changed each year for the remaining participants.
For each of the three time periods in this study, the study sample consists of respondents who have answered survey questions for all 15 years (even when they respond that they have zero earnings). Using the sample survey weights for the last year of each 15-year period results in demographic distributions that are different from the annual Current Population Survey (CPS), from which the annual wage gap data are derived, for people in the relevant age range. To make the study sample nationally-representative, the authors adjusted the weighting for each period such that the newly-weighted totals correspond to the national distributions of adults by gender, race/ethnicity, age, and education, for 36- to 84-year-olds in the last year of each time period.
The first two periods neatly comprise 30 years of data and provide complete yearly information for every respondent. In the last period, there are only eight years of data from interview answers. The earnings of sample participants for the missing seven years are available from a retrospective question about earnings in the year
prior to the year of the interview. These data have been cleaned and reviewed and have statistically appropriate means, medians, and distributions for that year in the authors’ judgment. The values for hours worked were also imputed for the missing years. Hours worked was determined by averaging the hourly wage in the two adjacent years and dividing the annual earnings of the missing year by the average hourly wage.
Age, race/ethnicity, and education in the final year of the period are variables whose values do not change. Otherwise, the years with positive earnings and years of working full-time, year-round have values from 0 to 15.
To group data on 15 years of data in a more usable form, three categories are developed accounting for the number of years with earnings as well as the number of hours worked per year. Strong attachment is defined as working all 15 years and having 12 or more years of full-time, year-round employment. Moderate attachment is defined as having earnings in all 15 years and fewer than 12 years full-time, year-round, and weak attachment as having at least one year with no earnings. These categories are non-overlapping. Long-term earnings gaps between women and men are calculated for these attachment categories in several different ways for all three 15-year periods and in several combinations of these categories.
The Appendix Table shows the annual earnings gaps that are derived from earnings data from the Census Bureau that are collected annually from the Current Population Survey (CPS), and also shown as averages across the three time periods in the study, compared with several different ways of calculating the long-term earnings gap using the PSID. The broadest PSID measure includes all the women and men in the study and the earnings gap is widest for this group as compared with the more narrowly defined measure based on the CPS. The one exception is a PSID-based measure of the long long-term earnings gap that is based on hourly
earnings, which is calculated for a more restricted labor force.

22
I W PR .ORGStill a Man’s Labor Market: The Slowly Narrowing Gender Wage Gap
15-Year Periods Years
CPS: Annual
Earnings Gap
Annual Earnings GapsHourly Earnings Gaps
PSID
CPS PSID2
Earnings While Working3
Working All Years4
1968– 1982
1968 42
41 81 49 37
1969 401970 41
1971 40
1972 42
1973 43
1974 41
1975 41
1976 40
1977 41
1978 41
1979 40
1980 40
1981 41
1982 38
1983–1997
1983 36
31 62 40 30
1984 361985 351986 361987 351988 341989 311990 281991 301992 291993 281994 281995 291996 261997 26
Table. Annual Average and Hourly Earnings Gaps1 of Women and Men in Three Successive Periods from Current Population Survey (CPS) and Panel Study on Income Dynamics (PSID)

23
I W PR .ORG Still a Man’s Labor Market: The Slowly Narrowing Gender Wage Gap
15-Year Periods Years
CPS: Annual
Earnings Gap
Annual Earnings GapsHourly Earnings Gaps
PSID
CPS PSID2
Earnings While Working3
Working All Years4
2001– 2015
2001 24
23 51 30 19
2002 232003 242004 232005 232006 232007 222008 232009 232010 232011 232012 232013 222014 212015 20
Notes:1The earnings gap = 100.0 - the earnings ratio. The earnings ratio is calculated as 100 x average of women’s annual (or hourly) earnings/average of men’s annual (or hourly) earnings. 2The annual gap is calculated based on the total annual earnings across all 15 years (0 earnings years are included).3Earnings while working = average hourly earnings of all workers who had positive earnings in at least one of 15 years (includes the weakly attached). Average hourly earnings include only the years when a person is working.4Working all years = average hourly earnings of workers who have positive earnings in all 15 years.
Sources: 1For CPS data see U.S. Census Bureau (2017) report on Income and Poverty in the United States: 2016 Table A-4. Authors’ calculations based on the Panel Study on Income Dynamics 1968-2015.

24
I W PR .ORGStill a Man’s Labor Market: The Slowly Narrowing Gender Wage Gap
ReferencesA Better Balance. 2018. “Overview of Paid Sick Time Laws in the United States.” <https://www.abetterbalance.org/wp-content/uploads/2018/05/Chart-and-Overview-of-Paid-Sick-Time-Laws-in-the-US-May-2018.pdf> (accessed September 28, 2018)
Bergmann, Barbara R. 1974. “Occupational Segregation, Wages and Profits when Employers Discriminate by Race or Sex.” Eastern Economic Journal. 1(2): 103–110.
Bergmann, Barbara R. 1989. “Does the Market for Women’s Labor Need Fixing?” Journal of Economic Perspectives. 3(1):43-60.
Blau, Francine D., and Lawrence M. Kahn. 2017. “The Gender Wage Gap: Extent, Trends, and Explanations.” Journal of Economic Literature. 55(3): 789-865.
Blau, Francine D., and Lawrence M. Kahn. 2013. “Female Labor Supply: Why Is the United States Falling Behind?” The American Economic Review. 103(3): 251–256.
Carmichael, Sarah Green. 2017. “Women Dominate College Majors that Lead to Lower-Paying Jobs.” Harvard Business Review (April 19).
Cotter, David A., Joan M. Hermsen, and Reeve Vanneman. 2011. “The End of the Gender Revolution: Gender Role Attitudes from 1977 to 2008.” American Journal of Sociology 117 (July): 259-289.
Favreault, Melissa F. 2018. “How Might Earnings Patterns and Interactions Among Certain Provisions in OASDI Solvency Packages Affect Financing and Distributional Goals?” Boston: Center for Retirement Research at Boston College. <http://crr.bc.edu/wpcontent/uploads/2018/03/wp_2018-2-1.pdf> (accessed September 11, 2018).
Fontenenot, Kayla, Jessica Semega, and Melissa Kollar. 2018. Income and Poverty in the United States: 2017. P60-263. Annual Social and Economic Supplement. (September 12). Washington, D.C.: U.S. Census Bureau.
Hartmann, Heidi and Jeffrey Hayes. 2017. “The Growing Need for Home Care Workers: Improving a Low-Paid, Female-Dominated Occupations and the Conditions of its Immigrant Workers.” Public Policy & Aging Report. 27:3:88-95.
Hawaii Aging and Disability Resource Center. 2018. “State Launches Landmark Kupuna Caregiving Program.” <https://www.hawaiiadrc.org/> (accessed September 16, 2018).
Hegewisch, Ariane. 2018. “The Gender Wage Gap: 2017; Earnings Differences by Gender, Race, and Ethnicity.” Fact Sheet, IWPR #C473. Washington, DC: Institute for Women’s Policy Research. < https://iwpr.org/publications/gender-wage-gap-2017/> (accessed September 17, 2018).
Hegewisch, Ariane and Marc Bendick, Barbara Gault, and Heidi Hartmann. 2016. Pathways to Equity: Narrowing the Wage Gap by Improving Women’s Access to Good Middle-Skill Jobs. Washington, DC: Institute for Women’s Policy Research.
Hegewisch, Ariane, and Emma Williams-Baron. 2018. “The Gender Wage Gap by Occupation, 2017, and by Race and Ethnicity.” Fact Sheet. C462. Washington, DC: Institute for Women’s Policy Research. <https://iwpr.org/publications/gender-wage-gap-occupation-2017-race-ethnicity/> (accessed Se ptember 17, 2018).
Jeffries, Lon. 2013. “How Much Are Employer Benefits Worth?” (November 14) <http://networthadvice.com/much-employer-benefits-worth/> (accessed September 7, 2018).
Lovell, Vicky, Heidi Hartmann, and Misha Werschkul. 2007. “More Than Raising the Floor: The Persistence of Gender Inequalities in the Low-Wage Labor Market.” In The Sex of Class: Women Transforming American Labor, ed. Dorothy Sue Cobble, 35-58. Ithaca, New York: Cornell University Press.
National Center for Education Statistics. 2017. Digest of Education Statistics, 2017. <https://nces.ed.gov/programs/digest/d17/tables/dt17_318.10.asp> (accessed September 7, 2018).
National Institute for Early Education Research. 2017. State of Preschool 2017. <http://nieer.org/wp-content/uploads/2018/07/State-of-Preschool-2017-Full-7-16-18.pdf> (accessed September 16, 2018).
National Women’s Law Center. 2018. “Progress in the States for Equal Pay.” Washington, DC: National Women’s Law Center. <https://nwlc-ciw49tixgw5lbab.stackpathdns.com/wp-content/uploads/2018/06/Progress-in-the-States-for-Equal-Pay-FINAL.pdf> (accessed September 9, 2018)
Power, Marilyn. 2004. “Social Provisioning as a Starting Point for Feminist Economics.” Feminist Economics. 10:3-19.
Rose, Stephen J. 2018. “Manufacturing Employment: Fact and Fiction.” (April 13) Washington, D.D.: Urban Institute. https://www.urban.org/sites/default/files/publication/97776/manufacturing_eemploymen_fact_and_fiction_2.pdf (accessed September 11, 2018)
Rose, Stephen J. 2018 Forthcoming. “The Ins and Outs of Measuring Income Inequality: Piketty and Company Aren’t the Only Game in Town.” Washington, DC: Urban Institute.

25
I W PR .ORG Still a Man’s Labor Market: The Slowly Narrowing Gender Wage Gap
Rose, Stephen J., and Heidi I. Hartmann. 2004. Still a Man’s Labor Market: The Long-Term Earnings Gap. C355. Washington: D.C.: Institute for Women’s Policy Research. LOC: 2004103515.<https://iwpr.org/wp-content/uploads/wpallimport/files/iwpr-export/publications/C366.pdf> (accessed September 11, 2018).
Shaw, Elyse and Julie Anderson. 2018. “The Union Advantage for Women.” Fact Sheet C463. (February) Washington, D.C.: Institute for Women’s Policy Research. <https://iwpr.org/publications/union-advantage-women-2018/> (accessed September 17, 2018).
U.S. Bureau of Labor Statistics. 2017a. News Release. “Work Experience of the Population-2016.” (December 5) Table 1. <https://www.bls.gov/news.release/pdf/work.pdf> (accessed September 9, 2018).
U.S. Bureau of Labor Statistics. 2017b. Women in the Labor Force: a Databook. BLS Reports (November). <https://www.bls.gov/opub/reports/womens-databook/2017/home.htm> (accessed September 7, 2018).
U.S. Bureau of Labor Statistics. 2018. Employment & Earnings Online 2018, Table 5. < https://www.bls.gov/opub/ee/2018/cps/annavg5_2017.pdf > (accessed October 15, 2018).
U.S. Department of Commerce, Bureau of Economic Analysis, NIPA Accounts, Supplemental table 7.1. <https://apps.bea.gov/iTable/iTable.cfm?isuri=1&reqid=19&step=2&0=survey> (accessed August 30, 2018).

26
I W PR .ORGStill a Man’s Labor Market: The Slowly Narrowing Gender Wage Gap
About the Institute for Women’s Policy ResearchThe Institute for Women’s Policy Research (IWPR) conducts and communicates research to inspire public dialogue, shape policy, and improve the lives and opportunities of women of diverse backgrounds, circumstances, and experiences. The Institute’s research strives to give voice to the needs of women from diverse ethnic and racial backgrounds across the income spectrum and to ensure that their perspectives enter the public debate on ending discrimination and inequality, improving opportunity, and increasing economic security for women and families. The Institute works with policymakers, scholars, and public interest groups to design, execute, and disseminate research and to build a diverse network of individuals and organizations that conduct and use women-oriented policy research. IWPR’s work is supported by foundation grants, government grants and contracts, donations from individuals, and contributions from organizations and corporations. IWPR is a 501(c)(3) tax-exempt organization that also works in affiliation with the Program on Gender Analysis in Economics at American University.
BOARD OF DIRECTORS
Lorretta Johnson, Chair American Federation of Teachers, AFL-CIO
Martha Darling, Vice Chair Boeing (retired)
Hilary Doe NationBuilder
Beth Grupp Beth Grupp Associates
Mary Hansen American University
Kai-yan Lee Vanke
Esmeralda O. Lyn Hofstra University
Joan Marsh AT&T
Kristin Rowe-Finkbeiner MomsRising
Elizabeth Shuler AFL-CIO
Marci B. Sternheim Sternheim Consulting
Sheila W. Wellington NYU/Stern School of Business Emerita
OFFICERS OF THE CORPORATION
Heidi Hartmann, President
Barbara Gault, Vice President
William Rodgers, Treasurer
Marcia Worthing, Secretary

IWPR #C474 | © Copyright 2018 by the Institute for Women’s Policy Research

1200 18th Street NW, Suit 301 Washington, DC 20036
iwpr.org | [email protected] | @IWPResearch
This report presents an updated analysis first modeled in the 2004 study, Still a Man’s Labor Market: The Long-Term Earnings Gap, by Stephen J. Rose Ph.D., and Heidi I. Hartmann, Ph.D. Updated here for the first time since 2004, the original study pioneered the analysis of the earnings gap over 15-year time periods.
Stephen J. Rose is a nationally recognized labor economist and has spent the last 35 years researching and writing about the interactions between formal education, training, career movements, incomes, and earnings. Rose has worked with large longitudinal and cross-sectional data sets to develop unique approaches to understanding long-term income and earnings movements. Rose is currently a nonresident fellow in the Income and Benefits Policy Center at the Urban Institute and a Research Professor at the George Washington Institute of Public Policy. Rose has held senior positions at the Georgetown University Center on Education and the Workforce, Educational Testing Service, the US Department of Labor, Joint Economic Committee of Congress, the National Commission for Employment Policy, and the Washington State Senate. His commentaries have appeared in The New York Times, Washington Post, Wall Street Journal, and other print and broadcast media. He has a BA from Princeton University and an MA and PhD in economics from the City University of New York.
Heidi I. Hartmann is the President of the Washington-based Institute for Women’s Policy Research (IWPR), a scientific research organization that she founded in 1987 to meet the need for women-centered, policy-oriented research. She is an economist with a B.A. from Swarthmore College and M. Phil and Ph.D. degrees from Yale University, all in economics. Dr. Hartmann is also a Distinguished Economist In-Residence for the Program on Gender Analysis in Economics at American University. She serves as Editor of the Journal of Women, Politics & Policy, and served as the Chair of the Board of the American Academy of Political and Social Science (AAPSS). Dr. Hartmann lectures internationally on women, economics, and public policy, frequently testifies before the U.S. Congress, and is often cited as an authority in various media outlets, such as CNN, The Washington Post, The New York Times, and The Wall Street Journal. She is the recipient of a MacArthur Fellowship Award for her work in the field of women and economics and was named a Charlotte Perkins Gilman Fellow by AAPSS.