steve neiman, executive director satish jonnavithula, … · september 2008 transaction monitoring...
TRANSCRIPT

September 2008
Transaction monitoring using Nagios®
Steve Neiman, Executive Director
Satish Jonnavithula, Vice President

1Copyright © 2008 J.P. Morgan Chase & Co. All rights reserved.May not be reproduced or distributed without written permission of J.P. Morgan Chase & Co.
Scale of the technology environment
A global company, such as JPMorgan Chase & Co. (NYSE: JPM)
Global financial services firm
Assets of $1.6 trillion and 2007 revenues of $71 billion
Operations in more than 60 countries
Covers many different finance fields from investment banking for multi-national corporate clients to financial services for millions of individual consumers
…translates into a global technology infrastructure
North America with 10 major data centers has the largest footprint, but JPMorgan Chase has major data centers around the globe
Data centers can consume up to 10 megawatts of power each
That’s a lot of machines, switches, power supplies, cooling, etc. to keep track of

2Copyright © 2008 J.P. Morgan Chase & Co. All rights reserved.May not be reproduced or distributed without written permission of J.P. Morgan Chase & Co.
Infrastructure monitoring is done best on a global scale
In today’s global economy, it is essential to track the state of the company’s technology infrastructure at all times
Like many companies, we set up centralized command centers that can respond instantly to infrastructure issues
To reap these advantages of scale, data center events and attributes have been standardized
Power
Ping
Plumbing

3Copyright © 2008 J.P. Morgan Chase & Co. All rights reserved.May not be reproduced or distributed without written permission of J.P. Morgan Chase & Co.
Application monitoring is not infrastructure monitoring
However, application state and events are not nearly as standardized as infrastructure
“Application power”Could be defined in many ways: memory, threads, resource pools
Even if the application shows up in a process table, that does not mean it is on
“Application ping”Could be defined in many ways: Initial splash page, an end-to-end response, or a trial transaction
If there is no customized monitoring, this type of fault may often be discovered first by end users
“Application plumbing”How and where do applications describe dependencies
Does an application ecosystem require market data servers, or messaging infrastructure, or a token of some sort, or a database connection?
Is access to a service enough, or do they need further rights? How much capacity? Latency?

4Copyright © 2008 J.P. Morgan Chase & Co. All rights reserved.May not be reproduced or distributed without written permission of J.P. Morgan Chase & Co.
Applications are different, so the monitoring must be different
A single business division within JPMorgan Chase may have close to 1,000 different applications
A given application may also have several different deployment topologies around the globe
Different business rhythms make different performance patterns acceptable
Pegging the CPU for three hours on a back office system may be acceptable on a quarterly credit derivative settlement run that has the entire weekend, but it is not acceptable for a market-making equity application during normal business hours
But global monitoring infrastructures must be careful about customization
Shared infrastructures of any type need to vet changes
A hidden circular reference can swamp an entire infrastructure
5Copyright © 2008 J.P. Morgan Chase & Co. All rights reserved.May not be reproduced or distributed without written permission of J.P. Morgan Chase & Co.
Nagios® monitoring tools provide an attractive approach for local customization
Leverage regional Operate teams that face off to business users and external client applications
Capture teams’ local wisdom to create customized monitoring
Nagios® monitoring tools’ easy extensibility allows them to do the customization directly
Smaller, customized installations allow for more rapid change
Push-pull hybrid architecture utilizing ‘nrpe/nsca’ gives resiliency and scalability
Software developers can easily experiment with different events
Specific events can still be thrown to the global monitoring infrastructure

6Copyright © 2008 J.P. Morgan Chase & Co. All rights reserved.May not be reproduced or distributed without written permission of J.P. Morgan Chase & Co.
Watching events flow through the application ecosystem
Bursts of system activity pose multiple challenges
Is it a valid business pattern?
Determining the status of a single transaction is easy; determining the status of a swarm of interrelated transactions is hard
Despite temporary backlogs or 100% utilization warnings, is the ecosystem functioning properly?
The regional Operate teams have seen these events before, but they need to encode their knowledge
Nagios® monitoring tools can track that impact of a burst across multiple system layers and allow previous experience to be put to use
Web
Messaging
Middleware
Database

7Copyright © 2008 J.P. Morgan Chase & Co. All rights reserved.May not be reproduced or distributed without written permission of J.P. Morgan Chase & Co.
Using Nagios® monitoring tools to monitor Straight Through Processing
Robust Straight-Through-Processing (STP) is a key advantage for large players in the financial services arena
STP monitoring must integrate different types of technology, data formats, and event bursts
An Enterprise Service Bus is a key concept for routing and data transformation, but just because ESB is running doesn’t mean a given STP workflow is “on”
While business process rules may be separated in the Build environment, different business processes and technical factors entwine logic in the runtime environment
Visibility is often further reduced when event processing crosses into a controlled environment like a mainframe or application server
MULE - Services Backbone
Web Services/.Net/HTTP
IBM MQ, Active
MQ, AMQ,etc
J2EE /ServetContainer
Frameworks,Spring, etc
AS400, Oracle,
Sybase, etcFILE,FTP

8Copyright © 2008 J.P. Morgan Chase & Co. All rights reserved.May not be reproduced or distributed without written permission of J.P. Morgan Chase & Co.
Using Nagios® monitoring tools when an STP burst first hits
Every STP application is different, depending on the complexity of the financial instrument and the capability of market participants
For instance, some deals are actually complex baskets of transactions, resulting in a cascade of deal messages. Less customized monitoring would trigger false alarms.
Local teams can see the different puzzle pieces…
Infrastructure – MQ Queue Depth
Application VM – Messages Processed
Plug-ins – MQ, Java, Mule-JMX, Database, Trending, Database
9Copyright © 2008 J.P. Morgan Chase & Co. All rights reserved.May not be reproduced or distributed without written permission of J.P. Morgan Chase & Co.
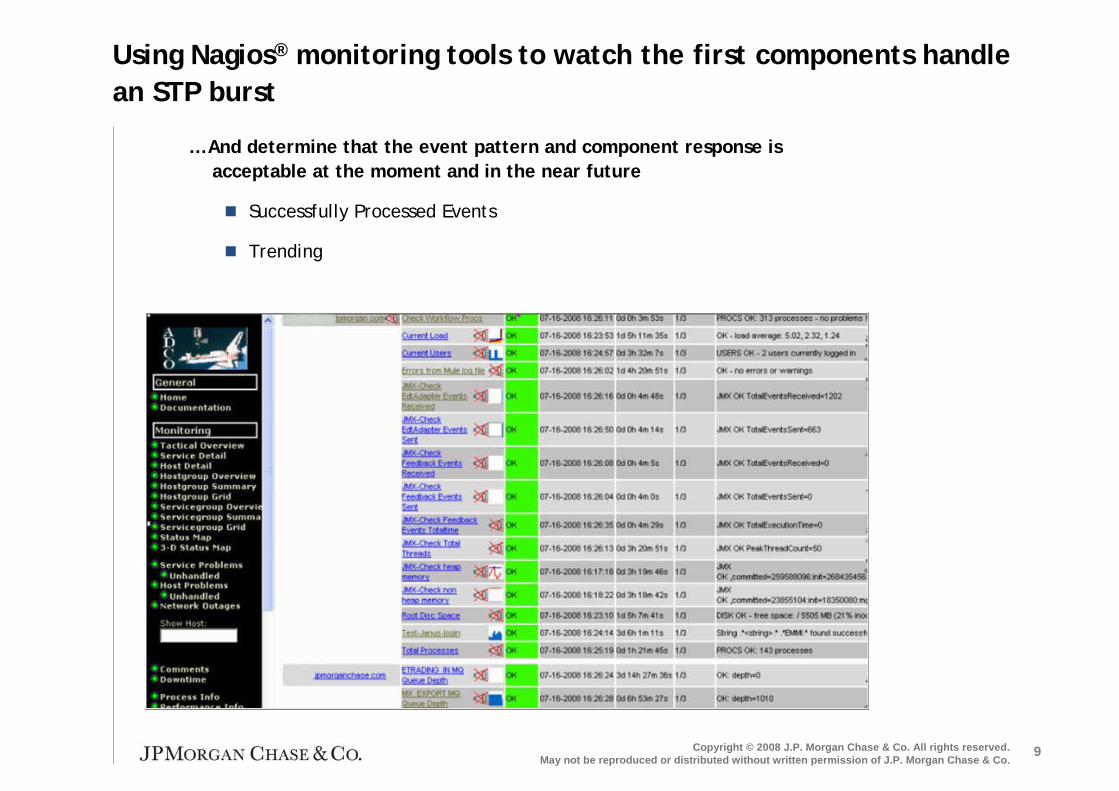
Using Nagios® monitoring tools to watch the first components handle an STP burst
… And determine that the event pattern and component response is acceptable at the moment and in the near future
Successfully Processed Events
Trending

10Copyright © 2008 J.P. Morgan Chase & Co. All rights reserved.May not be reproduced or distributed without written permission of J.P. Morgan Chase & Co.
Using a dashboard to see the broader impact of the STP burst
A broader STP dashboard shows the load flowing through differentcomponents of the ecosystem
None has an unacceptable backlog
Fingernail sketches indicate several components are under load
11Copyright © 2008 J.P. Morgan Chase & Co. All rights reserved.May not be reproduced or distributed without written permission of J.P. Morgan Chase & Co.
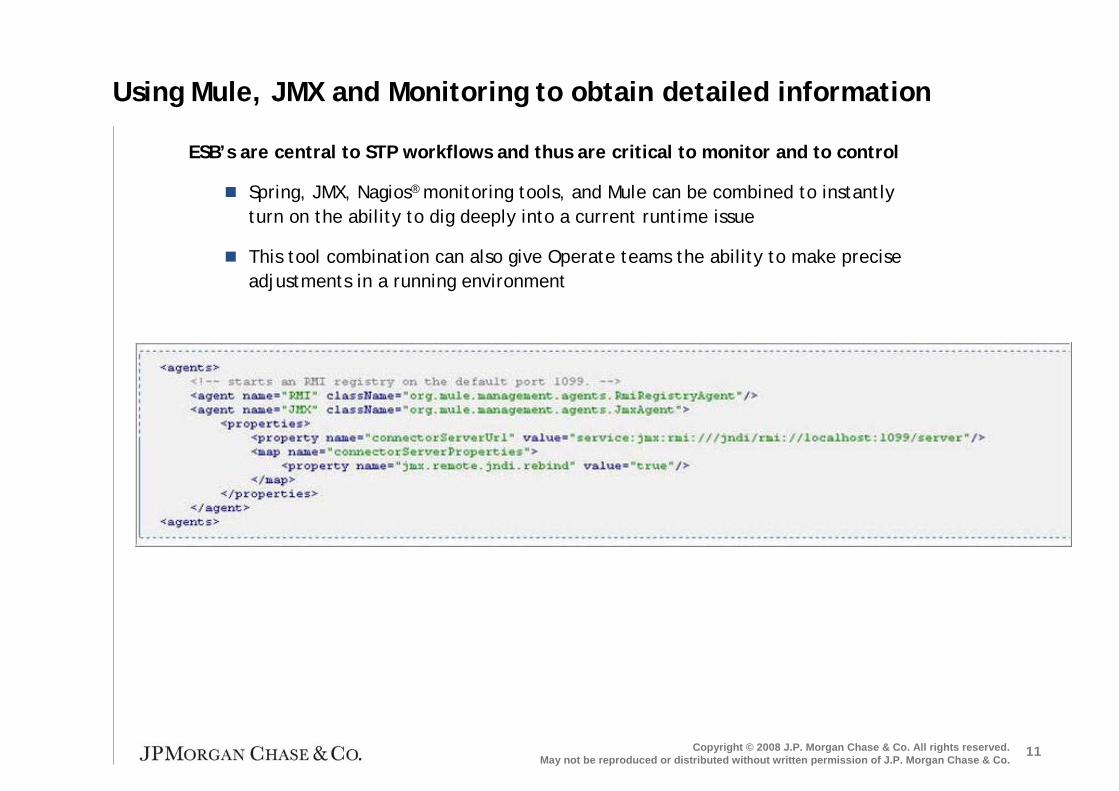
Using Mule, JMX and Monitoring to obtain detailed information
ESB’s are central to STP workflows and thus are critical to monitor and to control
Spring, JMX, Nagios® monitoring tools, and Mule can be combined to instantly turn on the ability to dig deeply into a current runtime issue
This tool combination can also give Operate teams the ability to make precise adjustments in a running environment

12Copyright © 2008 J.P. Morgan Chase & Co. All rights reserved.May not be reproduced or distributed without written permission of J.P. Morgan Chase & Co.
… Without requiring developer skills
These capabilities, while requiring scripting and configuration, do not require Operate teams to acquire advanced developer skills

13Copyright © 2008 J.P. Morgan Chase & Co. All rights reserved.May not be reproduced or distributed without written permission of J.P. Morgan Chase & Co.
Application monitoring is not infrastructure monitoring
Application state and events are not nearly as standardized as infrastructure
“Application power”
“Application ping”
“Application plumbing”
Need to leverage regional Operate teams
Capture teams’ local wisdom to create customized monitoring
Nagios® monitoring tools’ easy extensibility and installation is key to empowering Operate teams
Software developers must be able to see what Operate teams see
Specific events can still be thrown to the global monitoring infrastructure if desired