step 3 of the data analysis plan confirm what the data reveal: inferential statistics all this...
TRANSCRIPT
Step 3 of the Data Analysis Plan Confirm what the data reveal:
Inferential statistics
All this information is in Chapters 11 & 12 of text

For most research today, this step of the plan would use inferential statistics (such as t-test and analysis of variance).

Purpose of Inferential Statistics
To aid the researcher in making a decision about whether the differences in the DV are large enough to reflect a true effect of IV or are actually a result of chance alone.

Null Hypothesis Significance Testing (NHST) (5) Five Critical Terms:
1) H0 – Null Hypothesis – a hypothesis of “no difference”
• in reality the samples come from the same population and differ only due to chance.
• There is no effect of the IV ( 1= 2)• OR if I redo this study, I might or might not
get the same results.

2) HA – Alternative Hypothesis- says the means are truly different as a result of the effect of the different levels of my IV.
• The samples come from different populations.
• There is an effect of the IV ( 1≠ 2) • OR if I redo this study I will still find
the same results.

3-5 Type I Error, Type II Error, Power(page 387 of text)
Reality
H0 false H0 true
YourDecision
H0 false(reject H0)
H0 true(fail to reject H0)

Reality
H0 false H0 true
YourDecision
H0 false(reject H0)
Correct Decision(power)(1-b)
H0 true(fail to reject H0)

Power
• Power: the probability of correctly rejecting a false H0.
• The probability that there really IS an effect of IV and you correctly detect this and say there is an effect of the IV.
• “Power” is used to describe the ability of a particular statistical test to detect a true effect of an IV.

“Sensitivity”
• Similar to “power”
• Sensitivity is the term used to describe the likelihood that a DESIGN will be able to correctly detect a true effect of an IV

Reality
H0 false H0 true
YourDecision
H0 false(reject H0)
Correct Decision(power)(1-b)
H0 true(fail to reject H0)

3-5 Type I Error, Type II Error, Power(page 387 of text)
Reality
H0 false H0 true
YourDecision
H0 false(reject H0)
Correct Decision(power)(1-b)
Type I errorp (type I error)=a
H0 true(fail to reject H0)
Type I error
• Type I Error – when you claim there is an effect of IV, but in reality the differences were due to chance alone.
• Probability Type I Error = α (alpha)

3-5 Type I Error, Type II Error, Power(page 387 of text)
Reality
H0 false H0 true
YourDecision
H0 false(reject H0)
Correct Decision(power)(1-b)
Type I errorp (type I error)=a
H0 true(fail to reject H0)

3-5 Type I Error, Type II Error, Power(page 387 of text)
Reality
H0 false H0 true
YourDecision
H0 false(reject H0)
Correct Decision(power)(1-b)
Type I errorp (type I error)=a
H0 true(fail to reject H0)
Type II errorp (type II error)=b

Type II error
• Type II Error – when you miss a true effect of the IV
• The IV had an effect and you said differences were due to chance
• Probability Type II Error = β (beta)
• Type II errors are much more common than Type I errors

3-5 Type I Error, Type II Error, Power(page 387 of text)
Reality
H0 false H0 true
YourDecision
H0 false(reject H0)
Correct Decision(power)(1-b)
Type I errorp (type I error)=a
H0 true(fail to reject H0)
Type II errorp (type II error)=b ????
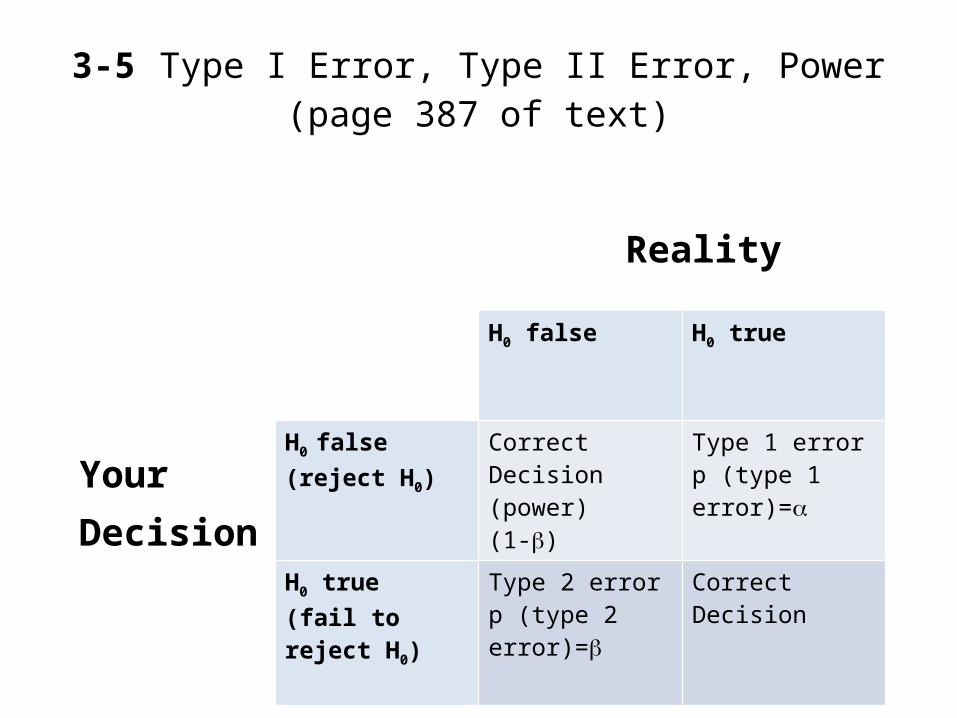
3-5 Type I Error, Type II Error, Power(page 387 of text)
Reality
H0 false H0 true
YourDecision
H0 false(reject H0)
Correct Decision(power)(1-b)
Type 1 errorp (type 1 error)=a
H0 true(fail to reject H0)
Type 2 errorp (type 2 error)=b
Correct Decision
Name that cell!
• Sadly, this last cell has no name
• If you could name this cell, what would you name it???

What affects Power?
• Sample size – as sample size increases, power increases
• Effect size – as effect size increases, power increases
• Statistical test used will actually affect power
(ex: repeated measures designs has more “power” (sensitivity) than independent group designs)
• α (alpha) affects power – as alpha increase, power increases

• So…where should you set alpha ( )???a
• Traditionally, set alpha to be .05 (at the highest) or sometimes .01
• Why do we use these values?• Arbitrary- Fisher had five fingers, we live in a
“digital world”

• Why would we want alpha to be low?
• Want to avoid Type I Error
• Want to avoid saying IV had effect when it did not.

• If (alpha) is high, we increase the amount of research in our “data base” that implies particular IVs have “effects” on DVs when the differences observed are due only to chance.
• Others then study these variables under the assumption that their effects are real when they are not.
• Expensive in terms of both time & money and potentially damaging if used in applied ways.

Relationship between α , β , and Power
• α (alpha), β (beta), and power are inter-related
• Where you decide to set α (alpha) will affect both β (beta) and power

Warning:This WILL make your head hurt
• alpha (α) and beta (β) have a “reciprocal” relationship. (as one goes up, the other goes down)
• As chance of Type I Error decreases, the chance of Type II Error increases.
• As chance of Type I error increases, the chance of a Type II error decreases.

Relationship between power and beta
• Since power=1- β, the relationship between β and power is also “reciprocal”
• as one goes up the other goes down
• As power increases, the chance of a type II error decreases

Relationship between alpha ( )a and power
• The relationship between α and power is “direct”
• As alpha (α) increases or decreases, power moves in the SAME direction
• As alpha increases, power increases• As alpha decreases, power decreases• If you set alpha to be .01 rather than .05, you
will decrease the power of the study

Does your head hurt now? Ready for a mnemonic?
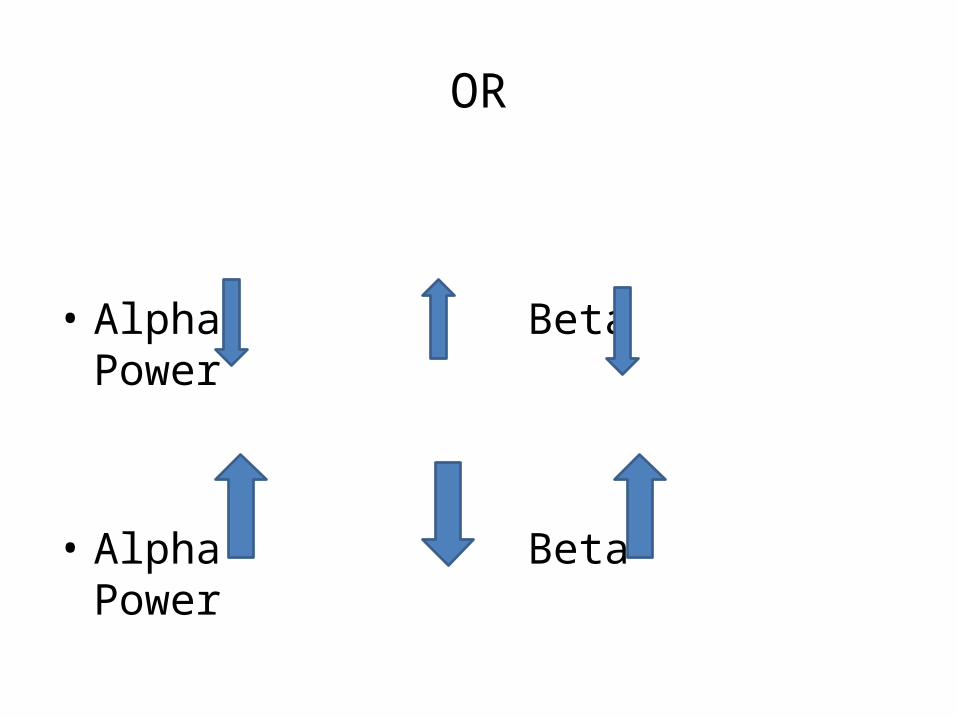
OR
• Alpha Beta Power
• Alpha Beta Power

Ready for a little statistical “heresy”?
• You (as the researcher) have control over alpha
• Remember, where you set alpha affects both power and beta.
• While the “traditional” levels for alpha are .05 or .01, there could be a practical (or applied) reason to allow for a higher level for alpha
• The value “.05” is truly an arbitrary value. You do want alpha to be low but sometimes, in certain situations, an alpha a little above .05 can be appropriate.
Aside• The computer tells you an exact value for α
(alpha)
• In SPSS, this is reported in the computer printout in a column labeled “Sig.”
• No longer need the tables at the back of a textbook
• What if the computer calculates a “Sig.” (equivalent to the probability of a Type I error or “p”) value of .0556?
• Will you declare this to be a difference due to chance alone?
• For practical/applied purposes, maybe not.

Example: New drug for severe depression
• Situation #1: New drug is cheaper than old drug and has no major side effects
• You have two groups: old drug vs. new drug
• New drug group shows considerable improvement (judging from means) over old drug, but…the significance level= .0556
• What will you do? What choice will you make? Use new drug or stick to old drug?

• if α (alpha) > .05, fail to reject null
• say there is no significant difference between the old and new drug
• But “.05” is an arbitrary cut off point. Alpha should be low but, in this case, maybe you should follow up on this finding.
• Change “mental” α (alpha) to .06 (from .05)

Effect of increasing alpha on beta & power
• If you let α (alpha) increase, β (beta) will decrease (you lower the chance of missing a true effect of the IV)
• since power = 1- β (beta), power will increase (you increase the chance of correctly detecting a true effect of the IV)

• I would allow a slightly greater chance of a Type I error in order to reduce the chances of a Type II error (missing a real effect)
• I would be willing to risk a somewhat greater chance of mistakenly saying the new drug is better than the old because the risks and costs of the new drug are low
• “border line” significant or “marginally” significant

• Situation #2: New Drug is expensive and has some very nasty (potentially dangerous) side effects
• Again, you analyze your data and find an a (alpha)=.0556
• What will you do? What choice will you make now? Use the new drug or stick with the old?

• I would lower α (alpha) (say .01)
• I want to avoid Type I Error (saying the new drug is better when differences are actually the result of chance)

• Lowering a (alpha) to .01 would increase β (beta) and decrease power
• I would not want to risk exposing people to potentially dangerous side effects and a more expensive treatment unless I was certain the new drug was more effective than the old drug.

• Power tells us the probability of correctly detecting a real effect of an IV
• As effect size or magnitude increases, power increases
• As sample size increases, power increases• These are two aspects you CAN control:• can study variables that have a large effect on
your DV & you can use large samples• Easiest way to increase power=increase
sample size

• Power Tables allow you to estimate the sample size needed to obtain a particular level of power based on the estimated “magnitude of effect” for the IV you are studying & the alpha level you are using.
• Ideally, you want a power value around .80
What does “power” really mean?Suppose:• You conclude your results are NOT significant
• SPSS tells you your power level is .30
• A study with this sample size, alpha =.05, & this effect size would detect an effect only 3 out of every 10 times the study was done
• 7 out of 10 times you would MISS seeing a real effect with this level of power

• I would be VERY cautious in claiming there was no effect of the IV in this case because my power was so low (.30) that the probability of my missing a real effect (Type II error) are very large

Three steps to a statistical decision
• “Assume” the null hypothesis
• Calculate the probability of results as or more extreme than those obtained under the null hypothesis
• Decide whether you are willing to accept this risk of error. Decide to reject or fail to reject (retain) the null hypothesis

Finale
Statistical Significance does not mean:a result is “practically” significant. (small
magnitude of effect)
a result is interpretable. (Threats to internal validity)

Statistical Significance does not mean:
• the null hypothesis is true or false. (It’s all a “gamble”, a game of chance)
• the result can be replicated. (Could still be result of Type I error)

Preview of next lectures
• The next several lectures will be about Analysis of Variance (ANOVA)
• Much of the information you will need to know for exam 2 is in your course packet on pages 75-76
• We will also cover several examples of what you need to know for exam 2. These examples are on pages 77-87.

Next Lecture
• Next lecture we will cover the two “one way” type ANOVAs: 1-way between subject and 1-way repeated measures.
• I will give you the formulas for these two models BUT you will only need to know the few very simple formulas on pages 75-76 of the CP for the exam so DO NOT PANIC! (But DO come to class)