steel door sound transmission tests
TRANSCRIPT

Steel Door Sound Transmission Tests
This package details the sound transmission tests we conducted on our 1.75" thick steel doors on Aug 8-9, 2012 at NWAA Labs in Elma, WA. We tested our 175C steel door with a 5"x29" slim view glass lite and another door with a 23"x65" full view glass lite.
On the 8th, the two doors were tested by NWAA and by JGL Acoustics. First, NWAA tested the slim view glass lite door and then JGL Acoustics tested the same door immediately afterwards using their own equipment. Then the same process was repeated for the full view glass lite door.
Here is what is in this package: Page
1. JGL Acoustics full detailed report. 3
2. NWAA Test NWTL120808-05 of slim view glass lite door on 8/8/2012 35 - as also tested by JGL Acoustics.
3. NWAA Test NWTL120808-07 of full view glass lite door on 8/8/2012 39 - as also tested by JGL Acoustics.
4. NWAA Test NWTL120809-02 of slim view glass lite door on 8/9/2012. * 43
5. NWAA Test NWTL120809-01 of full view glass lite door on 8/9/2012. * 47
6. NWAA Test NWTL110903-05 of our 175C steel door on 10/03/2011. 51
Please ask for any information you may want concerning these tests. Thank you, Randy Brown President Soundproof Windows, Inc.
* On the second day of testing we changed how we gasketed the test doors. We report these improved
results in our various brochures concerning the glass view lite doors. JGL Acoustics was not present for these new tests conducted on day two.
1 of 54

[ This page is left blank intentionally for 2 sided printing purposes]
2 of 54

Soundproof Windows, ASTM E90 Testing at NWAA Labs
August 13, 2012
Page 1 of 10
______________________________________________________________________________________
5266 NW Village Park Drive Phone: (425) 649-9344
Issaquah, WA 98027 FAX: (425) 649-0737
August 13, 2012
Soundproof Windows, Inc.
4673 Aircenter Circle
Reno, NV 89502
Attention: Randy Brown
Subject: ASTM E90 Testing at NWAA Labs
Ladies and Gentlemen:
This report summarizes my findings regarding the ASTM E90 sound testing services
provided by NWAA Labs, located at 90 Tower Blvd. in Elma, WA. As you are aware,
NWAA Labs operates a two-room measurements suite specifically designed to test sound
transmission loss of walls, windows, and doors in accordance with ASTM E90. JGL
Acoustics, Inc. has been retained by your firm to not only witness NWAA’s E90 sound
tests on two of your sound-rated door products, but also to independently test these same
two products in the NWAA lab using my own instrumentation and software. The
purpose of this review and independent acoustical testing is to verify that the
methodology and procedures used by NWAA labs and the test results obtained from their
ASTM E90 tests are reliable and accurate.
NWAA Facilities
The ASTM E90 suite at NWAA Labs consists of a 667 cubic meter all-concrete source
room connected to a 737 cubic meter receiving room via an 11.8 square meter test
opening. The entire receiving room is vibration isolated from the building structure with
4” thick Kinetics type KIP fiberglass isolation mounts. The receiving room floor is 6”
thick dense, reinforced concrete, and the receiving room walls consist of 2 layers of 5/8”
gypsum board and 2 layers of ½” thick cement board. The receiving room ceiling
consists of two layers of 1” thick gypsum core board suspended from the building
structure with Kinetics model ICC spring hangers. The wall separating the source room
from the receive room is 12” dense concrete (on the source room side) and 2 layers of
5/8” gypsum board and 2 layers of ½” thick cement board (on the receive room side) with
an air space of 16 inches between the concrete and gypsum board. There is no direct
connection between the source room and the receiving room.
The filler wall separating the source room and the receive room consists of 8” thick solid
concrete blocks (stacked tightly together without any grout or sealant between the blocks)
3 of 54

Soundproof Windows, ASTM E90 Testing at NWAA Labs
August 13, 2012
Page 2 of 10
______________________________________________________________________________________
5266 NW Village Park Drive Phone: (425) 649-9344
Issaquah, WA 98027 FAX: (425) 649-0737
on the source room side and 3 layers of 5/8” thick gypsum board screwed to 2x4 wood
framing on the receive room side. The entire cavity between the concrete blocks and
gypsum board was filled with fiberglass batt insulation. The gypsum board joints were
sealed with metal tape and acoustic caulk on all layers, and the gap at the perimeter of the
filler wall on both sides was sealed with acoustic caulk and putty.
NWAA Instrumentation
Both the source room and receiving room are equipped with six ¼” diameter condenser
microphones. The receiving room microphones are suspended from the ceiling, and the
source room microphones are mounted on floor stands. Each microphone has a specific
location that is fixed for all measurements. The cables from all microphones are fed back
to the control room which is located about 20 feet from the receiving room and about 100
feet from the source room. The data acquisition system is a custom modified preamp and
A/D converter used with the software package EASERA, and the data analysis software
was custom developed by AFMG, Berlin, Germany.
The source room contains 24 loudspeakers distributed throughout the upper 25% of the
source room. There are 8 high frequency drivers, 12 mid-high drivers, 8 mid-low drivers,
and 2 self-powered, full-range boxes. These speakers are fed by a digital signal processor
containing a 4-way crossover feeding 15,000 watts of amplifier power. The large number
of loudspeakers is required to achieve high enough source room levels to enable the
measurement of high TL products. The receiving room contains two dodecahedron
loudspeakers and a large subwoofer for generating broadband noise for reverberation
decays. Sound pressure level measurements are taken simultaneously in the source and
receive room using a total of 12 fixed microphones. The total duration of these
measurements is 20 seconds. A total of 20 individual decays are measured at each
microphone in the receiving room, and the computed average sound absorption is
therefore based on a net total of 120 (6 x 20 = 120) decays.
JGL Acoustics Instrumentation
All acoustic measurements conducted by me on this project were taken with a hand-held
Bruel & Kjaer model 2270 using the Bruel & Kjaer Building Acoustics Software Package
(BZ-7228). I used the NWAA source room loudspeakers to generate broad band pink
noise for the noise reduction portion of the tests, because my loudspeaker did not have
sufficient power to generate the required source room sound pressure levels. I used my
QSC model K12 powered loudspeaker (controlled by the Bruel & Kjaer 2270) in the
receive room to generate interrupted broad band noise for reverberation decay
measurements in the receiving room. Space average sound pressure level measurements
4 of 54

Soundproof Windows, ASTM E90 Testing at NWAA Labs
August 13, 2012
Page 3 of 10
______________________________________________________________________________________
5266 NW Village Park Drive Phone: (425) 649-9344
Issaquah, WA 98027 FAX: (425) 649-0737
in both the source and receiving rooms were taken over a 60 second time period with the
microphone moving slowly throughout each room. A total of 8 fixed source/receiver
location combinations were used to measure the average decay rate in the receiving room.
Four separate decays were time-averaged prior to analysis at each source/receiver
location for a grand total of 32 decays for each test. It should be noted that during all of
my measurements there were only two items in the receive room that were not in the
receive room during the NWAA measurements: 1) my body, and 2) my loudspeaker and
sound level meter.
Description of the Test Specimen
The two test specimens evaluated in this study were hollow metal insulated steel doors
with vision lites. Each door leaf measured 37” wide by 83.75” high by 1-3/4” thick. The
outside dimensions of the door frame were 43.25” wide by 87” high by 5.25” deep. The
first door tested had a 5” wide by 29” high vision lite centered vertically at eye height,
and the second door tested had a 23” wide by 65” high vision lite centered in the door.
Photos of both doors are presented in Appendix C. Both doors had three cam-lift hinges
and were tested in the same grout-filled hollow metal frame. The door frame weighed
108 pounds (after grout fill) and the door panel for the first test weighed 297 pounds, and
the door panel for the second test weighed 316 pounds. The net surface weight of the two
door panels was 13.8 and 14.7 pounds per square foot, respectively. The design of the
internal components of both doors is identical, but proprietary. The only difference
between the two doors is the size of the glazing element. The overall thickness of the
glazing element of both doors is 2.5 inches. Note that the glazing element protrudes
outward 3/8” from the basic door panel thickness on both sides of the door. The doors
and frame were fitted with peel and stick rubber fin gaskets that were applied by the
manufacturer immediately before the sound test. The seals were applied to both the door
frame as well as all four of the door edges.
Acoustic Measurements
Prior to conducting sound transmission loss tests of the two acoustic doors, the filler wall
was tested to determine its sound transmission loss. The filler wall measurements were
conducted on July 18, 2012. The frequency range of the measurements was from 50 Hz
to 10,000 Hz in one-third octave bands. The results showed the STC rating of the filler
wall to be 71. The raw data and calculated TL and STC values are shown in Appendix A
for the NWAA Lab tests. The raw data and calculated TL and STC values are shown in
Appendix B for my test of the filler wall.
5 of 54

Soundproof Windows, ASTM E90 Testing at NWAA Labs
August 13, 2012
Page 4 of 10
______________________________________________________________________________________
5266 NW Village Park Drive Phone: (425) 649-9344
Issaquah, WA 98027 FAX: (425) 649-0737
Also prior to conducting the sound transmission loss tests, the door frame was installed
into the filler wall. This work was performed on August 7, 2012 by Soundproof
Windows staff working with NWAA staff. I was not present to observe this work. The
door frame was installed flush with the source room wall, and the space between the
receive room side of the filler wall and the door frame was filled with 3 layers of 5/8”
gypsum board to match the construction of the filler wall on the receive side. The
distance from the door panel to the face of the receive room was 27.75 inches.
The test results are presented in tabular form in Appendix A and Appendix B. Appendix
A contains the raw data and calculated results from NWAA, and Appendix B contains the
raw data and calculated results from JGL Acoustics, Inc. Figures 1 and 2 present the
measured transmission loss values in each frequency band for the two doors that were
tested. The curves marked by solid black squares represent JGL Acoustics, Inc. data, and
the curves marked by open blue squares represent NWAA data. As you can see, the
calculated STC ratings are identical for both tests, although the individual TL values in
the one-third octave bands vary slightly at some frequency bands.
Summary
This review and analysis presents convincing evidence that the raw data and test results
obtained by NWAA Labs are accurate and in conformance with ASTM Standards. The
ultimate flanking limits of the lab have yet to be determined, but it is clear that doors,
windows and walls with STC ratings as high as 60 can be accurately measured using the
existing filler wall. Other higher performing filler walls will have to be constructed in
order to determine the ultimate flanking limits of this facility. It is also important to note
the low background sound levels, particularly at low frequencies where the background
noise level at 50 Hz is typically less than 25 dB. The lab also exhibits low TL confidence
limits at low frequencies. For example, at 50 Hz and 63 Hz, the 95% confidence limit is
typically significantly less than the maximum allowable confidence limit specified in
ASTM E90-09 for 80 Hz.
If you have any questions regarding these test results, do
not hesitate to give me a call.
Very truly yours,
JGL Acoustics, Inc,
Jerry G. Lilly, P.E., President, FASA
Member INCE, ASTM, NCAC
6 of 54

Soundproof Windows, ASTM E90 Testing at NWAA Labs
August 13, 2012
Page 5 of 10
______________________________________________________________________________________
5266 NW Village Park Drive Phone: (425) 649-9344
Issaquah, WA 98027 FAX: (425) 649-0737
0
10
20
30
40
50
60
70
80
50 80 125
200
315
500
800
1250
2000
3150
5000
8000
So
un
d T
ran
sm
iss
ion
Lo
ss
(d
B)
One-Third Octave Band Center Frequency (Hz)
Soundproof WindowsFigure 1. Door #1 Transmission Loss
(with 5" by 29" vision lite)
JGL Measured TL STC-53 Contour NWAA Measured TL
7 of 54

Soundproof Windows, ASTM E90 Testing at NWAA Labs
August 13, 2012
Page 6 of 10
______________________________________________________________________________________
5266 NW Village Park Drive Phone: (425) 649-9344
Issaquah, WA 98027 FAX: (425) 649-0737
0
10
20
30
40
50
60
70
80
50 80 125
200
315
500
800
1250
2000
3150
5000
8000
So
un
d T
ran
sm
iss
ion
Lo
ss
(d
B)
One-Third Octave Band Center Frequency (Hz)
Soundproof WindowsFigure 2. Door #2 Transmission Loss
(with 23" by 65" vision lite)
JGL Measured TL STC-46 Contour NWAA Measured TL
8 of 54

Soundproof Windows, ASTM E90 Testing at NWAA Labs
August 13, 2012
Page 7 of 10
______________________________________________________________________________________
5266 NW Village Park Drive Phone: (425) 649-9344
Issaquah, WA 98027 FAX: (425) 649-0737
20
30
40
50
60
70
80
90
100
110
120
50 80 125
200
315
500
800
1250
2000
3150
5000
8000
So
un
d P
res
su
re L
eve
l (d
B r
ef.
20
mP
a)
One-Third Octave Band Center Frequency (Hz)
Soundproof WindowsFigure 3. Space Average Sound Pressure Levels
(Door #1 with 5" by 29" vision lite)
JGL Source Room Lp JGL Receive Room LpNWAA Source Room Lp NWAA Receive Room Lp
9 of 54
Soundproof Windows, ASTM E90 Testing at NWAA Labs
August 13, 2012
Page 8 of 10
______________________________________________________________________________________
5266 NW Village Park Drive Phone: (425) 649-9344
Issaquah, WA 98027 FAX: (425) 649-0737
0
100
200
300
400
500
600
700
800
900
1000
50 80 125
200
315
500
800
1250
2000
3150
5000
8000
Re
ce
ive
Ro
om
Ab
so
rpti
on
(S
ab
ins
)
One-Third Octave Band Center Frequency (Hz)
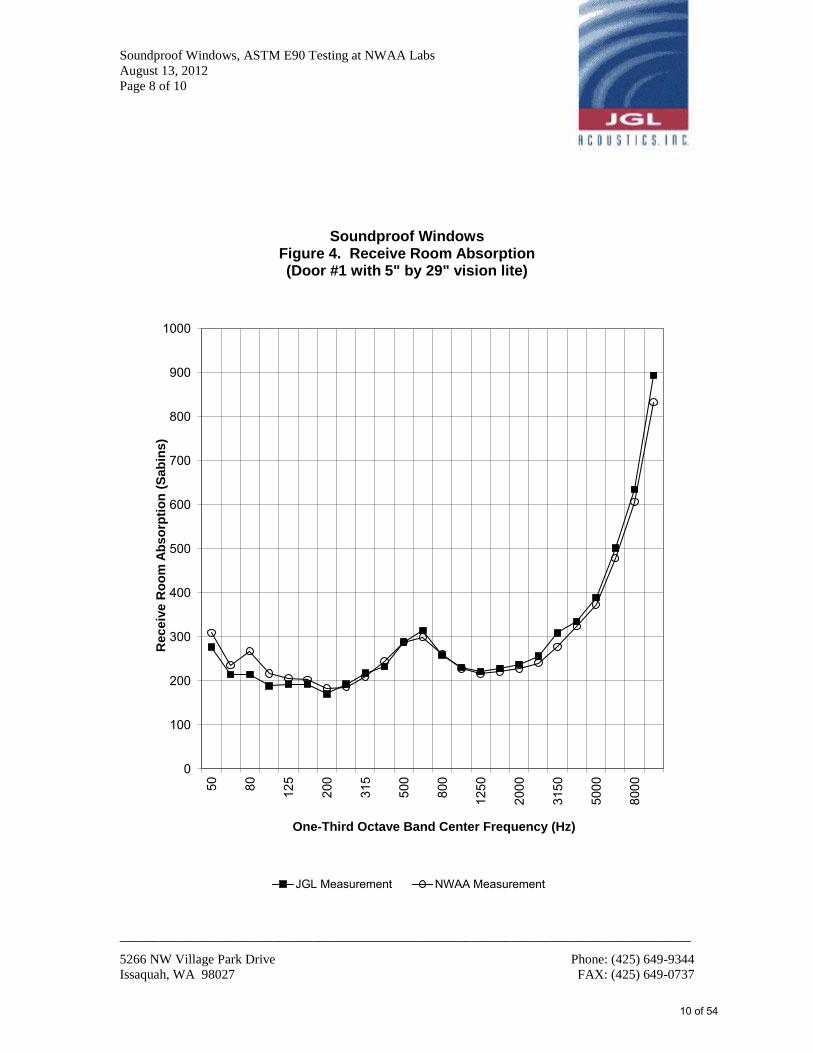
Soundproof WindowsFigure 4. Receive Room Absorption(Door #1 with 5" by 29" vision lite)
JGL Measurement NWAA Measurement
10 of 54

Soundproof Windows, ASTM E90 Testing at NWAA Labs
August 13, 2012
Page 9 of 10
______________________________________________________________________________________
5266 NW Village Park Drive Phone: (425) 649-9344
Issaquah, WA 98027 FAX: (425) 649-0737
20
30
40
50
60
70
80
90
100
110
120
50 80 125
200
315
500
800
1250
2000
3150
5000
8000
So
un
d P
res
su
re L
eve
l (d
B r
ef.
20
mP
a)
One-Third Octave Band Center Frequency (Hz)
Soundproof WindowsFigure 5. Space Average Sound Pressure Levels
(Door #2 with 23" by 65" vision lite)
JGL Source Room Lp JGL Receive Room LpNWAA Source Room Lp NWAA Receive Room Lp
11 of 54

Soundproof Windows, ASTM E90 Testing at NWAA Labs
August 13, 2012
Page 10 of 10
______________________________________________________________________________________
5266 NW Village Park Drive Phone: (425) 649-9344
Issaquah, WA 98027 FAX: (425) 649-0737
0
100
200
300
400
500
600
700
800
900
1000
50 80 125
200
315
500
800
1250
2000
3150
5000
8000
Re
ce
ive
Ro
om
Ab
so
rpti
on
(S
ab
ins
)
One-Third Octave Band Center Frequency (Hz)
Soundproof WindowsFigure 6. Receive Room Absorption(Door #2 with 23" by 65" vision lite)
JGL Measurement NWAA Measurement
12 of 54

Soundproof Windows, ASTM E90 Testing at NWAA Labs
Appendix A: NWAA Raw Data and Analysis
August 13, 2012
Page A-1
Appendix A
NWAA Raw Data and Analysis
This appendix presents detailed raw data and test results of the airborne sound
transmission tests conducted by NWAA Labs on two acoustic doors (with vision lites)
manufactured for Soundproof Windows. The tests were conducted on August 8, 2012.
This table presents the raw data and analysis for the filler wall test that was conducted
approximately 3 weeks prior to the acoustic door tests.
Filler Wall Test
Hz 50 63 80 100 125 160 200 250 315 400 500 630 800 1.0k 1.25k 1.6k 2.0k 2.5k 3.15k 4.0k 5.0k 6.3k 8.0k 10k
Ls 104 107 108 106 105 104 109 108 106 107 108 109 109 105 104 107 107 105 106 109 110 111 107 102
StdDev 2.8 1.8 1 0.9 2.3 1 0.5 0.8 0.9 0.8 0.3 0.5 0.4 0.5 0.3 0.4 0.5 0.5 0.6 0.5 0.4 0.4 0.2 0.3
Lr 63 59 59 55 55 49 47 48 43 36 38 38 32 29 24 25 24 23 25 26 23 24 25 25
StdDev 1.2 1.2 1.6 0.4 0.8 0.6 0.5 0.5 0.3 0.4 0.4 0.4 0.3 0.5 0.3 0.3 0.2 0.4 0.3 0.3 0.6 0.6 0.6 0.7
Lab 63 59 59 55 55 49 47 48 43 36 38 38 32 29 25 26 26 25 27 28 25 26 27 27
StdDev 1.2 1.2 1.6 0.4 0.8 0.6 0.5 0.5 0.3 0.4 0.4 0.4 0.3 0.3 0.2 0.2 0.1 0.4 0.3 0.3 0.6 0.6 0.6 0.7
Ln 21 20 19 21 29 18 18 19 17 17 17 17 17 18 19 19 21 21 22 23 24 25 26 27
StdDev 1.1 1.1 0.9 1.9 5.2 1.1 1 1.9 0.9 0.9 0.8 0.8 0.7 0.7 0.8 0.8 0.6 0.8 0.8 0.6 0.8 0.8 0.6 0.9
SNR 42 39 39 34 26 31 29 29 27 20 22 21 14 11 6.7 6.7 5 3.4 4.6 4.7 1.4 0.7 0.5 0.5
Sabins 284 260 252 207 194 188 175 187 207 242 286 289 252 221 209 216 221 233 271 321 370 485 618 861
Abs (m2) 26 24 23 19 18 17 16 17 19 22 27 27 23 21 19 20 21 22 25 30 34 45 57 80
StdDev 3.1 1.2 1.6 1.6 1.1 1.2 1.2 0.7 0.4 0.4 0.5 0.5 0.4 0.2 0.3 0.2 0.2 0.1 0.2 0.2 0.1 0.5 0.5 0.8
TL[dB] 37 45 46 49 48 54 61 59 60 67 66 68 75 74 77 79 81 80 78 79 82 81 75 69
StdDev 3 2.2 1.9 1.1 2.4 1.2 0.8 1 0.9 0.9 0.5 0.6 0.5 0.7 0.4 0.5 0.5 0.7 0.7 0.5 0.7 0.8 0.7 0.8[%] 8.2 4.8 4.1 2.2 5 2.3 1.3 1.6 1.6 1.3 0.8 0.9 0.7 1 0.6 0.6 0.7 0.8 0.9 0.7 0.9 0.9 0.9 1.2
95% Confidence interval (CI)
CI 3.2 2.3 2 1.1 2.5 1.3 0.8 1 1 0.9 0.5 0.7 0.5 0.8 0.5 0.5 0.6 0.7 0.7 0.5 0.7 0.8 0.7 0.8CI(max) 6 4 3 3 2 2 1 1 1 1 1 1 1 1 1 1 1 1
13 of 54

Soundproof Windows, ASTM E90 Testing at NWAA Labs
Appendix A: NWAA Raw Data and Analysis
August 13, 2012
Page A-2
This table provides raw data and test results for the composite test of the first door
mounted in the filler wall.
Composite Test (test speciment in filler wall)
Hz 50 63 80 100 125 160 200 250 315 400 500 630 800 1.0k 1.25k 1.6k 2.0k 2.5k 3.15k 4.0k 5.0k 6.3k 8.0k 10k
Ls 105 108 109 106 104 105 109 109 106 107 108 109 109 104 104 107 107 105 106 109 110 111 107 103
StdDev 4.2 2.4 0.7 1.6 1.2 1 1.3 0.9 0.7 0.7 0.5 0.2 0.5 0.6 0.3 0.7 0.4 0.4 0.4 0.2 0.3 0.3 0.2 0.5
Lr 70 74 76 73 61 55 59 57 51 49 48 47 46 42 40 41 41 39 39 42 45 46 39 31
StdDev 2.4 2 3.3 3.5 0.9 1.2 0.5 0.5 0.5 0.5 0.4 0.5 0.5 0.4 0.3 0.4 0.3 0.2 0.3 0.2 0.2 0.3 0.4 0.5
Lab 70 74 76 73 61 55 59 57 51 49 48 47 46 42 40 41 41 39 39 42 45 46 39 33
StdDev 2.4 2 3.3 3.5 0.9 1.2 0.5 0.5 0.5 0.5 0.4 0.5 0.5 0.4 0.3 0.4 0.3 0.2 0.3 0.2 0.2 0.3 0.4 0.5
Ln 22 21 21 21 29 18 18 19 17 17 17 17 17 18 19 20 21 21 22 23 24 25 26 27
StdDev 1.2 1 0.9 1.7 4.8 1 1 1.7 1 0.9 0.9 0.9 0.8 0.7 0.7 0.8 0.6 0.8 0.8 0.7 0.8 0.8 0.6 0.9
SNR 48 53 55 51 32 37 42 37 34 33 31 30 29 24 21 22 20 18 16 19 21 20 13 5.8
Sabins 309 236 268 217 206 202 183 186 210 243 288 299 261 228 216 221 228 240 277 325 374 479 606 833
Abs (m2) 29 22 25 20 19 19 17 17 19 23 27 28 24 21 20 21 21 22 26 30 35 44 56 77
StdDev 0.6 2.6 1.8 1.5 0.7 1.3 0.5 0.7 0.6 0.4 0.1 0.3 0.4 0.3 0.2 0.3 0.2 0.1 0.1 0.2 0.2 0.3 0.5 0.7
TL[dB] 31 32 29 32 41 48 48 51 53 54 56 58 60 60 62 63 63 63 64 63 61 60 61 63
StdDev 4.9 3.1 3.4 3.9 1.5 1.6 1.4 1.1 0.9 0.8 0.6 0.5 0.7 0.7 0.4 0.8 0.5 0.4 0.5 0.3 0.4 0.4 0.5 0.7[%] 16 9.9 12 12 3.8 3.4 3 2.2 1.7 1.5 1.1 0.9 1.1 1.2 0.7 1.2 0.8 0.7 0.7 0.5 0.6 0.7 0.7 1.1
95% Confidence interval (CI)
CI 5.1 3.3 3.6 4.1 1.6 1.7 1.5 1.1 0.9 0.9 0.7 0.6 0.7 0.7 0.4 0.8 0.5 0.5 0.5 0.4 0.4 0.5 0.5 0.8CI(max) 6 4 3 3 2 2 1 1 1 1 1 1 1 1 1 1 1 1
14 of 54

Soundproof Windows, ASTM E90 Testing at NWAA Labs
Appendix A: NWAA Raw Data and Analysis
August 13, 2012
Page A-3
This table shows the calculation of the test specimen transmission loss, STC, and OITC
ratings for the first door test.
Filler Wall Area 101.3 sq.ft. TRUETest Specimen Area 26.13 sq.ft. FALSETotal Test Opening 127.4 sq.ft. Max. Def.
Test Rounded 4Filler CompositeSpecimen Specimen STC Total Def. OITC
Frequency Wall TL Wall TL TL TL 53 29 38
50 37.35 31.2 25.3 25 7.163 45.1 31.8 25.1 25 14.380 46.3 29.2 22.3 22 18.1
100 49.1 31.5 24.6 25 18.5125 48.3 40.7 34.5 34 37 3 8.6160 53.7 48.3 42.6 43 40 0 6.4200 60.7 48.1 41.4 41 43 2 13.6250 58.9 50.5 44.2 44 46 2 9.3315 60.5 53.1 46.9 47 49 2 8.4400 67.4 54.3 47.6 48 52 4 14.1500 66.5 56.1 49.6 50 53 3 11.4630 67.5 58.2 51.7 52 54 2 10.3800 74.6 59.7 52.8 53 55 2 15.91K 73.6 59.7 52.9 53 56 3 14.9
1.2K 77.2 61.7 54.8 55 57 2 16.51.6K 79.4 63.0 56.1 56 57 1 17.42K 80.6 63.1 56.2 56 57 1 18.5
2.5K 80.1 63.3 56.4 56 57 1 17.83.15K 77.7 63.6 56.7 57 57 0 15.0
4K 79.1 63.2 56.3 56 57 1 16.95K 81.7 60.8 54.0 54 21.9
6.3K 81.1 59.7 52.8 53 22.48K 75.3 61.5 54.7 55 14.9
10K 68.5 63.1 57.4 57 6.4
15 of 54

Soundproof Windows, ASTM E90 Testing at NWAA Labs
Appendix A: NWAA Raw Data and Analysis
August 13, 2012
Page A-4
NWTL120808-05
8-Aug-12 STC 53
OITC 38
0.00 DEF 29
23
Barometer: pa 101800
71
Frequency
(Hz)
Transmission
Loss
Shifted
ContourDeficiencies
50Hz 25 2
63Hz 25 2
80Hz 22
100Hz 25
125Hz 34 37 3 2
160Hz 43 40 0 2
200Hz 41 43 2 2
250Hz 44 46 2 2
315Hz 47 49 2 2
400Hz 48 52 4 2
500Hz 50 53 3 2
630Hz 52 54 2 2 .
800Hz 53 55 2
1000Hz 53 56 3 2
1250Hz 55 57 2
1600Hz 56 57 1
2000Hz 56 57 1
2500Hz 56 57 1
3150Hz 57 57 0
4000Hz 56 57 1
5000Hz 54
6300Hz 53
8000Hz 55 2
10000Hz 57 2
Note 2: Flanking noise correction applied.
Note 1: Flanking noise limited. True value of Transmission Loss is greater than shown.
Soundproof Windows 175CG-view seal operable
S/N Ratio
0.0
0.0
0.0
0.0
0.0
NWAA Labs, Inc.90 Tower Blvd,
Elma, WA 98541(253)-973-1018
Test Date:
Humidity: %
Test #
Area Tested: M²
Temperature: ºC
0.0
0.0
0.0
0.0
0.0
0.0
0.0
0.0
0.0
0.0
0.0
0.0
0.0
Notes
0.0
0.0
0.0
0.0
0.0
0.0
16 of 54

Soundproof Windows, ASTM E90 Testing at NWAA Labs Appendix A: NWAA Raw Data and Analysis August 13, 2012 Page A-5
Soundproof Windows 175CG-view seal operable
0
5
10
15
20
25
30
35
40
45
50
55
60
65
50 63 80 100
125
160
200
250
315
400
500
630
800 1K
1.2K
1.6K 2K
2.5K
3.15
K 4K 5K
6.3K 8K 10
K
Tran
smis
sion
Los
s
One-Third Octave Center Frequency (Hz)
Transmission Loss Shifted Contour De�ciencies
17 of 5417 of 54

Soundproof Windows, ASTM E90 Testing at NWAA Labs
Appendix A: NWAA Raw Data and Analysis
August 13, 2012
Page A-6
This table provides raw data and test results for the composite test of the second door
mounted in the filler wall.
Composite Test (test specimen in filler wall)
Hz 50 63 80 100 125 160 200 250 315 400 500 630 800 1.0k 1.25k 1.6k 2.0k 2.5k 3.15k 4.0k 5.0k 6.3k 8.0k 10k
Ls 105 108 109 106 104 105 109 109 106 106 108 109 109 104 104 107 107 105 106 109 110 111 107 103
StdDev 4.2 2.3 0.7 1.6 1.3 1.1 1.4 0.9 0.7 0.8 0.5 0.3 0.4 0.7 0.3 0.5 0.3 0.5 0.4 0.4 0.2 0.4 0.2 0.4
Lr 67 70 69 74 68 61 64 59 55 55 52 53 55 51 50 50 47 43 41 43 43 42 35 29
StdDev 2.1 2.1 2.6 3.3 1.9 1.2 0.7 0.5 1 0.9 0.7 0.4 0.4 0.2 0.1 0.2 0.2 0.1 0.2 0.2 0.2 0.3 0.3 0.5
Lab 67 70 69 74 68 61 64 59 55 55 52 53 55 51 50 50 47 43 41 43 43 42 36 31
StdDev 2.1 2.1 2.6 3.3 1.9 1.2 0.7 0.5 1 0.9 0.7 0.4 0.4 0.2 0.1 0.2 0.2 0.1 0.2 0.2 0.2 0.3 0.4 0.5
Ln 21 20 20 21 29 18 18 19 17 17 17 17 17 18 19 20 21 21 22 23 24 25 26 27
StdDev 1 1 1 1.8 5.2 1.1 1 1.8 0.8 0.8 0.8 0.8 0.8 0.7 0.8 0.8 0.6 0.8 0.8 0.7 0.8 0.8 0.6 0.9
SNR 46 50 49 53 40 43 46 40 38 38 35 36 37 33 31 31 27 22 19 19 18 17 9.6 4
Sabins 305 241 255 214 209 205 186 184 208 246 288 300 262 227 216 222 228 242 280 329 380 488 618 857
Abs (m2) 28 22 24 20 19 19 17 17 19 23 27 28 24 21 20 21 21 22 26 31 35 45 57 80
StdDev 0.5 2 2.2 1.6 0.9 1.5 0.5 0.5 0.7 0.5 0.4 0.3 0.2 0.3 0.2 0.2 0.3 0.1 0.2 0.1 0.1 0.4 0.6 0.8
TL[dB] 34 36 36 30 33 43 43 48 49 49 53 52 51 51 51 54 57 59 61 63 63 63 65 66
StdDev 4.7 3.1 2.8 3.7 2.3 1.6 1.6 1 1.2 1.2 0.8 0.5 0.6 0.7 0.3 0.5 0.4 0.5 0.5 0.5 0.3 0.5 0.4 0.7[%] 14 8.7 7.6 12 7 3.8 3.6 2.2 2.5 2.5 1.6 0.9 1.1 1.4 0.6 1 0.6 0.9 0.7 0.7 0.5 0.7 0.6 1
95% Confidence interval (CI)
CI 4.9 3.3 2.9 3.9 2.5 1.7 1.6 1.1 1.3 1.3 0.9 0.5 0.6 0.7 0.3 0.6 0.4 0.5 0.5 0.5 0.3 0.5 0.4 0.7CI(max) 6 4 3 3 2 2 1 1 1 1 1 1 1 1 1 1 1 1
18 of 54

Soundproof Windows, ASTM E90 Testing at NWAA Labs
Appendix A: NWAA Raw Data and Analysis
August 13, 2012
Page A-7
This table shows the calculation of the test specimen transmission loss, STC, and OITC
ratings for the second door test.
Filler Wall Area 101.3 sq.ft. TRUETest Specimen Area 26.13 sq.ft. FALSETotal Test Opening 127.4 sq.ft. Max. Def.
Test Rounded 6Filler Composite Specimen Specimen STC OITC
Frequency Wall TL Wall TL TL TL 46 27 36
Total Def.50 37.35 34.1 28.5 29 4.263 45.1 36.0 29.5 30 10.180 46.3 36.4 29.9 30 10.8
100 49.1 30.2 23.3 23 19.8125 48.3 33.4 26.5 26 30 4 15.9160 53.7 42.6 36.0 36 33 0 12.1200 60.7 43.1 36.2 36 36 0 18.6250 58.9 47.7 41.1 41 39 0 12.1315 60.5 49.3 42.6 43 42 0 12.2400 67.4 49.0 42.1 42 45 3 19.4500 66.5 52.7 46.0 46 46 0 14.8630 67.5 52.0 45.1 45 47 2 16.5800 74.6 51.2 44.4 44 48 4 24.31K 73.6 50.7 43.8 44 49 5 23.9
1.2K 77.2 51.1 44.2 44 50 6 27.11.6K 79.4 54.2 47.3 47 50 3 26.22K 80.6 56.8 49.9 50 50 0 24.7
2.5K 80.1 59.2 52.3 52 50 0 21.93.15K 77.7 61.4 54.5 54 50 0 17.3
4K 79.1 62.6 55.7 56 50 0 17.55K 81.7 62.7 55.8 56 20.1
6.3K 81.1 62.8 55.9 56 19.48K 75.3 65.0 58.4 58 11.3
10K 68.5 65.6 59.9 60 3.9
19 of 54

Soundproof Windows, ASTM E90 Testing at NWAA Labs
Appendix A: NWAA Raw Data and Analysis
August 13, 2012
Page A-8
NWTL120808-07
8-Aug-12 STC 46
OITC 36
0.00 DEF 27
23
Barometer: pa 101800
69
Frequency
(Hz)
Transmission
Loss
Shifted
ContourDeficiencies
50Hz 29 1
63Hz 30 2
80Hz 30 2
100Hz 23
125Hz 26 30 4
160Hz 36 33 0 2
200Hz 36 36 0
250Hz 41 39 0 2
315Hz 43 42 0 2
400Hz 42 45 3
500Hz 46 46 0 2
630Hz 45 47 2 .
800Hz 44 48 4
1000Hz 44 49 5
1250Hz 44 50 6
1600Hz 47 50 3
2000Hz 50 50 0
2500Hz 52 50 0
3150Hz 54 50 0
4000Hz 56 50 0
5000Hz 56
6300Hz 56
8000Hz 58 2
10000Hz 60 1
Note 2: Flanking noise correction applied.
Note 1: Flanking noise limited. True value of Transmission Loss is greater than shown.
Soundproof Windows 175CG-10 operable
S/N Ratio
0.0
0.0
0.0
0.0
0.0
NWAA Labs, Inc.90 Tower Blvd,
Elma, WA 98541(253)-973-1018
Test Date:
Humidity: %
Test #
Area Tested: M²
Temperature: ºC
0.0
0.0
0.0
0.0
0.0
0.0
0.0
0.0
0.0
0.0
0.0
0.0
0.0
Notes
0.0
0.0
0.0
0.0
0.0
0.0
20 of 54

Soundproof Windows, ASTM E90 Testing at NWAA Labs
Appendix A: NWAA Raw Data and Analysis
August 13, 2012
Page A-9
End of Appendix A
Soundproof Windows 175CG-10 operable
0
5
10
15
20
25
30
35
40
45
50
55
60
65
50 63 80 100
125
160
200
250
315
400
500
630
800
1K
1.2K
1.6K 2K
2.5K
3.15
K 4K 5K
6.3K 8K 10
K
Tra
ns
mis
sio
n L
os
s
One-Third Octave Center Frequency (Hz)
Transmission Loss Shifted Contour Deficiencies
21 of 54

[ This page is left blank intentionally for 2 sided printing purposes]
22 of 54

Soundproof Windows, ASTM E90 Testing at NWAA Labs
Appendix B: JGL Acoustics, Inc. Raw Data and Analysis
August 13, 2012
Page B-1
Appendix B
JGL Acoustics, Inc. Raw Data and Analysis
This appendix presents detailed raw data and test results of the airborne sound
transmission tests conducted by JGL Acoustics, Inc. at NWAA Labs on two acoustic
doors (with vision lites) manufactured for Soundproof Windows. The tests were
conducted on August 8, 2012.
This table presents the raw data and analysis for the filler wall test that was conducted on
July 18, 2012, approximately 3 weeks prior to the acoustic door tests.
NWAA Labs Filler Wall TL Test: Concrete Blocks on Source Side, 3 layers 5/8" GWB on receive side
Air Temperature 74 deg. FSpeed of Sound 1132.7 ft/sec
Source Room 22,937 cu. ft. 650.0 m3Receive Room 26,021 cu. ft. 737.4 m3Partition Area 126.9 sq. ft. 11.8 m2
AmbientAdjusted NIC Def. Decay STC
Frequency L1 L2 B2 T2 L2 NR 73 28 Rate Receive TL 71 29 S/NContour (dB/s) Sabins Contour Def. Ratio
50 105.2 63.1 21.9 3.87 63.1 42 15.5 328 38 41.263 107.8 58.7 19.6 5.04 58.7 49 11.9 252 46 39.180 107.5 58.2 17.8 5.75 58.2 49 10.4 221 47 40.4
100 106.7 55.3 16.8 6.35 55.3 51 9.4 200 49 38.6125 104.9 53.3 17.1 6.65 53.3 52 57 5 9.0 191 50 55 5 36.2160 104.1 48.3 8.7 7.34 48.3 56 60 4 8.2 173 55 58 3 39.6200 108.5 45.7 7.8 7.57 45.7 63 63 0 7.9 168 62 61 0 38.0250 108.0 47.5 7.1 6.58 47.5 61 66 5 9.1 193 59 64 5 40.4315 106.2 42.8 5.9 6.58 42.8 63 69 6 9.1 193 62 67 5 36.9400 106.2 35.8 5.9 4.71 35.8 70 72 2 12.7 270 67 70 3 30.0500 107.8 37.3 6.4 4.31 37.3 70 73 3 13.9 295 67 71 4 31.0630 108.6 37.3 5.9 4.29 37.3 71 74 3 14.0 296 68 72 4 31.4800 109.0 30.8 6.0 4.87 30.8 78 75 0 12.3 261 75 73 0 24.81000 104.1 27.0 5.7 5.52 27.0 77 76 0 10.9 230 75 74 0 21.31250 103.2 22.3 6.1 5.76 22.3 81 77 0 10.4 220 79 75 0 16.21600 106.4 22.9 6.2 5.50 22.9 84 77 0 10.9 231 81 75 0 16.72000 106.5 23.2 6.6 5.46 23.2 83 77 0 11.0 233 81 75 0 16.62500 105.1 21.2 7.0 5.08 21.2 84 77 0 11.8 250 81 75 0 14.23150 105.4 24.2 7.3 4.45 24.2 81 77 0 13.5 285 78 75 0 16.94000 109.4 25.3 7.9 3.87 25.3 84 77 0 15.5 328 80 75 0 17.45000 110.2 18.8 8.7 3.16 18.8 91 19.0 402 86 10.16300 111.3 15.8 9.6 2.56 14.6 97 23.4 496 91 5.08000 107.5 13.0 10.5 1.94 11.0 97 30.9 654 89 0.4
10000 102.8 12.8 11.5 1.41 10.8 92 42.6 900 83 -0.7
23 of 54

Soundproof Windows, ASTM E90 Testing at NWAA Labs
Appendix B: JGL Acoustics, Inc. Raw Data and Analysis
August 13, 2012
Page B-2
This table provides raw data and test results for the composite test of the first door
mounted in the filler wall.
Soundproof Windows Test 1 with small vision lite (composite wall test with door in filler wall)
Air Temperature 74 deg. FSpeed of Sound 1132.7 ft/sec
Source Room 4,360 cu. ft. 650.0 m3Receive Room 26,021 cu. ft. 737.4 m3Partition Area 127.3 sq. ft. 11.8 m2
AmbientAdjusted NIC Def. Decay STC
Frequency L1 L2 B2 T2 L2 NR 46 0 Rate Receive TL 60 32 S/NContour (dB/s) Sabins Contour Def. Ratio
50 105.1 67.7 22.6 4.59 67.7 37 13 277 34 45.163 108.7 75.7 18.5 5.93 75.7 33 10 214 31 57.380 108.1 76.1 17.4 5.91 76.1 32 10 215 30 58.7
100 106.3 72.1 14.8 6.73 72.1 34 9 189 32 57.3125 103.9 60.9 12.9 6.60 60.9 43 30 0 9 192 41 44 3 48.1160 104.0 54.3 8.2 6.58 54.3 50 33 0 9 193 48 47 0 46.1200 107.9 58.6 5.7 7.46 58.6 49 36 0 8 170 48 50 2 52.9250 107.9 55.7 6.3 6.59 55.7 52 39 0 9 193 50 53 3 49.4315 105.9 49.7 4.2 5.84 49.7 56 42 0 10 217 54 56 2 45.6400 105.5 48.6 2.5 5.45 48.6 57 45 0 11 233 54 59 5 46.0500 107.5 47.3 3.3 4.41 47.3 60 46 0 14 288 57 60 3 44.1630 108.3 46.3 4.2 4.04 46.3 62 47 0 15 314 58 61 3 42.1800 108.4 45.8 4.9 4.91 45.8 63 48 0 12 259 60 62 2 40.91000 103.6 41.4 3.8 5.50 41.4 62 49 0 11 231 60 63 3 37.61250 102.7 39.0 4.5 5.75 39.0 64 50 0 10 221 61 64 3 34.51600 106.0 40.8 5.0 5.55 40.8 65 50 0 11 229 63 64 1 35.82000 106.1 40.3 5.2 5.34 40.3 66 50 0 11 238 63 64 1 35.12500 104.8 38.1 5.7 4.95 38.1 67 50 0 12 256 64 64 0 32.43150 105.2 37.6 6.6 4.11 37.6 68 50 0 15 309 64 64 0 31.14000 109.4 41.8 7.4 3.79 41.8 68 50 0 16 335 63 64 1 34.45000 110.3 44.6 8.5 3.26 44.6 66 18 389 61 36.16300 111.8 45.8 9.5 2.53 45.8 66 24 502 60 36.38000 108.1 39.2 10.4 2.00 39.2 69 30 635 62 28.8
10000 103.6 31.5 11.4 1.42 31.5 72 42 894 64 20.1
24 of 54

Soundproof Windows, ASTM E90 Testing at NWAA Labs
Appendix B: JGL Acoustics, Inc. Raw Data and Analysis
August 13, 2012
Page B-3
This table shows the calculation of the test specimen transmission loss and STC rating for
the first door test.
Soundproof Windows Test #1 with small vision lite Test Date: 8/8/2012
Filler Wall Area 101.2 sq.ft. 9.41 m2 TRUE
Test Specimen Area 26.13 sq.ft. 2.43 m2 FALSE
Total Test Opening 127.4 sq.ft. 11.84 m2 Max. Def.
Test Rounded 5
Filler Composite Specimen Specimen STC Total Def.
Frequency Wall TL Wall TL TL TL Notes 53 29
Contour
50 38 34 28.4 28 ** 5.0
63 46 31 24.1 24 16.0
80 47 30 23.1 23 18.0
100 49 32 25.1 25 18.0
125 50 41 34.6 35 * 37 2 10.0
160 55 48 41.9 42 * 40 0 8.0
200 62 48 41.3 41 * 43 2 15.0
250 59 50 43.6 44 * 46 2 10.0
315 62 54 47.7 48 * 49 1 9.0
400 67 54 47.3 47 * 52 5 14.0
500 67 57 50.5 50 * 53 3 11.0
630 68 58 51.5 51 * 54 3 11.0
800 75 60 53.1 53 55 2 16.0
1000 75 60 53.1 53 56 3 16.0
1250 79 61 54.1 54 57 3 19.0
1600 81 63 56.1 56 57 1 19.0
2000 81 63 56.1 56 57 1 19.0
2500 81 64 57.1 57 57 0 18.0
3150 78 64 57.3 57 * 57 0 15.0
4000 80 63 56.1 56 57 1 18.0
5000 86 61 54.1 54 26.0
6300 91 60 53.1 53 32.0
8000 89 62 55.1 55 28.0
10000 83 64 57.1 57 20.0
** < 6 dB, TL listed is lower limit of true TL
* 6 < < 15 dB, TL listed has been corrected for sound transmission through filler wall
25 of 54

Soundproof Windows, ASTM E90 Testing at NWAA Labs
Appendix B: JGL Acoustics, Inc. Raw Data and Analysis
August 13, 2012
Page B-4
-
0
10
20
30
40
50
60
70
80
50 80 125
200
315
500
800
1250
2000
3150
5000
8000
So
un
d T
ran
sm
iss
ion
Lo
ss
(d
B)
One-Third Octave Band Center Frequency (Hz)
Soundproof WindowsDoor #1 Transmission Loss(with 5" by 29" vision lite)
Measured TL STC-53 ContourDeficiencies Signal to Noise Ratio
26 of 54

Soundproof Windows, ASTM E90 Testing at NWAA Labs
Appendix B: JGL Acoustics, Inc. Raw Data and Analysis
August 13, 2012
Page B-5
This table provides raw data and test results for the composite test of the second door
mounted in the filler wall.
Soundproof Windows Door #2 Test with full vision lite (composite test in filler wall)
Air Temperature 74 deg. FSpeed of Sound 1132.7 ft/sec
Source Room 4,360 cu. ft. 650.0 m3Receive Room 26,021 cu. ft. 737.4 m3Partition Area 127.3 sq. ft. 11.8 m2
AmbientAdjusted NIC Def. Decay STC
Frequency L1 L2 B2 T2 L2 NR 55 25 Rate Receive 53 29 S/NContour (dB/s) Sabins TL Contour Def. Ratio
50 105.3 64.5 19.0 4.60 64.5 41 13 276 37 45.663 107.9 71.0 15.1 6.15 71.0 37 10 206 35 55.980 108.2 69.2 13.9 4.97 69.2 39 12 255 36 55.4
100 105.7 74.0 11.1 7.95 74.0 32 8 160 31 62.9125 103.7 69.3 10.9 5.78 69.3 34 39 5 10 220 32 37 5 58.4160 103.9 59.7 7.8 5.68 59.7 44 42 0 11 223 42 40 0 51.9200 107.7 63.6 7.5 6.90 63.6 44 45 1 9 184 43 43 0 56.1250 107.6 58.8 7.0 7.37 58.8 49 48 0 8 172 48 46 0 51.7315 105.9 53.6 4.9 5.75 53.6 52 51 0 10 221 50 49 0 48.7400 105.6 54.4 4.9 4.96 54.4 51 54 3 12 256 48 52 4 49.5500 107.5 50.9 4.5 4.38 50.9 57 55 0 14 290 53 53 0 46.4630 108.3 52.5 5.7 4.09 52.5 56 56 0 15 310 52 54 2 46.8800 108.4 54.5 7.3 4.56 54.5 54 57 3 13 278 51 55 4 47.21000 103.7 50.3 5.1 5.32 50.3 53 58 5 11 239 51 56 5 45.11250 102.6 49.4 4.9 5.57 49.4 53 59 6 11 228 51 57 6 44.51600 106.1 49.4 5.7 5.30 49.4 57 59 2 11 240 54 57 3 43.82000 106.1 46.5 6.0 5.26 46.5 60 59 0 11 241 57 57 0 40.52500 104.8 42.3 6.3 5.08 42.3 63 59 0 12 250 60 57 0 35.93150 105.2 40.1 7.0 4.25 40.1 65 59 0 14 299 61 57 0 33.14000 109.5 42.3 7.8 3.91 42.3 67 59 0 15 325 63 57 0 34.55000 110.4 42.5 8.7 3.21 42.5 68 19 395 63 33.86300 111.7 42.8 9.7 2.53 42.8 69 24 502 63 33.18000 108.1 35.9 10.5 1.89 35.9 72 32 672 65 25.4
10000 103.5 28.8 11.5 1.35 28.8 75 44 940 66 17.3
27 of 54

Soundproof Windows, ASTM E90 Testing at NWAA Labs
Appendix B: JGL Acoustics, Inc. Raw Data and Analysis
August 13, 2012
Page B-6
This table shows the calculation of the test specimen transmission loss and STC rating for
the second door test.
Soundproof Windows Test #2 with vision lite Test Date: 8/8/2012
Filler Wall Area 101.2 sq.ft. 9.41 m2 TRUE
Test Specimen Area 26.13 sq.ft. 2.43 m2 FALSE
Total Test Opening 127.4 sq.ft. 11.84 m2 Max. Def.
Test Rounded 6
Filler Composite Specimen Specimen STC Total Def.
Frequency Wall TL Wall TL TL TL Notes 46 29
Contour
50 38 37 31.4 31 ** 2.0
63 46 35 28.4 28 * 12.0
80 47 36 29.4 29 * 12.0
100 49 31 24.1 24 19.0
125 50 32 25.1 25 30 5 19.0
160 55 42 35.3 35 * 33 0 14.0
200 62 43 36.1 36 36 0 20.0
250 59 48 41.4 41 * 39 0 12.0
315 62 50 43.3 43 * 42 0 13.0
400 67 48 41.1 41 45 4 20.0
500 67 53 46.3 46 * 46 0 15.0
630 68 52 45.1 45 47 2 17.0
800 75 51 44.1 44 48 4 25.0
1000 75 51 44.1 44 49 5 25.0
1250 79 51 44.1 44 50 6 29.0
1600 81 54 47.1 47 50 3 28.0
2000 81 57 50.1 50 50 0 25.0
2500 81 60 53.1 53 50 0 22.0
3150 78 61 54.1 54 50 0 18.0
4000 80 63 56.1 56 50 0 18.0
5000 86 63 56.1 56 24.0
6300 91 63 56.1 56 29.0
8000 89 65 58.1 58 25.0
10000 83 66 59.1 59 18.0
** < 6 dB, TL listed is lower limit of true TL
* 6 < < 15 dB, TL listed has been corrected for sound transmission through filler wall
28 of 54
Soundproof Windows, ASTM E90 Testing at NWAA Labs
Appendix B: JGL Acoustics, Inc. Raw Data and Analysis
August 13, 2012
Page B-7
End of Appendix B
0
10
20
30
40
50
60
70
80
50 80 125
200
315
500
800
1250
2000
3150
5000
8000
So
un
d T
ran
sm
iss
ion
Lo
ss
(d
B)
One-Third Octave Band Center Frequency (Hz)
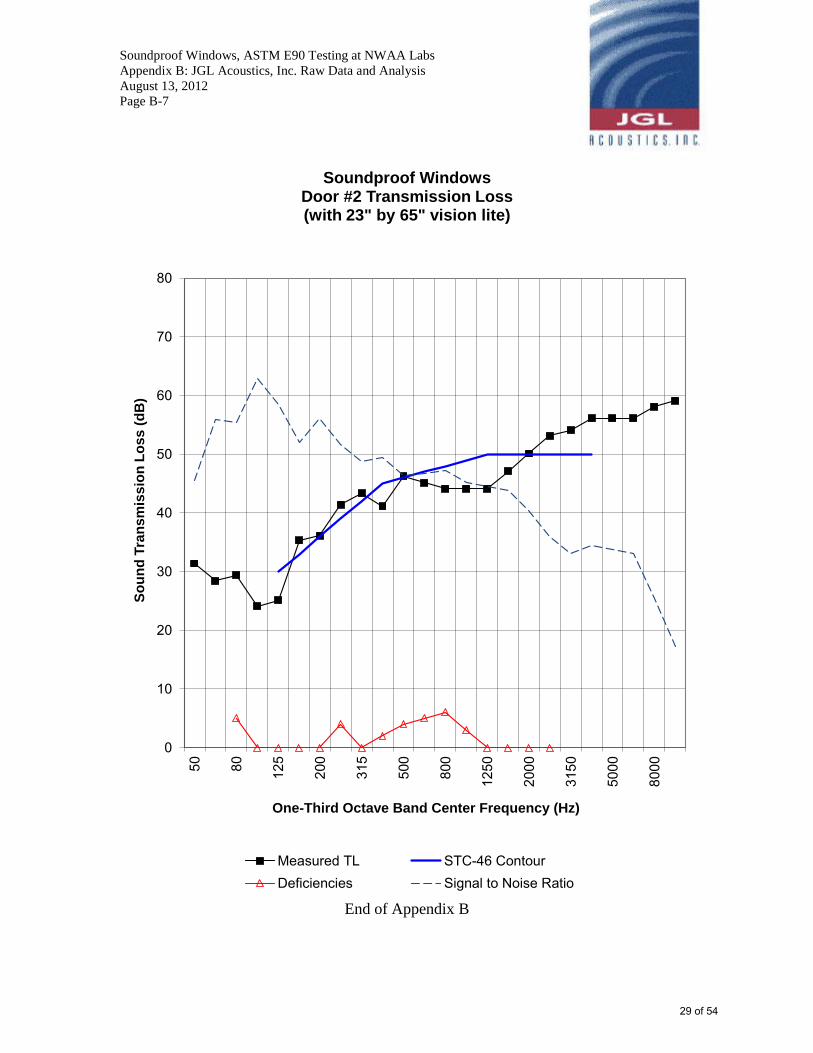
Soundproof WindowsDoor #2 Transmission Loss(with 23" by 65" vision lite)
Measured TL STC-46 ContourDeficiencies Signal to Noise Ratio
29 of 54

[ This page is left blank intentionally for 2 sided printing purposes]
30 of 54

Soundproof Windows, ASTM E90 Testing at NWAA Labs
Appendix C: Photos
August 13, 2012
Page C-1
Appendix C
Photographs
Photo 1. View of test specimen #1 from the source room side.
31 of 54

Soundproof Windows, ASTM E90 Testing at NWAA Labs
Appendix C: Photos
August 13, 2012
Page C-2
Photo 2. View of test specimen #1 and filler wall from the receive room side.
32 of 54
Soundproof Windows, ASTM E90 Testing at NWAA Labs
Appendix C: Photos
August 13, 2012
Page C-3
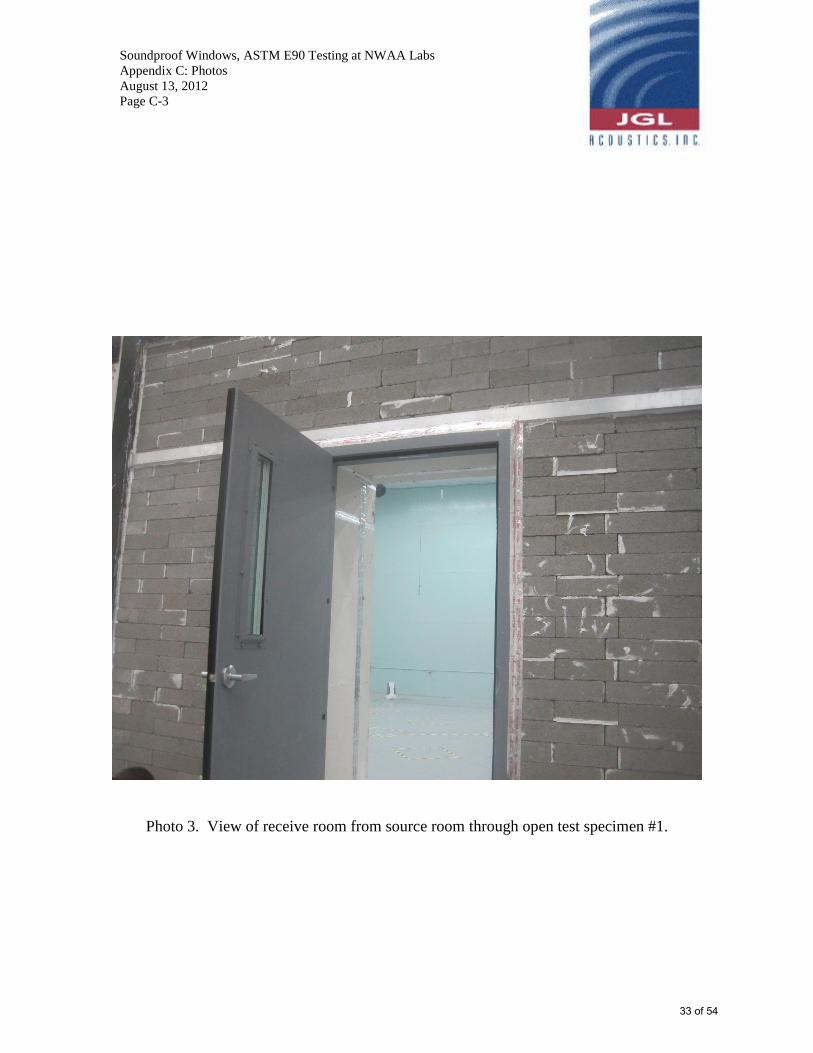
Photo 3. View of receive room from source room through open test specimen #1.
33 of 54

Soundproof Windows, ASTM E90 Testing at NWAA Labs
Appendix C: Photos
August 13, 2012
Page C-4
Photo 4. View of test specimen #2 and filler wall from the source side.
End of Appendix C
34 of 54

NWAA Labs 90 Tower Blvd, Elma, WA 98541, Phone:(253) 973-1018
Email address: [email protected]
AIRBORNE SOUND TRANSMISSION LOSS TEST REPORT #: NWTL120808-05
Client: Soundproof Windows, Inc. 4673 Aircenter Circle
Reno, NV 89501 Test Date: 8 August, 2012 Report Date: 15 August 2012 Test Specimen: Door, 175CG-529 INTRODUCTION The methods and procedures used in this test conform to the provisions and requirements of ASTM Procedure E 90-09, Standard Test Method for Laboratory Measurement of Airborne Sound Transmission Loss of Building Partitions and Elements and E413-10 Classification for Rating Sound Insulation. Copies of the test standards are available at www.astm.org. The receive room test chamber is a cuboid, 12.79 m (42.0 ft) long by 10.75 m (35.3 ft) wide by 5.31 m (17.4 ft) high, and volume is 737.4 m3 (26041.0 ft3). There are six fixed surfaces in the receive room. The source room test chamber is a cuboid, 10.67 m (35.0 ft) long by 8.85 m (29.0 ft) wide by 6.86 m (22.5 ft) high. There are six fixed basic wall surfaces in the source room. The source room also has 7 fixed reflecting/ absorbing shapes on the walls. A small rectangular niche is in a corner that is 1.84 m (6.0 ft) long by 1.52 m (5.0 ft) wide by 6.86 m (22.5FT) high. Together, they have a total volume of 667.0 m3 (23654.9 ft3). There are thirty two sources: two Renkus-Heinz ST94s, each in a separate corner, and two mid frequency cabinets containing four conic sources in each cabinet. The room also contains twelve mid/high frequency horns, six of each located near the ceiling and facing opposite walls and splayed, and sixteen SHF drivers, two of each mounted on aluminum plates and then mounted near the ceiling and splayed randomly across the room. A test opening in the common walls is 3.17 m (10.4 ft) high by 3.78 m (12.4 ft) wide by 81.28 cm (32 in) deep. This test report relates only to the item(s) tested. Any advertisement that utilizes this test report or test data must not imply product certification or endorsement by NWAA Labs and has to include all pages of the report. DESCRIPTION OF TEST SPECIMEN The test specimen was a door assembly with overall dimensions of 109.9 cm (43.25 in) wide by 221.0 cm (87.00 in) high by 13.3 cm (5.25 in) deep. The door leaf measured 94.0 cm (37 in) wide by 212.7cm (83.75 in) high by 4.4 cm (1.75 in) deep. This door has a 12.70 cm (5.0 in) wide by 73.66 cm (29.0 in) high vision lite centered vertically at eye level in the door. The door had three cam-lift hinges mounted to a grout filled frame. The door frame weight was 49.0kg (108 lbs){after grout filling} and the door leaf weight was 134.72 kg (297 lbs) for an overall weight of 183.70 kg (405 lbs). The net surface weight of the assembly was 67.4 kg/m2 (13.8 lbs/ft2).
35 of 54

The design of the interior door components is proprietary and the overall glazing thickness is 6.35cm (2.5 in) and protrudes outward from the surface of the door panel. The doors and the frame were fitted in the field with fin gaskets on both surfaces. A filler wall was constructed out of 20.3 cm (8 in) thick solid concrete blocks stacked together without grout or sealer between the blocks on the source room side and 3 layers of 1.6 cm (5/8in) thick gypsum board screwed to 2 x 4 wood framing on the receive room side. The cavity between the concrete blocks and gypsum board was filled with fiberglass batt insulation. The perimeters of both walls were sealed with acoustic caulk and putty. The door frame was installed on the source room side of the opening. All exposed edges were then sealed with acoustic seal. The STC is 53 Test results are on the following pages. Submitted by, NWAA Labs Inc ___________________________ Ron Sauro NWAA Labs Inc
36 of 54

NWTL120808-058-Aug-12 STC 53
OITC 38
2.43 DEF 29
23Barometer: pa 101800
71
Frequency(Hz)
TransmissionLoss
ShiftedContour
Deficiencies
50Hz 25 263Hz 25 280Hz 22 100Hz 25 125Hz 34 37 3 2160Hz 43 40 0 2200Hz 41 43 2 2250Hz 44 46 2 2315Hz 47 49 2 2400Hz 48 52 4 2500Hz 50 53 3 2630Hz 52 54 2 2 .
800Hz 53 55 2 1000Hz 53 56 3 21250Hz 55 57 2 1600Hz 56 57 1 2000Hz 56 57 1 2500Hz 56 57 1 3150Hz 57 57 0 4000Hz 56 57 1 5000Hz 54 6300Hz 53 8000Hz 55 210000Hz 57 2
Note 2: Flanking noise correction applied.
Note 1: Flanking noise limited. True value of Transmission Loss is greater than shown.
Soundproof Windows 175CG-529 operable
S/N Ratio
0.00.00.00.00.0
NWAA Labs, Inc.90 Tower Blvd,
Elma, WA 98541(253)-973-1018
Test Date:
Humidity: %
Test #
Area Tested: M²Temperature: ºC
0.00.0
0.00.00.00.00.00.00.00.0
0.00.00.0
Notes
0.00.00.00.00.00.0
37 of 54

NWTL120808-058-Aug-12 STC 53
OITC 382.43 DEF 2923
10180071
NWAA Labs, Inc.90 Tower Blvd,
Elma, WA 98541(253)-973-1018
Test #Test Date:
Area Tested: M²Temperature: ºCBarometer: paHumidity: %
Soundproof Windows 175CG-529 operable
0
5
10
15
20
25
30
35
40
45
50
55
60
65
50 63 80 100
125
160
200
250
315
400
500
630
800
1K
1.2K
1.6K 2K
2.5K
3.15
K 4K 5K
6.3K 8K 10K
One-Third Octave Center Frequency (Hz)
Tra
nsm
issi
on
Lo
ss
Transmission Loss Shifted Contour Deficiencies
38 of 54

NWAA Labs 90 Tower Blvd, Elma, WA 98541, Phone:(253) 973-1018
Email address: [email protected]
AIRBORNE SOUND TRANSMISSION LOSS TEST REPORT #: NWTL120808-07
Client: Soundproof Windows, Inc. 4673 Aircenter Circle
Reno, NV 89501 Test Date: 8 August, 2012 Report Date: 15 August 2012 Test Specimen: Door, 175CG-10 INTRODUCTION The methods and procedures used in this test conform to the provisions and requirements of ASTM Procedure E 90-09, Standard Test Method for Laboratory Measurement of Airborne Sound Transmission Loss of Building Partitions and Elements and E413-10 Classification for Rating Sound Insulation. Copies of the test standards are available at www.astm.org. The receive room test chamber is a cuboid, 12.79 m (42.0 ft) long by 10.75 m (35.3 ft) wide by 5.31 m (17.4 ft) high, and volume is 737.4 m3 (26041.0 ft3). There are six fixed surfaces in the receive room. The source room test chamber is a cuboid, 10.67 m (35.0 ft) long by 8.85 m (29.0 ft) wide by 6.86 m (22.5 ft) high. There are six fixed basic wall surfaces in the source room. The source room also has 7 fixed reflecting/ absorbing shapes on the walls. A small rectangular niche is in a corner that is 1.84 m (6.0 ft) long by 1.52 m (5.0 ft) wide by 6.86 m (22.5FT) high. Together, they have a total volume of 667.0 m3 (23654.9 ft3). There are thirty two sources: two Renkus-Heinz ST94s, each in a separate corner, and two mid frequency cabinets containing four conic sources in each cabinet. The room also contains twelve mid/high frequency horns, six of each located near the ceiling and facing opposite walls and splayed, and sixteen SHF drivers, two of each mounted on aluminum plates and then mounted near the ceiling and splayed randomly across the room. A test opening in the common walls is 3.17 m (10.4 ft) high by 3.78 m (12.4 ft) wide by 81.28 cm (32 in) deep. This test report relates only to the item(s) tested. Any advertisement that utilizes this test report or test data must not imply product certification or endorsement by NWAA Labs and has to include all pages of the report. DESCRIPTION OF TEST SPECIMEN The test specimen was a door assembly with overall dimensions of 109.9 cm (43.25 in) wide by 221.0 cm (87.00 in) high by 13.3 cm (5.25 in) deep. The door leaf measured 94.0 cm (37 in) wide by 212.7cm (83.75 in) high by 4.4 cm (1.75 in) deep. This door has a 58.42cm (23.0 in) wide by 165.10 cm (65.0 in) high vision lite centered in the door. The door had three cam-lift hinges mounted to a grout filled frame. The door frame weight was 49.0kg (108 lbs){after grout filling} and the door leaf weight was 143.34 kg (316 lbs) for an overall weight of 192.32 kg (424 lbs). The net surface weight of the assembly was 71.77kg/m2 (14.7 lbs/ft2).
39 of 54

The design of the interior door components is proprietary and the overall glazing thickness is 6.35cm (2.5 in) and protrudes outward from the surface of the door panel. The doors and the frame were fitted in the field with fin gaskets on both surfaces. A filler wall was constructed out of 20.3 cm (8 in) thick solid concrete blocks stacked together without grout or sealer between the blocks on the source room side and 3 layers of 1.6 cm (5/8in) thick gypsum board screwed to 2 x 4 wood framing on the receive room side. The cavity between the concrete blocks and gypsum board was filled with fiberglass batt insulation. The perimeters of both walls were sealed with acoustic caulk and putty. The door frame was installed on the source room side of the opening. All exposed edges were then sealed with acoustic seal. The STC is 46 Test results are on the following pages. Submitted by, NWAA Labs Inc ___________________________ Ron Sauro NWAA Labs Inc
40 of 54

NWTL120808-078-Aug-12 STC 46
OITC 36
2.43 DEF 27
23Barometer: pa 101800
69
Frequency(Hz)
TransmissionLoss
ShiftedContour
Deficiencies
50Hz 29 163Hz 30 280Hz 30 2100Hz 23 125Hz 26 30 4 160Hz 36 33 0 2200Hz 36 36 0 250Hz 41 39 0 2315Hz 43 42 0 2400Hz 42 45 3 500Hz 46 46 0 2630Hz 45 47 2 .
800Hz 44 48 4 1000Hz 44 49 5 1250Hz 44 50 6 1600Hz 47 50 3 2000Hz 50 50 0 2500Hz 52 50 0 3150Hz 54 50 0 4000Hz 56 50 0 5000Hz 56 6300Hz 56 8000Hz 58 210000Hz 60 1
Note 2: Flanking noise correction applied.
Note 1: Flanking noise limited. True value of Transmission Loss is greater than shown.
Soundproof Windows 175CG-10 operable
S/N Ratio
0.00.00.00.00.0
NWAA Labs, Inc.90 Tower Blvd,
Elma, WA 98541(253)-973-1018
Test Date:
Humidity: %
Test #
Area Tested: M²Temperature: ºC
0.00.0
0.00.00.00.00.00.00.00.0
0.00.00.0
Notes
0.00.00.00.00.00.0
41 of 54

NWTL120808-078-Aug-12 STC 46
OITC 362.43 DEF 2723
10180069
Soundproof Windows 175CG-10 operable
NWAA Labs, Inc.90 Tower Blvd,
Elma, WA 98541(253)-973-1018
Test #Test Date:
Area Tested: M²Temperature: ºCBarometer: paHumidity: %
0
5
10
15
20
25
30
35
40
45
50
55
60
65
50 63 80 100
125
160
200
250
315
400
500
630
800
1K
1.2K
1.6K 2K
2.5K
3.15
K 4K 5K
6.3K 8K 10K
One-Third Octave Center Frequency (Hz)
Tra
nsm
issi
on
Lo
ss
Transmission Loss Shifted Contour Deficiencies
42 of 54

NWAA Labs 90 Tower Blvd, Elma, WA 98541, Phone:(253) 973-1018
Email address: [email protected]
AIRBORNE SOUND TRANSMISSION LOSS TEST REPORT #: NWTL120809-02
Client: Soundproof Windows, Inc. 4673 Aircenter Circle
Reno, NV 89501 Test Date: 9 August, 2012 Report Date: 15 August 2012 Test Specimen: Door, 175CG-529 INTRODUCTION The methods and procedures used in this test conform to the provisions and requirements of ASTM Procedure E 90-09, Standard Test Method for Laboratory Measurement of Airborne Sound Transmission Loss of Building Partitions and Elements and E413-10 Classification for Rating Sound Insulation. Copies of the test standards are available at www.astm.org. The receive room test chamber is a cuboid, 12.79 m (42.0 ft) long by 10.75 m (35.3 ft) wide by 5.31 m (17.4 ft) high, and volume is 737.4 m3 (26041.0 ft3). There are six fixed surfaces in the receive room. The source room test chamber is a cuboid, 10.67 m (35.0 ft) long by 8.85 m (29.0 ft) wide by 6.86 m (22.5 ft) high. There are six fixed basic wall surfaces in the source room. The source room also has 7 fixed reflecting/ absorbing shapes on the walls. A small rectangular niche is in a corner that is 1.84 m (6.0 ft) long by 1.52 m (5.0 ft) wide by 6.86 m (22.5FT) high. Together, they have a total volume of 667.0 m3 (23654.9 ft3). There are thirty two sources: two Renkus-Heinz ST94s, each in a separate corner, and two mid frequency cabinets containing four conic sources in each cabinet. The room also contains twelve mid/high frequency horns, six of each located near the ceiling and facing opposite walls and splayed, and sixteen SHF drivers, two of each mounted on aluminum plates and then mounted near the ceiling and splayed randomly across the room. A test opening in the common walls is 3.17 m (10.4 ft) high by 3.78 m (12.4 ft) wide by 81.28 cm (32 in) deep. This test report relates only to the item(s) tested. Any advertisement that utilizes this test report or test data must not imply product certification or endorsement by NWAA Labs and has to include all pages of the report. DESCRIPTION OF TEST SPECIMEN The test specimen was a door assembly with overall dimensions of 109.9 cm (43.25 in) wide by 221.0 cm (87.00 in) high by 13.3 cm (5.25 in) deep. The door leaf measured 94.0 cm (37 in) wide by 212.7cm (83.75 in) high by 4.4 cm (1.75 in) deep. This door had a 12.7cm (5.0 in) wide by 73.66cm (29.0 in) high vision lite centered vertically at eye height in the door. The door had three cam-lift hinges mounted to a grout filled frame. The door frame weight was 49.0kg (108 lbs){after grout filling} and the door leaf weight was 134.72 kg (297 lbs) for an overall weight of 183.70 kg (405 lbs). The net surface weight of the assembly was 67.4 kg/m2 (13.8 lbs/ft2).
43 of 54
The design of the interior door components is proprietary and the overall glazing thickness is 6.35cm (2.5 in) and protrudes outward from the surface of the door panel. The doors and the frame were fitted in the field with bulb gaskets. A filler wall was constructed out of 20.3 cm (8 in) thick solid concrete blocks stacked together without grout or sealer between the blocks on the source room side and 3 layers of 1.6 cm (5/8in) thick gypsum board screwed to 2 x 4 wood framing on the receive room side. The cavity between the concrete blocks and gypsum board was filled with fiberglass batt insulation. The perimeters of both walls were sealed with acoustic caulk and putty. The door frame was installed on the source room side of the opening. All exposed edges were then sealed with acoustic seal. The STC is 53 Test results are on the following pages. Submitted by, NWAA Labs Inc ___________________________ Ron Sauro NWAA Labs Inc
44 of 54

NWTL120809-029-Aug-12 STC 53
OITC 38
2.43 DEF 23
23Barometer: pa 101800
73
Frequency(Hz)
TransmissionLoss
ShiftedContour
Deficiencies
50Hz 25 263Hz 25 280Hz 22 100Hz 24 125Hz 33 37 4 2160Hz 44 40 0 1200Hz 44 43 0 2250Hz 46 46 0 2315Hz 47 49 2 2400Hz 48 52 4 2500Hz 50 53 3 2630Hz 53 54 1 2 .
800Hz 53 55 2 1000Hz 53 56 3 21250Hz 54 57 3 1600Hz 56 57 1 2000Hz 57 57 0 2500Hz 57 57 0 3150Hz 58 57 0 24000Hz 57 57 0 5000Hz 54 6300Hz 53 8000Hz 55 210000Hz 58 2
0.00.00.0
Notes
0.00.00.00.00.00.00.00.0
0.00.00.00.00.00.00.00.0
0.0
NWAA Labs, Inc.90 Tower Blvd,
Elma, WA 98541(253)-973-1018
Test Date:
Humidity: %
Test #
Area Tested: M²Temperature: ºC
Note 2: Flanking noise correction applied.
Note 1: Flanking noise limited. True value of Transmission Loss is greater than shown.
Soundproof Windows 175CG-view w_bulb operable
S/N Ratio
0.00.00.00.0
45 of 54

NWTL120809-029-Aug-12 STC 53
OITC 382.43 DEF 2323
10180073
NWAA Labs, Inc.90 Tower Blvd,
Elma, WA 98541(253)-973-1018
Test #Test Date:
Area Tested: M²Temperature: ºCBarometer: paHumidity: %
Soundproof Windows 175CG-view w_bulb operable
0
5
10
15
20
25
30
35
40
45
50
55
60
65
50 63 80 100
125
160
200
250
315
400
500
630
800
1K
1.2K
1.6K 2K
2.5K
3.15
K 4K 5K
6.3K 8K 10K
One-Third Octave Center Frequency (Hz)
Tra
nsm
issi
on
Lo
ss
Transmission Loss Shifted Contour Deficiencies
46 of 54

NWAA Labs 90 Tower Blvd, Elma, WA 98541, Phone:(253) 973-1018
Email address: [email protected]
AIRBORNE SOUND TRANSMISSION LOSS TEST REPORT #: NWTL120809-01
Client: Soundproof Windows, Inc. 4673 Aircenter Circle
Reno, NV 89501 Test Date: 9 August, 2012 Report Date: 15 August 2012 Test Specimen: Door, 175CG-10 operable seal 2 INTRODUCTION The methods and procedures used in this test conform to the provisions and requirements of ASTM Procedure E 90-09, Standard Test Method for Laboratory Measurement of Airborne Sound Transmission Loss of Building Partitions and Elements and E413-10 Classification for Rating Sound Insulation. Copies of the test standards are available at www.astm.org. The receive room test chamber is a cuboid, 12.79 m (42.0 ft) long by 10.75 m (35.3 ft) wide by 5.31 m (17.4 ft) high, and volume is 737.4 m3 (26041.0 ft3). There are six fixed surfaces in the receive room. The source room test chamber is a cuboid, 10.67 m (35.0 ft) long by 8.85 m (29.0 ft) wide by 6.86 m (22.5 ft) high. There are six fixed basic wall surfaces in the source room. The source room also has 7 fixed reflecting/ absorbing shapes on the walls. A small rectangular niche is in a corner that is 1.84 m (6.0 ft) long by 1.52 m (5.0 ft) wide by 6.86 m (22.5FT) high. Together, they have a total volume of 667.0 m3 (23654.9 ft3). There are thirty two sources: two Renkus-Heinz ST94s, each in a separate corner, and two mid frequency cabinets containing four conic sources in each cabinet. The room also contains twelve mid/high frequency horns, six of each located near the ceiling and facing opposite walls and splayed, and sixteen SHF drivers, two of each mounted on aluminum plates and then mounted near the ceiling and splayed randomly across the room. A test opening in the common walls is 3.17 m (10.4 ft) high by 3.78 m (12.4 ft) wide by 81.28 cm (32 in) deep. This test report relates only to the item(s) tested. Any advertisement that utilizes this test report or test data must not imply product certification or endorsement by NWAA Labs and has to include all pages of the report. DESCRIPTION OF TEST SPECIMEN The test specimen was a door assembly with overall dimensions of 109.9 cm (43.25 in) wide by 221.0 cm (87.00 in) high by 13.3 cm (5.25 in) deep. The door leaf measured 94.0 cm (37 in) wide by 212.7cm (83.75 in) high by 4.4 cm (1.75 in) deep. This door has a 58.42cm (23.0 in) wide by 165.10 cm (65.0 in) high vision lite centered in the door. The door had three cam-lift hinges mounted to a grout filled frame. The door frame weight was 49.0kg (108 lbs){after grout filling} and the door leaf weight was 143.34 kg (316 lbs) for an overall weight of 192.32 kg (424 lbs). The net surface weight of the assembly was 71.77kg/m2 (14.7 lbs/ft2).
47 of 54

The design of the interior door components is proprietary and the overall glazing thickness is 6.35cm (2.5 in) and protrudes outward from the surface of the door panel. The doors and the frame were fitted in the field with seal 2 fin gaskets on both surfaces. A filler wall was constructed out of 20.3 cm (8 in) thick solid concrete blocks stacked together without grout or sealer between the blocks on the source room side and 3 layers of 1.6 cm (5/8in) thick gypsum board screwed to 2 x 4 wood framing on the receive room side. The cavity between the concrete blocks and gypsum board was filled with fiberglass batt insulation. The perimeters of both walls were sealed with acoustic caulk and putty. The door frame was installed on the source room side of the opening. All exposed edges were then sealed with acoustic seal. The STC is 47 Test results are on the following pages. Submitted by, NWAA Labs Inc ___________________________ Ron Sauro NWAA Labs Inc
48 of 54

NWTL120809-019-Aug-12 STC 47
OITC 37
2.43 DEF 28
24Barometer: pa 101800
70
Frequency(Hz)
TransmissionLoss
ShiftedContour
Deficiencies
50Hz 28 163Hz 30 280Hz 30 2100Hz 23 125Hz 27 31 4 160Hz 36 34 0 2200Hz 37 37 0 250Hz 42 40 0 2315Hz 43 43 0 2400Hz 43 46 3 500Hz 47 47 0 2630Hz 46 48 2 .
800Hz 45 49 4 1000Hz 44 50 6 1250Hz 45 51 6 1600Hz 48 51 3 2000Hz 51 51 0 2500Hz 54 51 0 3150Hz 56 51 0 4000Hz 57 51 0 5000Hz 56 6300Hz 56 8000Hz 58 210000Hz 60 1
0.00.00.0
Notes
0.00.00.00.00.00.00.00.0
0.00.00.00.00.00.00.00.0
0.0
NWAA Labs, Inc.90 Tower Blvd,
Elma, WA 98541(253)-973-1018
Test Date:
Humidity: %
Test #
Area Tested: M²Temperature: ºC
Note 2: Flanking noise correction applied.
Note 1: Flanking noise limited. True value of Transmission Loss is greater than shown.
Soundproof Windows 175CG-10 operable seal2
S/N Ratio
0.00.00.00.0
49 of 54

NWTL120809-019-Aug-12 STC 47
OITC 372.43 DEF 2824
10180070Humidity: %
Soundproof Windows 175CG-10 operable seal2
NWAA Labs, Inc.90 Tower Blvd,
Elma, WA 98541(253)-973-1018
Test #Test Date:
Area Tested: M²Temperature: ºCBarometer: pa
0
5
10
15
20
25
30
35
40
45
50
55
60
65
50 63 80
100
125
160
200
250
315
400
500
630
800
1K
1.2K
1.6K 2K
2.5K
3.15
K 4K 5K
6.3K 8K
10K
One-Third Octave Center Frequency (Hz)
Tra
nsm
issi
on
Lo
ss
Transmission Loss Shifted Contour Deficiencies
50 of 54

NWAA Labs 90 Tower Blvd, Elma, WA 98451, Phone:(253) 973-1018
Email address…[email protected]
AIRBORNE SOUND TRANSMISSION LOSS TEST REPORT #: NWTL111003-5 Rev.1
Client: Soundproof Windows, Inc 4673 Aircenter Circle Reno, NV 89502 Test Date: 03 October 2011 Test Specimen: Soundproof Windows Door Model 175C INTRODUCTION The methods and procedures used in this test conform to the provisions and requirements of ASTM Procedure E 90-09, Standard Test Method for Laboratory Measurement of Airborne Sound Transmission Loss of Building Partitions and Elements and E413-10 Classification for Rating Sound Insulation. Detailed test procedures, data for flanking limit tests, repeatability measurements and reference specimen tests are available on request. All transmission loss values are measured in a single direction only Copies of the test standards are available at www.astm.org. The receive room test chamber is a cuboid, 12.79 m (42.0 ft) long by 10.75 m (35.3 ft) wide by 5.31 m (17.4 ft) high, and volume is 737.4 m3 (26041.0 ft3). There are six fixed surfaces in the receive room. The source room test chamber is a cuboid, 10.67 m (35.0 ft) long by 8.85 m (29.0 ft) wide by 6.86 m (22.5 ft) high. There are six fixed basic wall surfaces in the source room. The source room also has 7 fixed reflecting/ absorbing shapes on the walls. A small rectangular niche is in a corner that is 1.84 m (6.0 ft) long by 1.52 m (5.0 ft) wide by 6.86 m (22.5FT) high. Together, they have a total volume of 667.0 m3 (23654.9 ft3). There are two sources, one in each corner, consisting of two Dodecahedron speakers. A test opening in the common walls is 3.17 m (10.4 ft) high by 3.78 m (12.4 ft) wide by 81.28 cm (32 in) deep . This test report relates only to the item(s) tested. Any advertisement that utilizes this test report or test data must not imply product certification or endorsement by NWAA Labs and has to include all pages of the report. DESCRIPTION OF TEST SPECIMEN The test specimen was a Soundproof Windows, Inc. Model 175C acoustic single steel swing door assembly. The steel frame was concrete grouted for that portion that was inserted into the test chamber wall. The door frame had a 2" facing that was neoprene filled. The frame was a single rabbet 4" deep jamb and there was no corresponding jamb piece attaching from the opposite jamb side. The door frame was attached with 4 lag bolts thru each side of the jamb into the test chamber opening. The door frame was sealed at the head and jambs with a heavy duct seal putty on both sides. The door panel was a steel acoustic core door. Details of the internal construction are proprietary, but contain no lead or other hazardous undesirable materials. The door was hung on three Zero 9500 cam-lift
51 of 54

hinges. There was a single-point cylindrical passage latch with lever handles - Home Depot part #701888. At the head and jambs a Zero 188S bulb seal was installed on the stop. On the jamb in front of the stop and the Zero seal was installed DHSI #105 Frame Seals. At the front edge of the head and jamb DHSI #SA seals were installed. On the bottom of the door panel 3ea DHSI #SA Seals were installed - sealing the sill when the cam lift lowered the door panel. The sill used was the flat steel sill that is part of the test chamber opening. The overall dimensions of the door assembly was 1.02 m (40 inches) wide by 2.2 m (86 inches) high by 101.6 mm (4 inches) in depth. The door panel dimensions were 908 mm (35-3/4 inches) by 2.12 m (83-1/2 inches) high by 44.5 mm (1-3/4 inches) thick. The weight of the door assembly was 159.1kg (350.0 lbs.) for a calculated surface weight of 8.5kg/cm2(103.6 lbs/ft2). The door was opened and closed five times immediately prior to test. MEASUREMENT RESULTS The Sound Transmission Class rating was determined by using the ASTM E-413-04 and is STC-56. The detailed sound transmission loss results are charted and displayed in one-third octave increments on the following pages. Submitted by, NWAA Labs Inc ___________________________ Ron Sauro NWAA Labs Inc
52 of 54

NWTL111003-53-Oct-11 STC 56
OITC 44
2.22 DEF 27
24Barometer: pa 100400
65
Frequency(Hz)
TransmissionLoss
ShiftedContour
Deficiencies
50Hz 28 163Hz 24 80Hz 29 2100Hz 32 2125Hz 37 40 3 2160Hz 44 43 0 1200Hz 46 46 0 2250Hz 47 49 2 2315Hz 49 52 3 1400Hz 52 55 3 2500Hz 55 56 1 1630Hz 54 57 3 1 .
800Hz 57 58 1 21000Hz 56 59 3 21250Hz 53 60 7 1600Hz 59 60 1 12000Hz 60 60 0 12500Hz 61 60 0 23150Hz 63 60 0 24000Hz 61 60 0 25000Hz 56 26300Hz 55 28000Hz 58 110000Hz 61 1
Note 2: Flanking noise correction applied.
Note 1: Flanking noise limited. True value of Transmission Loss is greater than shown.
E90 Soundproof Windows model 175C Rev1
S/N Ratio
0.00.00.00.00.0
NWAA Labs, Inc.90 Tower Blvd,
Elma, WA 98541(253)-973-1018
Test Date:
Humidity: %
Test #
Area Tested: M²Temperature: ºC
0.00.0
0.00.00.00.00.00.00.00.0
0.00.00.0
Notes
0.00.00.00.00.00.0
53 of 54

NWTL111003-53-Oct-11 STC 56
OITC 442.22 DEF 2724
10040065
E90 Soundproof Windows model 175C Rev1
NWAA Labs, Inc.90 Tower Blvd,
Elma, WA 98541(253)-973-1018
Test #Test Date:
Area Tested: M²Temperature: ºCBarometer: paHumidity: %
0
5
10
15
20
25
30
35
40
45
50
55
60
65
70
50 63 80 100
125
160
200
250
315
400
500
630
800
1K
1.2K
1.6K 2K
2.5K
3.15
K 4K 5K
6.3K 8K 10K
One-Third Octave Center Frequency (Hz)
Tra
nsm
issi
on
Lo
ss
Transmission Loss Shifted Contour Deficiencies
54 of 54