stealthgas inc. · interest rate swaps and foreign currency hedging arrangements, ... free cash...
TRANSCRIPT

StealthGas Inc. StealthGas Inc. 44thth Quarter 2010 ResultsQuarter 2010 Results
February 23February 23rdrd, , 20102010
CONSISTENCY & GREAT VALUECONSISTENCY & GREAT VALUE

Disclaimer
Forward-Looking Statements
This presentation contains forward-looking statements within the meaning of applicablefederal securities laws. Such statements are based upon current expectations thatinvolve risks and uncertainties. Any statements contained herein that are not statementsof historical fact may be deemed to be forward-looking statements. For example, wordssuch as “may,” “will,” “should,” “estimates,” “intends,” and similar expressions areintended to identify forward-looking statements. Actual results and the timing of certainevents may differ significantly from the results discussed or implied in the forward-looking statements. Among the factors that might cause or contribute to such adiscrepancy include, but are not limited to the risk factors described in the Company’sRegistration Statement filed with the Securities and Exchange Commission, particularlythose describing variations on charter rates and their effect on the Company’s revenues,net income and profitability as well as the value of the Company’s fleet.
1

Business Strategy Implementation
Consolidation and fleet renewal
Sold 5 LPG carriers in 2010
Acquiring 5 Newbuilding LPG Carriers (4 in 2011 and 1 in 2012)
Acquired Newbuilding Aframax Crude Oil Tanker in 2010
Moderate Leverage Fourth Quarter 2010 net debt to capitalization: 45.8%
Visible Revenue Stream –Consistency
61% of voyage days fixed for FY 2011
35% of voyage days fixed for FY 2012
During 2010 announced 20 new charter arrangements of duration 12months or more.
Modern Fleet Our fleet average age is 12.0 years
Sector average age is 18.5 years
Close Customer Relations High quality customer base – low counterparty risk
Cost-Efficient Operations
Consistent Breakeven
Net Income Breakeven of $6,188 per day in Q4 2010 (net of realized loss on interest rate swaps) compared to $6,311 in Q3 2010 and $5,963 in Q2
2010.
Common Stock
Re-Purchase
Instigated plan to buy-back up to $15 Million worth of Common Stock
As of December 31st 2010, repurchased 5.6 % of stocks outstanding.
Business Strategy
2

Fleet Development
Newbuilding program of 4 LPG carriers delivering in 2011 and 1 delivering in 2012
Newbuilding program has committed financing
Selective sale of older & smaller tonnage in 2010/11
3

Fleet Employment Profile
4

Fourth Quarter 2010 Financial Highlights
5
Fourth Quarter 2010
Q4 Net Income of $4.3 million, net revenues of $29.1 million, EBITDA of
$13.2 million
Q4 Net income of $2.4 million before net non cash gain of $1.3 million on
interest rate swaps and foreign currency hedging arrangements, $0.6
million gain on unrealized exchange difference
EPS of $0.21 per share (EPS $0.12 per share before non cash gain on
interest rate swaps and foreign currency hedging arrangements, gain on
unrealized exchange difference) on 21.1 million shares outstanding
Free cash balance of circa $30.0 million
Conservative leverage: net debt to capitalization of 45.8%

Fourth Quarter 2010 Income Statement
6
In US$ 000, except per share amounts Q4 2009 Q3 2010 Q4 2010
Net Revenues $28,381 $26,727 $29,056
Operating Income (20,843)(1)
4,540(2)
5,817
Net Income(3)
(27,151)(1)
990(2)
4,343
Net Income, net of interest rate swap, stock based compensation, impairment loss, unrealized exchange difference, contract termination fees and forfeiture of vessel deposit
2,270 942 2,440
EBITDA(3)
(17,645)(1)
9,703(2)
13,232
EPS(3)
(1.22)(1)
0.05(2)
0.21
EPS, net of interest rate swap, stock based compensation, impairment loss, unrealized exchange difference, contract termination fees and forfeiture of vessel deposit
0.10 0.04 0.12
Number of Shares, diluted 22,291,064 21,091,139 21,101,882
(1) Includes gain $ 1.1 million unrealized exchange difference on foreign currency deposit(2) Includes gain $ 0.6 million unrealized exchange difference on foreign currency deposit(3) Includes impairment loss $ 9.9 million and $10.75 million payment on termination of
vessel acquisition contract plus forfeiture of vessel deposit

Fourth Quarter 2010 Operating Highlights
7
Fleet Data Q4 2009 Q4 2010 FY 2009 FY 2010
Average number of vessels in fleet 42.8 38.0 42.0 38.6
Period end number of vessels in fleet 42 38 42 38
Total calendar days for fleet 3,934 3,496 15,335 14,075
Total voyage days for fleet 3,898 3,470 15,240 13,835
Fleet utilization 99.1% 99.3% 99.4% 98.3%
Total charter days for fleet 2,941 2,605 12,276 10,327
Total spot market days for fleet 957 865 2,964 3,508
Fleet operational utilization 86.8% 92.2% 90.2% 87.3%
Average Daily Results (in $) Q4 2009 Q4 2010 FY 2009 FY 2010
Time Charter Equivalent – TCE $7,324* $8,024* $7,712* $7,810*
Vessel Operating Expenses 3,473* 3,643* 3,464* 3,571*
Management Fees 355 379 341 368
General & Administrative Expenses 198 235 232 215
Total Vessel Operating Expenses 3,671* 3,878* 3,696* 3,786*
Fleet Data & Daily Results
* Assuming no vessels on Bareboat Charter

Daily Breakeven
8
Q4 2010 & FY 2010 Daily Cash Flow and Net Income Breakeven Composition
($ per vessel per day) Q4 2010 fleet calendar days: 3,496
FY 2010 fleet calendar days: 14,075
Q4 2010 Q4 2010
Cash Flow Net Income
FY 2010 FY 2010
Cash Flow Net Income
Full Year 2010 Financial Highlights
9
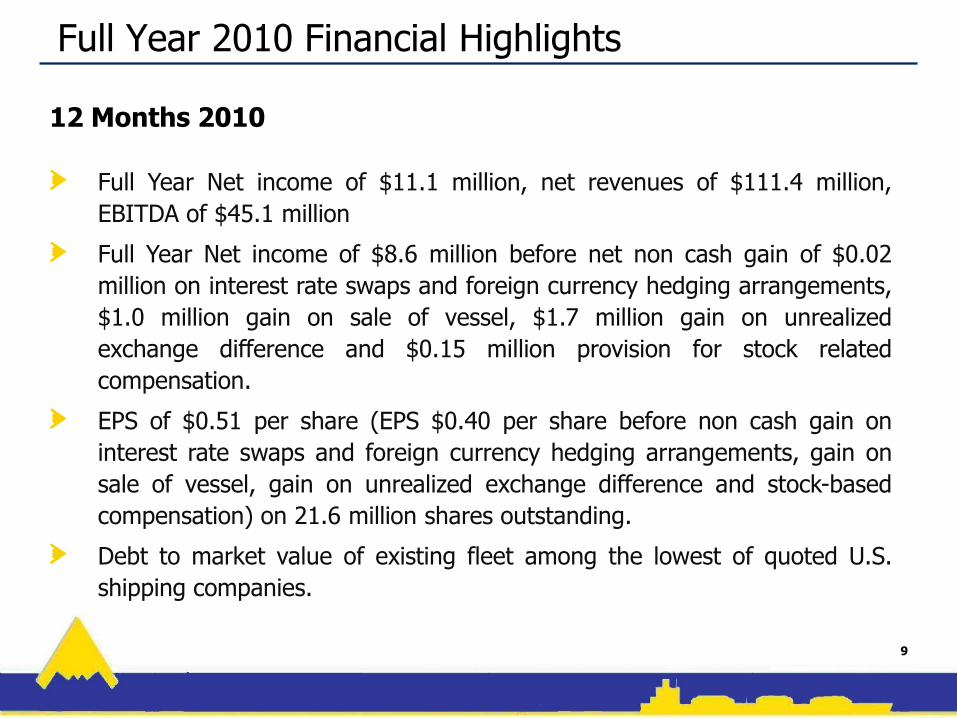
12 Months 2010
Full Year Net income of $11.1 million, net revenues of $111.4 million,
EBITDA of $45.1 million
Full Year Net income of $8.6 million before net non cash gain of $0.02
million on interest rate swaps and foreign currency hedging arrangements,
$1.0 million gain on sale of vessel, $1.7 million gain on unrealized
exchange difference and $0.15 million provision for stock related
compensation.
EPS of $0.51 per share (EPS $0.40 per share before non cash gain on
interest rate swaps and foreign currency hedging arrangements, gain on
sale of vessel, gain on unrealized exchange difference and stock-based
compensation) on 21.6 million shares outstanding.
Debt to market value of existing fleet among the lowest of quoted U.S.
shipping companies.

Full Year 2010 Income Statement
10
In US$ 000, except per share amounts12 Months
200912 Months
2010
Net Revenues $113,046 $111,410
Operating Income 1,287 23,024
Net Income (13,312) 11,093
Net Income, net of interest rate swap, loss/(gain) on sale of vessel, unrealized exchange difference and stock based compensation
15,876 8,580
EBITDA 22,132 45,075
EPS (0.60) 0.51
EPS, net of interest rate swap, loss/(gain) on sale of vessel, unrealized exchange difference and stock based compensation
0.71 0.40
Number of Shares, basic 22,219,442 21,553,659

Financial Estimator 2011
11
Contracted Revenues $77 million
Non contracted Voyage days 5,370
Drydock Expenses $5.1 million (11 vessels)
Interest & Swaps (cash portion) $14.2 million
Operating, G&A, Management Fees, Commissions at similar levels to 2010
D&A $29.0 million
Remaining Payments for Newbuildings $65.0 million (2011) $21million (2012)

LPGC Freight Rates
12
Average earnings in the spot market excluding waiting time / 1 yr TC rates
Source: Inge Steensland AS
100
200
300
400
500
600
700
800
2003 2004 2005 2006 2007 2008 2009 2010 2011
USD
10
00
's p
er m
on
th
15000 SR TCE
8000 ETH TCE
6500 SR TCE
3500 SR 1yr TC
3500 PR 1yr TC east
INGE STEENSLAND AS

Small LPG tanker rates are less volatile than crude tanker and drybulk rates
Data source: Clarkson Research Services 2009
Rates: 1-year TC measured weekly
Dry Bulk: average of Cape, Panamax, Handymax, and
Handysize rates
Crude Tanker: average of VLCC, Suezmax, and Aframax rates
But, small LPG rates remain relatively stable
1-Year TC Rate Volatility Since 2000
13
1-Year TC Rate Volatility Since 2000

Charter Market Rate Indicator (12 Month TCs)
Q4 2010 Average Current Q1 2011 Forecast
3,200 CBM S/R 256,000 270,000 270,000
3,500 CBM P/R 232,000 248,000 255,000
5,000 CBM P/R 265,000 295,000 310,000
6,000 CBM S/R 450,000 450,000 450,000
15,000 CBM S/R 514,000 525,000 540,000
35,000 CBM 591,000 620,000 650,000
60,000 CBM 650,000 650,000 650,000
78,000 CBM 711,000 725,000 725,000
Source: Lorentzen & Stemoco
14

3000-7999 cbm Fleet Development Vs. TC Rates/Earnings*
•TC equivalent spot earnings are assessed average earnings in the spot market excluding waiting time
•Fleet growth excl. Chinese fleet
Source: Inge Steensland AS 15
-5%
0%
5%
10%
15%
-
100
200
300
400
500
600
1995
1996
1997
1998
1999
2000
2001
2002
2003
2004
2005
2006
2007
2008
2009
2010
2011
2012
Flee
t gro
wth
in %
(bar
s)
TC e
quiv
. spo
t ear
ning
sTC
rate
s in
USD
100
0's p
er m
onth
(lin
es)
Overall 3000-7999 fleet growth S/R 3000-7999 fleet growth SR 6500 cbm TCE
SR 3500 cbm 1yr TC PR 3500 cbm 1yr TC East
INGE STEENSLAND AS

Despite a “stop” in new ordering, lots of ships will be delivered But not in the LPG space
Source: DnB NOR Markets – Shipping Sector Outlook 2010* Includes all LPG Carriers size categories
16
Orderbooks in Percent of Existing Fleet
0 %
10 %
20 %
30 %
40 %
50 %
60 %
70 %
Tank Drybulk Product Chemical LPG LNG Container Reefer PCC
sep.09 jan.10
*

Shipping Sector “Value” Comparison
* Source: for LT/Cap and NAV Cantor & Fitzgerald & Co., as of February 14th , 2011
Company Name SymbolLT
Debt/CAP NAV P/NAVLatest Price
StealthGas Inc. “GASS” 48.0% $13.00 0.51x 6.59
Diana Shipping Inc. * “DSX” 23.0% $13.75 1.01x 12.56
DryShips Inc. * “DRYS” 47.0% $7.35 0.62x 4.88
Nordic American Tanker Shipping Ltd. * “NAT” 5.0% $14.6 1.70x 24.63
Double Hull Tankers * “DHT” 58.0% $4.76 1.01x 4.85
Crude Carriers * “CRU” 32.0% $19.00 0.81x 15.43
17
Contacts
Company Contact:
Konstantinos Sistovaris Visit our Website at:Chief Financial Officer www.stealthgas.comStealthGas Inc.011-30-210-6250-001E-mail: [email protected]
Weekly LPG Market Report
updated every Monday
Comprehensive Investor
Relations Information
18