statutory voltage limits at customers’ terminals in the uk ... · voltage limits on the low...
TRANSCRIPT
PRODUCED BY THE OPERATIONS DIRECTORATE OF ENERGY NETWORKS ASSOCIATION
Engineering Technical Report 140
August 2017
Statutory Voltage Limits at customers’ terminals in the UK and options for future application of wider limits at low voltage
ENA Engineering Technical Report 140 Issue 1 2017
Page 2
First Published August 2017
Amendments since publication
Issue Date Amendment
© 2017 Energy Networks Association
All rights reserved. No part of this publication may be reproduced, stored in a retrieval system or transmitted in any form or by any means, electronic, mechanical, photocopying, recording or otherwise, without the prior written consent of Energy Networks Association. Specific enquiries concerning this document should be addressed to:
Operations Directorate Energy Networks Association 6th Floor, Dean Bradley House
52 Horseferry Rd London
SW1P 2AF
This document has been prepared for use by members of the Energy Networks Association to take account of the conditions which apply to them. Advice should be taken from an appropriately qualified engineer on the suitability of this document for any other purpose.
Contents
Foreword ................................................................................................................................ 4
Introduction ............................................................................................................................ 5
1 Scope .............................................................................................................................. 6
2 Normative references ....................................................................................................... 6
3 Terms and definitions ....................................................................................................... 6
3.1 AVC ........................................................................................................................ 6
3.2 DUOS ..................................................................................................................... 6
3.3 Low Carbon Network Fund (LCNF) ......................................................................... 6
3.4 Low Voltage (LV) .................................................................................................... 6
3.5 Network Innovation Allowance (NIA) ....................................................................... 7
4 Low Carbon Network Fund Projects ................................................................................. 7
5 European Voltage limits and tolerances ........................................................................... 8
6 Background to harmonisation of 230V ............................................................................. 9
7 Design Philosophy of DNOs ............................................................................................. 9
8 Working within the existing UK limits of 230V +10/-6% .................................................. 10
9 Record of voltage compliance within the UK .................................................................. 11
10 Working within wider limits of 230V +10/-10% ................................................................ 12
11 Impact to Stakeholders .................................................................................................. 13
11.1 Impact on customer’s equipment .......................................................................... 14
11.2 Impact on the National Electricity Transmission System ....................................... 15
11.3 Impact on Embedded Generation ......................................................................... 18
11.4 Benefits to customers ........................................................................................... 19
11.5 Impacts on DNOs.................................................................................................. 19
12 Summary ....................................................................................................................... 20
13 Recommendations ......................................................................................................... 20
Annex A - Terms of Reference ............................................................................................. 22
Annex B - Task Group Members .......................................................................................... 26
Annex C - Voltage Limits across the European Union .......................................................... 27
Annex D - Evaluation of effect of a Transmission System Event ........................................... 32
Annex E - Voltage Regulation across DNO companies ........................................................ 34
Annex F - Innovation Projects related to statutory voltage .................................................... 39
Bibliography ......................................................................................................................... 40
Foreword
This Engineering Technical Report is published by the Energy Networks Association (ENA) and comes into effect from July 2017. It has been prepared under the authority of the ENA Engineering Policy and Standards Manager and has been approved for publication by the ENA Electricity Networks and Futures Group (ENFG). The approved abbreviated title of this engineering document is “ETR 140”. This is a first issue and does not cancel or replace any other document.
This document has been developed in conjunction with the ENA Task Group on Statutory Voltage Limits and includes all relevant findings from work carried out by the Task Group. The Task Group would like to acknowledge the contributions of its membership and the support of BEIS (formerly DECC) and BEAMA/GAMBICA in its work.
The intention is for this document to be used by ENA member companies, Ofgem and the Department for Business, Energy and Industrial Strategy (BEIS) to promote stakeholder engagement on the use of the full range of statutory voltage limits currently available. It is also prepared to provide an evidence base for consideration by BEIS when assessing proposals to change statutory voltage limits.
The Task Group has also developed an Engineering Recommendation on the measurement of voltage at customer terminals at low voltage level. That document assists with the investigation and categorisation of voltage events.
Introduction
At a meeting of the Energy Networks Futures Group (ENFG) held in January 2015 it was agreed that an ENA Task Group would be established to consider the findings of various Low Carbon Network Fund (LCNF) projects in relation to voltage control on the low voltage (LV) network. The projects have highlighted benefits that could be gained by utilising a wider range and new lower voltage bound.
The Task Group used LCNF findings to review the current lower bound of the statutory voltage limits on the low voltage network and, specifically at LV customers’ terminals. Additionally the Task Group reviewed the option for changing the current lower bound from 6 per cent below nominal voltage to 10 per cent below nominal so as to align with the current BS EN 50160 and BS EN 60038 standards [3], [4].
The Task Group quantified the positive and negative aspects of such a policy and practice change on network operators, customers, generators and other stakeholders in terms of planning and operations.
An ENA Task Group was convened under the chairmanship of Paul Jewell of Western Power Distribution. A list of Task Group members is provided at Annex A.
The terms of reference for the Task Group included five main areas of consideration which were:
Working within the existing UK limits of 230V +10/-6%
Working within wider limits of 230V +10/-10%
Distributed Generation (DG) headroom1 and Low Carbon Technology (LCT) footroom2
Specific engineering challenges
Impact on the National Electricity Transmission System
—————————
1 A measure of the maximum capacity of additional DG that can be connected for the voltage on the supply terminals not to exceed the upper statutory voltage limit
2 A measure of the maximum additional LCT load that can be connected for the voltage on the supply terminals not to fall below the lower statutory voltage limit
1 Scope
This report details the potential benefits to stakeholders gained through Distribution Network Operators (DNOs) revising their operations within the current statutory voltage limit bands. In part this change is driven by the changing requirements placed on their networks by customers but also by opportunities identified by a number of LCNF projects. This report summarises the potential benefits and impacts on stakeholders, including the effect on LV networks, of changing the lower bound of the current LV statutory voltage limit from 6 per cent to 10 per cent as referenced in BS EN 50160 and BS EN 60038 [3], [4]. The report also compares the UK position with a number of other European countries who already utilise a wider band and investigates the voltage flexibility available within the current Regulations.
2 Normative references
The following referenced documents, in whole or part, are pertinent to this document.
Statutory Instruments:
[1] Electricity Safety Quality and Continuity Regulations 2002, as amended (ESQCR)
[2] Electricity Safety Quality and Continuity Regulations (Northern Ireland) 2012, as amended (ESQCR [NI])
Standards Publications:
[3] BS EN 50160:2010 - Voltage characteristics of electricity supplied by public electricity networks
[4] BS EN 60038:2011 - CENELEC standard voltages
[5] BS 7671:2008+A3:2015 – Requirements for Electrical Installations. IET Wiring Regulations
3 Terms and definitions
For the purposes of this document, the following terms and definitions apply.
3.1 AVC
Automatic Voltage Control
3.2 DUOS
Distribution Use Of System (charges)
3.3 Low Carbon Network Fund (LCNF)
The LCN Fund, established by Ofgem as part of the electricity distribution price control that ran until 31 March 2015. It supported projects sponsored by the DNOs to try out new technology, operating and commercial arrangements.
3.4 Low Voltage (LV)
In relation to alternating current, a voltage exceeding 50V measured between phase conductors (or between phase conductors and earth), but not exceeding 1,000V measured between phase conductors (or 600V if measured between phase conductors and earth), calculated by taking the square root of the mean of the squares (RMS) of the instantaneous values of a voltage during a complete cycle.
3.5 Network Innovation Allowance (NIA)
A set allowance to each network licensee receives as part of their 2015 -2023 price control allowance.
The NIA provides limited funding to RIIO network licensees to use for two purposes:
• To fund smaller technical, commercial, or operational projects directly related to the licensees network that have the potential to deliver financial benefits to the licensee and its customers; and/or
• To fund the preparation of submissions to the Network Innovation Competition (NIC) which meet the criteria set out in the NIC Governance Document.
4 Low Carbon Network Fund Projects
Many projects registered through the LCNF and its successor the NIA have included elements of research into the operation and management of low voltage distribution networks. They include:
Western Power Distribution – LV Templates
LV Templates created one of the largest monitored LV networks in Europe with over 750 monitored substations and 3,500 customer monitoring points. Over 177 million 10 minute averages of voltage and demand data were taken over a period of two years.
LV Templates concluded that the LV network was generally operating toward the higher limits of its operating band and that there was scope to reduce voltage and provide additional network capacity for DG.
Electricity North West – Customer Load Active System Services (CLASS) project
CLASS focussed on customer perception of voltage levels and voltage regulation. It undertook a regular survey of over 393,000 customers. Voltage levels were altered during the study and the perception of these changes was researched.
CLASS concluded that customers are sensitive to supply interruptions but have a low sensitivity to alterations to voltage; both magnitude and duration.
SP Energy Networks -Flexible Networks for a Low Carbon Future
Flexible networks, like other LCNF projects, concluded that a network voltage reduction enabled headroom for DG to connect. It also concluded that a voltage reduction will generally result in a reduction in active power demand, with this reduction being larger over the short term than in the long term.
Northern Powergrid – Customer Led Network Revolution – Grand Unified Scheme
The Customer Led Network Revolution project was a smart grid project designed to test a range of customer-side solutions alone and in combination with network-side technology including voltage controlled busbars, real-time thermal rating and energy storage.
In relation to voltage control, trials and additional studies showed that the target voltage could be reduced by reviewing and allocating a voltage range depending on the mix of
customers.3 The project reviewed voltage control devices, such as HV regulators, on-load distribution transformer tap-changers and battery storage.
SP Energy Networks - Voltage Optimisation
As part of the SP Energy Networks voltage optimisation exercise, part of the Flexible Networks project, an initial trial was undertaken at a primary substation to observe the effects of a reduction in the network voltage. A 3% voltage reduction was applied on the 9th January 2015. It was removed on the 30th January, due to a call from a customer that their equipment was not working as designed; this issue was subsequently found to be a LV network problem. A further extended voltage reduction trial at the same primary substation took place in May 2015. This allowed observation of the customer’s supply point voltage as well as the secondary supplying substation. The reduced network voltage remained in place until December 2015 with no customer issues. Also over a 24hr period on the 22/23 September a 6% voltage reduction was applied during the morning, midday and evening peak loads to observe the customer voltages. No customer issues arose due to this test and all measured supply voltages were within statutory limits.
In conclusion, it was found that a network voltage reduction can provide significant additional DG capacity headroom for the LV network. In this project, a 2% reduction in voltage enables a further 90% of PV generation (by kW) to be connected.
Western Power Distribution’s LV Templates project, SP Energy Networks’ Flexible Networks project and Electricity North West’s CLASS project all provided improved data and learning on the operation of the LV network and customer’s perception to alterations to supply voltage.
Links to each project website, which includes further details, and other examples of such projects are included in Annex F.
5 European Voltage limits and tolerances
A survey of European electricity network operators has shown that they generally follow EN 60038 in respect of standard voltage values and EN 50160 in respect of voltage characteristics, although these are not statutory in all areas. All countries are declaring a nominal voltage of 230V; however differing approaches have been taken by those European Network Operators who responded to the survey in applying upper and lower voltage limits. A full list of those who responded and their approaches is given in Annex C.
The upper and lower voltage limits stated by European network operators for LV networks are generally based on utilisation of the full permitted +10/-10% range. Some countries have an additional tolerance which is defined separately from EN 50160 to accommodate the voltage drop within a customer’s premises. In the UK, this tolerance is set out in the IET Wiring Regulations [5], which states that a voltage drop within the premises when supplied from a public low voltage distribution system of 3% for lighting or 5% for other uses, should be designed for. In general, European countries base their voltage quality parameters on EN 50160.
Within the UK there is no approved industry standard for measurement and analysis of the voltage levels detailed in the ESQC Regulations for GB and for Northern Ireland [1], [2]. An Engineering Recommendation (EREC) to adopt the measurement method of BS EN 50160
————————— 3 CLNR_DEI-257 – Voltage Control Policy: Proposals for a Voltage Control Policy from CLNR learning
has been drafted by the Task Group to set out a recommended position for application by DNOs.
6 Background to harmonisation of 230V
The CENELEC Harmonisation Document (HD 472) was implemented within the UK through BS 7697 in 1993. The original intent of the harmonisation document was to propose a three step approach in which the target voltage would be harmonised to 230V, the operating band would be increased to +10%/-10% to allow for individual country arrangements and finally the band would be narrowed around the new target voltage. This possible third stage was a disincentive to making use of the wider band. However, the third stage requirement was not continued into EN 60038 which superseded HD 472.
The Electricity Supply Regulations (1988) were the last body of legislation to refer to a voltage at the supply terminals of 240V. These were amended in 1994 to refer to a voltage of 230V. The permitted variations of +6%/-6% in the 1988 regulations were extended to +10%/-6% in the 1994 amendment. The introduction of the GB ESQCR [1], which came into force in January 2003, and more recently the ESQCR (NI)[2], maintained reference to a nominal supply terminal voltage of 230V with the range of +10%/-6%.
The extension of the voltage range and the reduction in the nominal voltage were implemented in different ways by the DNOs. Some companies took practical steps to amend the target voltage on their LV networks whilst others used the extended margins to continue with the same operational arrangements. In general, most DNOs adopted the new voltage range for new network designs or extensions.
It should be noted that up until recently all DNOs were operating a demand centric network with very limited levels of DG; therefore there were operational advantages to retaining a higher target voltage. Subsequently, some DNOs have tactically reduced their HV busbar voltage in selected locations (whilst maintaining the HV/LV transformer tap settings) as a result of demand loss associated with UK industry changes or the effects of DG connected to their networks.
7 Design Philosophy of DNOs
Historically DNOs networks were predominantly passive in nature with the bulk of connections being demand driven. Generation was centrally connected to the transmission network with a minimal volume of generation at the lower distribution voltages. The one-way power flow with a demand-led voltage drop across the network dictated a design philosophy which made efficient use of the higher end of the voltage range to accommodate voltage drop to service the demand from existing and new load connections.
Utilising the higher end of the voltage range gave other operational benefits to a passive network. For example, network recovery following a fault event is improved with a higher voltage starting point, as more customers will be likely to receive a voltage within the specified limits during the abnormal running of the network. The effects of voltage flicker are also reduced with a higher voltage design.
The requirements of The Carbon Plan are changing the way the distribution networks operate. With geographically dispersed generation connected to their networks, DNOs are increasingly operating them in a more active way.
DNOs will increasingly need to use the whole of the voltage range available to them within the regulations to allow additional DG to connect efficiently. Power now flows in both
directions on the network and network operators need to be cognisant of both voltage limits, voltage drop due to demand connections and the voltage rise effect of DG connections. These limits are anticipated to occur on the same sections of network at different times of the day. For example, an LV network with high levels of domestic solar generation may experience voltages at the high end of the range at mid-day when generation is at a peak and demand is low, changing to a voltage at the lower end of the range in the evenings when generation is reduced but demand is higher.
Examples of some networks operating in this way and making use of the full voltage range were identified in Western Power Distribution’s LV Templates Project. Whilst they are very much the exception at present, it is expected that they will become more normal with the introduction of more Low Carbon Technologies (LCTs). Northern Powergrid’s CLNR project estimated the voltage headroom would be reached on a typical LV network when the Solar PV penetration reached 30%.
Scottish & Southern Energy Power Distribution have also seen this with DG enquiries where reinforcement has been required to solve voltage rise issues. In one specific example a 50kW generator was constrained back to 30kW whilst a section of low voltage network was reinforced. It would have been possible for the generator to export its full output to the network without reinforcement if the network was set a lower target design voltage.
8 Working within the existing UK limits of 230V +10/-6%
DNOs have made use of the full range of the existing limits when operating their networks, often as a result of the changing mix of generation and demand customers who are connected. As already stated, there are operational benefits to setting a relatively high target voltage for demand centric networks but this benefit must be balanced against the benefits for generators of a lower target voltage. Individual DNOs have made tactical changes as a result of the changing mix of connections experienced on specific parts of their networks.
Between 2005 and 2008, SP Energy Networks (SPM) introduced a new AVC setting regime for all primary (33/11kV) substations. The transformer target voltage settings were reduced by 1% (from 11.11kV to 11kV). This action was necessary to compensate for the rising population of DG which resulted in local LV voltage excursions beyond the upper statutory limit. Following these changes, few, if any, LV complaints were received as a result of this company wide initiative.
Western Power Distribution’s LV Templates project monitored extensive LV networks, with data showing that the low voltage network was operating generally towards the higher end of the voltage range. This was to be expected, as at this end of the voltage range there is an improved resilience for post-fault recovery and flicker control which helps DNOs manage their network. These benefits should not be discounted. The LV Templates work showed that there is scope to reduce the LV target voltage and continue to operate within the current limits set out in the ESQCR.
In Western Power Distribution’s South Wales area, the HV target voltage was reduced by 0.88% from 11.4kV ± 200V to 11.3kV ±165V at over 90 primary sites supplying over 600,000 customers. The voltage monitoring equipment installed as part of the LV Templates project was re-used to collect data over a 12 month period following the changes and was then analysed as part of the Voltage Reduction Analysis project.
This monitoring project was completed in 2016. The reduction in voltage led to a statistically significant reduction in total electricity consumption of 1.16% through the period. This includes both energy delivered and network losses. Similar reductions in maximum demand and reactive power delivered were also identified.
Since 2012 there has been a rolling programme in both Northern Powergrid’s licence areas to reduce the operating voltages at the 11kV and 20kV voltage levels. These have been reduced by 1.8% from 11.3kV to 11.1kV and 1.0% from 20.3kV to 20.1kV. As of early 2016 this has been undertaken on 127 primary sites, with no increasing trend of customers reporting low volts. The measures employed appear to have prevented an increasing trend of customers reporting high volts as more DG is connected to the networks.
As part of CLNR, Northern Powergrid undertook a feasibility study on installing on-load tap changers on the low voltage network. Distribution transformers are not normally connected to automation systems or able to accept on-load voltage changes through their tap-changers. Other DNO projects to investigate the effect of the reduction of voltage have generally made changes at the 33kV/11kV transformation level where the transformers and tap-changers are capable of on-load alteration and are controlled and monitored by SCADA systems.
The feasibility study concluded that the technology was in its infancy and needed additional development, however the principle of automated control at the lower voltages had the potential to be viable and cost effective. CLNR also showed that better control of existing assets can yield significant footroom and headroom, particularly for the voltage rise associated with solar PV with headroom increase of 3%.
Data from the SP Energy Networks’ Voltage Optimisation project has shown that there is opportunity to reduce voltage across a wide area. In order to accommodate increased DG on the 11kV network, the voltage was reduced by 3% from 11,000V to 10,670V at a primary site in Ruabon, North Wales. The site supplies 2,400 customers who would have all seen a reduction in the voltage supplied at LV. Substation monitoring at the source and remote feeder ends showed the effect of the change, with the LV network moving from an average of 250V to an average of 243V.
Electricity North West completed a project in 2014 which lowered the operating voltage at the 11kV busbars to leverage additional capacity for generators at low voltage and, to date, there have been no voltage complaints from customers which can be attributed to the change in target voltage.
9 Record of voltage compliance within the UK
All companies retain records of voltage complaints made by customers. Not all complaints relate to voltage levels or limits as voltage fluctuation and intermittent supply problems are all captured by the same mechanism. It should also be noted that when complaints are investigated only a proportion of them result in a confirmed deviation from the standards.
Although the number of complaints and extrapolated assumed compliance to ESQCR are not completely aligned, using data from 2014/2015, the level of justified voltage-related complaints received in all the DNO companies is low and shows a very high level of compliance with the standard (see Table 1). The apparent higher level of complaints recorded in Northern Ireland Electricity Networks is in part due to the logging process which varies from that of mainland UK DNOs. The apparent lower level of complaints recorded in UK Power Networks is in part due to the large number of underground cable-connected customers in the London DNO licence area, its largest and densest customer base. Supporting detail to Table 1 is given in Annex E.
DNO Voltage-related complaints
(percentage of total customer base)
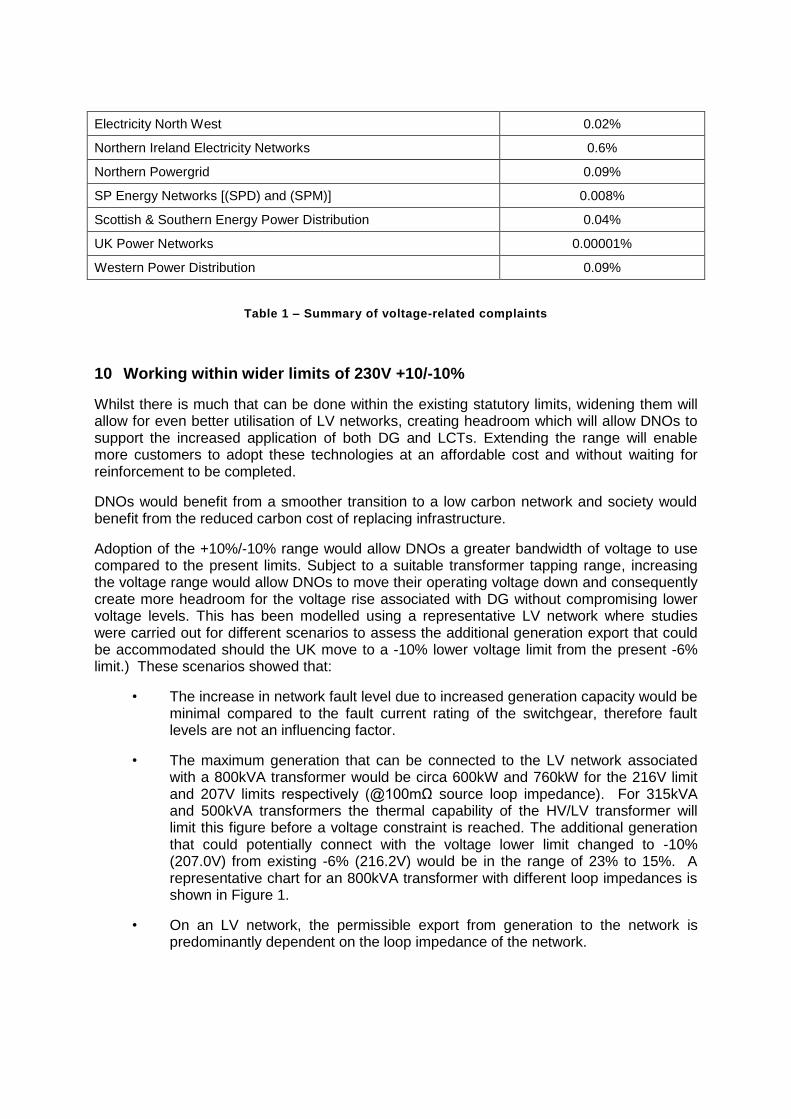
Electricity North West 0.02%
Northern Ireland Electricity Networks 0.6%
Northern Powergrid 0.09%
SP Energy Networks [(SPD) and (SPM)] 0.008%
Scottish & Southern Energy Power Distribution 0.04%
UK Power Networks 0.00001%
Western Power Distribution 0.09%
Table 1 – Summary of voltage-related complaints
10 Working within wider limits of 230V +10/-10%
Whilst there is much that can be done within the existing statutory limits, widening them will allow for even better utilisation of LV networks, creating headroom which will allow DNOs to support the increased application of both DG and LCTs. Extending the range will enable more customers to adopt these technologies at an affordable cost and without waiting for reinforcement to be completed.
DNOs would benefit from a smoother transition to a low carbon network and society would benefit from the reduced carbon cost of replacing infrastructure.
Adoption of the +10%/-10% range would allow DNOs a greater bandwidth of voltage to use compared to the present limits. Subject to a suitable transformer tapping range, increasing the voltage range would allow DNOs to move their operating voltage down and consequently create more headroom for the voltage rise associated with DG without compromising lower voltage levels. This has been modelled using a representative LV network where studies were carried out for different scenarios to assess the additional generation export that could be accommodated should the UK move to a -10% lower voltage limit from the present -6% limit.) These scenarios showed that:
• The increase in network fault level due to increased generation capacity would be minimal compared to the fault current rating of the switchgear, therefore fault levels are not an influencing factor.
• The maximum generation that can be connected to the LV network associated with a 800kVA transformer would be circa 600kW and 760kW for the 216V limit and 207V limits respectively (@100mΩ source loop impedance). For 315kVA and 500kVA transformers the thermal capability of the HV/LV transformer will limit this figure before a voltage constraint is reached. The additional generation that could potentially connect with the voltage lower limit changed to -10% (207.0V) from existing -6% (216.2V) would be in the range of 23% to 15%. A representative chart for an 800kVA transformer with different loop impedances is shown in Figure 1.
• On an LV network, the permissible export from generation to the network is predominantly dependent on the loop impedance of the network.
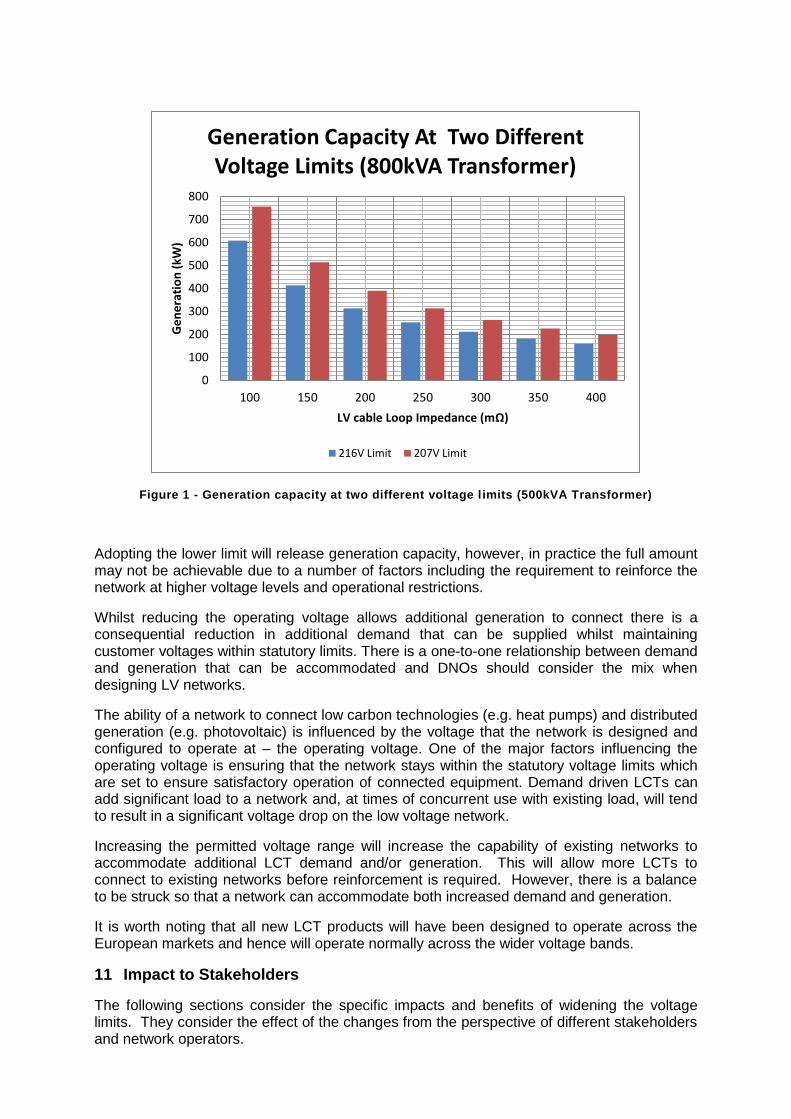
Figure 1 - Generation capacity at two different voltage l imits (500kVA Transformer)
Adopting the lower limit will release generation capacity, however, in practice the full amount may not be achievable due to a number of factors including the requirement to reinforce the network at higher voltage levels and operational restrictions.
Whilst reducing the operating voltage allows additional generation to connect there is a consequential reduction in additional demand that can be supplied whilst maintaining customer voltages within statutory limits. There is a one-to-one relationship between demand and generation that can be accommodated and DNOs should consider the mix when designing LV networks.
The ability of a network to connect low carbon technologies (e.g. heat pumps) and distributed generation (e.g. photovoltaic) is influenced by the voltage that the network is designed and configured to operate at – the operating voltage. One of the major factors influencing the operating voltage is ensuring that the network stays within the statutory voltage limits which are set to ensure satisfactory operation of connected equipment. Demand driven LCTs can add significant load to a network and, at times of concurrent use with existing load, will tend to result in a significant voltage drop on the low voltage network.
Increasing the permitted voltage range will increase the capability of existing networks to accommodate additional LCT demand and/or generation. This will allow more LCTs to connect to existing networks before reinforcement is required. However, there is a balance to be struck so that a network can accommodate both increased demand and generation.
It is worth noting that all new LCT products will have been designed to operate across the European markets and hence will operate normally across the wider voltage bands.
11 Impact to Stakeholders
The following sections consider the specific impacts and benefits of widening the voltage limits. They consider the effect of the changes from the perspective of different stakeholders and network operators.
0
100
200
300
400
500
600
700
800
100 150 200 250 300 350 400
Ge
ne
rati
on
(kW
)
LV cable Loop Impedance (mΩ)
Generation Capacity At Two Different Voltage Limits (800kVA Transformer)
216V Limit 207V Limit
11.1 Impact on customer’s equipment
Any change to statutory voltage limits could potentially have an impact on equipment that is already connected to the network. DNOs can model their own networks but needed to engage with stakeholders to investigate the effect on appliances and equipment. Using contacts provided by BEAMA/GAMBICA, we have surveyed 328 companies who design and manufacture electrical equipment for use in the UK. We asked manufacturers how a change to the statutory voltage limits would affect them, and what issues it would bring. 53 companies replied to the survey and their comments are summarised below.
With regard to problems being foreseen, 89% of respondents confirmed that they did not expect to see problems with a change to voltage within the BS EN 50160 limits. When asked about any longer term issues that may develop as a result, 96% of respondents confirmed that there would be no expected issues as they are already designed to 230V.
One area of concern related to older equipment through the compounded impact of the customer’s wiring voltage drop in addition to the change to voltage at the supply terminals. The example given was older contactors predating 1988 which were designed for a 240V supply with a 85% to 110% tolerance taking the lower limit to 204V below which chattering may occur or coils may fail to latch. If DNOs utilised the full lower voltage range to 207 V there may be issues with contactors within a customer’s installation and hence subject to a further voltage drop.
As a result of the survey, BEAMA/GAMBICA set up a working group of interested companies to discuss the comments that were raised. Through more detailed discussion the working group was able to establish that there were no significant issues with a proposed change.
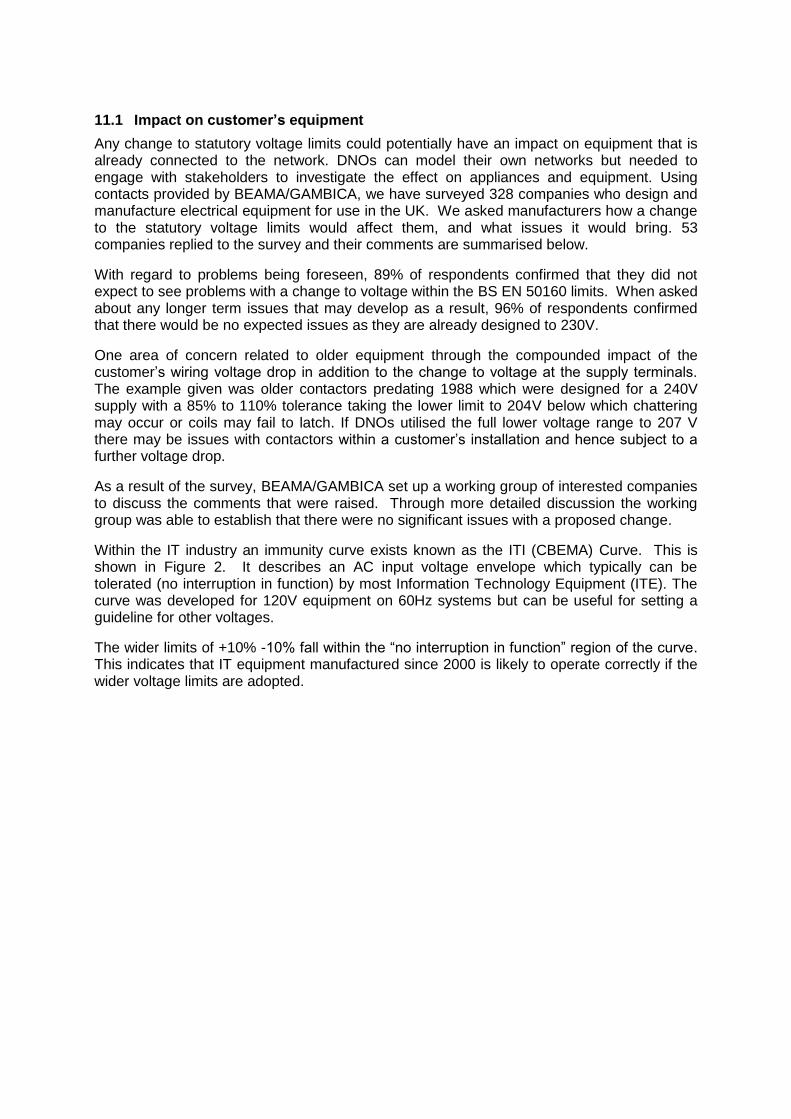
Within the IT industry an immunity curve exists known as the ITI (CBEMA) Curve. This is shown in Figure 2. It describes an AC input voltage envelope which typically can be tolerated (no interruption in function) by most Information Technology Equipment (ITE). The curve was developed for 120V equipment on 60Hz systems but can be useful for setting a guideline for other voltages.
The wider limits of +10% -10% fall within the “no interruption in function” region of the curve. This indicates that IT equipment manufactured since 2000 is likely to operate correctly if the wider voltage limits are adopted.
Figure 2 – ITI (CBEMA) Curve
11.2 Impact on the National Electricity Transmission System
Changes to voltage levels at the customer’s terminals will impact active and reactive demand on the LV network. Wide scale implementation of this change will be expected to be achieved by variations on the HV network and will have some impact at higher voltage levels up to the transmission system. These impacts include the following:
(a) Arrangements for Demand Reduction
Under OC6 of the Grid Code, the System Operator may instruct a DNO to reduce the demand within their distribution network. DNOs are expected to respond to this instruction in discrete stages. The first two stages of demand reduction can be achieved by reducing voltages by 2% to 4% (for each stage) with each stage resulting in expectation of demand being reduced by around 1.5% (3% in total). Further demand reduction is expected to be achieved via demand disconnection.
With voltage levels at the customer’s terminals being closer to the minimum statutory limit, DNOs will have two options in carrying out the instruction.
- The first option is to try to remain within the statutory voltage limits. This increases the likelihood that the DNO will carry out the demand reduction instruction by disconnecting customers.
- The second option is to accept that the voltage at customer’s terminals could fall below the lower statutory voltage limit. This could result in embedded generation being tripped by their under voltage relays, as required by ER G59 and G83. In areas with a high penetration level of embedded generation this could result in an overall increase in demand which undermines the DNO’s ability to carry out the emergency instruction and the System Operator’s ability to maintain the frequency stability of the transmission system.
It is of note that activation of OC6 constitutes a temporary emergency condition and hence statutory voltage limits do not apply during such events.
(b) Management of Transmission Voltage Levels
Voltage levels on the National Electricity Transmission System are influenced by the net reactive power exchange between the transmission and distribution systems at Grid Supply Points. An increase in the net reactive demand decreases voltage levels whereas a decrease in the net reactive demand increases voltage levels.
A reduction of voltage levels on the HV and the LV systems will result in a reduction of the reactive gain associated with these systems. However, this effect will be counteracted by a combination of a reduction in reactive demand, reductions in reactive losses, and lighter loading of distribution cables. The net effect on the net reactive demand at the Grid Supply Point will be the resultant of all these factors.
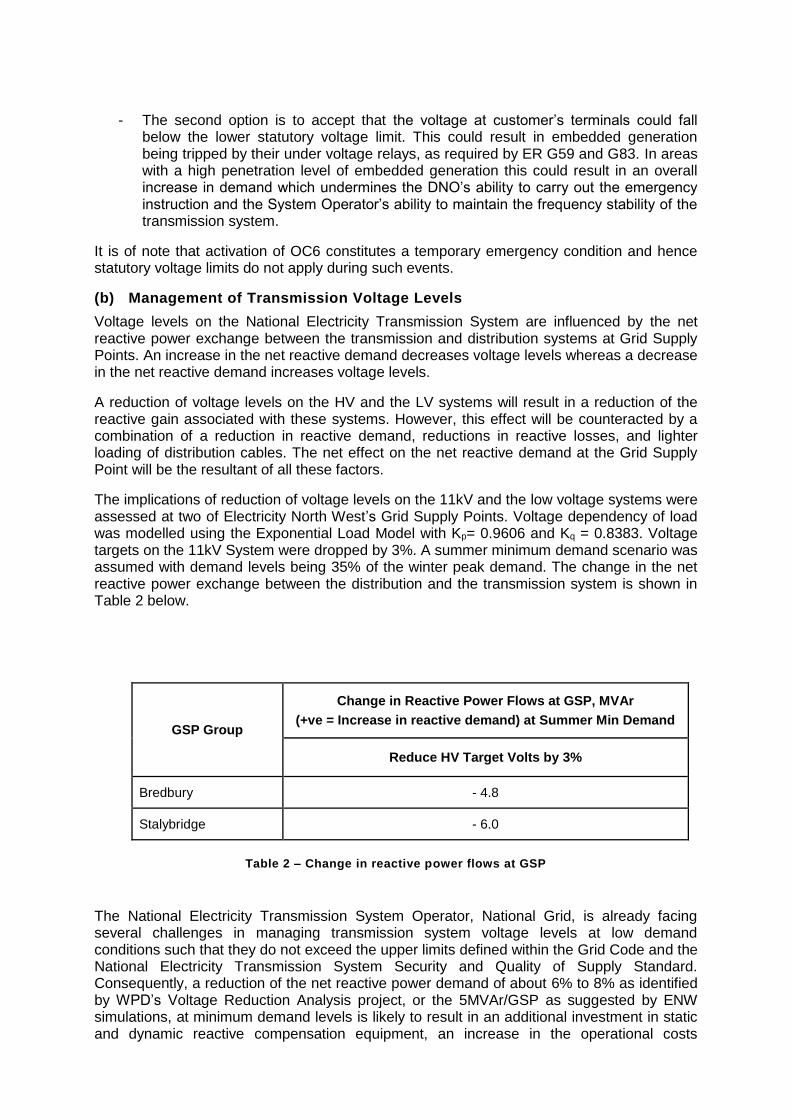
The implications of reduction of voltage levels on the 11kV and the low voltage systems were assessed at two of Electricity North West’s Grid Supply Points. Voltage dependency of load was modelled using the Exponential Load Model with Kp= 0.9606 and Kq = 0.8383. Voltage targets on the 11kV System were dropped by 3%. A summer minimum demand scenario was assumed with demand levels being 35% of the winter peak demand. The change in the net reactive power exchange between the distribution and the transmission system is shown in Table 2 below.
GSP Group
Change in Reactive Power Flows at GSP, MVAr
(+ve = Increase in reactive demand) at Summer Min Demand
Reduce HV Target Volts by 3%
Bredbury - 4.8
Stalybridge - 6.0
Table 2 – Change in reactive power flows at GSP
The National Electricity Transmission System Operator, National Grid, is already facing several challenges in managing transmission system voltage levels at low demand conditions such that they do not exceed the upper limits defined within the Grid Code and the National Electricity Transmission System Security and Quality of Supply Standard. Consequently, a reduction of the net reactive power demand of about 6% to 8% as identified by WPD’s Voltage Reduction Analysis project, or the 5MVAr/GSP as suggested by ENW simulations, at minimum demand levels is likely to result in an additional investment in static and dynamic reactive compensation equipment, an increase in the operational costs
associated with voltage management, or a combination of both. In addition this may result in additional reactive power control requirements on DG.
(c) Increased loss of infeed risk following faults on the National Electricity Transmission System
Some events on the transmission system such as faults, will be reflected on the distribution system in the form of short term voltage dips during the event followed by an enduring voltage step change of up to +6%/-12%. Such events should not unnecessarily result in loss of infeed from DNO connected DG.
Voltage step changes taking place on the transmission system will quickly propagate through the different voltage levels until they reach customers terminals on the low voltage network. Typically, 132kV/33kV transformers and 33kV/11kV transformers are equipped with on-load tapchangers which will react, several minutes following fault clearance, to restore the voltage levels at different points closer to their pre-fault values.
This effect was evaluated using a typical 11kV and 400V distribution network design rules and applying an event such as switching a reactor in or tripping a supergrid transformer off the network. These events reduce the voltage of the 132kV busbar by 12% with a subsequent drop on the 11kV and 400V system of 9.48% (taking transfer coefficients into consideration). The effect of this event is an immediate voltage reduction at all other voltage levels followed by a voltage restoration due to the reaction of on-load tapchangers. The effect of the post event, pre tapchanger operation is shown in Annex D Table D1.
For the purposes of this case study, a HV target voltage set point of 10.5kV was modelled to give a worst-case scenario on both the HV and LV networks. However, in practice this would likely be achieved with an equivalent reduction using a combination of HV or LV transformer re-tapping and target voltage reduction. Using this target voltage resulted in the potential loss of DG due to the operation of under-voltage relays in accordance with EREC G59 and EREC G83. If the voltage set point is to be further reduced below this value, the risk of inadvertent tripping of DG following a transmission system fault will increase.
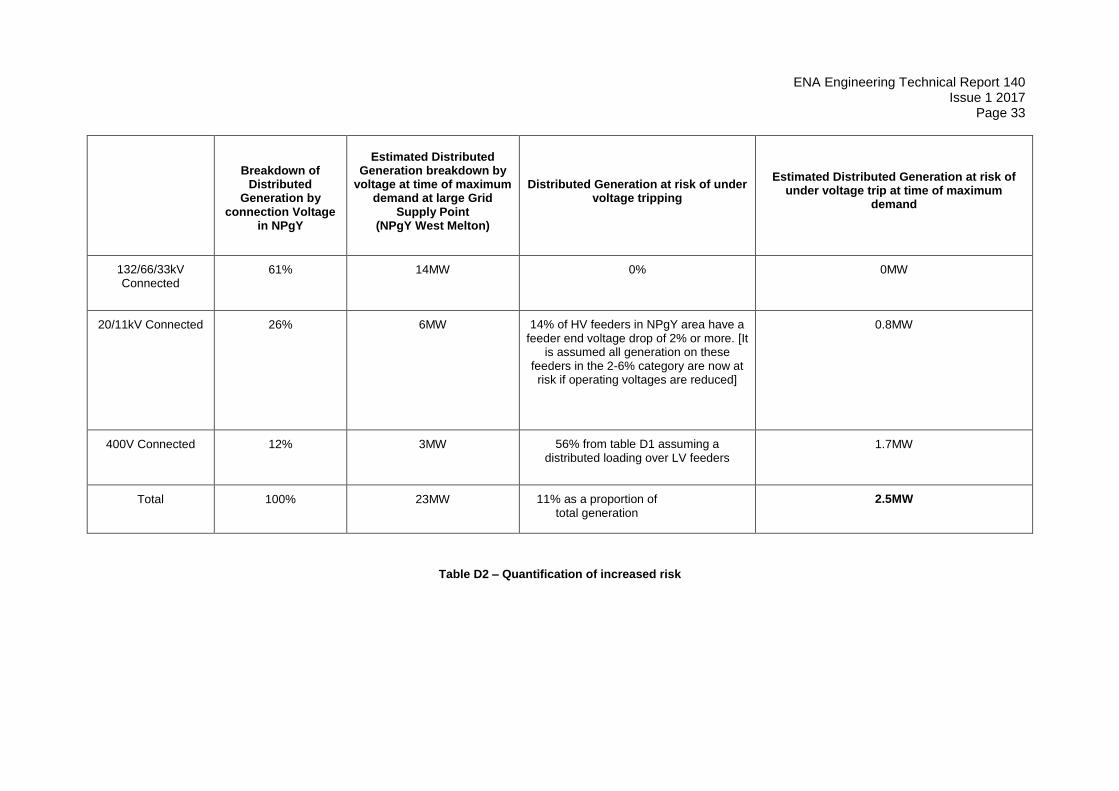
Table D2 in Annex D shows the estimated risk of DG tripping by under voltage relays at peak demand conditions on a large grid supply point4 in the Northern Powergrid Yorkshire licence area.. At this grid supply point the maximum demand is approximately 330MW and is estimated to have a 23MW of DG contribution at times of maximum demand.
This estimate assumes the DNO has reduced the target voltage of LV substations by approximately 4%, from around 240 to 230V. Due to the mix of demand and generation it is unlikely that target voltages would be dropped this much. Table D2 also ignores the increases in voltages caused by the associated demand reduction. It is predicted that the 2.54MW loss of distributed generation will be more than compensated by the voltage dependency of the connected load on the GSP which would likely have reduced by between 30-40MW for a short period (based on a linear power voltage relationship).
It is noted that the risk is likely to be low at very low output of embedded generation, as the drop in demand is more likely to exceed the generation disconnected, and at very high output of embedded generation, as the voltage will be higher than the undervoltage protection settings. However, the maximum risk will be at an intermediate level of embedded generation output. Hence, it is difficult to draw general conclusions based on a maximum demand scenario.
————————— 4 West Melton.
11.3 Impact on Embedded Generation
The flexibility of operation at any voltage setting within the existing statutory voltage range and the potential reduction in the lower limit will accelerate the connection of embedded generation and reduce the need to reinforce the distribution network in response to these connections. For generation connected above LV, the reduced voltages may make it more difficult for embedded generation to ride through transmission system faults and the need to install additional reactive power compensation equipment arising from the reduction in the net transmission system reactive power demand may restrict the connection of this embedded generation or require it to have stricter reactive power control requirements.
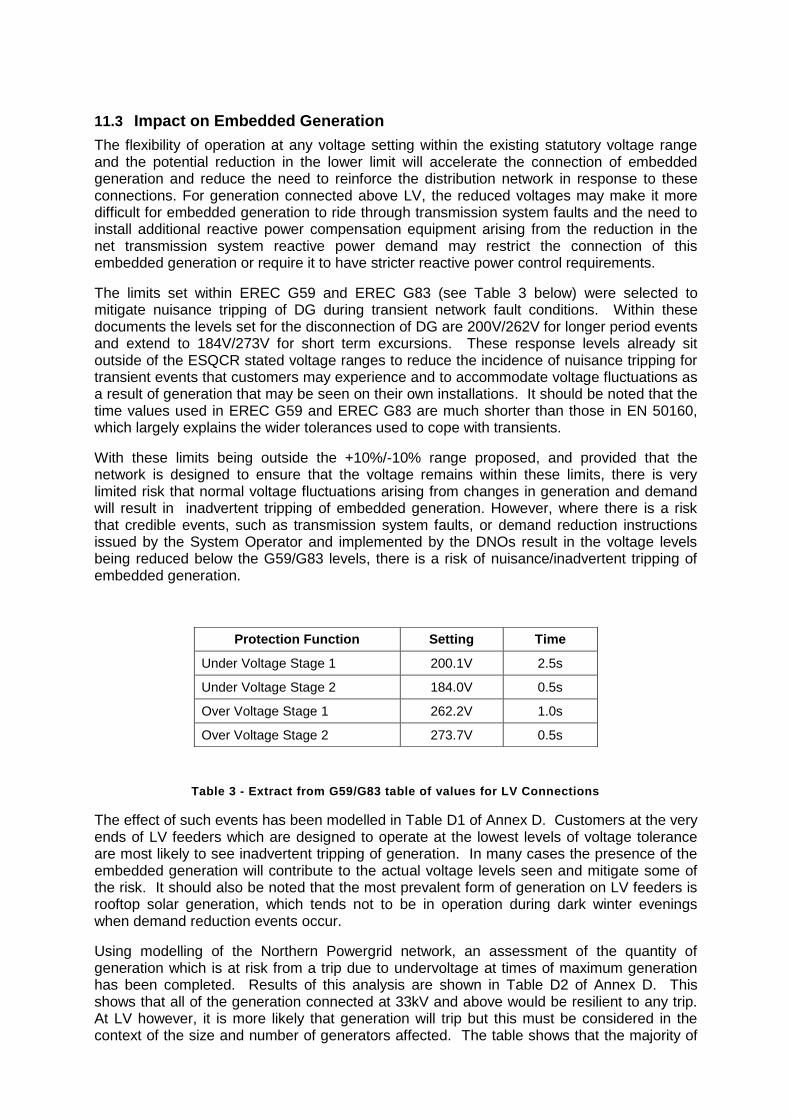
The limits set within EREC G59 and EREC G83 (see Table 3 below) were selected to mitigate nuisance tripping of DG during transient network fault conditions. Within these documents the levels set for the disconnection of DG are 200V/262V for longer period events and extend to 184V/273V for short term excursions. These response levels already sit outside of the ESQCR stated voltage ranges to reduce the incidence of nuisance tripping for transient events that customers may experience and to accommodate voltage fluctuations as a result of generation that may be seen on their own installations. It should be noted that the time values used in EREC G59 and EREC G83 are much shorter than those in EN 50160, which largely explains the wider tolerances used to cope with transients.
With these limits being outside the +10%/-10% range proposed, and provided that the network is designed to ensure that the voltage remains within these limits, there is very limited risk that normal voltage fluctuations arising from changes in generation and demand will result in inadvertent tripping of embedded generation. However, where there is a risk that credible events, such as transmission system faults, or demand reduction instructions issued by the System Operator and implemented by the DNOs result in the voltage levels being reduced below the G59/G83 levels, there is a risk of nuisance/inadvertent tripping of embedded generation.
Table 3 - Extract from G59/G83 table of values for LV Connections
The effect of such events has been modelled in Table D1 of Annex D. Customers at the very ends of LV feeders which are designed to operate at the lowest levels of voltage tolerance are most likely to see inadvertent tripping of generation. In many cases the presence of the embedded generation will contribute to the actual voltage levels seen and mitigate some of the risk. It should also be noted that the most prevalent form of generation on LV feeders is rooftop solar generation, which tends not to be in operation during dark winter evenings when demand reduction events occur.
Using modelling of the Northern Powergrid network, an assessment of the quantity of generation which is at risk from a trip due to undervoltage at times of maximum generation has been completed. Results of this analysis are shown in Table D2 of Annex D. This shows that all of the generation connected at 33kV and above would be resilient to any trip. At LV however, it is more likely that generation will trip but this must be considered in the context of the size and number of generators affected. The table shows that the majority of
Protection Function Setting Time
Under Voltage Stage 1 200.1V 2.5s
Under Voltage Stage 2 184.0V 0.5s
Over Voltage Stage 1 262.2V 1.0s
Over Voltage Stage 2 273.7V 0.5s
generation connected to the Northern Powergrid is connected to the 33kV network, this is representative of the connections in other DNOs.
The inadvertent tripping of DG following a transmission system fault will increase the frequency dip that results from the fault. Where the volume of generation tripped by the fault, including both generation that is directly affected by the fault and that that has been inadvertently disconnected by under-voltage relays, exceeds the maximum loss of infeed risk on the transmission system at the time of the fault, the frequency dip will exceed the acceptable operational limits and may result in frequency instability, loss of demand, or complete system shutdown.
It should be noted that DNOs are likely to only set low substation voltages where high levels of DG are connected. The presence of this DG will help support the local voltage levels and mitigate the risk of wider voltage reduction. However, in order to guarantee the adequate level of security of supply, the degree of risk has to be assessed and the potential mitigation measures may have to be identified by the System Operator and the DNO before voltage set points are reduced on sections of the network. This may require a re-assessment of ER G59 and ER G83 protection settings for future installations.
11.4 Benefits to customers
An increased voltage range will increase a DNO’s ability to react to changes in the future mix of generation and demand seen on networks. As a result of The Carbon Plan, customers are likely to increase the amount of DG connected to distribution networks with a potentially increased output from that generation. If DNOs are able to accept this additional generation whilst also deferring reinforcement projects as a result of the increased range there will be a corresponding deferral of DUOS charges which feed through to customers’ bills. There is also a certain amount of anecdotal evidence of an increased electrical appliance life as a result of a lower operating voltage.
The work carried out in South Wales demonstrated that the 0.88% voltage reduction gave a 1.16% reduction in energy consumption. This reduction in consumption has a value of around £14.6 million per annum across South Wales, or around £13 per customer. The LV Templates project estimated that this saving would extrapolate to around £147m across the UK. Using the value of 1.16% from the Voltage Reduction Assessment Project, the DUKES domestic consumption figure for 2015 and the DECC stated unit cost of 15.52p, the savings are calculated at £168m per annum across the UK.
Operating at a higher voltage target offers improved resilience for post fault recovery and flicker control. Reducing the target voltage or using the lower end of the range will have an effect on this level of resilience. Industrial customers who are still using 240V contactor controlled equipment may see a higher level of equipment tripping as the lower end of the voltage range when faults or other low volt disturbances occur. If the voltage reduction is carried out at HV, the implications for HV customers will also need to be considered.
Increased investment on the National Electricity Transmission System, in the form of reactive compensation equipment, and increased operational costs associated with managing voltage levels during low demand periods will feed through to the customers’ bills.
11.5 Impacts on DNOs
To make use of a wider voltage range DNOs will need to amend their voltage settings at points on the network where voltage is set and managed. This is a manual task normally at primary substations where HV networks receive their supply. At these sites voltage setting relays and tap change relays will require reconfiguration or replacement. This work will take time to complete and may create a cost to customers where older equipment requires replacement.
Within the UK there are 7,210 substations that would require a visit. Most DNOs would complete the task to reconfigure as a part of other planned protection system works and would take up to three years to complete. Amending the voltage set point will alter the voltage to a relatively large number of customers (around 15,000 to 20,000 per site) and there is a real likelihood that customers at the extremities of distribution networks would require additional work to ensure that they also remain within limits. There may be specific areas of DNOs’ networks where it is not possible to amend the voltage set point and then mitigate the voltage change on remote distribution transformers.
Changes in operating voltages will have effects on network losses. These are proportional to the square of the current and for a fixed power load will increase as voltage decreases. However, as shown in Western Power Distribution’s Voltage Reduction project, reducing voltage also reduces total consumption. The level of reduction in demand was sufficient that the increase in losses from running at a lower voltage was offset by the reduction due to the reduced loading. As such the absolute value of losses dropped while the percentage value increased.
12 Summary
Widening the voltage limits range has a range of benefits and impacts to stakeholders. Not all stakeholders will see a benefit but the societal benefit of a wider range and lower target voltage will be significant. The Voltage Reduction Project has estimated annual savings of £14.6m across South Wales with an extrapolation to £168m per annum across the UK. The CLASS project has also predicted savings in deferred investment of £90.3m up to 2030. National Grid expects that the equipment required to manage the reduction in VArs per GSP could include STATCOMs and shunt reactors at costs of around £1.5m to £5m per GSP site. It is unclear whether all GSP sites will be affected or whether other mitigations on the DNO networks may offer a more economical solution. Reducing the HV target voltage will, however, have a negative impact on the transmission system in that it will reduce the effectiveness of Demand Control via voltage reduction such that demand disconnection is more likely to be required; it will reduce the reactive power drawn from the transmission system exacerbating the voltage rise issues currently faced by National Grid and an increased risk from inadvertent tripping of DG.
Taking all of this into account it is likely that the annual savings to customers and the capital deferment of £90m shown from the CLASS project would provide a benefit to customers even when taken into consideration with potential expenditure on the National Grid network.
Research projects to date have shown that there is a benefit in reducing the target voltage on Low Voltage networks. They have also demonstrated that the most effective way of achieving this reduction is through the on-load tapchangers at primary substations. So far DNOs have implemented reductions of a few percentage points, which leave scope for further reductions within current limits as DNOs adopt techniques highlighted in this document. At some time in the future DNOs will be in the position that they have exhausted the range of the current limits and will require wider limits to exploit any further potential benefits. With this in mind, and the expected timescale of any legislative changes, it is imperative that this topic is discussed now to avoid delays as and when the current limits are reached and require alteration.
13 Recommendations
Recommendation 1 It is recommended that the ENA embark on a programme of consultation to understand the wider views within the UK regarding voltage limits and a wider voltage range. Within the Statutory Voltage Limits Task Group the membership has included Network Operators, BEIS, Ofgem and BEAMA. Stakeholder engagement should include industry partners and also a wider more general engagement to include customer groups, Suppliers and other interested
parties. Consultation should following the engagement model used for changes to the Distribution Code. Recommendation 2 Subject to the outcome of the consultation supporting a change, to exploit the benefits of the wider range of voltage allowed within BS EN 50160, the voltage limits specified in the Electricity Safety Quality and Continuity Regulations should be widened from 230V+10%-6% to 230V +/-10%. Recommendation 3 To publish Engineering Recommendation (EREC) – Voltage Measurements for Assessment of Compliance with Statutory Voltage Limits It is noted that Recommendation 2 will take time to complete, especially if there is a requirement for the regulations to change in order to accommodate the revision. In the meantime, DNOs should continue to make use of the full range of voltage available within the current regulations as required on their networks, whilst taking account the impact on customers and the electricity network as a whole.
ENA Engineering Technical Report Issue 1 2017 Page 22
Annex A - Terms of Reference
Electricity Networks and Futures Group
ENFG Task Group – Statutory Voltage Limits - Final Draft Terms of Reference (Paper by David Crawley) 1. Introduction
ENFG decided to establish a Task Group on Statutory Voltage Limits (Paper ENFG 106 refers). Three meetings have already been held, and alongside progressing the work, the original draft terms of reference have been discussed and modified within the Task Group. ENFG are invited to endorse the final draft ToR as outlined below.
2. Purpose and Aim
The purpose of the Task Group is to review the current lower bound of the statutory voltage limits on the low voltage network and specifically at LV customers’ terminals as dictated via the Electricity Safety, Quality and Continuity Regulations (ESQCR)5. Specifically the Task Group is to review changing the current lower bound from 6 per cent below to 10 per cent below so to align with the current European Standard. The Task Group should quantify the positive and negative aspects of such policy and practice changes on network operators, customers, generators and other stakeholders in terms of planning and operations.
3. Scope
The Task Group will liaise with those DNOs who are either scoping or engaged in trials on part of their network or engaged as business as usual activities, which will involve modifying target operating voltages in order to utilise the full range allowed by the present regulation i.e. 230V plus 10%, minus 6%. The Task Group will investigate the benefits already seen from changing the nominal voltage from 240V to 230V.
Based on the findings of the study, the Task Group will produce a summary report which will also include identifying the likely response by the DNOs in the event that the Statutory Limits were changed to 230V plus or minus 10% including the implications for stakeholders so that DECC can take an informed decision as to whether this would be a reasonable change to make. The Task Group will recommend how ESQCR voltage limits should be defined to reflect better the needs of both customers and the management of distribution systems. The roll out of smart metering may provide information to assist with this recommendation. It will also be necessary to establish whether operating the LV system at a lower operating voltage will i) provide more headroom for the connection of DG where high volts are often the constraining factor in connecting large amounts of DG to the LV network, and ii) create reduced headroom for the connection of the types and penetration levels of LCTs that are envisaged e.g. electric vehicles and heat pumps.
————————— 5 ESQCR Clause 27(3)(b) states that I’… in the case of a low voltage supply, a variation not exceeding 10 per
cent above or 6 per cent below the declared voltage at the declared frequency
Page 23 of 40
All DNOs have commented that they wish to explore the possibility of utilising the full voltage range available by reducing primary substation voltages. However, the Task Group will need to consider all issues including possible effects on the following:- • Motors • Generator control and protection settings • UPS Transfer • Dip tolerance for industrial customers • Customers with long sub mains • Interpretation of ESQCR limits given voltage control schemes in use • Equipment RMS voltage tolerance • System losses • Reduction in the capacity to accommodate Low Carbon Technologies such as EVs and Heat Pumps without network reinforcement or increased application of ANM / DSM • Reduced capability to accommodate the provision of Voltage Reduction under Grid Code OC6
Cable ratings
IDNO and embedded network voltage compliance
The effect on the overall transmission and distribution system of the lower MVArs generated by the 11kV and LV network due the lower operating voltages.
Existing or draft Network Codes
Rapid voltage changes – interaction with EREC P28 4. Deliverables
The target date for the production of a final report to ENFG is end March 2016. .
5. Reporting
The Task Group will report quarterly to ENFG and will liaise with the PQ/EMC Co-ordination Group. (It is expected that a number of the Task Group members will also be members of the PQ/EMC Co-ordination Group.)
6. Membership & Logistics The Task Group will consist of representatives from DNOs, IDNOs and National Grid. DECC and other key stakeholders, including manufacturers, will be invited to attend.
7. Compliance The Group will at all times comply with the requirements of the 1998 Competition Act and will not deal with any matter which will or is likely to prevent, restrict or distort competition or constitute an abuse of a dominant position as construed within the Act.
ENA Engineering Technical Report 140 Issue 1 2017 Page 24
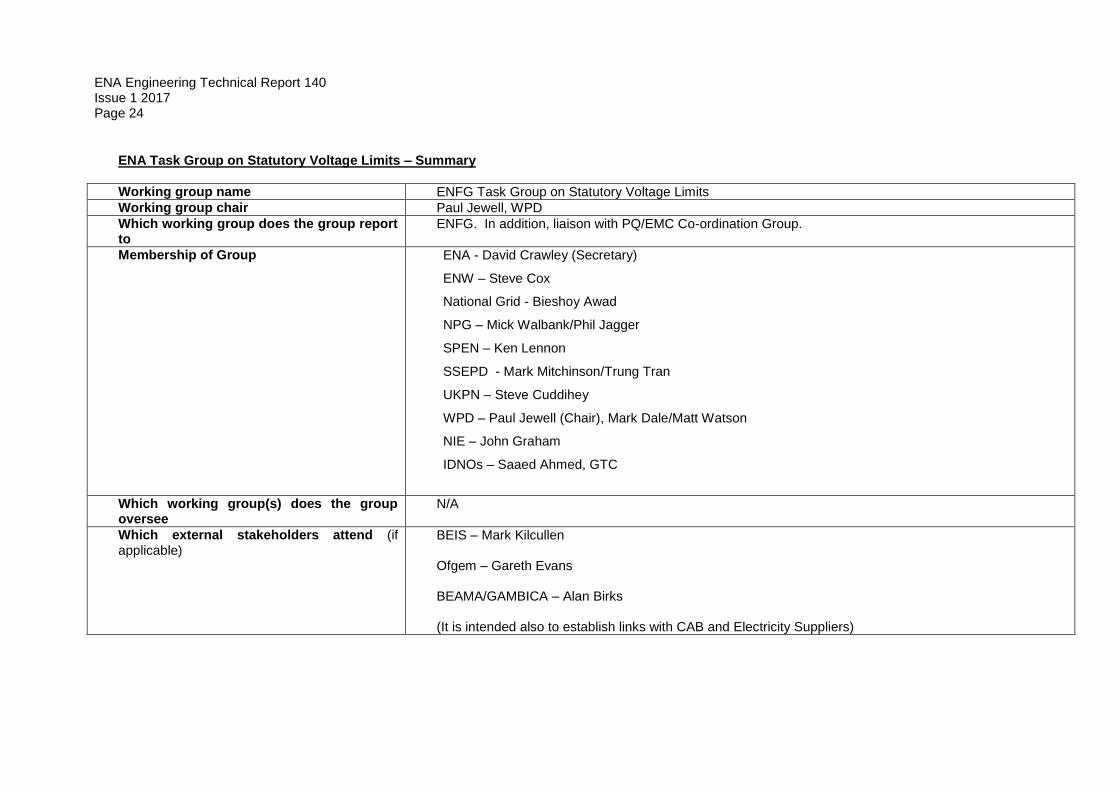
ENA Task Group on Statutory Voltage Limits – Summary
Working group name ENFG Task Group on Statutory Voltage Limits
Working group chair Paul Jewell, WPD
Which working group does the group report to
ENFG. In addition, liaison with PQ/EMC Co-ordination Group.
Membership of Group ENA - David Crawley (Secretary)
ENW – Steve Cox
National Grid - Bieshoy Awad
NPG – Mick Walbank/Phil Jagger
SPEN – Ken Lennon
SSEPD - Mark Mitchinson/Trung Tran
UKPN – Steve Cuddihey
WPD – Paul Jewell (Chair), Mark Dale/Matt Watson
NIE – John Graham
IDNOs – Saaed Ahmed, GTC
Which working group(s) does the group oversee
N/A
Which external stakeholders attend (if applicable)
BEIS – Mark Kilcullen Ofgem – Gareth Evans BEAMA/GAMBICA – Alan Birks (It is intended also to establish links with CAB and Electricity Suppliers)
Page 25 of 40
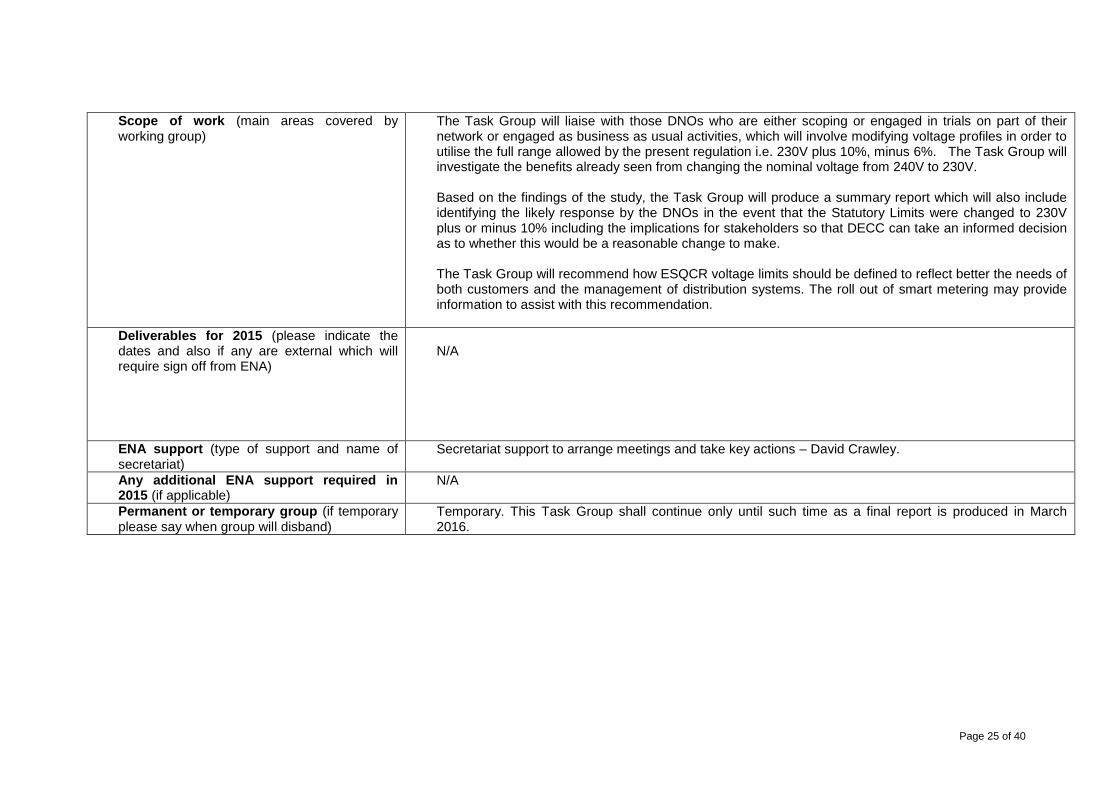
Scope of work (main areas covered by working group)
The Task Group will liaise with those DNOs who are either scoping or engaged in trials on part of their network or engaged as business as usual activities, which will involve modifying voltage profiles in order to utilise the full range allowed by the present regulation i.e. 230V plus 10%, minus 6%. The Task Group will investigate the benefits already seen from changing the nominal voltage from 240V to 230V.
Based on the findings of the study, the Task Group will produce a summary report which will also include identifying the likely response by the DNOs in the event that the Statutory Limits were changed to 230V plus or minus 10% including the implications for stakeholders so that DECC can take an informed decision as to whether this would be a reasonable change to make. The Task Group will recommend how ESQCR voltage limits should be defined to reflect better the needs of both customers and the management of distribution systems. The roll out of smart metering may provide information to assist with this recommendation.
Deliverables for 2015 (please indicate the dates and also if any are external which will require sign off from ENA)
N/A
ENA support (type of support and name of secretariat)
Secretariat support to arrange meetings and take key actions – David Crawley.
Any additional ENA support required in 2015 (if applicable)
N/A
Permanent or temporary group (if temporary please say when group will disband)
Temporary. This Task Group shall continue only until such time as a final report is produced in March 2016.
ENA Engineering Technical Report 140 Issue 1 2017 Page 26
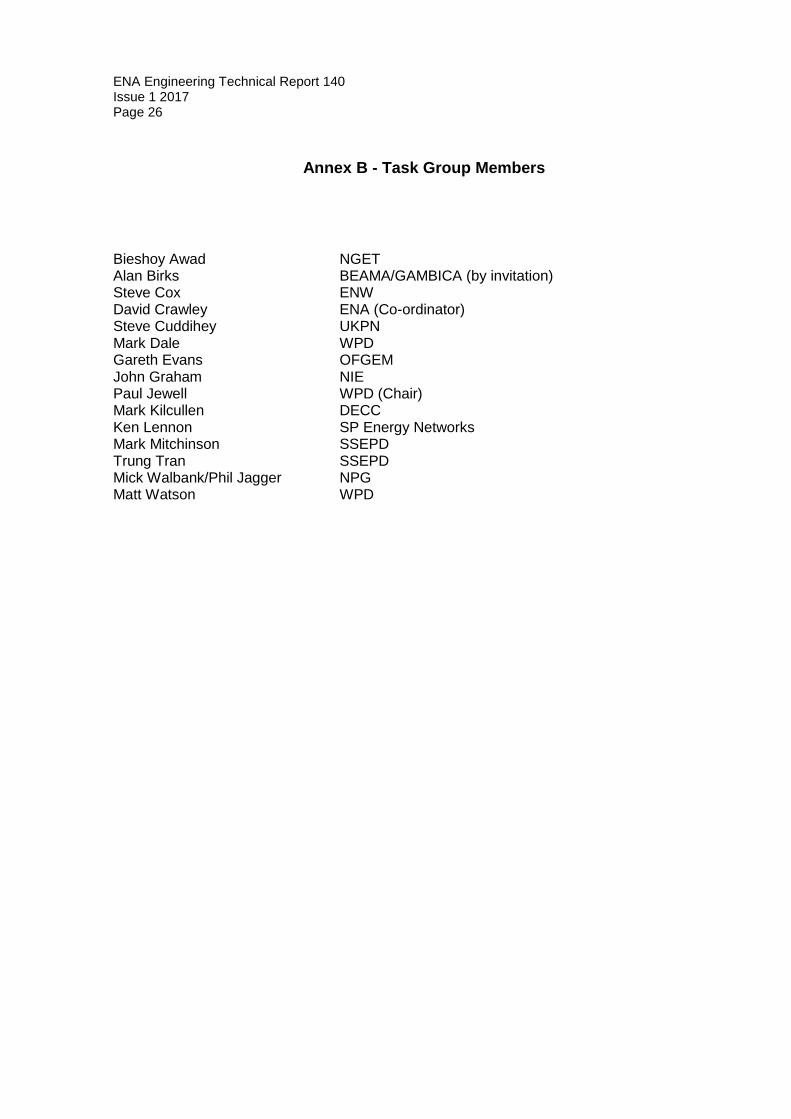
Annex B - Task Group Members
Bieshoy Awad NGET Alan Birks BEAMA/GAMBICA (by invitation) Steve Cox ENW David Crawley ENA (Co-ordinator) Steve Cuddihey UKPN Mark Dale WPD Gareth Evans OFGEM John Graham NIE Paul Jewell WPD (Chair) Mark Kilcullen DECC Ken Lennon SP Energy Networks Mark Mitchinson SSEPD Trung Tran SSEPD Mick Walbank/Phil Jagger NPG Matt Watson WPD
ENA Engineering Technical Report 140 Issue 1 2017
Page 27
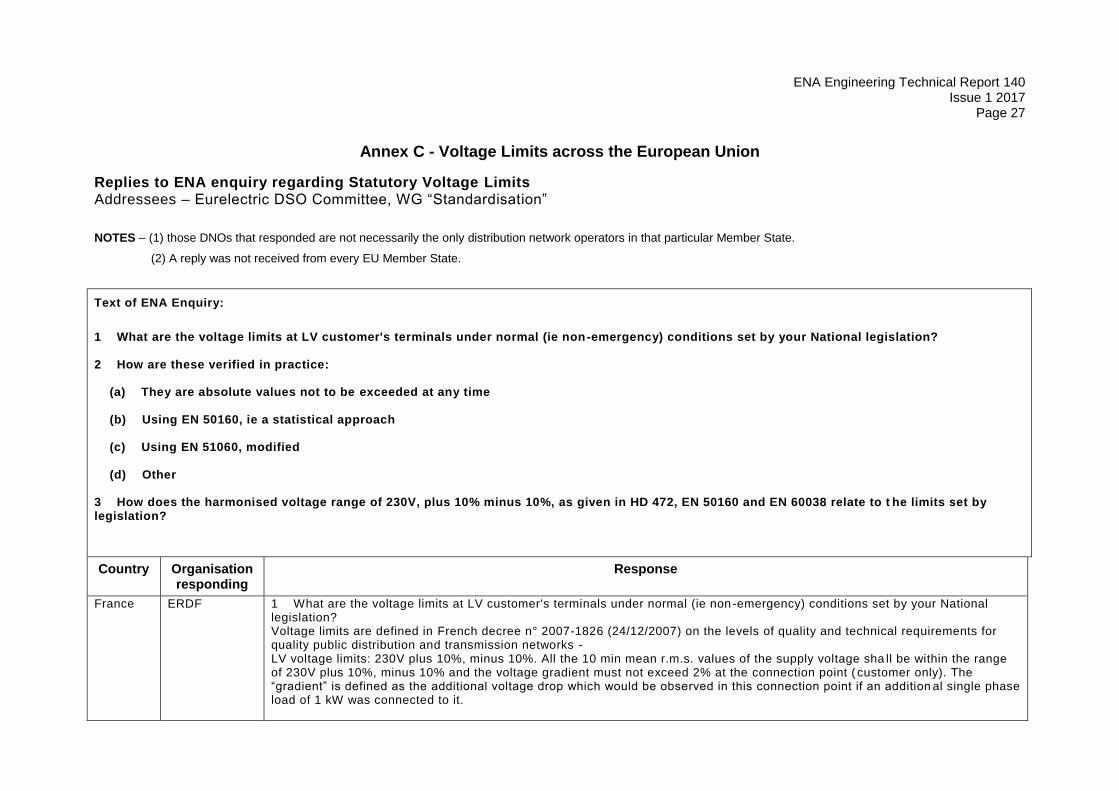
Annex C - Voltage Limits across the European Union
Replies to ENA enquiry regarding Statutory Voltage Limits Addressees – Eurelectric DSO Committee, WG “Standardisation”
NOTES – (1) those DNOs that responded are not necessarily the only distribution network operators in that particular Member State.
(2) A reply was not received from every EU Member State.
Text of ENA Enquiry:
1 What are the voltage limits at LV customer's terminals under normal (ie non-emergency) conditions set by your National legislation? 2 How are these verified in practice: (a) They are absolute values not to be exceeded at any time (b) Using EN 50160, ie a statistical approach (c) Using EN 51060, modified (d) Other 3 How does the harmonised voltage range of 230V, plus 10% minus 10%, as given in HD 472, EN 50160 and EN 60038 relate to t he limits set by legislation?
Country Organisation responding
Response
France ERDF 1 What are the voltage limits at LV customer's terminals under normal (ie non-emergency) conditions set by your National legislation? Voltage limits are defined in French decree n° 2007-1826 (24/12/2007) on the levels of quality and technical requirements for quality public distribution and transmission networks - LV voltage limits: 230V plus 10%, minus 10%. All the 10 min mean r.m.s. values of the supply voltage sha ll be within the range of 230V plus 10%, minus 10% and the voltage gradient must not exceed 2% at the connection point ( customer only). The “gradient” is defined as the additional voltage drop which would be observed in this connection point if an addition al single phase load of 1 kW was connected to it.
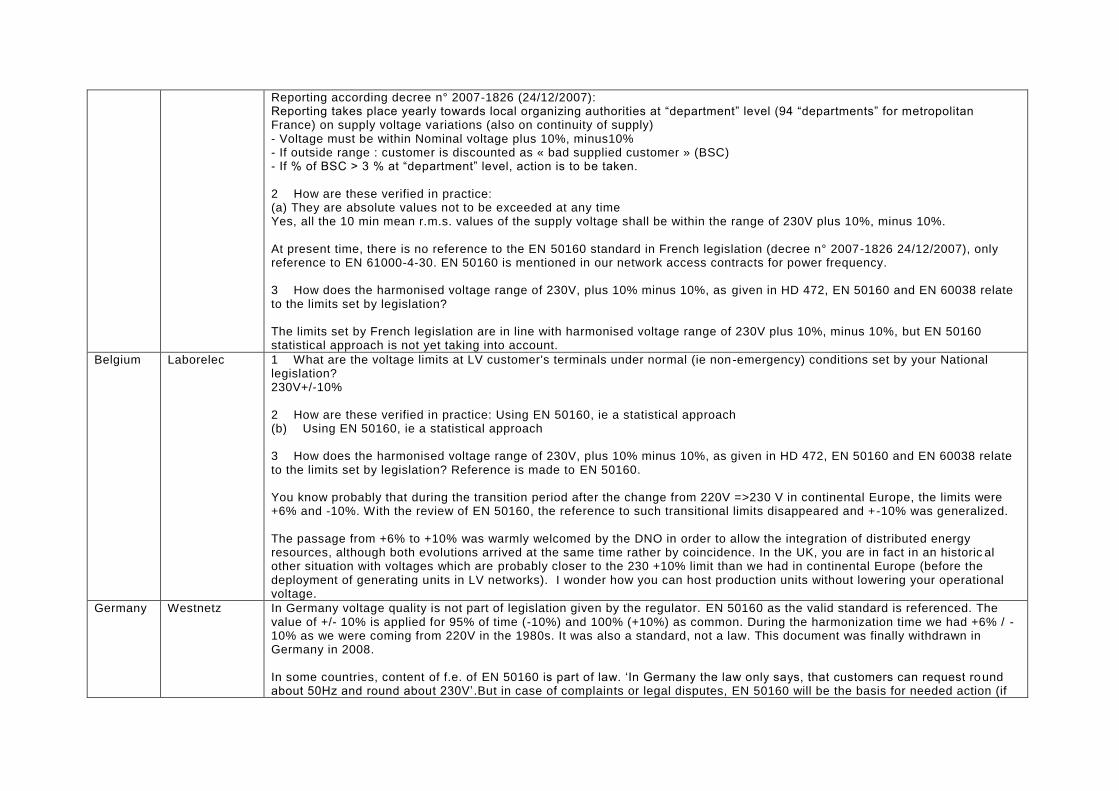
Reporting according decree n° 2007-1826 (24/12/2007): Reporting takes place yearly towards local organizing authorities at “department” level (94 “departments” for metropolitan France) on supply voltage variations (also on continuity of supply) - Voltage must be within Nominal voltage plus 10%, minus10% - If outside range : customer is discounted as « bad supplied customer » (BSC) - If % of BSC > 3 % at “department” level, action is to be taken. 2 How are these verified in practice: (a) They are absolute values not to be exceeded at any time Yes, all the 10 min mean r.m.s. values of the supply voltage shall be within the range of 230V plus 10%, minus 10%. At present time, there is no reference to the EN 50160 standard in French legislation (decree n° 2007-1826 24/12/2007), only reference to EN 61000-4-30. EN 50160 is mentioned in our network access contracts for power frequency. 3 How does the harmonised voltage range of 230V, plus 10% minus 10%, as given in HD 472, EN 50160 and EN 60038 relate to the limits set by legislation? The limits set by French legislation are in line with harmonised voltage range of 230V plus 10%, minus 10%, but EN 50160 statistical approach is not yet taking into account.
Belgium Laborelec 1 What are the voltage limits at LV customer's terminals under normal (ie non-emergency) conditions set by your National legislation? 230V+/-10% 2 How are these verified in practice: Using EN 50160, ie a statistical approach (b) Using EN 50160, ie a statistical approach 3 How does the harmonised voltage range of 230V, plus 10% minus 10%, as given in HD 472, EN 50160 and EN 60038 relate to the limits set by legislation? Reference is made to EN 50160. You know probably that during the transition period after the change from 220V =>230 V in continental Europe, the limits were +6% and -10%. With the review of EN 50160, the reference to such transitional limits disappeared and +-10% was generalized. The passage from +6% to +10% was warmly welcomed by the DNO in order to allow the integration of distributed energy resources, although both evolutions arrived at the same time rather by coincidence. In the UK, you are in fact in an historic al other situation with voltages which are probably closer to the 230 +10% limit than we had in continental Europe (before the deployment of generating units in LV networks). I wonder how you can host production units without lowering your operational voltage.
Germany Westnetz In Germany voltage quality is not part of legislation given by the regulator. EN 50160 as the valid standard is referenced. The value of +/- 10% is applied for 95% of time (-10%) and 100% (+10%) as common. During the harmonization time we had +6% / -10% as we were coming from 220V in the 1980s. It was also a standard, not a law. This document was finally withdrawn in Germany in 2008.
In some countries, content of f.e. of EN 50160 is part of law. ‘In Germany the law only says, that customers can request round about 50Hz and round about 230V’.But in case of complaints or legal disputes, EN 50160 will be the basis for needed action (if
ENA Engineering Technical Report 140 Issue 1 2017
Page 29
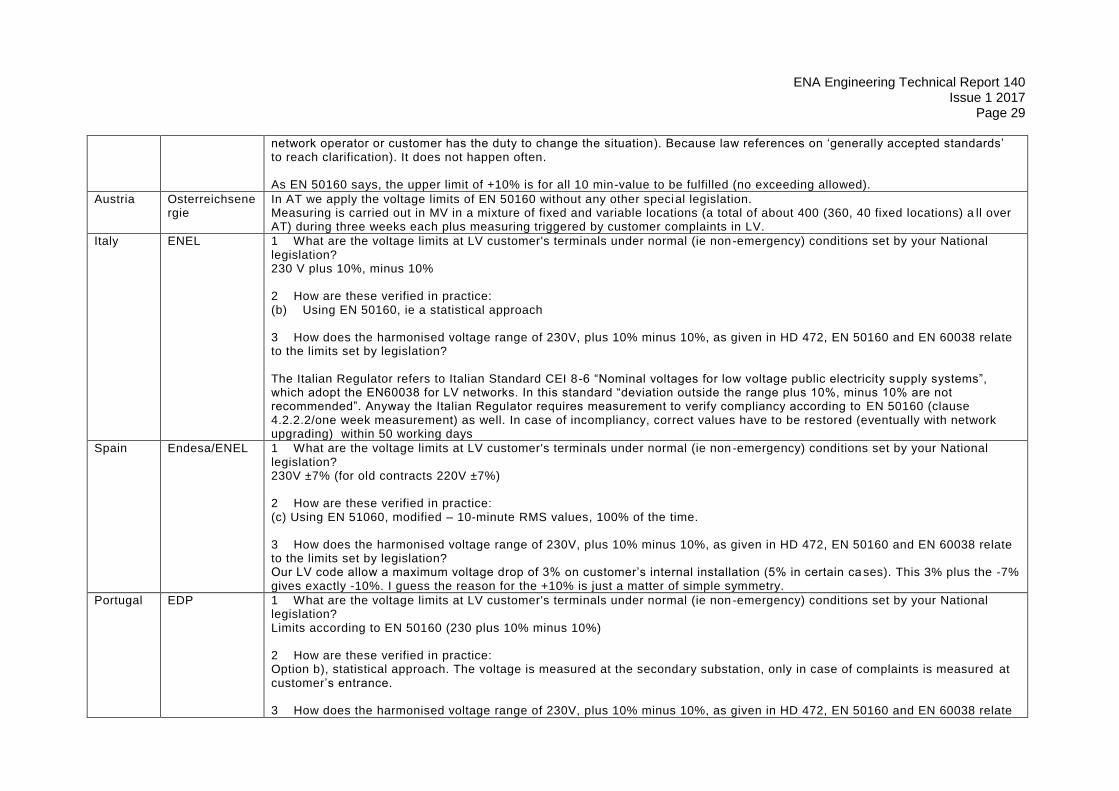
network operator or customer has the duty to change the situation). Because law references on ‘generally accepted standards’ to reach clarification). It does not happen often.
As EN 50160 says, the upper limit of +10% is for all 10 min-value to be fulfilled (no exceeding allowed).
Austria Osterreichsenergie
In AT we apply the voltage limits of EN 50160 without any other special legislation. Measuring is carried out in MV in a mixture of fixed and variable locations (a total of about 400 (360, 40 fixed locations) a ll over AT) during three weeks each plus measuring triggered by customer complaints in LV.
Italy ENEL 1 What are the voltage limits at LV customer's terminals under normal (ie non-emergency) conditions set by your National legislation? 230 V plus 10%, minus 10% 2 How are these verified in practice: (b) Using EN 50160, ie a statistical approach 3 How does the harmonised voltage range of 230V, plus 10% minus 10%, as given in HD 472, EN 50160 and EN 60038 relate to the limits set by legislation? The Italian Regulator refers to Italian Standard CEI 8-6 “Nominal voltages for low voltage public electricity supply systems”, which adopt the EN60038 for LV networks. In this standard “deviation outside the range plus 10%, minus 10% are not recommended”. Anyway the Italian Regulator requires measurement to verify compliancy according to EN 50160 (clause 4.2.2.2/one week measurement) as well. In case of incompliancy, correct values have to be restored (eventually with network upgrading) within 50 working days
Spain Endesa/ENEL 1 What are the voltage limits at LV customer's terminals under normal (ie non-emergency) conditions set by your National legislation? 230V ±7% (for old contracts 220V ±7%) 2 How are these verified in practice: (c) Using EN 51060, modified – 10-minute RMS values, 100% of the time. 3 How does the harmonised voltage range of 230V, plus 10% minus 10%, as given in HD 472, EN 50160 and EN 60038 relate to the limits set by legislation? Our LV code allow a maximum voltage drop of 3% on customer’s internal installation (5% in certain ca ses). This 3% plus the -7% gives exactly -10%. I guess the reason for the +10% is just a matter of simple symmetry.
Portugal EDP 1 What are the voltage limits at LV customer's terminals under normal (ie non-emergency) conditions set by your National legislation? Limits according to EN 50160 (230 plus 10% minus 10%) 2 How are these verified in practice: Option b), statistical approach. The voltage is measured at the secondary substation, only in case of complaints is measured at customer’s entrance. 3 How does the harmonised voltage range of 230V, plus 10% minus 10%, as given in HD 472, EN 50160 and EN 60038 relate
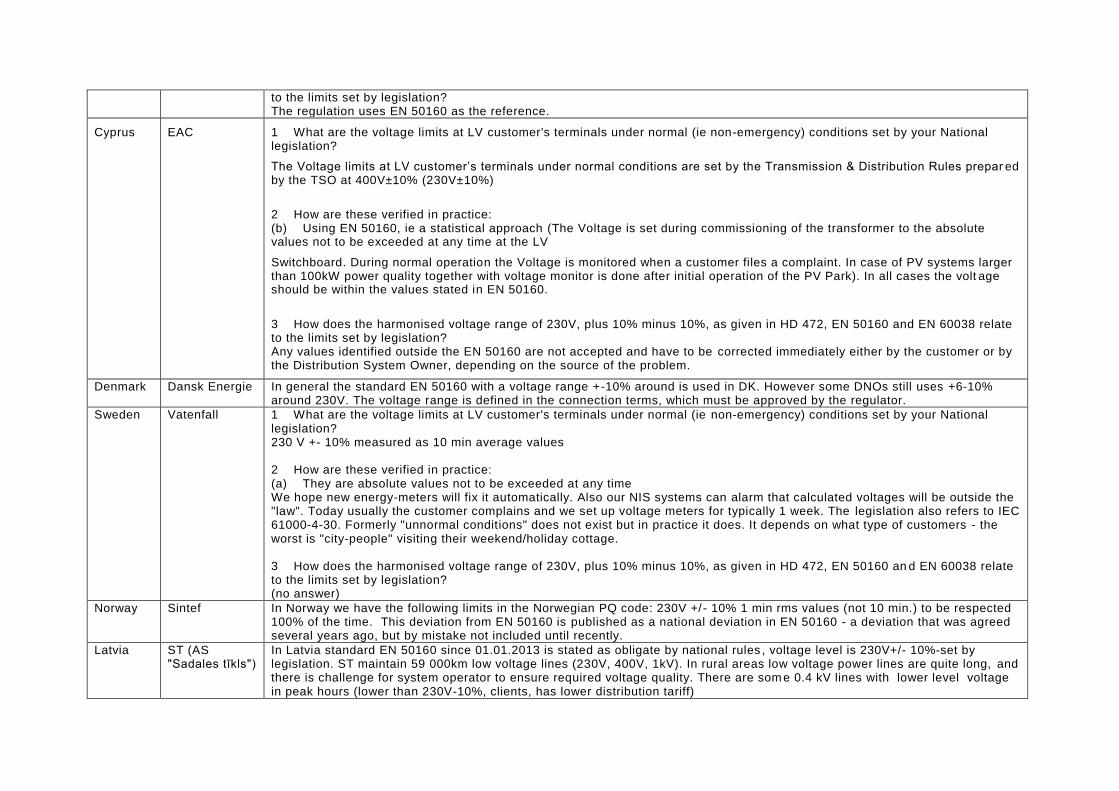
to the limits set by legislation? The regulation uses EN 50160 as the reference.
Cyprus EAC 1 What are the voltage limits at LV customer's terminals under normal (ie non-emergency) conditions set by your National legislation?
The Voltage limits at LV customer’s terminals under normal conditions are set by the Transmission & Distribution Rules prepar ed by the TSO at 400V±10% (230V±10%)
2 How are these verified in practice: (b) Using EN 50160, ie a statistical approach (The Voltage is set during commissioning of the transformer to the absolute values not to be exceeded at any time at the LV
Switchboard. During normal operation the Voltage is monitored when a customer files a complaint. In case of PV systems larger than 100kW power quality together with voltage monitor is done after initial operation of the PV Park). In all cases the volt age should be within the values stated in EN 50160.
3 How does the harmonised voltage range of 230V, plus 10% minus 10%, as given in HD 472, EN 50160 and EN 60038 relate to the limits set by legislation? Any values identified outside the EN 50160 are not accepted and have to be corrected immediately either by the customer or by the Distribution System Owner, depending on the source of the problem.
Denmark Dansk Energie In general the standard EN 50160 with a voltage range +-10% around is used in DK. However some DNOs still uses +6-10% around 230V. The voltage range is defined in the connection terms, which must be approved by the regulator.
Sweden Vatenfall 1 What are the voltage limits at LV customer's terminals under normal (ie non-emergency) conditions set by your National legislation? 230 V +- 10% measured as 10 min average values 2 How are these verified in practice: (a) They are absolute values not to be exceeded at any time We hope new energy-meters will fix it automatically. Also our NIS systems can alarm that calculated voltages will be outside the "law". Today usually the customer complains and we set up voltage meters for typically 1 week. The legislation also refers to IEC 61000-4-30. Formerly "unnormal conditions" does not exist but in practice it does. It depends on what type of customers - the worst is "city-people" visiting their weekend/holiday cottage. 3 How does the harmonised voltage range of 230V, plus 10% minus 10%, as given in HD 472, EN 50160 an d EN 60038 relate to the limits set by legislation? (no answer)
Norway Sintef In Norway we have the following limits in the Norwegian PQ code: 230V +/ - 10% 1 min rms values (not 10 min.) to be respected 100% of the time. This deviation from EN 50160 is published as a national deviation in EN 50160 - a deviation that was agreed several years ago, but by mistake not included until recently.
Latvia ST (AS "Sadales tīkls")
In Latvia standard EN 50160 since 01.01.2013 is stated as obligate by national rules , voltage level is 230V+/- 10%-set by legislation. ST maintain 59 000km low voltage lines (230V, 400V, 1kV). In rural areas low voltage power lines are quite long, and there is challenge for system operator to ensure required voltage quality. There are som e 0.4 kV lines with lower level voltage in peak hours (lower than 230V-10%, clients, has lower distribution tariff)
ENA Engineering Technical Report 140 Issue 1 2017
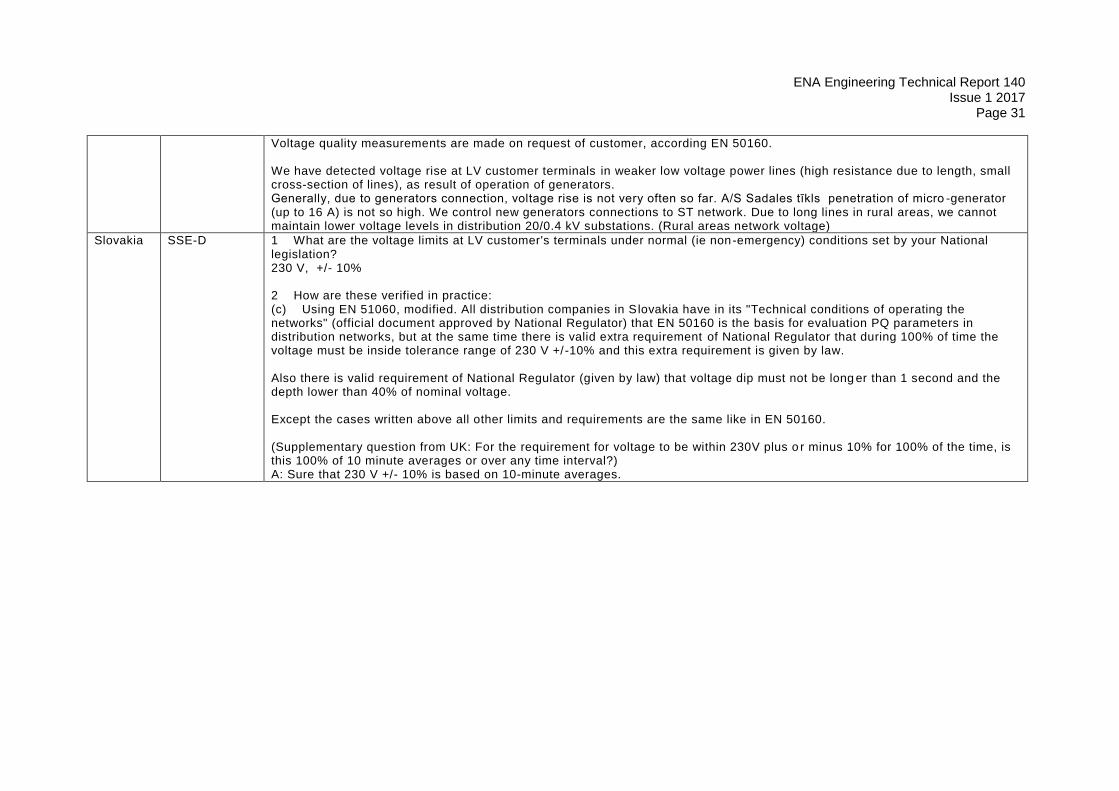
Page 31
Voltage quality measurements are made on request of customer, according EN 50160. We have detected voltage rise at LV customer terminals in weaker low voltage power lines (high resistance due to length, small cross-section of lines), as result of operation of generators. Generally, due to generators connection, voltage rise is not very often so far. A/S Sadales tīkls penetration of micro -generator (up to 16 A) is not so high. We control new generators connections to ST network. Due to long lines in rural areas, we cannot maintain lower voltage levels in distribution 20/0.4 kV substations. (Rural areas network voltage)
Slovakia SSE-D 1 What are the voltage limits at LV customer's terminals under normal (ie non-emergency) conditions set by your National legislation? 230 V, +/- 10% 2 How are these verified in practice: (c) Using EN 51060, modified. All distribution companies in Slovakia have in its "Technical conditions of operating the networks" (official document approved by National Regulator) that EN 50160 is the basis for evaluation PQ parameters in distribution networks, but at the same time there is valid extra requirement of National Regulator that during 100% of time the voltage must be inside tolerance range of 230 V +/-10% and this extra requirement is given by law. Also there is valid requirement of National Regulator (given by law) that voltage dip must not be long er than 1 second and the depth lower than 40% of nominal voltage. Except the cases written above all other limits and requirements are the same like in EN 50160. (Supplementary question from UK: For the requirement for voltage to be within 230V plus o r minus 10% for 100% of the time, is this 100% of 10 minute averages or over any time interval?) A: Sure that 230 V +/- 10% is based on 10-minute averages.
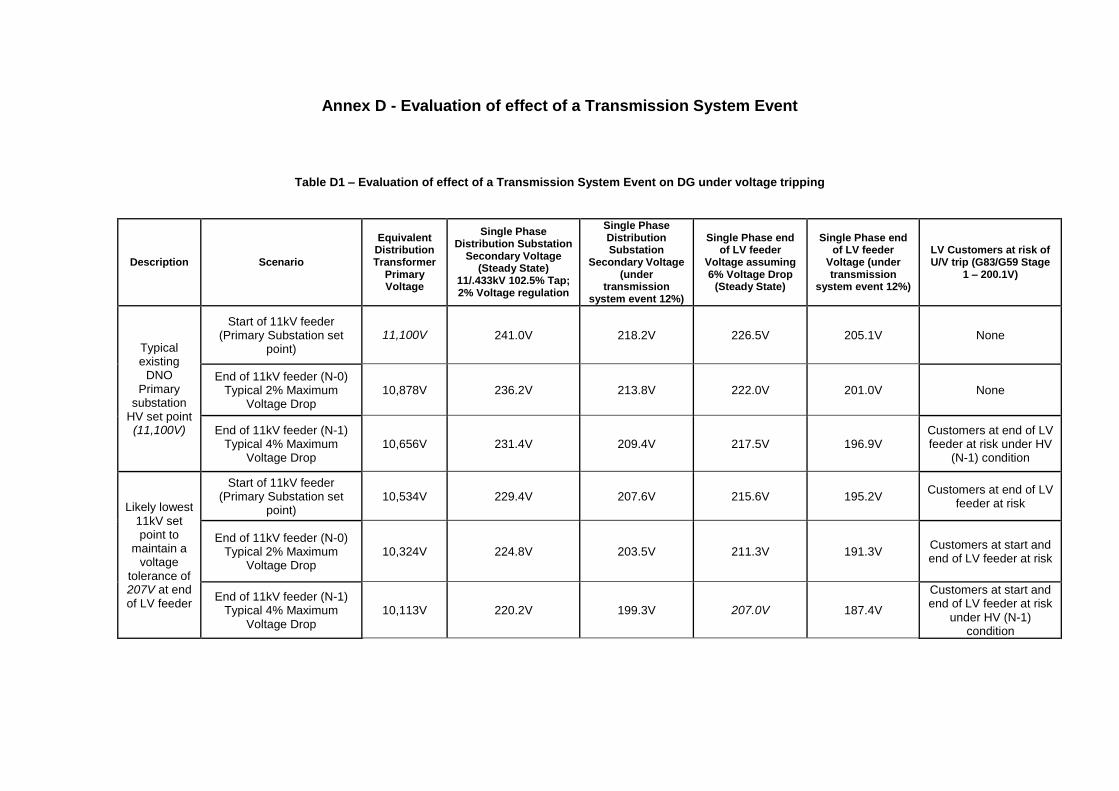
Annex D - Evaluation of effect of a Transmission System Event
Table D1 – Evaluation of effect of a Transmission System Event on DG under voltage tripping
Description Scenario
Equivalent Distribution Transformer
Primary Voltage
Single Phase Distribution Substation
Secondary Voltage (Steady State)
11/.433kV 102.5% Tap; 2% Voltage regulation
Single Phase Distribution Substation
Secondary Voltage (under
transmission system event 12%)
Single Phase end of LV feeder
Voltage assuming 6% Voltage Drop
(Steady State)
Single Phase end of LV feeder
Voltage (under transmission
system event 12%)
LV Customers at risk of U/V trip (G83/G59 Stage
1 – 200.1V)
Typical existing
DNO Primary
substation HV set point (11,100V)
Start of 11kV feeder (Primary Substation set
point)
11,100V 241.0V 218.2V 226.5V 205.1V None
End of 11kV feeder (N-0) Typical 2% Maximum
Voltage Drop 10,878V 236.2V 213.8V 222.0V 201.0V None
End of 11kV feeder (N-1) Typical 4% Maximum
Voltage Drop 10,656V 231.4V 209.4V 217.5V 196.9V
Customers at end of LV feeder at risk under HV
(N-1) condition
Likely lowest 11kV set point to
maintain a voltage
tolerance of 207V at end of LV feeder
Start of 11kV feeder (Primary Substation set
point) 10,534V 229.4V 207.6V 215.6V 195.2V
Customers at end of LV feeder at risk
End of 11kV feeder (N-0) Typical 2% Maximum
Voltage Drop 10,324V 224.8V 203.5V 211.3V 191.3V
Customers at start and end of LV feeder at risk
End of 11kV feeder (N-1) Typical 4% Maximum
Voltage Drop 10,113V 220.2V 199.3V 207.0V 187.4V
Customers at start and end of LV feeder at risk
under HV (N-1) condition
ENA Engineering Technical Report 140 Issue 1 2017
Page 33
Breakdown of Distributed
Generation by connection Voltage
in NPgY
Estimated Distributed
Generation breakdown by voltage at time of maximum
demand at large Grid Supply Point
(NPgY West Melton)
Distributed Generation at risk of under voltage tripping
Estimated Distributed Generation at risk of under voltage trip at time of maximum
demand
132/66/33kV Connected
61% 14MW 0% 0MW
20/11kV Connected 26% 6MW 14% of HV feeders in NPgY area have a feeder end voltage drop of 2% or more. [It
is assumed all generation on these feeders in the 2-6% category are now at risk if operating voltages are reduced]
0.8MW
400V Connected 12% 3MW 56% from table D1 assuming a distributed loading over LV feeders
1.7MW
Total 100% 23MW 11% as a proportion of total generation
2.5MW
Table D2 – Quantification of increased risk
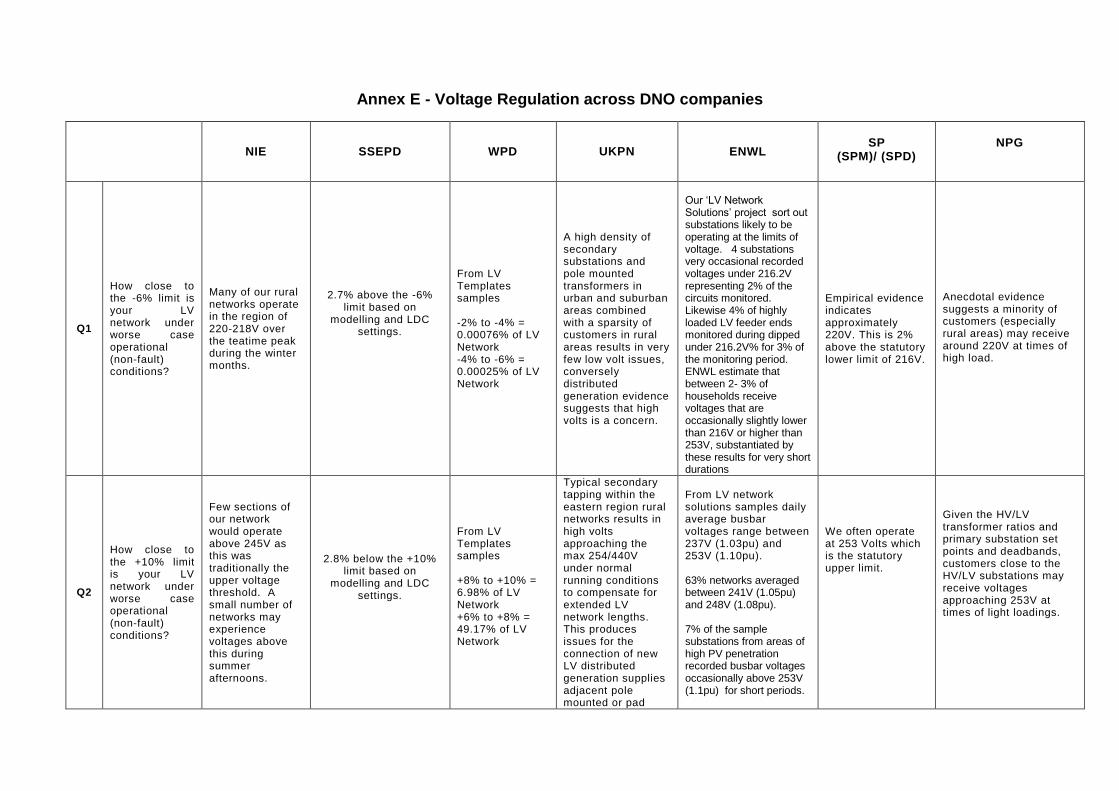
Annex E - Voltage Regulation across DNO companies
NIE SSEPD WPD UKPN ENWL
SP
(SPM)/ (SPD)
NPG
Q1
How close to the -6% limit is your LV network under worse case operational (non-fault) conditions?
Many of our rural networks operate in the region of 220-218V over the teatime peak during the winter months.
2.7% above the -6% limit based on
modelling and LDC settings.
From LV Templates samples -2% to -4% = 0.00076% of LV Network -4% to -6% = 0.00025% of LV Network
A high density of secondary substations and pole mounted transformers in urban and suburban areas combined with a sparsity of customers in rural areas results in very few low volt issues, conversely distributed generation evidence suggests that high volts is a concern.
Our ‘LV Network Solutions’ project sort out substations likely to be operating at the limits of voltage. 4 substations very occasional recorded voltages under 216.2V representing 2% of the circuits monitored. Likewise 4% of highly loaded LV feeder ends monitored during dipped under 216.2V% for 3% of the monitoring period. ENWL estimate that between 2- 3% of households receive voltages that are occasionally slightly lower than 216V or higher than 253V, substantiated by these results for very short durations
Empirical evidence indicates approximately 220V. This is 2% above the statutory lower limit of 216V.
Anecdotal evidence suggests a minority of customers (especially rural areas) may receive around 220V at times of high load.
Q2
How close to the +10% limit is your LV network under worse case operational (non-fault) conditions?
Few sections of our network would operate above 245V as this was traditionally the upper voltage threshold. A small number of networks may experience voltages above this during summer afternoons.
2.8% below the +10% limit based on
modelling and LDC settings.
From LV Templates samples +8% to +10% = 6.98% of LV Network +6% to +8% = 49.17% of LV Network
Typical secondary tapping within the eastern region rural networks results in high volts approaching the max 254/440V under normal running conditions to compensate for extended LV network lengths. This produces issues for the connection of new LV distributed generation supplies adjacent pole mounted or pad
From LV network solutions samples daily average busbar voltages range between 237V (1.03pu) and 253V (1.10pu). 63% networks averaged between 241V (1.05pu) and 248V (1.08pu). 7% of the sample substations from areas of high PV penetration recorded busbar voltages occasionally above 253V (1.1pu) for short periods.
We often operate at 253 Volts which is the statutory upper limit.
Given the HV/LV transformer ratios and primary substation set points and deadbands, customers close to the HV/LV substations may receive voltages approaching 253V at times of light loadings.
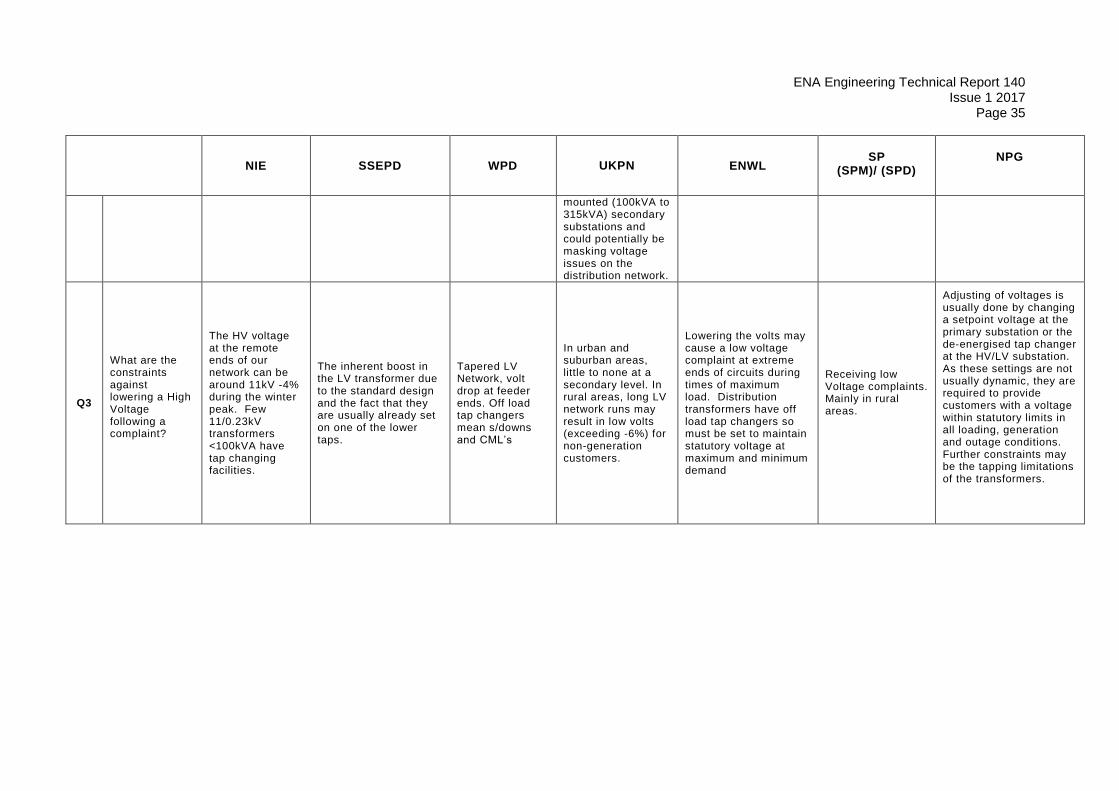
ENA Engineering Technical Report 140 Issue 1 2017
Page 35
NIE SSEPD WPD UKPN ENWL
SP
(SPM)/ (SPD)
NPG
mounted (100kVA to 315kVA) secondary substations and could potentially be masking voltage issues on the distribution network.
Q3
What are the constraints against lowering a High Voltage following a complaint?
The HV voltage at the remote ends of our network can be around 11kV -4% during the winter peak. Few 11/0.23kV transformers <100kVA have tap changing facilities.
The inherent boost in the LV transformer due to the standard design and the fact that they are usually already set on one of the lower taps.
Tapered LV Network, volt drop at feeder ends. Off load tap changers mean s/downs and CML’s
In urban and suburban areas, little to none at a secondary level. In rural areas, long LV network runs may result in low volts (exceeding -6%) for non-generation customers.
Lowering the volts may cause a low voltage complaint at extreme ends of circuits during times of maximum load. Distribution transformers have off load tap changers so must be set to maintain statutory voltage at maximum and minimum demand
Receiving low Voltage complaints. Mainly in rural areas.
Adjusting of voltages is usually done by changing a setpoint voltage at the primary substation or the de-energised tap changer at the HV/LV substation. As these settings are not usually dynamic, they are required to provide customers with a voltage within statutory limits in all loading, generation and outage conditions. Further constraints may be the tapping limitations of the transformers.
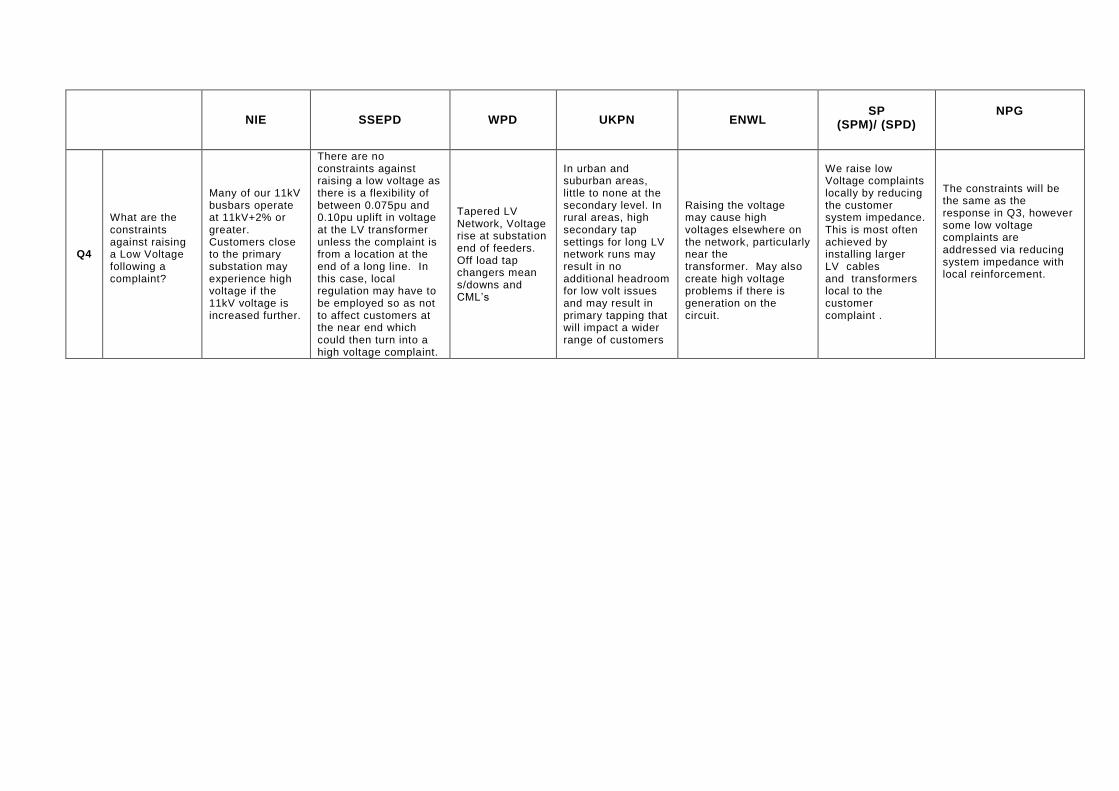
NIE SSEPD WPD UKPN ENWL
SP
(SPM)/ (SPD)
NPG
Q4
What are the constraints against raising a Low Voltage following a complaint?
Many of our 11kV busbars operate at 11kV+2% or greater. Customers close to the primary substation may experience high voltage if the 11kV voltage is increased further.
There are no constraints against raising a low voltage as there is a flexibility of between 0.075pu and 0.10pu uplift in voltage at the LV transformer unless the complaint is from a location at the end of a long line. In this case, local regulation may have to be employed so as not to affect customers at the near end which could then turn into a high voltage complaint.
Tapered LV Network, Voltage rise at substation end of feeders. Off load tap changers mean s/downs and CML’s
In urban and suburban areas, little to none at the secondary level. In rural areas, high secondary tap settings for long LV network runs may result in no additional headroom for low volt issues and may result in primary tapping that will impact a wider range of customers
Raising the voltage may cause high voltages elsewhere on the network, particularly near the transformer. May also create high voltage problems if there is generation on the circuit.
We raise low Voltage complaints locally by reducing the customer system impedance. This is most often achieved by installing larger LV cables and transformers local to the customer complaint .
The constraints will be the same as the response in Q3, however some low voltage complaints are addressed via reducing system impedance with local reinforcement.
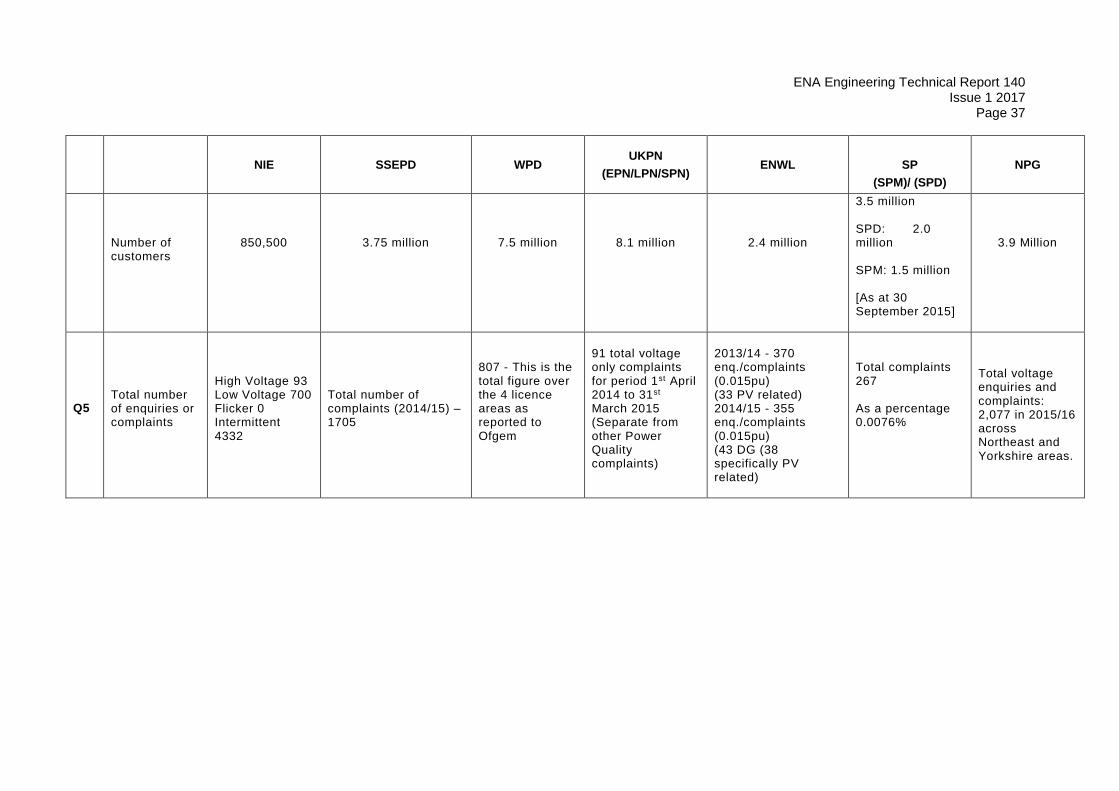
ENA Engineering Technical Report 140 Issue 1 2017
Page 37
NIE
SSEPD
WPD UKPN
(EPN/LPN/SPN) ENWL
SP
(SPM)/ (SPD)
NPG
Number of customers
850,500
3.75 million
7.5 million
8.1 million
2.4 million
3.5 million
SPD: 2.0 million
SPM: 1.5 million
[As at 30 September 2015]
3.9 Million
Q5
Total number of enquiries or complaints
High Voltage 93 Low Voltage 700 Flicker 0 Intermittent 4332
Total number of complaints (2014/15) – 1705
807 - This is the total figure over the 4 licence areas as reported to Ofgem
91 total voltage only complaints for period 1st April 2014 to 31st March 2015 (Separate from other Power Quality complaints)
2013/14 - 370 enq./complaints (0.015pu) (33 PV related) 2014/15 - 355 enq./complaints (0.015pu) (43 DG (38 specifically PV related)
Total complaints 267 As a percentage 0.0076%
Total voltage enquiries and complaints: 2,077 in 2015/16 across Northeast and Yorkshire areas.
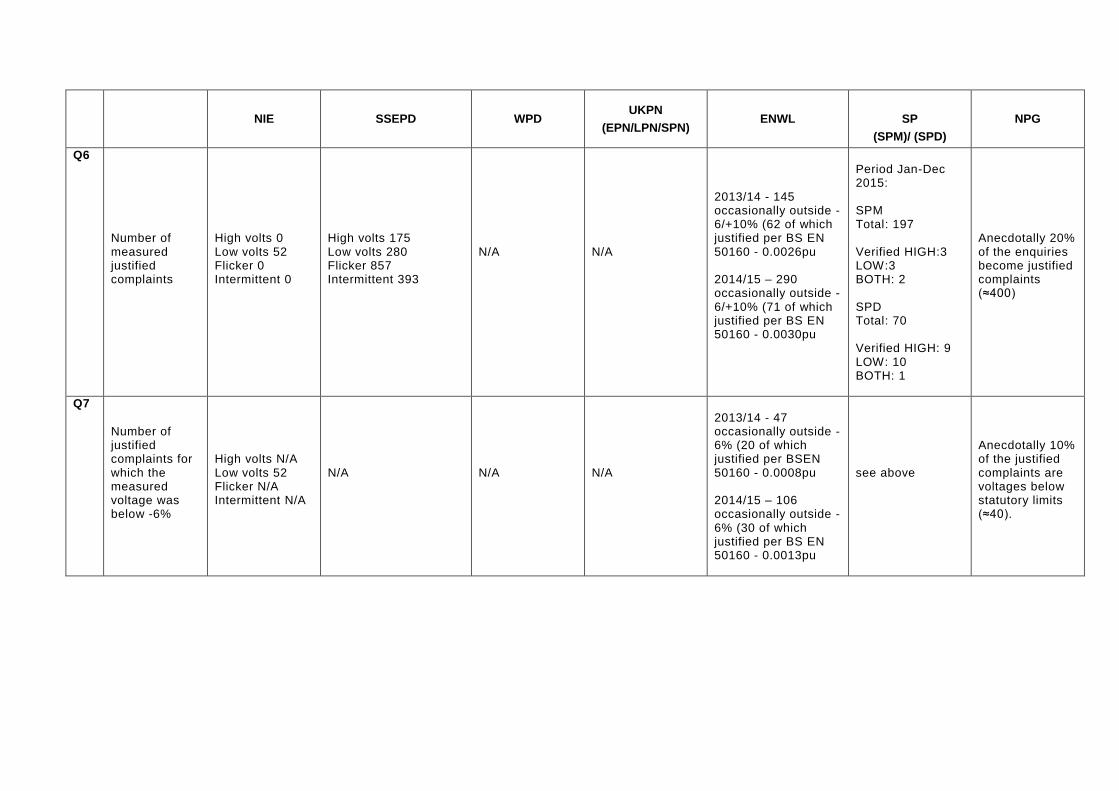
NIE
SSEPD
WPD UKPN
(EPN/LPN/SPN) ENWL
SP
(SPM)/ (SPD)
NPG
Q6 Number of measured justified complaints
High volts 0 Low volts 52 Flicker 0 Intermittent 0
High volts 175 Low volts 280 Flicker 857 Intermittent 393
N/A
N/A
2013/14 - 145 occasionally outside -6/+10% (62 of which justified per BS EN 50160 - 0.0026pu 2014/15 – 290 occasionally outside -6/+10% (71 of which justified per BS EN 50160 - 0.0030pu
Period Jan-Dec 2015: SPM Total: 197 Verified HIGH:3 LOW:3 BOTH: 2 SPD Total: 70 Verified HIGH: 9 LOW: 10 BOTH: 1
Anecdotally 20% of the enquiries become justified complaints (≈400)
Q7 Number of justified complaints for which the measured voltage was below -6%
High volts N/A Low volts 52 Flicker N/A Intermittent N/A
N/A
N/A
N/A
2013/14 - 47 occasionally outside -6% (20 of which justified per BSEN 50160 - 0.0008pu 2014/15 – 106 occasionally outside -6% (30 of which justified per BS EN 50160 - 0.0013pu
see above
Anecdotally 10% of the justified complaints are voltages below statutory limits (≈40).
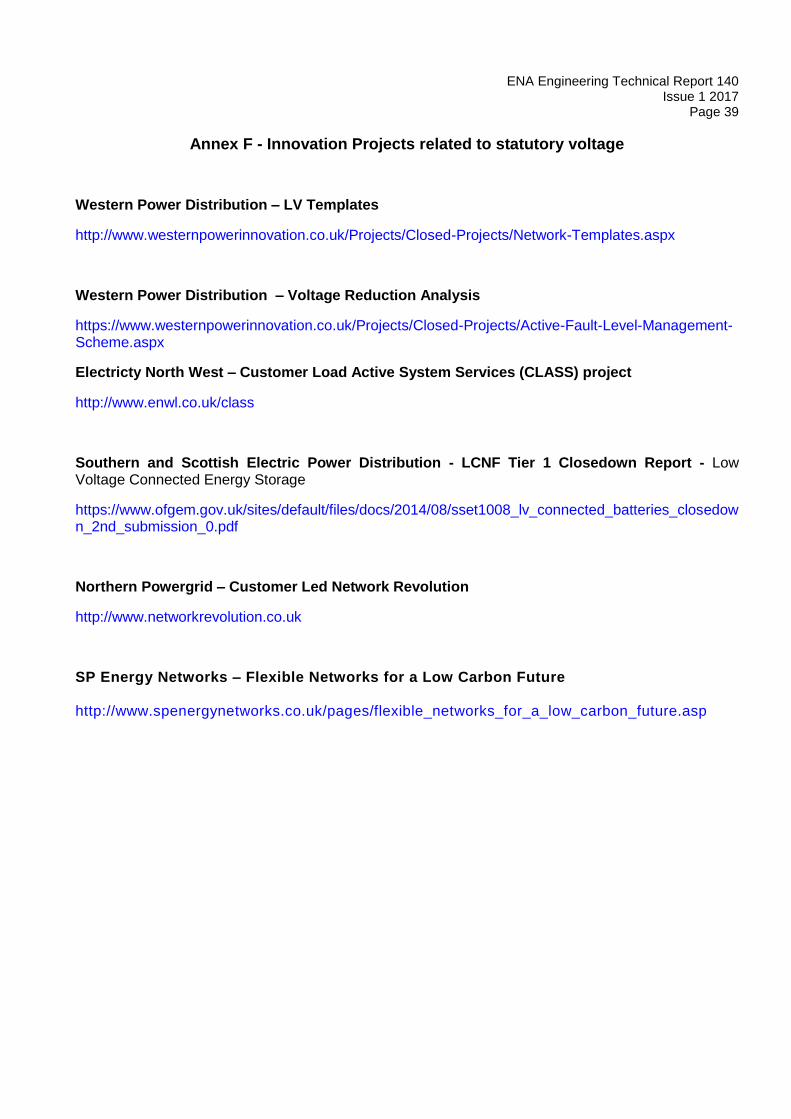
ENA Engineering Technical Report 140 Issue 1 2017
Page 39
Annex F - Innovation Projects related to statutory voltage
Western Power Distribution – LV Templates
http://www.westernpowerinnovation.co.uk/Projects/Closed-Projects/Network-Templates.aspx
Western Power Distribution – Voltage Reduction Analysis
https://www.westernpowerinnovation.co.uk/Projects/Closed-Projects/Active-Fault-Level-Management-Scheme.aspx
Electricty North West – Customer Load Active System Services (CLASS) project
http://www.enwl.co.uk/class
Southern and Scottish Electric Power Distribution - LCNF Tier 1 Closedown Report - Low Voltage Connected Energy Storage
https://www.ofgem.gov.uk/sites/default/files/docs/2014/08/sset1008_lv_connected_batteries_closedown_2nd_submission_0.pdf
Northern Powergrid – Customer Led Network Revolution
http://www.networkrevolution.co.uk
SP Energy Networks – Flexible Networks for a Low Carbon Future http://www.spenergynetworks.co.uk/pages/flexible_networks_for_a_low_carbon_future.asp
Bibliography
Standards publications
For dated references, only the edition cited applies. For undated references, the latest edition of the referenced document (including any amendments) applies.
CENELEC HD 472 S1/A1 – Nominal Voltages for Low Voltage Public Electricity Supply Systems
BS 7697:1993. Nominal voltages for low voltage public electricity supply systems.
NOTE: this Standard implemented CENELEC HD 472 in the UK.
Other publications
The Carbon Plan, Delivering Our Low Carbon Future; HM Government; December 2011
SI 1988 No. 1057: The Electricity Supply Regulations (1988)
The Distribution Code of Licensed Distribution Network Operators of Great Britain