status of mathematics researches in ilocos region: basis ... · universities (sucs’) in ilocos...
TRANSCRIPT
Asia Pacific Journal of Multidisciplinary Research, Vol. 3, No. 5, December 2015 _______________________________________________________________________________________________________________
121 P-ISSN 2350-7756 | E-ISSN 2350-8442 | www.apjmr.com
Status of Mathematics Researches in Ilocos
Region: Basis for Mathematics Research Agenda
Paulo V. Cenas and Melody C. De Vera Pangasinan State University, Lingayen Pangasinan, Philippines
[email protected], [email protected]
Date Received: October 10, 2015; Dare Revised: December 9, 2015
Asia Pacific Journal of
Multidisciplinary Research Vol. 3 No.5, 121 - 136
December 2015 Part IV P-ISSN 2350-7756
E-ISSN 2350-8442
www.apjmr.com
Abstract - This study describes the status of Mathematics researches of State College and Universities (SUCs’) in Ilocos Region (Region I) through content analysis of the undergraduate and
graduate students’ theses and dissertation, and faculty researches conducted from the year 2008 to 2014. Research results revealed that mathematics researches were produced by undergraduate
students and limited on institutional level. The thematic focus, were on enhancement of known
theories and concepts in Mathematics. The use of statistical tools was usually avoided and if ever needed, these tools were limited to basic statistical tools. Research types were mostly mixtures of
qualitative and quantitative with strategies of inquiry as mostly exploratory. The data gathered used
questionnaire or from secondary sources. A classification tree was used to model the level of researches where the research theme turned out to be the most important variable followed by the
research discipline, statistical tools employed and scope of the study. Researchable areas and prospective components were identified in the formulated Mathematics research agenda in their order
of priorities based on the problems and focus.
Keywords: Mathematics theme, Mathematics focus, Mathematics research agenda
INTRODUCTION Mathematics is the gate and key of sciences and
serves as the basic concept of science and technology. It occupies a vital position in the educational system
because the demand for it is evident in everyman’s
life. Kant, [1] a philosopher cited that “a science is exact only in so far as it employs mathematics”.
Hence, all scientific education which do not
commence with Mathematics are defective at its foundation. He further said that, “In every department
of physical science there is only so much science, properly so-called, as there is mathematics”[2].
Therefore, Mathematics is everywhere and endless.
Meanwhile, “Mathematics is the most versatile of all the sciences. It is uniquely well placed to respond
to the demands of a rapidly changing economic
landscape. Mathematics now has the opportunity more than ever before to under-pin quantitative
understanding of industrial strategy and processes across all sectors of business. Companies that take
best advantage of this opportunity will gain a
significant competitive advantage: mathematics truly gives industry the edge" Professor Arnold [3].
Over the last few years issues connected with learning and teaching mathematics have become a
matter of the highest importance for everyone involved in education, training and publishing. It has
been taken up at the highest policy level [4].
Mathematical competence has been identified by the European Parliament and the Council of the European
Union as one of the key competences necessary for
personal fulfillment, active citizenship, social inclusion and employability in modern society.
The member-states of the Association of Southeast Asian Nations (ASEAN), including the
Philippines, envisioned an ASEAN University born
from strong linkages of leading universities and institutions in the region. ASEAN 2015 [5] promote
greater educational cooperation among ASEAN
Member States and strengthen education within them. Julio Amador III [6], came up with collaboration in
research and extension as one issues the country must ponder on as a member-state of ASEAN.
Several researches are made yearly from Basic
Education to Higher Educational Institutions to find answers to issues and problems particularly in
mathematics subjects that mathematics teachers are
Cenas & De Vera, Status of Mathematics Researches in Ilocos Region… _______________________________________________________________________________________________________________
122 P-ISSN 2350-7756 | E-ISSN 2350-8442 | www.apjmr.com
Asia Pacific Journal of Multidisciplinary Research, Vol. 3, No. 5, December 2015
encountering in their quest to transfer quality
education to the youth . However, these mathematics researches are seldom classified or quantified of how
many researches fall under social or purely
mathematical in content. Hence, there’s too little information that recommends or encourage
researchers to research in some areas that need concentration. Since, Mathematics is one of the
priority cluster of disciplines of National Higher
Education Research Agenda (NHERA)[7], it was therefore the aim of this research to identify key
themes in mathematics researches, and to map the
concentration of mathematics education research within and across those themes. Moreover, this study
formulated possible mathematics research agenda for the next five years. Through accumulation of
evidences from research in mathematics education, it
is now possible to identify clear questions that warrant further research.
The following reviewed studies added insight to the completion of this study: Dayag et. al [8],
Voskoglou [9] Hyde et.al [10], Sloane [11] conducted
researches about trends and challenges. On the other hand, Yu-Chen Su [12] Bozkurt [13], made use of
content analysis in their researches. While, Bozkaya
et.al [14], GÖKTAŞ et. al [15] Tang Wee Teo et. al[16], established trends in various disciplines and at
the same time made use of content analysis technique.
OBJECTIVES OF THE STUDY This study described the status of Mathematics
researches among SUC’s in Ilocos Region using those
conducted from 2008 to 2014. Specifically, it aimed
to: establish the trend of the mathematics researches conducted by the undergraduate students, graduate
students and faculty researchers in terms of their (a) general characteristics as to educational level of
researchers, respondent type, discipline, and scope of
research (b) thematic research focus and discipline as to educational theory and research themes (c) research
methodology as to research type, data analysis,
strategies of inquiry, sampling scheme / procedures and instruments and materials used; derive a model of
classification of the level of researches as function of the aforementioned properties, and; propose a
mathematics education research agenda for the next
five years.
METHODOLOGY This study employed content analysis[17] thru
methodological review of the completed mathematics
researches of faculty, theses and dissertations of
undergraduate and graduate students in the State Universities and Colleges (SUCs) in Ilocos Region for
the past seven years (2008-2014). It considered all the
Mathematics researches that offer the following programs: BS Mathematics, Master’s Degree in
Mathematics and Doctoral Degree in Mathematics in the under graduate and graduate level during the
specified time period.
A researcher-made questionnaire served as the main instrument of the study. The research instrument
was composed of three parts. Part 1 established the
general characteristics of the mathematics researches in terms of the educational level of the researchers,
respondent type, mathematics discipline and the scope of the research. Part II described the educational
theory and research themes of the mathematics
researches. Lastly, Part III, established the research methodology. This included the research design, data
analysis, strategies of inquiry, sampling scheme and data collection methods and instruments used in the
mathematics researches.
List of study titles and electronic database of the abstracts were first studied to speed up selection of the
studies to be analyzed. Questions in the checklists
were answered while a study was selected and carefully studied.
Quantitative analysis was done in the gathered data. Answers in the checklists were analyzed using
frequency counts and percentage measures. Summary
of results were presented in tabular order. Classification tree analysis was used in modeling the
level of researches in the region.
RESULTS AND DISCUSSION
Trends of Mathematics Researchers
The general characteristics of researches are
usually described in terms of level, respondent type, focus and disciplines.
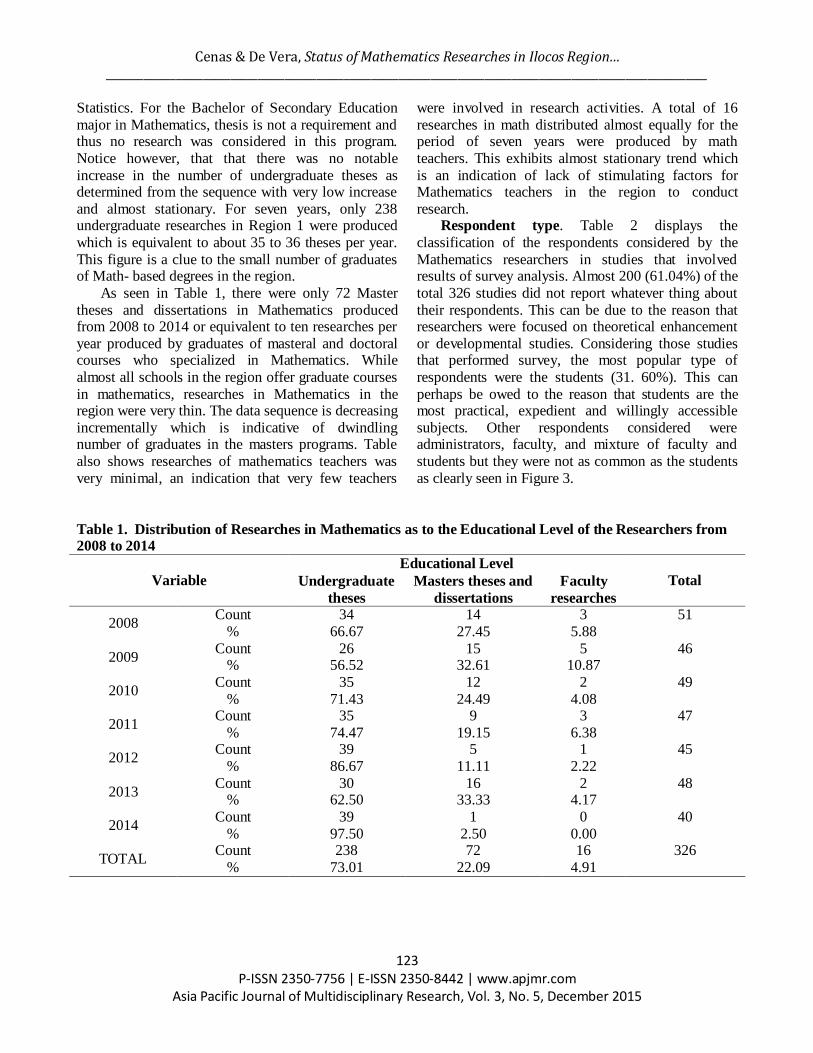
Educational level of researchers. Table 1 shows
the distribution of mathematics researches as to the
educational level of the researchers from 2008 to 2014. Undergraduate theses consistently remain to be
the highest in frequency throughout the observed
periods. The volume of the researches for the years considered ranged from 26 to 39 and these came from
undergraduate programs that require thesis such as BS
Mathematics, BS Applied Mathematics and BS
Cenas & De Vera, Status of Mathematics Researches in Ilocos Region… _______________________________________________________________________________________________________________
123 P-ISSN 2350-7756 | E-ISSN 2350-8442 | www.apjmr.com
Asia Pacific Journal of Multidisciplinary Research, Vol. 3, No. 5, December 2015
Statistics. For the Bachelor of Secondary Education
major in Mathematics, thesis is not a requirement and thus no research was considered in this program.
Notice however, that that there was no notable
increase in the number of undergraduate theses as determined from the sequence with very low increase
and almost stationary. For seven years, only 238 undergraduate researches in Region 1 were produced
which is equivalent to about 35 to 36 theses per year.
This figure is a clue to the small number of graduates of Math- based degrees in the region.
As seen in Table 1, there were only 72 Master
theses and dissertations in Mathematics produced from 2008 to 2014 or equivalent to ten researches per
year produced by graduates of masteral and doctoral courses who specialized in Mathematics. While
almost all schools in the region offer graduate courses
in mathematics, researches in Mathematics in the region were very thin. The data sequence is decreasing
incrementally which is indicative of dwindling number of graduates in the masters programs. Table
also shows researches of mathematics teachers was
very minimal, an indication that very few teachers
were involved in research activities. A total of 16
researches in math distributed almost equally for the period of seven years were produced by math
teachers. This exhibits almost stationary trend which
is an indication of lack of stimulating factors for Mathematics teachers in the region to conduct
research. Respondent type. Table 2 displays the
classification of the respondents considered by the
Mathematics researchers in studies that involved results of survey analysis. Almost 200 (61.04%) of the
total 326 studies did not report whatever thing about
their respondents. This can be due to the reason that researchers were focused on theoretical enhancement
or developmental studies. Considering those studies that performed survey, the most popular type of
respondents were the students (31. 60%). This can
perhaps be owed to the reason that students are the most practical, expedient and willingly accessible
subjects. Other respondents considered were administrators, faculty, and mixture of faculty and
students but they were not as common as the students
as clearly seen in Figure 3.
Table 1. Distribution of Researches in Mathematics as to the Educational Level of the Researchers from 2008 to 2014
Variable
Educational Level
Total Undergraduate
theses
Masters theses and
dissertations
Faculty
researches
2008 Count 34 14 3 51
% 66.67 27.45 5.88
2009 Count 26 15 5 46
% 56.52 32.61 10.87
2010 Count 35 12 2 49
% 71.43 24.49 4.08
2011 Count 35 9 3 47
% 74.47 19.15 6.38
2012 Count 39 5 1 45
% 86.67 11.11 2.22
2013 Count 30 16 2 48
% 62.50 33.33 4.17
2014 Count 39 1 0 40
% 97.50 2.50 0.00
TOTAL Count 238 72 16 326
% 73.01 22.09 4.91

Cenas & De Vera, Status of Mathematics Researches in Ilocos Region… _______________________________________________________________________________________________________________
124 P-ISSN 2350-7756 | E-ISSN 2350-8442 | www.apjmr.com
Asia Pacific Journal of Multidisciplinary Research, Vol. 3, No. 5, December 2015
Table 2. Distribution of the Researches in Mathematics as to the Type of Respondents
Year
Respondent type
Total Administrator Students Faculty
Faculty and
Students None
2008 Count 0 15 2 3 31 51
% 0.00 29.41 3.92 5.88 60.78
2009 Count 0 15 1 1 29 46
% 0.00 32.61 2.17 2.17 63.04
2010 Count 0 14 4 3 28 49
% 0.00 28.57 8.16 6.12 57.14
2011 Count 1 10 1 3 32 47 % 2.13 21.28 2.13 6.38 68.09
2012 Count 0 23 0 1 21 45
% 0.00 51.11 0.00 2.22 46.67
2013 Count 0 21 1 3 23 48
% 0.00 43.75 2.08 6.25 47.92
2014 Count 0 5 0 0 35 40
% 0.00 12.50 0.00 0.00 87.50
Total Count 1 103 9 14 199 326
% 0.31 31.60 2.76 4.29 61.04
Discipline. Mathematics is very expansive covering various disciplines. As seen in Table 3,
many (35.58%) researches were focused on the
application of mathematics to areas like computer programming needed in system development studies,
econometrics, instrument reliability and statistical
modelling. Math Analysis or Calculus was the most popular discipline being considered followed by
linear and abstract algebra. There were little studies
that focused on statistics, trigonometry, geometry but none on numerical analysis, topology, graph theory,
mathematical statistics and other disciplines.
Table 3. Distribution of the Researches as to the Mathematics Discipline Considered
Discipline
Total
Trigo-
nometry Statistics Geometry
Math Analysis/
Calculus
Linear/
Abstract
/College algebra
General
/Applie
d
2008 Count 2 4 3 12 12 18 51
% 3.92 7.84 5.88 23.53 23.53 35.29 1.0
2009 Count 0 1 7 12 11 15 46
% .00 2.17 15.22 26.09 23.91 32.61 1.0
2010 Count 1 4 4 11 7 22 49
% 2.04 8.16 8.16 22.45 14.29 44.90 1.0
2011 Count 2 2 3 11 12 17 47
% 4.26 4.26 6.38 23.40 25.53 36.17 1.0
2012 Count 3 3 6 19 8 6 45
% 6.67 6.67 13.33 42.22 17.78 13.33 1.0
2013 Count 1 5 3 14 8 17 48
% 2.08 10.42 6.25 29.17 16.67 35.42 1.0
2014 Count 0 1 2 15 1 21 40
% .00 2.50 5.00 37.50 2.50 52.50
Total Count 9 20 28 94 59 116 326
% 2.76 6.13 8.59 28.83 18.10 35.58
Cenas & De Vera, Status of Mathematics Researches in Ilocos Region… _______________________________________________________________________________________________________________
125 P-ISSN 2350-7756 | E-ISSN 2350-8442 | www.apjmr.com
Asia Pacific Journal of Multidisciplinary Research, Vol. 3, No. 5, December 2015
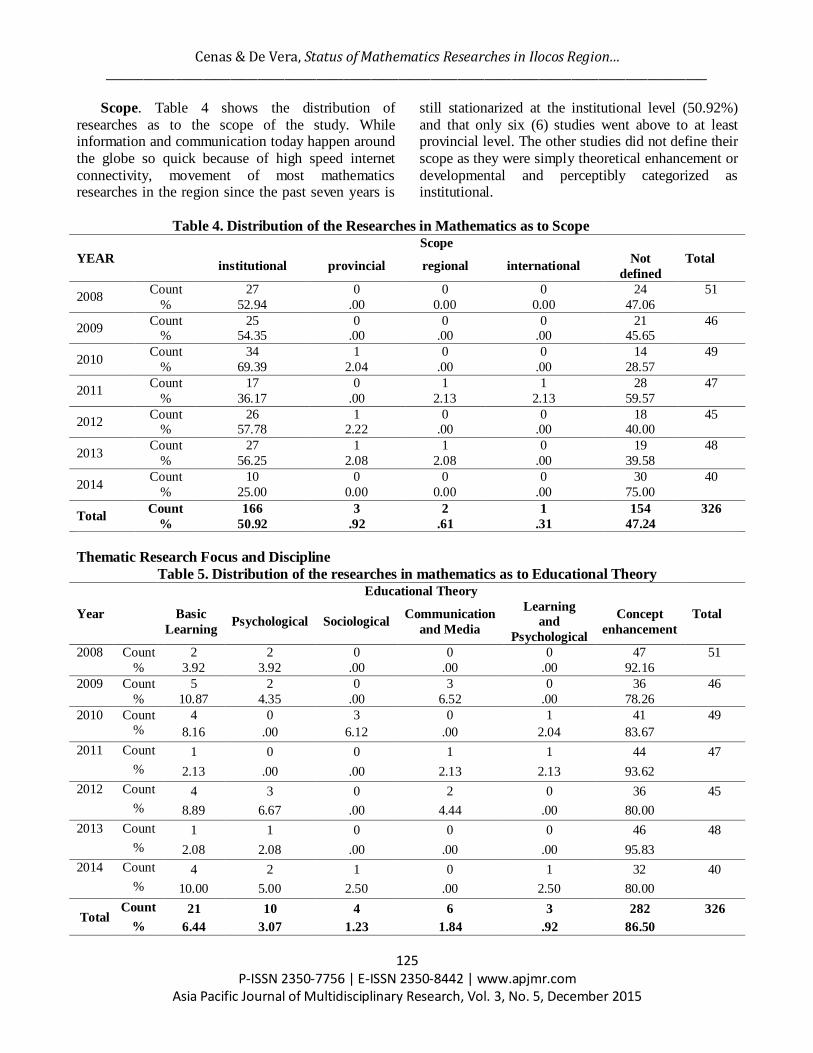
Scope. Table 4 shows the distribution of
researches as to the scope of the study. While information and communication today happen around
the globe so quick because of high speed internet
connectivity, movement of most mathematics researches in the region since the past seven years is
still stationarized at the institutional level (50.92%)
and that only six (6) studies went above to at least provincial level. The other studies did not define their
scope as they were simply theoretical enhancement or
developmental and perceptibly categorized as institutional.
Table 4. Distribution of the Researches in Mathematics as to Scope
YEAR
Scope
Total institutional provincial regional international
Not
defined
2008 Count 27 0 0 0 24 51
% 52.94 .00 0.00 0.00 47.06
2009 Count 25 0 0 0 21 46
% 54.35 .00 .00 .00 45.65
2010 Count 34 1 0 0 14 49
% 69.39 2.04 .00 .00 28.57
2011 Count 17 0 1 1 28 47
% 36.17 .00 2.13 2.13 59.57
2012 Count 26 1 0 0 18 45
% 57.78 2.22 .00 .00 40.00
2013 Count 27 1 1 0 19 48
% 56.25 2.08 2.08 .00 39.58
2014 Count 10 0 0 0 30 40
% 25.00 0.00 0.00 .00 75.00
Total Count 166 3 2 1 154 326
% 50.92 .92 .61 .31 47.24
Thematic Research Focus and Discipline
Table 5. Distribution of the researches in mathematics as to Educational Theory
Year
Educational Theory
Total Basic
Learning Psychological Sociological
Communication
and Media
Learning
and
Psychological
Concept
enhancement
2008 Count 2 2 0 0 0 47 51
% 3.92 3.92 .00 .00 .00 92.16
2009 Count 5 2 0 3 0 36 46
% 10.87 4.35 .00 6.52 .00 78.26
2010 Count 4 0 3 0 1 41 49 % 8.16 .00 6.12 .00 2.04 83.67
2011 Count 1 0 0 1 1 44 47
% 2.13 .00 .00 2.13 2.13 93.62
2012 Count 4 3 0 2 0 36 45
% 8.89 6.67 .00 4.44 .00 80.00
2013 Count 1 1 0 0 0 46 48
% 2.08 2.08 .00 .00 .00 95.83
2014 Count 4 2 1 0 1 32 40
% 10.00 5.00 2.50 .00 2.50 80.00
Total Count 21 10 4 6 3 282 326
% 6.44 3.07 1.23 1.84 .92 86.50
Cenas & De Vera, Status of Mathematics Researches in Ilocos Region… _______________________________________________________________________________________________________________
126 P-ISSN 2350-7756 | E-ISSN 2350-8442 | www.apjmr.com
Asia Pacific Journal of Multidisciplinary Research, Vol. 3, No. 5, December 2015
Table 5 displays the distribution of researches in
mathematics as to educational theory realized in the study. Of these theories, the most common were the
basic learning theories (6.44%) categorized as:
problem- based, constructivist, and engagement. Other theories generated from mathematics studies
were psychological (3.07%), sociological (3.07%), communication and media (1.84%) and combination
of basic learning and psychological (0.925).
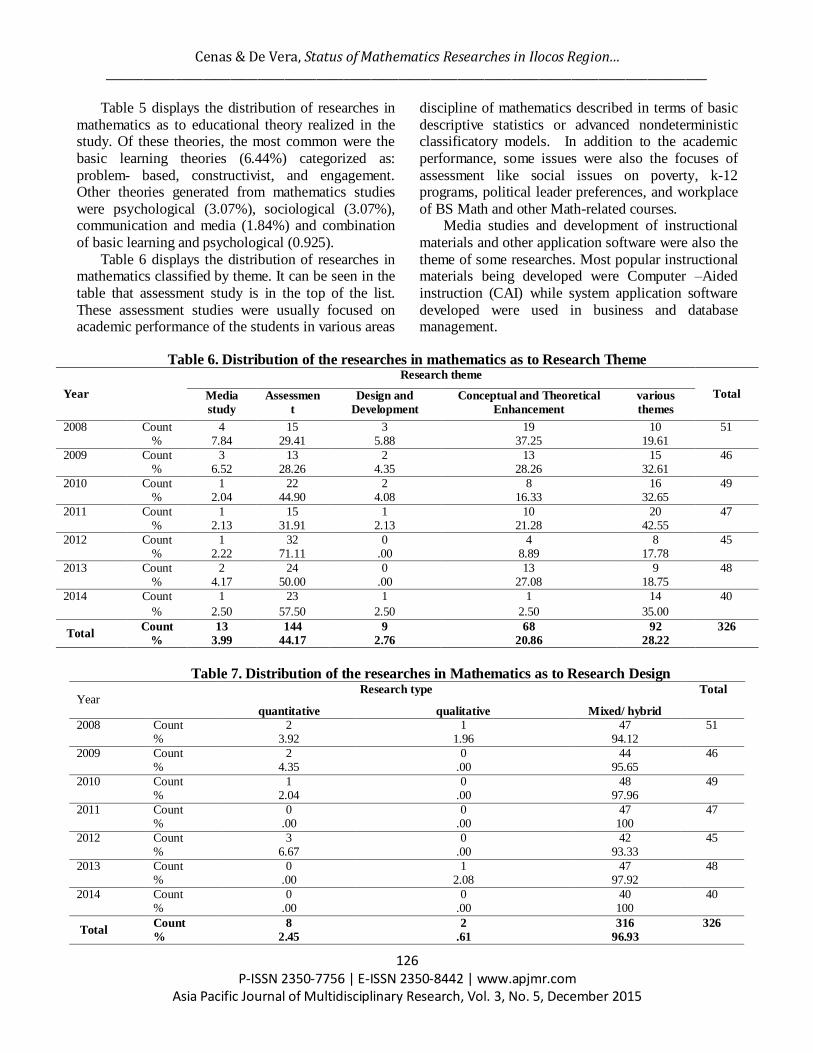
Table 6 displays the distribution of researches in mathematics classified by theme. It can be seen in the
table that assessment study is in the top of the list.
These assessment studies were usually focused on academic performance of the students in various areas
discipline of mathematics described in terms of basic
descriptive statistics or advanced nondeterministic classificatory models. In addition to the academic
performance, some issues were also the focuses of
assessment like social issues on poverty, k-12 programs, political leader preferences, and workplace
of BS Math and other Math-related courses. Media studies and development of instructional
materials and other application software were also the
theme of some researches. Most popular instructional materials being developed were Computer –Aided
instruction (CAI) while system application software
developed were used in business and database management.
Table 6. Distribution of the researches in mathematics as to Research Theme
Year
Research theme
Total Media
study
Assessmen
t
Design and
Development
Conceptual and Theoretical
Enhancement
various
themes
2008 Count 4 15 3 19 10 51 % 7.84 29.41 5.88 37.25 19.61
2009 Count 3 13 2 13 15 46 % 6.52 28.26 4.35 28.26 32.61
2010 Count 1 22 2 8 16 49 % 2.04 44.90 4.08 16.33 32.65
2011 Count 1 15 1 10 20 47 % 2.13 31.91 2.13 21.28 42.55
2012 Count 1 32 0 4 8 45 % 2.22 71.11 .00 8.89 17.78
2013 Count 2 24 0 13 9 48 % 4.17 50.00 .00 27.08 18.75
2014 Count 1 23 1 1 14 40
% 2.50 57.50 2.50 2.50 35.00
Total Count 13 144 9 68 92 326
% 3.99 44.17 2.76 20.86 28.22
Table 7. Distribution of the researches in Mathematics as to Research Design
Year Research type Total
quantitative qualitative Mixed/ hybrid 2008 Count 2 1 47 51
% 3.92 1.96 94.12
2009 Count 2 0 44 46 % 4.35 .00 95.65
2010 Count 1 0 48 49 % 2.04 .00 97.96
2011 Count 0 0 47 47 % .00 .00 100
2012 Count 3 0 42 45 % 6.67 .00 93.33
2013 Count 0 1 47 48 % .00 2.08 97.92
2014 Count 0 0 40 40 % .00 .00 100
Total Count 8 2 316 326
% 2.45 .61 96.93

Cenas & De Vera, Status of Mathematics Researches in Ilocos Region… _______________________________________________________________________________________________________________
127 P-ISSN 2350-7756 | E-ISSN 2350-8442 | www.apjmr.com
Asia Pacific Journal of Multidisciplinary Research, Vol. 3, No. 5, December 2015
METHOD Research type. Table 7 displays the distribution
of researches in mathematics as to the research design
being adopted such as pure quantitative, qualitative
and mixed. Many studies were judged as pure qualitative or quantitative. In can be seen in Table 7
that only eight (8) studies were classified as pure quantitative and only 2 can be considered qualitative.
Noticed however that many studies were combination
of study types and do not possess the unique characteristic of being qualitative or quantitative and
they are thus considered as mixed or hybrid studies.
The corresponding to studies of mixed type suggests that researches in the region are mixture of varied
types of studies.
DATA ANALYSIS Statistical Tools. Table 8 displays the
distribution of the researches in Mathematics in terms
of the Statistical tools used for the period 2008-2014. Notable findings are the studies which did not make
use of any statistical tool (62.58%). This is expected
since many studies were theoretical enhancements and developmental and thus did not involve any
statistical analysis. On the other hand, of those that
used statistical tools, there were still many studies who made use of basic descriptive and parametric
tools (22.70%). Very common among the descriptive tools was frequency count for categorical variables
and average weighted mean for scale variables.
Summated scale and Likert scale were very prominent wherein inferences about the target population were
made using the result of basic statistical tools such as:
t-test and ANOVA (F-test) for comparison; chi-square, Pearson r and Spearman rho for correlation;
and simple linear regression for prediction. There were studies (14.72%) that made use of
some advance statistical tools. These studies were
usually those that aimed to come up with a statistical model based on the measured interrelationship among
variables. These studies involved model building
strategies using advanced statistical tools built in many modern statistical software. Advanced
exploratory statistical procedures found in use were factor analysis and correspondence analysis while
advanced tools in classification and prediction used
where multiple stepwise regression, discriminant analysis, logistic regression, and probit analysis.
Advanced non-parametric tools found in statistical software that work on the principle of
Artificial Intelligence such as conjoint analysis,
classification tree and multilayer perceptron were found out to be appearing in some research. As the
old statistical software are being upgraded now and
then, new procedures are being introduced changing gradually the landscape of data analysis. Fortunately,
some researchers in the region were somehow being rationalized by these changes.
Table 8. Distribution of the researches in mathematics as to Statistical Tools Used
Year
statistical tool
Total
Basic descriptive and
inferential statistics
Advance predictive and
multivariate statistical
tools
No statistical
tool
2008 Count 10 6 35 51
% 19.61 11.76 68.63
2009 Count 8 6 32 46
% 17.39 13.04 69.57
2010 Count 11 13 25 49 % 22.45 26.53 51.02
2011 Count 10 3 34 47
% 21.28 6.38 72.34
2012 Count 14 5 26 45
% 31.11 11.11 57.78
2013 Count 11 4 33 48
% 22.92 8.33 68.75
2014 Count 10 11 19 40 % 25.00 27.50 47.50
Total Count 74 48 204 326
% 22.70 14.72 62.58
Cenas & De Vera, Status of Mathematics Researches in Ilocos Region… _______________________________________________________________________________________________________________
128 P-ISSN 2350-7756 | E-ISSN 2350-8442 | www.apjmr.com
Asia Pacific Journal of Multidisciplinary Research, Vol. 3, No. 5, December 2015
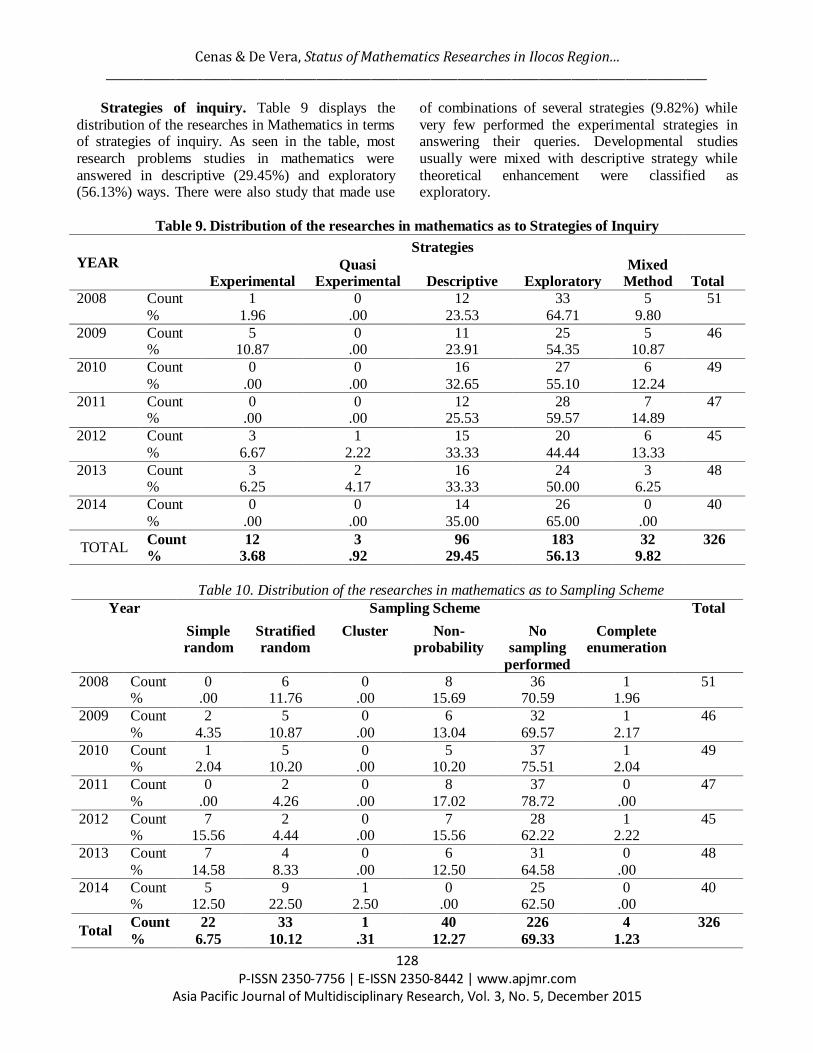
Strategies of inquiry. Table 9 displays the
distribution of the researches in Mathematics in terms of strategies of inquiry. As seen in the table, most
research problems studies in mathematics were
answered in descriptive (29.45%) and exploratory (56.13%) ways. There were also study that made use
of combinations of several strategies (9.82%) while
very few performed the experimental strategies in answering their queries. Developmental studies
usually were mixed with descriptive strategy while
theoretical enhancement were classified as exploratory.
Table 9. Distribution of the researches in mathematics as to Strategies of Inquiry
YEAR Strategies
Total Experimental Quasi
Experimental Descriptive Exploratory Mixed
Method
2008 Count 1 0 12 33 5 51
% 1.96 .00 23.53 64.71 9.80
2009 Count 5 0 11 25 5 46 % 10.87 .00 23.91 54.35 10.87
2010 Count 0 0 16 27 6 49
% .00 .00 32.65 55.10 12.24
2011 Count 0 0 12 28 7 47 % .00 .00 25.53 59.57 14.89
2012 Count 3 1 15 20 6 45
% 6.67 2.22 33.33 44.44 13.33
2013 Count 3 2 16 24 3 48 % 6.25 4.17 33.33 50.00 6.25
2014 Count 0 0 14 26 0 40
% .00 .00 35.00 65.00 .00
TOTAL Count 12 3 96 183 32 326 % 3.68 .92 29.45 56.13 9.82
Table 10. Distribution of the researches in mathematics as to Sampling Scheme
Year Sampling Scheme Total
Simple random
Stratified random
Cluster Non-probability
No sampling
performed
Complete enumeration
2008 Count 0 6 0 8 36 1 51 % .00 11.76 .00 15.69 70.59 1.96
2009 Count 2 5 0 6 32 1 46
% 4.35 10.87 .00 13.04 69.57 2.17
2010 Count 1 5 0 5 37 1 49 % 2.04 10.20 .00 10.20 75.51 2.04
2011 Count 0 2 0 8 37 0 47
% .00 4.26 .00 17.02 78.72 .00
2012 Count 7 2 0 7 28 1 45 % 15.56 4.44 .00 15.56 62.22 2.22
2013 Count 7 4 0 6 31 0 48
% 14.58 8.33 .00 12.50 64.58 .00
2014 Count 5 9 1 0 25 0 40 % 12.50 22.50 2.50 .00 62.50 .00
Total Count 22 33 1 40 226 4 326
% 6.75 10.12 .31 12.27 69.33 1.23
Cenas & De Vera, Status of Mathematics Researches in Ilocos Region… _______________________________________________________________________________________________________________
129 P-ISSN 2350-7756 | E-ISSN 2350-8442 | www.apjmr.com
Asia Pacific Journal of Multidisciplinary Research, Vol. 3, No. 5, December 2015
Sampling scheme. Sampling is a very crucial
stage of research usually those that involve survey of a wider group of respondent. As seen in Table 10,
12.27% involved non-probability sampling were
mostly were purposive. Many studies did not involve sampling because all the members of the population
were taken (1.23%) and the others, it’s not needed in the study (69.33%). On the other hand for those who
performed probability sampling, 6.75% performed
simple random sampling while stratified was the more popular (22.5%). In stratified random sampling,
student course is the most popular basis for
stratification. In sampling theory, there are criteria being set for
the choice on what variable to use as basis for stratification like the mean level and the internal
variability of the population within each stratum as a
function of the mean level. Ignoring these criteria, will make stratified sampling less precise over simple
random sampling. One important purpose of stratification is the estimation of parameters wherein
each mean of the strata are being averaged to come up
with a weighted mean that is used in the estimation. Unfortunately, most researchers ignored these
assumptions and estimation and made use only of
stratified random sampling as a method in obtaining random samples.
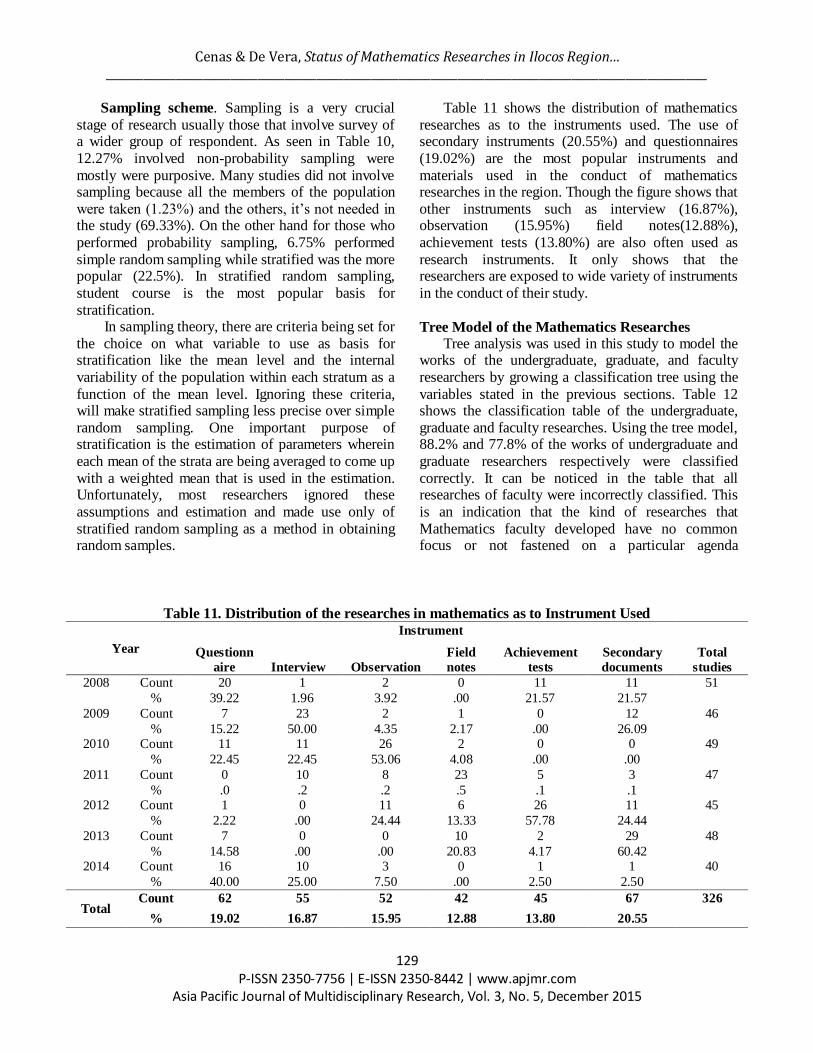
Table 11 shows the distribution of mathematics
researches as to the instruments used. The use of secondary instruments (20.55%) and questionnaires
(19.02%) are the most popular instruments and
materials used in the conduct of mathematics researches in the region. Though the figure shows that
other instruments such as interview (16.87%), observation (15.95%) field notes(12.88%),
achievement tests (13.80%) are also often used as
research instruments. It only shows that the researchers are exposed to wide variety of instruments
in the conduct of their study.
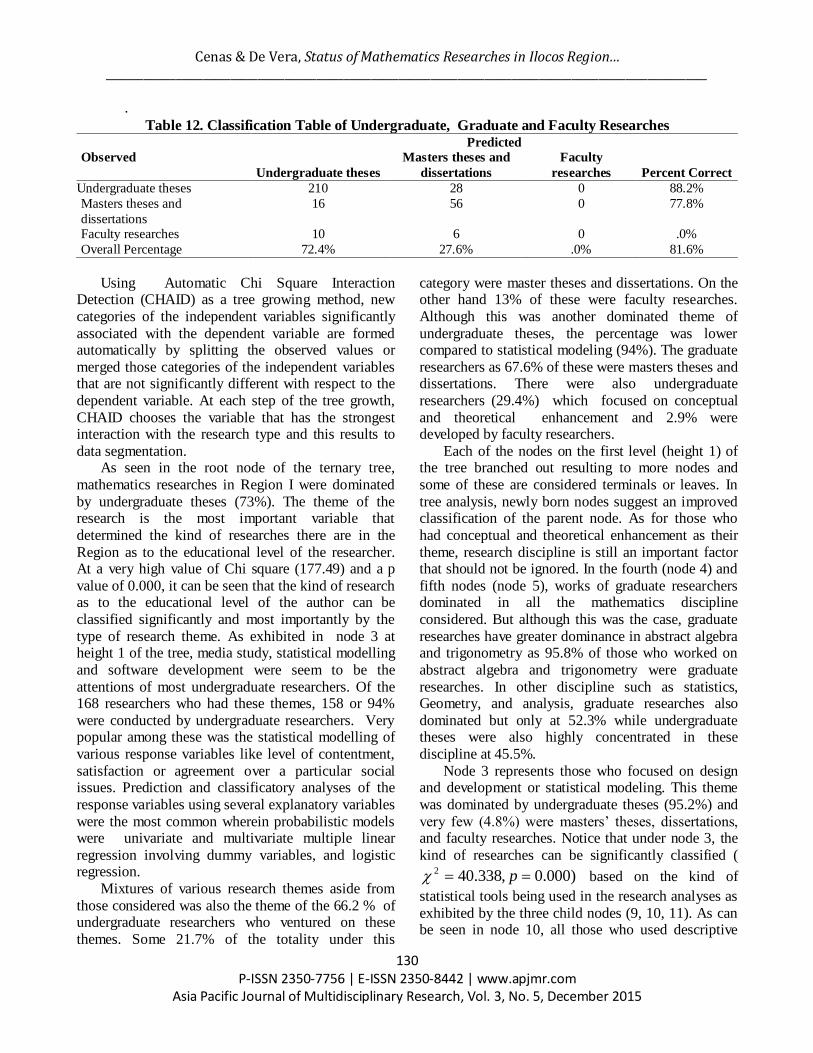
Tree Model of the Mathematics Researches Tree analysis was used in this study to model the
works of the undergraduate, graduate, and faculty
researchers by growing a classification tree using the
variables stated in the previous sections. Table 12 shows the classification table of the undergraduate,
graduate and faculty researches. Using the tree model, 88.2% and 77.8% of the works of undergraduate and
graduate researchers respectively were classified
correctly. It can be noticed in the table that all researches of faculty were incorrectly classified. This
is an indication that the kind of researches that
Mathematics faculty developed have no common focus or not fastened on a particular agenda
Table 11. Distribution of the researches in mathematics as to Instrument Used
Year
Instrument
Total
studies
Questionn
aire Interview Observation
Field
notes
Achievement
tests
Secondary
documents
2008 Count 20 1 2 0 11 11 51
% 39.22 1.96 3.92 .00 21.57 21.57
2009 Count 7 23 2 1 0 12 46
% 15.22 50.00 4.35 2.17 .00 26.09 2010 Count 11 11 26 2 0 0 49
% 22.45 22.45 53.06 4.08 .00 .00
2011 Count 0 10 8 23 5 3 47
% .0 .2 .2 .5 .1 .1 2012 Count 1 0 11 6 26 11 45
% 2.22 .00 24.44 13.33 57.78 24.44
2013 Count 7 0 0 10 2 29 48
% 14.58 .00 .00 20.83 4.17 60.42 2014 Count 16 10 3 0 1 1 40
% 40.00 25.00 7.50 .00 2.50 2.50
Total Count 62 55 52 42 45 67 326
% 19.02 16.87 15.95 12.88 13.80 20.55
Cenas & De Vera, Status of Mathematics Researches in Ilocos Region… _______________________________________________________________________________________________________________
130 P-ISSN 2350-7756 | E-ISSN 2350-8442 | www.apjmr.com
Asia Pacific Journal of Multidisciplinary Research, Vol. 3, No. 5, December 2015
.
Table 12. Classification Table of Undergraduate, Graduate and Faculty Researches
Observed
Predicted
Undergraduate theses
Masters theses and
dissertations
Faculty
researches Percent Correct
Undergraduate theses 210 28 0 88.2%
Masters theses and
dissertations
16 56 0 77.8%
Faculty researches 10 6 0 .0%
Overall Percentage 72.4% 27.6% .0% 81.6%
Using Automatic Chi Square Interaction Detection (CHAID) as a tree growing method, new
categories of the independent variables significantly
associated with the dependent variable are formed automatically by splitting the observed values or
merged those categories of the independent variables that are not significantly different with respect to the
dependent variable. At each step of the tree growth,
CHAID chooses the variable that has the strongest interaction with the research type and this results to
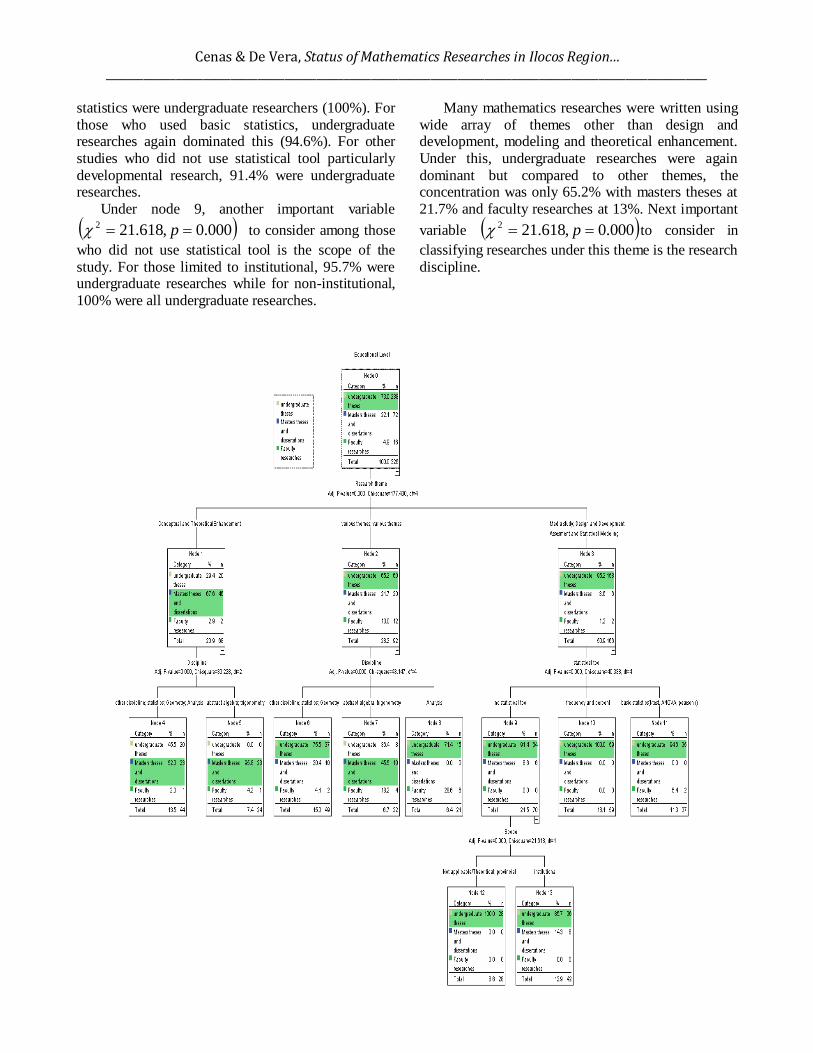
data segmentation. As seen in the root node of the ternary tree,
mathematics researches in Region I were dominated
by undergraduate theses (73%). The theme of the research is the most important variable that
determined the kind of researches there are in the
Region as to the educational level of the researcher. At a very high value of Chi square (177.49) and a p
value of 0.000, it can be seen that the kind of research as to the educational level of the author can be
classified significantly and most importantly by the
type of research theme. As exhibited in node 3 at height 1 of the tree, media study, statistical modelling
and software development were seem to be the
attentions of most undergraduate researchers. Of the 168 researchers who had these themes, 158 or 94%
were conducted by undergraduate researchers. Very popular among these was the statistical modelling of
various response variables like level of contentment,
satisfaction or agreement over a particular social issues. Prediction and classificatory analyses of the
response variables using several explanatory variables
were the most common wherein probabilistic models were univariate and multivariate multiple linear
regression involving dummy variables, and logistic regression.
Mixtures of various research themes aside from
those considered was also the theme of the 66.2 % of undergraduate researchers who ventured on these
themes. Some 21.7% of the totality under this
category were master theses and dissertations. On the other hand 13% of these were faculty researches.
Although this was another dominated theme of
undergraduate theses, the percentage was lower compared to statistical modeling (94%). The graduate
researchers as 67.6% of these were masters theses and dissertations. There were also undergraduate
researchers (29.4%) which focused on conceptual
and theoretical enhancement and 2.9% were developed by faculty researchers.
Each of the nodes on the first level (height 1) of the tree branched out resulting to more nodes and
some of these are considered terminals or leaves. In
tree analysis, newly born nodes suggest an improved classification of the parent node. As for those who
had conceptual and theoretical enhancement as their
theme, research discipline is still an important factor that should not be ignored. In the fourth (node 4) and
fifth nodes (node 5), works of graduate researchers dominated in all the mathematics discipline
considered. But although this was the case, graduate
researches have greater dominance in abstract algebra and trigonometry as 95.8% of those who worked on
abstract algebra and trigonometry were graduate
researches. In other discipline such as statistics, Geometry, and analysis, graduate researches also
dominated but only at 52.3% while undergraduate theses were also highly concentrated in these
discipline at 45.5%.
Node 3 represents those who focused on design and development or statistical modeling. This theme
was dominated by undergraduate theses (95.2%) and
very few (4.8%) were masters’ theses, dissertations, and faculty researches. Notice that under node 3, the
kind of researches can be significantly classified (
)000.0,338.402 p based on the kind of
statistical tools being used in the research analyses as
exhibited by the three child nodes (9, 10, 11). As can be seen in node 10, all those who used descriptive
Cenas & De Vera, Status of Mathematics Researches in Ilocos Region… _______________________________________________________________________________________________________________
132 P-ISSN 2350-7756 | E-ISSN 2350-8442 | www.apjmr.com
Asia Pacific Journal of Multidisciplinary Research, Vol. 3, No. 5, December 2015
statistics were undergraduate researchers (100%). For
those who used basic statistics, undergraduate researches again dominated this (94.6%). For other
studies who did not use statistical tool particularly
developmental research, 91.4% were undergraduate researches.
Under node 9, another important variable
000.0,618.212 p to consider among those
who did not use statistical tool is the scope of the
study. For those limited to institutional, 95.7% were undergraduate researches while for non-institutional,
100% were all undergraduate researches.
Many mathematics researches were written using
wide array of themes other than design and development, modeling and theoretical enhancement.
Under this, undergraduate researches were again
dominant but compared to other themes, the concentration was only 65.2% with masters theses at
21.7% and faculty researches at 13%. Next important
variable 000.0,618.212 p to consider in
classifying researches under this theme is the research
discipline.
Cenas & De Vera, Status of Mathematics Researches in Ilocos Region… _______________________________________________________________________________________________________________
132 P-ISSN 2350-7756 | E-ISSN 2350-8442 | www.apjmr.com
Asia Pacific Journal of Multidisciplinary Research, Vol. 3, No. 5, December 2015
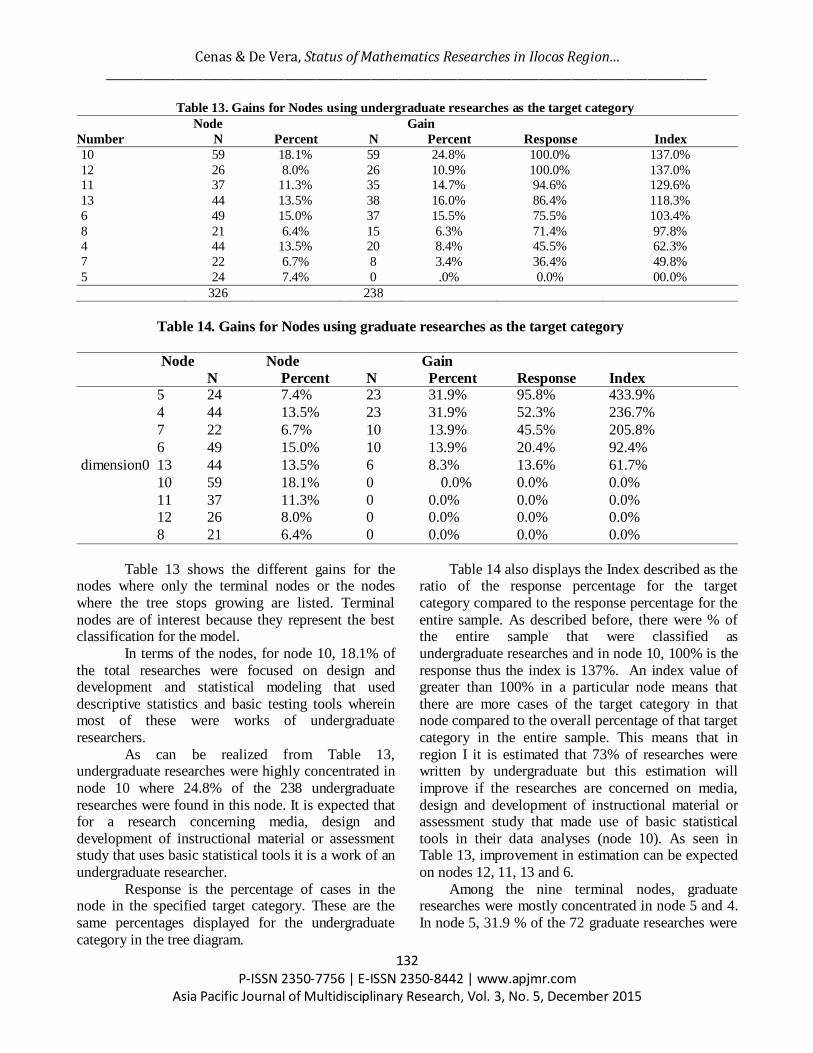
Table 13. Gains for Nodes using undergraduate researches as the target category
Node
Gain
Response Index Number N Percent N Percent
10 59 18.1% 59 24.8% 100.0% 137.0%
12 26 8.0% 26 10.9% 100.0% 137.0% 11 37 11.3% 35 14.7% 94.6% 129.6%
13 44 13.5% 38 16.0% 86.4% 118.3%
6 49 15.0% 37 15.5% 75.5% 103.4%
8 21 6.4% 15 6.3% 71.4% 97.8% 4 44 13.5% 20 8.4% 45.5% 62.3%
7 22 6.7% 8 3.4% 36.4% 49.8%
5 24 7.4% 0 .0% 0.0% 00.0%
326 238
Table 14. Gains for Nodes using graduate researches as the target category
Node Node Gain
Response Index N Percent N Percent
dimension0
5 24 7.4% 23 31.9% 95.8% 433.9%
4 44 13.5% 23 31.9% 52.3% 236.7%
7 22 6.7% 10 13.9% 45.5% 205.8%
6 49 15.0% 10 13.9% 20.4% 92.4%
13 44 13.5% 6 8.3% 13.6% 61.7%
10 59 18.1% 0 0.0% 0.0% 0.0%
11 37 11.3% 0 0.0% 0.0% 0.0%
12 26 8.0% 0 0.0% 0.0% 0.0%
8 21 6.4% 0 0.0% 0.0% 0.0%
Table 13 shows the different gains for the nodes where only the terminal nodes or the nodes
where the tree stops growing are listed. Terminal
nodes are of interest because they represent the best classification for the model.
In terms of the nodes, for node 10, 18.1% of
the total researches were focused on design and development and statistical modeling that used
descriptive statistics and basic testing tools wherein most of these were works of undergraduate
researchers.
As can be realized from Table 13, undergraduate researches were highly concentrated in
node 10 where 24.8% of the 238 undergraduate
researches were found in this node. It is expected that for a research concerning media, design and
development of instructional material or assessment study that uses basic statistical tools it is a work of an
undergraduate researcher.
Response is the percentage of cases in the node in the specified target category. These are the
same percentages displayed for the undergraduate
category in the tree diagram.
Table 14 also displays the Index described as the ratio of the response percentage for the target
category compared to the response percentage for the
entire sample. As described before, there were % of the entire sample that were classified as
undergraduate researches and in node 10, 100% is the
response thus the index is 137%. An index value of greater than 100% in a particular node means that
there are more cases of the target category in that node compared to the overall percentage of that target
category in the entire sample. This means that in
region I it is estimated that 73% of researches were written by undergraduate but this estimation will
improve if the researches are concerned on media,
design and development of instructional material or assessment study that made use of basic statistical
tools in their data analyses (node 10). As seen in Table 13, improvement in estimation can be expected
on nodes 12, 11, 13 and 6.
Among the nine terminal nodes, graduate researches were mostly concentrated in node 5 and 4.
In node 5, 31.9 % of the 72 graduate researches were
Cenas & De Vera, Status of Mathematics Researches in Ilocos Region… _______________________________________________________________________________________________________________
133 P-ISSN 2350-7756 | E-ISSN 2350-8442 | www.apjmr.com
Asia Pacific Journal of Multidisciplinary Research, Vol. 3, No. 5, December 2015
concentrated in this node while another 31.9% were
concentrated in node 4. Improvement in the estimation and classification
is noteworthy in nodes 5,4, and 7 as the index values
exceed 100% for these nodes.
PROPOSED 2016-2020 MATHEMATICS RESEARCH
AGENDA The research areas on Mathematics were
identified based on the findings of this study on the characteristics of Mathematics researches in Region I.
The formulation of the research agenda for the next
five years will support the National Higher Education Research Agenda (NHERA) Priority Research
Areas/Themes for the year 2008 – 2018. The formulation of the proposed agenda was guided by
the principles parallel to that used by the NHERA
namely: (1) Multidisciplinary. Researches that involve the expertise of researchers in several
disciplines are preferred over researches needing the expertise in a single discipline; (2) Policy orientation.
Policy- oriented researches are preferred over
researches that have little or no policy implication
across the various higher education disciplines ; (3) Participation and networking. The research should
involve the participation of as many stakeholders as
possible and should be organized preferably as network, instead of stand alone, undertaking of an
HEI or individual researcher (4) Balanced attention to basic and applied research. Both basic or pure
research and applied research shall be given due
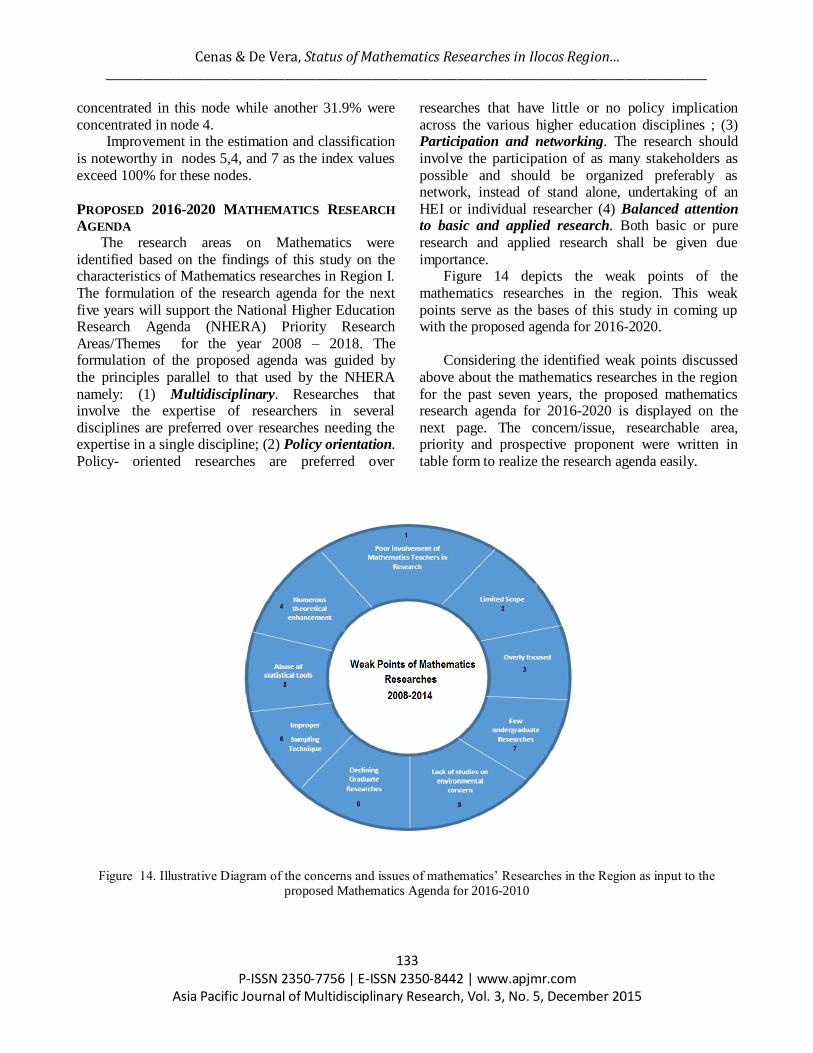
importance. Figure 14 depicts the weak points of the
mathematics researches in the region. This weak
points serve as the bases of this study in coming up with the proposed agenda for 2016-2020.
Considering the identified weak points discussed
above about the mathematics researches in the region
for the past seven years, the proposed mathematics research agenda for 2016-2020 is displayed on the
next page. The concern/issue, researchable area, priority and prospective proponent were written in
table form to realize the research agenda easily.
Figure 14. Illustrative Diagram of the concerns and issues of mathematics’ Researches in the Region as input to the
proposed Mathematics Agenda for 2016-2010

Cenas & De Vera, Status of Mathematics Researches in Ilocos Region… _______________________________________________________________________________________________________________
134 P-ISSN 2350-7756 | E-ISSN 2350-8442 | www.apjmr.com
Asia Pacific Journal of Multidisciplinary Research, Vol. 3, No. 5, December 2015
Table 15. The proposed Mathematics Research Agenda
Concern/Issue Researchable Area Priority Prospective Proponent
Poor Involvement of Mathematics
Teachers in the Conduct of
Research
Assessment of the factors that hinder
mathematics faculty to conduct research:
(a) personal factor
(b) job--related factors
1
Mathematics Faculty and
Administrators
The scope of study in
Mathematics in the Region was
limited to institutional level
Collaborative study in mathematics of
different state university in the region and
in the country that will focus on cultural practices depicted in the touches of
mathematical patterns in their respective
products like furniture, potteries, etc.
2
Mathematics faculty in the
region
Overly focused researches in
Calculus, Algebra and Geometry
Studies in other areas of mathematics less
explored like Numerical Analysis, Graph
Theory, Mathematical Statistics, Discrete
Mathematics
3
BSMath or MA/MS math
students
Numerous studies on theoretical
and conceptual enhancement
Application of the Enhanced Mathematical
Theories in Economics, Information Technology, Business, Applied Statistics,
Actuarial Sciences etc.
4
Undergraduate students
teamed with undergraduate students of Economics, IT,
Business, and Sciences
Abuse of basic statistical tools in
data analysis
1. Awareness of researches on the assumptions of most statistical tools
2. Application of data mining, neural
network technology, and artificial
intelligence in the analysis of research data
5
Students under the BS Stat
program or BS Math major
in Statistics
Lack of theoretical background of
the researchers about sampling techniques and their applications
Comparison of the performance of
different sampling method using computer simulated and actual data in reducing
sampling error
6
Students under the BS Stat
program or BS Math major in Statistics
Low enrolment in BS
Mathematics and math-related
program
as evidenced by the small number of researches produced by
undergraduate students in Math
program and its ally
Tracer study of BS Math graduates in the
region
Assessment of the industry needs of graduates of math related courses
7
Math faculty in the region
Declining number of math
researches produced by graduate
students
Analysis of pattern of academic
progression of Graduate students in
Mathematics
8
Math faculty and
Ed.D/PhD students in
math
Lack of Studies on
Environmental concerns
Mathematical Model of the Effect of
Climate Change on Human and the
Environment: A collaborative study
9
Mathematics and Science
Teachers in Region I
Cenas & De Vera, Status of Mathematics Researches in Ilocos Region… _______________________________________________________________________________________________________________
135 P-ISSN 2350-7756 | E-ISSN 2350-8442 | www.apjmr.com
Asia Pacific Journal of Multidisciplinary Research, Vol. 3, No. 5, December 2015
CONCLUSIONS AND RECOMMENDATIONS Based on the result of this study, it was found out
and concluded that: (1) through the years, the
mathematics researches in the region are generally
produced by undergraduate students and focus mainly on Calculus. Survey studies have the respondents as
mostly students who were selected using non-probability sampling and limited mostly to
institutional level. In terms of thematic focus,
researches are basically about enhancement of known theories and concepts in Mathematics and thus the use
of statistical tools are being avoided and if ever
needed, these tools are classified as basic statistical tools. The design are mixtures of qualitative and
quantitative with strategies of inquiry as mostly exploratory. The data were gathered using
questionnaire or from secondary sources; (2) the
decision tree model depicting the classification of mathematics researches in region is a function of the
research theme, discipline, statistical tools employed and the scope of the study. The research theme is the
most important significant variables. For those with
themes on conceptual enhancement, the next important variable is the mathematics discipline. On
the other hand for those researches with themes on
design and development, media studies, and statistical modelling, the next important variable is the statistical
tools being employed. For those who have not used statistical tools, the scope of the study is the next
important variable; (3) several researchable areas and
prospective components are identified in the formulated mathematics research agenda in their order
of priorities based on the problems and focus found
out in this study. Having known the trend of the mathematics
researches, the proposed Mathematics Research Agenda for the next five years is strongly
recommended by this study to be implemented in the
higher educational institutions in the region.
REFERENCES
[1] Immanuel Kant retrieved from: http://www.cs.mcgill.ca/~rwest/wikispeedia/wpcd/w
p/i/Immanuel_Kant.htm
[2] Quotations retrieved from:
https://www.goodreads.com/author/quotes/11038.Immanuel_Kant?page=2
[3] "Doing the Math and Making an Impact” by
Professor Arnold retrieved from:
http://www.ima.umn.edu/newsltrs/updates/summer03
[4] The importance of mathematics education in today’s
complex society. Retrieved from:
http://www.ydp.eu/resources/the-importance-of-mathematical-education-in-today%E2%80%99s-
complex-society
[5] ASEAN community 2015: Managing integration for
better jobs and shared prosperity. Retrieved from:http://www.adb.org/sites/default/files/publicati
on/42818/asean-community-2015-managing-
integration.pdf
[6] 8 ways PH higher education can prepare for ASEAN 2015 retrieved from: http://www.rappler.com/move-
ph/issues/education/44519-higher-education-sector-
asean-2015-preparation
[7] National Higher Education Research Agenda-2 http://pacu.org.ph/wp2/wp-
content/uploads/2013/06/Nationa-Higher-Education-
Research-Agenda-2.pdf
[8] Dayag et al.,(2012) The State of Linguistic In the Philippines, Trends Prospect and
Challenges.Linguistic Society of the Philippines
[9] Voskoglou Michael, (2008) “Problem Solving in
Mathematics Education: Recent Trends and Development” ,Higher Technological Educational
Institute School of Technological Applications
26334 Patras – Greece
[10] Hyde et.al, New Trends in Gender and Mathematics Performance: A Meta-Analysis
Retrieved from:
http://www.ncbi.nlm.nih.gov/pmc/articles/PMC3057
475/ [11] Conway, Paul and Sloane, Finbarr, (2005)
“International Trends in Post-Primary Mathematics
Education: Research report commissioned by the
National Council for Curriculum and Assessment [12] Yu-Chen Su et. al, (2009) Research Trends in
Technology-based Learning from 2000 to 2009:
Content Analysis of Publications in Selected
Journals. [13] Bozkurt et. al. Trends in Distance Education
Research: A Content Analysis of Journals 2009-
2013. The International Review Research in Open
distributed Learning Vol. 16, No 1 [14] Bozkaya, et.al, Research Trends and Issues in
Educational Technology: A Content Analysis of
Turkish Online Journal of Educational Technology
(2008-2011). The Turkish Online Journal of Educational Technology, April 2012, Volume II
Issue 2.
[15] GÖKTAŞ et. al. (2012) Trends in Educational
Research in Turkey: A Content Analysis. Retrieved from:
Cenas & De Vera, Status of Mathematics Researches in Ilocos Region… _______________________________________________________________________________________________________________
136 P-ISSN 2350-7756 | E-ISSN 2350-8442 | www.apjmr.com
Asia Pacific Journal of Multidisciplinary Research, Vol. 3, No. 5, December 2015
http://www.academia.edu/1476503/Trends_in_Educa
tional_Research_in_Turkey_A_Content_Analysis_
[16] Tang Wee Teo. (2014) Chemistry Education Research Trends: 2004-2013. Chemistry Education
Research and Practice Issue 4. Retrieved from:
http://pubs.rsc.org/en/Content/ArticleLanding/
2014/RP/c4rp00104d#!divAbstract [17] Content analysis retrieved from:
http://www.audiencedialogue.net/kya16a.html
COPYRIGHTS Copyright of this article is retained by the author/s, with first publication rights granted to APJMR. This is an open-
access article distributed under the terms and conditions of
the Creative Commons Attribution license (http://creative
commons.org/licenses/by/4.0/