report no. 2017-8 - psa.gov.ph and labor... · ilocos region 54.3 51.7 60.3 52.2 48.0 cagayan...
TRANSCRIPT

POPULATION AND LABOR FORCE
PHILIPPINE STATISTICS AUTHORITY
ISSN-2012-0435
REPORT No. 2017-8
PHILIPPINE STATISTICS AUTHORITY 16
th Floor, Eton Cyberpod Centris 3
EDSA, corner Quezon Avenue, Quezon City, Philippines 1100
Telefax No.: +63(2) 376-1954
URL: http://psa.gov.ph
/PhilippineStatisticsAuthority /PSAgovph

POPULATION AND LABOR FORCE
PHILIPPINE STATISTICS AUTHORITY
TERMS OF USE Agricultural Indicators System (AIS) is a publication of the Philippine Statistics Authority. The PSA reserves exclusive right to reproduce this publication in whatever form. Should any portion of this publication be included in a report/article, the title of the publication and the PSA should be cited as the source of the data. The PSA will not be responsible for any information derived from the processing of data contained in this publication.
ISSN-2012-0435 DECEMBER 2017


POPULATION AND LABOR FORCE
PHILIPPINE STATISTICS AUTHORITY
TABLE OF CONTENTS
iii 24
Tab
le 1
0b
.La
bo
r p
rod
uct
ivit
y in
agr
icu
ltu
re b
y re
gio
n, P
hili
pp
ine
s, 2
01
2-2
01
6(P
at
con
sta
nt
20
00
pri
ces)
Ph
ilip
pin
es5
7,8
00
59
,73
46
0,9
10
63
,72
86
4,2
18
NC
R1
62
,12
91
63
,93
11
59
,76
61
98
,21
32
03
,32
5C
AR
37
,26
53
8,0
66
35
,58
03
4,6
81
36
,08
6Il
oco
s R
egio
n7
1,2
06
78
,27
78
0,3
47
82
,68
38
6,5
44
Ca
gaya
n V
all
ey5
4,9
92
54
,89
86
0,0
03
59
,46
86
2,9
70
Cen
tra
l Lu
zon
12
5,1
24
12
7,9
41
13
7,8
03
15
3,5
63
17
6,1
05
CA
LAB
AR
ZON
95
,24
31
06
,64
59
6,9
65
11
1,1
47
13
4,6
37
MIM
AR
OP
A4
3,6
18
44
,21
94
5,3
64
48
,14
74
7,5
10
Bic
ol
Reg
ion
36
,09
13
8,6
22
39
,34
43
7,9
00
39
,16
0W
este
rn V
isa
yas
57
,13
05
6,6
64
50
,90
15
1,9
93
54
,29
1C
entr
al
Vis
aya
s3
2,5
93
32
,46
43
0,8
11
31
,71
53
0,0
77
East
ern
Vis
aya
s4
0,9
24
37
,33
05
2,4
20
57
,43
33
7,6
03
Zam
bo
an
ga P
enin
sula
44
,39
04
4,9
33
48
,16
15
0,5
68
43
,10
1N
ort
her
n M
ind
an
ao
69
,61
87
8,6
18
74
,01
18
5,8
78
91
,57
4D
ava
o R
egio
n6
0,3
13
57
,50
45
7,8
13
64
,37
65
8,6
23
SOC
CSK
SAR
GEN
60
,36
96
2,9
52
66
,53
46
6,5
47
62
,93
2C
ara
ga4
2,8
76
45
,50
34
5,9
32
42
,72
94
1,0
56
AR
MM
34
,17
63
5,8
68
33
,65
63
3,6
84
38
,55
2
Sou
rce:
Ph
ilip
pin
e St
ati
stic
s A
uth
ori
ty (
PSA
)
20
16
REG
ION
20
12
20
13
20
14
R2
01
5R
FOREWORD i
LIST OF TABLES i i i
POPULATION and LABOR FORCE
Table 1. Total household population 15 years old and over by region,Philippines, 2012-2016 7
Table 2a. Labor force by region, Philippines, 2012-2016 8
Table 2b. Labor force participation rate by region, 9Philippines, 2012-2016
Table 3a. Number of employed persons by region, 10Philippines, 2012-2016
Table 3b. Employment rate by region, Philippines, 2012-2016 11
Table 4a. Number of unemployed persons by region, 12Philippines, 2012-2016
Table 4b. Unemployment rate by region, Philippines, 2012-2016 13
Table 5a. Number of visibly underemployed persons by region, Philippines, 2012-2016 14
Table 5b. Visible underemployment rate by region, 15Philippines, 2012-2016
Table 6a. Total number of employed persons in agriculture by region,Philippines, 2012-2016 16
Table 6b. Proportion of employed persons in agriculture by region,Philippines, 2012-2016 17
Table 7a. Number of employed persons in agriculture by class of workers, Philippines, 2012-2016 18
Table 7b. Proportion of employed persons in agriculture by class of workers, Philippines, 2012-2016 19
Table 8. Average daily basic pay of wage and salary agricultural workers, Philippines, 2012-2016 20

POPULATION AND LABOR FORCE
PHILIPPINE STATISTICS AUTHORITY
23
TABLE OF CONTENTS
iv
Tab
le 1
0a.
Lab
or
pro
du
ctiv
ity
in a
gric
ult
ure
by
regi
on
, Ph
ilip
pin
es,
20
12
-20
16
( P
at
curr
ent
pri
ces)
Ph
ilip
pin
es1
03
,34
61
09
,70
51
21
,31
01
21
,02
61
26
,32
1
NC
R2
55
,58
12
66
,58
63
01
,45
44
29
,59
54
59
,98
2C
AR
62
,19
16
7,7
70
68
,60
66
3,0
16
69
,31
1Il
oco
s R
egio
n1
18
,21
61
32
,87
41
44
,51
01
43
,64
11
51
,37
7C
aga
yan
Va
lley
93
,40
59
7,0
77
12
2,4
17
10
6,9
57
11
6,1
61
Cen
tra
l Lu
zon
19
6,5
68
20
8,8
69
24
9,6
28
25
1,9
28
28
7,7
82
CA
LAB
AR
ZON
14
4,9
94
16
5,1
98
16
4,4
68
18
2,1
83
22
5,9
50
MIM
AR
OP
A7
9,5
54
82
,31
79
4,2
15
94
,99
39
8,0
93
Bic
ol
Reg
ion
64
,38
17
2,0
69
82
,12
77
4,3
46
80
,45
8W
este
rn V
isa
yas
10
1,8
44
10
7,2
53
10
4,4
41
10
5,4
06
11
1,5
75
Cen
tra
l V
isa
yas
62
,74
56
0,8
18
62
,46
76
5,1
38
63
,49
6Ea
ster
n V
isa
yas
67
,43
86
3,9
07
10
8,4
15
11
7,4
09
79
,23
9Za
mb
oa
nga
Pen
insu
la9
3,3
63
94
,86
61
00
,51
99
8,9
40
87
,01
3N
ort
her
n M
ind
an
ao
13
1,2
59
14
5,0
13
14
4,4
35
16
6,8
57
19
2,4
64
Da
vao
Reg
ion
13
4,7
54
13
5,0
20
14
9,1
08
16
7,2
82
16
3,8
96
SOC
CSK
SAR
GEN
12
0,2
70
13
0,0
14
14
0,5
05
12
8,9
34
13
0,6
00
Ca
raga
78
,34
58
0,8
62
93
,74
38
5,3
10
87
,97
0A
RM
M7
0,9
31
79
,69
07
4,4
62
69
,04
28
3,2
06
Sour
ce: P
hilip
pine
Sta
tist
ics
Au
thor
ity
(PSA
)
REG
ION
20
12
20
13
20
14
R2
01
5R
20
16
Table 9a. Total number of working children 5-17 years old in agriculture by region, Philippines, 2012-2016 21
Table 9b. Proportion of working children 5-17 years old in agriculture by region, Philippines, 2012-2016 22
Table 10a. Labor productivity in agriculture by region, Philippines,2012-2016 (at current prices) 23
Table 10b. Labor productivity in agriculture by region, Philippines,2012-2016 (at constant prices) 24
POPULATION AND LABOR FORCE
PHILIPPINE STATISTICS AUTHORITY
22
Table 9b.Proportion of working children 5-17 years old in agriculture by region, Philippines, 2012-2016(in percent)
PHILIPPINES 59.4 57.9 57.7 54.9 51.6
NCR 2.0 2.0 2.0 2.7 2.9 CAR 81.1 80.5 83.7 82.6 75.8 Ilocos Region 54.3 51.7 60.3 52.2 48.0 Cagayan Valley 78.7 78.9 76.4 77.4 64.7 Central Luzon 45.5 42.7 38.0 33.0 21.8 CALABARZON 36.3 32.5 38.2 26.1 15.3 MIMAROPA 64.9 69.3 66.9 69.6 62.3 Bicol Region 51.2 47.3 48.5 47.3 49.7 Western Visayas 59.2 57.0 58.1 55.8 60.3 Central Visayas 58.8 57.0 59.8 51.3 55.2 Eastern Visayas 58.7 57.9 55.6 58.3 56.2 Zamboanga Peninsula 72.7 75.2 67.5 68.8 67.1 Northern Mindanao 67.4 66.2 66.4 62.7 60.4 Davao Region 52.9 55.2 53.0 44.6 39.7 SOCCSKSARGEN 69.3 67.6 69.2 67.2 55.1 Caraga 54.5 50.0 54.5 53.3 60.8 ARMM 88.2 83.1 82.6 83.6 81.5
Source: Philippine Statistics Authority (PSA)
ITEM 2012 2013 2014 2015R 2016

POPULATION AND LABOR FORCE
PHILIPPINE STATISTICS AUTHORITY
1 20
Household Population aged 15 Years Old and Over The number of persons aged 15 years old and over enumerated in private households during the survey indicates the number of persons available for work. In 2016, the country’s working age population 15 years old and over totaled 68.31 million persons. Across regions, CALABARZON recorded the biggest number of this population group at 9.54 million persons. This was followed by NCR with 8.92 million persons and Central Luzon with 7.56 million persons. The working age population in Ilocos Region, Bicol Region, Eastern Visayas, Northern Mindanao, Davao Region and SOCCSKSARGEN ranged from 3.0 million to 3.90 million persons. CAR had the least count of this age group at 1.21 million persons (Table 1).
Labor Force Labor force describes the population aged 15 years old and over, whether employed and unemployed, who contributed to the production of goods and services in the country. It serves as an indicator of the extent by which working age population joins the stream of available manpower supply. A total of 43.36 million persons were in the labor force in 2016. It corresponded to labor force participation rate (LFPR) of 63.5 percent (Tables 2a-2b). By region, the biggest labor force population was registered in CALABARZON at 6.13 million persons. NCR and Central Luzon came next with 5.61 million persons and 4.69 million persons, respectively. The labor force counts in Cagayan Valley, MIMAROPA, Zamboanga Peninsula, SOCCSKSARGEN, Caraga and ARMM ranged from 1.14 million to 1.93 million persons. The least number was noted in CAR at 0.80 million persons. The 2016 LFPRs were highest in Central Visayas at 66.9 percent, Northern Mindanao at 66.7 percent and CAR at 66.1 percent. LFPRs from 62.0 percent to 62.9 percent were exhibited by NCR, Ilocos Region, Central Luzon, Bicol Region, Eastern Visayas and Davao Region. It was lowest in ARMM at 52.4 percent.
Tab
le 8
.A
vera
ge d
aily
bas
ic p
ay o
f w
age
an
d s
alar
y ag
ricu
ltu
ral w
ork
ers
, Ph
ilip
pin
es,
20
12
-20
16
(in
pes
os)
Agr
icu
ltu
re1
66
.74
17
0.3
4
1
85
.31
19
4.3
8
2
09
.32
5.9
Agr
icu
ltu
re, H
un
tin
g a
nd
Fo
rest
ry1
65
.27
16
9.2
2
1
84
.53
19
2.9
9
2
08
.25
6.0
Fish
ing
19
1.6
8
1
89
.48
19
9.3
2
2
18
.48
22
5.9
5
4
.3
Sour
ce: P
hilip
pine
Sta
tist
ics
Aut
hori
ty (
PSA
)
20
16
GR
OW
TH R
ATE
(%
)
20
12
-20
16
ITEM
20
12
20
13
20
14
20
15
POPULATION AND LABOR FORCE
PHILIPPINE STATISTICS AUTHORITY
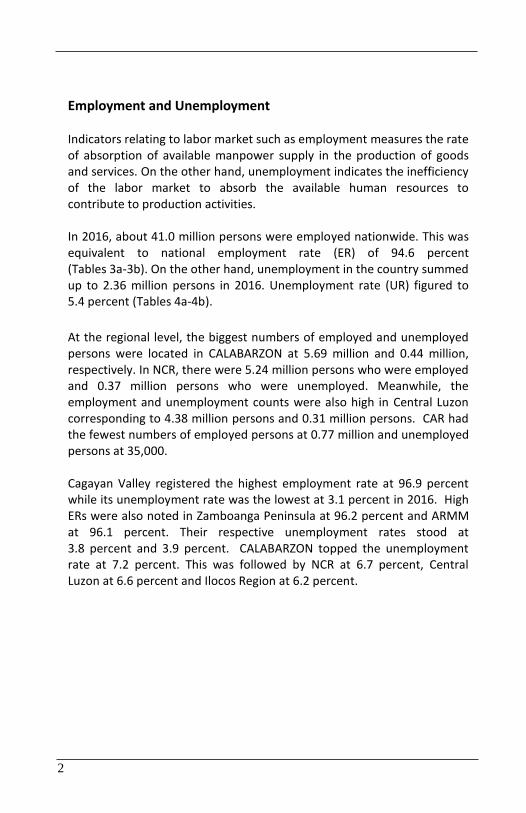
Employment and Unemployment Indicators relating to labor market such as employment measures the rate of absorption of available manpower supply in the production of goods and services. On the other hand, unemployment indicates the inefficiency of the labor market to absorb the available human resources to contribute to production activities. In 2016, about 41.0 million persons were employed nationwide. This was equivalent to national employment rate (ER) of 94.6 percent (Tables 3a-3b). On the other hand, unemployment in the country summed up to 2.36 million persons in 2016. Unemployment rate (UR) figured to 5.4 percent (Tables 4a-4b).
At the regional level, the biggest numbers of employed and unemployed persons were located in CALABARZON at 5.69 million and 0.44 million, respectively. In NCR, there were 5.24 million persons who were employed and 0.37 million persons who were unemployed. Meanwhile, the employment and unemployment counts were also high in Central Luzon corresponding to 4.38 million persons and 0.31 million persons. CAR had the fewest numbers of employed persons at 0.77 million and unemployed persons at 35,000. Cagayan Valley registered the highest employment rate at 96.9 percent while its unemployment rate was the lowest at 3.1 percent in 2016. High ERs were also noted in Zamboanga Peninsula at 96.2 percent and ARMM at 96.1 percent. Their respective unemployment rates stood at 3.8 percent and 3.9 percent. CALABARZON topped the unemployment rate at 7.2 percent. This was followed by NCR at 6.7 percent, Central Luzon at 6.6 percent and Ilocos Region at 6.2 percent.
19 2
Tab
le 7
b.
Pro
po
rtio
n o
f e
mp
loye
d p
ers
on
s b
y cl
ass
of
wo
rke
rs, P
hili
pp
ine
s, 2
01
2-2
01
6(i
n p
erce
nt)
Wa
ge a
nd
Sa
lary
Wo
rker
s3
1.4
32
.23
0.0
30
.53
2.3
Wo
rked
fo
r P
riva
te H
ou
seh
old
/Es
tab
lish
men
t/Fa
mil
y-O
per
ate
d A
ctiv
itie
s3
1.4
32
.23
0.0
30
.53
2.2
Wo
rked
fo
r G
ove
rnm
ent/
Go
vern
men
t C
orp
ora
tio
n0
.0-
--
0.0
Ow
n-a
cco
un
t W
ork
ers
44
.84
5.2
46
.34
6.9
48
.8
Self
-Em
plo
yed
38
.53
8.8
40
.34
0.5
41
.7
Emp
loye
r6
.36
.46
.06
.37
.1
Un
pa
id F
am
ily
Wo
rker
s2
3.8
22
.62
3.7
22
.61
8.9
T
ota
l1
00
10
01
00
10
01
00
Sour
ce: P
hilip
pine
Sta
tist
ics
Au
thor
ity
(PSA
)
20
16
CLA
SS O
F W
OR
KER
S2
01
22
01
32
01
42
01
5

POPULATION AND LABOR FORCE
PHILIPPINE STATISTICS AUTHORITY
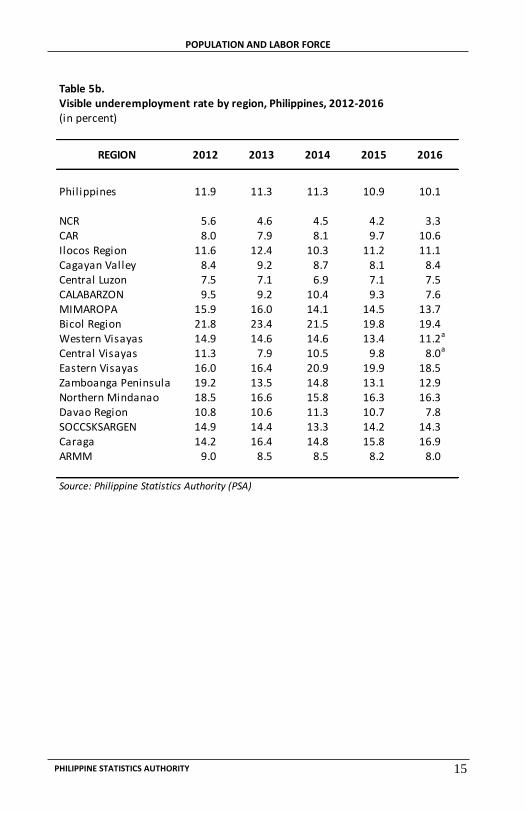
Visible Underemployment Visibly underemployed persons are those who worked for less than 40 hours during the reference week and still wanted additional hours of work. This indicator measures the level of dissatisfaction of the participants in the labor market with the working condition and/or remuneration they receive in exchange for their labor input. Countrywide, the number of visibly underemployed persons in 2016 reached 4.15 million translated to visible underemployment rate of 10.1 percent (Tables 5a-5b). The majority of the visibly underemployed persons in 2016 were reported in Bicol Region at 453,000 and CALABARZON at 430,000. In Central Luzon, Western Visayas, Eastern Visayas and Northern Mindanao, underemployment numbered 326,000 to 360,000 persons. The least counts were noted in CAR at 81,000 persons and ARMM at 91,000 persons. VIsible underemployment rates topped in Bicol Region at 19.4 percent and Eastern Visayas at 18.5 percent. This was followed by Caraga at 16.9 percent and Northern Mindanao at 16.3 percent. Underemployment rates in Cagayan Valley, Central Luzon, CALABARZON, Central Visayas, Davao Region and ARMM ranged from 7.5 percent to 8.4 percent. NCR posted the lowest rate at 3.3 percent.
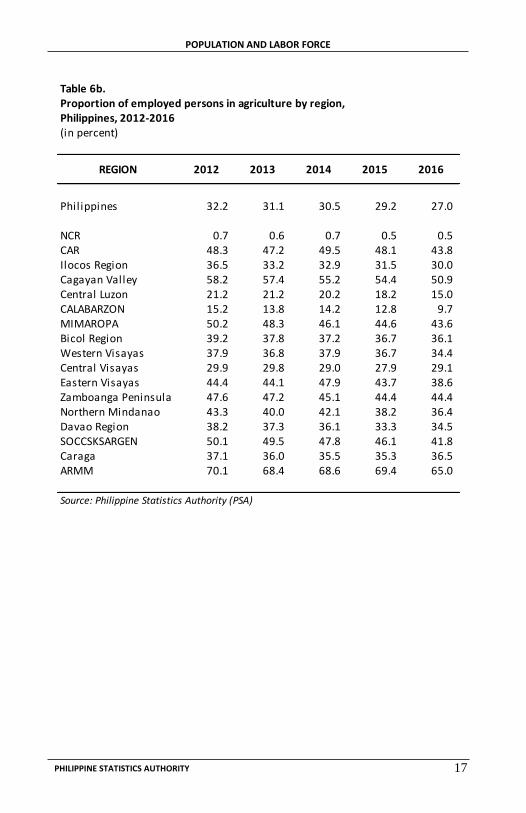
Employment in Agriculture The number of gainfully employed persons in agriculture measures the extent of absorption of the available manpower supply in agriculture and its contribution to the total economy. In 2016, about 11.06 million persons were employed in agriculture. This comprised 27.0 percent of the country’s total employment (Tables 6a-6b).
The biggest counts of the employed persons in agriculture were recorded in Western Visayas at 1.10 million and Central Visayas at 0.94 million. Agricultural employment was also bigger in Cagayan Valley, Bicol Region, Northern Mindanao, SOCCSKSARGEN and ARMM ranging from 0.73 million to 0.84 million persons. In contrast, the least employment in
3 18
Tab
le 7
a.N
um
be
r o
f e
mp
loye
d p
ers
on
s b
y cl
ass
of
wo
rke
rs, P
hili
pp
ine
s, 2
01
2-2
01
6(i
n '0
00
per
son
s)
Wa
ge a
nd
Sa
lary
Wo
rker
s3
,79
93
,81
13
,53
83
,44
73
,57
0W
ork
ed f
or
Pri
vate
Ho
use
ho
ld/
Esta
bli
shm
ent/
Fam
ily-
Op
era
ted
Act
ivit
ies
3,7
98
3,8
11
3,5
38
3,4
47
3,5
68
Wo
rked
fo
r G
ove
rnm
ent/
Go
vern
men
t C
orp
ora
tio
n1
--
-1
Ow
n-a
cco
un
t W
ork
ers
5,4
17
5,3
47
5,4
67
5,2
96
5,4
04
Se
lf-E
mp
loye
d4
,65
24
,59
34
,76
14
,58
04
,61
6
Emp
loye
r7
65
75
47
06
71
67
88
Un
pa
id F
am
ily
Wo
rker
s2
,87
82
,67
62
,79
52
,55
12
,09
0
T
ota
l1
2,0
92
11
,83
61
1,8
01
11
,29
41
1,0
64
Sour
ce: P
hilip
pine
Sta
tist
ics
Au
thor
ity
(PSA
)
CLA
SS O
F W
OR
KER
S2
01
22
01
32
01
42
01
52
01
6

POPULATION AND LABOR FORCE
PHILIPPINE STATISTICS AUTHORITY
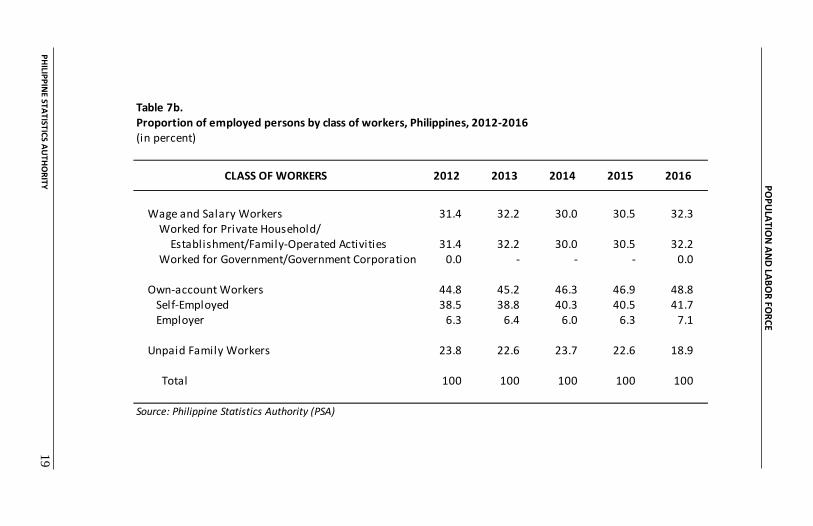
0.73 million to 0.84 million persons. In contrast, the least employment in agriculture was located in NCR with 25,000 persons. At the regional level, agriculture accounted for a bigger share in ARMM at 65.0 percent of the region’s total employment. This was followed by Cagayan Valley with about half of the total employment were absorbed by the agriculture sector. Agricultural employment contributed 41.8 percent to 44.4 percent in CAR, MIMAROPA, Zamboanga Peninsula and SOCCSKSARGEN. The least shares were in CALABARZON at 9.7 percent and in NCR at 0.5 percent. Agricultural Employment by Class of Worker Workers are classified according to their relationship to the establishment where he/she works. This indicates the status of employment in agriculture. A bigger portion of agricultural employment belonged to own-account workers. This class of worker numbered 5.40 million persons in 2016 or equivalent to 48.8 percent of the country’s total employment in agriculture. Of this total, 4.62 million persons were self-employed and 0.79 million persons were classified as employer. The wage and salary workers at 3.57 million persons comprised 32.3 percent and this was dominated by those who worked for private household, establishment and family-operated activities. The unpaid family workers had the least share at 18.9 percent corresponding to 2.09 million persons (Tables 7a-7b).
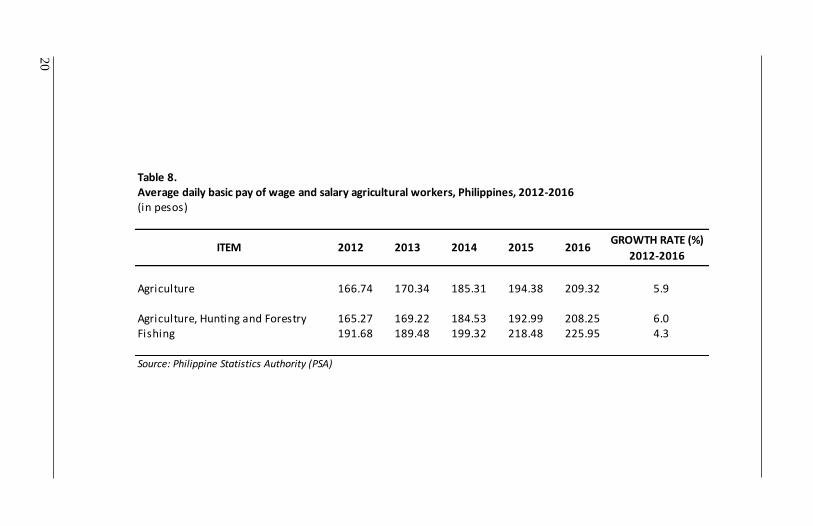
Daily Basic Pay of Wage and Salary Agricultural Workers The value of worker’s compensation for their labor is measured through the wages and salary received by the workers. In 2016, the country’s average basic wage and salary received by agricultural workers amounted to P209.32 per day. This was higher by P14.94 per day from a year’s ago record. Those engaged in fishing activities received higher wage and salary at P225.95 per day than those involved in agriculture, hunting and forestry at P208.25 per day.
17 4
Table 6b.Proportion of employed persons in agriculture by region, Philippines, 2012-2016(in percent)
Philippines 32.2 31.1 30.5 29.2 27.0
NCR 0.7 0.6 0.7 0.5 0.5 CAR 48.3 47.2 49.5 48.1 43.8 Ilocos Region 36.5 33.2 32.9 31.5 30.0 Cagayan Valley 58.2 57.4 55.2 54.4 50.9 Central Luzon 21.2 21.2 20.2 18.2 15.0 CALABARZON 15.2 13.8 14.2 12.8 9.7 MIMAROPA 50.2 48.3 46.1 44.6 43.6 Bicol Region 39.2 37.8 37.2 36.7 36.1 Western Visayas 37.9 36.8 37.9 36.7 34.4 Central Visayas 29.9 29.8 29.0 27.9 29.1 Eastern Visayas 44.4 44.1 47.9 43.7 38.6 Zamboanga Peninsula 47.6 47.2 45.1 44.4 44.4 Northern Mindanao 43.3 40.0 42.1 38.2 36.4 Davao Region 38.2 37.3 36.1 33.3 34.5 SOCCSKSARGEN 50.1 49.5 47.8 46.1 41.8 Caraga 37.1 36.0 35.5 35.3 36.5 ARMM 70.1 68.4 68.6 69.4 65.0
Source: Philippine Statistics Authority (PSA)
2016REGION 2012 2013 2014 2015

POPULATION AND LABOR FORCE
PHILIPPINE STATISTICS AUTHORITY
From 2012 to 2016, the basic pay of wage and salary agricultural workers grew by an average of 5.9 percent per year. The wage and salary of those employed in agriculture, hunting and forestry increased at a faster rate of 6.0 percent than those in fishing at 4.3 percent (Table 8).
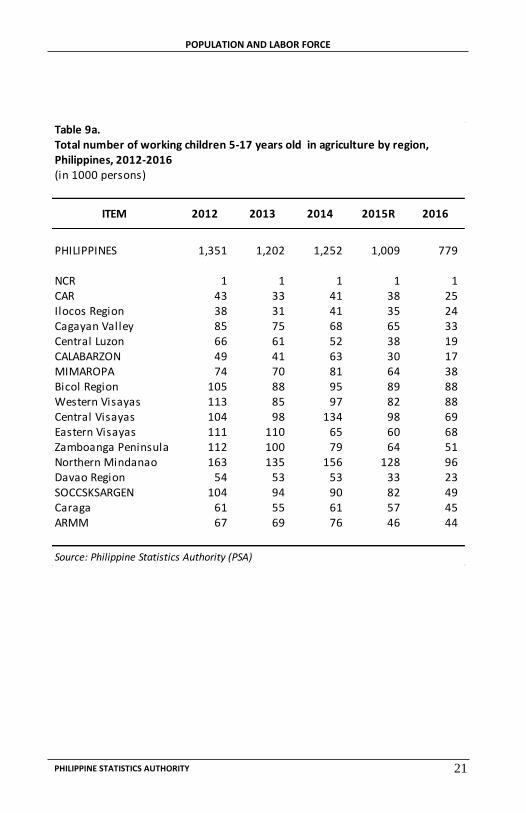
Working Children in Agriculture A child is considered working or economically active if at any time during the reference period he/she is engaged in any economic activity for at least one hour. He may be studying, looking for work and/or housekeeping at the same time. It is important to know how many of these working children were engaged in any agricultural activities as a measure of child labor. Nationwide, children aged 5 to 17 years old who were working in agriculture in 2016 totaled 779,000. Correspondingly, this group of working children in agriculture comprised 51.6 percent of the total working children (Tables 9a-9b). Across regions, Northern Mindanao reported the biggest number of children aged 5-17 years old working in agriculture at 96,000 in 2016. More working children in agriculture ranging from 68,000 to 88,000 were found in Bicol Region, Western Visayas, Central Visayas and Eastern Visayas. In contrast, fewer children of this age group were noted in Central Luzon with 19,000 and CALABARZON with 17,000. NCR had the least count with only 1,000 children aged 5 to 17 years old who were working in the agriculture sector. Regionwise, the biggest proportion of children aged 5 to 17 years old working in agriculture to total working children of the same age group was maintained in ARMM with 81.5 percent in 2016. Higher proportions were also recorded in CAR at 75.8 percent, Zamboanga Peninsula at 67.1 percent and Cagayan Valley at 64.7 percent. On the other hand, Central Luzon and CALABARZON posted smaller proportions at
21.8 percent and 15.3 percent, respectively. In NCR, only 2.9 percent of
the region’s children belonging to age group 5 to 17 years old were reported to be working in agriculture.
5 16
Table 6a.Total number of employed persons in agriculture by region, Philippines, 2012-2016(in '000 persons)
Philippines 12,092 11,836 11,801 11,294 11,064
NCR 31 29 31 26 25 CAR 351 347 372 365 335 Ilocos Region 699 649 662 635 596 Cagayan Valley 844 847 819 823 754 Central Luzon 820 845 832 751 659 CALABARZON 721 669 725 649 554 MIMAROPA 626 599 596 578 546 Bicol Region 888 866 859 871 841 Western Visayas 1,139 1,108 1,206 1,173 1,103 Central Visayas 874 881 904 898 941 Eastern Visayas 787 808 501 442 690 Zamboanga Peninsula 661 658 632 614 683 Northern Mindanao 846 773 849 759 729 Davao Region 716 690 703 641 695 SOCCSKSARGEN 843 837 829 810 775 Caraga 386 390 393 386 397 ARMM 861 841 888 874 741
Source: Philippine Statistics Authority (PSA)
2016REGION 2012 2013 2014 2015

POPULATION AND LABOR FORCE
PHILIPPINE STATISTICS AUTHORITY
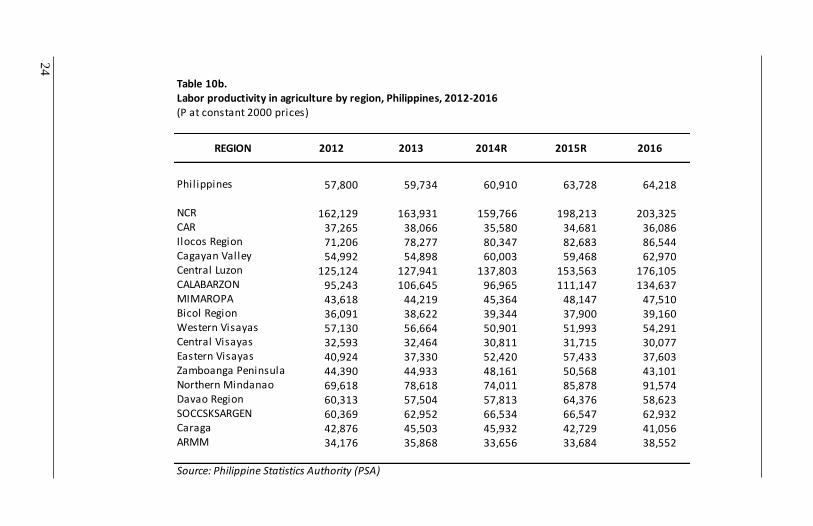
Labor Productivity in Agriculture Agricultural labor productivity provides information on the amount of agricultural output produced by each employed person In 2016, the country’s labor productivity in agriculture amounted to P126,321 at current prices or equivalent to P64,218 at constant 2000 prices (Tables 10a-10b). Across regions, the value of agricultural output per worker was biggest in NCR at P459,982 at current prices and P203,325 at constant prices. This was followed by Central Luzon with agricultural labor productivity valued at P287,782 at current prices and P176,105 at constant prices. In CALABARZON, agricultural output per worker amounted to P225,950 at current prices while it was valued at P134,637 at constant prices. Meanwhile, the lowest values of labor productivity in agriculture were recorded in Central Visayas at P63,496 and P30,077 at current and constant prices, respectively.
15 6
Table 5b.Visible underemployment rate by region, Philippines, 2012-2016(in percent)
Philippines 11.9 11.3 11.3 10.9 10.1
NCR 5.6 4.6 4.5 4.2 3.3CAR 8.0 7.9 8.1 9.7 10.6Ilocos Region 11.6 12.4 10.3 11.2 11.1Cagayan Valley 8.4 9.2 8.7 8.1 8.4Central Luzon 7.5 7.1 6.9 7.1 7.5CALABARZON 9.5 9.2 10.4 9.3 7.6MIMAROPA 15.9 16.0 14.1 14.5 13.7Bicol Region 21.8 23.4 21.5 19.8 19.4Western Visayas 14.9 14.6 14.6 13.4 11.2a
Central Visayas 11.3 7.9 10.5 9.8 8.0a
Eastern Visayas 16.0 16.4 20.9 19.9 18.5Zamboanga Peninsula 19.2 13.5 14.8 13.1 12.9Northern Mindanao 18.5 16.6 15.8 16.3 16.3Davao Region 10.8 10.6 11.3 10.7 7.8SOCCSKSARGEN 14.9 14.4 13.3 14.2 14.3Caraga 14.2 16.4 14.8 15.8 16.9ARMM 9.0 8.5 8.5 8.2 8.0
Source: Philippine Statistics Authority (PSA)
2016REGION 2012 2013 2014 2015

POPULATION AND LABOR FORCE
PHILIPPINE STATISTICS AUTHORITY
7 14
Table 1. Total household population 15 years old and over by region, Philippines, 2012-2016(in '000 persons)
Philippines 62,985 64,173 64,033 64,936 68,311
NCR 7,969 8,080 8,194 8,251 8,919CAR 1,128 1,149 1,170 1,188 1,211Ilocos Region 3,414 3,476 3,550 3,587 3,417Cagayan Valley 2,243 2,273 2,301 2,332 2,327Central Luzon 6,911 7,046 7,164 7,282 7,555CALABARZON 8,100 8,269 8,463 8,576 9,539MIMAROPA 1,903 1,950 2,001 2,045 1,997Bicol Region 3,761 3,840 3,907 3,972 3,904Western Visayas 5,066 5,156 5,270 5,359 5,249a
Central Visayas 4,794 4,885 4,978 5,074 5,083a
Eastern Visayas 2,942 2,997 1,709 1,701 3,006Zamboanga Peninsula 2,175 2,219 2,256 2,294 2,503Northern Mindanao 2,944 3,002 3,052 3,109 3,172Davao Region 3,042 3,097 3,143 3,182 3,355SOCCSKSARGEN 2,646 2,700 2,752 2,798 3,008Caraga 1,697 1,733 1,762 1,791 1,798ARMM 2,251 2,301 2,362 2,398 2,266
- Details may not add up to totals due to rounding
Source: Philippine Statistics Authority (PSA)
a - Computation of 2016 annualized data for region VI and VII used October round
results wherein statistics for Negros Occidental and Oriental were reverted back to
their original regions
Annualized data for 2016 was computed as the average of four survey rounds using
the January 2016 round that was based on the 2010 CPH population projections.
REGION 2012 2013 2014 2015 2016
Table 5a.Number of visibly underemployed persons by region, Philippines, 2012-2016(in '000 persons)
Philippines 4,489 4,321 4,365 4,222 4,149
NCR 251 210 215 198 171CAR 58 58 61 74 81Ilocos Region 223 243 208 226 220Cagayan Valley 122 136 130 122 124Central Luzon 291 285 283 295 328CALABARZON 453 447 529 472 430MIMAROPA 198 198 183 188 171Bicol Region 495 537 496 471 453Western Visayas 448 441 466 428 360a
Central Visayas 331 234 326 314 260a
Eastern Visayas 283 300 218 201 331Zamboanga Peninsula 267 189 207 181 199Northern Mindanao 361 321 319 324 326Davao Region 202 196 220 206 157SOCCSKSARGEN 250 243 231 248 266Caraga 148 178 164 172 183ARMM 111 104 110 103 91
Source: Philippine Statistics Authority (PSA)
2016REGION 2012 2013 2014 2015

POPULATION AND LABOR FORCE
PHILIPPINE STATISTICS AUTHORITY
13 8
Table 2a.Labor force by region, Philippines, 2012-2016(in '000 persons)
Philippines 40,426 41,022 41,379 41,343 43,361
NCR 5,025 5,129 5,281 5,193 5,613CAR 770 770 793 797 800Ilocos Region 2,087 2,130 2,191 2,199 2,119Cagayan Valley 1,490 1,523 1,542 1,562 1,529Central Luzon 4,261 4,370 4,484 4,476 4,693CALABARZON 5,218 5,331 5,542 5,528 6,125MIMAROPA 1,301 1,293 1,351 1,340 1,305Bicol Region 2,415 2,452 2,454 2,515 2,444Western Visayas 3,220 3,235 3,378 3,379 3,369a
Central Visayas 3,150 3,160 3,304 3,418 3,401a
Eastern Visayas 1,868 1,935 1,109 1,069 1,874Zamboanga Peninsula 1,444 1,445 1,451 1,434 1,600Northern Mindanao 2,052 2,050 2,132 2,107 2,115Davao Region 1,994 1,989 2,061 2,043 2,111SOCCSKSARGEN 1,756 1,769 1,798 1,820 1,933Caraga 1,104 1,152 1,169 1,158 1,143ARMM 1,272 1,289 1,341 1,304 1,187
Source: Philippine Statistics Authority (PSA)
2016REGION 2012 2013 2014 2015
Table 4b.Unemployment rate by region, Philippines, 2012-2016(in percent)
Philippines 7.0 7.1 6.6 6.3 5.4
NCR 10.6 10.3 10.2 8.5 6.7CAR 5.5 4.5 5.2 4.9 4.4Ilocos Region 8.2 8.3 8.2 8.4 6.2Cagayan Valley 2.8 3.2 3.6 3.2 3.1Central Luzon 9.0 8.7 8.1 7.8 6.6CALABARZON 8.9 9.2 8.0 8.0 7.2MIMAROPA 4.2 4.1 4.4 3.3 4.1Bicol Region 6.1 6.5 5.8 5.6 4.6Western Visayas 6.6 6.9 5.8 5.4 4.8a
Central Visayas 7.1 6.3 5.8 5.9 4.9a
Eastern Visayas 5.2 5.3 5.8 5.4 4.5Zamboanga Peninsula 3.8 3.5 3.5 3.5 3.8Northern Mindanao 4.7 5.7 5.4 5.6 5.2Davao Region 6.0 6.9 5.6 5.8 4.5SOCCSKSARGEN 4.2 4.4 3.5 3.5 4.1Caraga 5.7 6.0 5.2 5.7 5.0ARMM 3.4 4.6 3.4 3.5 3.9
Source: Philippine Statistics Authority (PSA)
2016REGION 2012 2013 2014 2015

POPULATION AND LABOR FORCE
PHILIPPINE STATISTICS AUTHORITY
9 12
Table 2b.Labor force participation rate by region, Philippines, 2012-2016(in percent)
Philippines 64.2 63.9 64.6 63.7 63.5
NCR 63.1 63.5 64.4 62.9 62.9CAR 68.3 67.0 67.8 67.1 66.1Ilocos Region 61.1 61.3 61.7 61.3 62.0Cagayan Valley 66.4 67.0 67.0 67.0 65.7Central Luzon 61.7 62.0 62.6 61.5 62.1CALABARZON 64.4 64.5 65.5 64.5 64.2MIMAROPA 68.4 66.3 67.5 65.5 65.3Bicol Region 64.2 63.9 62.8 63.3 62.6Western Visayas 63.6 62.7 64.1 63.1 64.2a
Central Visayas 65.7 64.7 66.4 67.4 66.9a
Eastern Visayas 63.5 64.6 64.9 62.8 62.3Zamboanga Peninsula 66.4 65.1 64.3 62.5 63.9Northern Mindanao 69.7 68.3 69.9 67.8 66.7Davao Region 65.5 64.2 65.6 64.2 62.9SOCCSKSARGEN 66.4 65.5 65.3 65.0 64.3Caraga 65.1 66.5 66.3 64.7 63.6ARMM 56.5 56.0 56.8 54.4 52.4
Source: Philippine Statistics Authority (PSA)
2016REGION 2012 2013 2014 2015
Table 4a.Number of unemployed persons by region, Philippines, 2012-2016(in '000 persons)
Philippines 2,826 2,905 2,728 2,602 2,363
NCR 535 527 538 441 374CAR 42 35 41 39 35Ilocos Region 172 176 179 185 131Cagayan Valley 41 48 56 50 47Central Luzon 384 379 365 350 310CALABARZON 465 489 445 444 438MIMAROPA 55 53 60 44 53Bicol Region 148 160 143 142 113Western Visayas 212 224 196 184 162a
Central Visayas 224 199 190 203 167a
Eastern Visayas 98 103 64 58 84Zamboanga Peninsula 55 50 51 50 60Northern Mindanao 96 117 116 118 111Davao Region 119 138 115 118 95SOCCSKSARGEN 74 78 63 64 79Caraga 63 69 61 66 57ARMM 43 59 46 46 47
Source: Philippine Statistics Authority (PSA)
2016REGION 2012 2013 2014 2015

POPULATION AND LABOR FORCE
PHILIPPINE STATISTICS AUTHORITY
11 10
Table 3a.Number of employed persons by region, Philippines, 2012-2016(in '000 persons)
Philippines 37,600 38,118 38,651 38,741 40,998
NCR 4,490 4,603 4,743 4,752 5,239CAR 727 735 752 759 765Ilocos Region 1,915 1,954 2,012 2,014 1,988Cagayan Valley 1,449 1,475 1,485 1,512 1,482Central Luzon 3,877 3,990 4,119 4,126 4,383CALABARZON 4,753 4,842 5,097 5,085 5,687MIMAROPA 1,247 1,241 1,292 1,296 1,252Bicol Region 2,267 2,292 2,311 2,374 2,331Western Visayas 3,008 3,011 3,182 3,195 3,208a
Central Visayas 2,926 2,961 3,114 3,215 3,234a
Eastern Visayas 1,771 1,832 1,045 1,011 1,790Zamboanga Peninsula 1,388 1,395 1,400 1,384 1,540Northern Mindanao 1,956 1,934 2,015 1,989 2,004Davao Region 1,874 1,851 1,946 1,924 2,016SOCCSKSARGEN 1,682 1,691 1,735 1,756 1,854Caraga 1,041 1,083 1,108 1,092 1,086ARMM 1,229 1,229 1,295 1,259 1,140
Source: Philippine Statistics Authority (PSA)
2016REGION 2012 2013 2014 2015
Table 3b.Employment rate by region, Philippines, 2012-2016(in percent)
Philippines 93.0 92.9 93.4 93.7 94.6
NCR 89.4 89.7 89.8 91.5 93.3CAR 94.4 95.5 94.8 95.2 95.6Ilocos Region 91.8 91.7 91.8 91.6 93.8Cagayan Valley 97.2 96.8 96.3 96.8 96.9Central Luzon 91.0 91.3 91.9 92.2 93.4CALABARZON 91.1 90.8 92.0 92.0 92.8MIMAROPA 95.8 96.0 95.6 96.7 95.9Bicol Region 93.9 93.5 94.2 94.4 95.4Western Visayas 93.4 93.1 94.2 94.6 95.2a
Central Visayas 92.9 93.7 94.2 94.1 95.1a
Eastern Visayas 94.8 94.7 94.2 94.6 95.5Zamboanga Peninsula 96.1 96.5 96.5 96.5 96.2Northern Mindanao 95.3 94.3 94.5 94.4 94.8Davao Region 94.0 93.1 94.4 94.2 95.5SOCCSKSARGEN 95.8 95.6 96.5 96.5 95.9Caraga 94.3 94.0 94.8 94.3 95.0ARMM 96.6 95.3 96.6 96.5 96.1
Source: Philippine Statistics Authority (PSA)
2016REGION 2012 2013 2014 2015

POPULATION AND LABOR FORCE
PHILIPPINE STATISTICS AUTHORITY
9 12
Table 2b.Labor force participation rate by region, Philippines, 2012-2016(in percent)
Philippines 64.2 63.9 64.6 63.7 63.5
NCR 63.1 63.5 64.4 62.9 62.9CAR 68.3 67.0 67.8 67.1 66.1Ilocos Region 61.1 61.3 61.7 61.3 62.0Cagayan Valley 66.4 67.0 67.0 67.0 65.7Central Luzon 61.7 62.0 62.6 61.5 62.1CALABARZON 64.4 64.5 65.5 64.5 64.2MIMAROPA 68.4 66.3 67.5 65.5 65.3Bicol Region 64.2 63.9 62.8 63.3 62.6Western Visayas 63.6 62.7 64.1 63.1 64.2a
Central Visayas 65.7 64.7 66.4 67.4 66.9a
Eastern Visayas 63.5 64.6 64.9 62.8 62.3Zamboanga Peninsula 66.4 65.1 64.3 62.5 63.9Northern Mindanao 69.7 68.3 69.9 67.8 66.7Davao Region 65.5 64.2 65.6 64.2 62.9SOCCSKSARGEN 66.4 65.5 65.3 65.0 64.3Caraga 65.1 66.5 66.3 64.7 63.6ARMM 56.5 56.0 56.8 54.4 52.4
Source: Philippine Statistics Authority (PSA)
2016REGION 2012 2013 2014 2015
Table 4a.Number of unemployed persons by region, Philippines, 2012-2016(in '000 persons)
Philippines 2,826 2,905 2,728 2,602 2,363
NCR 535 527 538 441 374CAR 42 35 41 39 35Ilocos Region 172 176 179 185 131Cagayan Valley 41 48 56 50 47Central Luzon 384 379 365 350 310CALABARZON 465 489 445 444 438MIMAROPA 55 53 60 44 53Bicol Region 148 160 143 142 113Western Visayas 212 224 196 184 162a
Central Visayas 224 199 190 203 167a
Eastern Visayas 98 103 64 58 84Zamboanga Peninsula 55 50 51 50 60Northern Mindanao 96 117 116 118 111Davao Region 119 138 115 118 95SOCCSKSARGEN 74 78 63 64 79Caraga 63 69 61 66 57ARMM 43 59 46 46 47
Source: Philippine Statistics Authority (PSA)
2016REGION 2012 2013 2014 2015

POPULATION AND LABOR FORCE
PHILIPPINE STATISTICS AUTHORITY
13 8
Table 2a.Labor force by region, Philippines, 2012-2016(in '000 persons)
Philippines 40,426 41,022 41,379 41,343 43,361
NCR 5,025 5,129 5,281 5,193 5,613CAR 770 770 793 797 800Ilocos Region 2,087 2,130 2,191 2,199 2,119Cagayan Valley 1,490 1,523 1,542 1,562 1,529Central Luzon 4,261 4,370 4,484 4,476 4,693CALABARZON 5,218 5,331 5,542 5,528 6,125MIMAROPA 1,301 1,293 1,351 1,340 1,305Bicol Region 2,415 2,452 2,454 2,515 2,444Western Visayas 3,220 3,235 3,378 3,379 3,369a
Central Visayas 3,150 3,160 3,304 3,418 3,401a
Eastern Visayas 1,868 1,935 1,109 1,069 1,874Zamboanga Peninsula 1,444 1,445 1,451 1,434 1,600Northern Mindanao 2,052 2,050 2,132 2,107 2,115Davao Region 1,994 1,989 2,061 2,043 2,111SOCCSKSARGEN 1,756 1,769 1,798 1,820 1,933Caraga 1,104 1,152 1,169 1,158 1,143ARMM 1,272 1,289 1,341 1,304 1,187
Source: Philippine Statistics Authority (PSA)
2016REGION 2012 2013 2014 2015
Table 4b.Unemployment rate by region, Philippines, 2012-2016(in percent)
Philippines 7.0 7.1 6.6 6.3 5.4
NCR 10.6 10.3 10.2 8.5 6.7CAR 5.5 4.5 5.2 4.9 4.4Ilocos Region 8.2 8.3 8.2 8.4 6.2Cagayan Valley 2.8 3.2 3.6 3.2 3.1Central Luzon 9.0 8.7 8.1 7.8 6.6CALABARZON 8.9 9.2 8.0 8.0 7.2MIMAROPA 4.2 4.1 4.4 3.3 4.1Bicol Region 6.1 6.5 5.8 5.6 4.6Western Visayas 6.6 6.9 5.8 5.4 4.8a
Central Visayas 7.1 6.3 5.8 5.9 4.9a
Eastern Visayas 5.2 5.3 5.8 5.4 4.5Zamboanga Peninsula 3.8 3.5 3.5 3.5 3.8Northern Mindanao 4.7 5.7 5.4 5.6 5.2Davao Region 6.0 6.9 5.6 5.8 4.5SOCCSKSARGEN 4.2 4.4 3.5 3.5 4.1Caraga 5.7 6.0 5.2 5.7 5.0ARMM 3.4 4.6 3.4 3.5 3.9
Source: Philippine Statistics Authority (PSA)
2016REGION 2012 2013 2014 2015

POPULATION AND LABOR FORCE
PHILIPPINE STATISTICS AUTHORITY
7 14
Table 1. Total household population 15 years old and over by region, Philippines, 2012-2016(in '000 persons)
Philippines 62,985 64,173 64,033 64,936 68,311
NCR 7,969 8,080 8,194 8,251 8,919CAR 1,128 1,149 1,170 1,188 1,211Ilocos Region 3,414 3,476 3,550 3,587 3,417Cagayan Valley 2,243 2,273 2,301 2,332 2,327Central Luzon 6,911 7,046 7,164 7,282 7,555CALABARZON 8,100 8,269 8,463 8,576 9,539MIMAROPA 1,903 1,950 2,001 2,045 1,997Bicol Region 3,761 3,840 3,907 3,972 3,904Western Visayas 5,066 5,156 5,270 5,359 5,249a
Central Visayas 4,794 4,885 4,978 5,074 5,083a
Eastern Visayas 2,942 2,997 1,709 1,701 3,006Zamboanga Peninsula 2,175 2,219 2,256 2,294 2,503Northern Mindanao 2,944 3,002 3,052 3,109 3,172Davao Region 3,042 3,097 3,143 3,182 3,355SOCCSKSARGEN 2,646 2,700 2,752 2,798 3,008Caraga 1,697 1,733 1,762 1,791 1,798ARMM 2,251 2,301 2,362 2,398 2,266
- Details may not add up to totals due to rounding
Source: Philippine Statistics Authority (PSA)
a - Computation of 2016 annualized data for region VI and VII used October round
results wherein statistics for Negros Occidental and Oriental were reverted back to
their original regions
Annualized data for 2016 was computed as the average of four survey rounds using
the January 2016 round that was based on the 2010 CPH population projections.
REGION 2012 2013 2014 2015 2016
Table 5a.Number of visibly underemployed persons by region, Philippines, 2012-2016(in '000 persons)
Philippines 4,489 4,321 4,365 4,222 4,149
NCR 251 210 215 198 171CAR 58 58 61 74 81Ilocos Region 223 243 208 226 220Cagayan Valley 122 136 130 122 124Central Luzon 291 285 283 295 328CALABARZON 453 447 529 472 430MIMAROPA 198 198 183 188 171Bicol Region 495 537 496 471 453Western Visayas 448 441 466 428 360a
Central Visayas 331 234 326 314 260a
Eastern Visayas 283 300 218 201 331Zamboanga Peninsula 267 189 207 181 199Northern Mindanao 361 321 319 324 326Davao Region 202 196 220 206 157SOCCSKSARGEN 250 243 231 248 266Caraga 148 178 164 172 183ARMM 111 104 110 103 91
Source: Philippine Statistics Authority (PSA)
2016REGION 2012 2013 2014 2015
POPULATION AND LABOR FORCE
PHILIPPINE STATISTICS AUTHORITY
Labor Productivity in Agriculture Agricultural labor productivity provides information on the amount of agricultural output produced by each employed person In 2016, the country’s labor productivity in agriculture amounted to P126,321 at current prices or equivalent to P64,218 at constant 2000 prices (Tables 10a-10b). Across regions, the value of agricultural output per worker was biggest in NCR at P459,982 at current prices and P203,325 at constant prices. This was followed by Central Luzon with agricultural labor productivity valued at P287,782 at current prices and P176,105 at constant prices. In CALABARZON, agricultural output per worker amounted to P225,950 at current prices while it was valued at P134,637 at constant prices. Meanwhile, the lowest values of labor productivity in agriculture were recorded in Central Visayas at P63,496 and P30,077 at current and constant prices, respectively.
15 6
Table 5b.Visible underemployment rate by region, Philippines, 2012-2016(in percent)
Philippines 11.9 11.3 11.3 10.9 10.1
NCR 5.6 4.6 4.5 4.2 3.3CAR 8.0 7.9 8.1 9.7 10.6Ilocos Region 11.6 12.4 10.3 11.2 11.1Cagayan Valley 8.4 9.2 8.7 8.1 8.4Central Luzon 7.5 7.1 6.9 7.1 7.5CALABARZON 9.5 9.2 10.4 9.3 7.6MIMAROPA 15.9 16.0 14.1 14.5 13.7Bicol Region 21.8 23.4 21.5 19.8 19.4Western Visayas 14.9 14.6 14.6 13.4 11.2a
Central Visayas 11.3 7.9 10.5 9.8 8.0a
Eastern Visayas 16.0 16.4 20.9 19.9 18.5Zamboanga Peninsula 19.2 13.5 14.8 13.1 12.9Northern Mindanao 18.5 16.6 15.8 16.3 16.3Davao Region 10.8 10.6 11.3 10.7 7.8SOCCSKSARGEN 14.9 14.4 13.3 14.2 14.3Caraga 14.2 16.4 14.8 15.8 16.9ARMM 9.0 8.5 8.5 8.2 8.0
Source: Philippine Statistics Authority (PSA)
2016REGION 2012 2013 2014 2015

POPULATION AND LABOR FORCE
PHILIPPINE STATISTICS AUTHORITY
From 2012 to 2016, the basic pay of wage and salary agricultural workers grew by an average of 5.9 percent per year. The wage and salary of those employed in agriculture, hunting and forestry increased at a faster rate of 6.0 percent than those in fishing at 4.3 percent (Table 8).
Working Children in Agriculture A child is considered working or economically active if at any time during the reference period he/she is engaged in any economic activity for at least one hour. He may be studying, looking for work and/or housekeeping at the same time. It is important to know how many of these working children were engaged in any agricultural activities as a measure of child labor. Nationwide, children aged 5 to 17 years old who were working in agriculture in 2016 totaled 779,000. Correspondingly, this group of working children in agriculture comprised 51.6 percent of the total working children (Tables 9a-9b). Across regions, Northern Mindanao reported the biggest number of children aged 5-17 years old working in agriculture at 96,000 in 2016. More working children in agriculture ranging from 68,000 to 88,000 were found in Bicol Region, Western Visayas, Central Visayas and Eastern Visayas. In contrast, fewer children of this age group were noted in Central Luzon with 19,000 and CALABARZON with 17,000. NCR had the least count with only 1,000 children aged 5 to 17 years old who were working in the agriculture sector. Regionwise, the biggest proportion of children aged 5 to 17 years old working in agriculture to total working children of the same age group was maintained in ARMM with 81.5 percent in 2016. Higher proportions were also recorded in CAR at 75.8 percent, Zamboanga Peninsula at 67.1 percent and Cagayan Valley at 64.7 percent. On the other hand, Central Luzon and CALABARZON posted smaller proportions at
21.8 percent and 15.3 percent, respectively. In NCR, only 2.9 percent of
the region’s children belonging to age group 5 to 17 years old were reported to be working in agriculture.
5 16
Table 6a.Total number of employed persons in agriculture by region, Philippines, 2012-2016(in '000 persons)
Philippines 12,092 11,836 11,801 11,294 11,064
NCR 31 29 31 26 25 CAR 351 347 372 365 335 Ilocos Region 699 649 662 635 596 Cagayan Valley 844 847 819 823 754 Central Luzon 820 845 832 751 659 CALABARZON 721 669 725 649 554 MIMAROPA 626 599 596 578 546 Bicol Region 888 866 859 871 841 Western Visayas 1,139 1,108 1,206 1,173 1,103 Central Visayas 874 881 904 898 941 Eastern Visayas 787 808 501 442 690 Zamboanga Peninsula 661 658 632 614 683 Northern Mindanao 846 773 849 759 729 Davao Region 716 690 703 641 695 SOCCSKSARGEN 843 837 829 810 775 Caraga 386 390 393 386 397 ARMM 861 841 888 874 741
Source: Philippine Statistics Authority (PSA)
2016REGION 2012 2013 2014 2015
POPULATION AND LABOR FORCE
PHILIPPINE STATISTICS AUTHORITY
0.73 million to 0.84 million persons. In contrast, the least employment in agriculture was located in NCR with 25,000 persons. At the regional level, agriculture accounted for a bigger share in ARMM at 65.0 percent of the region’s total employment. This was followed by Cagayan Valley with about half of the total employment were absorbed by the agriculture sector. Agricultural employment contributed 41.8 percent to 44.4 percent in CAR, MIMAROPA, Zamboanga Peninsula and SOCCSKSARGEN. The least shares were in CALABARZON at 9.7 percent and in NCR at 0.5 percent. Agricultural Employment by Class of Worker Workers are classified according to their relationship to the establishment where he/she works. This indicates the status of employment in agriculture. A bigger portion of agricultural employment belonged to own-account workers. This class of worker numbered 5.40 million persons in 2016 or equivalent to 48.8 percent of the country’s total employment in agriculture. Of this total, 4.62 million persons were self-employed and 0.79 million persons were classified as employer. The wage and salary workers at 3.57 million persons comprised 32.3 percent and this was dominated by those who worked for private household, establishment and family-operated activities. The unpaid family workers had the least share at 18.9 percent corresponding to 2.09 million persons (Tables 7a-7b).
Daily Basic Pay of Wage and Salary Agricultural Workers The value of worker’s compensation for their labor is measured through the wages and salary received by the workers. In 2016, the country’s average basic wage and salary received by agricultural workers amounted to P209.32 per day. This was higher by P14.94 per day from a year’s ago record. Those engaged in fishing activities received higher wage and salary at P225.95 per day than those involved in agriculture, hunting and forestry at P208.25 per day.
17 4
Table 6b.Proportion of employed persons in agriculture by region, Philippines, 2012-2016(in percent)
Philippines 32.2 31.1 30.5 29.2 27.0
NCR 0.7 0.6 0.7 0.5 0.5 CAR 48.3 47.2 49.5 48.1 43.8 Ilocos Region 36.5 33.2 32.9 31.5 30.0 Cagayan Valley 58.2 57.4 55.2 54.4 50.9 Central Luzon 21.2 21.2 20.2 18.2 15.0 CALABARZON 15.2 13.8 14.2 12.8 9.7 MIMAROPA 50.2 48.3 46.1 44.6 43.6 Bicol Region 39.2 37.8 37.2 36.7 36.1 Western Visayas 37.9 36.8 37.9 36.7 34.4 Central Visayas 29.9 29.8 29.0 27.9 29.1 Eastern Visayas 44.4 44.1 47.9 43.7 38.6 Zamboanga Peninsula 47.6 47.2 45.1 44.4 44.4 Northern Mindanao 43.3 40.0 42.1 38.2 36.4 Davao Region 38.2 37.3 36.1 33.3 34.5 SOCCSKSARGEN 50.1 49.5 47.8 46.1 41.8 Caraga 37.1 36.0 35.5 35.3 36.5 ARMM 70.1 68.4 68.6 69.4 65.0
Source: Philippine Statistics Authority (PSA)
2016REGION 2012 2013 2014 2015

PO
PU
LATIO
N A
ND
LAB
OR
FOR
CE
PH
ILIPP
INE STA
TIST
ICS A
UTH
OR
ITY
Visib
le Un
de
rem
plo
yme
nt
Visib
ly u
nd
erem
plo
yed
perso
ns
are th
ose
wh
o
wo
rked
for
less
than
4
0 h
ou
rs du
ring th
e reference w
eek and
still wan
ted ad
ditio
nal h
ou
rs of
wo
rk. Th
is in
dicato
r m
easures
the
level
of
dissatisfactio
n
of
the
particip
ants
in
the
labo
r m
arket w
ith
the
wo
rking
con
ditio
n
and
/or
remu
neratio
n th
ey receive in exch
ange fo
r their lab
or in
pu
t. C
ou
ntryw
ide,
the
nu
mb
er o
f visib
ly u
nd
eremp
loyed
p
erso
ns
in
20
16
reach
ed
4.1
5
millio
n
translated
to
visib
le u
nd
erem
plo
ymen
t rate
of
10
.1 p
ercent (Tab
les 5
a-5b
). Th
e majo
rity of th
e visibly u
nd
eremp
loyed
perso
ns in
20
16
were rep
orted
in
Bico
l Regio
n at 4
53
,00
0 an
d C
ALA
BA
RZO
N at 4
30
,00
0. In
Cen
tral Luzo
n,
Western
V
isayas, Eastern
V
isayas an
d
No
rthern
M
ind
anao
, u
nd
eremp
loym
ent
nu
mb
ered
3
26
,00
0
to
36
0,0
00
p
erso
ns.
The
least co
un
ts w
ere n
oted
in
C
AR
at
81
,00
0
perso
ns
and
A
RM
M
at 9
1,0
00
perso
ns.
VIsib
le un
dere
mp
loym
ent rates to
pp
ed in
Bico
l Regio
n at 1
9.4
percen
t an
d Eastern
Visayas at 1
8.5
percen
t. This w
as fo
llow
ed b
y Caraga at
16
.9 p
ercent an
d N
orth
ern M
ind
anao
at 16
.3 p
ercent. U
nd
erem
plo
ymen
t rates in
Cagayan
Valley, C
en
tral Luzo
n, C
ALA
BA
RZO
N, C
entral V
isayas, D
avao R
egio
n an
d A
RM
M ran
ged fro
m 7
.5 p
ercent to
8.4
percen
t. NC
R
po
sted th
e low
est rate at 3
.3 p
ercent.
Emp
loym
en
t in A
gricultu
re Th
e nu
mb
er of gain
fully e
mp
loyed
perso
ns in
agricultu
re m
easures th
e
extent o
f abso
rptio
n o
f the availab
le m
anp
ow
er sup
ply in
agricultu
re and
its co
ntrib
utio
n to
the to
tal econ
om
y. In
20
16
, abo
ut 1
1.0
6 m
illion
perso
ns w
ere em
plo
yed in
agricultu
re. Th
is co
mp
rised 2
7.0
percen
t of th
e cou
ntry’s to
tal emp
loym
ent (Tab
les 6
a-6b
).
The b
iggest cou
nts o
f the em
plo
yed p
erson
s in agricu
lture w
ere record
ed
in W
estern V
isayas at 1.1
0 m
illion
and
Cen
tral Visayas at 0
.94
millio
n.
Agricu
ltural e
mp
loym
ent w
as also b
igger in C
agayan V
alley, Bico
l Regio
n,
No
rthern
M
ind
anao
, SO
CC
SKSA
RG
EN
and
A
RM
M
rangin
g fro
m
0.7
3 m
illion
to 0
.84
millio
n p
erso
ns. In
con
trast, the least e
mp
loym
ent in
3
18
Table 7a.Number of employed persons by class of workers, Philippines, 2012-2016(in '000 persons)
Wage and Salary Workers 3,799 3,811 3,538 3,447 3,570Worked for Private Household/
Establishment/Family-Operated Activities 3,798 3,811 3,538 3,447 3,568Worked for Government/Government Corporation 1 - - - 1
Own-account Workers 5,417 5,347 5,467 5,296 5,404 Self-Employed 4,652 4,593 4,761 4,580 4,616 Employer 765 754 706 716 788
Unpaid Family Workers 2,878 2,676 2,795 2,551 2,090
Total 12,092 11,836 11,801 11,294 11,064
Source: Philippine Statistics Authority (PSA)
CLASS OF WORKERS 2012 2013 2014 2015 2016
PO
PU
LATIO
N A
ND
LAB
OR
FOR
CE
PH
ILIPP
INE STA
TIST
ICS A
UTH
OR
ITY
Em
plo
yme
nt an
d U
nem
plo
yme
nt
Ind
icators relatin
g to lab
or m
arket such
as em
plo
ymen
t me
asures th
e rate o
f abso
rptio
n o
f available m
anp
ow
er su
pp
ly in th
e pro
du
ction
of go
od
s an
d service
s. On
the o
ther h
and
, un
emp
loym
ent in
dicate
s the in
efficiency
of
the
labo
r m
arket to
ab
sorb
th
e availab
le h
um
an
resou
rces
to
con
tribu
te to p
rod
uctio
n activities.
In 2
01
6, ab
ou
t 41
.0 m
illion
perso
ns w
ere e
mp
loyed
natio
nw
ide. Th
is was
equ
ivalent
to
natio
nal
em
plo
ymen
t rate
(ER)
of
94
.6
percen
t (Tab
les 3
a-3b
). On
the o
ther h
and
, un
emp
loym
ent in
the co
un
try sum
med
u
p to
2.3
6 m
illion
perso
ns in
20
16
. Un
emp
loym
ent rate (U
R) figu
red to
5
.4 p
ercent (Tab
les 4
a-4b
).
At th
e region
al level, th
e biggest n
um
bers o
f emp
loyed
and
un
emp
loyed
p
erson
s were lo
cated in
CA
LAB
AR
ZON
at 5.6
9 m
illion
and
0.4
4 m
illion
, resp
ectively. In
NC
R, th
ere we
re 5.2
4 m
illion
perso
ns w
ho
were e
mp
loyed
an
d
0.3
7
millio
n
perso
ns
wh
o
were
un
emp
loyed
. M
eanw
hile,
the
em
plo
ymen
t and
un
emp
loym
ent co
un
ts were also
high
in C
entral Lu
zon
co
rrespo
nd
ing to
4.3
8 m
illion
perso
ns an
d 0
.31
millio
n p
erson
s. CA
R h
ad
the few
est nu
mb
ers of em
plo
yed p
erson
s at 0.7
7 m
illion
and
un
emp
loyed
p
erson
s at 35
,00
0.
Cagayan
Valley registered
the h
ighest em
plo
ymen
t rate at 96
.9 p
ercent
wh
ile its un
emp
loym
ent rate w
as the lo
west at 3
.1 p
ercent in
20
16
. High
ER
s were also
no
ted in
Zamb
oan
ga Pen
insu
la at 96
.2 p
ercen
t and
AR
MM
at
96
.1
percen
t. Th
eir re
spective
un
emp
loym
ent
rates sto
od
at
3.8
percen
t and
3.9
percen
t. CA
LAB
AR
ZON
top
ped
the u
nem
plo
ymen
t rate at 7
.2 p
ercent. Th
is was fo
llow
ed b
y NC
R at 6
.7 p
ercent, C
entral
Luzo
n at 6
.6 p
ercent an
d Ilo
cos R
egion
at 6.2
percen
t.
19
2
Table 7b.Proportion of employed persons by class of workers, Philippines, 2012-2016(in percent)
Wage and Salary Workers 31.4 32.2 30.0 30.5 32.3Worked for Private Household/
Establishment/Family-Operated Activities 31.4 32.2 30.0 30.5 32.2Worked for Government/Government Corporation 0.0 - - - 0.0
Own-account Workers 44.8 45.2 46.3 46.9 48.8 Self-Employed 38.5 38.8 40.3 40.5 41.7 Employer 6.3 6.4 6.0 6.3 7.1
Unpaid Family Workers 23.8 22.6 23.7 22.6 18.9
Total 100 100 100 100 100
Source: Philippine Statistics Authority (PSA)
2016CLASS OF WORKERS 2012 2013 2014 2015
PO
PU
LATIO
N A
ND
LAB
OR
FOR
CE
PH
ILIPP
INE STA
TIST
ICS A
UTH
OR
ITY
1
20
Ho
use
ho
ld P
op
ulatio
n age
d 1
5 Y
ears O
ld an
d O
ver Th
e nu
mb
er of p
erson
s aged 1
5 years o
ld an
d o
ver enu
merated
in p
rivate h
ou
seho
lds d
urin
g the su
rvey in
dicates th
e nu
mb
er of p
erso
ns availab
le fo
r wo
rk. In
20
16
, the co
un
try’s wo
rking age p
op
ulatio
n 1
5 years o
ld an
d o
ver to
taled 6
8.3
1 m
illion
perso
ns. A
cross regio
ns, C
ALA
BA
RZO
N reco
rded
the
b
iggest nu
mb
er of th
is po
pu
lation
grou
p at 9
.54
millio
n p
erson
s. This w
as fo
llow
ed
by
NC
R
with
8
.92
m
illion
p
erson
s an
d
Cen
tral Lu
zon
w
ith
7.5
6 m
illion
perso
ns. Th
e wo
rking age
po
pu
lation
in Ilo
cos R
egion
, Bico
l R
egion
, Eastern
V
isayas, N
orth
ern
Min
dan
ao,
Davao
R
egion
an
d
SOC
CSK
SAR
GEN
ranged
from
3.0
millio
n to
3.9
0 m
illion
perso
ns. C
AR
had
th
e least cou
nt o
f this age gro
up
at 1.2
1 m
illion
perso
ns (Tab
le 1).
Labo
r Force
Lab
or fo
rce describ
es the p
op
ulatio
n aged
15
years old
and
over, w
heth
er em
plo
yed an
d u
nem
plo
yed, w
ho
con
tribu
ted to
the p
rod
uctio
n o
f goo
ds
and
services in
the co
un
try. It serves as an
ind
icator o
f the exten
t by
wh
ich w
orkin
g age po
pu
lation
join
s the stream
of availab
le man
po
wer
sup
ply.
A
total
of
43
.36
m
illion
p
erson
s w
ere in
th
e
labo
r fo
rce in
2
01
6.
It co
rrespo
nd
ed to
labo
r force
particip
ation
rate (LFPR
) of 6
3.5
percen
t (Tab
les 2
a-2b
). B
y regio
n,
the
biggest
labo
r fo
rce p
op
ulatio
n
was
registered
in
CA
LAB
AR
ZON
at 6.1
3 m
illion
perso
ns. N
CR
and
Cen
tral Luzo
n cam
e n
ext w
ith 5
.61
millio
n p
erson
s and
4.6
9 m
illion
perso
ns, resp
ectively. Th
e lab
or
force
cou
nts
in
Cagayan
V
alley, M
IMA
RO
PA
, Zam
bo
anga
Pen
insu
la, SO
CC
SKSA
RG
EN,
Caraga
and
A
RM
M
ranged
fro
m
1.1
4
millio
n
to
1.9
3 m
illion
perso
ns. Th
e least nu
mb
er was n
oted
in C
AR
at 0.8
0 m
illion
p
erson
s. Th
e 20
16
LFPR
s were h
ighest in
Cen
tral Visayas at 6
6.9
percen
t, No
rthern
M
ind
anao
at
66
.7
percen
t an
d
CA
R
at 6
6.1
p
ercent.
LFPR
s fro
m
62
.0
percen
t to
6
2.9
p
ercen
t w
ere exh
ibited
b
y N
CR
, Ilo
cos
Regio
n,
Cen
tral Luzo
n, B
icol R
egion
, Eastern V
isayas and
Davao
Regio
n. It w
as lo
we
st in A
RM
M at 5
2.4
percen
t.
Table 8.Average daily basic pay of wage and salary agricultural workers, Philippines, 2012-2016(in pesos)
Agriculture 166.74 170.34 185.31 194.38 209.32 5.9
Agriculture, Hunting and Forestry 165.27 169.22 184.53 192.99 208.25 6.0Fishing 191.68 189.48 199.32 218.48 225.95 4.3
Source: Philippine Statistics Authority (PSA)
2016GROWTH RATE (%)
2012-2016ITEM 2012 2013 2014 2015
POPULATION AND LABOR FORCE
PHILIPPINE STATISTICS AUTHORITY
Table 9a.Total number of working children 5-17 years old in agriculture by region, Philippines, 2012-2016( in 1000 persons)
PHILIPPINES 1,351.0 1,202.0 1,252.0 1,009.0 779.0
NCR 1.0 1.0 1.0 1.0 1.0 CAR 43.0 33.0 41.0 38.0 25.0 Ilocos Region 38.0 31.0 41.0 35.0 24.0 Cagayan Valley 85.0 75.0 68.0 65.0 33.0 Central Luzon 66.0 61.0 52.0 38.0 19.0 CALABARZON 49.0 41.0 63.0 30.0 17.0 MIMAROPA 74.0 70.0 81.0 64.0 38.0 Bicol Region 105.0 88.0 95.0 89.0 88.0 Western Visayas 113.0 85.0 97.0 82.0 88.0 Central Visayas 104.0 98.0 134.0 98.0 69.0 Eastern Visayas 111.0 110.0 65.0 60.0 68.0 Zamboanga Peninsula 112.0 100.0 79.0 64.0 51.0 Northern Mindanao 163.0 135.0 156.0 128.0 96.0 Davao Region 54.0 53.0 53.0 33.0 23.0 SOCCSKSARGEN 104.0 94.0 90.0 82.0 49.0 Caraga 61.0 55.0 61.0 57.0 45.0 ARMM 67.0 69.0 76.0 46.0 44.0
Source: Philippine Statistics Authority (PSA)
ITEM 2012 2013 2014 2015R 2016
21
Table 9a.Total number of working children 5-17 years old in agriculture by region, Philippines, 2012-2016(in 1000 persons)
PHILIPPINES 1,351 1,202 1,252 1,009 779
NCR 1 1 1 1 1 CAR 43 33 41 38 25 Ilocos Region 38 31 41 35 24 Cagayan Valley 85 75 68 65 33 Central Luzon 66 61 52 38 19 CALABARZON 49 41 63 30 17 MIMAROPA 74 70 81 64 38 Bicol Region 105 88 95 89 88 Western Visayas 113 85 97 82 88 Central Visayas 104 98 134 98 69 Eastern Visayas 111 110 65 60 68 Zamboanga Peninsula 112 100 79 64 51 Northern Mindanao 163 135 156 128 96 Davao Region 54 53 53 33 23 SOCCSKSARGEN 104 94 90 82 49 Caraga 61 55 61 57 45 ARMM 67 69 76 46 44
Source: Philippine Statistics Authority (PSA)
ITEM 2012 2013 2014 2015R 2016

POPULATION AND LABOR FORCE
PHILIPPINE STATISTICS AUTHORITY
22
Table 9b.Proportion of working children 5-17 years old in agriculture by region, Philippines, 2012-2016(in percent)
PHILIPPINES 59.4 57.9 57.7 54.9 51.6
NCR 2.0 2.0 2.0 2.7 2.9 CAR 81.1 80.5 83.7 82.6 75.8 Ilocos Region 54.3 51.7 60.3 52.2 48.0 Cagayan Valley 78.7 78.9 76.4 77.4 64.7 Central Luzon 45.5 42.7 38.0 33.0 21.8 CALABARZON 36.3 32.5 38.2 26.1 15.3 MIMAROPA 64.9 69.3 66.9 69.6 62.3 Bicol Region 51.2 47.3 48.5 47.3 49.7 Western Visayas 59.2 57.0 58.1 55.8 60.3 Central Visayas 58.8 57.0 59.8 51.3 55.2 Eastern Visayas 58.7 57.9 55.6 58.3 56.2 Zamboanga Peninsula 72.7 75.2 67.5 68.8 67.1 Northern Mindanao 67.4 66.2 66.4 62.7 60.4 Davao Region 52.9 55.2 53.0 44.6 39.7 SOCCSKSARGEN 69.3 67.6 69.2 67.2 55.1 Caraga 54.5 50.0 54.5 53.3 60.8 ARMM 88.2 83.1 82.6 83.6 81.5
Source: Philippine Statistics Authority (PSA)
ITEM 2012 2013 2014 2015R 2016

PO
PU
LATIO
N A
ND
LAB
OR
FOR
CE
PH
ILIPP
INE STA
TIST
ICS A
UTH
OR
ITY
23
TA
BLE O
F CO
NTEN
TS iv
Table 10a.Labor productivity in agriculture by region, Philippines, 2012-2016( P at current prices)
Philippines 103,346 109,705 121,310 121,026 126,321
NCR 255,581 266,586 301,454 429,595 459,982CAR 62,191 67,770 68,606 63,016 69,311Ilocos Region 118,216 132,874 144,510 143,641 151,377Cagayan Valley 93,405 97,077 122,417 106,957 116,161Central Luzon 196,568 208,869 249,628 251,928 287,782CALABARZON 144,994 165,198 164,468 182,183 225,950MIMAROPA 79,554 82,317 94,215 94,993 98,093Bicol Region 64,381 72,069 82,127 74,346 80,458Western Visayas 101,844 107,253 104,441 105,406 111,575Central Visayas 62,745 60,818 62,467 65,138 63,496Eastern Visayas 67,438 63,907 108,415 117,409 79,239Zamboanga Peninsula 93,363 94,866 100,519 98,940 87,013Northern Mindanao 131,259 145,013 144,435 166,857 192,464Davao Region 134,754 135,020 149,108 167,282 163,896SOCCSKSARGEN 120,270 130,014 140,505 128,934 130,600Caraga 78,345 80,862 93,743 85,310 87,970ARMM 70,931 79,690 74,462 69,042 83,206
Source: Philippine Statistics Authority (PSA)
REGION 2012 2013 2014R 2015R 2016
Tab
le 9a
.To
tal n
um
ber o
f wo
rking ch
ildren
5-1
7 yea
rs old
in a
gricultu
re b
y region
, Ph
ilipp
ines, 2
01
2-2
01
62
1
Tab
le 9b
.P
rop
ortio
n o
f wo
rking ch
ildren
5-1
7 yea
rs old
in a
gricultu
re b
y region
, Ph
ilipp
ines, 2
01
2-2
01
62
2
Tab
le 10
a.
Lab
or p
rod
uctivity in
agricu
lture b
y region
, Ph
ilipp
ines,
20
12
-20
16
(at cu
rrent p
rices)2
3
Tab
le 10
b.
Lab
or p
rod
uctivity in
agricu
lture b
y region
, Ph
ilipp
ines,
20
12
-20
16
(at co
nsta
nt p
rices)2
4
PO
PU
LATIO
N A
ND
LAB
OR
FOR
CE
PH
ILIPP
INE STA
TIST
ICS A
UTH
OR
ITY
TAB
LE OF C
ON
TENTS
iii 2
4
Table 10b.Labor productivity in agriculture by region, Philippines, 2012-2016(P at constant 2000 prices)
Philippines 57,800 59,734 60,910 63,728 64,218
NCR 162,129 163,931 159,766 198,213 203,325CAR 37,265 38,066 35,580 34,681 36,086Ilocos Region 71,206 78,277 80,347 82,683 86,544Cagayan Valley 54,992 54,898 60,003 59,468 62,970Central Luzon 125,124 127,941 137,803 153,563 176,105CALABARZON 95,243 106,645 96,965 111,147 134,637MIMAROPA 43,618 44,219 45,364 48,147 47,510Bicol Region 36,091 38,622 39,344 37,900 39,160Western Visayas 57,130 56,664 50,901 51,993 54,291Central Visayas 32,593 32,464 30,811 31,715 30,077Eastern Visayas 40,924 37,330 52,420 57,433 37,603Zamboanga Peninsula 44,390 44,933 48,161 50,568 43,101Northern Mindanao 69,618 78,618 74,011 85,878 91,574Davao Region 60,313 57,504 57,813 64,376 58,623SOCCSKSARGEN 60,369 62,952 66,534 66,547 62,932Caraga 42,876 45,503 45,932 42,729 41,056ARMM 34,176 35,868 33,656 33,684 38,552
Source: Philippine Statistics Authority (PSA)
2016REGION 2012 2013 2014R 2015RFO
REW
OR
Di
LIST OF TA
BLES
iii
PO
PU
LATIO
N an
d LA
BO
R FO
RC
E
Tab
le 1.
Tota
l ho
useh
old
po
pu
latio
n 1
5 yea
rs old
an
d o
ver by regio
n,
Ph
ilipp
ines, 2
01
2-2
01
67
Tab
le 2a
.La
bo
r force b
y region
, Ph
ilipp
ines, 2
01
2-2
01
68
Tab
le 2b
.La
bo
r force p
articip
atio
n ra
te by regio
n,
9P
hilip
pin
es, 20
12
-20
16
Tab
le 3a
.N
um
ber o
f emp
loyed
perso
ns b
y region
, 1
0P
hilip
pin
es, 20
12
-20
16
Tab
le 3b
.Em
plo
ymen
t rate b
y region
, Ph
ilipp
ines, 2
01
2-2
01
61
1
Tab
le 4a
.N
um
ber o
f un
emp
loyed
perso
ns b
y region
, 1
2P
hilip
pin
es, 20
12
-20
16
Tab
le 4b
.U
nem
plo
ymen
t rate b
y region
, Ph
ilipp
ines, 2
01
2-2
01
61
3
Tab
le 5a
.N
um
ber o
f visibly u
nd
eremp
loyed
perso
ns b
y region
, P
hilip
pin
es, 20
12
-20
16
14
Tab
le 5b
.V
isible u
nd
eremp
loym
ent ra
te by regio
n,
15
Ph
ilipp
ines, 2
01
2-2
01
6
Tab
le 6a
.To
tal n
um
ber o
f emp
loyed
perso
ns in
agricu
lture b
y region
,P
hilip
pin
es, 20
12
-20
16
16
Tab
le 6b
.P
rop
ortio
n o
f emp
loyed
perso
ns in
agricu
lture b
y region
,P
hilip
pin
es, 20
12
-20
16
17
Tab
le 7a
.N
um
ber o
f emp
loyed
perso
ns in
agricu
lture b
y class o
f w
orkers, P
hilip
pin
es, 20
12
-20
16
18
Tab
le 7b
.P
rop
ortio
n o
f emp
loyed
perso
ns in
agricu
lture b
y class o
f w
orkers, P
hilip
pin
es, 20
12
-20
16
19
Tab
le 8.
Avera
ge da
ily ba
sic pa
y of w
age a
nd
sala
ry agricu
ltura
l w
orkers, P
hilip
pin
es, 20
12
-20
16
20

POPULATION AND LABOR FORCE
PHILIPPINE STATISTICS AUTHORITY
iii 20
MODULES OF THE AGRICULTURAL INDICATORS SYSTEM
1. Output and Productivity
2. Agricultural Structure and Resources
3. Economic Growth: Agriculture
4. Agricultural Exports and Imports
5. Food Sufficiency and Security
6. Food Consumption and Nutrition
7. Redistribution of Land
8. Population and Labor Force
9. Gender-based Indicators of Labor and Employment in Agriculture
10. Prices and Marketing of Agricultural Commodities
11. Agricultural Credit
12. Inputs

POPULATION AND LABOR FORCE
PHILIPPINE STATISTICS AUTHORITY
ISSN-2012-0435
REPORT No. 2017-8
PHILIPPINE STATISTICS AUTHORITY 16
th Floor, Eton Cyberpod Centris 3
EDSA, corner Quezon Avenue, Quezon City, Philippines 1100
Telefax No.: +63(2) 376-1954
URL: http://psa.gov.ph
/PhilippineStatisticsAuthority /PSAgovph