status and trends of coastal vulnerability to natural hazards ... phase 4...nonstructural...
TRANSCRIPT

1
Status and Trends of Coastal Vulnerability to Natural Hazards Project
Annual Report for Phase 4 by
Walter Gillis Peacock, Himanshu Grover, Douglas Wunneburger, Samuel D. Brody, Shannon Van Zandt, Rahmawati Husein, Hee Ju Kim, Forster Ndubisi, and June Martin.
Prepared for the Texas General Land Office
and The National Oceanic and Atmospheric Administration
Under GLO Contract No. 10-059-000-3758
A report of the Coastal Coordination Council pursuant to National Oceanic and Atmospheric Administration Award No. NA09NOS4190165.
This investigation was funded by a grant from the National Oceanic and Atmospheric Administration administered by the Texas General Land Office. The views expressed
herein are those of the authors and do not necessarily reflect the views of NOAA or any of its sub-agencies.
Hazard Reduction and Recovery Center College of Architecture Texas A&M University
TAMU 3731 College Station, Texas 77843
December 2011

2
Status and Trends of Coastal Vulnerability to Natural Hazards Project Annual Report for Phase 4
Texas A&M University
The Hazard Reduction and Recovery Center
When originally conceived, the Status and Trends of Coastal Vulnerability to Natural Hazards project is a multi-phase project designed to undertake a status and trends study of coastal vulnerability to natural hazards of counties located in the Coastal Management Program (CMP) boundary. The target areas for this study will be Harris, Galveston, and Brazoria counties. However, much of the overall analysis will include counties along the entire Texas Coast.1 The project includes the following tasks:
1. Evaluate content and implementation of the State of Texas Hazard Mitigation Plan (SHMP) (2004) for applicability to the CMP.
2. Assess the regulatory regime and effectiveness of construction codes and land use planning policies to mitigate potential impacts of coastal natural hazards.2
3. Identify best practices and emerging technologies related to building code and land use planning that could further mitigate potential impacts of coastal natural hazards.
4. Assess the local, state and federal resources available for mitigation, preparedness, response, and recovery to coastal natural hazards and evaluate their application to the CMP.
5. Evaluate the geographic relationship between current coastal management program boundaries and projected impacts from various categories of hurricanes based on the latest coastal study area maps.
6. Assess the physical and social vulnerabilities of coastal populations to facilitate planning and policy development related to hazard mitigation and response.
7. Assess the adoption of hazard mitigation technologies (e.g., hurricane shutters), issues related to the adoption of these technologies, and disaster planning by households and municipalities so that effective and targeted outreach and education activities can be developed.3
It is hoped that the research outlined above will generate policy and programmatic recommendations related to coastal programs, management, and regulations. This research will also develop tools for enhancing public involvement in mitigation decision
1 The original proposal targeted counties in and around the Lake Sabine area, which included Chambers, Hardin, Jasper, Jefferson, Liberty, Newton, and Orange counties. However, after consulting with GLO staff, it was mutually agreed that the target areas would be Harris, Galveston and Brazoria counties, with an emphasis on those areas and communities within the CMP boundary. Throughout the first phase of this project, other changes were made to the original proposal, always based on consultation and agreement with the GLO staff. This document reflects these changes. 2 By mutual agreement, the emphasis of this task shifted from construction codes and land-use planning policies, to a focus and assessment of mitigation actions plans and mitigation actions for areas within the CMZ. 3 By mutual agreement and due to budget cuts in March of 2010 it was agreed that this task would focus on the adoption of mitigation polices by municipalities and not households.

3
making and planning, as well as for assessing programmatic and policy weaknesses and hazard vulnerabilities along the Texas coast. Finally, it is hoped that this research will generate recommendations to better insure compatibility between and concerted action based on the SHMP and the CMP, strengthening mitigation activities throughout the CMP boundary. The following report provides a brief overview of the accomplishments for the fourth phase of this project and its associated tasks as outlined in the specific contract for Cycle 14. A report associated with Task 7 above and Task 5 below in included as Appendix 1. Task 1 - Phase 4: Identify best practices and emerging technologies related to hazard mitigation planning, building code, land use planning that could further mitigation against potential impacts of coastal natural hazards. Task Description: This task will draw from findings emerging from Phases 1-3. As part of the interviewing and investigations of building codes and land use planning policies, best practices will, on a continuing basis, be identified. This task highlight best practices in terms of their relative effectiveness and outline issues that emerged as local jurisdictions have sought to incorporate these practices into their local building codes or land use practices. Best practices that emerged and/or were adopted by local jurisdictions within Texas will be sought. However, this task will also review literature on land use planning, building codes, and emerging construction technologies that have the potential to positively impact coastal mitigation actions. Deliverable(s): The website will be enhanced and updated as content is identified. The initial Best Practices website was launched at the end of November 2008 on the TAMU website and has also been add to the TAMU-Galveston website (http://coastalatlas.tamug.edu). The content of the website in terms of adding new information and checking existing information and linkages has been updated through out the Cycle 14 year. The Best Practices websites can be accessed off the Coastal Atlas portal website: http://coastalatlas.tamug.edu (see figure 1 below).

4
Figure 1. Texas Coastal Atlas web-portal
After entering the portal, the user clicks on the “Resources” button, which is on the left side of the screen. After clicking the resources button, the resources web-page opens. This page gives users access to two resources pages; one of those pages is the “Best Practice Resources.”
Figure 2. The Coastal Atlas Resource Page

5
Figure 3. The Best Practices Webpage
The actual location of the website is: http://coastalatlas.tamug.edu/bestpractices.htm> . The Best Practices web-page displays information regarding special websites that identify a host of suggested best practices related to hazard mitigation policies and actions, videos of best practices projects and examples, and other information. In total the web-pages offers 6 different categories of potential best practices that include over 75 sources including websites, books and articles. The main sections are as follows:
• Best practices in hazard mitigation: This section offers a series of websites and even videos. Many of these sites are state or federal government websites that provide general mitigation best practices. In addition to the FEMA mitigation best practices website there are websites from Florida, Wisconsin, Colorado, and the National Governor Association’s website.
• Best practices by hazard type: This section offers a series of websites that focus on best practices related to flood, wind and wildfire hazards. This section, again targets a variety of websites, including the National Flood Insurance Program (NFIP) and the Community Rating System’s website. These two websites are important information that can greatly enhance policies focused on flooding.
• Best Practices in Planning, Management, and Administration: This section addresses best practices with respect to land use planning, recovery planning, and building codes. These best practices are particularly important because they offer information on a great variety of non-structural approaches to hazard mitigation, which we found to be under utilized in the mitigation action plan analysis.
• Technical Tools and Modeling Tools for Best Practices: This section includes websites that offer information on three sets of tools including FEMA’s HAZUS modeling tool, various evacuation modeling tools (HURREVAC, ETIS, and OREMS) and a flooding risk modeling tool (HEC-RAS).

6
• Academic Resources on Best Practices: This section providing a set of references for important research articles and books that discuss mitigation, vulnerability, resiliency and sustainability, recovery, and emergency planning.
• Organizations and Associations: This section lists and give web links to organization and associations that address mitigation and hazard mitigation planning. These have been roughly classified into general and specific hazard areas as well as a listing of academic research centers that offer a host of information on mitigation.
The following offers a complete listing of the contents of the best practices website. I. Best practices in Hazard Mitigation
• Texas local jurisdictions best practices o Tiki Island o KemahStrizek o Orange County 1 2 o Beaumont o Hindalgo County o Kemah o Rio Bravo o Maverick County
• Mitigation best practice portfolios • FEMA’s mitigation practices search page • Florida Hazard Mitigation Best Practices Guides • Lee county, Florida website • Wisconsin Hazard Mitigation Success Stories and Current State and Local
Mitigation Practices • Colorado Best practices in Natural Hazards Planning and Mitigation: • National Governor Association • Public and private sector best practice stories for all activity/project type in all
states and territories relating to all Hazards, FEMA, August 10, 2011
II. Best practices by Hazard Type • Flood
o NFIP insurance o CRS program o Stormwater best management practices o Best practices for Flood Mitigation o Mecklenburg County (Hazard Mitigation Plan, PowerPoint, Storm
water management) o Kinston, North Carolina (Flood plain management) o Mississippi Coastal Mapping Project for Floodplain Managers, Engineers,
Surveyors, and Architects • Wind
o Texas Department Insurance (TDI), Windstorm inspection program o New School Building “Hardened” Against the Wind

7
• Wildfire o National Database of State and Local Wildfire Hazard Mitigation
Programs: This database provides various information about current policies and programs related to wildfire.
III. Best practice in planning, management and administration • Land use planning
o APA(American Planning Association) o APA has conducted research regarding integrating hazard mitigation into
local planning and introduced best practices in their webpage o Bibliography on literature review regarding integrating hazard mitigation
in local planning and best practices • Recovery planning
o ASCE (American society of Civil Engineers) o American City and County:
Coastal towns rethink development patterns: Katrina recovery plans incorporate mixed uses. May 2006.
• Building Code o IBHS (Institute for Business &Home Safety) building code webpage o Building code reference library:
This webpage provides you with detailed information on building codes for all 50 states, major cities, and some counties.
o Florida Building code: this webpage provide information of Florida building code.
o Whole Building Design Guide (WBDG) o ASCE (American Society Civil Engineers):
Building standards guide information o Building code examples
Miami-Dade County California Code of Regulations (CCR)
IV. Technical tools and modeling tools for best practices
• FEMA HAZUS o FEMA o NIBS (National Institute of Building Sciences): Multi-hazard Loss
Estimation Methodology • Evacuation modeling
o HURREVAC (Hurricane Evacuation) o CATS/JACE (Consequence Assessment Tool Set/Joint Assessment of
Catastrophic Events) o ETIS (Evacuation Traffic Information Systems)
Recommended practices for hurricane evacuation traffic operations o OREMS (Oak Ridge Evacuation Modeling System)
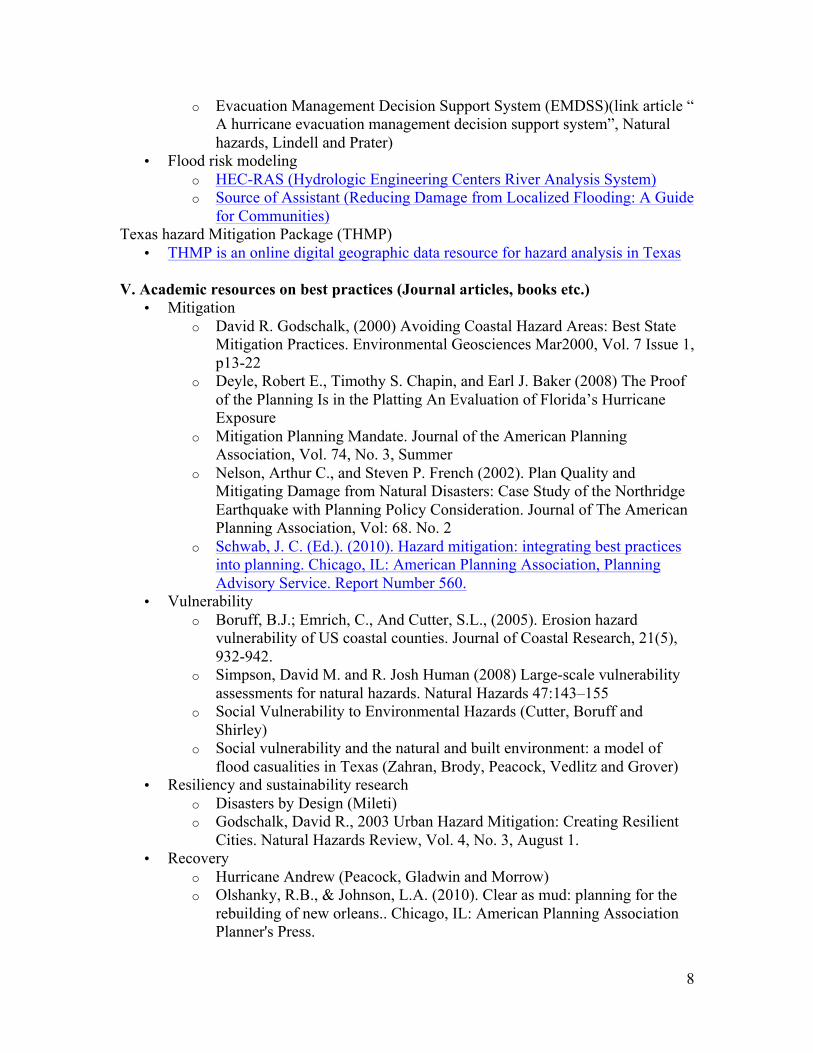
8
o Evacuation Management Decision Support System (EMDSS)(link article “ A hurricane evacuation management decision support system”, Natural hazards, Lindell and Prater)
• Flood risk modeling o HEC-RAS (Hydrologic Engineering Centers River Analysis System) o Source of Assistant (Reducing Damage from Localized Flooding: A Guide
for Communities) Texas hazard Mitigation Package (THMP)
• THMP is an online digital geographic data resource for hazard analysis in Texas V. Academic resources on best practices (Journal articles, books etc.)
• Mitigation o David R. Godschalk, (2000) Avoiding Coastal Hazard Areas: Best State
Mitigation Practices. Environmental Geosciences Mar2000, Vol. 7 Issue 1, p13-22
o Deyle, Robert E., Timothy S. Chapin, and Earl J. Baker (2008) The Proof of the Planning Is in the Platting An Evaluation of Florida’s Hurricane Exposure
o Mitigation Planning Mandate. Journal of the American Planning Association, Vol. 74, No. 3, Summer
o Nelson, Arthur C., and Steven P. French (2002). Plan Quality and Mitigating Damage from Natural Disasters: Case Study of the Northridge Earthquake with Planning Policy Consideration. Journal of The American Planning Association, Vol: 68. No. 2
o Schwab, J. C. (Ed.). (2010). Hazard mitigation: integrating best practices into planning. Chicago, IL: American Planning Association, Planning Advisory Service. Report Number 560.
• Vulnerability o Boruff, B.J.; Emrich, C., And Cutter, S.L., (2005). Erosion hazard
vulnerability of US coastal counties. Journal of Coastal Research, 21(5), 932-942.
o Simpson, David M. and R. Josh Human (2008) Large-scale vulnerability assessments for natural hazards. Natural Hazards 47:143–155
o Social Vulnerability to Environmental Hazards (Cutter, Boruff and Shirley)
o Social vulnerability and the natural and built environment: a model of flood casualities in Texas (Zahran, Brody, Peacock, Vedlitz and Grover)
• Resiliency and sustainability research o Disasters by Design (Mileti) o Godschalk, David R., 2003 Urban Hazard Mitigation: Creating Resilient
Cities. Natural Hazards Review, Vol. 4, No. 3, August 1. • Recovery
o Hurricane Andrew (Peacock, Gladwin and Morrow) o Olshanky, R.B., & Johnson, L.A. (2010). Clear as mud: planning for the
rebuilding of new orleans.. Chicago, IL: American Planning Association Planner's Press.

9
o Deyle, R., Eadie, C., Schwab, J., Smith, R., & Topping, K. (1998). Planning for post-disaster recovery and reconstruction (pas 483/484). Chicago, IL: APA Planning Advisory Committee.
• Emergency planning o Emergency planning(Perry and Lindell)
• Natural resource management
VI. Organizations and Associations • Multi-hazards
o FEMA Mitigation o APA Growing Smart o IBHS (Institute for Business and Home Safety) o National Institute of Building Sciences Multihazard Mitigation Council o USGS Hazards o International Strategy for Disaster Reduction o Union of concerned scientists – citizens and scientists for environmental
solutions – special resource info for gulf coast • Earthquake
o Building Seismic Safety Council(BSSC) o Earthquake Engineering Research Institute (EERI)
• Hurricane, Wind o Wind Science and Engineering Research Center, Texas Tech University o HazNet:
The National Sea Grant Network Web Site for Coastal Natural Hazards Information.
• Flood o Association of State Floodplain Managers (ASFPM)
• Fire o Color Country Interagency Fire Management Area o The Fire Safe Council o Firewise Communities o National Interagency fire Center o National Database of State and Local Wildfire Hazard Mitigation
Programs o National Fire Protection Association
• Research Institute o Hazard Reduction and Recovery Center, Texas A&M University o Natural Hazards Center, University of Colorado at Boulder o Disaster Research Center, University of Delaware o Hazards & Vulnerability Research Institute, University of South Carolina

10
Task 2 – Phase 4: Assess the local, state and federal resources available for mitigation, preparedness, response and recovery from coastal natural hazards and evaluate their application to the TCMP. Task Description: Regardless of whether one is a period of declining or expanding funding from federal, state, or local sources, the funding of activities to address hazard impacts or potential impacts will often require the creative use of a host funding resources, many of which might not appear to be particularly relevant at first glance. For example, low-income housing is often the most susceptible to hurricane hazards, yet targeting a program to directly address these issues can be difficult. However, using local housing authority and energy efficiency funding, some local communities have been able to match State funding and provide shutters for low-income elderly homeowners. The focus of this task will identify local, state, and federal resources that might be employed to meet mitigation, preparedness, response, and recovery needs stemming from coastal hazards. Deliverable(s): The website will be enhanced and updated as content is identified.
Figure 4. Community Resources Webpage
Figure 4, above, displays the community resource webpage that was initially launched in November of 2008. It is accessible by selecting or clicking on the hot link off the Community Resources webpage (see Figure 2). The actual website is at:

11
http://coastalatlas.tamug.edu/community.htm It is frequently updated and its links are checked for accuracy. The community resource page lists over 80 State and Federal websites that provide information on different types of resources that can be utilized to improve and develop mitigation policies and, most importantly, fund and implement potential mitigation actions. The complete listing of resource hot links is as follows: State Authorized Programs
• Texas Natural Resources Conservation Commission o Clean Rivers Program
• Texas Water Development Board o Clean Water State Revolving Fund o Research and Planning Fund Grants o State Participation and Storage Acquisition Program o Texas Natural Resources Information System o Texas Water Development Fund
• Texas Coastal Coordination Council o Texas Coastal Management Program Grants
• Texas Division of Emergency Management o Hazard mitigation grant program(HMGP) 1 2 o Pre-Disaster Mitigation Grant (PDM)
• Texas General Land Office o Hazard Mitigation o Coastal Impact Assistance Program (CIAP) for Construction (Texas
Recipients Only) • The Texas Department of Rural Affairs (TDRA)
o Community development Funds, Disaster Recovery, Emergency Services
Federally Authorized Programs
• Department of Agriculture, Natural Resources Conservation Service o Emergency Watershed Protection Program o Watershed Protection and Flood Prevention Program o Watershed Surveys and Planning o Wetlands Reserve Program
http://www.nrcs.usda.gov/programs/watershed/index.html http://www.nrcs.usda.gov/programs/wrp/
• Department of Housing and Urban Development Disaster Relief/Urgent Needs Fund Texas Community Development Program Community Development Block Grant (CDBG)
o Environmental Protection Agency Drinking Water State Revolving Funds Nonpoint Source Grant Program

12
Water Protection Coordination Grants to States Water Quality Cooperative Agreements Watershed Initiative Grants Wetlands Grants
o Federal Corporation for National and Community Service, Special Volunteer Programs and the Retired and Senior Volunteer Program
o Department of Homeland Security Citizens Corp http://www.dhs.gov/xopnbiz/grants/ http://www.dhs.gov/xgovt/grants/index.shtm http://www.grants.gov/ http://www.dhs.gov/xlibrary/assets/OfB_CDFA_Crosswalk.pdf
All-Hazards Emergency Operational Planning Antiterrorism and Emergency Assistance Program Assistance to Firefighters Grant Buffer Zone Protection Program Chemical Stockpile Emergency Preparedness Program Community Assistance Program, State Support Services Element
(CAP-SSSE) Citizens Corp Community Emergency Response Teams (CERT) Community Disaster Loans Competitive Training Grants Program Cooperating Technical Partners COPS Interoperable Communications Technology Program Disaster Preparedness Improvement Gant (DPIG) Emergency Food and Shelter Program Emergency Operations Center Funding Emergency Management Performance Grant Fire Management Assistance Grant Program First Responder Counter-Terrorism Training Assistance Flood Hazard Mapping Program Flood Mitigation Assistance Grant Program Flood Recovery Mapping Hazard Mitigation Grant Program (HMGP) Hazardous Materials Assistance Program Hazardous Materials Emergency Preparedness Training and Planning Hurricane Local Grant Program Infrastructure Protection Program (IPP)Law Enforcement Terrorism
Prevention Programs Individual Assistance Program Map Modernization Management Support National Dam Safety Program National Earthquake Hazard Reduction Program National Flood Insurance Program National Urban Search and Rescue (US & R) Response System

13
Pre-Disaster Mitigation Grant Program (PDM) Public Assistance Grant Program Preparedness Grant Fund Repetitive Flood Claims Program (RFC) Regional Catastrophic Preparedness Grant program --
http://www.fema.gov/government/grant/rcp/index.shtm Section 406 Hazard Mitigation Grant Program Severe Repetitive Loss (SRL) State Homeland Security Program State and Local Domestic Preparedness Training Program Superfund Amendments and Reauthorization Act
o Small Business Administration Small Business Administration Disaster Assistant Program Pre-Disaster Mitigation Loan Program
o U.S. Army Corps of Engineers Useful Government Links Programs Planner’s Study Aids
Aquatic Ecosystem Restoration http://www.usace.army.mil/CECW/PPA http://www.usace.army.mil/CECW/PlanningCOP/Documents/library/pgms/pgl97-05.pdf
Aquatic Habitat and Wetlands Beach Erosion and Coastal Projects Clearing and Snagging Projects Emergency Advance Measures for Flood Prevention Emergency Rehabilitation of Flood Control Works or Federally
Authorized Coastal Protection Works Emergency Streambank and Shoreline Protection Floodplain Management Services Nonstructural Alternatives to Structural Rehabilitation of Damaged
Flood Control Works National Flood Risk Management Program Planning Assistance to States Small Ecosystem Restoration Small Flood Control Projects
o Community Capacity Development Office (CCDO), Office of Justice Programs (OJP), U.S. Department of Justice
Operation Weed and Seed o Department of Health and Human Services
Public Health Emergency Preparedness Bioterrorism Training and Curriculum Development
o National Storm Shelter Association

14
Tasks 3 and 4 – Phase 4: Both Tasks 3 and 4 deal with assembling various forms of data, such as mapping or spatial data and utilizing these data to create, populate and improve the platform for their usage to help Texas coastal communities and various stakeholders communities and stakeholders in their planning activities. Indeed the primary activity required by these tasks was development and maintenance of a website to display data and tools that will enable the public to gain access to these data in a user friendly website environment. Over the course of this multi-year project the website developed for this purpose is called the Coastal Planning Atlas, the most up to date version is now hosted and in Galveston (coastalatlas.tamug.edu). Given the similarities between these two tasks, the accomplishments for each will be discussed together. The following will briefly outline the tasks and subtasks associated with each. This will be followed by a discussion of the accomplishments for both tasks and their subtasks during phase 4. Task 3 – Phase 4: Evaluate the geographic relationship between current CMP boundaries and project impacts from various categories of hurricanes based on the latest coastal study area maps. Task 3 Description: Task 3 is developing procedures for spatially displaying and analyzing the mosaic of coastal management and planning regimes in conjunction with coastal management program boundaries and physical hazard vulnerabilities. The goal is to provide insights with respect to the spatial distribution of quality management and contiguous (or noncontiguous) consistency and compatibility in management in order to identify weaknesses in broader coastal management issues. In a very real sense, the focus of this task will be a spatial analysis of coastal management vulnerability – an analysis of vulnerabilities emerging due to management deficiencies or inconsistencies. This task includes the following objectives: a. Continue assembling physical hazard analyses related to coastal natural hazards (surge
maps, inland flooding maps, flood plain maps, and wind field maps). b. Continue assembling and integrating coastal management and policy boundary files. c. Continue development and refinement of methodologies for displaying general policies
based on quality and area of implementation. d. Continue spatial analysis of these data and where necessary develop methodological
tools to display these data and the results from the analyses. e. Continue development of website to making the findings available to prospective users. Deliverable(s): Updates provided in progress reports Task 4 – Phase 4: Assess the physical and social vulnerabilities of coastal populations to facilitate planning and policy development related to hazard mitigation and response.

15
Task 4 Description: A critical element in the determining “management vulnerabilities” and hazard mitigation plans and planning along with building codes is an assessment of the physical and social vulnerabilities of a coastal population. This task is important to the success of the larger project and will provide a usable set of products for end users making decisions related to hazard management planning and policy development. This task includes the following objectives: a. Continue acquiring, refining, and compiling additional data as it becomes available. b. Continue spatial analysis and finalize methodologies for identifying socially vulnerable
populations. c. Update and complete the development of the website or making the findings available
to prospective users. d. Refine temporal and spatial assessments of social (and physical if possible)
vulnerability utilizing historical census data. Deliverable(s): Updates provided quarterly In sum, both Tasks 3 and 4 include collecting data (primarily secondary data), continue creatively evolve a website that will allow for the mapping of these data and the development of tools to utilize these data. While Task 3 focuses on hazard data and policy data, Task 4 includes additional hazard data, data on physical hazards and, most importantly this year data for establishing and measuring population social vulnerabilities. Both tasks address continuing to spatially analyzing these data and developing methodological tools for displaying the data and results and providing a web based system whereby prospective users can make use of the data and their results. The additional major task for this phase was to undertake the writing of a report utilizing the data collected to spatially analyze population social vulnerabilities of coastal counties, focusing on the CMZ. The following offers some of the highlights of the website, its data, and its tools. I. Website options and enhancements: Phase 4 of the Status and Trends project has seen major improvements to the Coastal Atlas Website. We have continued to modify the look, feel, and content of the Coastal Planning Atlas by improving data layers, displays and tools. New servers have been brought on line at Texas A&M Galveston that have greatly enhanced the capabilities of the website. Indeed, the website is hosted in both locations: coastalatlas.tamu.edu and coastalatlas.tamug.edu. We have gone from principally three (3) websites to offering five (5) different Atlas websites delivering a variety of data and tools targeting particular areas or analysis themes in an easily accessible manner with a host of tools to allow for visualization of the data and data analysis. It has become clear that in our attempts to enhance and stabilize the atlas operation we must shift to ArcGIS technology. This has required a transformation of our Geodatabase into ArcSDE technology. The conversion to SDE database tables is significant and a necessity to expand the coverage. All of the files have been moved. All of the data have

16
been consolidated on the databases; The matching (consistent is probably a better descriptor) boundaries are enabled by consolidation. Also, the organization of the data tables is improved. The user gets the same look (field names, eg.) using any census geography. This reorganization of data also enables us to create relations to other geographies, such as surge zones or user generated spatial queries. All versions of the atlas are operating off of the SDE data in College Station. However in our continuing endeavor to improved the website, the most substantial changes have involved a consolidation of data and many new additional data layers all appearing on the main coastal atlas website.
Figure 5. Atlas Options Web-page.
The principle access point for the website is through http://coastalatlas.tamug.edu pictured in Figure 1 (see above). The user clicks on the “Atlas” button on the left hand side of the webpage. Once that button is clicked, the Atlas-options webpage (see Figure 5) opens offering 5 different Atlas web-pages or entry portals. These websites were first made available during phase 3 and they continued to be available and maintained during phase 4. The Main Atlas has been the site of major changes that will be discussed below, the Vulnerability Hotspot Atlas offers pre-analyzed and configured data layers to enable users to undertake both physical, social, and environmental vulnerability and sustainability analysis, the Galveston Atlas provides very rich and refined data at a high resolution for the Galveston County, the Run-off Model and Pollution-Load Tool offer a unique ‘what if’ approach that allows the user to understand the consequences, in terms of potential flooding runoff and pollution consequences for different types of development in Galveston county. The following will provide a brief tour of these first four atlas pages.

17
Access to the main atlas webpage can be gained by simply clicking on the “Main Atlas” hotlink in the center of the Atlas Options Webpage. Figure 6 displays a visual representation of the main atlas page. This website has been vastly improved and expanded during phase 4. Indeed, it now can display all of the data and analysis features available This webpage now displays 19 different categories of data layers including administrative boundaries, Policy data, transportation, census data, social vulnerability analysis, topography, ecological data, hot spot analysis, hydrological data, protected areas, recreational facilities, development data, Natural hazards data, costal data, coastal development data, offshore risk, place and facilities data, climate data and additional base mapping data. During phase 3 the main atlas contained approximately 100 data layers, as part of Phase 4, over 173 additional data layers have been added, bring the total number of data layers to 273! The entire detailed listing of these 273 data layers can be found in Table 1. The new layers are indicated in red. What is most exciting about the changes to the main atlas is that analysis like the social vulnerability analysis and assessments that were once only available for the northeastern coast of Texas, are now available for the entire coast. In addition, some of the interesting data that have been added include data on schools and school districts, officially recognized colonias – informal communities often lacking in basic infrastructure.
Figure 6. The Main Atlas Page

18
Table 1. A Detailed Listing of Data Layers Available Through the Main Atlas Webpage.
Administrative boundaries 1. State boundary 2. Texas Counties 3. School Districts 4. City Limits 5. Three Nautical line 6. Three Marine line
Policy Data 7. Coastal Zone Boundary 8. Coastal Management Zones 9. Study Area 10. School District Wealth Index 11. School District Tax Rate 12. School District Revenue 13. Building Code 14. Colonias
Transportation 15. Interstate Highway 16. Major Highway 17. Roads 18. Hurricane Evacuation Route 19. Railroad 20. Heliports 21. Airports
Census Data 22. County Population (2000) 23. Census Tract Population (2000) 24. Block Group Population (2000) 25. Block Population (2000)
Census 1980-1990 26. Tract new population (1990) 27. Tract new population (2000) 28. Group new population (1990) 29. Group new population (2000) 30. County new population (1990) 31. County new population (2000) 32. Place new population (1990) 33. Place new population (2000)
Social Vulnerability Analysis 1980 34. Single Parent Households with Children 35. Population < 5 years 36. Population Age > 65 years 37. Population Age > 65 years below Poverty
Line 38. Workers using Public Transportation 39. Households without Vehicle 40. Occupied Housing Units 41. Renters 42. Race (non-White) 43. Persons in Group Quarters 44. Housing Units > 20 years 45. Mobile Homes 46. Persons in Poverty 47. Occupied Housing Units without phone 48. Education less than HS for Age > 25 years 49. Unemployed (Age > 16 years) 50. Population speaking English not well/not at
all (Age>5years) Social Vulnerability 2nd and 3rd Level Measures 1980
51. Child Care Needs 52. Elderly Care Needs 53. Transportation Needs 54. Recovery Needs 55. Capacity Building Needs 56. Social Vulnerability Index (SVI)
Social Vulnerability Analysis 1990 57. Single Parent Households with Children 58. Population < 5 years 59. Population Age > 65 years 60. Population Age > 65 years below Poverty
Line 61. Workers using Public Transportation 62. Households without Vehicle 63. Occupied Housing Units 64. Renters 65. Race (non-White) 66. Persons in Group Quarters 67. Housing Units > 20 years 68. Mobile Homes 69. Persons in Poverty 70. Occupied Housing Units without phone 71. Education less than HS for Age > 25 years 72. Unemployed (Age > 16 years) 73. Population speaking English not well/not at
all (Age>5years) Social Vulnerability 2nd and 3rd Level Measures 1990
74. Child Care Needs 75. Elderly Care Needs 76. Transportation Needs 77. Recovery Needs 78. Capacity Building Needs 79. Raw total Social Vulnerability Index (SVI)
Social Vulnerability Analysis 2000 80. Single Parent Households with Children 81. Population < 5 years 82. Population Age > 65 years 83. Population Age > 65 years below Poverty
Line 84. Workers using Public Transportation 85. Households without Vehicle 86. Occupied Housing Units 87. Renters 88. Race (non-White) 89. Persons in Group Quarters 90. Housing Units > 20 years 91. Mobile Homes 92. Persons in Poverty 93. Occupied Housing Units without phone 94. Education less than HS for Age > 25 years 95. Unemployed (Age > 16 years) 96. Population speaking English not well/not at
all (Age>5years) Social Vulnerability 2nd and 3rd Level Measures 2000
97. Child Care Needs 98. Elderly Care Needs 99. Transportation Needs 100. Recovery Needs 101. Capacity Building Needs 102. Raw total Social Vulnerability Index (SVI)

19
Intra-County Analysis 103. SVI Aransas_1980 104. SVI Aransas_1990 105. SVI Aransas_2000 106. SVI Bee_1980 107. SVI Bee_1990 108. SVI Bee_2000 109. SVI Brazoria_1980 110. SVI Brazoria _1990 111. SVI Brazoria _2000 112. SVI Brooks_1980 113. SVI Brooks _1990 114. SVI Brooks _2000 115. SVI Calhoun_1980 116. SVI Calhoun _1990 117. SVI Calhoun _2000 118. SVI Cameron_1980 119. SVI Cameron _1990 120. SVI Cameron _2000 121. SVI Chambers_1980 122. SVI Chambers _1990 123. SVI Chambers _2000 124. SVI FortBend_1980 125. SVI FortBend _1990 126. SVI FortBend _2000 127. SVI Galveston_1980 128. SVI Galveston_1990 129. SVI Galveston_2000 130. SVI Goliad_1980 131. SVI Goliad_1990 132. SVI Goliad_2000 133. SVI Hardin_1980 134. SVI Hardin _1990 135. SVI Hardin _2000 136. SVI Harris_1980 137. SVI Harris _1990 138. SVI Harris _2000 139. SVI Hildalgo_1980 140. SVI Hildalgo_1990 141. SVI Hildalgo_2000 142. SVI Jackson_1980 143. SVI Jackson _1990 144. SVI Jackson _2000 145. SVI Jasper_1980 146. SVI Jasper _1990 147. SVI Jasper _2000 148. SVI Jefferson_1980 149. SVI Jefferson _1990 150. SVI Jefferson _2000 151. SVI JimWells_1980 152. SVI JimWells_1990 153. SVI JimWells_2000 154. SVI Kenedy_1980 155. SVI Kenedy_1990 156. SVI Kendey_2000 157. SVI Liberty_1980 158. SVI Liberty _1990 159. SVI Liberty _2000 160. SVI LiveOak_1980 161. SVI LiveOak _1990 162. SVI LiveOak_2000 163. SVI Matagorda_1980
164. SVI Matagorda _1990 165. SVI Matagorda _2000 166. SVI Newton_1980 167. SVI Newton _1990 168. SVI Newton _2000 169. SVI Nueces_1980 170. SVI Nueces _1990 171. SVI Nueces _2000 172. SVI Orange_1980 173. SVI Orange _1990 174. SVI Orange _2000 175. SVI Refugio_1980 176. SVI Refugio_1990 177. SVI Refugio_2000 178. SVI SanPatricio_1980 179. SVI SanPatricio _1990 180. SVI SanPatricio _2000 181. SVI Victoria_1980 182. SVI Victoria _1990 183. SVI Victoria _2000 184. SVI Wharton_1980 185. SVI Wharton_1990 186. SVI Wharton_2000 187. SVI Willacy_1980 188. SVI Willacy _1990 189. SVI Willacy _2000
Climate 190. Rainfall
Topography 191. Elevation
Ecological Data 192. Ecosystem Criticality Measure 193. Eco-Regions 194. Vegetation 195. Seagrass 196. Washover Areas 197. Environmental Sensitivity Index
Hydrology 198. Hydrological Units 199. Rivers and Streams 200. Lakes and Reservoirs
Protected Areas 201. Federal Lands 202. National Parks 203. State Parks 204. Wildlife Refuge 205. Marine Sanctuaries 206. Audubon Sanctuaries 207. Coastal Preserves 208. Burn Exclusion Zone 209. Habitat Priority Areas 210. Wetland Inventory Data 211. Historic Places (National Register) 212. Species 213. Rookery 214. Hard Reefs 215. Open gulf 216. Refish Bay State Scientific Area
Recreation 217. County and City Parks 218. Beach Access 219. Marinas

20
220. Boat Ramps Development
221. Census county Property Values (2000) 222. Census Tracts Property Values (2000) 223. Census Block Groups Property Values (2000) 224. Populated Places 225. Dams 226. Wetland Permits 227. Location Quotient Analysis
Natural Hazards 228. Hurricane Surge Zones Category 1 229. Hurricane Surge Zones Category 2 230. Hurricane Surge Zones Category 3 231. Hurricane Surge Zones Category 4 232. Hurricane Surge Zones Category 5 233. Hurricane Risk Zones Category 1 234. Hurricane Risk Zones, Category 2 235. Hurricane Risk Zones, Category 3 236. Hurricane Risk Zones, Category 4 237. Hurricane Risk Zones, Category 5 238. Hurricane Tracks 239. Hazard Events (1960-2005) 240. FEMA Floodplains 241. FEMA Flood Zones Risk (Detailed) 242. Fire Risk Zones 243. Earthquake Risk Zone
Coastal Data 244. Coastal Topography 245. Bathymetry Points 246. Bathymetry Lines (Bathymetry contours) 247. Sea Floor Features
248. Tidal Influence Zone 249. Detailed Shoreline 250. Ship Channel 251. Ship Fairway 252. Coast Guard
Coastal Development 253. Resource Management codes 254. Offshore Blocks 255. Oil and Gas Leases 256. Oil and Gas Units 257. Coastal Lease Polygons 258. Oil and Gas Platforms
Offshore Risks 259. Environmental Sensitivity Index 260. Erosion Areas (Erosion) 261. Tidal Influence (Tidal Influence Zone) 262. Coastal Barriers 263. Dredged Sites
Places and Facilities 264. Public Schools 265. Place Names 266. Populated Places
Background 267. Texas Image 268. Coastal County Name 269. Coastal County Shade 270. Texas County Boundaries 271. State Boundary 272. Water 273. Mexico
The websites have full set of operative GIS tools that are located in the upper left hand corner, just above the map itself. These tools are available in all three of the Atlas webpages (Main, Hotspot, and Galveston). The buttons in the grey bar offer tools that, for the most part, provide information regarding the current map. Activating or selecting one of these tools results in the information appearing in the left frame of the atlas screen. For example, clicking the “Layers” button results in the 19 categories (or 273 detailed categories) of data layer options appearing in this frame, which allows the user to active specific data layers for presentation. Furthermore, if one clicks on the “Legend” button, a legend will appear in the left frame providing the user with information regarding the data currently being displayed in the map frame. One can also select the “Print PDF” button to obtain a hardcopy of the current map. There are also a set of quick tools including: zoom in (+), zoom out (-) query tool (i), and a tool to move the map (the hand symbol). There are more advanced tools that can be opened in the red, green, and blue tool box icons. The red tool box contains tools to save current work, email the results, upload or download data, as well as a tool that allows the user to use additional visualization tools such as “Virtual earth,” or “Google earth” to obtain a visual picture of a mapped location. This tool box also contains tools to get measurements and add captions to a map. The green tool box contains a number of mark-up tools. These tools allow one to draw on or add additional information to a map. For example one can draw dots, add lines, add geo-referenced lines or points, draw polygons, move mark-up symbols, and add labels. These

21
are all tools that should be particularly useful when conducting workshops or planning charrettes. During these events participants can display a variety of attributes and then use markup tools to discuss “what if” scenarios and ask questions like: What if land-use patterns are changed in ‘this’ area? What wetland areas might be impacted? How would the look of your community change? The final tool box, the blue tool box, contains additional query tools where by one can select and create complex sets of queries where by one can use attribute tables to select and combine data to answer questions. There is also a fully function tutorial that can be executed to provide more information about how to use the full GIS capabilities built into the system by Geocortex® and ArcIMS ® We will be converting away from these in the very near future. The following are some examples of simple maps that display some of the data available in the Main Atlas web page. The first map, Figure 7, is a very simple map of hurricane surge zones for an area in and around Galveston, Harris, Brazoria and Chambers counties. The surge zones range from those associated with a category 1 storm in dark red, category 2 in light red, category 3 in dark pink, category 4 in lighter pink and, lastly category 5 storm in very light pink that because of the green background almost looks light green. This is an interesting map because it clearly shows many surge risk areas extend well beyond the CMZ. This may well be a good argument for extending the CMZ further inland in many areas, because these are coastal areas subject to coastal storm surge. Furthermore, it should also be clear that substantially all areas within the CMZ are highly vulnerable to surge.
Figure 7. Main Atlas with Surge Zones and CMZ layers active.

22
Figure 8. More Elaborate map of Corpus Christi & Port Aransas Areas.
Figure 8 offers a bit more elaborate map of the Corpus Christi and Port Aransas area. This map includes bathometry data and road/highway data along with the surge zone data from category 1 through 5. Of course, one can zoom all the way into a much higher resolution to capture surge zones relative to specific roads and neighborhoods. In addition, as shown in Figure 9, by activating the external map visualization tool, the user can bring up a virtual map of any location, geo-referenced to the map being developed within the Atlas. Here, a Google-map is has been activated to actually display a picture of this location.

23
Figure 9. Figure 8’s Map including a Google Map Viewer Image of the Map’s Location
As noted above, one of the most exciting features of the new main atlas page is that all of the social vulnerability data layers, and more, that were only available on the vulnerability hotspot page for the northeastern coast, are now available for the entire coast. Many of these data have been processed with respect to the county or municipality to allow for county and city planners, emergency management officials, stakeholders, or just the general public throughout the entire Texas coast to undertake analysis that is relevant for their particular area of interest. These include ecosystem criticality measures that assess how critical ecosystem areas (defined by county area, census tract area, and census block area) are under stress due to development. Land-use changes over decades. Social vulnerability analysis utilized census data at the block level to identify areas containing populations likely to have difficulty preparing for and responding to environmental hazards and disasters, can also be undertaken with this website. A full discuss of this type of analysis is presented in the detailed report on social vulnerability and the Coastal Atlas that was part of the deliverables in Phase 3. These data have also been analytically combined so that one may examine areas with particular types of needs (child care, elder care, public transportation, housing recovery, and overall social vulnerability hotspots) at the municipality or county level. Finally there are basic economic analyses, based on Location Quotient Analysis, included at the county level as well. Again, these data are now available on the main atlas webpage for all areas on the coast.

24
Table 2. Data still Available on the Hotspot Website for the Northeastern Texas Coast.
Political & Administrative Boundaries
274. 2000 Census Count 275. 2000 Census Tracts 276. 2000 Census Block Groups 277. 2000 Blocks 278. Focus Texas Counties 279. Non-Coastal Counties 280. City Limits 281. Building Codes
Transportation 282. Interstate Highway 283. Major Highway 284. Hazardous Cargo Routes 285. Hurricane Evacuation Routes
Demographic Data (Census 2000) 286. County 287. Census Tracts 288. Census Block Groups 289. Census Blocks
Natural Hazards: Hurricane Surge Zones 290. Category 1 Surge Zone 291. Category 2 Surge Zone 292. Category 3 Surge Zone 293. Category 4 Surge Zone 294. Category 5 Surge Zone
Natural Hazards: Hurricane Risk Zones 295. Risk Zone A 296. Risk Zone B 297. Risk Zone C
Natural Hazards: Hurricane Tracks 298. Hurricane Tracks (1851-2005)
Natural Hazards: Flooding 299. FEMA Flood plains
Ecosystem Critically Measures (ECM) 300. ECM County 301. ECM Census Tract 302. ECM Block Group 303. ECM Block
Social Vulnerability Assessment: Base Characteristics 304. Population < 5 years 305. Single Parent Households with Children 306. Population Age > 65 years 307. Population Age > 65 years below Poverty
Line 308. Workers using Public Transportation
309. Households without Vehicle 310. Occupied Housing Units 311. Renters 312. Race (non-White) 313. Persons in Group Quarters 314. Housing Units > 20 years 315. Mobile Homes 316. Persons in Poverty 317. Occupied Housing Units without phone 318. Education less than HS for Age > 25 years 319. Unemployed (Age > 16 years) 320. Population speaking English not well/not at
all (Age>5years) Social Vulnerability Assessment: Indexes (Block Groups regional comparisons)
321. Child Care Needs 322. Elderly Care Needs 323. Transportation Needs 324. Recovery Needs 325. Capacity Building Needs 326. Raw total Social Vulnerability Index (SVI) 327. Weighted SVI
Social Vulnerability Assessment: Block Group County Comparison using SVI
328. Orange County 329. Newton County 330. Liberty County 331. Jefferson County 332. Jasper County 333. Harris County 334. Hardin County 335. Galveston County 336. Fort Bend County 337. Chambers County 338. Brazoria County 339. Construction 340. Others
Location Quotient Analysis 341. Natural Resources and Mining 342. Construction 343. Other
Land Cover Data 344. Land Use 1996 345. Land Use 2001 346. Land Use 2005
Figure 10 displays a map of areas (census block groups) in and around Corpus Christi that contain concentrations of socially vulnerable households when it comes to transportation needs. Specifically as areas shift from yellow to dark red, they contain higher proportions of households without vehicles and with workers that are more likely to depend on some form of public transportation to get back and forth from work. In other words, these are areas with high concentrations of households without easy access to transportation. These areas can therefore be expected to have individuals and households that will find it much more difficult to evacuate for hurricanes. Hence they are vulnerable because of their social characteristics.

25
Figure 10. Transportation Dependent Areas in and around Corpus Christi, TX.
Figure 11. The same area in Corpus Christi with Category 3 Surge
What can make the Atlas so valuable for planning is the ability to compare areas with high social vulnerability AND physical vulnerability. Figure 11 displays the same

26
populations with high transportation dependence and areas subject to surge from category 3 hurricanes. Likely areas to be subject to hurricane storm surge are mapped in a light blue overlay. As can be seen there are many areas with high concentrations of households without easy access to transportation that are also subject to surge risk given a category 3 storm. These are areas that will need to be targeted for evacuation and preparation assistance. While the new main atlas website essentially contains almost all of the data layers that were available on the vulnerability hotspot website, that website will be maintained until all data have been transferred. Table 2 provides a listing of all the data that are available on the hotspot website. The Galveston Atlas and associated runoff and pollution tool websites have been upgraded so that they are much more stable. The following provides a brief discussion of this website and the runoff tool.
Table 3. Data Available on the Galveston Atlas Website.
Administrative Districts Boundaries
1. County 2. City 3. Water Control and Improvement
Districts (WCIDs) 4. Municipal Utility Districts (MUDs) 5. Independent School Districts
(ISDs) 6. Drainage Districts 7. Emergency (police, fire, EMS)
Service Networks (ESNs) 8. College Boundaries 9. Navigational Districts
Census 2000 Data 10. Census Tracts 11. Census Block Groups 12. Census Blocks
Development 13. Streets 14. Railroads 15. Landmarks
Physical Risks: Hurricane Surge Zones 16. Category 1 Surge Zone 17. Category 2 Surge Zone 18. Category 3 Surge Zone 19. Category 4 Surge Zone 20. Category 5 Surge Zone
Physical Risks: Wetland Loss (2000-2004) 21. Freshwater Natural Wetland Loss 22. Freshwater human Modified
Wetland Physical Risks: Others Natural Hazards
23. Hurricane Risk Zones (A, B, & C) 24. Flood Risk Zones (FEMA-Q3)
25. Flood – 1994 26. Tropical Storm Tracks 27. Subsidence Risk Zones 28. Coastal Shoreline Types (ESI) 29. Tornado Events (F3-F5) 1950-2003 30. Hazardous Waste Sites 2004 31. Flood Events 1993-2003 32. Drought Events 1994-2003 33. Coastal Erosion Rates (Ft per year)
Parcel Data 34. Parcels 2008 35. Lot Lines 2008
Background Data 36. Water 37. County detailed Outline
Hurricane Ike 38. Damage Pictures

The Galveston Atlas provides very detailed data on Galveston proper that allows users to undertake analyses at a much finer resolution. The Galveston Atlas provides users with 38 different data layers. The foundation of these layers is the parcel data for Galveston County which providing data on each individual property parcel for the entire county. In addition to the parcel data, some of the other data layers include layers for Water Control and Improvement Districts (WCIDs), Municipal Utility Districts (MUDs), Independent School districts and Emergency Service Networks. A complete listing of the data layers can be found in Table 3 (above). Figure 12 displays the main website for the Galveston Atlas that is reached by clicking the hotlink in the Atlas Options webpage (see Figure 5).
Figure 12. Galveston Atlas Portal
Figures 13 and 14 offer but two examples of the types of maps and analysis that can be undertaken with data layers available at Galveston Atlas website. Figure 13 displays the property parcel level data for a section of the City of Galveston near the port area, just across from Pelican Island which is just barely indicated by the sliver of green just north of the port waterway, and extending south toward the Strand area near the sea wall. The northern area near the seaport was the area that received the most extensive flooding from the surge that accompanied Hurricane Ike. Overlaid on the parcels are the surge zones for Category 1 and Category 2 hurricanes. While one must be cautious about interpreting the precise boundaries of the surge risk areas, since they are only

2
2
approximate and not designed for this fine of a resolution, one can clearly get an indication of the areas of Galveston City proper that are more subject to surge damage than others. The much narrower band of surge areas to the south reflect the protection of the sea-wall and the fact that the elevation of the island increases markedly as one moves toward the sea-wall due to the filling of this area following the great Hurricane of 1900.
Figure 13. Cat 1 & 2 Surge Zones Over Galveston City Parcel Data

3
3
Figure 14. Cat 2 Surge Zones over Galveston Parcel Data on the Island’s West End
Figure 14 provides yet another example of the functionality of the Galveston Atlas website. Here parcel data from the west end of the island, near the community of Jamaica Beach, have a category 2 storm surge layer active. This representation clearly shows that all properties in this are subject to major surge flooding under normal category two event. Furthermore, this example indicates how a user can obtain specific information regarding a given parcel and also obtain a visual representation of the location being mapped. Here, instead of using Google Map, a Virtual Earth tool is employed. These examples, make it clear how these finer resolution data can more clearly help planners, emergency managers, and, perhaps most importantly, the public understand how potentially vulnerable they are coastal hazards. A final component of the Coastal Atlas is a “what if” scenario tools for Galveston County that enables a user to project the consequences of development for storm water runoff. This is the most interactive and predictive component of the Atlas system because a user can change existing land use at the parcel level based on a development scenario and then receive a graphical and statistical output of the impacts at the landscape level. To reach this tool, the user simply clicks on the “Run-off Model” hotlink on the main atlas link webpage (see Figure 5). After clicking the hotlink the Run-off Model webpage (http://coastalatlas.tamu.edu/imf/imf.jsp?site=galveston_runoff) can be reached. This webpage is show in Figure 15.

4
4
Figure 15. Run-Off Model website.
Under the storm water runoff model, the system calculates percentage change in acre-feet of surface runoff within a Census Tract. For example, using the yellow toolbox, a user can select multiple parcels for which the Atlas will calculate storm water runoff and potential flooding based on existing land use within the chosen zone. A user can then change the percentages of land use based on a hypothesized development scheme (e.g. 80% urban open to 80% single-family residential) to estimate the change in surface runoff within the zone (Census Tract).

5
5
Figure 16. Selected parcels
Figure 17. Calculated runoff within Census Tract Zone
An illustration of a runoff scenario is given in Figures 16 through 18. Figure 16 shows 166 parcels in Galveston County selected for analysis (outlined in yellow). The system then calculates runoff in acre-feet based on existing land use for the selected parcels within the designated zone, which in this case is a Census Tract, as shown in Figure 17. Figure 18 illustrates the changes a user could make under the proposed scenario column (outlined in red) in the land use table. In this case, the 84% Urban Open land use is largely re-distributed to commercial, residential (high and low density), and multi-family

6
6
categories. Finally, the bar chart in Figure 18 shows the consequences of the proposed development in terms of surface water runoff. The red bars represent the existing land use scenario and the yellow bars indicate the proposed development. In this case, the proposal would generate an estimated 129% increase in total runoff, which could exacerbate area-wide flooding.
Figure 18: Changed percentage of land use within zone and predicted runoff for future compared with existing development scenario.
Over the last year the activities associated with Tasks 3 and 4 have produced an ever improving, more stable multifunctional website that offers coastal planners, emergency managers, stakeholder and the public access four different Atlas websites. In many respects this year was also a transition year as we move to consolidate the multiple websites maintained under the coastal atlas rubric, into one or two. The main coastal atlas website, which is housed principally in the TAMU-Galveston servers, now contains nearly 300 data layers for all coastal counties in Texas. Vulnerability hotspot analysis that was once only available for counties along the northeastern coast is now possible for all coastal areas in Texas. The Hotspot website will b maintained until all data are transferred to the main website. Furthermore the Galveston Atlas contains nearly 40 data layers with the foundational layer being all property parcel data for the entire county, and finally the run-off and pollution tools allows users to assess “what-if” scenarios to examine the consequences of changing development patterns in Galveston county. Each of these websites provides a fully functional web-based GIS environment that can be used to facilitate planning activities with respect to a coastal hazards, ecosystem characteristics, and physical and social vulnerability analysis.
A
B

7
7
Task 5 – Phase 4: Survey of planners and managers in local Jurisdictions. Task Description: Assess the perception and adoption of hazard mitigation policies and actions by the planners and managers in local jurisdictions. Much like the problems with the lack of firm information related to hazard mitigation and broader land use planning policies, almost nothing is known about the awareness, perception, and adoption of mitigation strategies by members of the planning and management community in local jurisdictions. While the elite survey completed in Phase 2 will provide detailed information related to hazard mitigation planning in Texas, all planning is ultimately a local phenomena. Hence, there is a need to conduct systematic random samples of planners and managers in specific local jurisdictions in order to truly understand the nature of mitigation planning in coastal areas. The purpose of this task will be to collect systematic data on planning activities by jurisdictions in coastal Texas. Deliverable(s): Final report of survey of planners and managers in local Jurisdictions. (SEE APPENDIX 1). Rather than restate what is already written up in a report that appears in Appendix 1, suffice it to say that a survey of 124 coastal jurisdictions (both municipalities and counties) in which planners, city managers, county judges were targeted as jurisdictional informants was undertaken. The report in Appendix 1 provides a detail discussion of the survey, its goals and methods, along with a detailed discussion of the findings. Task 6 – Phase 4: Coastal Atlas outreach Task Description: In a continuing effort to promote the usage of the coastal atlas website developed and its various components, task 6 of this project will continue to utilize and create opportunities to introduce the website to the public and develop specific learning modules to facilitate usage of the resources being develop. Specifically this task will focus on utilizing opportunities to do presentations on the coastal planning atlas in various venues that would provide information about the atlas and how it can be utilized to enhance local mitigation planning. These activities will target state and local stakeholders. One of the important features of the atlas is that it can serve as an educational tool to promote awareness of coastal hazards, the vulnerabilities of local communities, and promote awareness of the need for mitigation. To facilitate the potential utility of the atlas and its data, learning modules utilizing coastal atlas data will be created for classes at the university level and work with teachers at the K-12 level to include Atlas activities in their classes.

8
8
The Coastal Atlas has been presented and training exercises have been undertaken in a number of venues and locations. The following provides a partial listing of these activities with information on who did the presentation or training along with some indication of the number of participants. Presentations: The following provides a listing of the presentations that employed or discussed the Atlas.
1. Sept. 23, 2010. Making Maps with a Coastal Atlas. Cline Elementary, Friendswood, TX, ISD. (Brody). [n = 22]
2. October 1, 2010: Coastal Community Hazards, , Mrs. Louder’s 4th Grade Homeroom Class, Forest Ridge Elementary School, College Station, 22 students. We talked about map-making, characteristics of coastal communities, and physical vulnerability. (Van Zandt). [n=22]
3. Oct. 7, 2010. Legacy Data Sets and Ambiguous Boundaries. Presentation to Planning 625 Class (Wunneburger)[n=36]
4. October 19, 2010: Hazard Mitigation, Disaster Reduction, and Land Development. Presentation to Jeoffery Booth’s MSLD 667 (Land Development Process) & URSC 330 (Introduction to Land Development). Discussed how to use the Atlas to undertake a hazard identification analysis. (Peacock) [n=45]
5. November 17, 2010. Atlas was presented as part of GIS DAY, at Texas A&M University. Computers were set up and students were able to get onto and work with the Atlas. Project students were there to help. [n=55]
6. January 6, 2011. The Coastal Planning Atlas was a foundation for research presented at a National Science Foundation CMMI meeting in Atlanta, Georgia, on the need for long-term monitoring of vulnerability and resiliency in Coastal areas. [n=50-60]
7. March 8, 2011. The Coastal Planning Atlas was discussed and elements presented at an Advancing Coastal Resilience, Indicators of Well-Being Workshop, at NOAA’s Hollings Marine Lab, Charleston, SC, Sam Brody. [n = 15]
8. March 11, 2011. The Coastal Planning Atlas was discussed and elements presented at the Roundtable on Housing Recovery after Disaster held at the Urban Affairs Association Annual Conference, New Orleans, LA. Presenters include S. Van Zandt and W. G. Peacock. [n=30].
9. March 14, 2011. The Texas Coastal Atlas featured in a article that appeared in Galveston County’s The Daily News. The article was entitled, Isaacs Storm, Brody’s Atlas germane to Galveston, and was written by Tom Linton. (http://galvestondailynews.com/story/217838/).
10. April 7, 2011. “Developing a coastal communities planning atlas for decision makers and local residents.” Presentation to the 21st annual SAIL Conference: Into the "I" of the Storm.. Samuel Brody. [n = 65]

9
9
11. April 28, 2011. The Coastal Planning Atlas was employed in a talk entitled, Landscapes of Inequality at the North Carolina Fair Housing Conference, Raleigh, NC. Presenter S. Van Zandt. [n=30].
12. May 27, 2011, Introduction to the concepts of coastal resiliency. 2011 Coastal Resiliency Workshop. At Texas A&M University – Galveston. S. Brody. [n = 50]
13. June 29, 2011. The coastal atlas was presented in a presentation entitled, Coastal Flooding and Resiliency: Building Safer Communities, at University of Houston-Clear Lake, Clearlake, TX. Presentation Dr. S Brody [n = 25]
Training Activities: The following provides a listing of the various training activities in which the Atlas was employed
1. September 1, 2010: Coastal Community Planning Atlas as a Tool for Emergency Management. 4th Annual EMAT Symposium: Lighting the way to the future. League City, TX. (Brody) TRAINING[n = 10]
2. September 1 – December, 15, 2010. The Coastal Planning Atlas was employed in PLAN 641 – Environmental Planning – by S. Brody. [n = 15]
3. September 1 – December 15, 2010. The Coastal Community Planning Atlas was employed in PLAN 625 – Introduction to GIS, classes in the Masters of Urban Planning Graduate program. (Wunneburger) TRAINING [n=38].
4. September 1 – December 15, 2010. The Coastal Community Planning Atlas was employed in URSC 325 – Undergraduate Introduction to GIS, classes in the BS in Urban and Regional Science Undergraduate program. (Wunneburger) TRAINING [n=24].
5. January – May 2011 (Spring Semester). The Coastal Planning Atlas was used extensively in PLAN 613 – Planning Methods II – in the Masters of Urban Planning program at Texas A&M College Station. For example, the Atlas was employed to conduct land suitability analyses and a resiliency exercise. Course instructor was S. Van Zandt. TRAINING. [n= 27].
6. January – May 2011 (Spring Semester). The atlas was also employed extensively for training purposes in PLAN 626 -- Advanced GIS-- at Texas A&M University – College Station. Instructor, D. Wunneburger. It was used both as a data source and as an example of an enterprise application of GIS databases. Instructor, D. Wunneburger. [n = 7]
7. January – May 2011. The Coastal Planning Atlas was extensively used in LDEV 671 -- Sustainable Land Development, & MARS 689 -- Coastal Sustainability and Resiliency, at Texas A&M College Station and Galveston. TRAINING [n=15].
Publications: The following provides a listing of the publications that have employed the atlas or present it as an example of a tool that can be used in hazard or mitigation planning.

10
10
1. Van Zandt, Shannon, Walter Gillis Peacock, Dustin Henry, Himanshu Grover, Wesley Highfield, and Sam Brody. Forthcoming. Mapping Social Vulnerability to Enhance Housing and Neighborhood Resilience. Housing Policy Debate.
2. Walter Gillis Peacock, Shannon Van Zandt, Dustin Henry, Himanshu Grover and Wesley Highfield. Forthcoming. Social Vulnerability and Hurricane Ike: Using Social Vulnerability Mapping to Enhance Coastal Community Resiliency in Texas. Chapter 7 in Sever Storm Prediction, Impact, and Recovery on the Texas Gulf Coast. Edited by Phillip B. Bedient. College Station, Texas: Texas A&M Press.

11
11
The Adoption and Implementation of Hazard Mitigation Policies and Strategies by
Coastal Jurisdictions in Texas: The Planning Survey Results
Walter Gillis Peacock and Rahmawati Husein
A Report Prepared for the Texas General Land Office
and The National Oceanic and Atmospheric Administration
Under GLO Contract No. 10-059-000-3758
This investigation was funded by a grant from the National Oceanic and Atmospheric Administration administered by the Texas General Land Office. The views expressed
herein are those of the authors and do not necessarily reflect the views of NOAA or any of its sub-agencies.
Hazard Reduction and Recovery Center
College of Architecture Texas A&M University
TAMU 3731 College Station, Texas 77843
November 28, 2011

12
12
The Adoption and Implementation of Hazard Mitigation Policies and Strategies by
Coastal Jurisdictions in Texas: The Planning Survey Results
Walter Gillis Peacock and Rahmawati Husein 1.0. Introduction
Over recent decades coastal areas around the world and in the US have experienced natural hazards such as tsunamis, hurricanes, tropical storms, and other coastal hazards that caused the loss of human life as well as immense economic losses. The tsunami that hit Asia in 2004, for example, killed more than 200,000 people (Lay et al., 2005) and the recent earthquake followed by a tsunami that hit Japan on March 11, 2011 killed 15,839 and has cost estimates up to $235 billion in damages, making it the most expensive natural disaster on record (Accuweather, 2011; World Bank, 2011). From 1970 to 2009, 7 of the 10 most costly disasters, in terms of insured losses, in the world were coastal disasters, specifically hurricanes that struck the United States (Sigma, 2011). These storms include, in order of losses: Katrina (2005), Andrew (1992), Ike (2008), Ivan (2004), Wilma (2005), Rita (2005), and Charley (2004) and together they totaled 2,232 killed and over 164 billion dollars insured losses (Sigma 2011).
This escalating loss and vulnerability in coastal areas is partly due to the increasing concentrations of population and infrastructure with high exposure to natural hazard (NOAA, 2004). Studies have shown that the rise in human habitation and structural development along coastlines contributed to the destruction of coastal resources such as wetlands and coastal forests that can lessen damage to property and reduce loss of life (Forbes and Broadhead, 2007; Williams & Micallef, 2009).
In the US, 53% of the nation’s total population currently lives in coastal counties and the coastal population has grown by more than 33 million since 1980. It is expected to reach 165 million by 2015 (Wood & Poole and NOAA, 2010). National Oceanic and Atmospheric Administration (NOAA) also reported that more than 60 percent of homes and buildings within 500 feet of the shoreline are located along the Atlantic and Gulf coasts, the nation’s fastest growing areas (The National Academies, 2011). As a state that has one of the longest coastal areas, Texas is not exempt from the trend. The recent census shows that the Texas coastal population has grown 21% since the last census (US Census, 2011). The census also indicates that the Texas coast is one of the fastest growing coastal regions in the country. It is home to one of the ten largest US metropolitan areas to be located in a coastal zone – the greater Houston area (Peacock, 2008; Wilson, 2009), where the population of the Houston-Baytown-Sugarland metropolitan area increased 21.5% from 2000-2008 (State of Texas Hazard Mitigation Plan (THMP), 2010).
The increasing population in coastal areas intensifies people’s hazard vulnerability and adds to a risk of property loss. Throughout history, Texas has been one of the states that experiences great damage due to multiple hazards in the coastal region.

13
13
The Texas coast not only suffers from recurring hazards such as hurricanes, wind storms, and flooding, but also from hazards such as subsidence, sea level rise, and coastal erosion. According to NOAA, since 1950, 26 hurricanes and 32 tropical storms have passed within 65 nautical miles of Texas coastal lines (Wilson, 2009). For hurricane Ike only, which was one of the costliest and most destructive hurricanes in U.S. history, the total damage is estimated to be $29.5 billion, making it the fourth costliest hurricane behind Katrina (Blake, 2011). In addition to hurricane and tropical storm exposure, the Texas coast has experienced the highest coastal erosion in the nation, where approximately 64% of the Gulf shoreline is considered a critical erosion area with 235 acres of shoreline lost to erosion annually (THMP, 2010). Such erosion affects property and the natural environment.
These escalating losses and increasing vulnerability in the coastal region should influence local governments to adopt policies that can reduce the risk and increase the calls for mitigation as part of the solution (Peacock, 2009). Regardless of what jurisdictions should be doing, there has been a clear movement toward more mitigation planning. The trends toward mitigation planning have been driven by the Federal Emergency Management Agency (FEMA), which launched the Disaster Mitigation Act (DMA) in 2000. The aim of this act is to reduce the loss of life and property, economic disruption, human suffering, and disaster-assistance costs from natural hazards (FEMA, 2011). This Federal legislation requires state, local, and Indian tribal governments to develop hazard mitigation plans in order to receive post-disaster assistance. So far, over 10,000 local jurisdictions have participated in local mitigation plans, where 1,696 out of the 3,141 counties in the nation took part in the planning process (FEMA, 2011). Texas has also participated in creating local hazard mitigation plans. Since the end of 2003, there have been 16 city plans, 33 county plans (which cover cities and unincorporated areas), 10 regional plans (which cover counties, cities, and unincorporated areas), and 9 other plans, including schools and hospitals, which received FEMA-approval (TDEM, 2011).
The increasing numbers of local jurisdictions that have participated in local hazard mitigation planning activities has not guaranteed the implementation of mitigation strategies at the local level. For example, a study of Local Mitigation Strategy (LMS) in Florida, a pilot program for planning requirements and planning mandates in response to the DMA of 2000, found that local mitigation plans are not actually a step toward creating mitigation actions, but rather are a bureaucratic step in the mitigation grant funding process (Rovin, 2009). The author also mentions that the LMS “did not reduce disaster loss and negate the goal of mitigation” (Rovin, 2009, p. 19). One of the possible reasons that local mitigation plans do not work successfully is that in many cases, local mitigation plans are not incorporated into or sufficiently linked to, city or county comprehensive plans, master plans, and/or other land use plans. In other words, these plans end up being free standing plans and have little bearing on, among other things, modifying land use policy to bring about reduce vulnerabilities. This disconnection may result in a weakening of the potential of a plan’s effectiveness (Burby, 1998). In addition, local hazard mitigation plans are often under the direction of

14
14
and undertaken by local emergency managers without involvement of planning departments. Schwab (2010) notes from Boswell studies that 50% of Local Hazard Mitigation Plans (LHMP) was prepared by emergency managers, 29% by consultants, and 21% by both emergency managers and consultants. Theses hazard-planning process may not include planners in formulating the local hazard mitigation plan and often lack an understanding of land use and development regulations and their potential importance for mitigation. In other words, while local hazard mitigation plans may offer potential “actions” to be undertaken should mitigation funding become available, these plans often fail to inform local land use planning strategies and efforts at the jurisdictional level that might be better accomplished with proper integration of hazard mitigation plans into community comprehensive planning efforts.
Thus far, several studies have shown that land use tools and development regulations can be effectively used for hazard mitigation, particularly if they are backed by state planning mandates (Berke & French, 1994; Berke & Roenigk, 1996; Burby & Dalton, 1994; Burby & May, 1997; Godschalk et al., 1999). However, most of these studies have focused on the quality of plans and whether stand-alone mitigation plans or elements of comprehensive plans address mitigation issues. It was relatively rare to find research that actually focused on the types of land use policies adopted and implemented by local jurisdictions. Furthermore, many of these studies focused on hazard mitigation with respect to a single hazard such as flooding (Brody et al., 2010), tsunamis (Tang et al., 2011), and hurricanes (Wilson, 2010). Very few studies look at multiple hazards in coastal areas. Lastly, extant studies have mostly focused on state and/or county government actions with respect to hazard mitigation polices and planning. Specifically, they are often limited in the nature of the jurisdictions considered, focusing on state and county levels, but neglecting policies and planning at the municipality level. In many states like Texas however, the state and county have only limited possibilities for engaging on land use planning activities and policies, while municipalities have more authority in regulating land use and controlling development.
These neglected areas in the research lead to questions about the actual prevalence with which local jurisdictions employ hazard mitigation strategies and tools that may have the capability to enhance hazard mitigation in coastal areas. In other words, there are a host of broad-based hazard mitigation policies ranging from education programs through newer incentive based zoning policies and ordinances that can be used to address hazard mitigation, and yet little is known about the prevalence of these tools and extent to which they are employed. This research seeks to address these shortcomings by looking into current coastal hazard mitigation practices of coastal jurisdictions in Texas. 1.1. Specific research objectives
The overall objective of this study is to empirically investigate policy practices at the local level. The study specifically seeks to examine the adoption and the usage regulations, policies and strategies that can enhance hazard mitigation among local jurisdictions (counties and municipalities) in the Texas coast

15
15
1.2. Structure of this report In addition to this introductory section, this report is organized into four
additional sections. The following section provides a literature review, which presents a background of existing literature and research findings. In particular it reviews the literature about hazard mitigation with the goal of highlighting non-structural, often termed land use approaches and provides a classification of 12 different hazard mitigation policies and strategies that can be employed by local jurisdictions seeking to mitigation against natural disaster impacts. This classification provided the guidance for what types of information was gathered from key planning informants in the surveyed jurisdictions. Section 3 presents the sampling and research methodology employed to gather the data that are utilized in this report. Section 4 describes in detail the hazard mitigation policies and practices of local jurisdictions in Texas coastal areas and a descriptive analysis of the survey findings. And, finally, Section 5 will provide an analysis and comparison between jurisdictions in and out of the Texas Coastal Management Zone.
2.0 Hazard mitigation: approaches and strategies The following discussion provides a discussion of the concept mitigation, with
respect to natural hazards and will move on to provide a background on the various types and approaches to hazard migration. The critical focus of this section however is a discussion of the type of non-structural hazard mitigation policies and strategies have been proposed and adopted by local jurisdictions – the focus of this report.
2.1 Hazard mitigation policies and strategies in the coastal areas As with so many concepts, hazard mitigation has been defined in a variety of
ways in the literature. The term of mitigation mostly reflects protection, reducing or eliminating impacts, and action before the event. Table 2.2 displays a variety of different definitions for the concept and as a consequence, also illustrates that the definitions of hazard mitigation are considerably diverse, reflecting the complex nature of the ideas many associate with the concept. Some consider mitigation to include activities for emergency preparedness and response and recovery planning such as preparing personnel, plans, facilities, equipment, and materials needed during the event and after the event (FEMA, 2009; Godschalk et al., 1999). Others focus on long-term action or activities that are passively in place prior to an event (Lindell et al., 2006). This latter approach is rather distinctive and yet has the strong advantage of clearly differentiating mitigation from other phases in the disaster cycle - a distinction often lacking in other approaches.

16
16
Table 2.2 Selected definitions of hazard mitigation published in the hazard and
environmental literature Researchers/ Institution Definitions of hazard mitigation
FEMA (2009) Hazard mitigation is sustained action taken to reduce or eliminate long-term risk to people and their property from hazards.
Lindell, Prater and Perry (2006)
Mitigation is pre-impact actions that provide passive protection at the time of disaster impact. It distinguishes hazard mitigation from emergency preparedness, which consists of pre-impact actions that provide the resources (personnel, plans, facilities, equipment, materials) needed to support an active response at the time of disaster impact.
Godschalk, Beatley, Berke, Brower and
Kaiser (1999)
Hazard mitigation is advance action taken to reduce or eliminate risk to human life and property from natural hazards in the long run.
William and Micalef (2009)
Cost-effective measures taken to reduce potential for damage to a community from hazard impacts.
Moga (2002) Mitigation planning or disaster reduction is the development of a strategy for reducing the impact of disasters on a community, facility, agency, city or country.
UNISDR (2002) Hazard mitigation is structural and non-structural measures undertaken to limit the adverse impact of natural hazards, environmental degradation and technological hazards.
Scwab, Eschelbach, Brower (2007)
Mitigation is defined as activities that prevent a disaster, reduce the chance of a disaster happening, or lessen the damage effect of unavoidable disasters and emergencies.
Despite these variations there is a good deal in common among these definitions.
Common aspects include the ideas that mitigation actions are mostly focused on activities prior to the hazard or disaster event, these actions (or more precisely their results/products) are passively in place prior to an event and its consequences, and mitigation’s primary goal is to reduce adverse impacts. It is understood that most of these hazards are impossible to predict, experts have estimated probabilities for different types of events, and much of the impact can be prevented or substantially reduced by undertaking activities prior to hazard events (Godschalk et al., 1999). In addition, others believe that hazards can be prevented and their impacts can be reduced based on how we design or plan our communities (Mileti, 1999; Peacock et al.,2009) in order to reach the goal of mitigation of giving “passive protection” at the time of disaster impact (Lindell et al., 2006).
Mitigation strategies have commonly been classified into structural and non-structural mitigation (Godschalk et al., 1999; Lindell et al., 2006). Structural mitigation involves the use of engineered safety features to provide protection from disaster

17
17
impacts (Lindell et al., 2006, p. 194). The most common examples of structural mitigation include levees, dams, seawalls, dykes, and riprap (Godschalk et al., 1999; Klee1999; Lindell et al., 2006), and also “building designs and constructions materials to increase the ability of an individual structure’s foundation and load bearing framework to resist environmental extremes” (Lindell et al., 2006, p. 194).
Non-structural mitigation involves a broad set of mitigation strategies that include regulating development in environmentally sensitive areas, installing window shutters for buildings located on hurricane-prone coastlines, and educating the public to reduce any impact of hazards (Burby, 1998; Godschalk et al., 1999; Lindell et al., 2006). Table 2.3 shows a broad list of strategies for both structural and non-structural categories of hazard mitigation for coastal areas.
Table 2.3. Structural and non-structural hazard mitigation strategies for coastal areas Structural Non-structural
Concept - Control over hazard - Protection of human settlement
- Hazard mitigation/ avoidance - Adjustment of human activities
Measures
- Sea walls, levees, structure of dams, break water, flood storage reservoirs, dikes, pumps, channel improvements and diversions, and groins
- Strengthening buildings through building codes
- Building shelters
- Land use management by planning tools (comprehensive plan, zoning, ordinance, incentives)
- Infrastructure policy - Insurance - Awareness (education, information
dissemination) and partnership - Protect natural areas (dunes,
wetland, maritime forests, vegetation etc.)
- Risk reduction and preparedness policies
Sources: adapted from Burby & French (1981); Alexander (1993); Moga (2002); William &Micalef (2009)
However, it should also be noted that many in the literature have pointed out that structural strategies that involve modifications of the natural and physical environment may cause physical damage and degradation of the natural environment. Examples of these problematic outcomes include the destruction of wetlands despite the mitigation services they can provide in coastal regions as well as increasing the likelihood of human-made disasters resulting from the failure of damns and levees (Klee, 1999) and discouraging the protection of natural resources (Dalton & Burby, 1994). In the case of Hurricane Katrina, large areas of the city of New Orleans were destroyed because of the failures and breaches of the levees and floodwalls protecting the city due to poor maintenance and design failure (Daniels et al., 2006). In addition, structural mitigations are very expensive and require enormous ongoing costs for their maintenance (Alexander, 1993; Burby, 1998), and failure to maintain them can lead to great losses. Furthermore, structural approaches may provide a false sense of security to the public

18
18
(Dalton & Burby, 1994; White, 1936). The belief that coastal areas are protected and made safe by seawalls, levees, dykes, and others structural works can encourage new development in the hazardous or environmentally sensitive areas (Burby et al., 1985).
On the other hand, non-structural approaches have been seen by many in the
literature as offering a more comprehensive approach that results in fewer negative effects, at least with respect to promoting appropriate development in risky areas and with respect to the natural environment. Non-structural approaches are also relatively less costly and provide more sustainable tools to hazard mitigation at the local level. They offer a more obvious way to avoid many natural catastrophes (Hyndman & Hyndman, 2006) and provide important tools for reducing losses to natural disasters (Burby et al., 2000). Numerous research studies on hazard mitigation using non-structural strategies in the US as well as in other countries have been conducted (Berke et al., 1999; Burby et al., 1985; Burby, et al., 1999; Godschalk, Brower, & Beatley, 1989; Henstra & McBean, 2004). Conceptually, this strategy focuses on adjusting human activities, particularly developmental activities, by encouraging development out of harm’s way, appropriate development that explicitly addresses the natural hazard exposure, risks associated with an area, and the preservation of environmental resources, particularly those in sensitive areas, and thereby enhancing the natural environmental services that can reduce natural hazard impact.
2.2 Non-structural Mitigation strategies
While the distinctions between structural and non-structural hazard mitigation
strategies presented in Table 2.3 offers some clarification of the types of policies and land use strategies generally considered non-structural, it fails to provide a full discussion of the types that will be considered in this research report. The literature offers a host of ways to classify non-structural strategies (Daniel and Daniel 2002; Lindell, Perry and Prater 2007; Beatly 2003; Godshack et al 1999). Table 2.4 provides a classification of various types of strategies, along with their goals and detailed examples of the strategy tools that fall under these categories based on the literature.4 In total 11 strategies are identified including: 1) development regulations and land use management tools, 2) limiting shoreline development, 3) building standards, 4) natural resource protection, 5) public information and awareness tools, 6) local incentive tools, 7) federal incentive programs, 8) property acquisition tools, 9) financial tools, 10) public and private facilities policies, 11) private-public sector initiatives, and 12) use of professionals.
4 In some sense, the exact placement of a particular tool, such hazard setbacks, is arbitrary, in that policies are often related and tools can be employed in a variety ways. Hence, the focus of this table is not to definitively categorize tools, but rather provide a convenient method for identifying different strategies and tools.

19
19
Table 2.4. Land use and development regulations for hazard mitigation in coastal areas
Strategy Goals Tools
Development regulation and land use management
- Restrict occupancy in hazardous zones (location)
- Density regulation - Discourage
development in environmentally sensitive/hazardous areas
- Residential subdivision ordinance
- Planned unit development - Special overlay districts - Agricultural or open space
zoning - Performance based zoning - Hazard setback ordinance - Storm water retention
requirements Limiting shoreline development
- Limit use of shoreline - Restrict activities in
environmentally sensitive/hazardous
areas
- Limitation of shoreline development to water-dependent uses
- Restrictions on shoreline armoring
- Restrictions on dredging/filling Building standards - Design regulation (type
and category) that reduce loss and damage
- Building codes - Wind hazard resistance
standards - Flood hazard resistance for new
homes - Retrofit for existing buildings - Special utility codes
Natural resource protection
- Preserve ecologically sensitive coastal areas
- Dune protection - Wetland protection - Coastal vegetation protection - Habitat protection/restoration - Protected areas
Public information and awareness
- Disseminate information and advise individuals, groups, as well the community in general about hazards, hazardous areas, and mitigation techniques and goals
- Public education for hazard mitigation
- Citizen involvement in hazard mitigation planning
- Seminars or workshops on hazard mitigation practices for developers and builders
- Hazard disclosure - Hazard zone signs

20
20
Incentive tools
- Encourage land owners and developers to avoid development of environmentally sensitive and hazardous areas
- Transfer of development rights - Density bonuses - Clustered development
Federal incentive tools
- Encourage land owners to avoid development in hazardous areas
- Risk dispersion and risk reduction
- Participation in the National Flood Insurance Program (NFIP)
- Participation in the FEMA Community Rating System (CRS)
Property acquisition programs
- Acquire and hold property for public benefit and use
- Remove at-risk property from the private market
- Fees for simple purchases of undeveloped lands
- Acquisition of developments and easements
- Relocation of existing structures out of hazardous areas
Financial tools - Distribute more fairly
the public costs of private development
- Lower tax rates - Special tax assessments - Impact fees or special
assessments
Critical public and private facilities policies
- Direct the location of infrastructure away from hazardous areas
- Requirements for locating public facilities and infrastructure
- Requirements for locating critical private facilities and infrastructure
- Using municipal service areas to limit development
Private-public sector initiatives
- Work with other private entities to mitigate hazard impacts
- Land trusts - Public-private partnerships
Use of Professionals
Working with professionals can provide skill sets and technical expertise that many communities do not have on staff.
- Identify suitable building sites - Develop special building
techniques - Conduct windstorm/roof
inspection

21
21
Since these non-structural hazard mitigation techniques, programs and policies are the focus of survey and this report; the following offers a more complete discussion of these various strategies. 2.2.1. Development regulations and land use management
Development regulations and land use management are significant tools for hazard mitigation policies’ adoption in the coastal region. The concept of integrating hazard mitigation and development regulation and land use management at the local level has a long history. Gilbert White and other scholars (Burby et al., 1995; Burby, et al., 1999; Godschalk, et al., 1989) have argued that the loss of lives and property from a range of natural hazards could be minimized through land use planning. In addition, studies also show that land use and development-management mandates can positively impact mitigation by steering development away from hazard areas (Burby, 1998; Godschalk, et al., 1998; May 1993). Zoning and subdivision ordinances are basic and still are the most frequently used tools (Burby, 1998; Deyle at al., 1998), and are considered a traditional approach to planning (Olshansky & Kartez, 1998).
Many researchers agree that local governments can implement these strategies because they generally have the regulatory power to implement these tools that can direct development (Godschalk et al., 1998; Schwab et al., 2006). Local jurisdictions may use these regulatory tools to keep population and development away from high-risk locations and impose performance standards to reduce vulnerability in exposed areas. For instance, by requiring new development to be set back a minimum distance from high erosion shorelines structures are not only kept out of harms way, but natural environmental features like dunes and mangroves can be better preserved (Beatley, 2009, p. 30). In addition, Tang (2009) states that development regulations have been widely used in coastal zone management since they can provide the most direct approach of land use management aiming to protecting critical coastal environments and coastal disaster-vulnerable areas.
2.2.2. Limit development and activities on shoreline Structural approaches to mitigation such as armoring and dredging have been
used for a long time to reduce or eliminate erosion of natural shorelines and protect the built environment. However, these strategies can radically alter the characteristics of natural habitats and may influence and adversely impact the natural environment for some distance surrounding the structure. It can cause a) excessive erosion on neighboring unarmored properties; b) an increase water depth by transporting near-shore sediment to deeper water, producing “wave bashing” effects and turbulence; (c) a decrease in habitat complexity; and (d) an increase predator habitat such as bass and sculpin (Sargeant et al., 2004; The Watershed Company 2008). In addition, shoreline “water-dependent uses are threatened with displacement or have given way to more profitable non-water-dependent uses, such as residential, hotels, retail shops and restaurants” (Walker & Arnn, 1998).

22
22
Therefore, limiting development to preserve water-dependent uses and restricting activities on the shoreline may help encourage the natural preservation and restoration of the natural environment – such as dune and coastal vegetation- which can mitigate coastal hazards in a more sustainable way. Bernd-Cohen and Gordon’s (1999) study of Coastal Zone Management (CZM) programs shows that the use of regulatory tools along the shoreline can lessen shoreline change and reduce development pressures in order to protect the shoreline from hazards and minimize adverse impacts on resources. Examples of the types of actions local governments may implement to restrict extreme physical changes might include the limitation of shoreline development to water-dependent uses, restrictions on shoreline armoring, and restriction on dredging/filling.
2.2.3. Natural resource preservation and protection for coastal hazard mitigation The idea of preserving and protecting natural resources for coastal hazard
mitigation has been discussed by many scholars (Beatly et al 2002; Beatley 2009; Brody, Highfield, and Kang 2011; Daniels and Daniels 2003). The fact that coastal areas are subject to excessive growth not only results in the settlement of hazardous areas but also the destruction of local ecosystems, which could have provided protection from natural peril (Mileti, 1999). In addition, the lack of natural barriers such as wetlands, barrier islands, estuaries, water supply reservoir buffers, dunes, and forests has been linked to an increased risk of many types of hazards such as flooding, hurricanes, storm surges, and coastal erosion (Beatley, 2009; Bernd-Cohen and Gordon, 1999; Klee, 1999; William & Micalef, 2009).
Some researchers suggest mitigation strategies that maintain protective features of natural environments and focus on ecosystem management, such as the use of vegetation for reducing wave action, current energy, and erosion as well as trapping sediments that are urgently needed (William & Micalef, 2009). William and Micalef (2009) also suggest other examples including enhancing coral reefs, preserving and enhancing dune formation and sand bars, planting forests (porous barriers), preserving wetlands and mangroves, and hybrid strategies that are also relatively effective as mitigation tools. Meanwhile, Beatley (2009) suggests that coastal communities need to ensure sufficient wetland buffers and must permit coastal wetlands to migrate landward in response to long-term sea level rise. Many of these strategies have been instituted by the Coastal Zone Management Act (CZMA) of 1972 which requires that states designate “areas of particular concern,” and the 1980 amendments to CZMA encouraged “special area management planning.” This act and its amendments provide the legal foundation and funds for local governments in the coastal regions to improve policy and practices in improving the natural resources of the coastal areas and reducing any impact of natural hazards. Examples of the types of policies local governments might address include wetland protection, habitat protection and restoration and simply protecting and perhaps even expanding preservation areas (Daniels and Daniels 2002 and Beatly et al, 2002). 2.2.4. Building standards
Implementing building standards and codes that minimize the loss of and damage to buildings from natural hazards can be a crucial strategy for hazard mitigation in

23
23
coastal areas. These strategies are particularly needed because local governments often display little or no ability to limit development in high-hazard coastal regions. The inability to control development is a function of many factors such as the attachment of residents to their lands, land development rights, limited choices that can result in purchasing property in the environmentally sensitive areas that are the most affordable for people, and the simple fact that people build in coastal areas because of its attractiveness and recreational and economic opportunities. As Beatley (2009) notes, the complete avoidance of hazard areas is often not possible in many coastal areas.
The fact is that buildings and homes throughout the coastal areas are often subject to the high winds and surge associated with hurricanes and tropical storms (Beatley, 2009). Therefore, if the development itself can’t be stopped, then perhaps through building standard and code requirements are essential aspects of coastal hazard mitigation by reducing the likelihood of damage when the inevitable high winds and surge to impact coastal areas. Klee (2009, p. 106) states that “coastal hazards can be reduced through prudent design and construction of structures.” He further mentions that designs which allow the passage of wind and water around and under structures have been found to be the most effective at reducing damage. Building standards may include traditional building codes, flood proofing requirements, retrofit requirements for existing buildings (Olshansky & Kartez, 1998), and wind hazard resistance technology for new and existing homes (Beatley, 2009).
2.2.5. Information dissemination and awareness strategies Information dissemination strategies and hazard awareness programs are strongly
recognized as significant components of hazard mitigation planning. In some sense these types of programs reflect a commitment to engage with the community through increasing public participation in mitigation planning activities and through increasing awareness of natural hazards and the risks they pose (Lindell & Perry, 2006; Olshansky & Kartez, 1998). Oftentimes people think that natural hazards have such a low probability of occurrence in their area or they are so lacking in knowledge of what types of hazard adjustments they can undertake when they do understand the risks that the results is low probabilities to undertake specific steps to reduce the effect of potential hazards (Ge, Peacock, Lindell 2011; Hyndman & Hyndman, 2006; Peacock, 2003). Even in situations where many “old-timers” know what to do, given the high mobility rates for coastal populations, it is not surprising that studies have found that residents of coastal communities in Florida that were relative newcomers who had not experienced a disaster were not likely viewing mitigation as a high concern (Godschalk, Brody,& Burby 2003; Peacock, 2003). Through communication programs, communities can attempt to enhance voluntary actions on the part of citizens, builders and developers to undertake hazard mitigation actions and adjustments.
Hazard awareness strategies can be a crucial and significant step toward the success of implementing other hazard mitigation policy. Hyndman & Hyndman (2006, p. 9) state that public awareness will help people in adopting mitigation policies in order to avoid potential impacts or at least “modify their behaviour or their property to

24
24
minimize such impacts.” In addition, Beatley (2009) states that while not preventing hazardous development, the strategies such as hazard disclosure and hazard zone signs can at least put coastal property owners, developers, and local officials on notice that future dangers do exists and increase awareness of coastal hazards and their impact (p.83). Other studies also found that educational programs introduced by local governments to individuals or groups in their respective communities can in turn increase the level of commitment of local government officials toward hazard mitigation policies (Norton, 2005; Robins, 2008).
The awareness strategies and programs for hazard mitigation in the coastal areas may include public education programs, real estate hazard disclosures in all transactions in addition to mandatory flood disclosures for homes purchased using a mortgage, the posting of signs indicating highly hazard areas, programs to encourage the purchase of insurance, providing technical assistance and training to builders, developers, and property owners for mitigation, hazard information centers, and training materials provided in multiple languages (Beatley, 2009; Berke 1996; Brody & Highfield, 2005; Burby, 1998; Godschalk et al., 1999; Olshansky & Kartez, 1998; Srivastava & Laurian, 2006). 2.2.6. Local incentive programs and policies
Incentive tools are non-mandatory strategies that can be used to stimulate or promote property owners, builders, developers, and even whole communities to engage in hazard mitigation practices or adjustments (Tang et al., 2011; Daniels and Daniels, 2003). Some of these strategies are at the purview of local communities as they try to shape the nature of development within their jurisdiction. However there are also federal programs that seek to shape the behavior of jurisdictions, particularly with respect to flooding mitigation. This discussion will first concentrate on local incentive programs and then next section will address federal programs.
In general, local incentive attempt to shape the behavior of developers and land owners by offering a variety of incentives to promote development that is consistent with reserving the natural environment or promoting hazard mitigation. These strategies can, for example, allow developers to exceed certain development limits set by current zoning regulations in return for certain concessions, which in this case that enhance the mitigation status of development. When used as a mitigation tool, these strategies might encourage developers to avoid building in high hazard prone areas, incorporate enhanced mitigation technologies into building designs, or cluster structures within a large parcel that is being developed away from wetland areas, by, for example, allowing for a higher density development or exceeding height standards.
Another example of an incentive based approach might be Transfer Development Rights (TDR) (Beatley, 2009). In this strategy, coastal communities need to designate both conservation sending zones – such as an open space directly along the coast or a natural wetland, where development is not permitted or is to be discouraged, and a receiving zones, where additional development density is permitted by acquiring the transfered development rights (Beatley, 2009). Another strategy is the simple use of

25
25
density bonuses under which, for example, a developer might incorporate enhanced mitigation technologies into the building designs – say utilizing higher wind standards for roof coverings – in order to be allowed to increase densities. 2.2.7 Federal incentive programs
There are also federal programs that seek to enhance or promote the adoption of mitigation actions by whole jurisdictions through the federal flood insurance program. The National Flood Insurance Programs (NFIP), which was established in 1968, is considered a federal incentive that provides flood insurance to residents at the flood plain area (Schwab et al., 2010). NFIP has played a significant role in floodplain management and reducing risk and development in floodplain areas by demanding the adoption of building and land preparation standards in order to enable residents within a community or county to qualify for insurance (Holway & Burby, 1990). In a similar manner, many state-supported wind insurance programs demand higher building standards and inspections to qualify for coverage.
Another related federal program that might be considered an incentive tool is FEMA’s Community Rating System (CRS) as part of NFIP. This program provides flood insurance premium discounts for residents if the community that undertake floodplain activities above and beyond the minimum NFIP requirements (Schwab et al., 2007). CRS programs include activities such as (a) public information activities, such as providing elevation certificates and map information services; and (b) mapping and regulatory activities, such as establishing addition flood data, maintaining flood data, and introducing higher regulatory standards in addition to the NFIP minimum standards, such as foundation protection and more stringent building improvement rules (FEMA, 2007). Interestingly recent research has clearly shown that involvement by jurisdictions in both Florida and Texas in the CRS can substantially reduce flooding losses (Brody et al., 2011).
2.2.8. Financial tools Local and state governments have the power to levy taxes, charge administrative
fees, and make special assessments, which can be used not only for the collection of revenue, but also to integrate mitigation in the development process (Schwab et al., 2007). Financial tools may also be used to more equitably distribute the public costs of private development (Olshansky & Kartez, 1998). Financial tools include lower tax rates for preserving specific coastal areas as open space by limiting development intensity, special tax assessment for specific coastal areas, and impact fees for the development of specific coastal areas (Tang et al., 2011). In other words, local jurisdictions can encourage particular land use and land use patterns through adjustments in taxation policy by establishing economic and financial incentives to preserve, maintain, or create desirable features, or disincentives to discourage undesirable development patterns (Beatley, 2009, p. 82). Lower taxes or special taxes can also be employed as incentives for building designs that include mitigation or resilience features beyond what is required by codes (Beatley, 2009).

26
26
2.2.9 Critical public and private facilities Directing the location of public infrastructure and critical facilities outside of the
hazardous or environmentally sensitive areas can also be a critical element enhancing mitigation. This can reduce the cost of repairs and replacement following a disaster, by simply keeping these features of the built environment out of harms way. Critical public and private facilities include lifeline services such as police stations, fire stations, hospitals, and emergency centers are also located in safer areas helps ensure that the response capability of the local government is not impaired during a disaster (Schwab, et al., 2007). In other words, these critical facilities should be sited outside of high-risk locations and in places where, in the event of a major community disruption, they will remain functional (Beatley, 2009, p. 74). This means that essential community lifelines and infrastructure should be designed and integrated into the local jurisdictions’ land use plans and policy to reduce exposure and vulnerability and ensure operability (Beatley, 2009). Following such policies can also sets a public example and reflects the seriousness with which hazard mitigation issues should be considered and can steer development out of hazardous areas indirectly by stimulating development closer to these facilities and infrastructure. 2.2.10. Property acquisition programs
While not without challenges, local governments are allowed to acquire and hold property for public benefit and use the property to secure public ownership in high-hazard and risky areas (Beatley, 2009). In addition, local governments can purchase property, through fee simply acquisitions, to conserve critical ecosystems or natural features such as wetlands, maritime forests, and estuaries, as well as to provide open space for recreational benefits to their communities (Beatley, 2009; Schwab et al., 2007). The specific tools and strategies may include fee simple purchases, acquisition of development and easement rights, and relocation of existing structures in the hazardous areas pre-disaster. A fee simple purchase transfers full ownership of the property, including the underlying titles, to another party, in this case the community (Beatley, 2009; Schwab et al., 2007; US Forest Service, 2011). Meanwhile, an easement is a legal agreement between a landowner and an eligible easement holder that restricts future activities on the land to protect its value for natural protection or conservation (US Forest Service, 2011). These strategies that strive for removing at-risk property from the private market can be useful mitigation tools, as they reduce the possibility of inappropriate development and prevent the future exposure and vulnerability that development would cause (Beatley, 2009; Schwab et al., 2007). However, these programs can be costly for local government, although “in the long run it is often less expensive to acquire and demolish a building than to repeatedly provide for its construction” and provide costs for rescuing humans who live in the structure (Schwab et al., 2007, p. 263). 2.2.11. Private and public sector initiatives
Local jurisdictions often have limited resources for mitigation planning, particularly funding for acquisition, which often becomes a significant challenge for

27
27
coastal communities (Beatley, 2009). Therefore, local jurisdictions in some areas of the country have begun to explore more creative ways to raise funds and other initiatives for insuring that development does not occur in hazardous or environmentally sensitive areas. These initiatives may include land trust and public-private partnerships for land acquisition or easements (Beatley, 2009; Scwab et al., 2007). Land trusts can be acquired by raising funds by private, often non profit, entities to purchase and preserve natural land trough a variety of means, including facilitating the donation of scenic areas and space easement (Beatley, 2009). Beatly (2009, p80) discusses for example the Maui Coastal Land Trust which is a nonprofit, nonpolitical land conservation organization aimed at preserving and protecting coastal lands in Maui for the benefit of the natural environment and current and future generations. Initiatives of this type can also be undertaken in the form of public-private partnerships in which entities such as land banks, which can be “governmental or quasi-governmental in nature” (Beatley, 2009, p. 81), can buy land and hold it until appropriate uses or development strategies can be developed for its use. In addition, public-private partnerships can be created by bringing together various players such as businesses, researchers and academics institutions, and non-profit groups to develop integrated strategies to reduce and control the nature of development and exposure to coastal hazards by purchasing land or easements on existing holdings (Schwab et al., 2007). 2.2.12. Employing professionals for building standards
Utilizing professionals to assist local jurisdictions in building mitigation can be important, particularly for communities that lack these professional resources on their own staffs. Schwab (2010), for example, mentions that communities without a permanent planning staff tend to hire planning consultants to assist in multiple tasks such as drafting and implementing the codes and zoning regulations that govern land use. This is important as planners are often, or should be at least, more formally trained to understand how hazards should influence those tasks and processes. In addition, planners need other professionals involved because hazard mitigation that requires more highly technical and scientific information and data sources (Schwab, 2010). Geological consultants may help to identify suitable building sites and engineering consultants may help to develop special building techniques in hazard prone areas (Tang et al., 2011). Cigler (2009) found that the Louisiana Coastal Protection and Restoration (LACPR) considered the use of professionals and technical expertise as one of the important themes in guiding initiatives for post-Katrina and post-Rita hazard mitigation in the Gulf coast. There are a variety of ways professionals might be employed by local jurisdictions such as 1) the identification of suitable building sites for public infrastructure and facilities, 2) develop special building techniques and codes for hazard prone areas, and 3) to conduct windstorm/roof inspections.
3.0. Research design and survey methodology This section will focus on how the research that collected the data utilized in this
report was conducted. Specifically it will describe the study area, the sampling methods

28
28
and sample frame, as well as the response rates and provide an assessment of sample. Finally, the data collected as part of this survey will be briefly discussed.
3.1. Study Area The study area for this research is the Texas coastal region. It was chosen, quite
frankly, because the funding for its collection came from National Oceanic and Atmospheric Administration (NOAA) through the Texas General Land Office Coastal Management Program with the mission of targeting a research project to better understand the nature of non-structural hazard mitigation policies and strategies, with an emphasis on development and land-use policies employed by coastal jurisdictions in Texas. This area is part of the U.S. Gulf coast region, which is one of the most vulnerable coastal regions in the nation, subject to various weather related hazards such as hurricanes, tropical storms, and floods (Manyunga, 2008, p. 71; peacock physical hazard report,). According to the NOAA special projects’ office, there are 41 counties in Texas that is considered part of the coastal region (Crossett et al., 2004). NOAA defines a county to be part of the coastal region if one of the following two criteria are met: (1) at a minimum, 15% of the county’s total land area is located within a coastal watershed or, (2) a portion of, or an entire county accounts for at least 15% of a coastal cataloging unit. A cataloging unit is the smallest hydrologic unit which the U.S. Geologic Survey classified at four levels: regions, sub-regions, accounting units, and cataloging units (Crossett et al., 2004). Table 3.1 presents a list of the 41 NOAA defined coastal counties in Texas and Figure 3.1 provides a map of Texas counties consider coastal by NOAA’s definition. These are the target counties for this study.
Table 3.1 Coastal counties in Texas
Aransas, Austin, Bee, Brazoria, Brooks, Calhoun, Cameron,
Chambers, Colorado, DeWitt, Duval, Fayette, Fort Bend, Galveston,
Goliad, Harris, Hidalgo, Jackson, Jasper, Jefferson, Jim Hogg, Jim
Wells, Kenedy, Kleberg, Lavaca, Liberty, Live Oak, Matagorda,
Newton, Nueces, Orange, Refugio, San Patricio, Starr, Tyler,
Victoria, Waller, Washington, Webb, Wharton, and Willacy.
3.2. Units analysis
The target units of analysis for this research are all jurisdictions -- counties and municipalities -- located in NOAA defined coastal counties in Texas. Municipalities and counties are the targeted units of analysis given the focus of this research on what more generally are termed “non-structural” mitigation policies and techniques. Counties and cities are the legal entities in Texas that can adopt and employ a wide variety non-structural mitigation polices, or more specifically they can adopt and utilize a host of broadly defined land use and development policies that can directly or indirectly address

29
29
hazard mitigation. Of the two, municipalities or cities have much greater abilities to enact mitigation policies.
Figure 3.1 County Study Areas
Municipalities in Texas that are over 5000 individuals and have adopted home rule charters that have been approved by the legislature, have by definition home rule and therefore are legally capable of enacting and enforcing a large number of land-use policies related to zoning and similar policies and they can adopt building codes. Cities that have not adopted a home rule charter or are smaller than 5000 citizens are termed general rule cities. Their powers are not as expansive as home rule cities, having much more limited powers that are defined or granted by the state legislature.
Given the importance of building codes for hazard mitigation, the nature of building codes and their adoption in Texas should be briefly discussed. First, it should be noted that there is not a statewide building code in the state of Texas, in that the state

30
30
does not officially adopt and enforce building code regulations. In general, municipalities are the only entity in Texas that can and do adopt and enforce building codes. However, the Texas Department of Insurance (TDOI) does “adopt” a state recognized building code, with special wind provisions for “designated catastrophe areas”, which are essentially areas within the first tier of coastal counties and parts of Harris County. As informants within the TDOI noted, while all municipalities are suppose to adopt new building codes as they are recommended by TDOI, municipalities often fail to do so without penalty. As a consequence, there are in fact a variety of building codes in effect across municipalities in Texas ranging from the most recent International Residential Building Codes (IRBC) for 2009 to the much older Southern Building Code.
One factor that does help insure compliance with more recent wind related construction codes is that many insurers do not cover wind with standard homeowner policies which requires individuals to seek wind peril coverage from the Texas Windstorm Insurance Association (TWIA). To receive such coverage, however, demands compliance with the state’s windstorm codes and compliance is verified via inspection. Thus the state’s windstorm code does indirectly influence building construction for all developments and households seeking wind coverage from the state’s wind pool. Furthermore, while it is generally true that municipalities are the only jurisdictions that can adopt building codes, as with so many things in Texas, this is not always the case.
Counties in Texas are known as “general purpose” governments providing a host of services to their citizens as well as administering State services. In addition to services like law enforcement, the construction and maintenance of roads, welfare and health, counties also address flood plain management issues. In addition, many counties have also been granted powers by the state that allow for a variety of land-use regulation within unincorporated areas of the county. Some of these are related to subdivision regulations and ordinances of variable levels of specificity and land-use issues along the shorelines of lakes and waterways. Importantly, the 2009 legislature also granted counties the ability to adopt building codes or more specifically to apply the building codes adopted by their respective county seats to all unincorporated areas within the county. The addition of these extra abilities of some Texas counties to enact zoning like regulations and building construction ordinance (see Texas Local Government Code - Section 231 and 233) have led some to note that some counties provide a considerable variety of services when compared to counties in the Midwest, Mid-Atlantic and New England (Maxwell, 2011).
Given the great degree of heterogeneity across municipalities in Texas and the piece meal manner in which the legislature has granted extended rights and privileges to enact land use and development regulations to counties and general rule cities makes it difficult to know exactly which of the 249 counties and approximately 2000 municipalities in Texas have particular land use planning policies. In light of the variability in which the citizens and households are served by their “local” jurisdiction, whether it is the city in which they reside or the county if they reside in unincorporated

31
31
areas, this research will focus on gathering data from both types of jurisdictions in the Texas coastal zone. Furthermore, this research will not arbitrarily limit the size of the community to be surveyed. Since municipalities of any size are the backbone of land-use planning in Texas, this research attempted to survey any officially designated and state recognized municipality as well as all counties in the NOAA defined coastal zone. Based on these parameters, the initial sample frame for the coastal region included 267 local jurisdictions composed of 41 counties and 226 cities. 3.3. Sampling method
After initially identifying the 41 counties and 226 state recognized cities, the next step in creating the sample frame was identifying key local informants that could be contacted to provide information about the jurisdiction’s mitigation policies and governmental and community characteristics. The critical goal was to find an individual involved in city or county government that would be knowledgeable about various forms of mitigation policies related to land use, development and environmental controls, building code regulations, various public and private programs created or utilized by their jurisdiction and characteristics about the government and community in general. Given the nature of the types of data being collected, the primary individuals initially targeted for this survey were city planners and county judges. However given the great heterogeneity of jurisdictional governing structures our target group necessarily had to be expanded. Some city and county governments are quite large with individual departments addressing planning, building and infrastructure, as well as community development issues. Others were very simple operations with only a few staff or employees. Therefore, the development of the sample frame required extensive investigative work using many sources including the web, the city/county data book, and extensive telephone conversation and interviews with multiple contacts at the local level. While we began by targeting planners and county judges, in the event that these individuals were not available, nonexistent or unidentifiable other targeted individuals included city managers, building inspectors, flood plain administrators or managers and local mayors. In the final analysis a sampling frame was developed that consisted of 326 officials in jurisdictional governments to capture information on the 267 jurisdictions.
3.4. Methods of survey There are varieties of approaches that could be employed to actually implement
the survey including mailed surveys, telephone surveys, face-to-face surveys, and more recently, internet surveys. There are advantages and disadvantages with respect to each approach. For instance, face-to-face surveys have major advantages in that the survey can be rather complex, but nevertheless manageable, since a trained interviewer will implement the survey. However, face-to-face surveys would be very expensive to implement, particularly when the survey covers 267 local jurisdictions along the extensive Texas coastal region. Fortunately, because all informants were city or county officials and as part of the development of the sample frame contact information on the informants including their names, addresses, phone numbers, and email addresses were

32
32
available alternative approaches were possible. Specifically, this research utilized an internet or web-based survey, supplemented by a mailed survey if needed.
An Internet survey is not only a feasible but more importantly, a viable option because most officials with local governments can and do have access to email and the web via official computers they employ in carrying out their official functions. A number of scholars have noted that for populations that regularly use the internet, the Web has been found to be a useful means of conducting research (Couper, Traugott, & Lamias 2001; Sills & Song 2002). Furthermore as Dillman (2007) has also noted that a self-administered web-based questionnaires are feasible because when soliciting information from professional individuals that are likely to have access to the Internet.
Internet surveys have a number of advantages making them more efficient when compared to mail and face-to-face survey. The internet survey may significantly reduce data collection time required for survey implementation, especially when dealing with the large territories in the area targeted which often become significant barriers to conducting face to face surveys (Dillman, 2007). In addition, internet surveys often save time because the data are entered in an electronic format and therefore do not demand transferring the data from paper survey instruments (Kaplowitz et al., 2004). Furthermore Internet surveys also provide additional and readily available data on the progress of the survey because researchers quickly know the number of undeliverable e-mail s as well as what time the web-based survey was opened and completed. This can improve sampling procedures (Paolo et al., 2000).
Internet based surveys also reduce the cost associated with surveying conducting the research compared to face to face surveys, the telephone interviews and even the printing and mailing costs associated with mailed surveys (Cobanoglu, Warae, & Morec 2001; Dillman, 2007). Moreover, the Internet surveys like mailed surveys allows the respondent more flexibility in answering the questions. This was particularly important for this survey where the respondent is actually an informant asked to provide the most reliable and factual information about the jurisdiction and its policies. Hence, an internet survey enables the informant the time and ability to consult with others when answering questions.
For this research, the survey consisted of a self-administered web-based questionnaire. It was distributed from late summer of 2010 through early spring of 2011. There was also a supplemental data collection period during the summer of 2011 to obtain additional responses from some jurisdictions following elections and new appointments. The survey was conducted essentially following the Dillman’s (2007) three-tiered approach for Internet surveys. The initial survey distribution consisting of an email containing a cover letter with a link to the survey’s website along with a unique code and was followed with a reminder letter sent to the respondent’s email addresses after one month. If no response was received after two months, emails and cover letters with the link to the survey were resent. Follow-up reminders were sent via email unless the respondents needed a paper copy of the survey. Internet surveys were supplemented by mail surveys in case jurisdictional informants did not have internet or email access or

33
33
simply preferred using a paper survey. In total only eight informants requested the survey in paper format.
In total, when considering the 267-targeted jurisdictions, data were obtained on a total of 124, representing an overall response rate of 46%. There was some variability when comparing the response rates from counties versus cities. Of the overall 41 counties targeted, complete data were obtained from 26 counties, yielding a response rate of 63.4%. Meanwhile from 226 municipalities targeted, complete data was obtained from 98 of municipalities yielding a slightly lower response rate of 43.4%. As noted above, our desire was to initially target planners and county judges, but due to the complexities and variability of jurisdictional governments was greatly augmented to include key informants that included: planners, building officials or flood plain managers, mayors or city managers, and county judges or emergency or hazard management officials.
Table 3.2. Response rates by Jurisdiction population size
Population Targeted Responding Response Size Jurisdictions Jurisdictions Rates
< 1,000 44 11 25.0% 1,000-4,999 94 35 37.2%
5,000 - 14,999 65 38 58.5% 15,000 - 49,999 40 23 57.5% 50,000 - 99,999 14 10 71.4%
100,000-299,999 7 4 57.1% 300,000 - 499,000 1 1 100.0%
> 1,000,000 2 2 100.0% Total 267 124 46.4%
As completed surveys came in and the responses were monitored, it became evident that the response rates were varying by the size of the jurisdiction. Table 3.2 displays the response rates by size of jurisdiction. In general the data presented in this table clearly suggest variable response rates by jurisdiction size. The lowest response rate was for communities of less than 1000 at 25%, increasing to 37% for communities between 1,000 and 4,999, increased again to 58.5% for communities between 5,000 and 14,999, remained essentially unchanged at 57.5% for communities between 15,000 and 49,999 and then rose again to 71% for jurisdictions between 50,000 and 99,999. For jurisdictions between 100,000 and 299,999 the rate dropped back to 57%, but the final two categories, reflecting very large jurisdictions 300,000 or more had response rates of

34
34
100%. Clearly, the resulting sample is under representative of smaller jurisdictions, a factor that will have to be considered when generalizing the results.5
3.5. Designing the instrument
Before the survey was conducted, several steps were undertaken to ensure the reliability and validity of the data collection process. This process is illustrated in Figure 3.2. The first step was the designing of the instrument itself. The instrument was initially developed based on previous instruments that were employed by previous studies (Lindell, 2010, Brody et.al, 2010). To improve on the instrument and ensure it would work in the Texas context, questions were thoroughly discussed with experts. In addition, the instrument was also sent to practitioners to get their feedback. Some professionals were also asked to take the survey as a pre-test before the actual survey was conducted. After having feedback from experts, practitioners, and professionals, the instrument was discussed again through a focus group discussion and subsequently was revised to create final survey instrument. This survey questionnaire’s format was then modified such that it would work as a web-survey design using Qualtrics software. The tailoring process insured it could be appropriately viewed on a web-based configuration and design (Dillman, 2007).
Figure 3.2 Instrument design process
5 It is interesting to note that while under representing populations in smaller jurisdictions, in terms of the overall population in coastal areas in Texas, the responding jurisdictions contain 79.9% of the entire coastal population of Texas and 90% of the population of jurisdictions in Texas coastal management zone (CMZ).
Designing survey instrument
Focus group discussion
Practitioner input and professional
pre test
Focus group discussion: expert and researchers
Revising instrument and preparing for
final draft
Tailoring web-based survey

35
35
3.6. Data collection and usage The survey instrument collected a variety of types of information from the key informants. The majority of the instrument was focused on collecting information on whether a jurisdiction adopted particular hazard mitigation policies or strategies and if they did adopt a policy, how extensively it was employed by the jurisdiction. In addition information about the jurisdiction and support for mitigation activities was also collected. This report will focus on the nature of the policies and strategies employed by the jurisdiction. A copy of the Internet survey instrument is available in Appendix 1.
In addition to the Internet survey, other secondary data sources were employed for this research. For example, the locations of the CMZ area were identified based on the map provided by the Texas General Land Office. The 2010 census data and the fact finder in the U.S. Census Bureau were utilized for population and population change variables. In addition, GIS based data were downloaded from the coastal planning atlas (http://coastalatlas.tamug.edu/). These GIS based data were used to calculate land cover, the 100-year floodplain and storm surge.
With this general knowledge of how the data were collected and the nature of the sample, the following section will provide a detailed discussion and descriptive analysis of the extent to which non-structural hazard mitigation strategies and tools are employed among coastal jurisdictions in Texas. 4.0 Hazard mitigation policy and strategy usage among Texas coastal Jurisdictions
The focus of this report again is on the extent to which a variety of what are generally referred to as non-structural hazard mitigation policies and strategies are being employed by coastal jurisdictions in Texas. Section 2 provided a systematic discussion of the variety of different non-structural hazard mitigation policies and strategies that are often identified by the planning and hazard mitigation literatures. As noted, there are many ways that these types of strategies and policies might be categorize; for the purposes of this research the classification was based on a synthesis of classifications generally seen in the planning and mitigation literature for addressing mitigation (Daniel and Daniel 2003, Beatley et al., 2002). The resulting classification has 12 categories of similar non-structural mitigation strategies and tools that included: 1) land use and development regulations, 2) shoreline regulations, 3) natural resource protection, 4) building standards, 5) information dissemination/awareness programs, 6) property acquisition programs, 7) local incentives tools, 8) federal incentive programs, 9) financial tools, 10) critical public and private facilities policies, 11) private-public sector initiatives and 12) hiring professionals for building mitigation.
Also as discussed in section 2 were the variety of specific types of strategies and tools that are generally associated with each of these categories. Table 4.1 identifies the 44 detailed strategies that were associated with each of the 12 categories. Some categories like land use and development regulations have a relatively large number of specific policies/strategies associated with them, while others like federal incentives or public-private sector initiatives have relatively few.
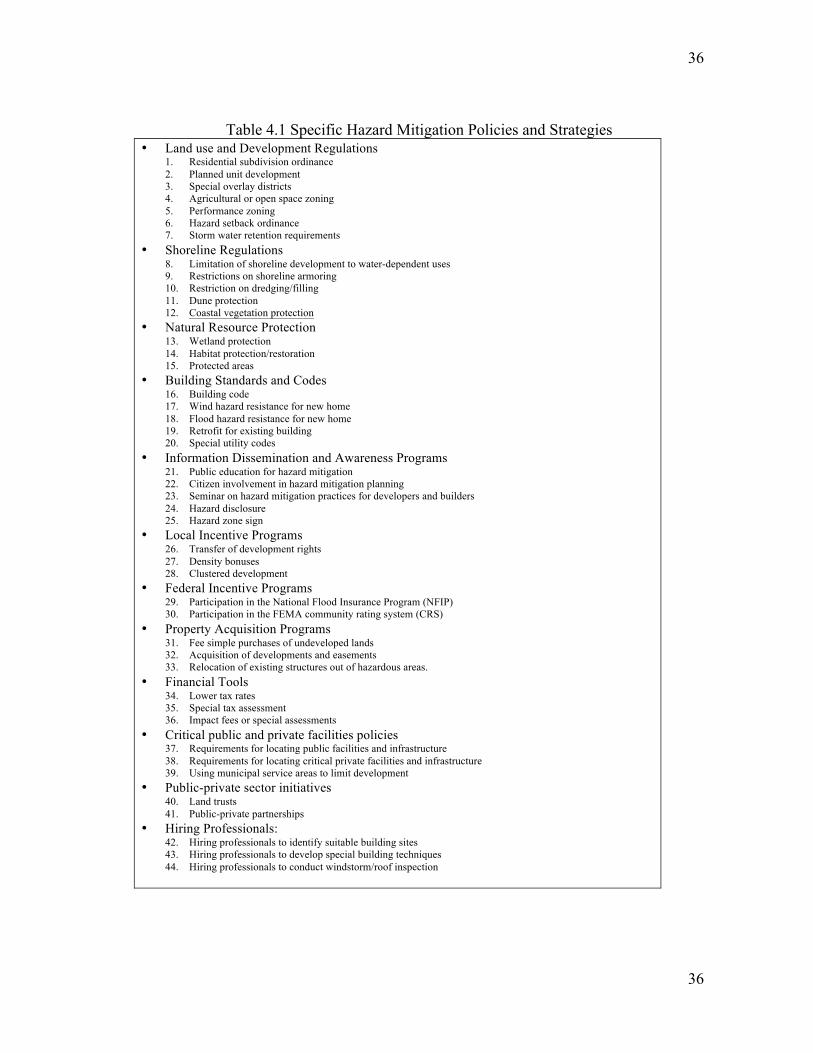
36
36
Table 4.1 Specific Hazard Mitigation Policies and Strategies • Land use and Development Regulations
1. Residential subdivision ordinance 2. Planned unit development 3. Special overlay districts 4. Agricultural or open space zoning 5. Performance zoning 6. Hazard setback ordinance 7. Storm water retention requirements
• Shoreline Regulations 8. Limitation of shoreline development to water-dependent uses 9. Restrictions on shoreline armoring 10. Restriction on dredging/filling 11. Dune protection 12. Coastal vegetation protection
• Natural Resource Protection 13. Wetland protection 14. Habitat protection/restoration 15. Protected areas
• Building Standards and Codes 16. Building code 17. Wind hazard resistance for new home 18. Flood hazard resistance for new home 19. Retrofit for existing building 20. Special utility codes
• Information Dissemination and Awareness Programs 21. Public education for hazard mitigation 22. Citizen involvement in hazard mitigation planning 23. Seminar on hazard mitigation practices for developers and builders 24. Hazard disclosure 25. Hazard zone sign
• Local Incentive Programs 26. Transfer of development rights 27. Density bonuses 28. Clustered development
• Federal Incentive Programs 29. Participation in the National Flood Insurance Program (NFIP) 30. Participation in the FEMA community rating system (CRS)
• Property Acquisition Programs 31. Fee simple purchases of undeveloped lands 32. Acquisition of developments and easements 33. Relocation of existing structures out of hazardous areas.
• Financial Tools 34. Lower tax rates 35. Special tax assessment 36. Impact fees or special assessments
• Critical public and private facilities policies 37. Requirements for locating public facilities and infrastructure 38. Requirements for locating critical private facilities and infrastructure 39. Using municipal service areas to limit development
• Public-private sector initiatives 40. Land trusts 41. Public-private partnerships
• Hiring Professionals: 42. Hiring professionals to identify suitable building sites 43. Hiring professionals to develop special building techniques 44. Hiring professionals to conduct windstorm/roof inspection

37
37
For each of the 44 specific planning approaches or methods, local planning informants were asked to assess the extent to which each is being employed by their jurisdiction. Informants were provided with response categories ranging from not at all (1) through to a very great extent (4) and since it is possible that some jurisdictions6 did not have the legal capacity to undertake some of these strategies, a response category was provided to capture such an option. For the purposes of this and subsequent analysis, the response categories were recoded to better capture a simple scale reflecting the extensiveness to which each strategic or policy was employed. For example, while it may be important to know that a jurisdiction did not have the legal capacity to enact a particular policy or not, the focus here is whether or not the jurisdiction does or does not employ the policy, hence these jurisdictions were equivalent to those that had the capacity, but did not choose to exercise the possibility. In both cases, the jurisdiction did not employ the policy and hence are equivalent and will be recoded as zero (0). The full set of recoded categories were: not at all (0), to a small extent (1), to some extent (2) or to a great extent (3).
This section will provide a discussion and descriptive analysis of the extent to which various types of non-structural mitigation policies or strategies are in use by the counties and municipalities in Texas coastal areas. The discussion will first examine to what extent various types of mitigation policies are in use by local jurisdictions in Texas coastal areas. The second section will examine the difference between municipalities and counties in the extensiveness to which these policies and strategies are employed.
Table 4.2 Development and Land Use Regulations
Development Regulations not at all small extent
some extent great extent
Total 1. Residential subdivision ordinance n 17 4 23 80 124
% 13.7 3.2 18.6 64.5 100.0 2. Planned unit development 43 28 20 33 124 34.7 22.6 16.1 26.6 100.0 3. Special overlay districts 70 14 27 13 124 56.5 11.3 21.8 10.5 100.0 4. Agricultural or open space zoning 70 20 17 17 124 56.5 16.1 13.7 13.7 100.0 5. Performance Zoning 90 15 12 7.0 124 72.6 12.1 9.7 5.7 100.0 6. Hazard setback ordinance 42 8 23 51 124 33.9 6.5 18.6 41.1 100.0 7. Storm water retention requirements 28 24 25 47 124 22.6 19.4 20.2 37.9 100.0
6 It should be noted again, that in Texas, blanket statements that certain types of jurisdictions can not undertake a specific policy, must be approached with caution. While it is generally true that only municipalities can adopt and enforce building codes, some counties also have this legal authority. Perhaps the general rule is that there are and can be exceptions.

38
38
4.1 Development and land use regulations. Table 4.2 presents the findings with respect to land use and development
regulations within jurisdictions. Specifically, informants were asked about the 7 different development and land use regulations displayed in the table which include: 1) residential subdivision ordinances, 2) planned unit development, 3) special overlay districts, 4) agricultural or open space zoning, 5) performance zoning, 6) hazard setback ordinance and 7) storm water retention requirements.
The data in Table 4.2 show that residential subdivision ordinances are the most extensively employed strategies by local jurisdictions with 64.5% reported using them to a great extent and 18.55% to some extent. This is followed by hazard setback ordinances with just over 41% employing them to a great extent and 18.6% to some extent. This finding suggests that local jurisdictions are quite likely to use hazard setback ordinances, with nearly 60% using them at least to some extent. In addition, with respect to storm water retention requirements, it can be seen that nearly 38% employ them to a great extent, and an additional 20% employing them to some extent. Again these results suggest storm water requirements are also prevalent in a clear majority of jurisdictions. The other form of development regulation that is at least somewhat prevalent related to planned unit developments. While not a majority, nearly 43% of jurisdictions report employing this approach at least to some extent (16.1%) or to a great extent (26.6%).
In contrast, most local jurisdictions did not implement land use and development regulations that are based on performance-based zoning compared to other development regulations. Indeed, 73% of jurisdiction reported that they did not use performance zoning at all and an additional 12% use them only to a small extent. Rather substantial percentages of jurisdictions do not use special overlay zoning districts (56.5%) or agricultural or open space zoning (56.5%) at all. Nevertheless, a far from insignificant 10.5% of jurisdictions used special overlay zoning districts extensively and nearly 22% employing them to some extent. Despite these latter findings, one would have to concluded that on the whole, zoning approaches appear to be used only on a limited basis among these jurisdictions.
The findings with respect to land use and development regulations show that local jurisdictions are generally more focused on trying to shape development via residential subdivision ordinances, and to mitigate through storm water retention requirements and hazard setbacks, with some limited introduction of more incentive based and flexible approaches like planned unit developments. These findings are somewhat similar to previous studies that suggested that subdivision and hazard setback ordinance are often used in land use planning (Deyle, et al., 1998; Olshansky & Kartez, 1998). However, previous studies that suggest rather extensive use of zoning ordinances (Godschalk et al., 1989; Beatley et al., 1994) clearly do not hold among jurisdictions along the Texas coast, at least with respect to more progressive forms of zoning examined by this research.

39
39
Table 4.3 Shoreline regulations
Shoreline regulations
not at
all small extent
some extent
great extent Total
Limitation of shoreline dev. to water-dependent uses n 87 13 11 13 124
% 70.2 10.5 8.9 10.5 100.0 Restrictions on shoreline armoring 91 13 8 12 124 73.4 10.5 6.5 9.7 100.0 Restriction on dredging /filling 71 12 20 21 124 57.3 9.7 16.1 16.9 100.0 Dune Protection 110 2 4 8 124
88.7 1.6 3.2 6.5 100.0 Coastal Vegetation protection 100 4 7 13 124
80.7 3.2 5.7 10.5 100.0
4.2. Shoreline regulations
Table 4.3 displays the data on the use of regulations to limit and restrict the nature of development activities along shoreline areas. These shoreline regulations consist of 1) limitation of shoreline development to water-dependent uses, 2) restriction on shoreline armoring, 3) restriction on dredging and filling, 4) dune protection and 5) coastal vegetation protection. Overall, these types of regulations were not very extensively used by sampled jurisdictions, although it must be pointed out that many of these jurisdictions, while they may have some form of shorelines, are not directly adjacent to the Gulf Coast. The data suggests that 87 localities (70.2%) never use regulations that place limitations on shore development to water-dependent uses only. Conversely, only 10.5% used them extensively and 8.9% used them to some extent. Similarly, the vast majority, at 73.5% of jurisdictions, do not employ restrictions on shoreline armoring at all and only 9.7% use them to a great extent. In addition, the vast majority of jurisdictions, 57.3%, do not place restrictions on dredging/filling, with only 16.9% employing these restrictions extensively. Furthermore, and here is where the issue of being directly on the gulf coast has it most significant consequence, very few local jurisdictions employ dune and coastal vegetation protection policies. The findings in the table shows that nearly 89% do not have any kind of dune protection ordinances at all and nearly 81% do not protect coastal vegetation. Conversely only 6.5% of local jurisdictions employed dune protection and 10.5% employed coastal vegetation protection extensively. As noted above, these findings can in no small measure be a consequence of the location of many of these jurisdictions. While all jurisdictions are part of the coastal region as defined by NOAA, almost 2/3 of sample jurisdictions do not have coastal shorelines and just over 56% of sampled jurisdictions (70 of 124) are not located, partially or wholly in Texas’ Coastal Management Zone (CMZ). Therefore, many of these non-CMZ jurisdictions

40
40
may not even have coastal shoreline issues; hence shoreline regulations are not a priority for them.
We can take some small measure of consolation in the following observations. For example, when just considering CMZ jurisdictions, nearly 35% limit shoreline development to water dependent usages, 26% protect dunes, 44% protect shoreline vegetation, and 39% restrict dredging and fill activities to at least some extent. However, sizable majorities, even when focusing just on CMZ jurisdictions, do not limit shoreline development (48%), armoring (52%), dredging/filling (48%), or protect dunes (74%) shoreline vegetation (55.6%) at all. While there are undoubtedly many factors influencing this lack of shoreline protection, such as whether addressing bay or gulf shorelines as well as the locations of state and national parks/management areas, these percentages are somewhat sobering.
4.3 Natural resource protection Table 4.4 presents responses to natural resource protection regulations which
consist of 1) wetland protection, 2) habitat protection/restoration, and 3) protected areas preservation. The findings suggest that on the whole these regulations are not very extensively used by coastal jurisdictions. The majority of jurisdictions do not engage in wetland protection at all, with 54% or 67 of 124 localities falling into this category. However, 21% used them extensively and an additional 15% use them somewhat. The findings also show that only a small percentage, 10%, of local communities engage in habitat protection/restoration extensively. Most jurisdictions, 66%, do not engage in habitat protection or restoration activities at all. In addition, 62% of localities do not utilize protected areas to protect natural resources at all. Relatively small percentages, 12% in both cases, utilize protected areas extensively or to some extent.
Table 4.4 Natural resource protection
Natural Resource Protection not at all small
extent some extent
great extent Total
Wetland Protection n 67 12 19 26 124 % 54.0 9.7 15.3 21.0 100.0
Habitat protection/ restoration 82 12 18 12 124 66.1 9.7 14.5 9.7 100.0 Protected areas 77 17 15 15 124 62.1 13.7 12.1 12.1 100.0
These relatively low percentages suggest that local jurisdiction generally do not employ natural resource protection approaches as a mitigation strategy. This suggests, albeit indirectly, that coastal communities in Texas do not fully understand or possibly appreciate the potential protection that these natural resources provide, through the ecosystem services of wetlands and natural habitats, as mitigation tools that can reduce hazard impacts.

41
41
Interestingly, these results are not similar at all to those of Tang et al., (2008). While not directly assessing policy implementation, but rather the assessment of land use/comprehensive plans along the pacific coastal region, they found that natural resource protection policies were pervasively mentioned in planning documents through the region. However, the above findings are similar to Olshansky & Kartez (1998) who found that few communities nation wide used these tools. These findings are also consistent with Peacock et al., (2009) who found that most of communities participating in the development of local hazard mitigation plans, even those within the Texas Coastal Management Zone, were not likely to propose hazard mitigation actions related to natural resource protection. Indeed, they found that only one jurisdiction proposed a hazard mitigation action which was focused on wetland protection/restoration! 4.5 Building standards
The building regulation standards and policies data includes information collected on five policy areas: 1) the current building code used by local jurisdictions, 2) flood hazard standards for new home, 3) wind hazard resistance standards for new home, 4) retrofitting for existing building, and 5) special utility codes. For most of these building standards regulations, each jurisdiction’s informant was asked to what extent the regulations were used in a manner similar to those discussed above. For the building code question however local jurisdictional informants were simply asked what types of building codes their jurisdiction had adopted. The response categories included the 2009, 2006, 2003 and 2000 IRC/IBC, the much older Southern Building Code (SBC), no building code, and other. These response categories were converted into a coding scheme that is consistent to the coding scheme employed for other policy related questions ranging from a 0 reflecting no building code having been adopted to a 3, reflecting the adoption of the most current, up to date and presumably the most stringent codes.7 Specifically if local jurisdiction adopted the most current building code standards, the 2009 IRB/IBC codes, they were given the highest code 3, if the local jurisdiction adopted the 2006 or 2003 IRC/IBC codes they were coded 2, communities utilizing the 2000 IRC/IBC or the even older southern building codes were coded 1, and if no building code was adopted, the jurisdiction was coded 0.
The data on the extent of adoption for the 5 building standards/policy data are reported in Table 4.6. Perhaps somewhat surprisingly, only 23.4% of the sampled jurisdictions reported having adopted the current 2009 IRC/IBC. An additional 46% of the jurisdictions have adopted either the 2006 or 2003 IRC/IBC. Overall then, 69.4% of coastal jurisdictions report having adopted one of the newer, 2003-9, international building or residential codes that have been recommended by the Texas Department of Insurance. Unfortunately, 11.3% of coastal jurisdictions were still utilizing either the oldest version (2000) of the IRC/IBC or the even older southern building code (SBC).
7 This assumption may not always be warranted. There have been historical periods, particularly periods with high levels of development, where building codes have been known to diminish in quality as was the case with building codes in Miami Dade county from about the 1950s through the late 1970s and early 1980s (see Peacock, Morrow and Gladwin 2001).

42
42
And even more of a concern is that finding that 19.4%, or 26 of sample jurisdictions have adopted no building codes. Most of these jurisdictions are counties, which as noted earlier have limited capacity to adopt and enforce a building code, however a number were also cities. These findings suggest a relatively large percentage of coastal jurisdictions have either no building code, 19.4%, or are employing relatively out of date standards, 11.3%.
When comparing the findings for the remaining standards, it can be seen that flood hazard standards for new homes are by far the most extensively adopted and implemented regulations adopted by coastal jurisdictions. Specifically 62.9% local jurisdictions report that they are using these standards extensively in their communities, while and additional 16.1% are employing them to some extent. However, there were still 12.1% or 15 coastal localities that have no flood hazard standards for new housing at all.
Table 4.6 Building standards regulations
Building Standards
not at all
small extent
some extent
great extent Total
Building code n 24 14 57 29 124 % 19.4 11.3 46.5 23.9 100.0
Wind hazard resistance for new homes 38 4 18 64 124 30.7 3.2 14.5 51.6 100.0 Flood hazard standards for new homes 15 11 20 78 124 12.1 8.9 16.1 62.9 100.0 Retrofit for existing building 42 27 23 32 124 33.9 21.8 18.6 25.8 100.0 Special utility codes 50 18 20 36 124
40.3 14.5 16.1 29.0 100.0
The implementation of building regulations in terms of wind hazard resistance for new home was moderately high with 51.6% local jurisdiction reporting using these standards extensively and an additional 14.5% reporting using them somewhat. Nevertheless, 30.7% of coastal jurisdictions report that they have not adopted and hence employed wind hazard resistance policies at all. The final two regulations related to retrofitting and special utility codes are not utilized that extensively among coastal jurisdictions. Only 25.8% or 32 of the124 sampled jurisdictions employ retrofitting standards extensively in their communities and 35% of coastal jurisdictions have no such polices for existing building/structures at all. Similarly, just over two fifths or 40% of coastal communities have no special utility codes and an additional 14.5% used them only sparingly in their jurisdictions. On the other hand, it should not be overlooked that nearly 30% of jurisdictions do employ special utility codes extensively.

43
43
The observation that nearly 70% of coastal jurisdictions have adopted IRC/IBC codes from 2003 or later is a positive finding. However, it should be noted that as Burby (1998) suggests, measures such as building codes and flood and wind standards, which often require elevating structures and installing hurricane clips are effective in reducing losses for new construction and development, but have limited impact on losses to existing development in hazard zones. This of course assumes that more recently adopted codes are stronger in terms of hazard mitigation (Burby, 1998; Tang, 2008). Newer codes will have substantial effects when homes are renovated or significantly improved upon, or even if damaged, assuming that the renovations or repairs amount to more than 50% of the value of a structure. But even in the case of less substantial improvements, retrofitting programs and insuring code compliant improvements, such as when installing hurricane shutters or replacing roofs can result in substantial improvements in terms of mitigation with new code adoption. Overall, compared to other regulations examined thus far, local jurisdictions appear to be making more extensive usage of building standards and codes as a tool in hazard mitigation analysis.
Table 4.7 Information dissemination and awareness Information dissemination/
awareness not at
all small extent
some extent
great extent Total
Public education for hazard mitigation n 38 35 29 22 124
% 30.7 28.2 23.4 17.7 100.0 Citizen involvement in hazard mitigation planning 40 38 29 17 124 32.3 30.7 23.4 13.7 100.0 Seminar on hazard mitigation practices for developers and builders 75 27 17 5 124 60.5 21.8 13.7 4.0 100.0 Hazard disclosure 76 21 16 11 124 61.3 16.9 12.9 8.9 100.0 Hazard zone sign 92 17 12 3 124
74.2 13.7 9.7 2.4 100.0
4.6. Information dissemination and awareness programs
Hazard information and awareness programs offer a mechanism through which land use practices and patterns might be altered voluntarily. The hope is that as residents, builders, developers and others gain a better understanding of their hazard exposure and risk they will make adjustments that will enhance the mitigation status of an area. Five strategies were asked of local jurisdictional informants concerning a variety of information dissemination and awareness policies and programs. These programs include: 1) public education for hazard mitigation, 2) citizen involvement in hazard

44
44
mitigation planning, 3) offering seminars on hazard mitigation practices for developers and builders, 4) hazard disclosure statements as part of real estate and other transitions, and 5) the use of hazard zone signage. The Table 4.7 displays the various responses for each strategy.
Interestingly, while not many jurisdictions employed public education for hazard mitigation programs extensively, of the hazard dissemination and awareness approaches considered, it was by far most extensively employed. Only 17.7% or 22 coastal jurisdictions extensively used public education programs with an additional 23.4% or 29 using them to some extent. Meanwhile, nearly 31% or 38 of 124 never utilized these kinds of programs and just over 28% used them to only a small extent. Similarly, there is a very limited report of utilizing citizen involvement in hazard mitigation planning. Nearly 14% or 17 communities reported extensively using citizen involvement in hazard mitigation planning activities and an additional 23% or 29 communities reported involvement of citizens to some extent and just under 31% or 38 report involving citizens to only a small extent. Unfortunately just over 32% or 40 jurisdictions indicated that citizens were not involved at all in hazard mitigation planning at all, to the extent that such planning even occurs in the first place.
The findings also suggest that offering seminars on hazard mitigation practices for developers and builders were not commonly found programs utilized by local jurisdictions. Very few localities, only 4% or 5 jurisdictions extensively hold these types of seminars, while the vast majority of jurisdictions, 60.5% never offer seminars on hazard mitigation practices for builders and developers. Approximately 22% of jurisdictions offer these seminars on a limited basis and additional 14% of utilize them slightly more extensively. In addition, 61.3% jurisdictions responded that they do not require hazard disclosures at all during real-estate transactions. Only 8.9% or 11 jurisdictions require disclosures extensively with an additional 12.9% or 16 jurisdictions employ them somewhat extensively. The least popular strategy that might be employed to increase public awareness of hazard is signage clearly indicating hazardous zones or areas. Only 2.4% of jurisdictions report using hazards signage extensively, 9.7 of jurisdictions employ them somewhat and nearly 14% use them sparingly. The vast majority of just over 74% never use hazard signage in their jurisdictions.
It is interesting that while information dissemination and awareness tools are known to be relatively inexpensive yet effective measures for promoting mitigation adjustment, especially voluntary adjustments, these policies are not being extensively implemented by local jurisdictions along the Texas coastal areas. It is also interesting to note that these general findings stands in stark contrast to the observation that education programs are often proposed actions in the coastal hazard mitigation plans evaluated by Peacock and colleagues (2009). However, many stakeholders, particularly those in the “development” community, often shun programs like disclosure statements and signage that make very obvious hazard exposures for areas within local jurisdictions.

45
45
4.7. Property acquisition programs As discussed in section 2, property acquisition or the purchasing of development
rights offer methods of preventing development from occurring in hazardous areas in the first place. Furthermore the relocating of structures out of hazards areas can have the same effect, after questionable development has occurred or, because of changes in the physical environment such as erosion, structures are now threaten. Table 4.7 displays the jurisdictional usage findings related to property acquisition programs including: 1) fee simple purchases, 2) acquisition of development rights or easements, and 3) relocation of existing structures. The percentage of local jurisdictions that employ fee simple purchases was very low. Indeed, only 4% or 5 jurisdictions used such mechanisms extensively, with the vast majority of nearly 76% or 94 jurisdictions never employing this method at all. Likewise, very few, 3% or 4 jurisdictions utilize the acquisition of development rights or easements extensively. Yet again, the vast majority of jurisdictions, 76% or 94 jurisdictions, never attempt to obtain such rights or easements at all. Finally, an overwhelming majority of 83% or 103 of 124 jurisdictions have ever relocated structures out of harm’s way, with only 3 jurisdictions employing such methods extensively.
Table 4.7 Property acquisition programs
Property acquisition programs not at all
small extent
some extent
great extent Total
Fee simple purchase n 94 9 16 5 124 % 75.8 7.3 12.9 4.0 100.0
Acquisition of development rights or easements 94 14 12 4 124 75.8 11.3 9.7 3.2 100.0 Relocating existing buildings 103 11 7 3 124 83.1 8.9 5.7 2.4 100.0
The very low percentages of communities that employ these methods might be explained by the fact that the property or land acquisitions programs are among the most expensive methods, particularly given the relatively high value of coastal land (Beatley, 2009). Local communities simply do not have the financial capital to undertake these types of programs. In fact, even in the aftermath of a disaster, when communities have the possibility of combining local resources with those of the state and federal government to obtain repetitive loss properties or properties that perhaps are subject to coastal setback demands, local communities and even state governments do not like to undertake these acquisitions. In addition, with respect to fee simple purchases and property acquisition by governmental entities, these methods often imply that the local governments effectively delete these properties from its property tax rolls and it additionally assumes maintenance costs. Therefore, local jurisdictions often are loath to adopt property acquisition programs, despite the observation that these properties can often become community amities in the form of parks and recreational areas. It should

46
46
be pointed out that the above results are not necessarily surprising for they are similar to previous studies on plan evaluations that find that few communities used land and property acquisition programs (Olshansky & Kartez, 1998; Tang, 2008). 4.6. Financial Tools.
Local jurisdictional informants were also asked specifically about three different financial strategies for promoting and addressing mitigation needs within jurisdictions. These include: 1) lower tax rates for preserving specific coastal areas as open space limited development intensity, 2) special tax assessment for specific coastal areas, and 3) impact fees or special assessments for the development of environmentally sensitive or hazardous areas. Table 4.8 displays the response on financial tools/policies.
Table 4.8 Financial tools
Financial tools
not at all
small extent
some extent
great extent Total
Lower tax rates n 112 5 4 3 124 % 90.3 4.0 3.2 2.4 100.0
Special tax assessments 115 3 5 1 124 92.7 2.4 4.0 0.8 100.0 Impact fees or special assessments 113 5 4 2 124 91.1 4.0 3.2 1.6 100.0
Compared to others policies and strategies examined above, these policies are by
far the most unpopular when assessed in terms of the extent to which they are employed by sampled jurisdictions. Very few jurisdictions make use of these types of policies – just over 90% or 112 of these jurisdictions to not use lower tax rates for preserving environmentally sensitive or hazards areas at all, nearly 93% or 115 jurisdictions to not consider special tax assessments, and just over 91% or 113 jurisdictions do not levy special impacts fees or assessments for developing in high hazard or environmentally sensitive areas. Conversely, only 9.6% of jurisdictions at least consider using lower taxes as an incentive for not developing in high hazard or environmentally sensitive areas and respectively, just over 7% and nearly 9% at least to a small extent consider levying special tax assessments or impact fees for developing in environmentally sensitive or high risk areas.
These findings suggest that local jurisdictions in coastal Texas have very little affinity toward using taxes as incentives or as disincentives for steering development to safer less hazards areas as well as preserving environmental sensitive areas. These results are consistent with some previous findings showing that more market-based mechanism, whether as incentives or disincentives were rarely included or were rarely used (Deyle et al., 1998; Olshansky & Kartez, 1998; Tang, 2008). However, it should be pointed out that some states, like Florida, has made impact fees an important mechanism

47
47
for not only financing mitigation activities, but for also funding a great variety of programs to help local communities plan for and undertake mitigation activities.
4.8 Local Incentive tools Incentive tools include might include a variety of programs where by certain
mitigation actions are promoted by offering various forms of incentives to developers, land owners, and even whole communities. For our purposes incentives have been broken down into two clusters, those that might be employed by local governments and those offered by the federal government. Table 4.9 presents the data on the incentive tools that might be employed by local governments. Specifically these local incentives include the 1) transfer development rights from environmentally sensitive and hazardous areas, 2) density bonuses and 3) cluster development in the environmentally sensitive and hazardous areas. Unfortunately, the pattern that emerges from these data are quite similar to the findings above with respect to financial tools – on the whole very few coastal jurisdictions in Texas employ these methods. The findings are those 87% or 108 out of 124 jurisdictions to not employ the transfer of development rights at all and only 16 or about 13% consider them to any extent. Similarly, when it comes to density bonuses or cluster development options, both of which might be employed to entice developers to focus development out of higher hazard or environmentally areas, 91% do not consider density bonuses and 89.5% do not offer cluster development options at all.
Table 4.9 Local incentive tools
Incentive tools
not at all
small extent
some extent
great extent Total
Transfer of development rights n 108 11 4 1 124 % 87.1 8.9 3.2 0.8 100.0
Density bonus 113 7 4 0 124 91.1 5.7 3.2 0.0 100.0 Clustered Development 111 6 6 1 124 89.5 4.8 4.8 0.8 100.0
It is possible that one reason for the relatively low usage of these forms of incentives such as the transfer of development rights is, as Schwab and colleagues (Schwab et al., 2007) suggested, they are often difficult for local governments to implement and for landowners to understand and accept. This is particularly the case with respect to transferring development rights, which requires local communities to identify areas they which to protect or remain the same, generally termed sending areas, and areas that they will allow more intensive development, termed receiving areas.
It should be noted that these findings are, on the whole, not similar to previous studies that focused on plan evaluations and the adoption of incentive tools which suggests that local jurisdictions have adopted transfer development rights, clustered development and density bonus in coastal areas at somewhat higher rates (Davis, 2004;

48
48
Hershman, 1999; Tang, 2008). For example, while not as frequently adopted as some other forms of land-use management, Godschalk and colleagues (1989) found that upwards of 20% of communities they surveyed employ development rights transfers. The rates for Texas are generally half those seen in previous research, yet we are examining finding for 2010-11, over twenty years later. 4.9. Federal Incentive Programs.
Unlike the findings with respect to local incentives, many local jurisdictions employ federal incentive programs as part of the local policies that are important for coastal hazard mitigation. Table 4.10 displays the results for participation in the National Flood Insurance Program (NFIP) and the Community Rating System (CRS). Relatively speaking a remarkably high percentage of 63.7% of local jurisdictions along Texas coastal areas participated in NFIP to a very great extent with an additional 18.6% participating somewhat.8 While participation in CRS is more moderate, it still is substantial. In all, 46 of 124 or 37% of local jurisdictions participated in CRS extensively with additional percentages participating somewhat, 23.4%, or to a small extent, 10.5%. Overall very few jurisdictions fail to participate in these programs at all.
Table 4.10 Federal incentive tools
Incentive tools
not at all
small extent
some extent
great extent Total
Participation in the National Flood Insurance Program (NFIP) n 14 8 23 79 124
% 11.3 6.5 18.6 63.7 100.0 Participation in the FEMA community rating system (CRS) 36 13 29 46 124 29.0 10.5 23.4 37.1 100.0
These findings clearly suggest much higher and more extensive participation in
these two federally based incentive programs despite the fact that they can play a direct regulatory role in local government policy to insure participation. Specifically, both programs demand some level of federal mitigation policy compliance by local governments and yet, the incentives they also provide in access to flooding insurance and discounts are attractive enough to local governments and their citizens to insure more extensive participation, particularly when compared to local incentive programs.
8 In some sense a community either is or is not an NFIP participant. Most of not all of the jurisdictions indicating participation at levels of “small” or “some” extent are listed on FEMA/NFIP websites as participants. Many of these jurisdictions had relatively small flood plains, hence these lower participation rates may represent a respondent’s perception that relatively small parts of their jurisdictions would likely be participants in the NFIP.

49
49
4.10. Critical public and private facilities policies Policies related to the placement of public facilities, public or private critical
facilities and municipal service areas can keep buildings and infrastructure out of hazardous and sensitive environmental areas, as well as shape future development into safer areas. Table 4.11 displays the survey results for these policies. Even a cursory examination suggests that the percentages of local jurisdiction employing these policies are relatively low. Very few jurisdictions made special requirements for locating public and private facilities and infrastructure out of harms way or at least in less risky locations; indeed, 54% of jurisdictions do not have requirements for locating public facilities and infrastructure as well as critical private facilities and infrastructure out of environmentally sensitive or hazards areas. Only 9.7% or 12 jurisdictions have made extensive usage of locating public facilities and infrastructure out of hazardous or environmentally sensitive areas and only 8.9% or 11 jurisdictions extensively require the location of critical private facilities and infrastructure out of hazardous or environmentally sensitive areas.
Table 4.11. Locating public, and private facilities and service areas
Critical public and private facilities not at all small extent
some extent
great extent Total
Requirements for locating public facilities and infrastructure n 67 21 24 12 124
% 54.0 16.9 19.4 9.7 100.0 Requirements for locating critical private facilities and infrastructure 67 24 22 11 124 54.0 19.4 17.7 8.9 100.0 Using municipal service areas to limit development 82 22 14 6 124
66.1 17.7 11.3 4.8 100.0
The least employed among these tools concerned using municipal service areas to limit development. As the data in Table 4.11 suggest only 6 or 4.8% of local jurisdictions extensively employ municipal service areas to limit development. The vast majority of jurisdictions, 66.1% or 82 of the 124, never use municipal service areas to limit development whether as a tool for hazard reduction or simply to guide general development in their communities. On the whole, these findings are somewhat surprising, particularly with respect to the simple locating of public facilities and infrastructure. While there can certainly be issues in using municipal service areas to limit development, particularly in states not requiring or mandating comprehensive or general plans that can justify these limitation, simply insuring that public facilities and infrastructure are not located in environmentally sensitive or hazardous areas not only helps shape and guide development, but also helps reduce future losses and disruption of services in the case of future disasters. Neglecting these issues is surprising.
These findings were not generally consistent with what previous studies that found both with respect to the plan evaluation and policy adoption literature the siting of

50
50
critical public and private facilities policies out of hazardous and sensitive areas are commonly proposed land use tools (Deyle et al., 1998; Olashansky & Kartez, 1998) and with respect to the literature on actual policies enacted by coastal communities which found that locating public structures to reduce storm damage was practiced in nearly 46% of the jurisdictions they surveyed (Godschalk et al 1989 and Beatley et al 1994). 4.11. Public-private sector initiatives
There are a variety of public and private sector initiatives that generally focus on preserving land in either its natural state, as in the case of wetlands or forest land, or preserving its current state as agricultural or otherwise open land. Jurisdictional informants were asked about the use of private sector tools like land trust as well as public-private partnerships for land to preserve environmentally sensitive areas and reduce development in hazards areas. The findings are presented in table 4.12, which shows that the vast majority of local jurisdictions do not make much use of these tools.
Table 4.12 Public-private sector initiatives
Initiatives
not at all
small extent
some extent
great extent Total
Land trusts n 102 9 9 4 124 % 82.3 7.3 7.3 3.2 100.0
Public-private partnerships 99 13 9 3 124 79.8 10.5 7.3 2.4 100.0
Almost no jurisdictions, 3% or 4 of 124, are making extensive use of land trust with an additional 9 or 7.3% are using them somewhat. As can clearly be seen, the vast majority of jurisdictions, 82.3% do not employ land trust strategies at all. Similarly, 99 of 124 or 79.8%, of local jurisdictions do not utilize public-private partnerships either. However, 10.5% have utilized them to a small extent, 7.3% to some extent, and 2.4% extensively. The use of land trust and public-private initiatives have increased since the 1990s in the United States and some indication of that happening, at least informally, in Texas. However, these data still suggest that not many jurisdictions are taking advantage of these approaches along the Texas Coast. 4.12. Employing professionals for building mitigation
Hiring professionals for building mitigation is often needed, particularly when local agencies do not have the professional capacity or abilities to undertake technical assessments related to mitigation. Table 4.13 displays the findings with respect to hiring professional consultants such as planners, geologists and engineers to 1) identify suitable building sites in hazards prone areas, 2) develop special building techniques in hazard prone areas, and 3) conduct windstorm/roof inspection.
The data in Table 4.13 clearly suggest that most local jurisdictions do not employ professionals although there is some variation across the purposes such professionals might be hired. Relatively few local jurisdictions hire geological or engineering

51
51
consultants to determine suitable building sites in hazard prone areas. Specifically, 8.9% or 11 jurisdictions make use of these professional extensively, 11.3% or 14 to some extent, and 21.8% or 27 use this occasionally, while 58.1% or 72 never employ these services.
Table 4.13. Hiring professionals for building standards
Hiring professionals not at all small extent
some extent
great extent Total
Identify suitable building sites n 72 27 14 11 124 % 58.1 21.8 11.3 8.9 100.0
Develop special building techniques 79 20 12 13 124 63.7 16.1 9.7 10.5 100.0 Conduct windstorm/roof inspection 53 24 19 28 124
42.7 19.4 15.3 22.6 100.0
Slightly more jurisdictions, 10.5%, extensively employ professionals to develop special building techniques in hazard prone areas, than extensively employ professionals to identify suitable building sites (8.9%). However, the majority of jurisdictions, 63.7% and 58.1% respectively, do not employ professionals for developing special building techniques or identifying suitable building sites. A somewhat different pattern emerges when examining the use of professionals to conduct windstorm/roof inspection. A sizable percentage of 22.6% of local jurisdictions employ professionals to conduct windstorm/ roof inspections extensively, and additional percentages, 15.3% and 19.4% employ them somewhat or at least to a small extent. However, 42.7% of jurisdictions do not employ professionals at all for these types of inspections. The relatively higher use of professionals for windstorm and roof inspections is likely due to the requirement of structures to be inspected by a professional to qualify for Texas wind insurance coverage under the Texas wind pool.
The findings clearly suggest that hiring professionals for windstorm and roof inspection is by far the most popular of these three mitigation activities when compared to hiring consultants for preventive activities such as developing special building techniques and the siting of structures in hazardous areas. Hence, the results indicate at least some local jurisdictions have sought to improve their resources to address mitigation issues by hiring professionals, although in a limited manner. It should also be noted that, these results are consistent with previous studies that, while focusing on plan evaluation, have shown that relatively few coastal plans specified using geological and engineering consultants to identify suitable building techniques as well as to develop special building techniques (Tang, 2008). So the results for Texas may not be that unusual.

52
52
Figure 4.1. Ranking of Land Use Tools
0.000 0.500 1.000 1.500 2.000 2.500
Density Bonuses Special taxing districts
Impact fees Cluster development
Lower tax to for envir. Protect Transfer dev. rights
Relocating public buildings Land trust environ sensitive areas
Public private Dune protection
Acquisition develop rights/easement Hazard zone signs
Fee simple purchases undeveloped land Performance zoning
Restriction shoreline armoring Coastal/shoreline veg. protection Limited dev. using munic. Services
Limited shoreline dev. Seminars for developers/builders
Professional dev special building haz Habitat protection
Hazard disclosure (real-‐estate) Professional suitability analysis
Protected area regulations Locating critical facilities less haz areas
Ag and open space zoning Locating public facil/utili less haz areas
Overlay zoning dist. Dredging-‐Pilling restrictions
Wetland protection Profession wind/roof inspections
Citizen involvement hazard planning Public hazard education pgms. Special local utility standards
Plan unit development RetroPit building standards Hazard setback ordinances
Community Rating System (Flood) Building codes
Storm water retention Wind hazard building standards Flood standards for buildings
Subdivision ordinances Nat. Flood Ins. Pgm
0.121 0.129 0.153 0.169 0.177 0.177 0.274 0.315 0.323 0.355 0.403 0.403 0.452 0.484 0.524 0.532 0.548 0.597 0.613 0.669 0.677 0.694 0.710 0.742 0.815 0.847 0.847 0.863 0.927 1.032 1.177 1.185 1.282 1.339 1.347 1.363
1.669 1.685 1.734 1.734 1.871
2.298 2.339 2.347

53
53
4.13 Summary of Findings with respect to mitigation policies On the whole the findings clearly suggest that some policies are much more
extensively employed than others, although the overall rates to which many are utilized appear to be quite low. A convenient method for quickly ascertaining the relative “popularity” assessed in terms of the relative usage of each of these planning tools and strategies can be obtained by calculating and comparing the average rating of each. Remembering that the response categories range from “0” indicating the tool/strategy is not employed at all to “3” indicating the method is employed extensively, the closer the average is to three, the more extensively the method is employed across coastal jurisdictions. Figure 4.1 presents a bar graph of the average usage ratings for each planning tool, where the size of the bar represents the average extent of usage. In addition, the planning tools have been rank ordered such that higher ranked and hence more extensively employed tools appear higher on the figure.
The top three planning tools are the only three planning tools having average ranks over two, suggesting that they are on the whole employed somewhat rather extensively across coastal jurisdictions in Texas. These three are: 1) participation in the national flood insurance program (2.35), 2) the use of subdivision ordinances (2.34), and 3) flood standards for buildings/homes (2.30). It is interesting to note that two of the three are related to federal government policies. The NFIP is of course the federal flood insurance program and flood mitigation building standards are also driven by federal flood requirements to insure compliance with NFIP regulations. Subdivision ordnances are, as we saw above extensively employed by 64.5% of jurisdictions and to some extent by an additional 18.6% of jurisdictions; no other general development or land use regulation came close to these usage levels.
The next cluster consists of five tools that, while there significant drop in their average rating from the top three, all have averages that fall between 1.87 and 1.67, suggesting they are employed to a small extent but clearly approaching the “to some extent” levels across jurisdictions. This cluster from high to low include, wind hazard building standards (1.87), storm water retention and building codes who share the same average (1.73), the community rating system (1.69), and hazards setback ordinances (1.67). Three of these five are directly related to building code policies, the first being mandated by the State’s Texas Wind Inspection Program for wind insurance coverage. Of the final two in this cluster, one is again associated with the federal government, the CRS or community Rating System and the final one is a rather typical development/land use regulation – hazard setbacks.
When considering the top ten policies is use among coastal jurisdictions, five (5) are related to building codes, two (2) are federal incentive programs, and three are land use/development regulations. The three land-use policies were subdivision ordinances (2.34), hazard setbacks (1.67) and planned unit developments (1.35). Only about a third or 15 of the 44 policies/tool considered have averages of one (1) or above, suggesting at least some usage among jurisdictions. The remaining 29 planning tools found very little use among coastal jurisdictions. By far the least utilized of these tools include density

54
54
bonuses, special taxing districts, impact fees, cluster development, lower taxes for environmental protection, and transferring development rights. On the whole, these findings suggest a very limited tool bag of land use planning policies are being employed by local jurisdictions along the Texas coast whether directly or indirectly attempting to promote and improve hazard mitigation. 4.14. Comparing municipality and county hazard mitigation policy practices
As discussed earlier, many researchers have investigated various planning practices for reducing risk of hazards between states with planning mandates and states without planning mandates. In addition, some studies have examined state and counties level government policies, and but few have examine different practices between local counties and municipalities. This section will provide a comparison between counties and cities in our sample of Texas coastal jurisdictions. This comparison is important because, as noted above, there are considerable variations in the extent to which cities and counties can enact policies to address hazard mitigation.
Cities in Texas have much greater power than counties because they, subject to size limits and the adoption of a city charter, generally have “home rule” in which they have eminent power to enact laws or more generally, policies regarding land use and development regulations ranging from building codes to taxes. Counties, on the other hand, are much more limited general-purpose governments with much more limited power. However, it must also be noted that some counties have been granted additional powers by the legislature to, for example, regulate development along shorelines around lakes and enhanced ability for subdivision regulations in some areas, and many counties exercise a good deal of influence on some elements of land uses through flood plain management activities. Furthermore in 2009 counties, who so choose, can now establish and enforce building codes, and Harris County, home to Houston, was rather quick to adopt this new ability. In light of these differentials enabling cities to undertake a greater range of mitigation policy actions, it might be expected that they would rank higher than counties in the extensiveness in which they employ these policies.
Tables 4.14 and 4.15 present the average usage scores for each of the 44 policies discussed above. In addition, to examine overall differences between city and county with respect to each of the 12 types of hazard mitigation strategies, a simple index based on the average of the specific policies for each type was calculated and these were also compared. The latter appear in the light gray rows. So, Tables 4.14 and 4.15 presents the overall means for the entire sample, for municipalities and counties respectively, along with a difference between the latter two. A t-test for difference between the city and county means was computed for each of the 44 specific policies and for the 12 policy indices; if the difference between the respective means is statistically significant, the level of significance is indicted on the difference score.

55
55
4.14 County/City Differences in Mitigation Policy/strategy Usage, part 1
Total City and County
Hazard Mitigation Policy/strategy sample City County Difference Subdivision ordinances 2.34 2.49 1.77 0.72** Plan unit development 1.35 1.46 0.92 0.54** Overlay zoning districts 0.86 0.93 0.62 0.31 Ag and open space zoning 0.85 0.94 0.50 0.44^ Performance zoning 0.48 0.56 0.19 0.37^ Hazard setback ordinances 1.67 1.55 2.12 -0.56** Storm water retention 1.73 1.79 1.54 0.25 Land use and development policies 1.33 1.39 1.09 0.29^ Limited shoreline development 0.60 0.54 0.81 -0.27 Restriction shoreline armoring 0.52 0.55 0.42 0.13 Dredging-filling restrictions 0.93 1.00 0.65 0.35 Dune protection 0.35 0.36 0.35 0.01 Coastal/shoreline veg. protection 0.53 0.51 0.62 -0.11 Shoreline regulations 0.59 0.59 0.57 0.02 Wetland protection 1.03 0.99 1.19 -0.20 Habitat protection 0.68 0.63 0.85 -0.21 Protected area regulations 0.74 0.72 0.81 -0.08 Natural resource protection 0.82 0.78 0.95 -0.17 Building codes 1.73 1.98 0.81 1.17** Wind hazard building standards 1.87 2.12 0.92 1.20** Flood standards for buildings 2.30 2.33 2.19 0.13 Retrofit building standards 1.36 1.44 1.08 0.36 Special local utility standards 1.34 1.55 0.54 1.01** Building standards and regulations 1.72 1.88 1.11 0.78** Public hazard education programs 1.28 1.20 1.58 -0.37 Citizen involvement hazard planning 1.19 1.02 1.81 -0.79** Seminars for developers/builders 0.61 0.53 0.92 -0.39* Hazard disclosure (real-estate) 0.69 0.58 1.12 -0.53* Hazard zone signs 0.40 0.34 0.65 -0.32^ Hazard information & awareness programs 0.84 0.73 1.22 -0.48** Fee simple purchases undeveloped land 0.45 0.42 0.58 -0.16 Acquisition develop rights/easement 0.40 0.41 0.38 0.02 Relocating public buildings 0.27 0.23 0.42 -0.19 Property acquisition programs 0.38 0.35 0.46 -0.11
** = p ≤ .01; * = p ≤ .05; ^ = p ≤ .10; all test two-tail
On the whole and perhaps somewhat surprising at first blush, when scanning the results for both tables, is the general finding that there simply are not that many

56
56
statistically significant differences when comparing cities and counties. Of the 12 sets of comparisons, there are no statistically significant variations between cities and counties for 7 different sets. Specifically there are no significant differences found between cities and counties when comparing the specific and combined strategies and programs with respect to shoreline regulations, natural resource protection, property acquisition programs, financial tools, local incentives, federal incentives, or with respect to policies regarding the placement of public and private critical facilities and utilities. Simply stated, there appear to be no real variation between cities and counties with respect to their utilization of these types of mitigation programs or strategies. The major statistically significant variations between cities and counties occur with respect to land use and development policies, building codes and standards, hazard information and awareness programs. There are also some variations between public/private initiatives and use of professionals.
4.15 County/City Differences in Mitigation Policy/strategy Usage, part 2
Total City and County
Hazard Mitigation Policy/strategy sample City County Difference Lower taxes for environmental protect 0.18 0.19 0.12 0.08 Special taxing districts 0.13 0.15 0.04 0.11 Impact fees 0.15 0.15 0.15 0.00 Financial tools 0.15 0.17 0.10 0.06 Transfer development rights 0.18 0.17 0.19 -0.02 Density Bonuses 0.12 0.11 0.15 -0.04 Cluster development 0.17 0.18 0.12 0.07 Local incentive tools 0.16 0.16 0.15 0.00 National flood insurance program 2.35 2.30 2.54 -0.24 Community rating system (Flood) 1.69 1.61 1.96 -0.35 Federal incentive tools 2.02 1.95 2.25 -0.30 Locating public facil/utili less haz areas 0.85 0.90 0.65 0.24 Locating critical facilities less haz areas 0.81 0.87 0.62 0.25 Municipal service areas to limit development 0.55 0.60 0.35 0.26 Critical public and private facilities 0.74 0.79 0.54 0.25 Land trust environ sensitive areas 0.31 0.23 0.62 -0.38* Public-private partnerships 0.32 0.29 0.46 -0.18 Public/Private initiatives 0.32 0.26 0.54 -0.28^ Professional for special building techniques 0.67 0.64 0.77 -0.13 Profession wind/roof inspections 1.18 1.30 0.73 0.57* Professional suitability analysis 0.71 0.69 0.77 -0.08 Hiring professional for building standards 0.85 0.88 0.76 0.12
** = p ≤ .01; * = p ≤ .05; ^ = p ≤ .10; all test two-tail
Focusing first on land use and development regulations there are highly significant differences between counties and cities with respect to subdivision

57
57
ordinances, plan unit development and hazard setbacks, but the pattern is not consistent. While cities are more likely to employ subdivision ordinances and plan unit developments, surprisingly, counties are more likely to employ hazard setbacks. Cities are also more likely to employ agricultural or open space and performance based zoning, but the differences are only marginally significant. Finally, given the inconsistent patterns, it is perhaps somewhat surprising, that overall there is a marginally significant difference between cities and counties with respect to the usage of land use and development policies as assessed by the combined index.
The variations with respect to building codes, given that cities in general much greater capacity to enact building standards and codes, is perhaps not surprising. Cities are much more likely to more extensively employ building codes, wind standards and special utility standards. Furthermore, with respect to the combined index, cities show higher overall utilization of building standards and regulations. It is interesting to note that the mean usage scores for flood standards are quite similar. This is one area that both counties and cities have similar legal status to enforce flood plain management standards across the board.
Perhaps one of the more interesting findings is with respect to hazards information and awareness programs/strategies. There are significant differences with respect to citizen involvement in hazard mitigation planning, seminars for developers/builders, hazard disclosure statements, and hazard zone signs, although the latter is only marginally significant, in which counties, not cities, make more extensive usage of these strategies. In addition, counties also score significantly higher on the combined hazard information and awareness program index. Clearly, counties are more extensively employing these types of strategies.
Only a couple of comparisons are statistically significant in Table 4.15, but they are quite interesting. First, counties are making more extensive use of land trust to protect environmentally sensitive and hazardous areas. Furthermore, counties are also making more usage of public-private initiatives as a whole, although the difference is only marginally significant. However, cities are making more extensive usage of professionals for wind/roof inspections.
It is interesting to combine these overall findings. On the one hand, cities are more extensively employing building code regulations and various forms of land development regulations, while on the other hand counties are more extensively using information dissemination strategies and public-private initiatives. These findings suggest that cities, who generally have home rule, are utilizing more extensively two powerful sets of strategies related to their capabilities, building codes and development regulations. Counties on the other hand, with much more limited abilities depend more extensively on public education programs in the hope that these will stimulate voluntary mitigation adjustments and public/private initiatives in the form of land trusts to help preserve and enhance mitigation through natural resource protection. In some sense, these findings suggest different types of jurisdictions are utilizing strategies open to them to promote hazard mitigation. However, even with that observation, it should also

58
58
be noted that overall the mean values are relatively low for many of these strategies across the board, suggesting that jurisdictions of both types have considerable latitude for increasing how extensively all of these policy sets are being employed.
Interestingly, it must again be pointed out that there were no statistically significant differences between counties and municipalities in regards to seven of the 12 policy sets. When focusing on the combined index scores, city mean scores for shoreline regulations, local incentives tools, financial tools, critical public-private facilities relocation, and professional for building mitigation policies are higher than county scores, but the differences are not statistically significant. Similarly, county mean scores for natural resource protection and property acquisition programs are higher than municipalities, but they too are not statistically significant either. The one additional comparison that is perhaps worth drawing attention is the summary index for federal incentives programs. First, it should be noted that the means for both counties (2.25) and cities (1.95) are higher than any other of the respective sets of county/city index means, suggesting again that these federal incentive programs are among the most extensively employed mitigation programs among jurisdictions along the coast. Second, the federal incentives mean score for counties is higher than cities although it too is not technically statistically significant. On the whole, both counties and cities, particularly counties, are extensively participating in the National Flood Insurance Program (NFIP) and the Community Rating System (CRS). The same cannot be said of most other forms of mitigation programs and policies. Again, coastal jurisdictions are not employing a full portfolio of possible non-structural hazard mitigation polices and strategies.
Previous studies suggest that the type of jurisdiction, between county and city, can have an influence on local coastal zone land use planning and may lead to varied coastal planning outcome (Norton, 2005; Tang, 2008). These data also suggest variations between cities and counties in Texas when utilizing hazard mitigation policies. In particular, cities make stronger and more extensive efforts in using development regulations and building standards, while counties, tend to make more extensive use of programs that either require more involvement and greater reliance on private sector individuals or groups working with the public or to stimulate voluntary hazard mitigation adjustments through information dissemination and awareness programs. However, the findings also demonstrate that both cities and counties in Texas coastal areas are making less use of policies related to shoreline regulations, natural resource protection, local and incentives tools, financial tools, critical public-private facilities relocation, property acquisition, and professionals for building mitigation. The exception to this rule is related to the extensive use of federal incentive programs. Even more sobering is the observation that, as can be seen from the table, the mean scores for many of the 44 planning policies/tools for both county and city jurisdictions are very low, often less, sometimes substantially less than 1, suggesting minimal usage of these approaches at best. These low averages suggest very low usage of a host of policy mitigation tools as a whole among city and county coastal jurisdictions in Texas.

59
59
4.15. Summary This section has examined land use and development practices for the entire sample and the difference between municipalities and counties in using these policies to enhance hazard mitigation in coastal areas. The following is a summary of the findings thus far. First, building standard regulations, federal incentive programs, and a limited number of development regulations (subdivision ordinances and setbacks) were the most extensively used hazard mitigation policies. Second, financial tools and policies that make use of bonuses, taxes and fees are the least extensively employed by the local jurisdictions. These low levels of usage are particularly evident with respect to local incentives tools and property acquisition programs. Third, there are a statistically significant difference between municipalities and counties in employing building standards, development regulations, information dissemination and public-private initiatives. While counties more extensively employ the latter two programs, cities are more likely to employ the former two sets. These findings suggest that the type of jurisdiction and its power, structures and functions do influence the types of hazard mitigation policies and strategies practices at the local level.
Overall, coastal communities in Texas are employing a very limited set of land use and development regulations that the literature has suggested are important for hazard mitigation. Although previous studies on land use planning or comprehensive planning tools have found that some communities are employing a robust set of land use tools and development regulations that are commonly practiced for hazard planning (Deyle et al., 1998; Olashansky & Kartez, 1998), such is not the case in Texas. As suggested by Slotterback (2008, p. 546) “the implementation of planning documents and their associated objectives and strategies, including those related to environmental review, remains a challenge for planner”. This certainly is the case for planners throughout coastal Texas.
5.0 Hazard mitigation policies and strategies among CMZ jurisdictions
As part of the sampling strategy, this research sought to include coastal jurisdictions both within and outside areas in Texas’ coastal management zone (CMZ). The logic in undertaking this sampling strategy is that it would allow for an examination and comparison of what CMZ jurisdictions are doing with respect to the adoption and usage of hazard mitigation strategies in comparison to other non-CMZ coastal jurisdictions. The general expectation is that CMZ jurisdictions, because they are generally more exposed to coastal hazards and also include greater proportions of environmentally sensitive coastal resources such as wetlands, will be much more extensively employing hazard mitigation strategies and policies. The purpose of this section is to first explore whether there are differences between CMZ and non-CMZ jurisdictions and then to examine if there are variations between counties and cities within the CMZ. We begin first with a comparison between CMZ and non-CMZ jurisdictions.

60
60
Tables 5.1 and 5.2 present comparisons between CMZ and non-CMZ jurisdictions for all 44-hazard mitigation policies and for the 12 policy indices. Specifically, in each table the mean usage scores (how extensively the policy is employed) for the total sample of all jurisdictions, CMZ jurisdictions, and non-CMZ jurisdictions are presented. In addition, the difference between the the CMZ and non-CMZ means are computed and if the difference was statistically significant it appears in red. Values appearing in blue are marginally significant, while those in black are not significant. In general, if the difference score is positive, this indicates that the CMZ means is higher, reflecting higher or more extensive usage of the policy among CMZ jurisdictions.
Table 5.1 presents the findings for the first 6 sets of mitigation policies and strategies and there appear to be significant differences between CMZ and non-CMZ jurisdictions for 4 of the 6 sets, with a marginally significant difference in at least one of the remaining sets. First there appears to be absolutely no variations between CMZ and non-CMZ jurisdictions with respect to land use and development policies and regulations. Jurisdictions in both areas make extensive use of subdivision ordinances, limited use of plan unit developments, setbacks and storm water retention requirements, and very limited use of zoning ordinances. There were, not surprisingly, considerable variations with respect to shoreline regulations. Across the board CMZ jurisdictions make much more extensive use of shoreline regulations, than to non-CMZ jurisdictions. It should however be noted that the overall average levels for CMZ jurisdictions ranged from a high of 1.11 for dredging-fill restrictions to a low of .62 for dune protection – these are still relatively low usage scores suggesting that these policies and strategies are being use only to a very limited extent.
There are also interesting and important distinctions with respect to natural resource protection. As anticipated, CMZ jurisdictions are making more extensive use of habitat protection and protected area regulations, along with overall use of natural resource protection strategies than their non-CMZ cousins. However, here again it should be noted that the extent to which these provisions are being employed is relatively low, ranging from a high of 1.22 for wetland protection to a low of 1.04 for protected area regulations. These usage values again fall into the relatively low range, suggesting they are not being employed as extensively as they perhaps could be employed.
There are also quite a number of significant variations between CMZ and non-CMZ jurisdictions when it comes to building codes and standards and they all suggest higher and more extensive usage of these strategies among CMZ jurisdictions. Specifically, not only are CMZ jurisdictions more likely to be making use of more recent building codes, but they are also making more extensive use of wind, flooding, and retrofitting standards and requirements and have, as a result, a significantly higher building code/standard usage index score (the values in gray). Furthermore, and equally important, is the observation that the mean usage levels for CMZ jurisdictions are quite high, with scores ranging from a low of 1.56 for utility standards to a high of 2.57 for

61
61
flood standards. These values suggest much more extensive use of these mitigation practices among CMZ jurisdictions.
Table 5.1. Means and differences in means between CMZ/non-CMZ jurisdictions, part 1.
Hazard Mitigation Policy/strategy Total n=124
CMZ n=54
Non CMZ n=70 Diff.
Subdivision ordinances 2.34 2.31 2.36 -0.04 Plan unit development 1.35 1.54 1.20 0.34 Overlay zoning dist. 0.86 0.94 0.80 0.14 Ag and open space zoning 0.85 0.78 0.90 -0.12 Performance zoning 0.48 0.48 0.49 0.00 Hazard setback ordinances 1.67 1.69 1.66 0.03 Storm water retention 1.73 1.78 1.70 0.08 Development policies/tools 1.33 1.36 1.30 0.06 Limited shoreline dev. 0.60 0.98 0.30 0.68* Restriction shoreline armoring 0.52 0.87 0.26 0.61* Dredging-filling restrictions 0.93 1.11 0.79 0.33 Dune protection 0.27 0.63 0.00 0.63* Coastal/shoreline veg. protection 0.46 1.06 0.00 -1.06* Shoreline regulations 0.59 0.93 0.32 0.61* Wetland protection 1.03 1.22 0.89 0.34 Habitat protection 0.68 1.07 0.37 0.70* Protected area regulations 0.74 1.04 0.51 0.52* Natural Resource Protection 0.82 1.11 0.59 0.52* Building codes 1.73 1.93 1.59 0.34* Wind hazard building standards 1.87 2.31 1.53 0.79* Flood standards for buildings 2.30 2.57 2.09 0.49* Retrofit building standards 1.36 1.83 1.00 0.83* Special local utility standards 1.34 1.56 1.17 0.38 Building Standards and Regulations 1.72 2.04 1.47 0.57* Public hazard education pgms. 1.28 1.56 1.07 0.48* Citizen involvement hazard planning 1.19 1.39 1.03 0.36 Seminars for developers/builders 0.61 0.80 0.47 0.32 Hazard disclosure (real-estate) 0.69 0.83 0.59 0.25 Hazard zone signage 0.40 0.48 0.34 0.14 Hazard Information awareness programs 0.84 1.01 0.70 0.31* Fee simple purchases undeveloped land 0.45 0.56 0.37 0.18 Acquisition develop rights/easement 0.40 0.50 0.33 0.17 Relocating public buildings 0.27 0.35 0.21 0.14 Property Acquisition Programs 0.38 0.47 0.30 0.17
Note: values in blue significant at .1 (two-tailed); values in red significant at .05 (two-tailed).

62
62
CMZ jurisdictions also appear to be making more extensive usage of hazard information and communication programs. However, the only statistically significant difference shows up with respect to public education programs and for the overall index associated with these policies. So while jurisdictions in CMZ areas are making more extensive use of public education programs, when it comes to policies like hazard disclosure and signage, there are no differences. And, yet again, the average usage values for these types of programs are quite low among both CMZ and non-CMZ jurisdictions. The final observation with respect to Table 5.1 is that there is a marginally significant difference between these types of jurisdictions with respect to property acquisition programs, suggesting that CMZ jurisdictions are making slightly more extensive usage of these programs. However, yet again, the overall usage levels are extraordinarily low.
Table 5.2. Differences between CMZ and non-CMZ jurisdictions in how extensively hazard mitigation policies and strategies are employed, part 2.
Hazard Mitigation Policy/strategy Total n=124
CMZ n=54
Not CMZ n=70 Diff.
Lower tax to for enviro. protect 0.18 0.22 0.14 0.08 Special taxing districts 0.13 0.19 0.09 0.10 Impact fees 0.15 0.24 0.09 0.16 Financial Tools 0.15 0.22 0.10 0.11 Transfer dev. rights 0.18 0.22 0.14 0.08 Density Bonuses 0.12 0.20 0.06 0.15* Cluster development 0.17 0.28 0.09 0.19* Incentive Tools: Local 0.16 0.23 0.10 0.14* Nat. Flood Ins. Pgm 2.35 2.50 2.23 0.27 Community Rating System (Flood) 1.69 1.89 1.53 0.36 Incentive Tools: Federal 2.02 2.19 1.88 0.32* Locating public facil/utili less haz areas 0.85 0.80 0.89 -0.09 Locating critical facilities less haz areas 0.81 0.74 0.87 -0.13 Limiting dev. using munic. Services areas 0.55 0.67 0.46 0.21 Critical Public and Private Facilities 0.74 0.73 0.74 0.00 Land trust environ sensitive areas 0.31 0.46 0.20 0.26* Public private 0.32 0.43 0.24 0.18 Public/Private Initiatives 0.32 0.44 0.22 0.22* Professional dev special building haz 0.67 0.83 0.54 0.29 Profession wind/roof inspections 1.18 1.35 1.04 0.31 Professional suitability analysis 0.71 0.70 0.71 -0.01 Hiring professional for building standards 0.85 0.96 0.77 0.20
Note: values in blue significant at .1 (two-tailed); values in red significant at .05 (two-tailed).

63
63
The findings with respect to the last 6 hazard mitigation policies and strategies presented in Table 5.2 suggest that there are no differences between CMZ and non-CMZ jurisdictions with respect to financial tools, critical public and private facilities regulations or the hiring of professionals. However there are some significant differences with respect to incentive tools and public-private initiatives.
CMZ jurisdictions appear to be using both local and federal incentive programs and strategies more extensively than non-CMZ jurisdictions. Specifically, the findings with respect to local incentive programs suggest that CMZ jurisdictions are making more use of density bonuses and cluster developments and overall local incentive policies. However, the fact that the average usage values are so very low (between .20 and .28) among CMZ jurisdictions suggests that we are only detecting exploratory usage at best. However, the levels to which federal program are being employed is much more robust, with means values of 2.5 for NFIP and 1.89 for CRS among CMZ jurisdictions, resulting in an overall statistically significant difference for the combined index assessing the extent to which federal incentive programs are being employed.
On the whole these findings do indeed suggest that as anticipated CMZ jurisdictions are indeed making more extensive use of a variety of hazard mitigation policies and strategies when compared to non-CMZ jurisdictions. Not surprisingly, we found more extensive usage of shoreline regulations, natural resources protection strategies, building codes, public education programs, local and federal incentive programs, and public/private initiatives. These findings are consistent with the fact that CMZ jurisdictions have higher vulnerabilities to coastal hazards and, in general, have higher proportions of environmentally sensitive and hazards areas.
Many of the significant variations between CMZ and non-CMZ jurisdictions are evident in Figure 5.1, which displays the average usage rating scores for each of the 44 different hazard mitigation policies and strategies. The hazard mitigation strategies have been rank ordered from high to low based on the average usage scores for CMZ jurisdictions. The blue bars represent the CMZ community means, while the red bars represent the means for non-CMZ jurisdictions. As can readily be seen, in the majority of cases, the CMZ means (bars) are generally higher and as a result the blue bars generally are longer. The greater the difference in lengthens, the more likely it was that they reflect the statistically significant differences9 noted in our discussions of Tables 5.1 and 5.2. For example beginning at the top some of the statistically significant differences are those for flood standards for buildings, wind hazard building standards, building codes, retrofitting standards, public education programs, habitat protection, shoreline vegetation protection, protected area regulation, limiting shoreline development, and restricting shoreline armoring. But also note, in many of the others the blue bar is longer than the red, but that does not mean the difference is statistically significant.
9 Note, simply because one bar is longer than the other, does not guarantee that the difference is statistically significant. Refer back to Tables 5.1 and 5.2 to confirm statistical significance.

64
64
Figure 5.1. Comparison of CMZ and non-CMZ jurisdictional average usage scores
0.00 0.50 1.00 1.50 2.00 2.50 3.00
Flood standards for buildings Nat. Flood Ins. Pgm
Subdivision ordinances Wind hazard building standards
Building codes Community Rating System RetroPit building standards
Storm water retention Hazard setback ordinances
Special local utility standards Public hazard education pgms.
Plan unit development Citizen involvement hazard planning Professional wind/roof inspections
Wetland protection Dredging-‐Pilling restrictions
Habitat protection Coastal veg. protection
Protected area regulations Limited shoreline dev.
Overlay zoning Restriction shoreline armoring Hazard disclosure (real-‐estate)
Professional dev. special building Seminars for developers/builders Locating public facil/utili less haz
Ag and open space zoning Locating critical facilities less haz Professional suitability analysis
Limited dev. using munic. Services Dune protection
Fee simple purchases Acquisition develop rights/easement
Performance zoning Hazard zone signs
Land trust environ sensitive areas Public private
Relocating public buildings Cluster development
Impact fees Lower tax for envir. protect
Transfer dev. rights Density Bonuses
Special taxing districts
CMZ
non-‐CMZ

65
65
While these findings of differences between CMZ and non-CMZ jurisdictions are noteworthy, it is also important to recognize that while there are differences, as we saw for the entire sample, for many of these policies the overall usage levels can be quite low. When considering just CMZ jurisdictions (blue bars) only 4 policies have average usage values over 2.0 suggesting somewhat extensive usage. Theses are: flood standards for buildings (2.57), NIFP participation (2.5), subdivision ordinances (2.31), and wind hazard standards (2.31). Eight more policies have averages less than 2, but more than 1.5 suggesting at least moderate policy usage by jurisdictions on average. These policies are: building codes (1.93), CRS participation (1.89), retrofitting standards (1.83), storm water retention requirement (1.78), hazard setbacks (1.69) special utility standards (1.56), and plan unit developments (1.54). There are an additional 7 policies that have averages of over 1, including: citizen involvement in planning (1.39), professional wind inspections (1.35), wetland protection (1.22), dredging-fill restrictions (1.11), habitat protection (1.07), shoreline vegetation protection (1.06) and protected area regulations (1.04).
When considering again the top 10 policies the patterns are quite similar to the overall sample, with some minor variations in that five (5) are related to building codes, two (2) are related to federal incentive programs and three area related to land use and development regulations. On the whole when considering only CMZ jurisdictions, 19 of the 44 or 43% have averages greater; a pattern not too different from the 14 that had average usage rating of 1 or more when looking at the whole sample. The remaining 25 policies all have values below 1, often substantially below one. In a similar pattern to that seen when considering the whole sample, the least utilized of these tools include special taxing districts, density bonuses, transfer development rights, lower taxes for environmental protection, impact fees, and cluster developments.
On the whole, we see a good deal that is more positive about actions being taken among CMZ jurisdictions and yet some issues of concern. First we see much more extensive use of federal incentive programs and a greater attention to building codes, both generally and with respect to flooding, wind, and even retrofitting standards. There is also significantly greater attention paid to shoreline regulations and to natural resource protection and preservation. These finding suggest some attempts at keeping inappropriate development out of vulnerable areas and attempts to preserve natural ecosystem services that might pay off in reduce impacts from natural hazards. Significantly, we also appear to see at least initial and significantly greater attempts by CMZ jurisdictions to employing rather novel approaches related to local incentive programs such as density bonuses and cluster developments as well as public/private initiatives related to land trusts.
The issues of concern are related to the narrow portfolio of mitigation policies and strategies being considered and, the related matter, of relatively low implementation rates. Overall emphasis seems to be placed on federal incentive programs and building codes and standards, which may partially be driven by the nature of NFIP and State wind pool requirements. While there is a bit more emphasis placed on natural resource protection and preservation, the extent to which these kinds of strategies are being implemented are very low. Furthermore, more innovative land use and development

66
66
strategies can provide incentives and bonuses for developers and landowners to refrain from developing in high hazard or environmentally sensitive areas are greatly neglected. And finally programs and policies that seek, through more market based incentives and disincentives based on taxes and impact fees are particularly neglected and orphaned. As a consequence, the final result is a very limited tool bag of hazard mitigation policies and strategies being employed by local jurisdictions along the Texas coast whether considering all coastal jurisdictions or just jurisdictions within the coastal management zone. Seeking to expand and enrich this tool bag will certainly enhance the mitigation possibilities being considered.
References Acock, A.C. (2006). A Gentle Introduction to Stata. College Station, Texas: Stata Press. Agresti, A., & Finlay, B. (1997). Statistical methods for the social sciences. Upper
Saddle River, NJ: Prentice-Hall, Inc. Alaerts, G. J., Hartvelt, F., & Patorni, F. (1999). Water sector capacity building:
concepts and instruments. Rotterdam; AA Balkema, 1999, 455 p. Alexander, D. E. (2000). Confronting catastrophe: new perspectives on natural
disasters: Oxford University Press, USA. Alexander, D. (1993). Natural disasters. New York: Chapman & Hall. Baker, E.J. (2008). Are We Any Safer? Comprehensive Plan Impacts on Hurricane
Evacuation and Shelter Demand in Florida. Coastal Management, 36, 294-317. Basolo, V., Steinberg, L. J., Burby, R. J., Levine, J., Cruz, A. M., & Huang, C. (2009).
The effects of confidence in government and information on perceived and actual preparedness for disasters. Environment and Behavior, 41(3), 338.
Beatley, T. (2009). Planning for Coastal Resilience: Best Practices for Calamitous Times: Island Press.
Beatley, T., Brower, D. J., & Schwab, A. K. (2002). An introduction to coastal zone management (2nd ed.). Washington, D.C.: Island Press.
Berke, P. R. (1998). Reducing natural hazard risks through state growth management. Journal of the American Planning Association, 64(1), 76-87.
Berke, P., & French, S. (1994). The influence of state planning mandates on local plan quality. Journal of Planning Education and Research, 13(4), 237.
Berke, P. R., & Roenigk, D. J. (1996). Enhancing plan quality: Evaluating the role of state planning mandates for natural hazard. Journal of Environmental Planning & Management, 39(1), 79.
Berke, P., Crawford, J., Dixon, J., & Ericksen, N. (1999). Do cooperative environmental planning mandates produce good plans? Empirical results from the New Zealand experience. Environment and planning B, 26, 643-664.
Berke, P. R., Backhurst, M., Laurian, L., Crawford, J., and Dixon, J. (2006). What makes plan implementation successful? An evaluation of local plans and implementation practices in New Zealand. Environment and Planning B: Planning and Design 33 (4): 581-600.

67
67
Berke, P. R., & Campanella, T. J. (2006). Planning for postdisaster resiliency. The Annals of the American Academy of Political and Social Science, 604(1), 192.
Bernd-Cohen, T., & Gordon, M. (1999). State coastal program effectiveness in protecting natural beaches, dunes, bluffs, and rocky shores. Coastal Management, 27(2/3), 187-217.
Blake, E. S., & Gibney, E. J. (2011). The deadliest, costliest, and most intense United States tropical cyclones from 1851 to 2006 (and other frequently requested hurricane facts). Miami, FL: NOAA/National Weather Service, National Centers for Environmental Prediction, National Hurricane Center.
Board on Natural Disasters (1999). Mitigation emerges as major strategy for reducing losses caused by natural disasters. Science, 284(5422), 1943-1947.
Boruff, B. J., Emrich, C., & Cutter, S. L. (2009). Erosion hazard vulnerability of us coastal counties. Journal of Coastal Research, 21(5), 932-842.
Bowman, A. O. M., & Kearney, R. C. (2010). State and local government: Wadsworth Pub Co.
Brody, S. D. (2003). Implementing the principles of ecosystem management through local land use planning. Population and Environment, 24(6), 511-540.
Brody, S. D., Godschalk, D. R., & Burby, R. J. (2003). Mandating citizen participation in plan making: Six strategic planning choices. Journal of the American Planning Association, 69(3), 245-264.
Brody, S. D., & Highfield, W. E. (2005). Does planning work? : Testing the implementation of local environmental planning in Florida. Journal of the American Planning Association, 71(2), 159-175.
Brody, S., Zahran, S., Highfield, W., Grover, H., & Vedlitz, A. (2008). Identifying the impact of the built environment on flood damage in Texas. Disasters, 32(1), 1-18.
Brody, S. D., Kang, J. E., & Bernhardt, S. (2010). Identifying factors influencing flood mitigation at the local level in Texas and Florida: the role of organizational capacity. Natural hazards, 52(1), 167-184.
Burby, R. J. (1998). Cooperating with nature: Confronting natural hazards with land-use planning for sustainable communities. Washington D.C.: National Academies Press.
Burby, R. J. (2006). Hurricane Katrina and the paradoxes of government disaster policy: bringing about wise governmental decisions for hazardous areas. The Annals of the American Academy of Political and Social Science, 604, 171-191
Burby, R. J. (2001). Flood insurance and floodplain management: the US experience. Global Environmental Change Part B: Environmental Hazards, 3(3-4), 111-122.
Burby, R.J. (2003). Making Plans That Matter: Citizen Involvement and Government Action. Journal of the American Planning Association, 69(1), 33-50.
Burby, R. J., & Dalton, L. C. (1994). Plans can matter! The role of land use plans and state planning mandates in limiting the development of hazardous areas. Public administration review, 54(3), 229-238.
Burby, R., & May, P. (1997). Making governments plan: State experiments in managing land use: Johns Hopkins University Press.

68
68
Burby, R., & May, P. (1998). Intergovernmental Environmental Planning: Addressing the Commitment Conundrum. Journal of Environmental Planning and Management, 41(1), 95-110.
Burby, R., Berke, P., Dalton, L., DeGrove, J., French, S., Kaiser, E., . . . Roenigk, D. (1993). Is State-Mandated Planning Effective? Land Use Law and Zoning Digest, 45(10), 3-9.
Burby, R., & Dalton, L. (1994). Plans can matter! The role of land use plans and state planning mandates in limiting the development of hazardous areas. Public Administration Review, 229-238
Carr, T.L. (2007). A Study of Local Governments Participating in the Pre-Disaster Mitigation (PDM) Program and Population Served. Journal of Homeland Security and Emergency Management, 4 (2), 1-34.
Crossett, K., Culliton, T., Wiley, P., & Goodspeed, T. (2004). Population trends along the coastal United States. 1980-2008. Coastal trends report series. NOAA, National Ocean Service. Management and Budget Office, Special Projects. Retrieved March 28, 2011 from http://oceanservice.noaa.gov/programs/mb/pdfs/coastal_pop_trends_complete.pdf
Carmines, E. G., & Zeller, R. A. (1979). Reliability and validity assessment Beverly Hills, CA: Sage Publications.
Chaskin, R. J. (2001). Building community capacity. Urban Affairs Review, 36(3), 291. Christensen, R. K., & Gazley, B. (2008). Capacity for public administration: Analysis of
meaning and measurement. Public Administration and Development, 28(4), 265-279.
Col, J-M. (2007). Managing disasters: the role of local government. Public Administration Review 67: 114-124
Conrad, F.G. and Schober, M. ed. (2007). Envisioning the Survey Interview of the Future. New York: John Wiley & Sons, Inc
Costanza, R., Mitsch, W.J. and Day, J.W. Jr. 2006. A new vision for New Orleans and the Mississippi delta: applying ecological economics and ecological engineering. Front. Ecol. Env. 4, 465–472.
The National Academy of Sciences (2007) Coastal Hazards: Highlights of National Academies Report. Washington DC: The National Academy of Sciences.
Crossett, K. M., Culliton, T. J., Wiley, P. C., & Goodspeed, T. R. (2004). Population trend along the coastal United States:1980-2008 . Retrieved April 15, 2011, from www.oceanservice.noaa.gov.
Dalton, L. C. (1989). Emerging knowledge about planning practice. Journal of Planning Education and Research, 9 (1), 29-44.
Dalton, L. C., & Burby, R. J. (1994). Mandates, plans, and planners. [Article]. Journal of the American Planning Association, 60(4), 444.
Daniels, T., & Daniels, K. (2003). The environmental planning handbook: for sustainable communities and regions. Chicago, Ill: American Planning Association.
Davis, B.C. (2004). Regional planning in the US coastal zone: a comparative analysis of 15 special area plans. Ocean and Coastal Management, 47, 79-94.

69
69
De Loe, R. C., Di Giantomasso, S. E., & Kreutzwiser, R. D. (2002). Local capacity for groundwater protection in Ontario. Environmental Management, 29(2), 217-233.
Deyle, R. E., Chapin, T. S., & Baker, E. J. (2008). The Proof of the Planning Is in the Platting: An Evaluation of Florida's Hurricane Exposure Mitigation Planning Mandate. Journal of the American Planning Association, 74(3), 349-370.
Dillman, D. A., Smyth, J.D. and Christian, L.M. (2008). Internet, Mail, and Mixed-Mode Survey. New York: John Wiley & Sons, Inc.
Eisner, R. K. (2005). Planning for Tsunami: Reducing Future Losses Through Mitigation. Natural Hazards, 35, 155-162.
FEMA. (2000). Planning for a sustainable future: the link between hazard mitigation and livability. Washington, D.C.: Federal Emergency Management Agency
FEMA. (2008). Understanding your Risks: Identifying hazards and estimating losses. FEMA 386-2, Washington, D.C.: Federal Emergency Management Agency.
FEMA. (2007). Local multi-hazard mitigation planning guidance. Retrieved April 25, 2011, http://training.fema.gov/EMIWeb/CRS/2007%20CRS%20Coord%20Manual%20Entire.pdf
FEMA. (2008). National Flood Insurance Program and Community Rating System: Coordinator’s manual. Retrieved September 20, 2011, from http://www.fema.gov/library/viewRecord.do?id=154
FEMA (2011). Fact sheet: Mitigation Value to Society. Retrieved August 18, 2011, from http://www.fema.gov/pdf/media/factsheets/2011/mit_value.pdf
Fink, A. (2009). How to conduct surveys: A step-by-step Guide (4th Ed). Thousand Oaks, CA: Sage Publications, Inc.
Forbes, K., & Broadhead, J. (2007). The role of coastal forests in the mitigation of tsunami impacts. RAP publication I. Bangkok: FAO. Retrieved April 25, 2011, from www.fao.org/docrep/010/ai389e/ai389e00.htm
Gargan, J. J. (1981). Consideration of local government capacity. Public administration review, 41(6), 649-658.
Gargan, J. J. (1997). Handbook of local government administration. Boca Raton, FL: CRC Press
George, D., & Mallery, P. (2003). SPSS for Windows step by step: A simple guide and reference. 11.0 update (4th ed.). Boston: Allyn & Bacon.
Ge, Y., Peacock, W. G., & Lindell, M. K. (2011). Florida households’ expected responses to hurricane hazard mitigation incentives. Risk analysis, 31(10), 1676.
Godschalk, D., Beatley, T., & Berke, P. (1998). Natural hazard mitigation: Recasting disaster policy and planning. Washington, D.C.: Island Press.
Godschalk, D. R., Brower, D. J., & Beatley, T. (1989). Catastrophic coastal storms: Hazard mitigation and development management. Durham, NC: Duke University Press
Godschalk, D. R., Norton, R., Richardson, C., & Salvesen, D. (2000). Avoiding coastal hazard areas: Best state mitigation practices. Environmental Geosciences, 7(1), 13-22.

70
70
Grindle, M. S., & Hilderbrand, M. E. (1995). Building sustainable capacity in the public sector: what can be done? Public Administration and Development, 15(5), 441-463.
Handmer, J. W., & Dovers, S. (2007). The handbook of disaster and emergency policies and institutions: Earthscan/James & James.
Hartvelt F. and Okun ,D.A. (1991) Capacity building for water resources management. Water Int 16:176–183
Heinz, H. (1999). The hidden costs of coastal hazards: Implications for risk assessment and mitigation: Island Press.
Henstra, D., & McBean, G. (2004). The role of government in services for natural disaster mitigation. Institute for Catastrophic Loss Reduction Research Paper Series.
Hershman, M. J., Good, J. W., Bernd-Cohen, T., Goodwin, R. F., Lee, V., & Pogue, P. (1999). The effectiveness of coastal zone management in the united states. Coastal Management, 27, 2(3), 113-138.
Hoch, C. 2002. Evaluating plans pragmatically. Planning Theory 1 (1): 53-75. Holway, J. M., & Burby, R. J. (1990). The effects of floodplain development controls on
residential land values. Land Economics, 66(3), 259-271. Honadle, B. W. (1981). A capacity-building framework: A search for concept and
purpose. Public administration review, 41(5), 575-580. Honadle, B. W. (2001). Theoretical and practical issues of local government capacity in
an era of devolution. Journal of Regional Analysis and Policy, 31(1), 77-90. Hyndman, D., & Hyndman, D. (2006). Natural hazards and disasters: Cengage
Learning. Ingraham, P. W., Joyce, P. G., & Donahue, A. K. (2003). Government performance:
Why management matters: Johns Hopkins Univ Pr. Ivey, J. L., Smithers, J., de Loë, R. C., & Kreutzwiser, R. D. (2004). Community
capacity for adaptation to climate-induced water shortages: Linking institutional complexity and local actors. Environmental Management, 33(1), 36-47.
Kang, J. E. (2009). Mitigating flood loss through local comprehensive planning in florida. Doctor of Philoshopy Doctoral dissertation, Texas A&M University, College Station.
Klee, G. (1999). The coastal environment: Toward integrated coastal and marine sanctuary management: Prentice-Hall, Inc.
Kunreuther, H. (2006). Disaster mitigation and insurance: Learning from Katrina. The Annals of the American Academy of Political and Social Science, 604(1), 208.
Kunreuther, H., & Pauly, M. (2004). Neglecting Disaster: Why Don't People Insure Against Large Losses? Journal of Risk & Uncertainty, 28(1), 5-21.
Lay, T., Kanamori, H., Ammon, C. J., Nettles, M., Ward, S. N., Aster, R. C., . . . Butler, R. (2005). The great sumatra-andaman earthquake of 26 december 2004. Science, 308(5725), 1127.
Lindell, M. K. and Carla, C.S. (2003). Assessing community impacts of natural disasters. Natural Hazards Review, 176-185.

71
71
Lindell, M. K., & Perry, R. W. (2000). Household adjustment to earthquake hazard. Environment and Behavior, 32(4), 461.
Lindell, M., Prater, C., & Perry, R. (2006). Fundamentals of emergency management. Emmitsburg MD: Federal Emergency Management Agency Emergency Management Institute.[Available at training. fema. gov/EMIWeb/edu/fem. asp].
May, P. (1993). Mandate design and implementation: Enhancing implementation efforts and shaping regulatory styles. Journal of Policy Analysis and Management, 12(4), 634-663.
May, P. J., & Deyle, R. E. (1998). Governing land use in hazardous areas with a patchwork system. Cooperating with Nature: Confronting Natural Hazards with Land-Use Planning for Sustainable Communities, 57-84.
Mayunga, J. S. (2009). Measuring the measure: A multi-dimensional scale model to measure community disaster resilience in the U. S. Gulf Coast region.
Mileti, D. S. (1999). Disaster by design. Washington, D.C.: Joseph Henry Press. Morgan, P., & Taschereau, S. (1996). Capacity and institutional assessment, framework,
methods and tools for analysis. Hull: Policy Branch, CIDA. Multihazard Mitigation Council (2005). Natural Hazard Mitigation Saves: Independent
Study to Assess the Future Benefits of Hazard Mitigation Activities, Washington DC: Volume 2-Study Documentation.
Multihazard Mitigation Council. (2002). Parameters for an independent study to assess the future benefits of hazard mitigation activities. Washington, DC: National Institute of Building Sciences.
NOAA. 1998 (on-line). "Preserving Waterfronts for Water Dependent Uses" by Kenneth Walker and Matt Arnn. NOAA's State of the Coast Report. Silver Spring, MD: NOAA. Retrieved April, 2005 from http://oceanservice.noaa.gov/websites/retiredsites/sotc_pdf/WDU.PDF
Ward, S. & Main, C, (1998) "Population at Risk from Natural Hazards". NOAA's State of the Coast Report. Silver Spring, MD: NOAA. Retrieved March 29, from http://state_of_coast.noaa.gov/bulletins/html/par_02/par.html
NOAA (2010), Hazard and Resiliency Planning: Perceived Benefits and Barriers among Land Use Planners, retrieved April 25 from www.csc.noaa.gov/publications/.../NOAACSCResearchReport.pdf
Norton, R. K. (2005a). More and Better Local Planning. Journal of the American Planning Association, 71(1), 55-71.
Norton, R. K. (2005b). Local Commitment to State-Mandated Planning in Coastal North Carolina. Journal of Planning Education and Research, 25(2), 149-171.
Nelson, A. C., & French, S. P. (2002). Plan quality and mitigating damage from natural disasters: A case study of the Northridge earthquake with planning policy considerations. Journal of the American Planning Association, 68(2), 194-207.
Olshansky, R. B., & Kartez, J. D. (1998). Managing land use to build resilience. Cooperating with Nature: Confronting Natural Hazards with Land-Use Planning for Sustainable Communities, 167-202.
Olshansky, R. B. (2001). Land Use Planning for Seismic Safety. Journal of the American Planning Association, 67(2), 173-185.

72
72
Oregon Natural Hazards Workgroup (2006). Cannon Beach Post-Disaster Recovery Planning Forum Summary Report. Oregon Natural Hazards Workgroup – Community Service Center, University of Oregon
Peacock, W. G. (2003). Hurricane mitigation status and factors influencing mitigation status among Florida’s single-family homeowners. Natural Hazards Review, 4, 149.
Peacock, W. G., Kang, J. E., Husein, R., Burns, G. R., Prater, C., Brody, S., & Kennedy, T. (2009). An Assessment of Coastal Zone Hazard Mitigation Plans in Texas. College Station: Hazard Reduction and Recovery Center, Texas A&M University
Prater, C. S., & Lindell, M. K. (2000). Politics of hazard mitigation. Natural Hazards Review, 1(2), 73-82.
Preuss, J. (2003) Coastal area planning and management. Retrieved September 19, 2009 from FAO Publication, http://www.fao.org/docrep/010/ag127e/AG127E10.htm.
Pielke Jr, R. A., Gratz, J., Landsea, C. W., Collins, D., Saunders, M. A., & Musulin, R. (2008). Normalized hurricane damage in the United States: 1900–2005. Natural Hazards Review, 9, 29.
Robins, L. (2008). Capacity building for natural resource management: lessons from risk and emergency management. Australasian Journal of Environmental Management, 15(1), 6.
Rovins, J. E. (2009). Effective Hazard Mitigation: Are Local Mitigation Strategies Getting the Job Done? FEMA. Retrieved from http://training.fema.gov
Sargeant, S. L., Transportation, W. D. o., Division, B. M. I. P. N., & Commission, W. S. T. (2004). Shoreline armoring research program: Phase ii--conceptual model development for bank stabilization in freshwater systems: Washington State Dept. of Transportation.
Schneider, A., & Ingram, H. (1990). Behavioral assumptions of policy tools. The Journal of Politics, 52(02), 510-529.
Schneider, S. (1995). Flirting with disaster: Public management in crisis situations: ME Sharpe Inc.
Schwab, J. (2010). Hazard mitigation: Integrating best practices into planning. Planning Advisory Service Report, 560.
Schwab, A., Eschelbach, K., & Brower, D. (2007). Hazard mitigation and preparedness. Danvers, MA: Wiley.
Srivastava, R., & Laurian, L. (2006). Natural hazard mitigation in local comprehensive plans: The case of flood, wildfire and drought planning in Arizona. Disaster Prevention and Management, 15(3), 461-483.
State of Texas Hazard Mitigation Plan 2010-2013, retrieved April 25 from ftp://ftp.txdps.state.tx.us/dem/mitigation/txHazMitPlan.pdf
Tang, Z. (2008). Evaluating local coastal zone land use planning capacities in California. Ocean and Coastal Management, 51(7), 544-555.
Tang, Z. (2009). How are California local jurisdictions incorporating a strategic environmental assessment in local comprehensive land use plans? Local Environment, 14(4), 313-328.
Tang, Z., Lindell, M. K., Prater, C. S., & Brody, S. D. (2008). Measuring Tsunami planning capacity on US Pacific coast. Natural Hazards Review, 9, 91.

73
73
Tang, Z., Lindell, M. K., Prater, C., Wei, T., & Hussey, C. M. (2011). Examining Local Coastal Zone Management Capacity in US Pacific Coastal Counties. Coastal Management, 39(2), 105-132.
Texas Municipal League (2011). Handbook of Municipal Government. Retrieved on April 25, 2011 from https://www.tml.org/Handbook-M&C/Chapter1.pdf
TGLO (2011) Grants and Funding. Retrieved March 25, 2011 http://www.glo.texas.gov/what-we-do/caring-for-the-coast/grants-funding/index.html
TXDPS (2011) FEMA-Approved Local Mitigation Plans (LMPs). Retrieved April 25, 2011 http://www.txdps.state.tx.us/dem/documents/FEMAApprovedMAPs.pdf
Walker, K., & Arnn, M. (1998). Preserving waterfronts for water dependent uses. NOAA's state of the coast report, National Oceanic and Atmospheric Administration, Silver Spring, MD. Retrieved April 25, 2011 from http://state-ofcoast.noaa.gov/bulletins/html/wdu_11/wdu.html
Williams, A., & Micallef, A. (2009). Beach Management: Principles and Practice. Sterling, VA: Earthscan.
Wilson, J. P. (2009). Policy Actions of Texas Gulf Coast Cities to Mitigate Hurricane Damage: Perspectives of City Officials. Applied Research Projects, 312. http://ecommons.txstate.edu/arp/312
Woods & Poole and NOAA, 2010, The Economic Consequences of a Closed Beach Communities. Retrieved March 28, 2011 from http://stateofthecoast.noaa.gov/population/hotspots.html
Yu-Lee, R. T. (2002). Essentials of capacity management: John Wiley & Sons Inc.

74
Appendix 1
TEXAS COASTAL HAZARD MITIGATION POLICY SURVEY HAZARD REDUCTION & RECOVERY CENTER
TEXAS A&M UNIVERSITY
2010
The purpose of this survey is to gather information about the types of hazard mitigation policies and actions coastal jurisdictions (e.g., municipalities and counties) in Texas are employing to help reduce their vulnerability to natural disasters such as hurricanes and coastal flooding. Hazard mitigation refers to actions taken to reduce future disaster impacts. Often this is interpreted as structural actions like levees, dykes, or flood control infrastructure. However, the primary focus of this survey is on more "non-‐structural" mitigation practices often associated with general community planning efforts such as promoting development in non-‐hazard areas, building codes that are appropriate for high wind risks, involvement in the National Flood Insurance Program, and promoting community awareness. Since our focus is on these planning efforts, questions will be asked about general municipal/county planning as well as planning focused on mitigation. The individual information we gather will remain confidential, however the broader findings and patterns will be examined and shared with you and other participants so that we all can better understand what types of actions and policies are being employed by jurisdictions along the Texas Coast. We hope that this information will better help all of us make our communities more resilient. Please answer the following questions to the best of your ability. Most of the questions are factual with the goal of simply collecting the most reliable and accurate information as possible. So, if you need to consult with co-‐workers regarding some of these questions, please feel free to do so. Throughout the survey, the questions are being asked with respect to "your jurisdiction." If you are a city official, this refers to your city or municipality. If you are a county official, this refers to the county itself and unincorporated areas under its jurisdiction, not to the cities that may reside in your county. Overall there are 31 questions. It should take you about 20-‐25 minutes to complete the survey. We appreciate your time and efforts at completing this survey. If you have questions, please contact Ama Husein at 210.204.0029 or [email protected] or Dr. Walter Gillis Peacock at 979.845.7813 or [email protected]. If you send an email, please put "Survey Question" in the subject line.

75
Section I. The following section asks some general questions about your jurisdiction and some land-‐use planning issues.
1. To what extent are each of the following issues considered to be high priorities in your jurisdiction?
Not Important at all
Somewhat Important Important Very
Important
a. Economic Development b. Land Use c. Housing d. Infrastructure (e.g., water, sewer,
electric power e. Environmental protection f. Disaster reduction g. Transportation h. Recreation
2. Does your jurisdiction have a comprehensive or general plan? a. Yes b. No
3. Does your jurisdiction have it own hazard mitigation plan (not a emergency preparedness plan) or is it participating as part of a county or regional hazard mitigation plan? NOTE: If you have more than one, please select all that is applied. a. No b. Yes, stand alone hazard mitigation plan (or hazard mitigation action plan) c. Yes, part of regional (multi-‐jurisdictional) hazard mitigation plan (or hazard
mitigation action plan) d. Yes, others__________________________
4. Does your jurisdiction have zoning ordinances? a. Yes b. No
5. Does your jurisdiction have a building code and if yes, what type of code has been adopted? a. No b. Yes, 2009 IRC/IBC c. Yes, 2006 IRC/IBC d. Yes, 2003 IRC/IBC e. Yes, 2000 IRC/IBC f. Yes, SBC g. Yes, Others_________________________

76
Section II. Policy Questions 6-‐14 ask about specific policies or actions that jurisdictions may employ in their general planning strategy or for specific hazard mitigation planning. Please indicate how extensively your jurisdiction employs each on the scale ranging from (not at all) through (to a very great extent) with a (√) or (X). If your jurisdiction does not have the authority (as may be the case for counties) to use a particular policy or action, simple select the response indicating that fact. We are aware that many jurisdictions may not employ all of the strategies mentioned below, but to get a clear picture of what is being used, we need to gather information on all of them.
6. To what extent are each of
the following issues considered to be high priorities in your jurisdiction?
Not at all
A Small extent
To Some extent
Very great extent
Not Within this
jurisdiction’s authority
a. Residential Subdivision Ordinances b. Planned unit development c. Special overlay districts d. Agricultural or open space zoning e. Performance zoning f. Hazard setback ordinances
(shoreline, flood plain) g. Storm water retention requirements h. Environmental impact assessment
requirements i. Limitation of shoreline development
to water-‐dependent uses j. Restrictions on shoreline armoring
(e.g., levees, seawalls) k. Restrictions on dredging/filling l. Dune protection regulations m. Wetlands protection regulations n. Coastal vegetation protection
regulations o. Requirements for habitat
protection/restoration

77
7. To what extent has your jurisdiction used the following building standards?
Not at all
A Small extent
To Some extent
Very great extent
Not Within this
jurisdiction’s authority
a. Special local standards for wind hazard resistance for new home construction (e.g. hurricane straps, impact resistant windows, reinforced garage doors)
b. Special local standards for flooding hazards for new home construction (e.g. home elevation, flood vents, shields)
c. Special local hazard retrofit standards for existing buildings
d. Special local utility codes (e.g., raised meters, raised air-‐conditioner platforms)
8. To what extent has your
jurisdiction used the following property acquisition programs?
Not at all
A Small extent
To Some extent
Very great extent
Not Within this
jurisdiction’s authority
a. Fee simple purchase of undeveloped lands in environmentally sensitive/hazardous areas
b. Acquisition of development rights or easements in environmentally sensitive/hazardous areas
c. Relocating existing buildings from environmentally sensitive/hazardous areas
9. To what extent has your jurisdiction used the following incentive tools?
Not at all
A Small extent
To Some extent
Very great extent
Not Within this
jurisdiction’s authority
a. Transfer of development rights from environmentally sensitive/hazardous areas
b. Density bonuses in environmentally sensitive/hazardous areas
c. Clustered development in environmentally sensitive/hazardous areas
d. Participation in the National Flood Insurance Program (NFIP)

78
e. Participation in the FEMA community rating system (CRS)
10. To what extent has your jurisdiction used the following financial tools?
Not at all
A Small extent
To Some extent
Very great extent
Not Within this
jurisdiction’s authority
a. Lower tax rates for preserving environmentally sensitive/hazardous areas as open space or limited development intensity
b. Special tax assessment for districts for environmentally sensitive/hazardous areas
c. Impact fees or special assessments for development of environmentally sensitive/hazardous areas
11. To what extent has your
jurisdiction used the following information dissemination strategies?
Not at all
A Small extent
To Some extent
Very great extent
Not Within this
jurisdiction’s authority
a. Public education for hazard mitigation (e.g., brochures, posters, public service announcements)
b. Citizen involvement in hazard mitigation planning (e.g., public hearings, meetings with community groups)
c. Seminars on hazard mitigation practices for developers and builders
d. Hazard disclosure requirements in real estate transactions
e. Hazard zone signs
12. To what extent has your jurisdiction used the following
Not at all
A Small extent
To Some extent
Very great extent
Not Within this
jurisdiction’s authority
a. Requirements for locating public facilities and infrastructure in less

79
environmentally sensitive/hazardous areas (e.g., capital improvement plans)
b. Requirements for locating critical private facilities and infrastructure in less environmentally sensitive/hazardous areas
c. Using municipal service areas to limit development in environmentally sensitive/hazardous areas
13. To what extent has your
jurisdiction used the following private-‐public sector initiatives?
Not at all
A Small extent
To Some extent
Very great extent
Not Within this
jurisdiction’s authority
a. Land trusts for environmentally sensitive/hazardous areas
b. Public-‐private partnerships for environmentally sensitive/hazardous areas
14. To what extent have geologists, engineers, and other professionals been employed or worked for your jurisdiction to:
Not at all
A Small extent
To Some extent
Very great extent
Not Within this
jurisdiction’s authority
a. Identify suitable building sites in hazard prone areas
b. Develop special building techniques for hazard prone areas
c. Conduct windstorm/roof inspection

80
Section III: Hazard Experience The next two questions ask you to roughly assess about how much damage or how likely your jurisdiction will be impacted by different types of hazards. We realize that you may not be a trained specialist when it comes to these hazards, but we are simply asking you to give your best judgment or assessment. Also, some jurisdictions may not be at risk to some of these hazards, in those cases, simply answer "never."
15. In the past 10 years, how much
damage has your jurisdiction experienced from:
Never Slight Moderate Major
a. Flood b. Coastal storms (including hurricanes) c. Tornados d. Hail e. Excessive heat f. Drought g. Wildfires h. Thunderstorms i. Coastal Erosion j. Technical hazards (e.g., industrial disaster,
dam/levee failure, etc.) k. Subsidence l. Sea-‐level rise m. Others (please specify):
16. In the next 10 years, to what
extent do you thing the following hazards impact your jurisdiction?
Not at all
Not Very Likely
Somewhat Likely
Very Likely
i. Flood j. Coastal storms (including hurricanes) k. Tornados l. Hail m. Excessive heat n. Drought o. Wildfires p. Thunderstorms q. Coastal Erosion r. Technical hazards (e.g., industrial disaster,
dam/levee failure, etc.) s. Subsidence t. Sea-‐level rise u. Others (please specify):

81
Section IV: Jurisdictional Capacities and Resources The following questions ask about the capacities and resources your jurisdiction has or might employ for undertaking hazard mitigation planning activities.
17. How would you rate the capacity of your jurisdiction to undertake hazard mitigation planning in the following areas?
Poor Fair Good Very Good Excellent
a. Budget adequacy b. In-‐house technical expertise (e.g., GIS,
water/storm water engineer, building inspector)
c. Access to senior appointed and elected officials
d. Enforcement authority e. Business communities (e.g., chambers
of commerce, small businesses)
18. Please indicate the general
support for hazard mitigation planning exhibited by the following groups in your jurisdiction:
Poor Fair Good Very Good Excellent
a. Elected officials b. Jurisdiction's staff as a whole c. Jurisdiction's planning staff/personnel d. Jurisdiction's emergency management
staff/personnel
e. Business communities (e.g., chambers of commerce, small businesses)
f. Special districts (e.g., independent school district, utility district)
g. Citizens/general population
19. Rate the frequency with which any jurisdictional staff/personnel have been able to attend the following training opportunities addressing hazard mitigation issues with the past 3 years.
Not at all
A Small extent
To Some extent
Very great extent
a. Training by FEMA b. Technical training for computer programs (e.g.
HAZUS, GIS, etc.) c. Training by professional association (e.g., American
Planning Association, Texas Planning Association,

82
National Emergency Management Association) d. Other (please specify):
20. Please rate the degree to which your
jurisdiction has used each of the following financial resources for funding hazard mitigation actions and/or for disaster recovery efforts.
Not at all
A Small extent
To Some extent
Very great extent
a. Community Development Block Grants (CDBG) b. Texas Coastal Management Program Grants (TGLO) c. Section 406 Hazard Mitigation Grant Program d. Small Business Administration Disaster Assistant
Program e. Pre-‐Disaster Mitigation Loan Program f. Local jurisdictional funds g. Other (please specify): 21. Please rate the degree to which your
jurisdiction uses each of the following data sources in map or digital form for general or hazard mitigation planning.
Not at all
A Small extent
To Some extent
Very great extent
a. Aerial photos/satellite images b. Topographical maps c. Jurisdictional land use maps or parcel data d. Risk area or hazard zone data (e.g., flood, surge,
wind-‐field) e. Sensitive environmental area location maps f. U.S. Census data g. Population projections from State Demographer or
Texas Water Development Board h. Economic data (e.g., sales, number of employees) i. HAZUS program or output-‐estimates from that
program j. Coastal Planning Atlas (coastalatlas.tamu.edu) k. Other (please specify):
Section V. Coordination, Cooperation, and Involvement We are nearly finished. This is the second to the last section, which asks questions about coordination and cooperation within your jurisdiction as well as between your jurisdiction and others.

83
22. To what extent have the following individuals or departments been involved in your jurisdiction's hazard mitigation planning?
Not at all
A Small extent
To Some extent
Very great extent
Group/Department Not Present In Jurisdiction
a. Elected officials b. City Manager (or City
Manager in County) c. Public Works/Engineering d. Planning/Community
Development e. Economic Development f. Building Department g. Emergency Management h. Environmental Services i. City/County Attorney's Office j. County Judge k. Housing
Department/Authority l. Flood administrator m. Parks/Recreational
Department
23. To what extent have the following individuals or departments been involved in your jurisdiction's hazard mitigation planning?
Not at all
A Small extent
To Some extent
Very great extent
a. Texas Department of Housing and Community Affairs (TDHCA)
b. Texas Commission on Environmental Quality (TCEQ) c. Texas Department of Transportation (TxDOT) d. Texas Water Development Board (TWDB) e. Texas State Soil and Water Conservation Board
(TSSWCB) f. Texas Parks and Wildlife Department (TPWD) g. Texas General Land Office (GLO) h. Texas Division of Emergency Management (TDEM) i. Texas Department of Rural Affairs (TDRA) j. Regional Council of Government (COG) k. Federal Emergency Management Agency (FEMA) l. Other (please specify):

84
24. Has your jurisdiction worked with or coordinated with other jurisdictions in your area on hazard mitigation planning issues?
a. Yes b. No
25. Does your jurisdiction have any type of agreements like MOUs or joint aid agreements with the following groups for hazard mitigation planning, or disaster response/recovery efforts?
Yes No
a. Schools/educational institution b. Utilities (e.g., electric power, natural gas, telecommunication) c. Health service institution (e.g., hospital, clinic) d. Professional associations (e.g., builders, engineers, planners) e. Non-‐profit organization (e.g., Red Cross, Habitat for Humanity,
neighborhood) f. Church or faith-‐based organization g. Financial institution (e.g., bank, savings, loan associations, insurance) h. Hospitality facilities (e.g. hotel/motel, nursery homes) i. Other (please specify):
26. How would you characterize the support the following stakeholders have for
general planning activities undertaken by your jurisdiction? Stron
gly Opposed
Opposed
Neutral
Supportive
Strongly Supporti
ve
Group(s) Not Present
In Jurisdiction
a. Developers/Realtors b. Property/land owners c. Hospital/medical
industry d. Utilities (e.g., electric
power, natural gas, telecommunications)
e. Financial industry (e.g., insurance, banks, mortgage companies)
f. Minority organizations g. News media h. Neighborhood
associations i. Environmental groups j. Religious groups k. Other (please specify):
Section VI. Final Information on Your Jurisdiction

85
The following four final questions simple asks about your jurisdiction. 27. How many staff members in your jurisdiction are involved in hazard mitigation
planning? 28. Please indicate the amount of time per year each of these staff members are is
involved in hazard mitigation activities. (For example if you have 4 people involved in hazard mitigation activities, 2 for about 50% of their time and 2 for about 10% of their time enter 2 by 26%-‐50% and 2 by 0%-‐10%). Each field must have a response, even if it is 0. a. 0 % to 20 % b. 21 % to 40 % c. 41 % to 60 % d. 61 % to 80 % e. 81 % to 100 %
29. Please estimate the approximate annual budget your jurisdiction dedicates to
hazard mitigation planning: a. $0–$5,000 b. $5,001–$10,000 c. $10,001–$20,000 d. $20,001–$50,000 e. $50,001–$100,000 f. $100,001–$300,000 g. $300,001 or greater
30. Name of your jurisdiction (city or county name): 31. Your job title (e.g. city planner, floodplain administrator):