statistics in hrm kenneth m. york school of business administration oakland university
Post on 20-Dec-2015
215 views
TRANSCRIPT
Statistics in HRM
Kenneth M. York
School of Business Administration
Oakland University
ORG434 2
Applied Research in HRM
• Statistics are used to answer applied research questions in HRM, such as:– Does this selection test have adverse impact?– Is this selection test valid?– Is this selection test reliable?– What is the reliability of this selection test?– How much should this job be paid?
ORG434 3
Determining whether a selection test has adverse impact
• Civil Rights Act of 1964, SEC. 2000e-2. [Section 703– It shall be an unlawful employment practice
for an employer –• to fail or refuse to hire or to discharge any
individual, or otherwise to discriminate against any individual with respect to his compensation, terms, conditions, or privileges of employment, because of such individual's race, color, religion, sex, or national origin;
ORG434 4
Determining whether a selection test has adverse impact
• The Uniform Guidelines on Employee Selection , Section 41CFR60-3.4(d), Adverse impact and the “four-fifths rule.'' – A selection rate for any race, sex, or ethnic group
which is less than four-fifths (4/5) (or eighty percent) of the rate for the group with the highest rate will generally be regarded by the Federal enforcement agencies as evidence of adverse impact, while a greater than four-fifths rate will generally not be regarded by Federal enforcement agencies as evidence of adverse impact.
ORG434 5
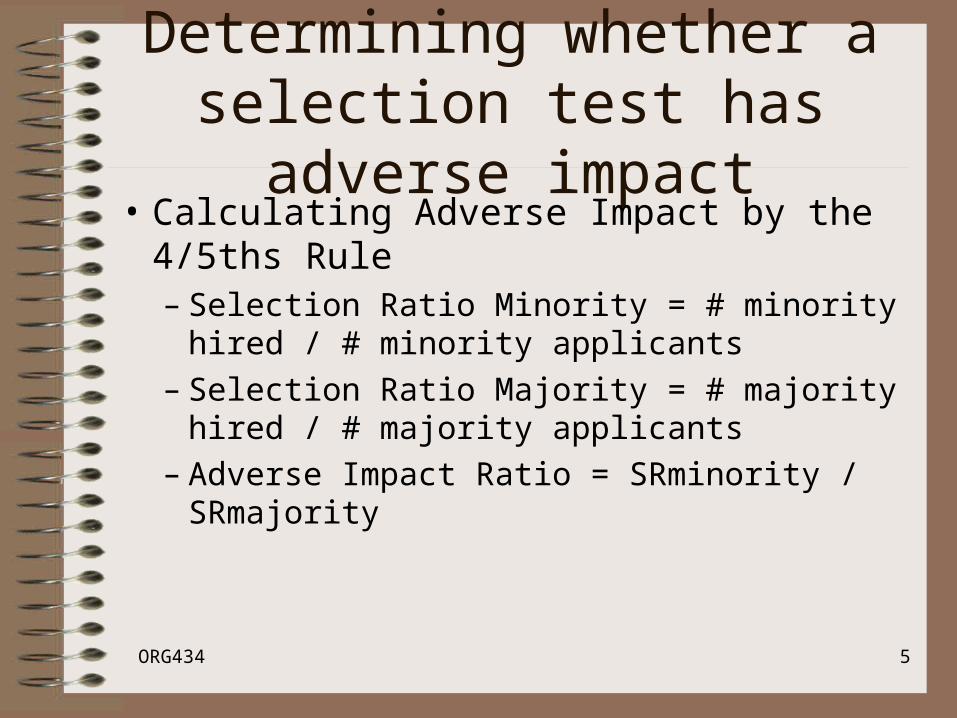
Determining whether a selection test has adverse impact
• Calculating Adverse Impact by the 4/5ths Rule– Selection Ratio Minority = # minority hired / #
minority applicants– Selection Ratio Majority = # majority hired / #
majority applicants– Adverse Impact Ratio = SRminority /
SRmajority
ORG434 6
Determining whether a selection test has adverse impact
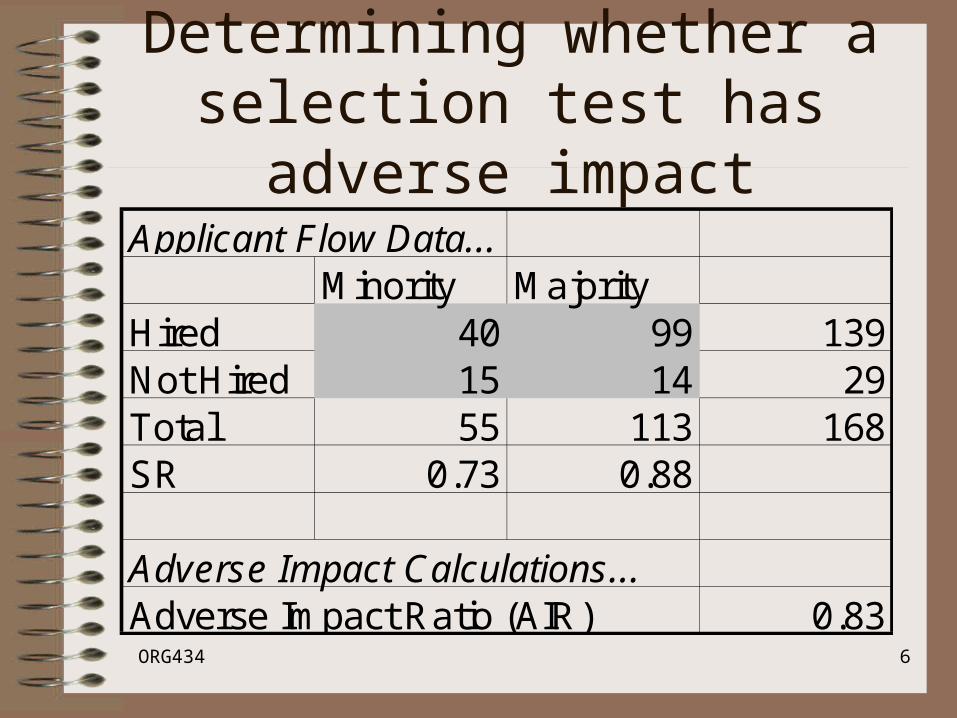
Applicant Flow Data...Minority Majority
Hired 40 99 139Not Hired 15 14 29Total 55 113 168SR 0.73 0.88
Adverse Impact Calculations...Adverse Impact Ratio (AIR) 0.83

ORG434 7
Determining whether a selection test has adverse impact
• The Chi Square is the appropriate statistical test, when the sample size is large enough:Applicant Flow Data...
Minority MajorityHired 40 99 139Not Hired 15 14 29Total 55 113 168SR 0.73 0.88
Adverse Impact Calculations...Adverse Impact Ratio (AIR) 0.83Chi Square Test (df=1) 5.74 0.0166
ORG434 8
Determining whether a selection test is valid
• Uniform Guidelines on Employee Selection Proceedures, Section 41CFR60-3.3(a), Discrimination defined: Relationship between use of selection procedures and discrimination– Procedure having adverse impact constitutes discrimination
unless justified. The use of any selection procedure which has an adverse impact on the hiring, promotion, or other employment or membership opportunities of members of any race, sex, or ethnic group will be considered to be discriminatory and inconsistent with these guidelines, unless the procedure has been validated in accordance with these guidelines, or the provisions of section 6 of this part are satisfied.
ORG434 9
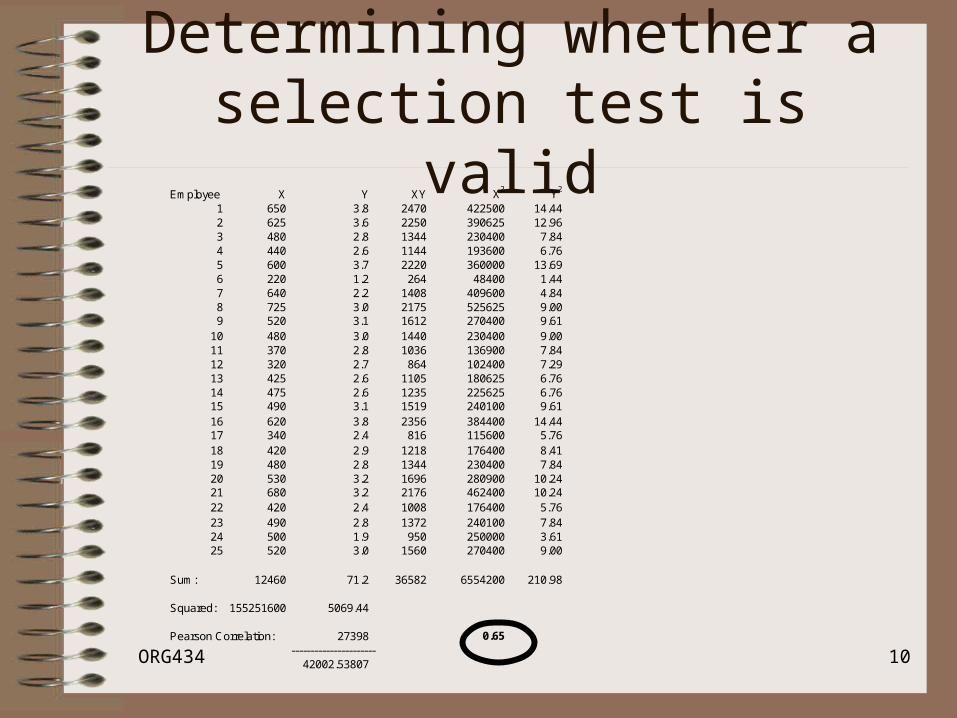
Determining whether a selection test is valid
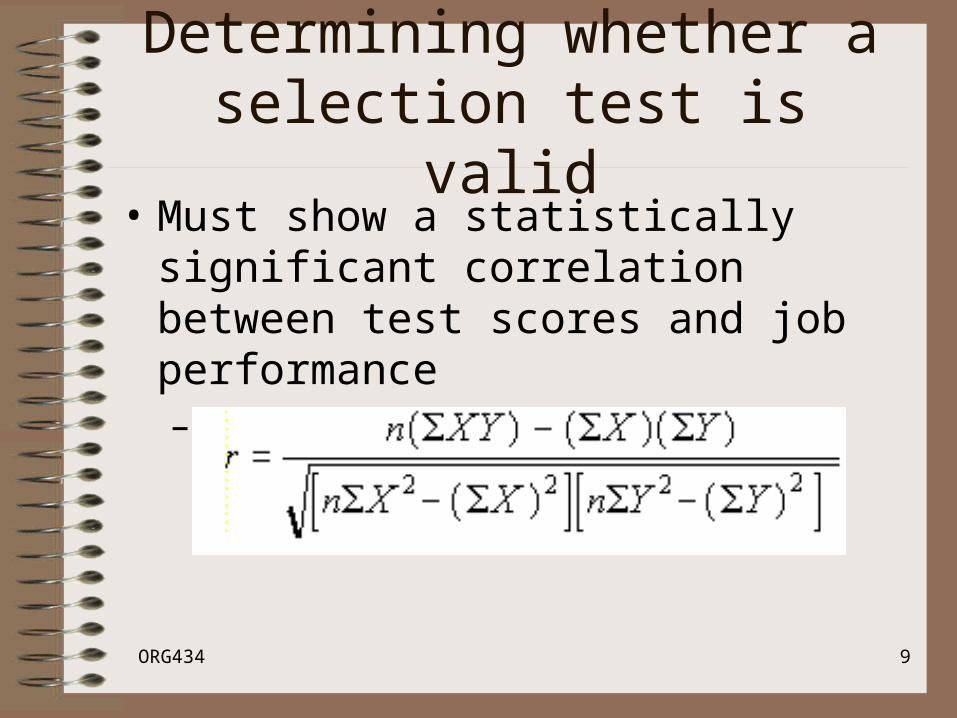
• Must show a statistically significant correlation between test scores and job performance– Pearson Correlation Coefficient:
ORG434 10
Determining whether a selection test is valid
Employee X Y XY X2 Y2
1 650 3.8 2470 422500 14.442 625 3.6 2250 390625 12.963 480 2.8 1344 230400 7.844 440 2.6 1144 193600 6.765 600 3.7 2220 360000 13.696 220 1.2 264 48400 1.447 640 2.2 1408 409600 4.848 725 3.0 2175 525625 9.009 520 3.1 1612 270400 9.61
10 480 3.0 1440 230400 9.0011 370 2.8 1036 136900 7.8412 320 2.7 864 102400 7.2913 425 2.6 1105 180625 6.7614 475 2.6 1235 225625 6.7615 490 3.1 1519 240100 9.6116 620 3.8 2356 384400 14.4417 340 2.4 816 115600 5.7618 420 2.9 1218 176400 8.4119 480 2.8 1344 230400 7.8420 530 3.2 1696 280900 10.2421 680 3.2 2176 462400 10.2422 420 2.4 1008 176400 5.7623 490 2.8 1372 240100 7.8424 500 1.9 950 250000 3.6125 520 3.0 1560 270400 9.00
Sum: 12460 71.2 36582 6554200 210.98
Squared: 155251600 5069.44
Pearson Correlation: 27398 0.65----------------------
42002.53807
ORG434 11
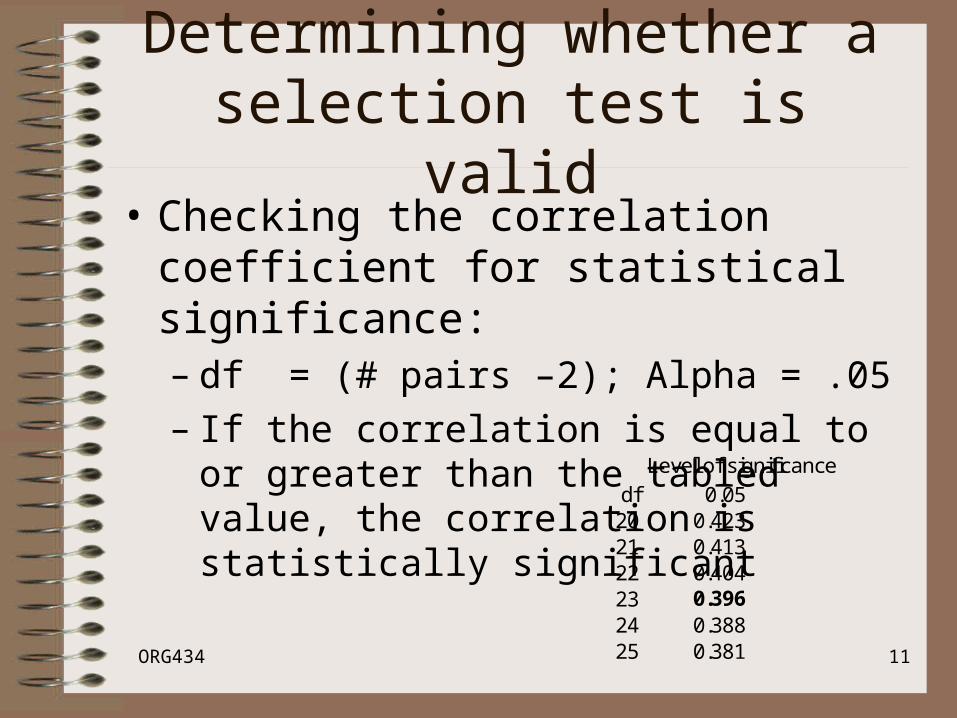
Determining whether a selection test is valid
• Checking the correlation coefficient for statistical significance:– df = (# pairs –2); Alpha = .05– If the correlation is equal to or greater than the
tabled value, the correlation is statistically significant Level of significance
df 0.0520 0.42321 0.41322 0.40423 0.39624 0.38825 0.381
ORG434 12
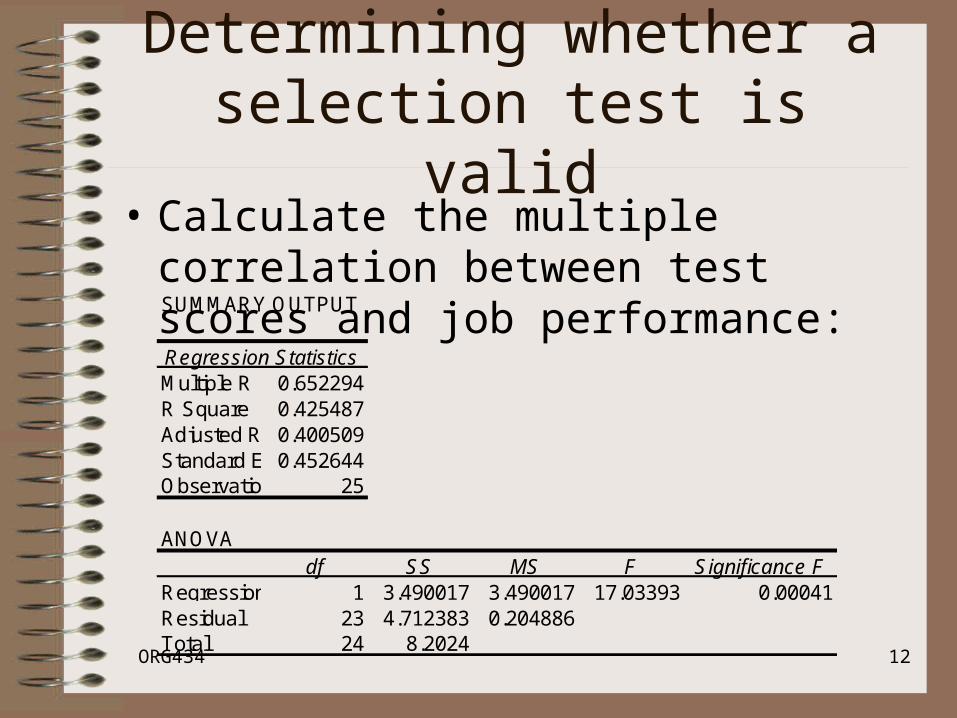
Determining whether a selection test is valid
• Calculate the multiple correlation between test scores and job performance:SUMMARY OUTPUT
Regression StatisticsMultiple R 0.652294R Square 0.425487Adjusted R Square0.400509Standard Error0.452644Observations 25
ANOVAdf SS MS F Significance F
Regression 1 3.490017 3.490017 17.03393 0.00041Residual 23 4.712383 0.204886Total 24 8.2024
ORG434 13
Determining the reliability of a selection test
• Reliability is the upper limit of validity– For a test to be valid, it must be reliable
• To measure the reliability of a test over time (stability), calculate Test-Retest Reliability Coefficient– Correlate a set of test scores at Time1 and
Time2
ORG434 14
Determining the reliability of a selection test
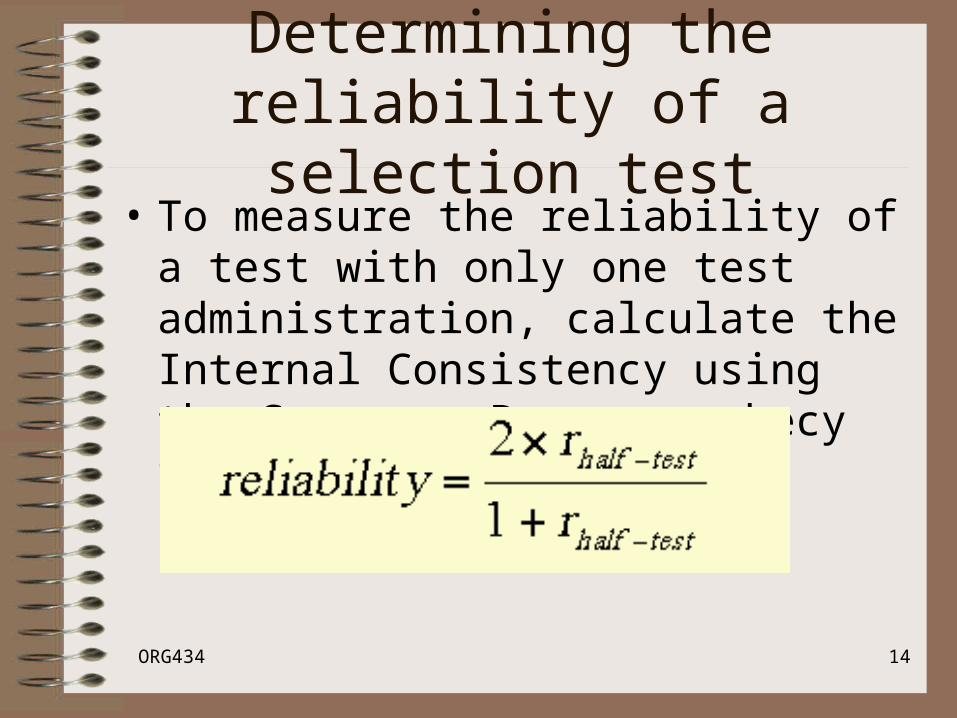
• To measure the reliability of a test with only one test administration, calculate the Internal Consistency using the Spearman-Brown prophecy formula:
ORG434 15
Determining the reliability of a selection test
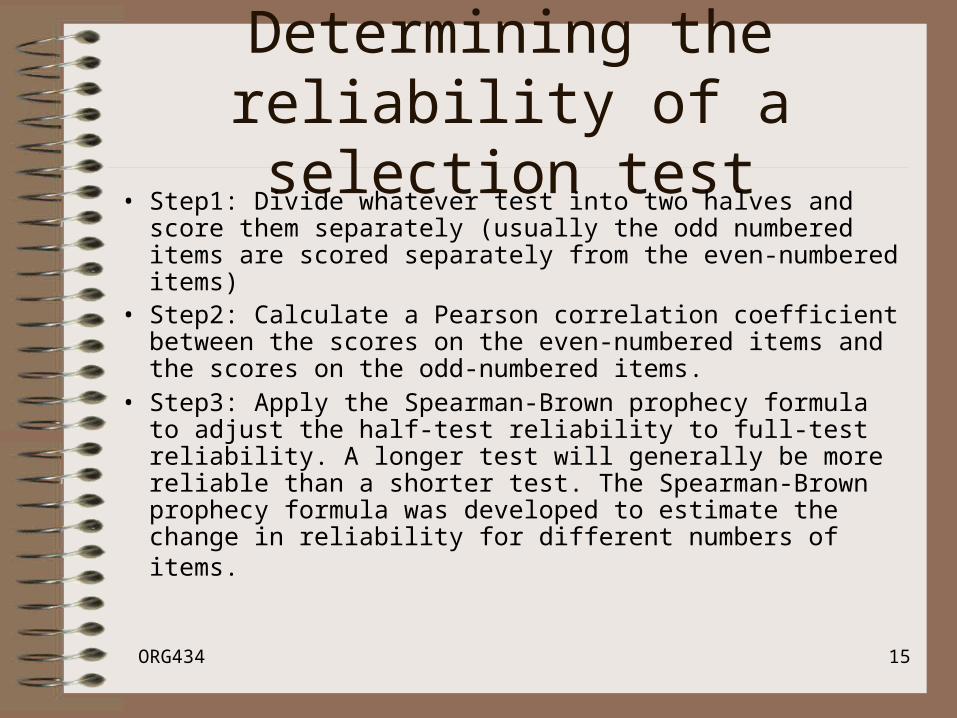
• Step1: Divide whatever test into two halves and score them separately (usually the odd numbered items are scored separately from the even-numbered items)
• Step2: Calculate a Pearson correlation coefficient between the scores on the even-numbered items and the scores on the odd-numbered items.
• Step3: Apply the Spearman-Brown prophecy formula to adjust the half-test reliability to full-test reliability. A longer test will generally be more reliable than a shorter test. The Spearman-Brown prophecy formula was developed to estimate the change in reliability for different numbers of items.
ORG434 16
Determining the reliability of a selection test
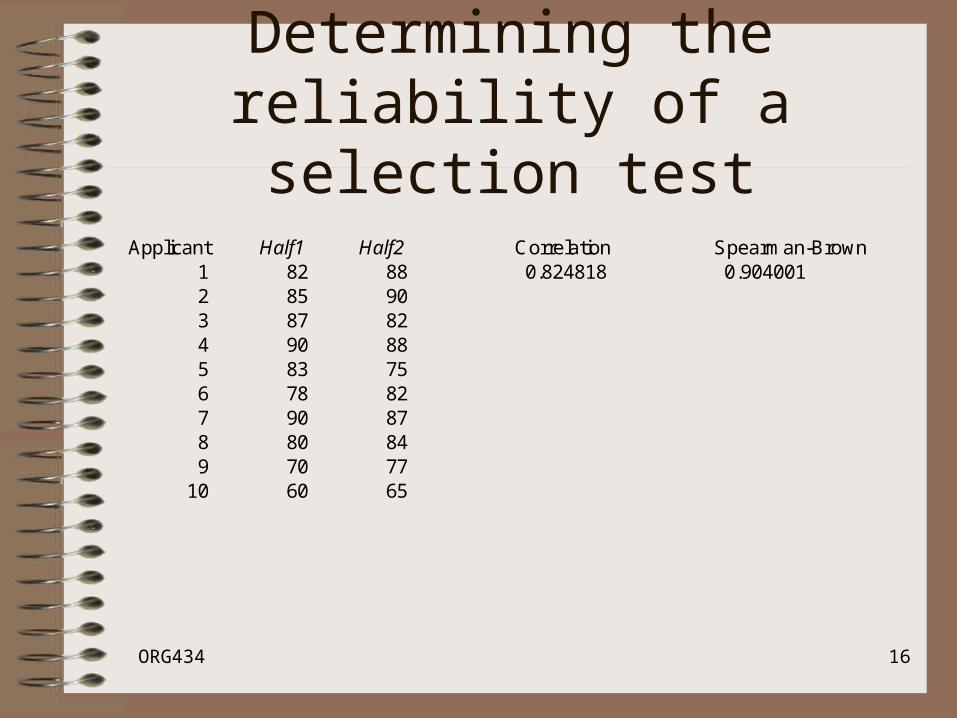
Applicant Half1 Half2 Correlation Spearman-Brown1 82 88 0.824818 0.9040012 85 903 87 824 90 885 83 756 78 827 90 878 80 849 70 7710 60 65
ORG434 17
Determining the reliability of a selection test
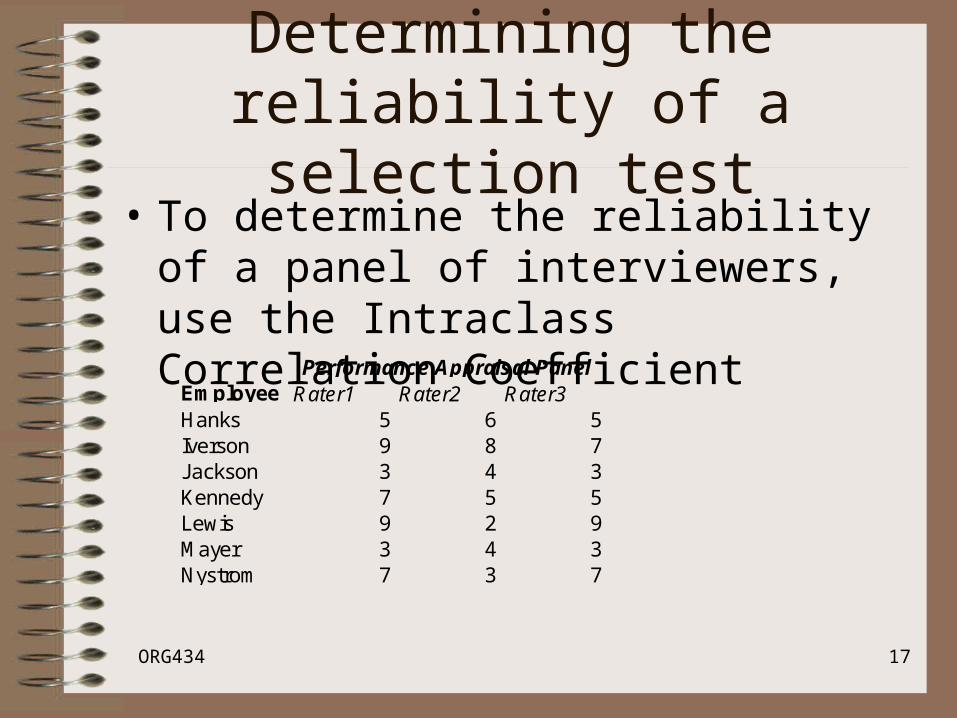
• To determine the reliability of a panel of interviewers, use the Intraclass Correlation Coefficient
Employee Rater1 Rater2 Rater3Hanks 5 6 5Iverson 9 8 7Jackson 3 4 3Kennedy 7 5 5Lewis 9 2 9Mayer 3 4 3Nystrom 7 3 7
Performance Appraisal Panel
ORG434 18
Determining the reliability of a selection test
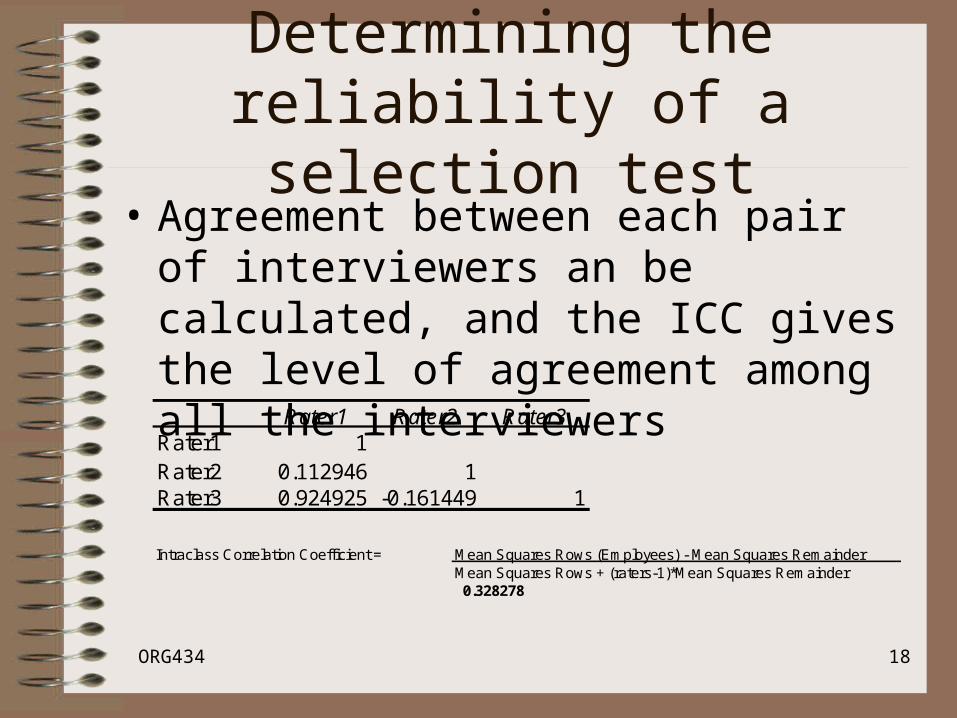
• Agreement between each pair of interviewers an be calculated, and the ICC gives the level of agreement among all the interviewers
Rater1 Rater2 Rater3Rater1 1Rater2 0.112946 1Rater3 0.924925 -0.161449 1
Intraclass Correlation Coefficient = Mean Squares Rows (Employees) - Mean Squares RemainderMean Squares Rows + (raters-1)*Mean Squares Remainder0.328278

ORG434 19
Determining how much a job should be paid
• People should be paid fairly based on two factors:– The work that they do (difficulty, hazard,
responsibility, education, etc.)• Internal Equity
– What the market is paying• External Competitiveness
ORG434 20
Determining how much a job should be paid
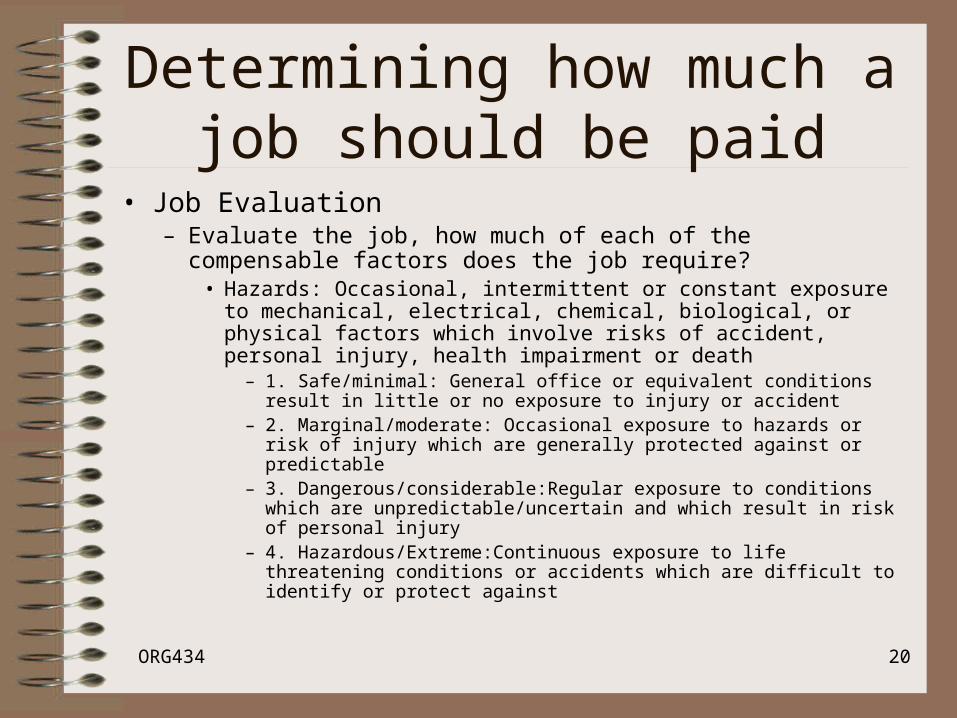
• Job Evaluation– Evaluate the job, how much of each of the compensable factors
does the job require?• Hazards: Occasional, intermittent or constant exposure to
mechanical, electrical, chemical, biological, or physical factors which involve risks of accident, personal injury, health impairment or death
– 1. Safe/minimal: General office or equivalent conditions result in little or no exposure to injury or accident
– 2. Marginal/moderate: Occasional exposure to hazards or risk of injury which are generally protected against or predictable
– 3. Dangerous/considerable:Regular exposure to conditions which are unpredictable/uncertain and which result in risk of personal injury
– 4. Hazardous/Extreme:Continuous exposure to life threatening conditions or accidents which are difficult to identify or protect against
ORG434 21
Determining how much a job should be paid
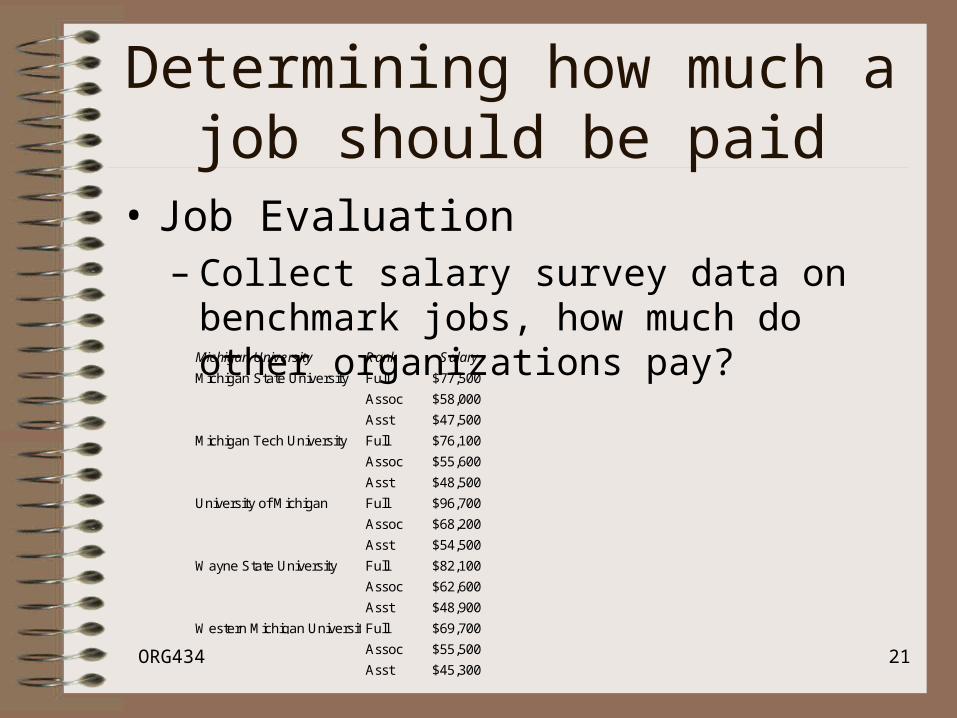
• Job Evaluation– Collect salary survey data on benchmark jobs,
how much do other organizations pay?Michigan University Rank Salary
Michigan State University Full $77,500
Assoc $58,000
Asst $47,500
Michigan Tech University Full $76,100
Assoc $55,600
Asst $48,500
University of Michigan Full $96,700
Assoc $68,200
Asst $54,500
Wayne State University Full $82,100
Assoc $62,600
Asst $48,900
Western Michigan UniversityFull $69,700
Assoc $55,500
Asst $45,300
ORG434 22
Determining how much a job should be paid
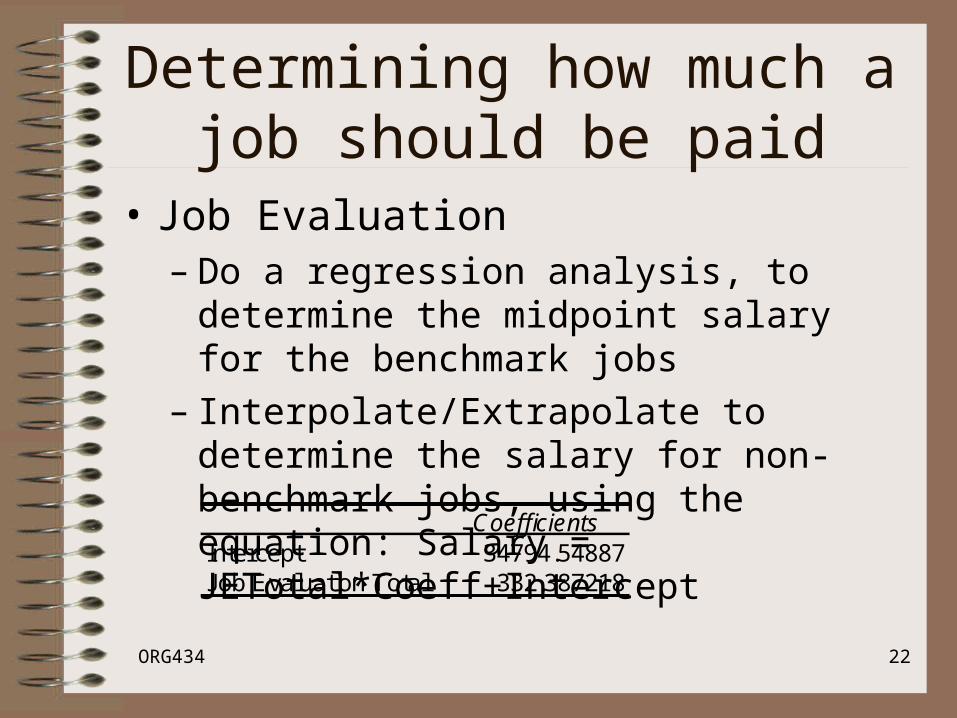
• Job Evaluation– Do a regression analysis, to determine the
midpoint salary for the benchmark jobs– Interpolate/Extrapolate to determine the salary
for non-benchmark jobs, using the equation: Salary = JETotal*Coeff+Intercept
CoefficientsIntercept 34794.54887Job Evaluation Total 332.387218
ORG434 23
Statistics Pretest
• What statistic do you use?– To determine the validity of a selection test
– To determine the adverse impact of a selection test
– To determine whether women get significantly lower scores on a test than men
– To determine whether alternate (parallel) forms of a test are statistically equivalent
– To determine how well a panel of interviewers agrees with each other about candidates they’ve interviewed
ORG434 24
Statistics Pretest
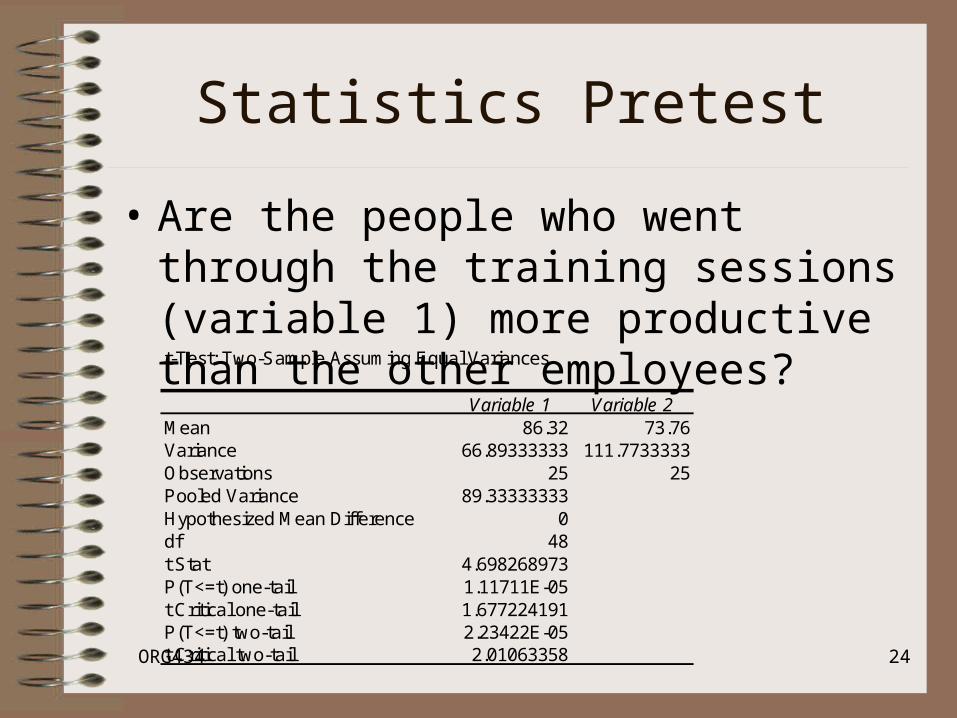
• Are the people who went through the training sessions (variable 1) more productive than the other employees?t-Test: Two-Sample Assuming Equal Variances
Variable 1 Variable 2Mean 86.32 73.76Variance 66.89333333 111.7733333Observations 25 25Pooled Variance 89.33333333Hypothesized Mean Difference 0df 48t Stat 4.698268973P(T<=t) one-tail 1.11711E-05t Critical one-tail 1.677224191P(T<=t) two-tail 2.23422E-05t Critical two-tail 2.01063358
ORG434 25
Statistics Pretest
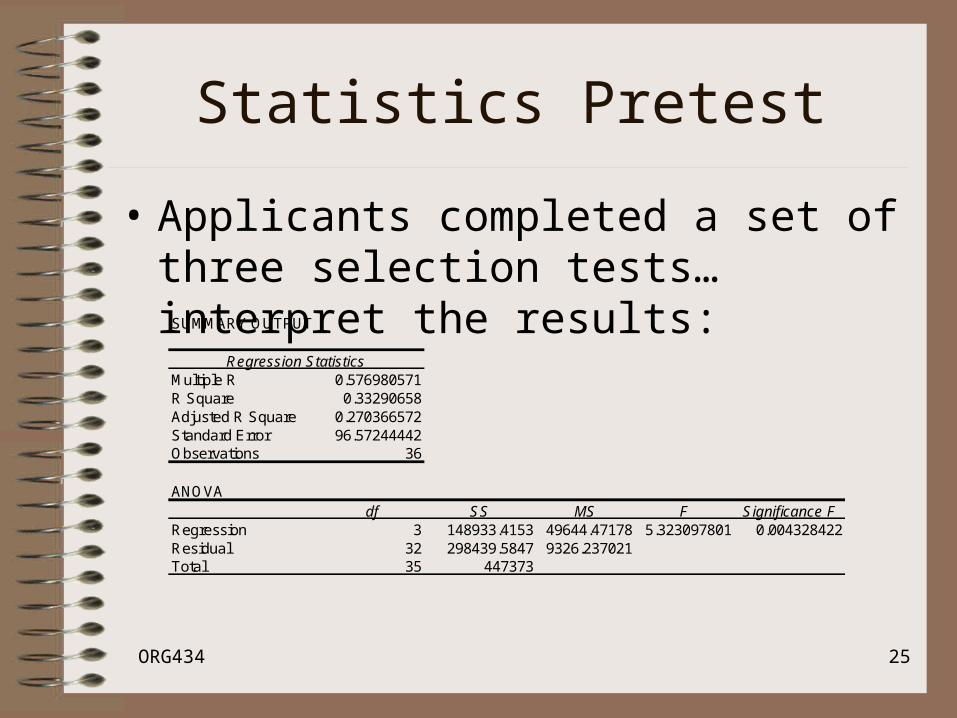
• Applicants completed a set of three selection tests…interpret the results:
SUMMARY OUTPUT
Regression StatisticsMultiple R 0.576980571R Square 0.33290658Adjusted R Square 0.270366572Standard Error 96.57244442Observations 36
ANOVAdf SS MS F Significance F
Regression 3 148933.4153 49644.47178 5.323097801 0.004328422Residual 32 298439.5847 9326.237021Total 35 447373
ORG434 26
Statistics Pretest
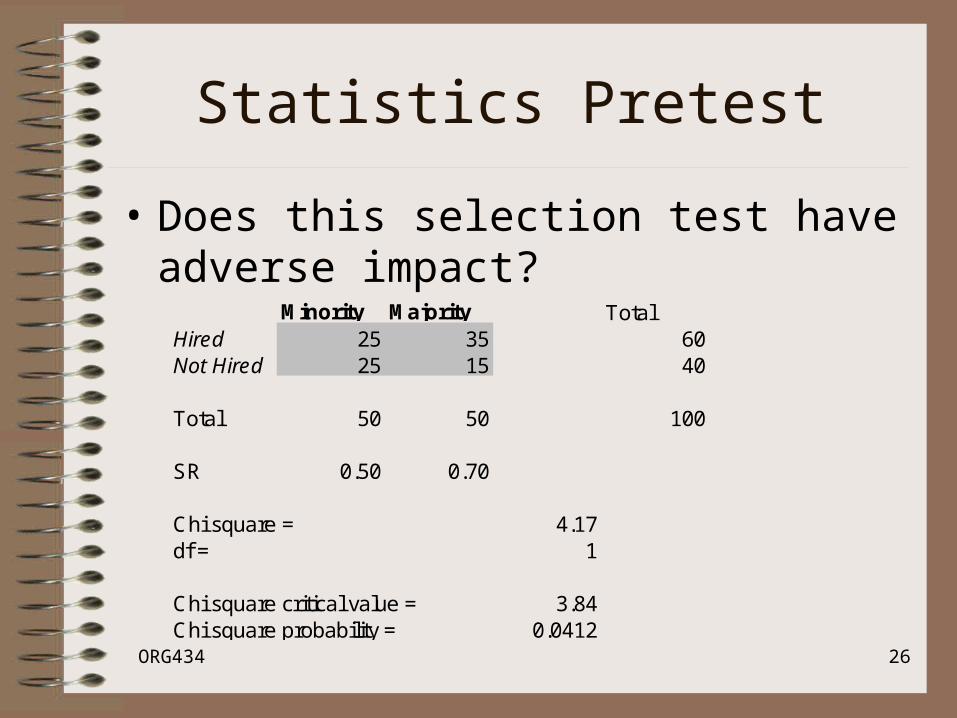
• Does this selection test have adverse impact?
Minority Majority TotalHired 25 35 60Not Hired 25 15 40
Total 50 50 100
SR 0.50 0.70
Chi square = 4.17df = 1
Chi square critical value = 3.84Chi square probability = 0.0412