2016 outfall monitoring overview - mwra - home · 2016 outfall monitoring overview prepared by...
TRANSCRIPT

2016 Outfall monitoring overview
1
Massachusetts Water Resources Authority
Environmental Quality Department
Report 2017-12

Citation:
Werme C, Keay KE, Libby, PS, Codiga DL, Taylor DI, Wu DC, Charlestra L. 2017.
2016 outfall monitoring overview. Boston: Massachusetts Water Resources
Authority. Report 2017-12. 49 p.

2016
Outfall Monitoring Overview
prepared by
Christine Werme
Independent Consultant
Oakland, CA 94612
Kenneth E. Keay
Massachusetts Water Resources Authority
Environmental Quality Department
100 First Avenue
Charlestown Navy Yard
Boston, MA 02129
P. Scott Libby
Battelle
157 Park Row
Brunswick, ME 04011
Daniel L. Codiga, David I. Taylor, David C. Wu, Lucner Charlestra
Massachusetts Water Resources Authority
Environmental Quality Department
100 First Avenue
Charlestown Navy Yard
Boston, MA 02129
October 30, 2017

2016 Outfall Monitoring Panel and Committees
Outfall Monitoring Science Advisory Panel (OMSAP)
Robert Beardsley, Woods Hole Oceanographic Institution
Robert Kenney, University of Rhode Island
Judy Pederson, Massachusetts Institute of Technology Sea Grant
Michael Shiaris, University of Massachusetts, Boston
James Shine, Harvard School of Public Health
Geoffrey Trussell, Northeastern University Marine Science Center
Juanita Urban-Rich, University of Massachusetts, Boston
Inter-Agency Advisory Committee (IAAC)
US Geological Survey
Massachusetts Coastal Zone Management
US Army Corps of Engineers
Stellwagen Bank National Marine Sanctuary
US Environmental Protection Agency
Massachusetts Division of Marine Fisheries
Massachusetts Department of Environmental Protection
Public Interest Advisory Committee (PIAC)
Save the Harbor/Save the Bay
MWRA Wastewater Advisory Committee
Conservation Law Foundation
Massachusetts Audubon Society
MWRA Advisory Board
Association to Preserve Cape Cod
Safer Waters in Massachusetts
The Boston Harbor Association
i
Table of Contents
Summary ....................................................................................................................... v
1. Introduction ............................................................................................................... 1
2. Effluent ..................................................................................................................... 2
2016 Characterization ............................................................................................... 2 Contingency Plan Thresholds ................................................................................... 7
3. Water Column ........................................................................................................... 8
Physical Conditions .................................................................................................. 9
Water Quality .......................................................................................................... 12 Phytoplankton Communities ................................................................................... 19
Zooplankton Communities...................................................................................... 22
Stellwagen Bank National Marine Sanctuary ......................................................... 23 Boston Harbor ......................................................................................................... 24 Contingency Plan Thresholds ................................................................................. 25
4. Sea Floor ................................................................................................................. 27
Sediment Characteristics and Tracers ..................................................................... 29
Soft-bottom Communities ....................................................................................... 31 Sediment-profile Imaging ....................................................................................... 33
Stellwagen Bank National Marine Sanctuary ......................................................... 34 Boston Harbor ......................................................................................................... 35 Contingency Plan Thresholds ................................................................................. 37
5. Fish and Shellfish .................................................................................................... 39
Flounder Health ...................................................................................................... 40 Contingency Plan Thresholds ................................................................................. 41
6. Special Studies ........................................................................................................ 42
Indicator Bacteria in Sewage Effluent .................................................................... 42 Recovery in Boston Harbor .................................................................................... 44
Cape Cod Bay Studies ............................................................................................ 46 References ................................................................................................................... 48
List of Acronyms ........................................................................................................ 49

ii
List of Figures
Figure 2-1. Annual rainfall in Boston, 1990–2016 ....................................................... 2
Figure 2-2. Annual primary-blended and full secondary effluent flows, 1999–2016. . 3
Figure 2-3. Annual solids discharges, 1990–2016. ....................................................... 4
Figure 2-4. Annual nitrogen discharges, 1996–2016 .................................................... 4
Figure 2-5. Annual metals discharges, 1990–2016. ...................................................... 5
Figure 2-6. Annual polycyclic aromatic hydrocarbon discharges, 2006–2016 ............ 6
Figure 2-7. Annual discharges of banned organic pesticides and their breakdown
products and PCBs, 2006–2016. ................................................................................... 6
Figure 3-1. Water-column monitoring stations in Massachusetts and Cape Cod bays 8
Figure 3-2. Flows of the Merrimack (top) and Charles (bottom) rivers. .................... 10
Figure 3-3. Surface- and bottom-water temperature and salinity concentrations at
nearfield Station N18 in 2016 compared to prior years. ............................................. 11
Figure 3-4. Stratification at nearfield Station N18 in 2016 compared to prior years. 12
Figure 3-5. Depth-averaged dissolved inorganic nutrient concentrations at nearfield
Station N18 in 2016 compared to prior years ............................................................. 13
Figure 3-6. Depth-averaged ammonium concentrations by station in Massachusetts
and Cape Cod bays in 2016. ....................................................................................... 14
Figure 3-7. (Left) Surface- and bottom-water ammonium on April 18, 2016 at the
monitoring stations during mixed conditions. (Right) Cross-sections of concentrations
throughout the water column along transects connecting selected stations ................ 15
Figure 3-8. (Left) Surface- and bottom-water ammonium on July 26, 2016 at the
monitoring stations during stratified conditions. (Right) Cross-sections of
concentrations throughout the water column along transects connecting selected
stations. ....................................................................................................................... 16
Figure 3-9. Depth-averaged chlorophyll by station in Massachusetts Bay in 2016. .. 17
Figure 3-10. Bottom-water dissolved oxygen concentrations at selected stations in
2016 compared to prior years. .................................................................................... 18
Figure 3-11. Total phytoplankton abundance at selected stations in 2016 compared to
prior years. .................................................................................................................. 19
Figure 3-12. Mean nearfield abundance of Phaeocystis pouchetii in 2016, compared
to 1992–2015 .............................................................................................................. 20
Figure 3-13. Nearfield abundance of Alexandrium fundyense, 1992–2016 ................ 21
Figure 3-14. Total zooplankton abundance (10,000 animals per square meter) at
selected stations in 2016 compared to prior years. ..................................................... 22
Figure 3-15. Bottom water dissolved oxygen concentrations at NERACOOS Buoy
A01, inside the Stellwagen Bank National Marine Sanctuary, and at nearby Station
F22 .............................................................................................................................. 23
Figure 3-16. Depth-averaged ammonium levels at selected stations in 2016. ............ 24
Figure 3-17. Mean nearfield abundance of Phaeocystis pouchetii, 1992–2016. (Top)
Winter-spring. (Bottom) Summer. .............................................................................. 26

iii
Figure 4-1. Soft-bottom monitoring stations .............................................................. 27
Figure 4-2. Sediment-profile imaging stations ........................................................... 28
Figure 4-3. Concentrations of Clostridium perfringens spores, corrected for sediment
grain size, in 2016 ....................................................................................................... 30
Figure 4-4. Mean concentrations of Clostridium perfringens spores during the
baseline and outfall discharge years ........................................................................... 30
Figure 4-5. Mean infaunal abundance per sample during the baseline and outfall-
discharge years ............................................................................................................ 31
Figure 4-6. Percent fine sediments superimposed on the ordination plot of the 2016
infauna samples ........................................................................................................... 32
Figure 4-7. Annual apparent color RPD depth for data from nearfield stations. ........ 33
Figure 4-8. Depth superimposed on the ordination plot of the 2016 infauna samples.
..................................................................................................................................... 34
Figure 4-9. Soft-bottom sampling stations in Boston Harbor ..................................... 35
Figure 4-10. Mean concentrations of Clostridium perfringens spores at selected
harbor stations, 1991–2016. ........................................................................................ 36
Figure 4-11. Ordination plot of 2016 Boston Harbor infauna samples. ..................... 36
Figure 4-12. Annual community parameters with nearfield Contingency Plan
thresholds .................................................................................................................... 38
Figure 5-1. Fish-and-shellfish monitoring stations ..................................................... 39
Figure 5-2. Annual prevalence of centrotubular hydropic vacuolation, 1991–2016 .. 41
Figure 6-1. Daily geometric mean fecal coliform bacteria in Deer Island effluent,
2008–2016, in comparison to the permit limit ............................................................ 42
Figure 6-2. Monthly geometric mean Enterococcus bacteria in Deer Island effluent,
2008–2016, in comparison to monthly geometric mean Enterococcus in surface and
bottom samples from two stations near the outfall. .................................................... 43
Figure 6-3. Annual nutrient inputs, pelagic community production, and benthic fluxes
in Boston Harbor ......................................................................................................... 45
Figure 6-4. The Center for Coastal Studies monitors its own eight stations and three
MWRA stations in and near Cape Cod Bay ............................................................... 46
Figure 6-5. Whale sightings and zooplankton density in Cape Cod Bay in March 2016
..................................................................................................................................... 47
Figure 6-6. Total individual right whale sightings and sightings per unit effort in Cape
Cod Bay in 1998–2016 ............................................................................................... 47

iv
List of Tables
Table i. Contingency Plan threshold values and 2016 results for effluent monitoring.
...................................................................................................................................... vi
Table ii. Contingency Plan threshold values and 2016 results for water-column
monitoring. .................................................................................................................. vii
Table iii. Contingency Plan threshold values and 2016 results for seafloor monitoring.
.................................................................................................................................... viii
Table iv. Contingency Plan threshold value and 2016 results for fish-and-shellfish
monitoring. ................................................................................................................. viii
Table 2-1. Projected and actual loads of metals and organic contaminants in MWRA
effluent. Loads of metals and organic contaminants are far below those projected
during the planning and permitting process. ................................................................. 7
Table 2-2. Contingency Plan threshold values and 2016 results for effluent
monitoring. .................................................................................................................... 7
Table 3-1. Contingency Plan threshold values and 2016 results for water-column
monitoring. .................................................................................................................. 25
Table 4-1. Contingency Plan threshold values and 2016 results for seafloor
monitoring. .................................................................................................................. 37
Table 5-1. Contingency Plan threshold value and 2016 results for fish-and-shellfish
monitoring. .................................................................................................................. 41

v
Summary
Each year, the Massachusetts Water Resources Authority (MWRA) prepares an
overview of effluent and environmental monitoring related to the discharge of municipal
wastewater effluent from Deer Island Treatment Plant through an offshore outfall tunnel
into Massachusetts Bay. This overview presents monitoring results and information
relevant to MWRA’s permit-required Contingency Plan, including any threshold
exceedances or other permit violations, responses, and, should they be needed, corrective
actions. The overview also includes monitoring results relevant to the Stellwagen Bank
National Marine Sanctuary and information on special studies conducted in response to
specific permit requirements, scientific questions, or public concerns.
This report for 2016 marks 25 years of monitoring, including more than 16 years since
September 2000, when MWRA ceased discharge of wastewater effluent to the relatively
confined waters of Boston Harbor and began to discharge into deeper, less confined
waters in Massachusetts Bay. This report for 2016 includes results of effluent analyses;
water-column, seafloor, and fish-and-shellfish monitoring in the vicinity of the outfall
(the “nearfield”) and at reference stations; and results pertinent to Stellwagen Bank and
to Boston Harbor. Special studies reports included in this year’s overview focus on
indicator bacteria in sewage effluent, continued recovery of Boston Harbor, and ongoing
Cape Cod Bay studies.
Operations at Deer Island Treatment Plant continued to be exceptional in 2016, earning
MWRA a National Association of Clean Water Agencies (NACWA) Platinum 10 Peak
Performance Award. This NACWA award recognizes facilities with 100% compliance
with permit effluent limits for ten consecutive years. Nearfield and reference-station
monitoring results from 2016 were consistent both with predictions made during the
outfall planning process and with past results, showing no unanticipated effects of the
discharge (Tables i through iv). No Contingency Plan “warning-level” exceedances
were observed. A “caution-level” exceedance* occurred for one water-column
parameter, summer levels of the nuisance algal species Phaeocystis pouchetii. Overall,
Phaeocystis abundance was low in 2016. However, as has occurred in other recent
years, this exceedance was due to presence of Phaeocystis at a low abundance in one
sample during the May (“summer”) survey. These exceedances have caused no
measurable aesthetic or other adverse effects, prompting MWRA regulators to approve
discontinuing the summer Phaeocystis threshold in future monitoring years. Regulators
also approved discontinuing upper bounds for benthic community thresholds, as
exceeding those thresholds would not be indicative of environmental degradation.
* MWRA’s discharge permit includes Contingency Plan thresholds, indicators that may signal a need for action. The thresholds are
based on permit limits, state water quality standards, and expert judgment. “Caution-level” thresholds indicate a need for a closer
assessment of the data to determine the reason for an observed change. “Warning-level” thresholds are a higher level of concern,
and the permit requires a series of steps to evaluate whether adverse effects occurred and if so, whether they were related to the
discharge. If exceedances were related to the discharge, MWRA might need to implement corrective action. All thresholds based on
effluent discharge permit limits are warning-level. Some ambient parameters have both caution- and warning-level thresholds, and
others have only caution-level thresholds.

vi
Table i. Contingency Plan threshold values and 2016 results for effluent monitoring.
Parameter Baseline Caution Level Warning Level 2016 Results
pH NA None <6 or >9 Not exceeded
Fecal coliform NA None >14,000 fecal coliforms/100 mL
Not exceeded
Chlorine, residual NA None >631 µg/L daily, >456 µg/L monthly
Not exceeded
Suspended solids NA None >45 mg/L weekly >30 mg/L monthly
Not exceeded
cBOD NA None >40 mg/L weekly, >25 mg/L monthly
Not exceeded
Acute toxicity NA None LC50 <50% Not exceeded
Chronic toxicity NA None NOEC <1.5% effluent
Not exceeded
PCBs NA Aroclor>0.045 ng/L None Not exceeded
Plant performance NA 5 violations/year Compliance <95% of the time
Not exceeded
Flow NA None >436 MGD average dry days
Not exceeded
Total nitrogen load NA >12,500 mtons/year
>14,000 mtons/year
Not exceeded
Oil and grease NA None >15 mg/L weekly Not exceeded
NA = not applicable
cBOD = carbonaceous biological oxygen demand
LC50 = 50% mortality concentration
NOEC = no observable effect concentration
PCB = polychlorinated biphenyl
Plant performance = compliance with permit conditions
vii
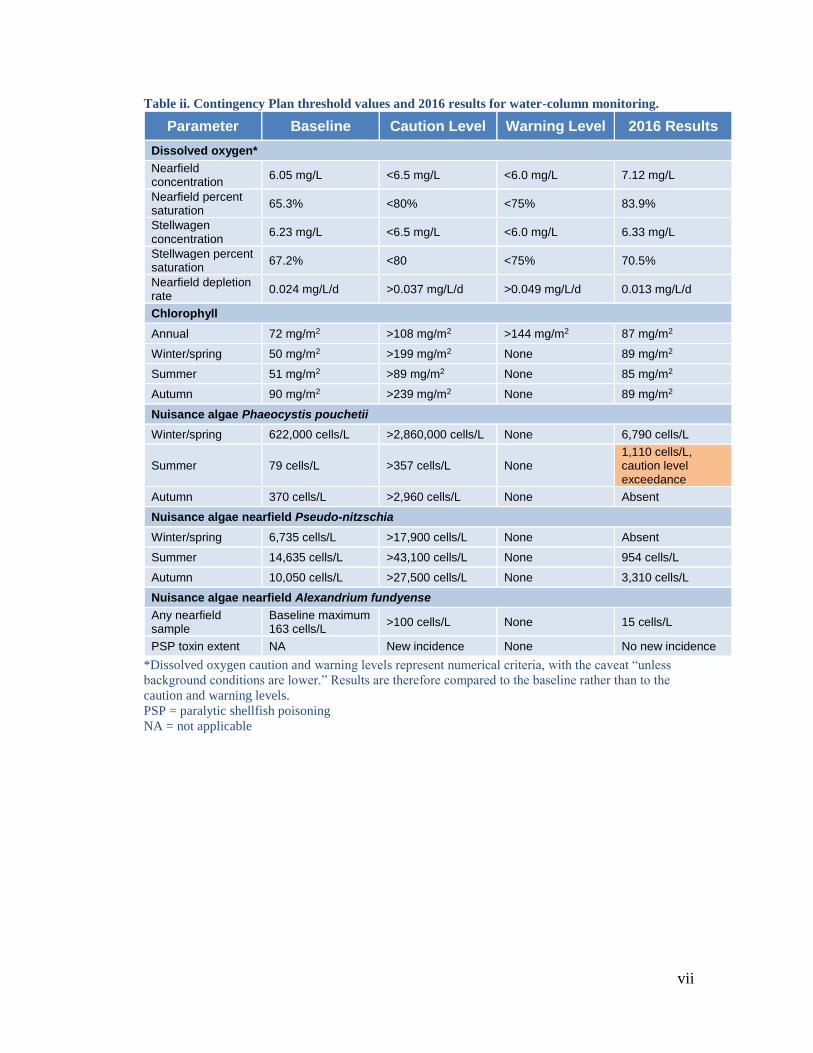
Table ii. Contingency Plan threshold values and 2016 results for water-column monitoring.
Parameter Baseline Caution Level Warning Level 2016 Results
Dissolved oxygen*
Nearfield concentration
6.05 mg/L <6.5 mg/L <6.0 mg/L 7.12 mg/L
Nearfield percent saturation
65.3% <80% <75% 83.9%
Stellwagen concentration
6.23 mg/L <6.5 mg/L <6.0 mg/L 6.33 mg/L
Stellwagen percent saturation
67.2% <80 <75% 70.5%
Nearfield depletion rate
0.024 mg/L/d >0.037 mg/L/d >0.049 mg/L/d 0.013 mg/L/d
Chlorophyll
Annual 72 mg/m2 >108 mg/m2 >144 mg/m2 87 mg/m2
Winter/spring 50 mg/m2 >199 mg/m2 None 89 mg/m2
Summer 51 mg/m2 >89 mg/m2 None 85 mg/m2
Autumn 90 mg/m2 >239 mg/m2 None 89 mg/m2
Nuisance algae Phaeocystis pouchetii
Winter/spring 622,000 cells/L >2,860,000 cells/L None 6,790 cells/L
Summer 79 cells/L >357 cells/L None 1,110 cells/L, caution level exceedance
Autumn 370 cells/L >2,960 cells/L None Absent
Nuisance algae nearfield Pseudo-nitzschia
Winter/spring 6,735 cells/L >17,900 cells/L None Absent
Summer 14,635 cells/L >43,100 cells/L None 954 cells/L
Autumn 10,050 cells/L >27,500 cells/L None 3,310 cells/L
Nuisance algae nearfield Alexandrium fundyense
Any nearfield sample
Baseline maximum 163 cells/L
>100 cells/L None 15 cells/L
PSP toxin extent NA New incidence None No new incidence
*Dissolved oxygen caution and warning levels represent numerical criteria, with the caveat “unless
background conditions are lower.” Results are therefore compared to the baseline rather than to the
caution and warning levels.
PSP = paralytic shellfish poisoning
NA = not applicable

viii
Table iii. Contingency Plan threshold values and 2016 results for seafloor monitoring.
Parameter Baseline Caution Level Warning Level 2016 Results
Sediment parameters
RPD depth NA <1.18 cm None 3.89 cm
Benthic community parameters
Species per sample
NA <42.99 or >81.85 None 58.5
Fisher’s log-series alpha
NA <9.42 or >15.8 None 12.7
Shannon-Wiener diversity
NA <3.37 or >3.99 None 3.93
Pielou’s evenness NA <0.57 or >0.67 None 0.672
% opportunists NA >10% >25% 0.21%
HMW = high molecular weight; LMW = low molecular weight
NA = not applicable; RPD = redox potential discontinuity
Table iv. Contingency Plan threshold value and 2016 results for fish-and-shellfish monitoring.
Parameter Baseline Caution Level Warning Level 2016 Results
Liver disease CHV 24.4% >44.9% None 4%
CHV = centrotubular hydropic vacuolation

1
1. Introduction
Since its creation by the Massachusetts state legislature in 1984, the Massachusetts
Water Resources Authority (MWRA) has worked to minimize the effects of
municipal wastewater discharge on the marine environment. The mission of what
became known as MWRA’s Boston Harbor Project included reducing inflow of
contaminants into the waste stream, ending biosolids (sludge) discharge, improving
wastewater-treatment facilities, and providing better dilution of the effluent
discharge. MWRA has conducted long-term environmental monitoring in Boston
Harbor, where both biosolids and effluent were once discharged, and in
Massachusetts Bay, where wastewater effluent is currently discharged through a
deepwater tunnel and diffuser system.
Biosolids discharges to Boston Harbor ended in December 1991, all discharges to the
southern portion of the harbor ended in 1998, and upgrades to Deer Island Treatment
Plant were completed in 1995–2001. A major milestone was reached in September
2000, when all effluent discharge was diverted from Boston Harbor to the deeper, less
confined waters of Massachusetts Bay. The relocated outfall operates under a
National Pollutant Discharge Elimination System (NPDES) permit, jointly issued by
the U.S. Environmental Protection Agency (EPA) and the Massachusetts Department
of Environmental Protection (MassDEP).
The NPDES permit requires monitoring of effluent and receiving waters to assess
compliance with permit conditions and with a permit-required Contingency Plan.
Results are presented in annual outfall monitoring overviews, such as this report.
Background information about the monitoring program (Werme et al. 2012), the
monitoring plan (MWRA 2010), the Contingency Plan (MWRA 2001), past plans and
overviews, and area-specific technical reports are available in MWRA’s technical
report list, http://www.mwra.state.ma.us/harbor/enquad/trlist.html.
This year’s outfall monitoring overview presents results from 2016, marking the
twenty-fifth year of Massachusetts Bay monitoring and more than sixteen years of
outfall discharge from the deepwater outfall. The report presents information relevant
to permit and Contingency Plan conditions in the effluent, water column, sea floor,
and fish and shellfish, as well as special studies conducted in response to permit
conditions and environmental concerns. Data relevant to the Stellwagen Bank
National Marine Sanctuary, located offshore from the outfall, are presented in
sections covering the water column and the sea floor. The report also includes
pertinent information from MWRA’s separate monitoring efforts in Boston Harbor.

2
2. Effluent
2016 Characterization
The Deer Island Treatment Plant continued to operate as designed through 2016,
earning MWRA the National Association of Clean Water Agencies (NACWA)
Platinum 10 Peak Performance Award. This NACWA award recognizes facilities
with 100% compliance with effluent permit limits over ten consecutive years.
The Boston area received about 10 inches less rain than the long-term average in
2016, a second consecutive year of drought and one of the driest years since 1990
(Figure 2-1). Drought conditions persisted until May 2017. Correspondingly,
average effluent flow in 2016, 281 million gallons per day, was the lowest measured
since the Massachusetts Bay outfall began to discharge in September 2000 (Figure 2-
2). Virtually all the flow, 99.8%, received full primary and secondary treatment, with
only trace discharges of primary-treated effluent blended with fully treated effluent
prior to discharge in any month. (During large storms, flow exceeding the secondary
capacity of the plant is diverted around the secondary process to prevent washing out
the essential microbes that carry out secondary treatment. These primary-treated
flows are then combined or “blended” with full secondary-treated flows before
disinfection and discharge.)
Figure 2-1. Annual rainfall in Boston, 1990–2016. Rainfall in 2016, 33.05 inches, was the third
driest of the monitoring program, with only 1997 and 2001 having less rainfall. Those years are shown
in darker blue. The dashed line shows the average rainfall for the period, 43.17 inches.

3
Figure 2-2. Annual primary-blended and full secondary effluent flows, 1999–2016. During large
storms, flow exceeding the secondary capacity of the plant is diverted around the secondary process.
Primary-treated flows are blended into secondary-treated flows before discharge.
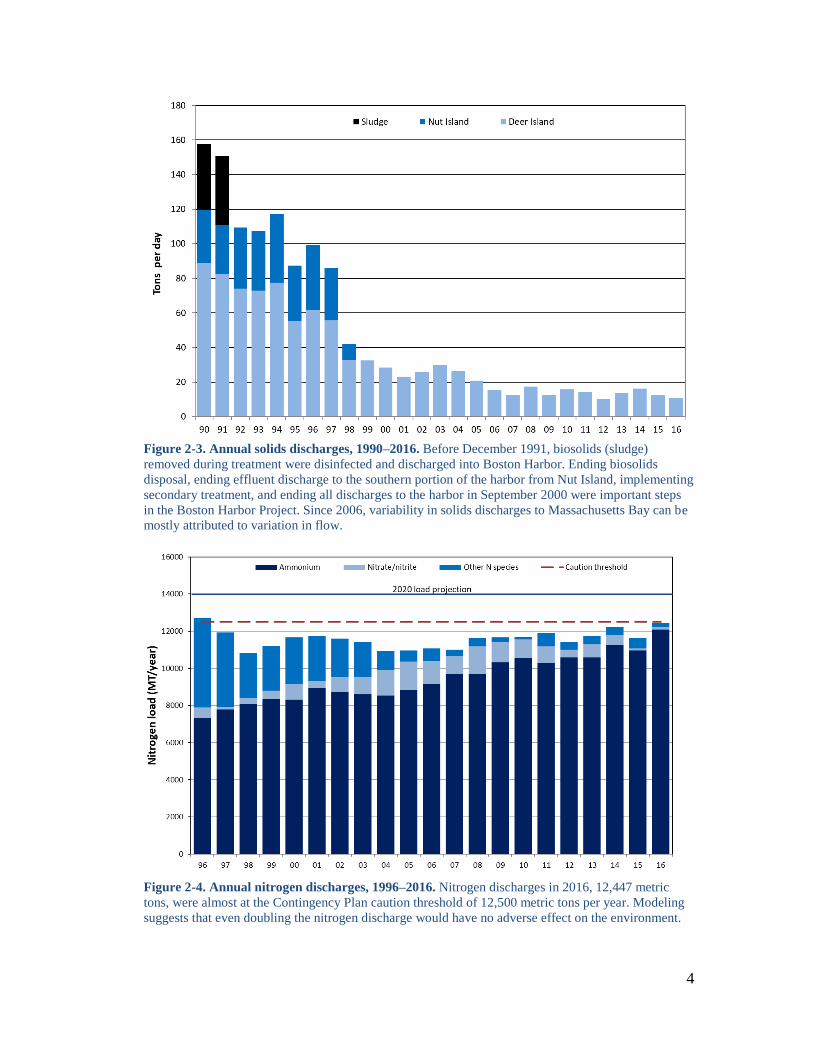
The total suspended solids load to Massachusetts Bay was also low, well below the
loads discharged to Boston Harbor before the relocated outfall began operation
(Figure 2-3). Carbonaceous biological oxygen demand, a measure of the amount of
oxygen consumed by microorganisms, also remained low (not shown), well below
levels that would be expected to affect dissolved oxygen concentrations at the
discharge.
The total nitrogen load remained just under its caution-level Contingency Plan
threshold in 2016 (Figure 2-4), but was well below the warning-level threshold,
14,000 metric tons per year. (The caution level was somewhat arbitrarily set as 90%
the of the warning level; the warning level was the projected total nitrogen load for
the year 2020.)
The portion of the nitrogen load made up of ammonium reached a record high,
continuing a gradual increase since early years of the Boston Harbor Project.
Increased ammonium loads are a consequence of the biological treatment process and
addition of ammonium-rich liquids from the biosolids (sludge) pelletizing plant.
Total effluent nitrogen loads reflect variability in nitrogen levels in the influent
reaching Deer Island (although about 30% of the nitrogen is removed during
treatment). There have been no observed adverse environmental effects due to
nitrogen discharge into Massachusetts Bay, and water-quality modeling has suggested
that even doubling the nitrogen discharge would have no adverse effect on the
environment.
4
Figure 2-3. Annual solids discharges, 1990–2016. Before December 1991, biosolids (sludge)
removed during treatment were disinfected and discharged into Boston Harbor. Ending biosolids
disposal, ending effluent discharge to the southern portion of the harbor from Nut Island, implementing
secondary treatment, and ending all discharges to the harbor in September 2000 were important steps
in the Boston Harbor Project. Since 2006, variability in solids discharges to Massachusetts Bay can be
mostly attributed to variation in flow.
Figure 2-4. Annual nitrogen discharges, 1996–2016. Nitrogen discharges in 2016, 12,447 metric
tons, were almost at the Contingency Plan caution threshold of 12,500 metric tons per year. Modeling
suggests that even doubling the nitrogen discharge would have no adverse effect on the environment.

5
Metals loads remained low in 2016, with zinc and copper continuing to comprise
most of the annual discharges (Figure 2-5). Metals loads are now mostly a factor of
rainfall and flow rates rather than variations in inputs to the waste stream. Except for
copper, metals meet water quality standards prior to discharge, while copper meets
the standard after initial dilution at the Massachusetts Bay outfall. Once considered a
sewage tracer, silver is no longer detected in the effluent in appreciable amounts, a
result of high removal efficiencies associated with secondary treatment and the
change from film to digital photography.
Polycyclic aromatic hydrocarbon (PAH, Figure 2-6) and other organic contaminant
loads (Figure 2-7) were low, as they have been throughout the monitoring program.
Discharges of organic contaminants have varied slightly from year to year but have
been well below levels historically discharged into Boston Harbor.
Total discharges of both metals and organic compounds remain well below
predictions made during the planning and permitting process for the Massachusetts
Bay outfall (Table 2-1). Metals discharges are well below projected levels, ranging
from mercury, with discharges about 1% of the projected load, to copper, with
discharges just over 20% of what had been projected. Loads of total PCBs, and 4-4’
DDE (a breakdown product of the banned pesticide DDT) are only about 1% of the
loads that had been anticipated in the Supplemental Environmental Impact Statement
(SEIS) prepared during planning (EPA 1988).
Figure 2-5. Annual metals discharges, 1990–2016.

6
Figure 2-6. Annual polycyclic aromatic hydrocarbon (PAH) discharges, 2006–2016. LMW PAH =
lower molecular weight PAH, HMW PAH = high molecular weight PAH
Figure 2-7. Annual discharges of banned organic pesticides and their breakdown products and
PCBs, 2006–2016.

7
Table 2-1. Projected and actual loads of metals and organic contaminants in MWRA effluent.
Loads of metals and organic contaminants are far below those projected during the planning and
permitting process.
Parameter SEIS Projected Load
(kg/year) 2016 Load (kg/year)
Percent Projected Load
Chromium 3,517 416 12
Copper 11,945 2,460 21
Lead 4,961 279 5.6
Mercury 216 2 0.93
Nickel 8,926 1,271 14
Silver 290 23 7.9
Total PCBs 50 0.52 1.0
4-4’ DDE 28 0.31 1.1
SEIS = Supplemental Environmental Impact Statement
Contingency Plan Thresholds
There were no permit violations in 2016 and no exceedances of the Contingency Plan
effluent thresholds (Table 2-1). Effluent threshold exceedances have been rare
throughout the duration of the monitoring program, and none have occurred over the
past ten years.
Table 2-2. Contingency Plan threshold values and 2016 results for effluent monitoring.
Parameter Caution Level Warning Level 2016 Results
pH None <6 or >9 Not exceeded
Fecal coliform None >14,000 fecal coliforms/100 mL Not exceeded
Chlorine, residual None >631 µg/L daily, >456 µg/L monthly
Not exceeded
Suspended solids None >45 mg/L weekly >30 mg/L monthly
Not exceeded
cBOD None >40 mg/L weekly, >25 mg/L monthly
Not exceeded
Acute toxicity None LC50 <50% Not exceeded
Chronic toxicity None NOEC <1.5% effluent Not exceeded
PCBs Aroclor >0.045 ng/L None Not exceeded
Plant performance 5 violations/year Compliance <95% of the time Not exceeded
Flow None >436 MGD average dry days Not exceeded
Total nitrogen load >12,500 mtons/year >14,000 mtons/year Not exceeded
Oil and grease None >15 mg/L weekly Not exceeded
NA = not applicable
cBOD = carbonaceous biological oxygen demand
LC50 = 50% mortality concentration
NOEC = no observable effect concentration
PCB = polychlorinated biphenyl
Plant performance = compliance with permit conditions

8
3. Water Column
Water-column monitoring evaluates relevant oceanographic processes, water quality,
and phytoplankton and zooplankton communities at stations in Massachusetts Bay, at
the mouth of Boston Harbor, and in Cape Cod Bay (Figure 3-1).
Figure 3-1. Water-column monitoring stations in Massachusetts and Cape Cod bays.

9
Sampling during nine surveys of fourteen stations in 2016 included vertical profiles
of physical, chemical, and biological parameters in the nearfield (the area around the
outfall where some effects of the effluent were expected and have been observed),
and at farfield reference stations, including stations in Cape Cod Bay and near the
Stellwagen Bank National Marine Sanctuary. Analyses included data from ten
additional stations, sampled as part of MWRA’s Boston Harbor water-quality
monitoring program when sampling dates were within a few days of the outfall-
monitoring surveys. In some years, including 2016, special surveys are conducted in
response to Alexandrium fundyense red tide blooms. In 2016, Alexandrium special
surveys were conducted in late May and early June.
The program continued to benefit from collaboration with the Center for Coastal
Studies at Provincetown, Massachusetts, which conducts a monitoring program in
Cape Cod Bay. As part of the MWRA monitoring program, the Center for Coastal
Studies samples water-column stations in Cape Cod Bay and the Stellwagen Bank
National Marine Sanctuary. Regulators have set a target that, whenever possible,
sampling in Cape Cod Bay should occur on the same day as Massachusetts Bay
sampling conducted by MWRA. Surveys for which sampling cannot occur within 48
hours should be reported in this annual outfall monitoring overview. In 2016, engine
problems and weather forced one Massachusetts Bay survey to be delayed to seven
days after the Cape Cod Bay sampling on September 26. All other survey dates met
the 48-hour window.
As in past years, the field monitoring program was augmented by measurements on
two instrumented buoys: the Northeastern Regional Association of Coastal and Ocean
Observing Systems (NERACOOS) Buoy A01 and the National Oceanic and
Atmospheric Administration’s National Data Buoy Center (NDBC) Buoy 44013.
The National Aeronautics and Space Administration provided Moderate Resolution
Imaging Spectroradiometer (MODIS) satellite imagery of chlorophyll and sea-surface
temperature.
Physical Conditions
Monitoring has shown that the water quality in the vicinity of the outfall and
throughout Massachusetts and Cape Cod bays is heavily influenced by weather, river
inflows, and other physical factors. Information about physical conditions has proven
key to interpreting the annual water-column monitoring data.
Corresponding to the low rainfall in the Boston area in 2016, discharges from the
Merrimack and Charles rivers were also low, with Merrimack River discharges higher
than average at the beginning of the year, but discharges from both rivers dropping to
the lowest flows measured in any year of the monitoring program (Figure 3-2).

10
Figure 3-2. Flows of the Merrimack (top) and Charles (bottom) rivers. Flow from the Charles
River was the lowest measured in 25 years of monitoring. Dark red lines are 2016 data. Results from
1992–2015 are in light blue. The quarterly percentiles represent the 2016 flows in comparison to the
entire 25-year record.
Water temperatures, measured at the NDBC Buoy 44013 (not shown) and at nearby
Station N18 (Figure 3-3, top panels), reached the long-term maxima for the
monitoring program (Libby et al. 2017). During the first survey of the year, surface
water temperature at Station N18 was the highest February temperature measured
since monitoring began. Surface temperature again exceeded past measurements in
late July and was elevated throughout fall. Bottom water temperatures at Station N18
were also high compared to past years, particularly during the spring and fall.
The low river flows resulted in correspondingly high salinity measurements in surface
and bottom waters (Figure 3-3, bottom panels). Surface- and bottom-water salinity
measurements at Station N18 were at or above the long-term maxima from June until
the last survey date, November 1.

11
Figure 3-3. Surface- and bottom-water temperature and salinity concentrations at nearfield
Station N18 in 2016 compared to prior years. Black points are results from individual surveys in
2016. Results from 1992–2015 are in blue: line is the 50th percentile, dark shading spans the 25th to 75th
percentile, and light shading spans the range.

12
Stratification during the first half of 2016 was much the same as in previous years,
but strong during some surveys. Persistent winds in September led to an unusually
early breakdown of stratification at Station N18 (Figure 3-4). Data from
NERACOOS Buoy A01 also showed destratification to depths of 20 meters in late
September and to 50 meters in late October.
Figure 3-4. Stratification at nearfield Station N18 in 2016 compared to prior years. Black points
are results from individual surveys in 2016. Results from 1992–2015 are in blue: line is the 50th
percentile, dark shading spans the 25th to 75th percentile, and light shading spans the range.
Water Quality
As in past years, water quality measurements for 2016 included quantification of
nutrients, phytoplankton biomass (measured as chlorophyll and particulate organic
carbon), and dissolved oxygen. Results continued to confirm predictions of
measurable outfall influence in some parameters, but only at stations very near the
outfall, and no unexpected adverse effects (Libby et al. 2017).
During 2016, dissolved inorganic nutrient concentrations (nitrate, ammonium,
silicate, and phosphate) at nearfield Station N18 one kilometer south of the outfall fell
mostly within the ranges seen in previous years (Figure 3-5). Nitrate and phosphate
concentrations, which generally follow a similar and strong seasonal pattern at that
location, were highest early in 2016, lower during the summer due to phytoplankton
uptake, and higher again in the fall. Silicate concentrations were low during the first
survey, an indication of a diatom bloom.
Concentrations of ammonium at Station N18, as in most years, varied greatly and did
not show a seasonal pattern. Ammonium is the largest fraction of the total nitrogen in
wastewater and provides a tracer that could identify possible adverse effects of the
outfall, if they were to occur.

13
Figure 3-5. Depth-averaged dissolved inorganic nutrient concentrations (micromoles per liter) at
nearfield Station N18 in 2016 compared to prior years. Note difference in scale for phosphate.
Black points are results from individual surveys in 2016. Results from 1992–2015 are in blue: line is
the 50th percentile, dark shading spans the 25th to 75th percentile, and light shading spans the range.
In the immediate vicinity of the outfall, at Station N21, elevated ammonium
concentrations have been detected since the discharge began in 2000. In 2016, that
signature was especially apparent during some surveys but not others (Figure 3-6).
However, despite record-high ammonium discharges from Deer Island Treatment
Plant (see Figure 2-4 in Section 2, Effluent), the outfall ammonium signature was not
unusual in either magnitude (concentration) or spatial extent in 2016.

14
Figure 3-6. Depth-averaged ammonium concentrations (µM) by station in Massachusetts and
Cape Cod bays in 2016. Several panels show additional data from MWRA’s in-house Boston Harbor
monitoring surveys when those surveys were conducted within a few days of the outfall-monitoring
surveys.
71oW 48' 36' 24' 12' 70oW
42oN
10'
20'
30'
40'
0 2 4 6 8 10
Feb 12
71oW 48' 36' 24' 12' 70oW
42oN
10'
20'
30'
40'
0 2 4 6 8 10
Mar 23
71oW 48' 36' 24' 12' 70oW
42oN
10'
20'
30'
40'
0 2 4 6 8 10
Apr 18
71oW 48' 36' 24' 12' 70oW
42oN
10'
20'
30'
40'
0 2 4 6 8 10
May 18
71oW 48' 36' 24' 12' 70oW
42oN
10'
20'
30'
40'
0 2 4 6 8 10
Jun 21
71oW 48' 36' 24' 12' 70oW
42oN
10'
20'
30'
40'
0 2 4 6 8 10
Jul 26
71oW 48' 36' 24' 12' 70oW
42oN
10'
20'
30'
40'
0 2 4 6 8 10
Aug 23
71oW 48' 36' 24' 12' 70oW
42oN
10'
20'
30'
40'
0 2 4 6 8 10
Oct 03
71oW 48' 36' 24' 12' 70oW
42oN
10'
20'
30'
40'
0 2 4 6 8 10
Nov 01
71oW 48' 36' 24' 12' 70oW
42oN
10'
20'
30'
40'
0 2 4 6 8 10
Oct 03
15
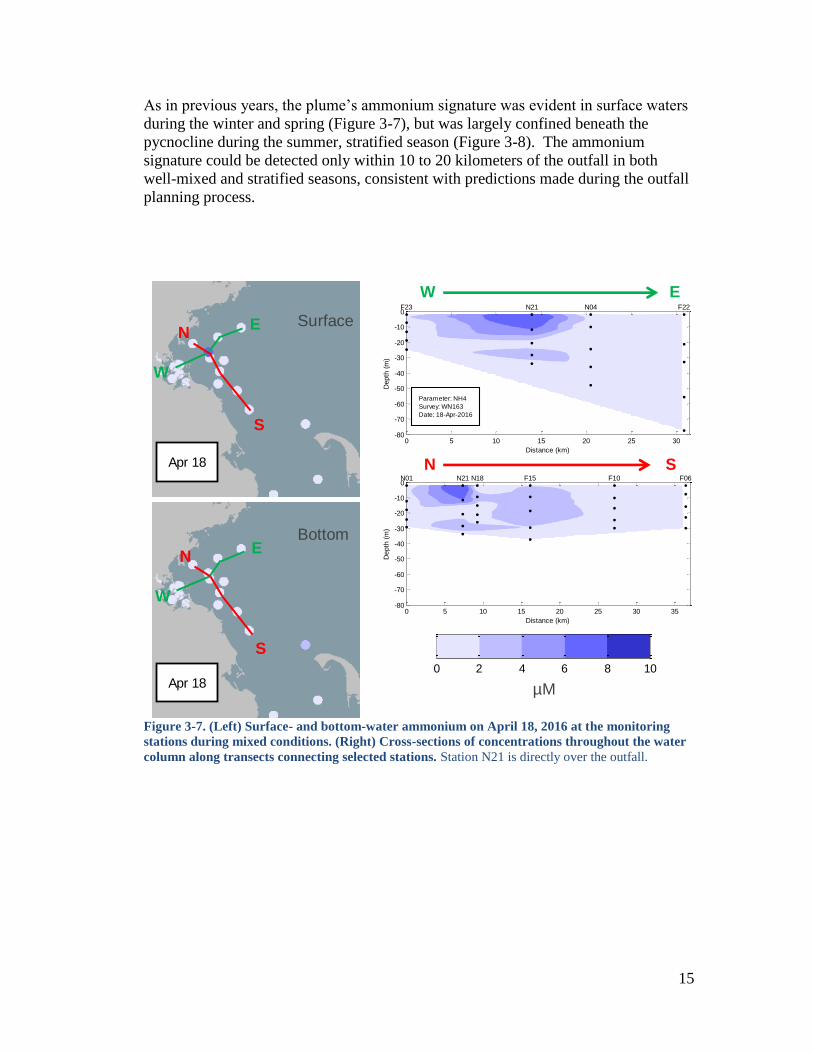
As in previous years, the plume’s ammonium signature was evident in surface waters
during the winter and spring (Figure 3-7), but was largely confined beneath the
pycnocline during the summer, stratified season (Figure 3-8). The ammonium
signature could be detected only within 10 to 20 kilometers of the outfall in both
well-mixed and stratified seasons, consistent with predictions made during the outfall
planning process.
Figure 3-7. (Left) Surface- and bottom-water ammonium on April 18, 2016 at the monitoring
stations during mixed conditions. (Right) Cross-sections of concentrations throughout the water
column along transects connecting selected stations. Station N21 is directly over the outfall.
Distance (km)
Depth
(m
)
0 5 10 15 20 25 30-80
-70
-60
-50
-40
-30
-20
-10
0
0
2
4
6
8
10F23 N21 N04 F22
Parameter: NH4
Survey: WN163
Date: 18-Apr-2016
Distance (km)
Depth
(m
)
0 5 10 15 20 25 30 35-80
-70
-60
-50
-40
-30
-20
-10
0
0
2
4
6
8
10N01 N21 N18 F15 F10 F06
Distance (km)
Depth
(m
)
0 2 4 6 8 10 12 14 16 18 20-80
-70
-60
-50
-40
-30
-20
-10
0
0
2
4
6
8
10F13 F15 N07 N04
71oW 48' 36' 24' 12' 70oW
42oN
10'
20'
30'
40'
0 2 4 6 8 10
Apr 18
71oW 48' 36' 24' 12' 70oW
42oN
10'
20'
30'
40'
0 2 4 6 8 10
Apr 18
W E
N S
Surface
Bottom
µM
N
S
W
E
N
S
W
E
71oW 48' 36' 24' 12' 70oW
42oN
10'
20'
30'
40'
0 2 4 6 8 10
Feb 04

16
Figure 3-8. (Left) Surface- and bottom-water ammonium on July 26, 2016 at the monitoring
stations during stratified conditions. (Right) Cross-sections of concentrations throughout the
water column along transects connecting selected stations. The pycnocline (yellow line) was
located at approximately 10 meters.
71oW 48' 36' 24' 12' 70oW
42oN
10'
20'
30'
40'
0 2 4 6 8 10
Jul 26
71oW 48' 36' 24' 12' 70oW
42oN
10'
20'
30'
40'
0 2 4 6 8 10
Jul 26
Distance (km)
Depth
(m
)
0 5 10 15 20 25 30-80
-70
-60
-50
-40
-30
-20
-10
0
0
2
4
6
8
10F23 N21 N04 F22
Parameter: NH4
Survey: WN166
Date: 26-Jul-2016
Distance (km)
Depth
(m
)
0 5 10 15 20 25 30 35-80
-70
-60
-50
-40
-30
-20
-10
0
0
2
4
6
8
10N01 N21 N18 F15 F10 F06
Distance (km)
Depth
(m
)
0 2 4 6 8 10 12 14 16 18 20-80
-70
-60
-50
-40
-30
-20
-10
0
0
2
4
6
8
10F13 F15 N07 N04
Surface
Bottom
N
S
W
E
N
S
W
E
N S
W E
71oW 48' 36' 24' 12' 70oW
42oN
10'
20'
30'
40'
0 2 4 6 8 10
Feb 04
µM

17
No increase in phytoplankton biomass, measured as chlorophyll or particulate organic
carbon, has been evident at the outfall since the discharge began, and none was
measured in 2016. The survey data showed elevated chlorophyll levels across much
of Massachusetts Bay in February, April, and August surveys and lower levels during
other months, particularly March (Figure 3-9). No unusual results were detected by
the survey data or by satellite imagery in 2016 (not shown).
Figure 3-9. Depth-averaged chlorophyll (mg/m2) by station in Massachusetts Bay in 2016.
71oW 48' 36' 24' 12' 70oW
42oN
10'
20'
30'
40'
0 40 80 120 160 200
Feb 12
71oW 48' 36' 24' 12' 70oW
42oN
10'
20'
30'
40'
0 40 80 120 160 200
Mar 23
71oW 48' 36' 24' 12' 70oW
42oN
10'
20'
30'
40'
0 40 80 120 160 200
Apr 18
71oW 48' 36' 24' 12' 70oW
42oN
10'
20'
30'
40'
0 40 80 120 160 200
May 18
71oW 48' 36' 24' 12' 70oW
42oN
10'
20'
30'
40'
0 40 80 120 160 200
Jun 21
71oW 48' 36' 24' 12' 70oW
42oN
10'
20'
30'
40'
0 40 80 120 160 200
Jul 26
71oW 48' 36' 24' 12' 70oW
42oN
10'
20'
30'
40'
0 40 80 120 160 200
Aug 23
71oW 48' 36' 24' 12' 70oW
42oN
10'
20'
30'
40'
0 40 80 120 160 200
Oct 03
71oW 48' 36' 24' 12' 70oW
42oN
10'
20'
30'
40'
0 40 80 120 160 200
Nov 01
71oW 48' 36' 24' 12' 70oW
42oN
10'
20'
30'
40'
0 40 80 120 160 200
Apr 18

18
Typically, concentrations of dissolved oxygen in bottom waters of Massachusetts Bay
fall steadily from highest concentrations in the spring to lowest in the fall, with
recovery after the breakdown of stratification in the fall. In 2016, that steady decline
was interrupted by a mixing event in June. Early destratification, a result of a late
September storm and persistent winds, resulted in relatively high oxygen minima at
some stations. Although low oxygen levels were measured in some deep waters in
the fall, oxygen minima were higher than would have been expected, considering the
warm bottom waters and high salinities in 2016.
Figure 3-10. Bottom-water dissolved oxygen concentrations at selected stations in 2016 compared
to prior years. Black points and line are results from individual surveys in 2016. Results from 1992–
2015 are in blue: line is the 50th percentile, dark shading spans the 25th to 75th percentile, and light
shading spans the range.

19
Phytoplankton Communities
As in recent years, total observed phytoplankton abundances were low throughout the
year and throughout Massachusetts Bay (Figure 3-11, Libby et al. 2017).
Abundances were low during the first survey of the year, even though chlorophyll
levels were relatively high. Abundances peaked in April, during a moderate bloom of
centric diatoms, with total phytoplankton cell counts highest at Boston Harbor Station
F23 and coastal Station F13. The bloom was dominated by Thalassiosira spp. and
Skeletonema spp., which are the generally dominant taxa in the summer in
Massachusetts Bay.
Figure 3-11. Total phytoplankton abundance (million cells per liter) at selected stations in 2016
compared to prior years. Black points and line are results from individual surveys in 2016. Results
from 1992–2015 are in blue: line is the 50th percentile, dark shading spans the 25th to 75th percentile,
and light shading spans the range.
2016
1992-2015Median25-75%
Range

20
Since 2000, spring diatom blooms have often been followed by April blooms of the
nuisance species Phaeocystis pouchetii. Since 2013, Phaeocystis abundances have
been relatively low, both in the nearfield and throughout Massachusetts Bay, and this
trend continued in 2016 (Figure 3-12). However, Phaeocystis abundance in one May
sample was sufficiently high to exceed the very low summer Contingency Plan
threshold (see Contingency Plan Thresholds, below).
Figure 3-12. Mean nearfield abundance of Phaeocystis pouchetii in 2016, compared to 1992–2015.
Black points and line are results from individual surveys in 2016. Results from 1992–2015 are in blue:
line is the 50th percentile, dark shading spans the 25th to 75th percentile, and light shading spans the
range. Note log scale.

21
Nearfield abundance of the toxic dinoflagellate Alexandrium fundyense (responsible
for red tide in New England) remained relatively low in 2016 (Figure 3-13). Its
presence in one farfield sample during the May survey exceeded 100 cells per liter,
triggering Alexandrium rapid-response surveys.
Figure 3-13. Nearfield abundance of Alexandrium fundyense, 1992–2016.
In early May, Alexandrium cells had been sufficiently abundant in the western Gulf of
Maine that paralytic shellfish poisoning (PSP) toxicity was measured in coastal and
offshore New Hampshire waters. On May 5–7, a storm with winds from the northeast
brought cells into Massachusetts Bay, and during the May 18 survey, cell counts were
elevated at the northeast farfield Station F22. On May 25, elevated abundances of
Alexandrium were detected during the special survey, but only at stations just south of
Cape Ann in northeastern Massachusetts Bay. By the June 21 regular survey, no
Alexandrium cells were detected in any sample from Massachusetts Bay. No PSP
toxicity was measured in Massachusetts Bay at any time in 2016.
1
10
100
1,000
10,000
100,000
Ale
xa
nd
riu
m p
er s
ampl
e
(CEL
LS/L
+1
)
baseline outfall discharge caution threshold

22
Zooplankton Communities
Annual peak abundances of total zooplankton did not reach the record highs observed
in 2015 (Figure 3-14, Libby et al. 2017). Those 2015 abundances were largely driven
by the presence of bivalve veliger larvae in July and August, and those ephemeral
taxa were not present in large numbers during the 2016 surveys. However,
abundances of total zooplankton and of other dominant taxa were above the maxima
for the monitoring program at many stations from February through June. Warm
temperatures may have contributed to early increases in zooplankton abundances.
Figure 3-14. Total zooplankton abundance (10,000 animals per square meter) at selected stations
in 2016 compared to prior years. Black points and line are results from individual surveys in 2016.
Results from 1992–2015 are in blue: line is the 50th percentile, dark shading spans the 25th to 75th
percentile, and light shading spans the range.
In general, since 2008, total phytoplankton abundance has declined, while total
zooplankton abundance has increased. Regression analyses suggest that
phytoplankton abundance may be at least partially controlled by zooplankton grazing.
2016
1992-2015Median25-75%
Range

23
Stellwagen Bank National Marine Sanctuary
The NPDES permit to discharge from Deer Island Treatment Plant into
Massachusetts Bay requires annual reporting on results that are relevant to the
Stellwagen Bank National Marine Sanctuary. Water column Station F22 is in
Stellwagen Basin, to the northwest of the sanctuary, and is considered to be
representative of northern, offshore conditions.
Ammonium levels have remained low at Station F22 since the outfall began to
discharge (see, for example, Figure 3-6, above). Levels have also remained low at
Station F06, located to the south of the outfall and offshore. In contrast, increased
ammonium levels have been detected in the nearfield, while decreases have been
detected at representative harbor and coastal stations.
Sampling at Station F22 and data from NERACOOS Buoy A01 (Figure 3-15), as well
as satellite imagery (not shown), detected no unusual chlorophyll levels in offshore
regions in 2016. No effects on chlorophyll levels in the offshore were predicted, and
none have been measured.
Bottom-water dissolved oxygen concentrations at Station F22 were healthy
throughout 2016, and both survey observations and data from NERACOOS Buoy
A01, located within the sanctuary, showed the typical decline during the stratified
season (Figure 3-15). Data from the buoy documented the return to oxygenated
conditions as a result of fall mixing events.
Figure 3-15. Bottom water dissolved oxygen concentrations at NERACOOS Buoy A01, inside the
Stellwagen Bank National Marine Sanctuary, and at nearby Station F22. The NERACOOS
measurement (blue) is at 51 m, the deep Station F22 (yellow) at 52 m, and the near-bottom Station F22
(red) at 78 m. DO = dissolved oxygen
5
6
7
8
9
10
11
12
Ox
yg
en
co
nce
ntr
ati
on
(m
g/l)
NERACOOS Buoy A01 (51 m)
Deep DO station F22 (52 m)
Near-bottom DO station F22 (78 m)
24
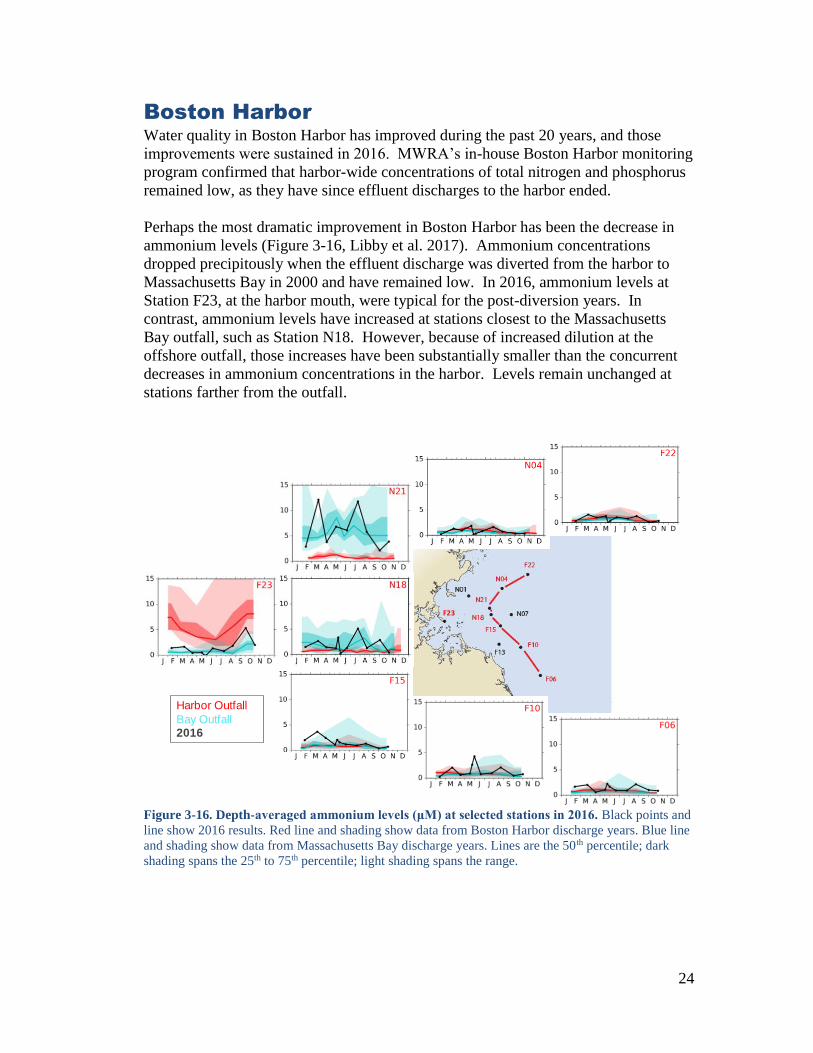
Boston Harbor
Water quality in Boston Harbor has improved during the past 20 years, and those
improvements were sustained in 2016. MWRA’s in-house Boston Harbor monitoring
program confirmed that harbor-wide concentrations of total nitrogen and phosphorus
remained low, as they have since effluent discharges to the harbor ended.
Perhaps the most dramatic improvement in Boston Harbor has been the decrease in
ammonium levels (Figure 3-16, Libby et al. 2017). Ammonium concentrations
dropped precipitously when the effluent discharge was diverted from the harbor to
Massachusetts Bay in 2000 and have remained low. In 2016, ammonium levels at
Station F23, at the harbor mouth, were typical for the post-diversion years. In
contrast, ammonium levels have increased at stations closest to the Massachusetts
Bay outfall, such as Station N18. However, because of increased dilution at the
offshore outfall, those increases have been substantially smaller than the concurrent
decreases in ammonium concentrations in the harbor. Levels remain unchanged at
stations farther from the outfall.
Figure 3-16. Depth-averaged ammonium levels (μM) at selected stations in 2016. Black points and
line show 2016 results. Red line and shading show data from Boston Harbor discharge years. Blue line
and shading show data from Massachusetts Bay discharge years. Lines are the 50th percentile; dark
shading spans the 25th to 75th percentile; light shading spans the range.
Harbor Outfall
Bay Outfall2016
F23

25
Contingency Plan Thresholds
All water-quality parameters were within normal ranges during 2016. There was one
Contingency Plan caution-level threshold exceedance for a nuisance algae measure,
summer Phaeocystis pouchetii abundance (Table 3-1).
Table 3-1. Contingency Plan threshold values and 2016 results for water-column monitoring.
Parameter Baseline Caution Level Warning Level 2016 Results
Dissolved oxygen*
Nearfield concentration
6.05 mg/L <6.5 mg/L <6.0 mg/L 7.12 mg/L
Nearfield percent saturation
65.3% <80% <75% 83.9%
Stellwagen concentration
6.23 mg/L <6.5 mg/L <6.0 mg/L 6.33 mg/L
Stellwagen percent saturation
67.2% <80 <75% 70.5%
Nearfield depletion rate
0.024 mg/L/d >0.037 mg/L/d >0.049 mg/L/d 0.01 mg/L/d
Chlorophyll
Annual 72 mg/m2 >108 mg/m2 >144 mg/m2 87 mg/m2
Winter/spring 50 mg/m2 >199 mg/m2 None 89 mg/m2
Summer 51 mg/m2 >89 mg/m2 None 85 mg/m2
Autumn 90 mg/m2 >239 mg/m2 None 89 mg/m2
Nuisance algae Phaeocystis pouchetii
Winter/spring 622,000 cells/L >2,860,000 cells/L None 6,790 cells/L
Summer 79 cells/L >357 cells/L None 1,110 cells/L, caution level exceedance
Autumn 370 cells/L >2,960 cells/L None Absent
Nuisance algae nearfield Pseudo-nitzschia
Winter/spring 6,735 cells/L >17,900 cells/L None Absent
Summer 14,635 cells/L >43,100 cells/L None 954 cells/L
Autumn 10,050 cells/L >27,500 cells/L None 3,310 cells/L
Nuisance algae nearfield Alexandrium fundyense
Any nearfield sample
Baseline maximum 163 cells/L
>100 cells/L None 15 cells/L
PSP toxin extent NA New incidence None No new incidence
*Dissolved oxygen caution and warning levels represent numerical criteria, with the caveat “unless
background conditions are lower.” Results are therefore compared to the baseline rather than to the
caution and warning levels.
PSP = paralytic shellfish poisoning
NA = not applicable

26
While winter-spring abundances of Phaeocystis pouchetii have been low in recent
years (Figure 3-17, top) exceedances of the very low summer Phaeocystis threshold
have occurred in several years (Figure 3-17, bottom). In May 2016, for example,
Phaeocystis was detected in just one nearfield sample, but its presence, even at the
low abundance of 36,000 cells per liter, was sufficient to exceed the summer
Contingency Plan caution threshold. These exceedances have been evaluated and
discussed with OMSAP, EPA, and MassDEP and have been determined to have
caused no measurable aesthetic or other adverse effects. While the threshold
remained in effect in 2016, OMSAP and the regulators have agreed to discontinue its
use in future years.
Figure 3-17. Mean nearfield abundance of Phaeocystis pouchetii, 1992–2016. (Top) Winter-spring.
(Bottom) Summer. (No Phaeocystis were detected in years with no symbol.) Note the difference in
scales for winter-spring (caution-level threshold of 2.86 million cells per liter) and summer (caution
threshold of 357 cells per liter).
1
10
100
1,000
10,000
100,000
1,000,000
10,000,000
Win
ter-
spri
ng
Ph
aeo
cyst
is
(ce
lls/
l)
baseline outfall discharge caution threshold
1
10
100
1,000
10,000
100,000
1,000,000
Sum
me
r P
hae
ocy
stis
(c
ell
s/l)
baseline outfall discharge caution threshold

27
4. Sea Floor
Seafloor monitoring in 2016 included sampling and analysis of soft-bottom sediment
conditions, tracers, and infauna at 14 stations and sediment-profile imaging at 23
stations (Figures 4-1, 4-2). Every three years, most recently in 2014, monitoring
includes analysis of chemical contaminants in sediments and an assessment of hard-
bottom habitats.
Figure 4-1. Soft-bottom monitoring stations. Benthic community parameters and sediment
characteristics are measured in samples from 14 stations. Also shown are the instrumented buoys, the
MWRA outfall diffuser, and the Stellwagen Bank National Marine Sanctuary.

28
Figure 4-2. Sediment-profile imaging stations. Images are taken at 23 stations and provide rapid
assessments of benthic habitats. Also shown are the NDBC buoy and the MWRA outfall diffuser.
SPI = sediment-profile imaging

29
Soft-bottom sediment sampling was completed in August 2016, with samples
analyzed for grain-size distribution, total organic carbon, the effluent tracer
Clostridium perfringens spores, and benthic infauna. The 14 stations included one
station in the “transition” area, located between Boston Harbor and the nearfield
stations (FF12); four nearfield stations located within two kilometers of the outfall
(NF13, NF14, NF17, NF24); six nearfield stations located within Massachusetts Bay
but farther than two kilometers from the outfall (NF04, NF10, NF12, NF20, NF21,
NF22); and three farfield reference stations located in Massachusetts Bay and Cape
Cod Bay (FF01A, FF04, and FF09). For the purposes of threshold testing,
“nearfield” includes the transition station, as well as both nearfield groups, for a total
of eleven stations.
Sediment-profile imaging was also completed in August 2016. Triplicate images
from 23 stations were used to measure the apparent reduction-oxidation (redox)
potential discontinuity (RPD) depth, an approximation of the depth of oxygen
penetration into the sediments; the apparent successional stage, often indicative of the
health of the benthic community; and an organism-sediment index which is derived
from the RPD depth and the successional stage.
Sediment Characteristics and Tracers
As in past years, sediment grain-size distributions in 2016 varied broadly among
stations, ranging from silt and clay at some stations to mostly sand at others (Nestler
et al. 2017). Sediment grain-size distributions have remained generally consistent at
individual stations over the years of the monitoring program. Changes that have
occurred have been mostly associated with large storms, having wave-driven currents
sufficient to re-suspend bottom sediments.
Percent organic carbon content, which tracks closely with fine material in the
samples, was consistent with past results at most stations, with higher mean total
organic carbon concentrations at stations with finer sediments. Total organic carbon
concentrations showed no signs of organic enrichment from the effluent discharge,
even at stations closest to the outfall.
As in past years since the offshore outfall began to discharge, it was possible to detect
elevated levels of Clostridium perfringens spores at the stations located closest to the
outfall (Figures 4-3 and 4-4). Past years’ statistical analyses have shown that these
increases close to the outfall are consistent with predictions made during the outfall
planning process.

30
Figure 4-3. Concentrations of Clostridium perfringens spores, corrected for sediment grain size,
in 2016.
Figure 4-4. Mean concentrations of Clostridium perfringens spores during the baseline and
outfall discharge years. Tran = transition area, stations located between Boston Harbor and the
outfall; NF<2km = nearfield stations located within 2 km of the outfall diffusers; NF>2km = nearfield
stations located further than 2 km from the diffusers; FF = farfield stations offshore from the outfall
Clo
str
idiu
m p
erf
ringens (
cfu
/g d
ry/%
fines)
0
50
100
150
200
250
300
350Outfall Startup
1992 1994 1996 1998 2000 2002 2004 2006 2008 2010 2012 2014 2016
NF <2kmNF >2kmTranFF

31
Soft-bottom Communities
The 14 soft-bottom samples collected and analyzed in 2016 yielded 18,077
organisms, classified into 175 species and 21 other discrete taxonomic groups
(Nestler et al. 2017). Total abundance of organisms was comparable to recent years
and within the ranges of the monitoring program (Figure 4-5). Abundances by station
(not shown) were also similar to the past. As in 2014 and 2015, total abundance was
highest at stations within the transition area located between the harbor and the
nearfield. It remained at the low end for the monitoring program at farfield stations.
The mean numbers of species per sample were typical for the monitoring program in
all areas.
Figure 4-5. Mean infaunal abundance per sample during the baseline and outfall-discharge
years. Tran = transition area, stations located between Boston Harbor and Massachusetts Bay;
NF<2km = stations within 2 km of the outfall; NF>2km = nearfield stations greater than 2 km from the
outfall; FF = farfield stations offshore from the outfall
Tota
l A
bundance
0
500
1000
1500
2000
2500
3000
3500
4000
4500Outfall Startup
1992 1994 1996 1998 2000 2002 2004 2006 2008 2010 2012 2014 2016
NF <2kmNF >2kmTranFF

32
Community analyses continued to show that sediment grain size, rather than
proximity to the outfall, is a major determinant of community composition and
relative abundance. (Depth is also a major determinant; see the section on the
Stellwagen Bank Marine Sanctuary, p. 34.) A series of multivariate analyses assessed
spatial and temporal patterns in the soft-bottom benthic communities and found no
particular species or type of community that could be specifically associated with the
outfall.
As in past years, a cluster analysis identified two main infaunal assemblages, with an
outlier at Station FF04, which is offshore in the deeper waters of Stellwagen Basin
and has consistently had a distinct community. Ordination analysis demonstrated that
variations in species distributions largely followed differences in sediment type
(Figure 4-6). The multivariate analyses have shown no indication of any relation of
species composition to proximity to the outfall.
Figure 4-6. Percent fine sediments superimposed on the ordination plot of the 2016 infauna
samples. Each point on the plot represents one of the 14 stations; similarity of species composition is
indicated by proximity of points on the plot. Faunal assemblages (Groups I-II, and sub-groups)
identified by cluster analysis are circled on the plot.

33
Sediment-profile Imaging
Sediment-profile images continued to show no adverse effects of the outfall (Nestler
et al. 2017). Rough topography and physical processes in the nearfield remain the
more important factors in determining benthic habitat quality.
As in past years, the average RPD depth (the depth to which oxygen penetrates into
sediments as determined by color changes) was deeper than average RPD depths
measured during the baseline period (Figure 4-7). At 16 of the 23 stations, the RPD
was deeper than the bottom of the images. The environmental concern before the
outfall began to discharge was that the RPD depth would become shallower, due to
increases in sediment organic matter causing stress on sensitive sediment-dwelling
organisms. A deeper RPD continued to indicate that there has been no adverse effect
from the discharge.
Figure 4-7. Annual apparent color RPD depth for data from nearfield stations. The average RPD
discharge-period mean has been deeper than the baseline mean, continuing to indicate that there has
been no adverse effect from the discharge.
Monitoring has shown that physical processes, such as storms and storm-induced
sediment transport, are the primary stressors on the Massachusetts Bay sea floor. The
dominance of physical forces is typical of outfalls that have been located in high-
energy areas that promote rapid dispersion of effluent discharges. Physical forces
that mix water into the sediments or transport coarser sediments to the sea floor may
result in deepening of the RPD depths.
0
1
2
3
4
5
6
7
8
RP
D (c
m)
baseline outfall discharge caution threshold
34
Stellwagen Bank National Marine Sanctuary
The NPDES permit to discharge from Deer Island Treatment Plant into
Massachusetts Bay requires annual reports on results that are relevant to the
Stellwagen Bank National Marine Sanctuary. MWRA’s deepwater reference Station
FF04 lies within the depositional part of the sanctuary, in Stellwagen Basin, where
long-term accumulation of pollutants and their effects could be detected if they were
to occur.
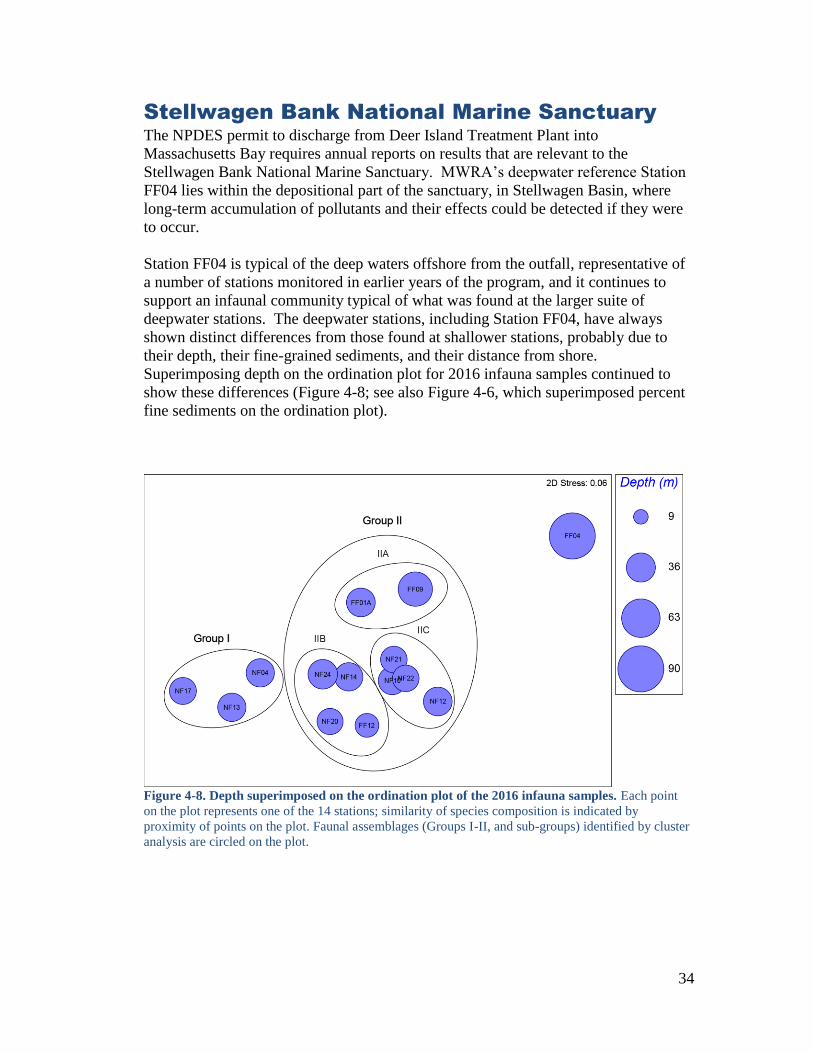
Station FF04 is typical of the deep waters offshore from the outfall, representative of
a number of stations monitored in earlier years of the program, and it continues to
support an infaunal community typical of what was found at the larger suite of
deepwater stations. The deepwater stations, including Station FF04, have always
shown distinct differences from those found at shallower stations, probably due to
their depth, their fine-grained sediments, and their distance from shore.
Superimposing depth on the ordination plot for 2016 infauna samples continued to
show these differences (Figure 4-8; see also Figure 4-6, which superimposed percent
fine sediments on the ordination plot).
Figure 4-8. Depth superimposed on the ordination plot of the 2016 infauna samples. Each point
on the plot represents one of the 14 stations; similarity of species composition is indicated by
proximity of points on the plot. Faunal assemblages (Groups I-II, and sub-groups) identified by cluster
analysis are circled on the plot.

35
Boston Harbor
While the chemistry and biology of the Massachusetts Bay sea floor have not been
affected by the relocated outfall, conditions have greatly improved and continue to
improve in Boston Harbor, a result of the Boston Harbor Project and more recent
enhancements to treatment and remediation of combined sewer overflows. MWRA
has conducted ongoing seafloor monitoring in Boston Harbor since 1991. Annual
sediment and infauna samples are taken from nine stations (Figure 4-9).
Figure 4-9. Soft-bottom sampling stations in Boston Harbor. Nine stations are sampled each year
for sediment characteristics and infauna analyses.
Concentrations of total organic carbon (not shown) and Clostridium perfringens
spores (Figure 4-10) have declined over time. Infaunal diversity has increased,
reflecting continued improvement in habitat conditions. An ordination plot of Boston
Harbor infaunal samples shows a separate community in stations in the outer harbor
and a most unique fauna at Station T04 at the mouth of Savin Hill Cove, a location
recognized as one of the most polluted sites in the harbor (Figure 4-11). Sediment-
profile imaging (not shown) also confirmed an inner- to outer-harbor gradient.

36
Figure 4-10. Mean concentrations of Clostridium perfringens spores at selected harbor stations,
1991–2016.
Figure 4-11. Ordination plot of 2016 Boston Harbor infauna samples. Two samples are collected
per station. Group I comprises stations from the outer harbor; Group II includes Station C019 in the
inner harbor and Station T07 in Quincy Bay. The assemblage most different from others was found at
Station T04, at the mouth of Savin Hill Cove, in Dorchester Bay.
Clo
str
idiu
m p
erf
ringens (
cfu
/g d
ry/%
fines)
0
100
200
300
400
500
600
700
800
900
1000
1100
1990 1992 1994 1996 1998 2000 2002 2004 2006 2008 2010 2012 2014 2016
T01T02T04T08C019

37
Contingency Plan Thresholds
There were no seafloor Contingency Plan threshold exceedances in 2016 (Table 4-1).
Values for Shannon-Wiener diversity and Pielou’s evenness, both diversity measures
that triggered exceedances in 2010–2014, remained high but were within the upper
caution-level ranges (Figure 4-12). Two other community threshold parameters, total
number of species per sample (species richness) and Fisher’s log-series alpha, another
diversity measure, were also within the caution-level ranges. Percent opportunists
among the soft-bottom community remained far below caution and warning levels.
There has been no indication, even when diversity levels exceeded the upper bounds
of the caution-level thresholds, that environmental conditions have worsened or that
there has been any effect of the outfall. Indeed, increased diversity is typically
considered a good outcome in benthic habitats. The 2010–2014 exceedances, when
reviewed, were found to be natural fluctuations in the environment, with no indication
of any effect of the outfall. Therefore, OMSAP, with concurrence of EPA and
MassDEP, has agreed to discontinue the upper bounds as Contingency Plan
thresholds for future monitoring years.
Table 4-1. Contingency Plan threshold values and 2016 results for seafloor monitoring.
Parameter Baseline Caution Level Warning Level 2016 Results
Sediment parameters
RPD depth NA <1.18 cm None 3.89 cm
Benthic community parameters
Species per sample
NA <42.99 or >81.85 None 58.5
Fisher’s log-series alpha
NA <9.42 or >15.8 None 12.7
Shannon-Wiener diversity
NA <3.37 or >3.99 None 3.93
Pielou’s evenness NA <0.57 or >0.67 None 0.672
% opportunists NA >10% >25% 0.21%
HMW = high molecular weight; LMW = low molecular weight
NA = not applicable; RPD = redox potential discontinuity

38
Figure 4-12. Annual community parameters with nearfield Contingency Plan thresholds. The
varied symbols represent differences in the stations sampled over the years of the program. Results
were tested against thresholds calculated for each sampling design, but only the current threshold
values are shown. Except for the percent opportunists threshold, which is based on levels in Boston
Harbor, thresholds have both upper and lower bounds to show potentially meaningful changes from the
baseline. Upper level threshold will be discontinued in 2017. SD = standard deviation
0.40
0.45
0.50
0.55
0.60
0.65
0.70
0.75
0.80Evenness (J)
Baseline mean Thresholds
Mean +/-1SD Outfall startup

39
5. Fish and Shellfish
Each year, MWRA monitors the health of winter flounder from the Massachusetts
Bay outfall site, Deer Island Flats in Boston Harbor, off Nantasket Beach just outside
the harbor, and eastern Cape Cod Bay (Figure 5-1). Every three years, most recently
in 2015, monitoring includes chemical analyses of flounder fillets and liver, lobster
meat and hepatopancreas, and cage-deployed blue mussels. Sampling and analysis in
2016 were limited to winter flounder health assessments.
Figure 5-1. Fish-and-shellfish monitoring stations. Also shown are the two instrumented buoys, the
MWRA outfall diffuser, and the boundaries of the Stellwagen Bank National Marine Sanctuary.

40
Flounder Health
Annual flounder monitoring focuses on external condition and the presence of early
liver disease and tumors (neoplasia). In April 2016, 50 sexually mature flounder
were collected from each of the four sites: Deer Island Flats, off Nantasket Beach, the
outfall site, and eastern Cape Cod Bay. Catch per unit effort, which has varied
through time, was highest at eastern Cape Cod Bay. Abandoned fishing gear,
sometimes referred to as “ghost gear,” continued to interfere with catches,
particularly in muddy depressions at the outfall and at Deer Island Flats.
Across the sites, mean age of fish ranged from 4.0 to 4.7 years, and standard length
ranged from 278 to 323 millimeters, within the ranges for the monitoring
program. As is common throughout northeast coastal populations, the catches were
dominated by females (see Moore et al. 2016 for analysis of MWRA and other
northeast flounder studies).
Measures of external condition continued to suggest improved conditions in
comparison to the 1980s and 1990s, and there continued to be no evidence of
neoplasia. Tumors have not been observed by the monitoring program since 2004
and have never been observed in fish taken from the outfall site.
The incidence of centrotubular hydropic vacuolation (CHV), a mild condition
associated with exposure to contaminants and a neoplasia precursor, remained lower
than the baseline observations (Figure 5-2). Incidence of CHV at the outfall was the
lowest measured since MWRA monitoring began in 1991. At Deer Island Flats, near
the location of the former Boston Harbor outfall, there was an increase in incidence to
about 30% in 2015 and 2016, but even in those years, levels remained lower than
observed levels before discharge was diverted to Massachusetts Bay. Average
severity of CHV (not shown) also remained lower than baseline levels, and reasons
for the two years of increased CHV prevalence were unclear. (In 2017, data not
shown, CHV incidence in fish from Deer Island Flats returned to levels similar to
what was observed in 2010–2013, about 24%.)

41
Figure 5-2. Annual prevalence of centrotubular hydropic vacuolation (CHV), 1991–2016. DIF =
Deer Island Flats, ECCB = Eastern Cape Cod Bay, NB = Nantasket Beach, OS = Outfall Site
Contingency Plan Thresholds
There was no Contingency Plan threshold exceedance for the only parameter
measured for 2016 (Table 5-1). Incidence of CHV, the most common indicator of
liver disease in winter flounder of the region, was 4% in fish taken from the vicinity
of the outfall, the lowest recorded during the monitoring program, far lower than the
44.9% caution threshold or 24.4% baseline average.
Table 5-1. Contingency Plan threshold value and 2016 results for fish-and-shellfish monitoring.
Parameter Baseline Caution Level Warning Level 2016 Results
Flounder disease
Liver disease (CHV)
24.4% >44.9% None 4%
CHV = centrotubular hydropic vacuolation
CH
V P
reva
lence (
%)
0
10
20
30
40
50
60
70Outfall Startup
1990 1992 1994 1996 1998 2000 2002 2004 2006 2008 2010 2012 2014 2016
DIFECCBNBOS

42
6. Special Studies
Besides monitoring the effluent and the water column, sea floor, and fish and
shellfish in Massachusetts Bay, MWRA conducts special studies in response to
specific permit requirements, scientific questions, and public concerns. This year’s
overview focuses on special studies of indicator bacteria in sewage effluent,
continued recovery in Boston Harbor, and ongoing monitoring by the Center for
Coastal Studies in Cape Cod Bay.
Indicator Bacteria in Sewage Effluent
MWRA’s NPDES permit to discharge effluent at the Massachusetts Bay outfall
specifies that daily counts of sewage-indicator fecal coliform bacteria not exceed
14,000 coliforms per 100 milliliters at the point of dechlorination, just prior to
discharge. Except for one event in 2001 and another in 2004, this daily permit limit
has been met throughout the duration of monitoring. Since 2008, almost half of all
samples have had no detectable fecal coliform bacteria, and the maximum count was
only 501 fecal coliforms per 100 milliliters (Figure 6-1).
Figure 6-1. Daily geometric mean fecal coliform bacteria in Deer Island effluent, 2008–2016, in
comparison to the permit limit, 14,000 fecal coliforms per 100 milliliters. Note log scale.
14,000 fecal coliform bacteria per 100 mL

43
Future permits may include a limit for another indicator bacteria species group,
Enterococcus. Meeting an Enterococcus effluent limit could be more difficult than
meeting the fecal coliform bacteria limit, potentially requiring greater levels of
chlorination and subsequent dechlorination prior to discharge.
MWRA already monitors Enterococcus in both the effluent and in the vicinity of the
Massachusetts Bay outfall (Figure 6-2). Those samples show that under current
levels of disinfection, Enterococcus counts in the effluent vary strongly by season,
with peak counts during the late winter. Despite this variation in the effluent, levels
in the receiving water are relatively constant throughout the year and have met the
state water quality standard, 35 Enterococcus per 100 milliliters, in more than 99.9%
of all samples. The vast majority of samples taken from Massachusetts Bay have had
undetectable levels of either fecal coliform or Enterococcus indicator bacteria.
Figure 6-2. Monthly geometric mean Enterococcus bacteria in Deer Island effluent, 2008–2016,
in comparison to monthly geometric mean Enterococcus in surface and bottom samples from two
stations near the outfall. Note log scale. Enterococcus have not been detected in any February sample
from the outfall.
Deer Island effluent samples
Massachusetts Bay outfall samples

44
Recovery in Boston Harbor
In 1990, when MWRA discharged both biosolids (sludge) and inadequately treated
municipal effluent into Boston Harbor, the harbor was known as one of the dirtiest in
the nation. One major problem was eutrophication, that is, an excess of organic
matter, which can lead to low levels of dissolved oxygen in the water column and the
bottom sediments. In addition to organic matter, the Boston Harbor outfalls
discharged nutrients that fueled excessive phytoplankton growth. When the
phytoplankton died and decomposed, bacteria removed oxygen from the water.
Decomposing phytoplankton also sank to the sea floor, where excess organic matter
enhanced benthic respiration and nutrient fluxes, also contributing to lower oxygen
levels. However, because tidal mixing in Boston Harbor is strong, oxygen
concentrations were not reduced to the unhealthiest conditions, hypoxia or anoxia.
With the end of biosolids discharge in 1991 and the end of effluent discharge in 2000,
nutrient inputs have declined, and those decreases have resulted in changes in the
water column and the sea floor. Nitrogen inputs are now about 20% of what they
were in 1990, and phosphorus inputs are about 5% (Figure 6-3, top). Organic carbon
inputs (not shown), have fallen to less than half of what they were in the past.
With the decreases in nutrient inputs, annual primary production (growth of
phytoplankton or algae) in the water column has also decreased, changing the
classification of the harbor from an unhealthy, hyper-eutrophic water body to a much
more favorable condition, borderline eutrophic or mesotrophic (Figure 6-3, middle).
In 1990, there had been predictions that primary production might increase despite
declines in nutrient inputs, because increased water clarity could also stimulate
phytoplankton blooms. In fact, blooms in 2002 and 2007 were not associated with
any change in nutrient inputs and may have been storm-induced. Through the overall
course of the program, however, phytoplankton production has declined.
Phytoplankton biomass (not shown) has also declined over the same period.
Sediment metabolism, the rates of processes such as sediment respiration and
regeneration of nutrients by bacteria in the sediments, have also decreased in Boston
Harbor (Figure 6-3, bottom). The changes in these measures have been smaller and
more variable than the changes observed among the water column parameters. The
effects of the 2002 and 2007 phytoplankton blooms were apparent, with increases in
benthic fluxes during the immediately following years. The pattern demonstrates a
strong coupling between the water column and the sediments.
Numbers of benthic organisms (not shown) have also declined in response to the
decreases in nutrients and organic matter. Organism density and extent of dense
amphipod mats reached minima about five to eight years after the end of effluent
discharge to the harbor, corresponding well to the changes in phytoplankton
production and nutrient fluxes.

45
1992
1994
1996
1998
2000
2002
2004
2006
2008
2010
0
20
40
60
80
100
120
140A
nn
ual
to
tal
N
inp
uts
( g
N m
-2 y
-1 )
P
N
Wastewater project
0
4
8
12
16
20
24
An
nu
al
to
tal
P
inp
uts
( g
P m
-2 y
-1 )
Figure 6-3. Annual nutrient inputs, pelagic community production, and benthic fluxes in Boston
Harbor. N=nitrogen, P=phosphorus, C=carbon, DIN=dissolved inorganic nitrogen
0
200
400
600
800
1000
Oligotrophic
Mesotrophic
Eutrophic2007
20
02
20
04
20
08
20
06A
nn
ua
l p
ela
gic
p
rim
ary
pro
du
cti
on
(g
C m
-2 y
-1 )
2002
Hyper-eutrophic
19
94
19
96
19
98
20
00
20
10
Wastewater project
0
100
200
300
400
500
0
5
10
15
20
25
20072002
19
92
19
94
19
96
19
98
20
00
20
02
20
04
20
06
20
08Be
nth
ic
ae
rob
ic
org
an
ic
C
min
era
liza
tio
n r
ate
s (
g C
m-
2 y
-1)
DIN
fl
ux
es
(g N
m-
2 y
-1)
20
10
Wastewater project

46
Cape Cod Bay Studies
The Center for Coastal Studies has conducted a monitoring program in Cape Cod Bay
for many years, and since 2011, MWRA has collaborated on a portion of the
program. The Center for Coastal Studies monitoring program includes MWRA
water-column Station F29, on the southern boundary of Stellwagen Bank National
Marine Sanctuary, MWRA Stations F01 and F02 in Cape Cod Bay and eight
additional stations (Figure 6-4). Recent years’ studies have documented conditions
ranging from one of the coldest winter sampling dates in early 2015 to the second
warmest of winters in early 2016 (Costa et al. 2017). Similar to other MWRA
analyses, the studies have found that, in general, nutrient levels and phytoplankton
abundances have been somewhat lower than average in recent years, while
zooplankton abundances have been higher.
Figure 6-4. The Center for Coastal Studies monitors its own eight stations (black) and three
MWRA stations (F01, F02, and F29) in and near Cape Cod Bay. (Figure from the Center for
Coastal Studies)
The Center for Coastal Studies also monitors North Atlantic right whales, which are
protected under the U.S. Endangered Species and Marine Mammal Protection acts,
with Massachusetts and Cape Cod bays considered to be key habitat. Aerial surveys
flown along a series of east-west tracks over Cape Cod Bay record presence, dive
times, and whale behaviors. Right whales typically occur in Cape Cod Bay during
January through May, entering when nutrient and chlorophyll levels are high, and the
large zooplankton species favored as food are abundant. In 2016, peak numbers of
whales were sighted in March and April. Unlike some years, March sightings did not
correspond to zooplankton density (Figure 6-5), although the correspondence was
better in April (not shown). Direct observations of deep-diving behaviors suggested
that whales may have been feeding more deeply than in other years.

47
Figure 6-5. Whale sightings (black dots) and zooplankton density (purple shading) in Cape Cod
Bay in March 2016. (Figure from the Center for Coastal Studies.)
Overall, there were 178 identified whales observed throughout the season (Figure 6-
6), approximately one third of the known North Atlantic right whale population.
Total sightings were more numerous than in 2015, when frigid winter conditions
delayed the arrival of whales into Cape Cod Bay, but fewer than in 2011–2014.
Figure 6-6. Total individual right whale sightings and sightings per unit effort (IPUE) in Cape
Cod Bay in 1998–2016. (Figure from the Center for Coastal Studies.)

48
References
Costa AS, Taylor DI, Accardo C, Hudak C, McKenna B. 2016. Water column
monitoring results for Cape Cod Bay and Stellwagen Bank National Marine
Sanctuary 2014–2016. Boston: Massachusetts Water Resources Authority. Report
2017-07. 18 p.
EPA. 1988. Boston Harbor wastewater conveyance system. Final supplemental
Environmental Impact Statement (SEIS). Boston, Massachusetts. United States
Environmental Protection Agency Region I.
Libby PS, Borkman DG, Geyer WR, Turner JT, Costa AS, Wang J, Codiga D, Taylor
D. 2017. 2016 water column monitoring results. Boston: Massachusetts Water
Resources Authority. Report 2017-11 . 56 p.
MWRA. 2001. Massachusetts Water Resources Authority Contingency Plan revision
1. Boston: Massachusetts Water Resources Authority. Report 2001-ms-071. 47 p.
MWRA. 2010. Ambient monitoring plan for the Massachusetts Water Resources
Authority effluent outfall Revision 2, July 2010. Boston: Massachusetts Water
Resources Authority. Report 2010-04. 107 p.
Moore MJ, McElroy A, Geoghegan P, Siskey M, Pembroke AE. 2016. Flounder
monitoring report: 2015 results. Boston: Massachusetts Water Resources Authority.
Report 2016-05. 40 p.
Nestler EC, Diaz RJ, Pembroke AE, Keay KE. 2017. Outfall benthic monitoring
report: 2016 results. Boston: Massachusetts Water Resources Authority. Report 2017-
08 . 37 p.
Werme C, Rex AC, Hunt, C. 2012. Outfall monitoring overview background: 2012
update. Boston: Massachusetts Water Resources Authority. Report 2012-02. 59 p.

49
List of Acronyms
C Carbon
cBOD Carbonaceous biochemical oxygen demand
CHV Centrotubular hydropic vacuolation
DDT Dichlorodiphenyltrichloroethane
DIF Deer Island Flats
DIN Dissolved inorganic carbon
DO Dissolved oxygen
ECCB Eastern Cape Cod Bay
EPA U.S. Environmental Protection Agency
FF Farfield
HMW High molecular weight
IAAC Inter-Agency Advisory Committee
IPUE Individuals per unit effort
LC50 50% mortality concentration
LMW Low molecular weight
MassDEP Massachusetts Department of Environmental Protection
MODIS Moderate Resolution Imaging Spectroradiometer
MWRA Massachusetts Water Resources Authority
N Nitrogen
NA Not analyzed/not applicable
NACWA National Association of Clean Water Agencies
NB Nantasket Beach
NERACOOS Northeastern Regional Association of Coastal Ocean Observing Systems
NF Nearfield
NDBC National Data Buoy Center
NOEC No observed effects concentration
NPDES National Pollutant Discharge Elimination System
OMSAP Outfall Monitoring Science Advisory Panel
OS Outfall site
P Phosphorus
PAH Polycyclic aromatic hydrocarbon
PCB Polychlorinated biphenyl
PIAC Public Interest Advisory Committee
PSP Paralytic shellfish poisoning
RPD Redox potential discontinuity
SD Standard deviation
SEIS Supplemental environmental impact statement
SPI Sediment-profile imagery

Massachusetts Water Resources Authority
Charlestown Navy Yard
100 First Avenue
Boston, MA 02129
(617) 242-6000