statistics for managers using microsoft excel,...
TRANSCRIPT
© 2002 Prentice-Hall, Inc. Chap 4-1
Statistics for Managers Using Microsoft Excel
(3rd Edition)
Chapter 4
Basic Probability and Discrete Probability Distributions
© 2002 Prentice-Hall, Inc.
Chap 4-2
Chapter Topics
Basic probability concepts
Sample spaces and events, simple probability, joint
probability
Conditional probability
Statistical independence, marginal probability
Bayes’s Theorem

© 2002 Prentice-Hall, Inc.
Chap 4-3
Chapter Topics
The probability of a discrete random variable
Covariance and its applications in finance
Binomial distribution
Poisson distribution
Hypergeometric distribution
(continued)
© 2002 Prentice-Hall, Inc.
Chap 4-4
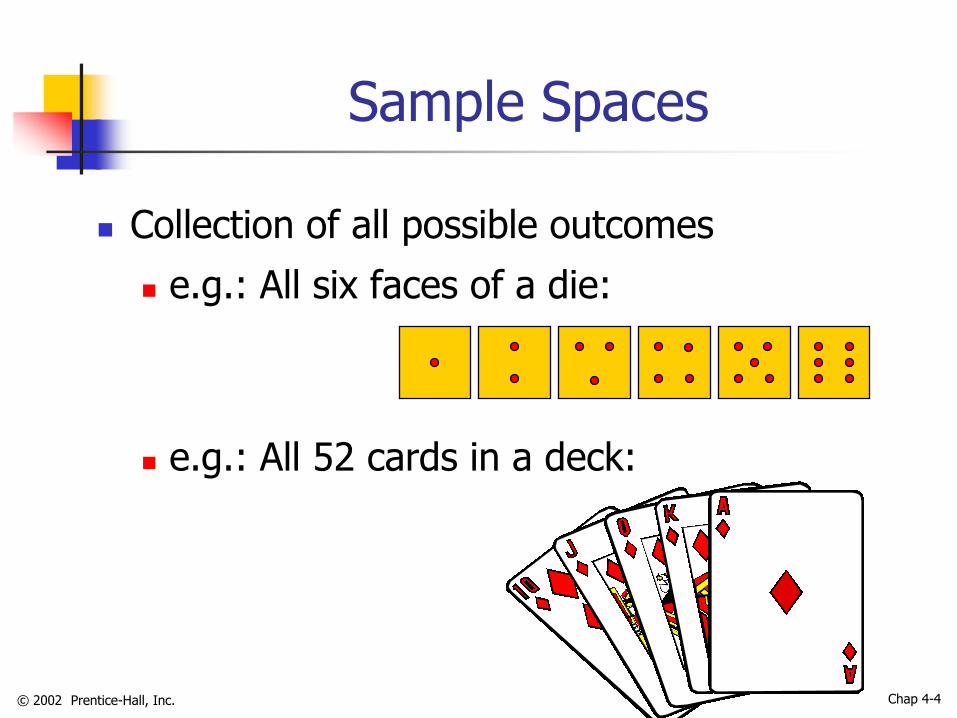
Sample Spaces
Collection of all possible outcomes
e.g.: All six faces of a die:
e.g.: All 52 cards in a deck:

© 2002 Prentice-Hall, Inc.
Chap 4-5
Events
Simple event
Outcome from a sample space with one
characteristic
e.g.: A red card from a deck of cards
Joint event
Involves two outcomes simultaneously
e.g.: An ace that is also red from a deck of
cards
© 2002 Prentice-Hall, Inc.
Chap 4-6
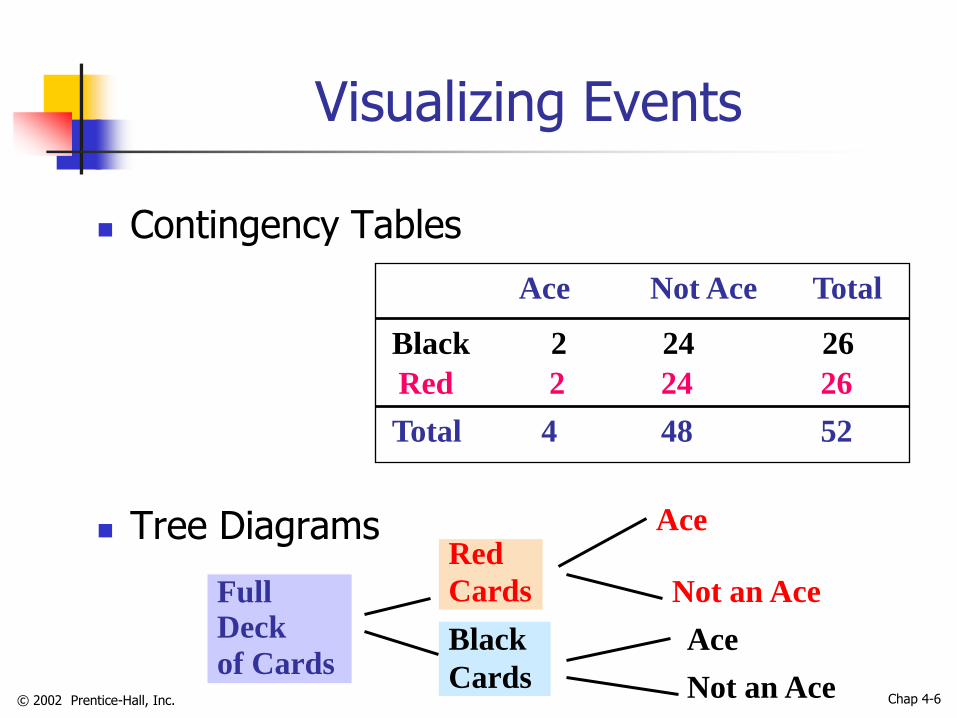
Visualizing Events
Contingency Tables
Tree Diagrams
Red 2 24 26
Black 2 24 26
Total 4 48 52
Ace Not Ace Total
Full Deck
of Cards
Red
Cards
Black
Cards
Not an Ace
Ace
Ace
Not an Ace
© 2002 Prentice-Hall, Inc.
Chap 4-7
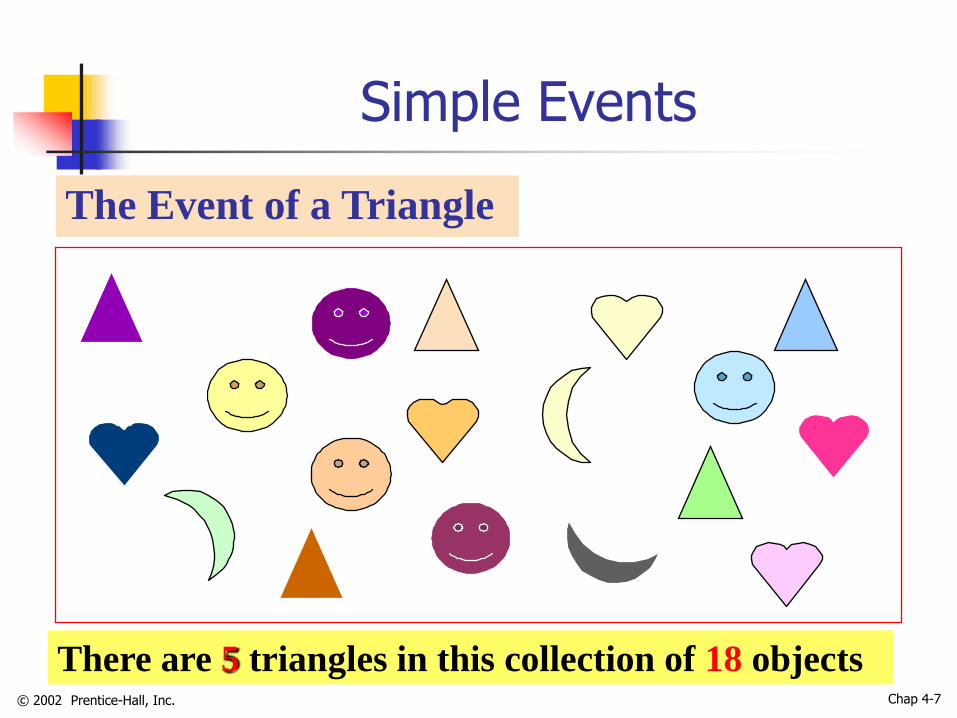
Simple Events
The Event of a Triangle
There are 5 triangles in this collection of 18 objects

© 2002 Prentice-Hall, Inc.
Chap 4-8
The event of a triangle AND blue in color
Joint Events
Two triangles that are blue

© 2002 Prentice-Hall, Inc.
Chap 4-9
Special Events
Impossible event
e.g.: Club & diamond on one card draw
Complement of event
For event A, all events not in A
Denoted as A’
e.g.: A: queen of diamonds A’: all cards in a deck that are not queen of diamonds
Null Event

© 2002 Prentice-Hall, Inc.
Chap 4-10
Special Events
Mutually exclusive events Two events cannot occur together
e.g.: -- A: queen of diamonds; B: queen of clubs
Events A and B are mutually exclusive Collectively exhaustive events
One of the events must occur
The set of events covers the whole sample space
e.g.: -- A: all the aces; B: all the black cards; C: all the diamonds; D: all the hearts
Events A, B, C and D are collectively exhaustive
Events B, C and D are also collectively exhaustive
(continued)

© 2002 Prentice-Hall, Inc.
Chap 4-11
Contingency Table
A Deck of 52 Cards
Ace Not an
Ace Total
Red
Black
Total
2 24
2 24
26
26
4 48 52
Sample Space
Red Ace
© 2002 Prentice-Hall, Inc.
Chap 4-12
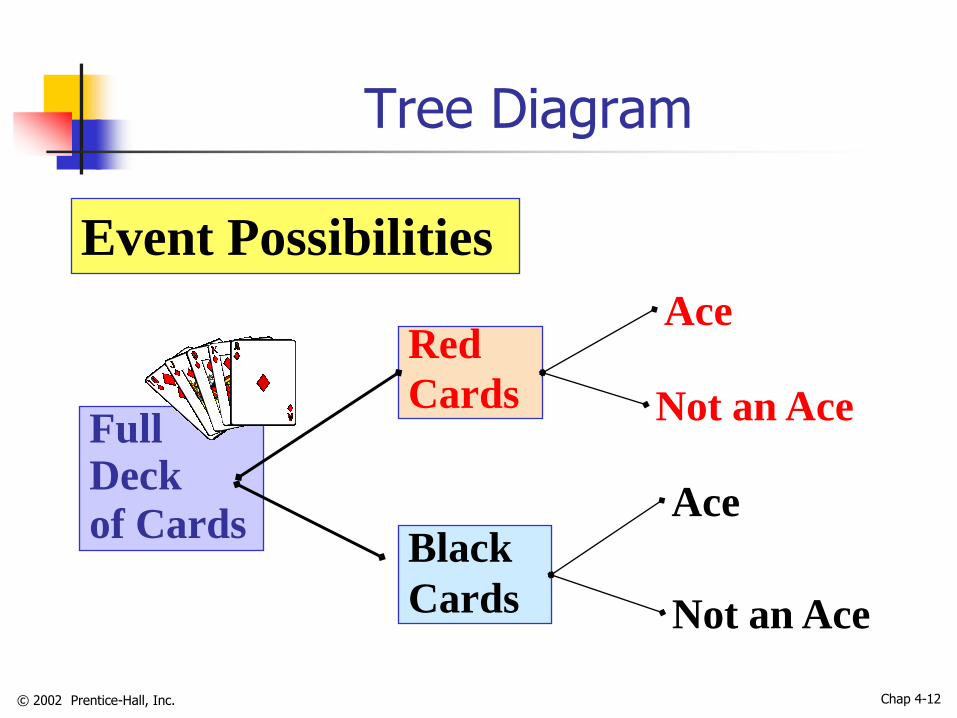
Full Deck
of Cards
Tree Diagram
Event Possibilities
Red
Cards
Black
Cards
Ace
Not an Ace
Ace
Not an Ace
© 2002 Prentice-Hall, Inc.
Chap 4-13
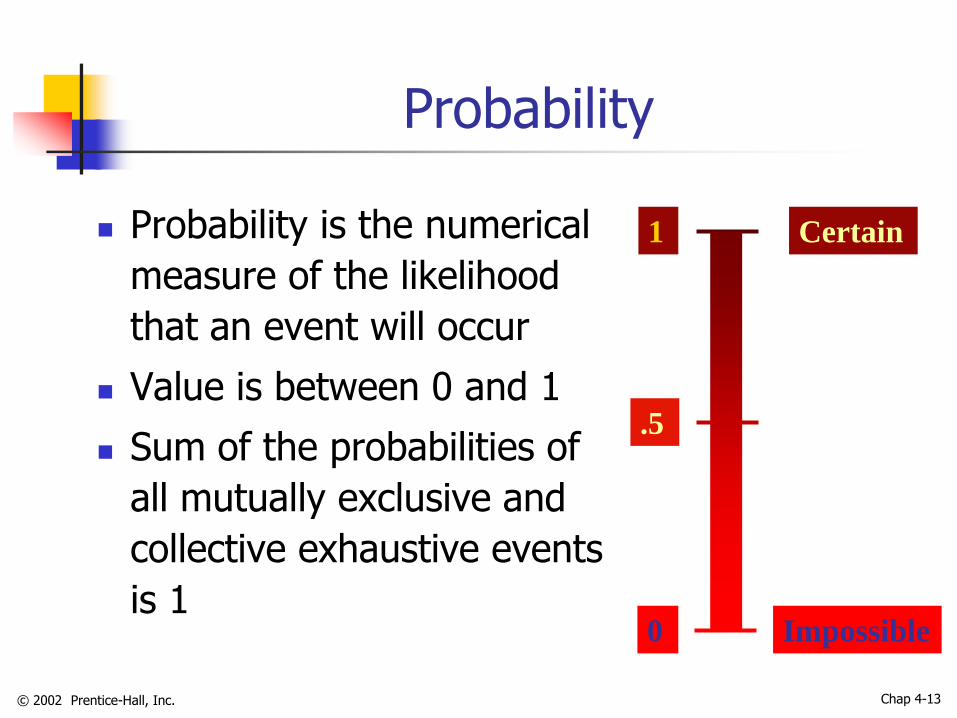
Probability
Probability is the numerical
measure of the likelihood
that an event will occur
Value is between 0 and 1
Sum of the probabilities of
all mutually exclusive and
collective exhaustive events
is 1
Certain
Impossible
.5
1
0

© 2002 Prentice-Hall, Inc.
Chap 4-14
(There are 2 ways to get one 6 and the other 4)
e.g. P( ) = 2/36
Computing Probabilities
The probability of an event E:
Each of the outcomes in the sample space is
equally likely to occur
number of event outcomes( )
total number of possible outcomes in the sample space
P E
X
T

© 2002 Prentice-Hall, Inc.
Chap 4-15
Computing Joint Probability
The probability of a joint event, A and B:
( and ) = ( )
number of outcomes from both A and B
total number of possible outcomes in sample space
P A B P A B
E.g. (Red Card and Ace)
2 Red Aces 1
52 Total Number of Cards 26
P

© 2002 Prentice-Hall, Inc.
Chap 4-16
P(A1 and B2) P(A1)
Total Event
Joint Probability Using Contingency Table
P(A2 and B1)
P(A1 and B1)
Event
Total 1
Joint Probability Marginal (Simple) Probability
A1
A2
B1 B2
P(B1) P(B2)
P(A2 and B2) P(A2)
© 2002 Prentice-Hall, Inc.
Chap 4-17
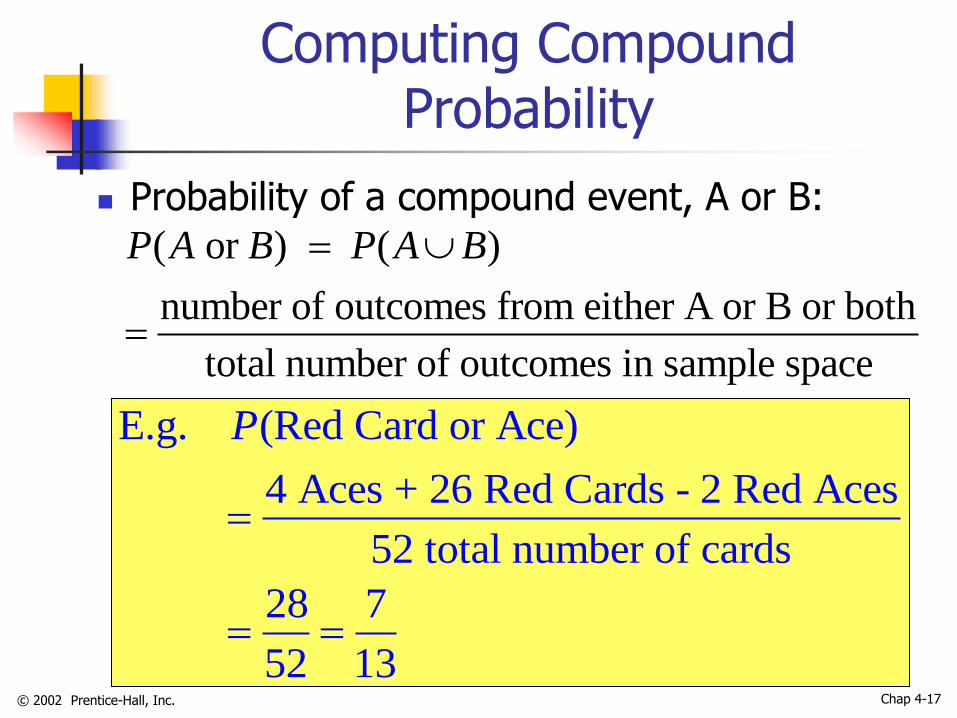
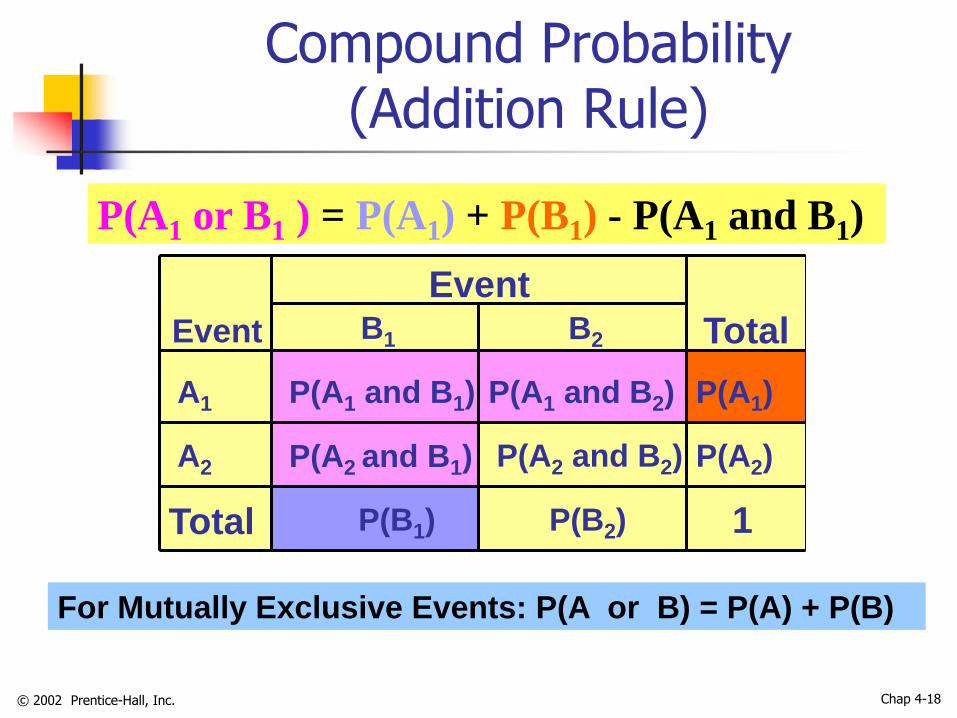
Computing Compound Probability
Probability of a compound event, A or B:
( or ) ( )
number of outcomes from either A or B or both
total number of outcomes in sample space
P A B P A B
E.g. (Red Card or Ace)
4 Aces + 26 Red Cards - 2 Red Aces
52 total number of cards
28 7
52 13
P
© 2002 Prentice-Hall, Inc.
Chap 4-18
P(A1)
P(B2)
P(A1 and B1)
Compound Probability (Addition Rule)
P(A1 or B1 ) = P(A1) + P(B1) - P(A1 and B1)
P(A1 and B2)
Total Event
P(A2 and B1)
Event
Total 1
A1
A2
B1 B2
P(B1)
P(A2 and B2) P(A2)
For Mutually Exclusive Events: P(A or B) = P(A) + P(B)
© 2002 Prentice-Hall, Inc.
Chap 4-19
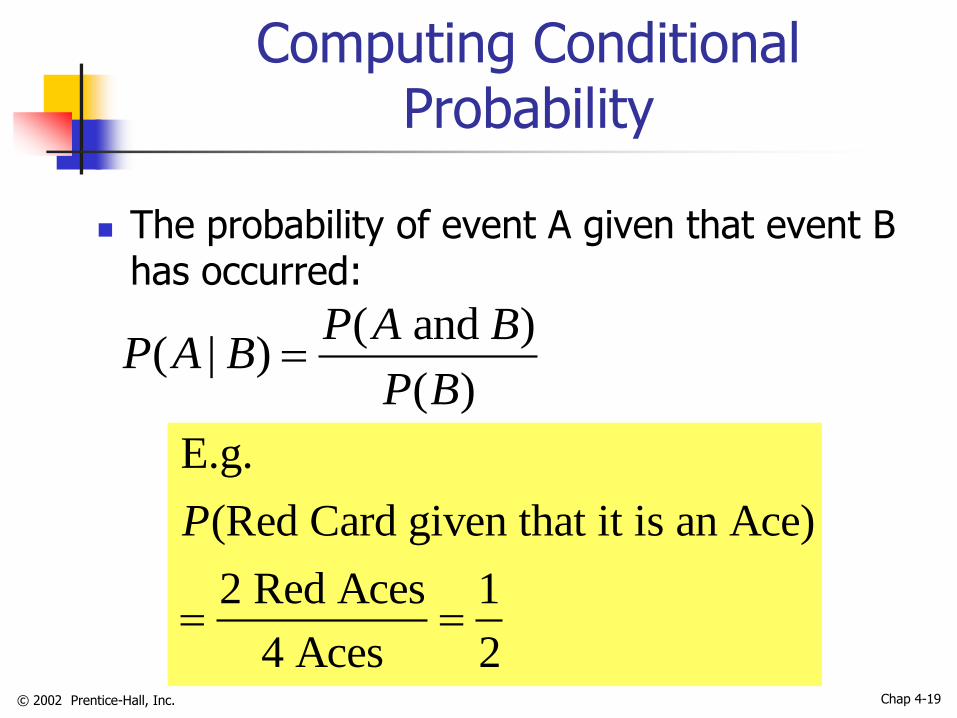
Computing Conditional Probability
The probability of event A given that event B has occurred:
( and )( | )
( )
P A BP A B
P B
E.g.
(Red Card given that it is an Ace)
2 Red Aces 1
4 Aces 2
P

© 2002 Prentice-Hall, Inc.
Chap 4-20
Conditional Probability Using Contingency Table
Black
Color Type Red Total
Ace 2 2 4
Non-Ace 24 24 48
Total 26 26 52
Revised Sample Space
(Ace and Red) 2 / 52 2(Ace | Red)
(Red) 26 / 52 26
PP
P
© 2002 Prentice-Hall, Inc.
Chap 4-21
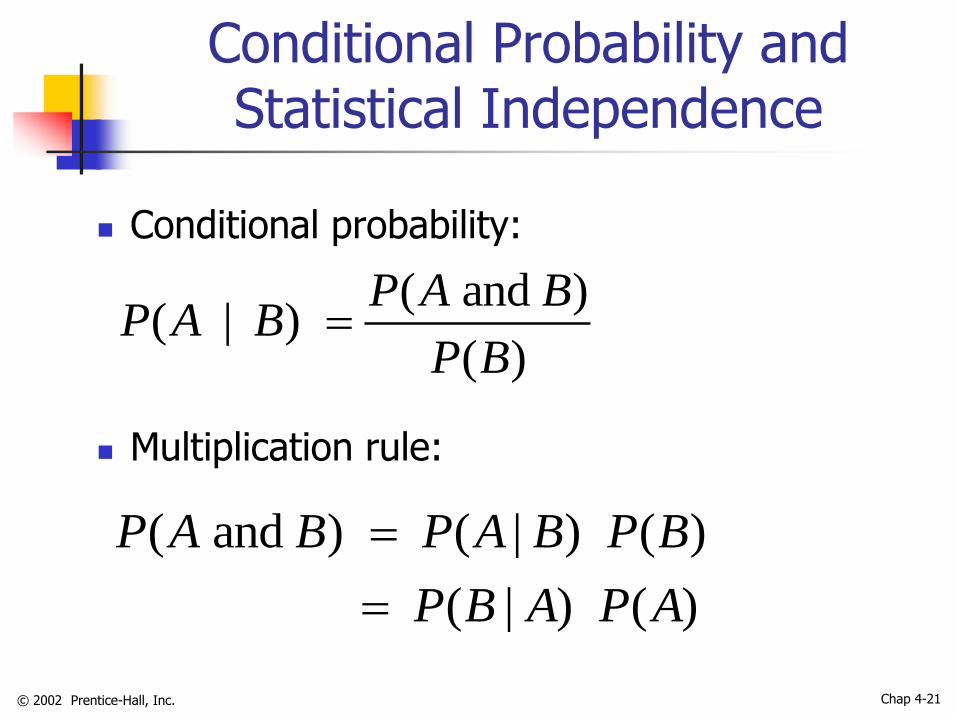
Conditional Probability and Statistical Independence
Conditional probability:
Multiplication rule:
( and )( | )
( )
P A BP A B
P B
( and ) ( | ) ( )
( | ) ( )
P A B P A B P B
P B A P A
© 2002 Prentice-Hall, Inc.
Chap 4-22
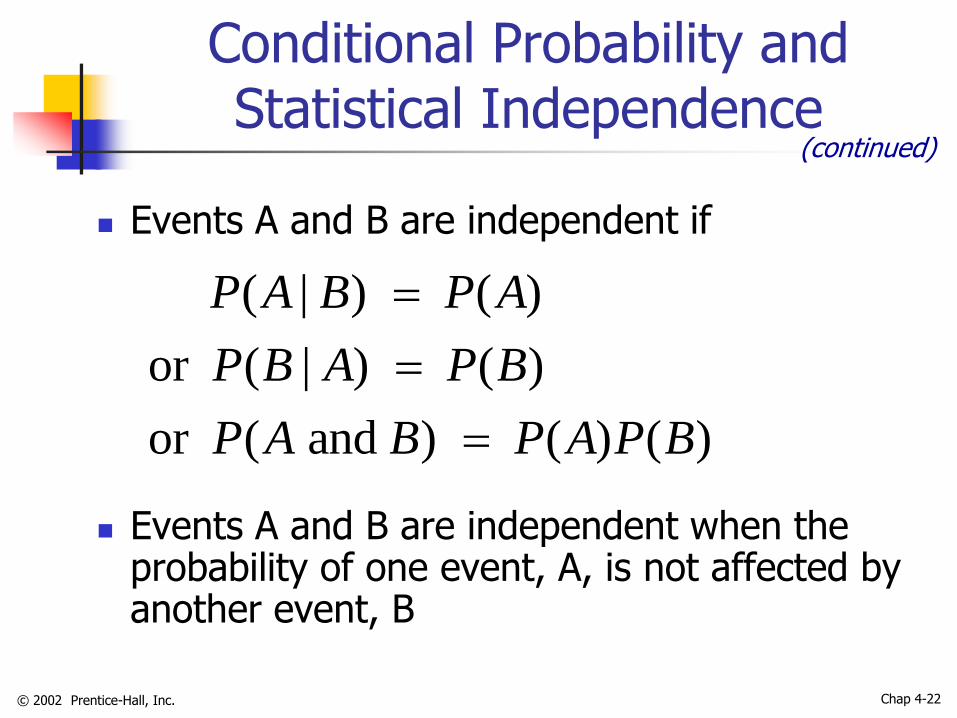
Conditional Probability and Statistical Independence
Events A and B are independent if
Events A and B are independent when the probability of one event, A, is not affected by another event, B
(continued)
( | ) ( )
or ( | ) ( )
or ( and ) ( ) ( )
P A B P A
P B A P B
P A B P A P B

© 2002 Prentice-Hall, Inc.
Chap 4-23
Bayes’s Theorem
1 1
||
| |
and
i i
i
k k
i
P A B P BP B A
P A B P B P A B P B
P B A
P A
Adding up
the parts
of A in all
the B’s Same
Event
© 2002 Prentice-Hall, Inc.
Chap 4-24
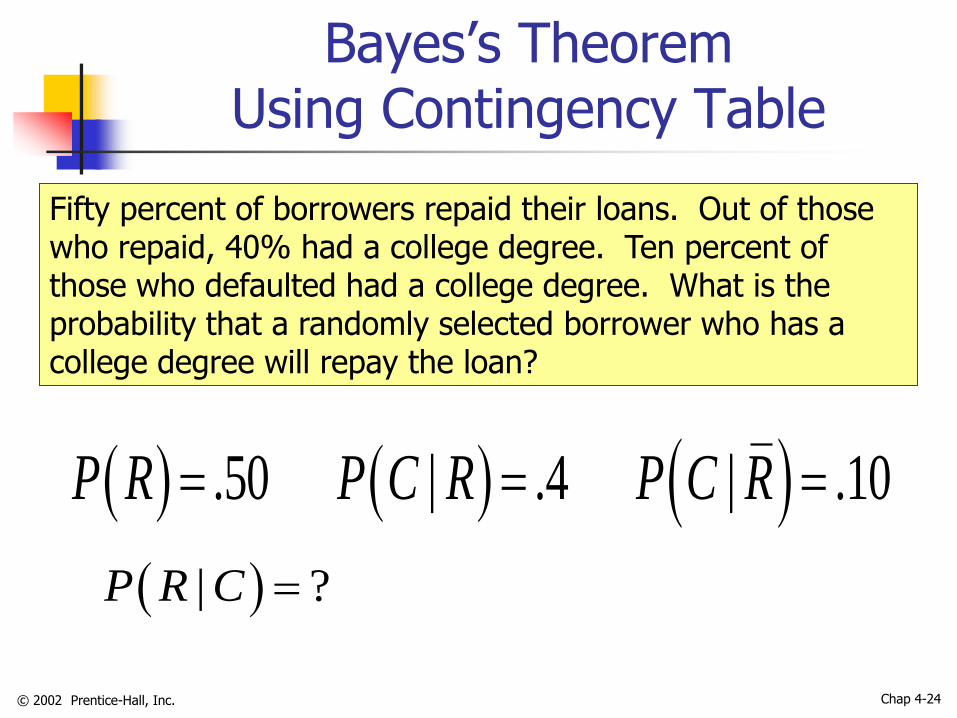
Bayes’s Theorem Using Contingency Table
Fifty percent of borrowers repaid their loans. Out of those who repaid, 40% had a college degree. Ten percent of those who defaulted had a college degree. What is the probability that a randomly selected borrower who has a college degree will repay the loan?
.50 | .4 | .10P R P C R P C R
| ?P R C
© 2002 Prentice-Hall, Inc.
Chap 4-25
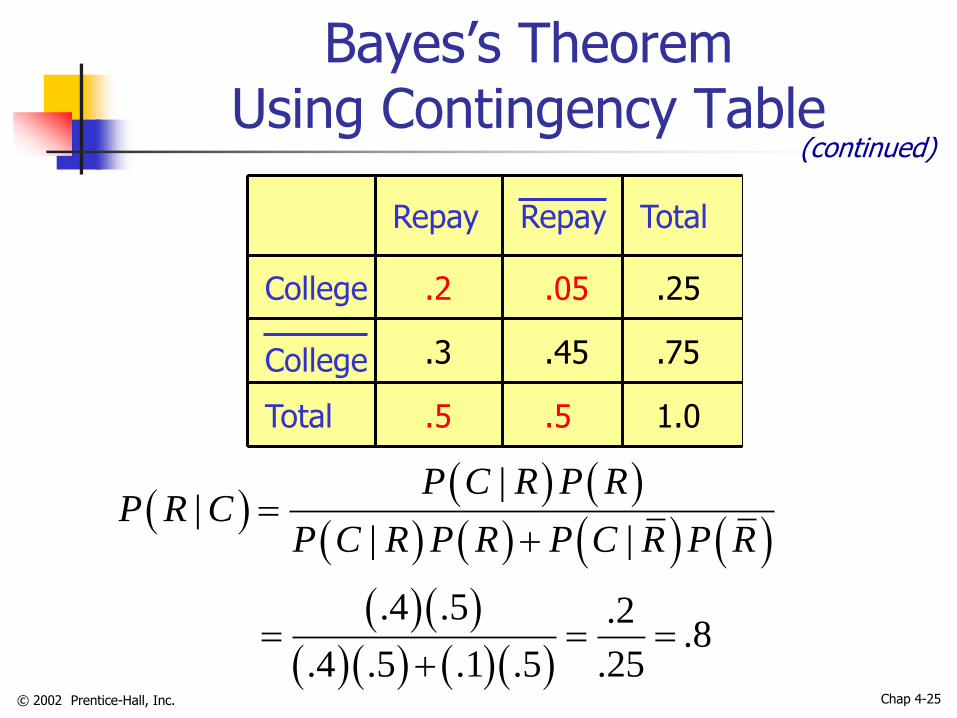
Bayes’s Theorem Using Contingency Table
||
| |
.4 .5 .2 .8
.4 .5 .1 .5 .25
P C R P RP R C
P C R P R P C R P R
(continued)
Repay Repay
College
College
1.0 .5 .5
.2
.3
.05
.45
.25
.75
Total
Total

© 2002 Prentice-Hall, Inc.
Chap 4-26
Random Variable
Random Variable
Outcomes of an experiment expressed numerically
e.g.: Toss a die twice; count the number of times
the number 4 appears (0, 1 or 2 times)
© 2002 Prentice-Hall, Inc.
Chap 4-27
Discrete Random Variable
Discrete random variable
Obtained by counting (1, 2, 3, etc.)
Usually a finite number of different values
e.g.: Toss a coin five times; count the number of
tails (0, 1, 2, 3, 4, or 5 times)

© 2002 Prentice-Hall, Inc.
Chap 4-28
Probability Distribution
Values Probability
0 1/4 = .25
1 2/4 = .50
2 1/4 = .25
Discrete Probability
Distribution Example
T
T
T T
Event: Toss two coins Count the number of tails

© 2002 Prentice-Hall, Inc.
Chap 4-29
Discrete Probability Distribution
List of all possible [Xj , p(Xj) ] pairs
Xj = value of random variable
P(Xj) = probability associated with value
Mutually exclusive (nothing in common)
Collectively exhaustive (nothing left out)
0 1 1j jP X P X
© 2002 Prentice-Hall, Inc.
Chap 4-30
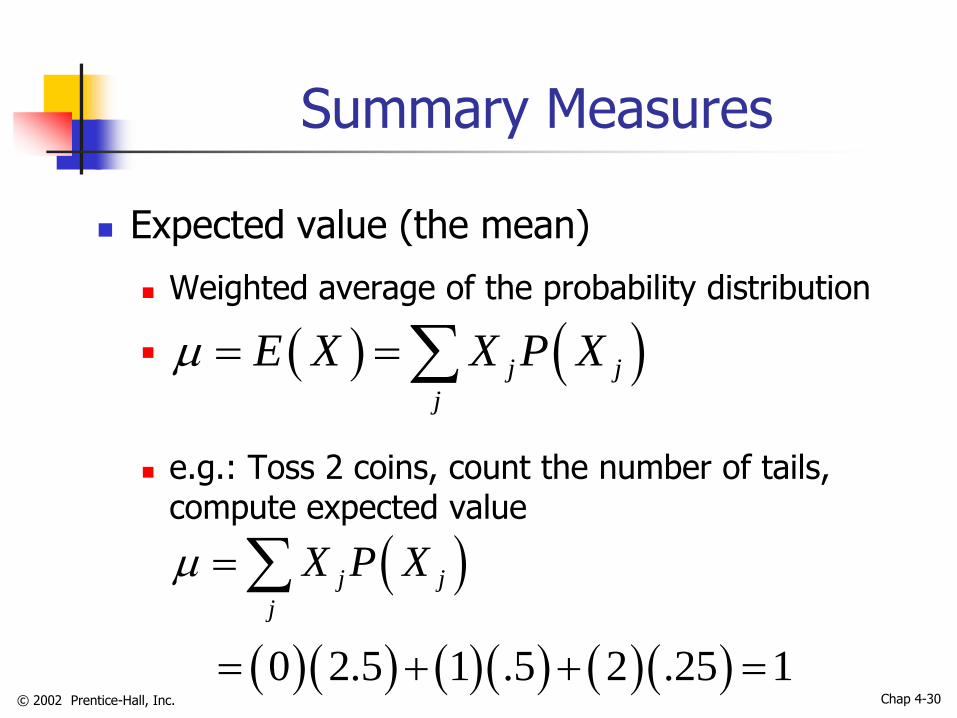
Summary Measures
Expected value (the mean)
Weighted average of the probability distribution
e.g.: Toss 2 coins, count the number of tails, compute expected value
j j
j
E X X P X
0 2.5 1 .5 2 .25 1
j j
j
X P X

© 2002 Prentice-Hall, Inc.
Chap 4-31
Summary Measures
Variance
Weight average squared deviation about the mean
e.g. Toss two coins, count number of tails, compute variance
(continued)
222
j jE X X P X
22
2 2 2 0 1 .25 1 1 .5 2 1 .25 .5
j jX P X

© 2002 Prentice-Hall, Inc.
Chap 4-32
Covariance and its Application
1
th
th
th
: discrete random variable
: outcome of
: discrete random variable
: outcome of
: probability of occurrence of the
outcome of an
N
XY i i i i
i
i
i
i i
X E X Y E Y P X Y
X
X i X
Y
Y i Y
P X Y i
X
thd the outcome of Yi
© 2002 Prentice-Hall, Inc.
Chap 4-33
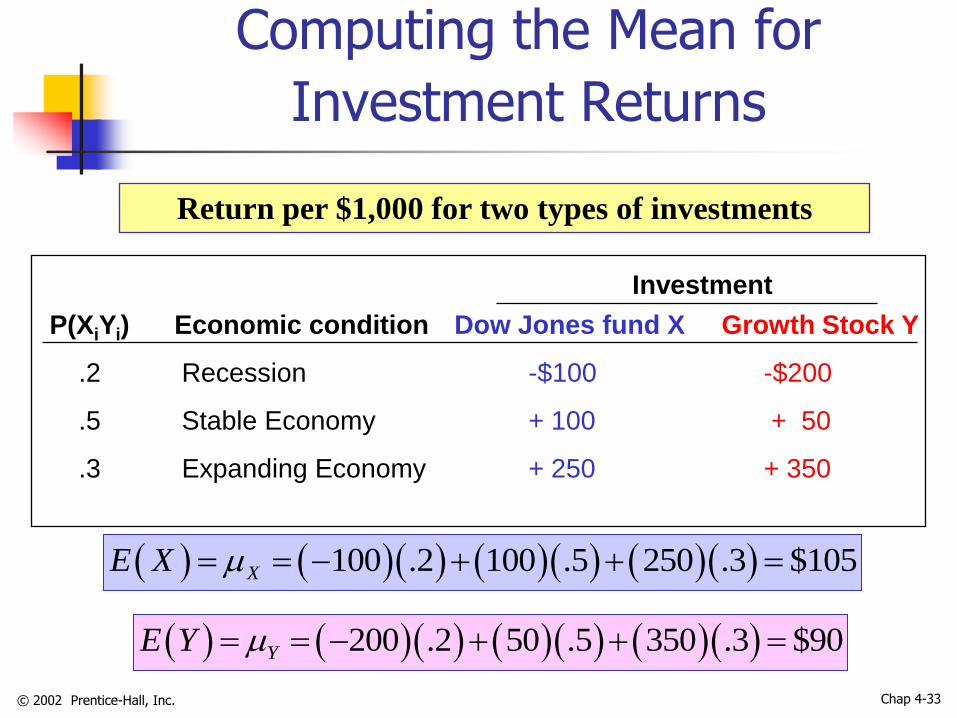
Computing the Mean for
Investment Returns
Return per $1,000 for two types of investments
P(XiYi) Economic condition Dow Jones fund X Growth Stock Y
.2 Recession -$100 -$200
.5 Stable Economy + 100 + 50
.3 Expanding Economy + 250 + 350
Investment
100 .2 100 .5 250 .3 $105XE X
200 .2 50 .5 350 .3 $90YE Y

© 2002 Prentice-Hall, Inc.
Chap 4-34
Computing the Variance for
Investment Returns
P(XiYi) Economic condition Dow Jones fund X Growth Stock Y
.2 Recession -$100 -$200
.5 Stable Economy + 100 + 50
.3 Expanding Economy + 250 + 350
Investment
2 2 22 100 105 .2 100 105 .5 250 105 .3
14,725 121.35
X
X
2 2 22 200 90 .2 50 90 .5 350 90 .3
37,900 194.68
Y
Y

© 2002 Prentice-Hall, Inc.
Chap 4-35
Computing the Covariance for
Investment Returns
P(XiYi) Economic condition Dow Jones fund X Growth Stock Y
.2 Recession -$100 -$200
.5 Stable Economy + 100 + 50
.3 Expanding Economy + 250 + 350
Investment
The Covariance of 23,000 indicates that the two investments are
positively related and will vary together in the same direction.
100 105 200 90 .2 100 105 50 90 .5
250 105 350 90 .3 23,300
XY

© 2002 Prentice-Hall, Inc.
Chap 4-36
Important Discrete Probability Distributions
Discrete Probability
Distributions
Binomial Hypergeometric Poisson
© 2002 Prentice-Hall, Inc.
Chap 4-37
Binomial Probability Distribution
‘n’ identical trials e.g.: 15 tosses of a coin; ten light bulbs taken
from a warehouse
Two mutually exclusive outcomes on each trials e.g.: Head or tail in each toss of a coin; defective
or not defective light bulb
Trials are independent The outcome of one trial does not affect the
outcome of the other
© 2002 Prentice-Hall, Inc.
Chap 4-38
Binomial Probability Distribution
Constant probability for each trial
e.g.: Probability of getting a tail is the same each time we toss the coin
Two sampling methods
Infinite population without replacement
Finite population with replacement
(continued)
© 2002 Prentice-Hall, Inc.
Chap 4-39
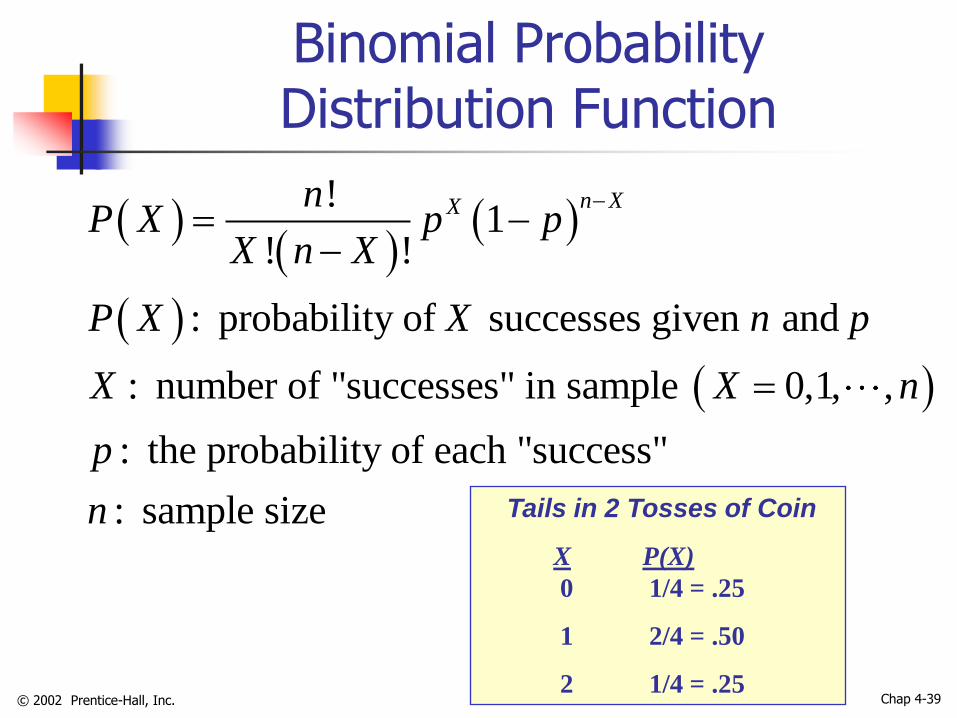
Binomial Probability Distribution Function
Tails in 2 Tosses of Coin X P(X)
0 1/4 = .25
1 2/4 = .50
2 1/4 = .25
!1
! !
: probability of successes given and
: number of "successes" in sample 0,1, ,
: the probability of each "success"
: sample size
n XXnP X p p
X n X
P X X n p
X X n
p
n

© 2002 Prentice-Hall, Inc.
Chap 4-40
Binomial Distribution Characteristics
Mean
E.g.
Variance and Standard Deviation
E.g.
E X np
5 .1 .5np
n = 5 p = 0.1
0
.2
.4
.6
0 1 2 3 4 5
X
P(X)
1 5 .1 1 .1 .6708np p
2 1
1
np p
np p

© 2002 Prentice-Hall, Inc.
Chap 4-41
Binomial Distribution in PHStat
PHStat | probability & prob. Distributions | binomial
Example in excel spreadsheet
© 2002 Prentice-Hall, Inc.
Chap 4-42
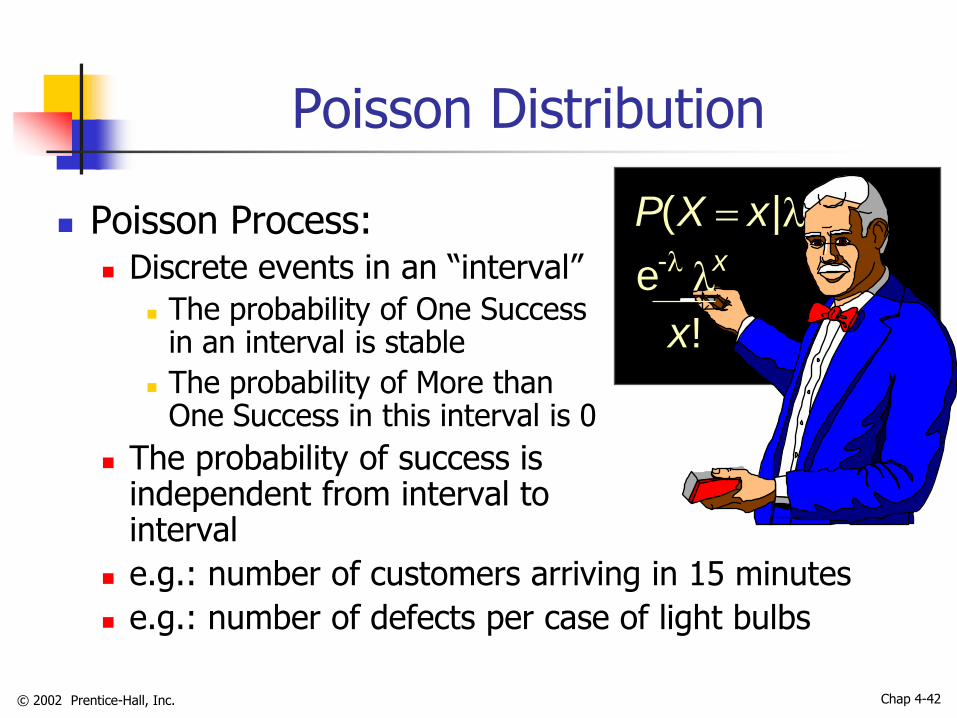
Poisson Distribution
Poisson Process: Discrete events in an “interval”
The probability of One Success in an interval is stable
The probability of More than One Success in this interval is 0
The probability of success is independent from interval to interval
e.g.: number of customers arriving in 15 minutes
e.g.: number of defects per case of light bulbs
P X x
x
x
( |
!
e -

© 2002 Prentice-Hall, Inc.
Chap 4-43
Poisson Probability Distribution Function
e.g.: Find the probability of 4
customers arriving in 3 minutes
when the mean is 3.6.
3.6 43.6
.19124!
eP X
!
: probability of "successes" given
: number of "successes" per unit
: expected (average) number of "successes"
: 2.71828 (base of natural logs)
XeP X
X
P X X
X
e
© 2002 Prentice-Hall, Inc.
Chap 4-44
Poisson Distribution in PHStat
PHStat | probability & prob. Distributions | Poisson
Example in excel spreadsheet
© 2002 Prentice-Hall, Inc.
Chap 4-45
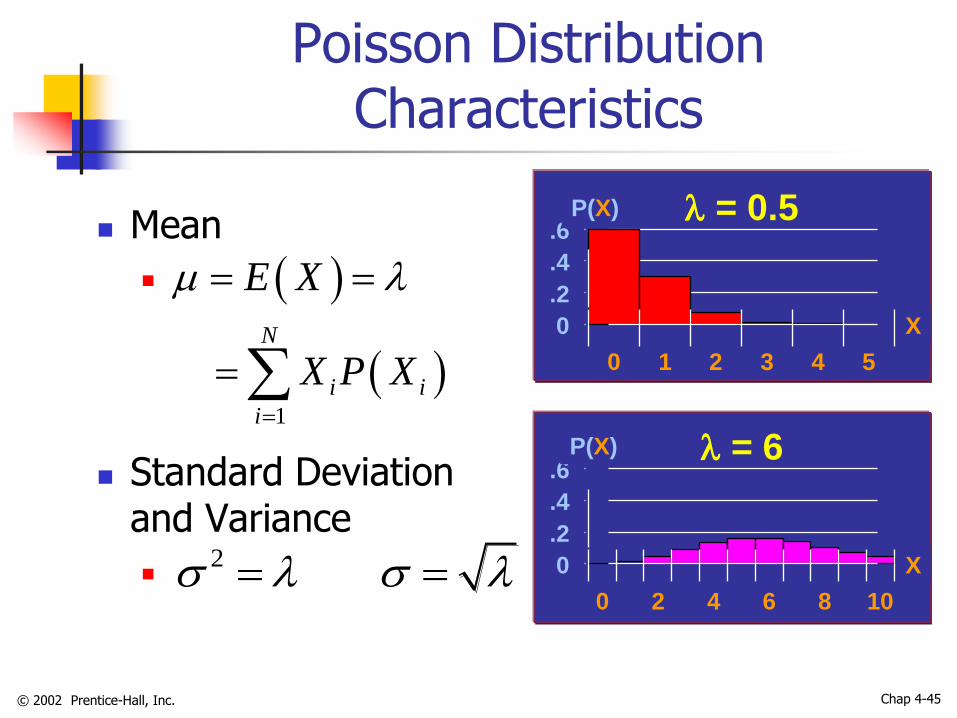
Poisson Distribution Characteristics
Mean
Standard Deviation and Variance
1
N
i i
i
E X
X P X
= 0.5
= 6
0
.2
.4
.6
0 1 2 3 4 5
X
P(X)
0
.2
.4
.6
0 2 4 6 8 10
X
P(X)
2
© 2002 Prentice-Hall, Inc.
Chap 4-46
Hypergeometric Distribution
“n” trials in a sample taken from a finite
population of size N
Sample taken without replacement
Trials are dependent
Concerned with finding the probability of “X”
successes in the sample where there are “A”
successes in the population
© 2002 Prentice-Hall, Inc.
Chap 4-47
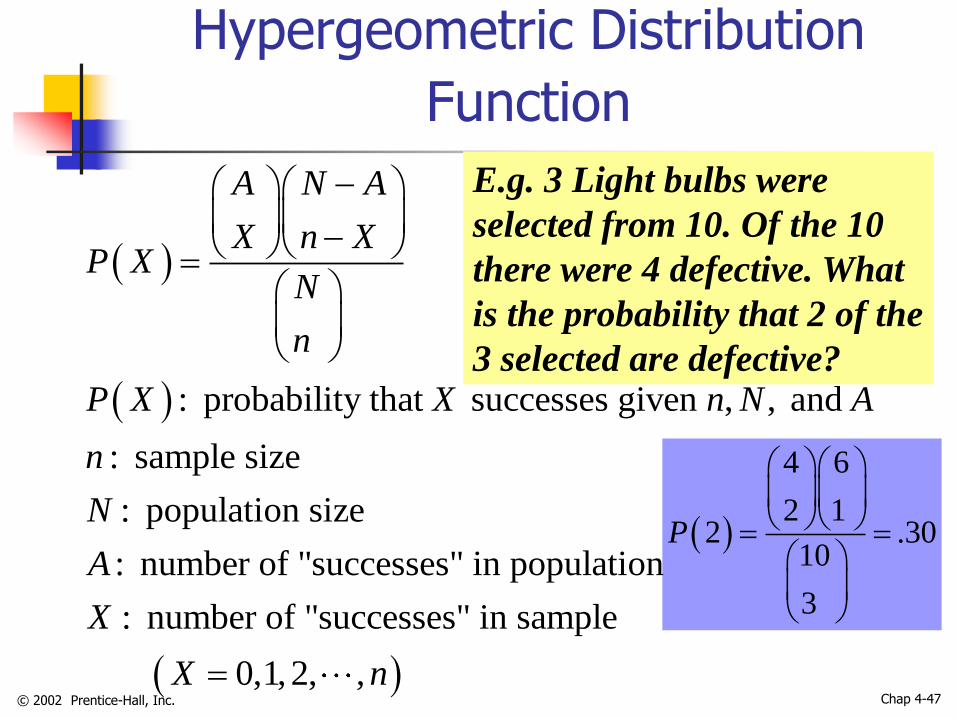
Hypergeometric Distribution
Function
E.g. 3 Light bulbs were
selected from 10. Of the 10
there were 4 defective. What
is the probability that 2 of the
3 selected are defective?
4 6
2 12 .30
10
3
P
: probability that successes given , , and
: sample size
: population size
: number of "successes" in population
: number of "successes" in sample
0,1,2,
A N A
X n XP X
N
n
P X X n N A
n
N
A
X
X
,n

© 2002 Prentice-Hall, Inc.
Chap 4-48
Hypergeometric Distribution
Characteristics
Mean
Variance and Standard Deviation
A
E X nN
2
2
2
1
1
nA N A N n
N N
nA N A N n
N N
Finite Population Correction Factor

© 2002 Prentice-Hall, Inc.
Chap 4-49
Hypergeometric Distribution in PHStat
PHStat | probability & prob. Distributions | Hypergeometric …
Example in excel spreadsheet
© 2002 Prentice-Hall, Inc.
Chap 4-50
Chapter Summary
Discussed basic probability concepts
Sample spaces and events, simple
probability, and joint probability
Defined conditional probability
Statistical independence, marginal probability
Discussed Bayes’s theorem

© 2002 Prentice-Hall, Inc.
Chap 4-51
Chapter Summary
Addressed the probability of a discrete
random variable
Defined covariance and discussed its
application in finance
Discussed binomial distribution
Addressed Poisson distribution
Discussed hypergeometric distribution
(continued)