statistical release 99.3% 100% employment … · businesses at the start of 2016 and 99.9% were...
TRANSCRIPT
Page 1 of 16
Publication date:
13 October 2016 Next Updated:
October 2017 Reference: BEIS/16/34
Coverage: UK
Theme: Business and
Energy For further detail: https://www.gov.uk/government/collections/business-population-estimates Lead Statistician:
Steven White [email protected] 0114 207 5302 Department for Business, Energy & Industrial Strategy Level 2, 2 St Paul’s Place, 125 Norfolk Street, Sheffield S1 2FJ
Summary
There were a record 5.5 million private sector businesses at the start of 2016.
This is an increase of 97,000 since 2015, and 2.0 million more than in 2000.
The number of employing businesses increased by 14,000 (+1%) since 2015, and the number of non-employing businesses by 84,000 (+2%).
SMEs and the Economy
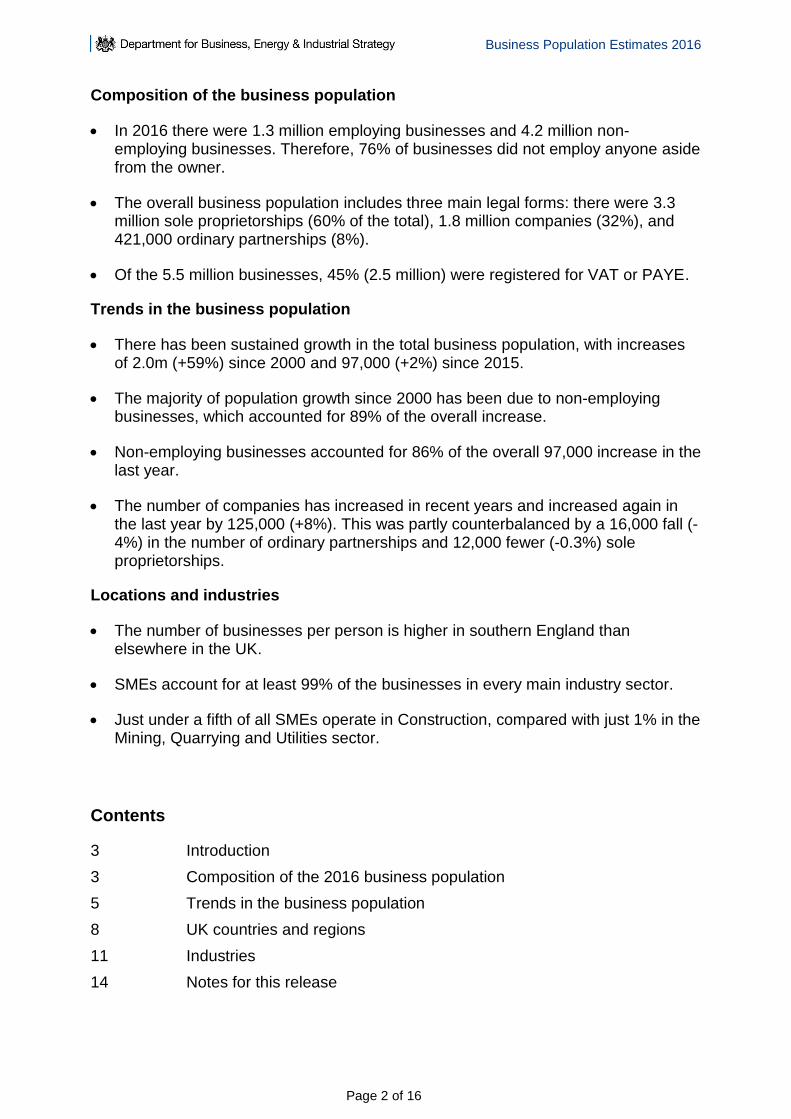
Small businesses accounted for 99.3% of all private sector businesses at the start of 2016 and 99.9% were small or medium-sized (SMEs).
Total employment in SMEs was 15.7 million; 60% of all private sector employment in the UK.
The combined annual turnover of SMEs was £1.8 trillion, 47% of all private sector turnover in the UK.
Figure 1: Contribution of different sized businesses to total population, employment and turnover, at start of 2016
48%
12%
40%
33%
14%
53%
99.3%
0.6% 0.1%0%
50%
100%
Small Medium Large
Employment Turnover Businesses
BUSINESS POPULATION ESTIMATES FOR THE UK AND REGIONS 2016
STATISTICAL RELEASE
Business Population Estimates 2016
Page 2 of 16
Composition of the business population
In 2016 there were 1.3 million employing businesses and 4.2 million non-employing businesses. Therefore, 76% of businesses did not employ anyone aside from the owner.
The overall business population includes three main legal forms: there were 3.3 million sole proprietorships (60% of the total), 1.8 million companies (32%), and 421,000 ordinary partnerships (8%).
Of the 5.5 million businesses, 45% (2.5 million) were registered for VAT or PAYE.
Trends in the business population
There has been sustained growth in the total business population, with increases of 2.0m (+59%) since 2000 and 97,000 (+2%) since 2015.
The majority of population growth since 2000 has been due to non-employing businesses, which accounted for 89% of the overall increase.
Non-employing businesses accounted for 86% of the overall 97,000 increase in the last year.
The number of companies has increased in recent years and increased again in the last year by 125,000 (+8%). This was partly counterbalanced by a 16,000 fall (-4%) in the number of ordinary partnerships and 12,000 fewer (-0.3%) sole proprietorships.
Locations and industries
The number of businesses per person is higher in southern England than elsewhere in the UK.
SMEs account for at least 99% of the businesses in every main industry sector.
Just under a fifth of all SMEs operate in Construction, compared with just 1% in the Mining, Quarrying and Utilities sector.
Contents
3 Introduction
3 Composition of the 2016 business population
5 Trends in the business population
8 UK countries and regions
11 Industries
14 Notes for this release
Business Population Estimates 2016
Page 3 of 16
Introduction
1. The Business Population Estimates (BPE) for the UK and Regions 2016 provides information on the number of private sector businesses in the UK at the start of 2016, broken down by number of employees, legal status, industry and geography. The publication:
measures the net change in the number of private sector businesses, but
cannot be used to estimate numbers of business start-ups or closures
reports on businesses in the private sector – figures in this release exclude the
government and not-for-profit sectors; an overview of the number of businesses
in the whole economy is provided in Table 2 of the detailed tables
comprises this statistical release, a set of detailed tables and a
‘methodology and quality’ note, which are all available on gov.uk
Composition of the UK private sector business population in 2016
2. The UK private sector is dominated by non-employing businesses and small employers, and SMEs account for 99.9% of the business population. At the start of 2016:
there were an estimated 5.5 million UK private sector businesses
1.3 million of these had employees and 4.2 million had no employees
therefore, 76% of businesses did not employ anyone aside from the owner
there were 5.5 million small business (with 0 to 49 employees), which is 99.3%
of the total business population
a further 33,000 (0.6%) were medium-sized businesses (with 50 to 249
employees), and this means there were 5.5 million SMEs in total
Table A: Estimated number of businesses in the UK private sector and their
associated employment and turnover, by size of business, start of 2016
Businesses Employment Turnover1
thousands £ millions
All businesses 5,497,670 26,204 3,860,870
SMEs (0-249 employees) 5,490,470 15,734 1,824,698
Small businesses (0-49 employees) 5,457,160 12,483 1,278,754
With no employees2
4,172,185 4,535 254,545
All employers 1,325,485 21,669 3,606,325
of which:
1-9 employees 1,081,425 3,978 463,421
10-49 employees 203,550 3,970 560,788
50-249 employees 33,310 3,251 545,945 250 or more employees 7,200 10,470 2,036,172
1. Total turnover figures exclude Section K (financial and insurance activities) where turnover is not available on a comparable
basis.
2: "With no employees" includes sole proprietorships and partnerships with only the self-employed owner-manager(s), and
companies with a single employee, who are assumed to be directors.
Business Population Estimates 2016
Page 4 of 16
3. The 7,200 large businesses in the UK make a major contribution to employment and turnoveri. Nonetheless, SMEs account for three fifths of the employment and almost half of turnover in the UK private sector. At the start of 2016:
total employment in SMEs was 15.7 million (60% of the total), whilst turnover
was estimated at £1.8 trillion (47%)
employment in small businesses was 12.5 million (48%), and turnover £1.3
trillion (33%)
employment in large businesses was 10.5 million (40%) and turnover £2.0
trillion (53%)
further information on composition in Table A, and Table 1 in the detailed tables
Legal form
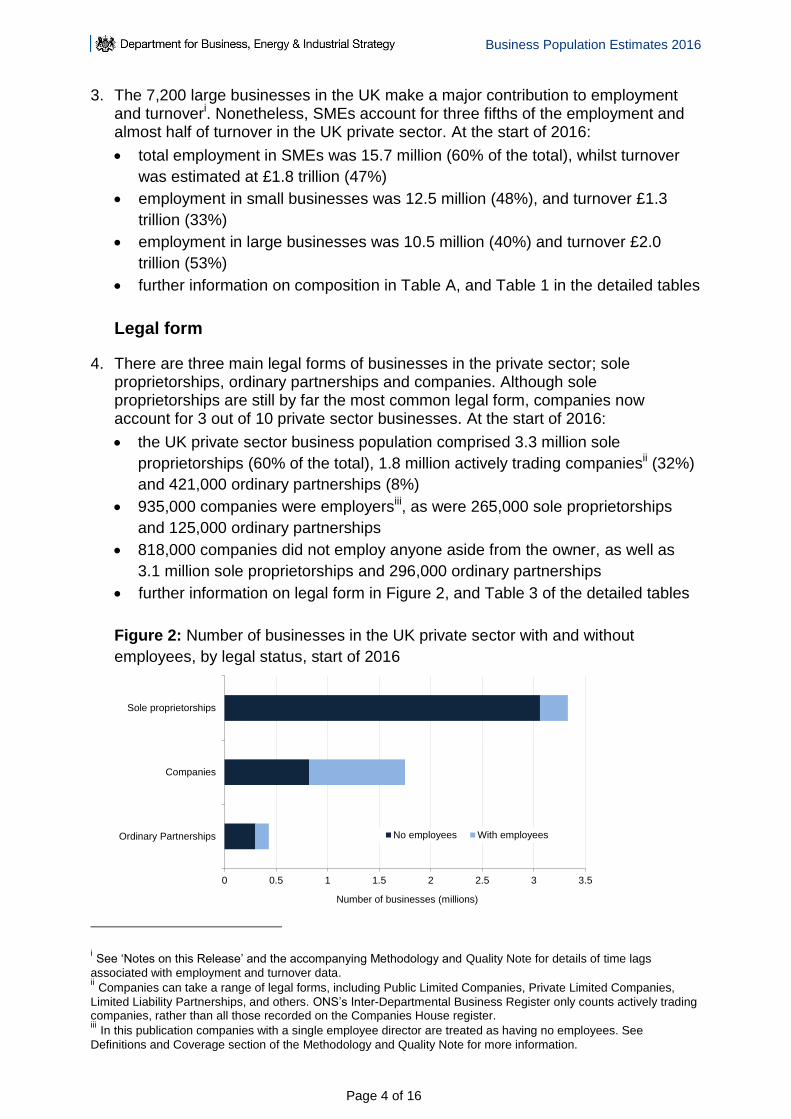
4. There are three main legal forms of businesses in the private sector; sole proprietorships, ordinary partnerships and companies. Although sole proprietorships are still by far the most common legal form, companies now account for 3 out of 10 private sector businesses. At the start of 2016:
the UK private sector business population comprised 3.3 million sole
proprietorships (60% of the total), 1.8 million actively trading companiesii (32%)
and 421,000 ordinary partnerships (8%)
935,000 companies were employersiii, as were 265,000 sole proprietorships
and 125,000 ordinary partnerships
818,000 companies did not employ anyone aside from the owner, as well as
3.1 million sole proprietorships and 296,000 ordinary partnerships
further information on legal form in Figure 2, and Table 3 of the detailed tables
Figure 2: Number of businesses in the UK private sector with and without
employees, by legal status, start of 2016
i See ‘Notes on this Release’ and the accompanying Methodology and Quality Note for details of time lags
associated with employment and turnover data. ii Companies can take a range of legal forms, including Public Limited Companies, Private Limited Companies,
Limited Liability Partnerships, and others. ONS’s Inter-Departmental Business Register only counts actively trading companies, rather than all those recorded on the Companies House register. iii In this publication companies with a single employee director are treated as having no employees. See
Definitions and Coverage section of the Methodology and Quality Note for more information.
0 0.5 1 1.5 2 2.5 3 3.5
Ordinary Partnerships
Companies
Sole proprietorships
Number of businesses (millions)
No employees With employees
Business Population Estimates 2016
Page 5 of 16
Registration for VAT and PAYE
5. Three quarters of UK private sector businesses are non-employers, and the majority of these are not registered for either VAT or PAYE. At the start of 2016:
the Office for National Statistics recorded 2.5 million private sector businesses
as registered for VAT or PAYEiv, 45% of the estimated total population
over 3 million businesses (55%) traded without being registered for VAT or
PAYE and are classified here as ‘un-registered’
14% of sole proprietorships and 53% of partnerships were registered for VAT or
PAYE
further information on registration status is in Table 3 in the detailed tables
Trends in the business population
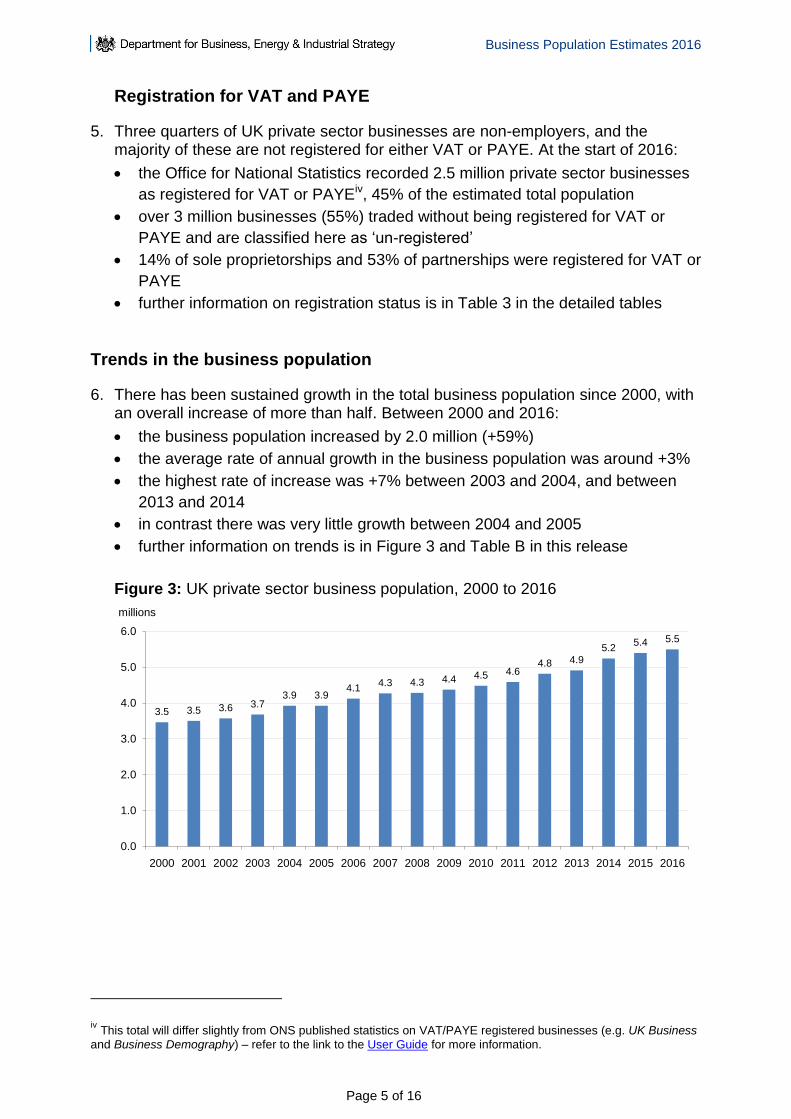
6. There has been sustained growth in the total business population since 2000, with an overall increase of more than half. Between 2000 and 2016:
the business population increased by 2.0 million (+59%)
the average rate of annual growth in the business population was around +3%
the highest rate of increase was +7% between 2003 and 2004, and between
2013 and 2014
in contrast there was very little growth between 2004 and 2005
further information on trends is in Figure 3 and Table B in this release
Figure 3: UK private sector business population, 2000 to 2016
iv This total will differ slightly from ONS published statistics on VAT/PAYE registered businesses (e.g. UK Business
and Business Demography) – refer to the link to the User Guide for more information.
3.5 3.5 3.6 3.73.9 3.9
4.14.3 4.3 4.4 4.5 4.6
4.8 4.9
5.25.4 5.5
0.0
1.0
2.0
3.0
4.0
5.0
6.0
2000 2001 2002 2003 2004 2005 2006 2007 2008 2009 2010 2011 2012 2013 2014 2015 2016
millions
Business Population Estimates 2016
Page 6 of 16
7. In the last year the UK private sector business population increased by 97,000, or +2%. The numbers of employing businesses grew by +1% and the number of non-employing businesses by +2%. Between 2015 and 2016:
non-employing businesses accounted for 86% of the overall increase
there were 84,000 (+2%) more non-employing businesses and the number of
employing businesses increased by 14,000 (+1%)
the net change in the business population is determined by the balance of new
business start-ups (inflows) against those businesses that closed, merged or
were taken over by another business (outflows)
further information on detailed trends is in Figure 5 and Table B
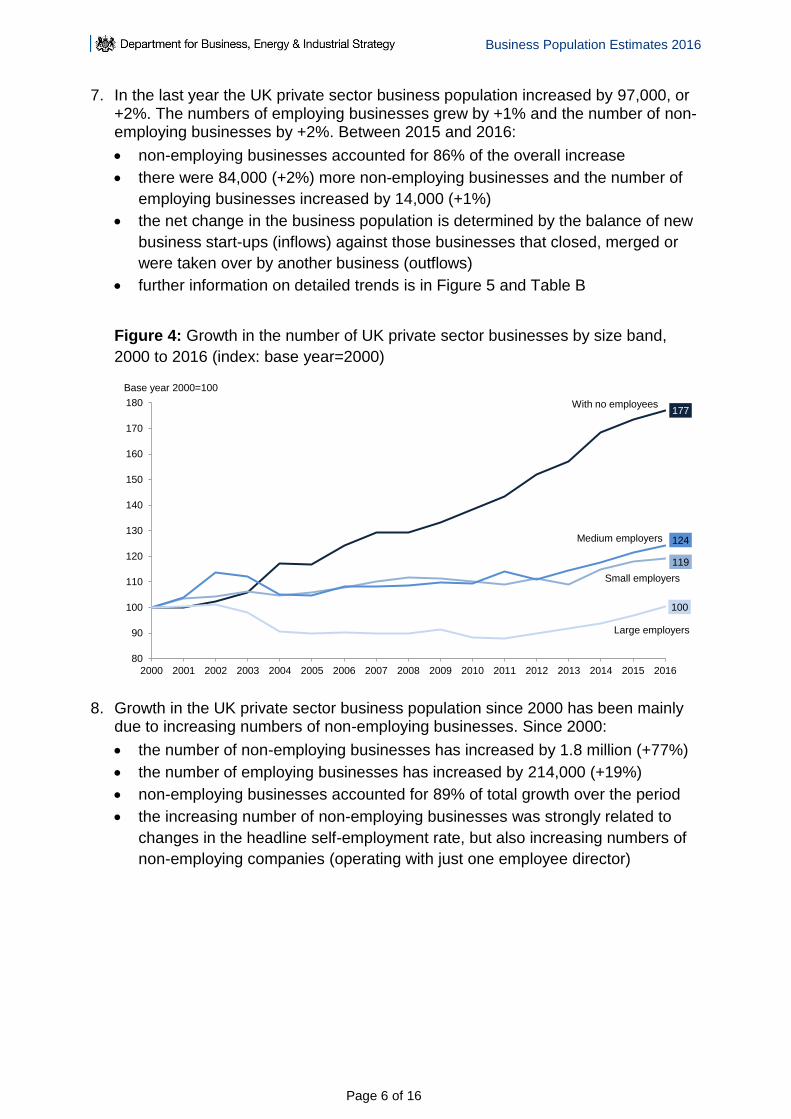
Figure 4: Growth in the number of UK private sector businesses by size band,
2000 to 2016 (index: base year=2000)
8. Growth in the UK private sector business population since 2000 has been mainly due to increasing numbers of non-employing businesses. Since 2000:
the number of non-employing businesses has increased by 1.8 million (+77%)
the number of employing businesses has increased by 214,000 (+19%)
non-employing businesses accounted for 89% of total growth over the period
the increasing number of non-employing businesses was strongly related to
changes in the headline self-employment rate, but also increasing numbers of
non-employing companies (operating with just one employee director)
177
119
124
100
80
90
100
110
120
130
140
150
160
170
180
2000 2001 2002 2003 2004 2005 2006 2007 2008 2009 2010 2011 2012 2013 2014 2015 2016
Base year 2000=100
With no employees
Medium employers
Small employers
Large employers
Business Population Estimates 2016
Page 7 of 16
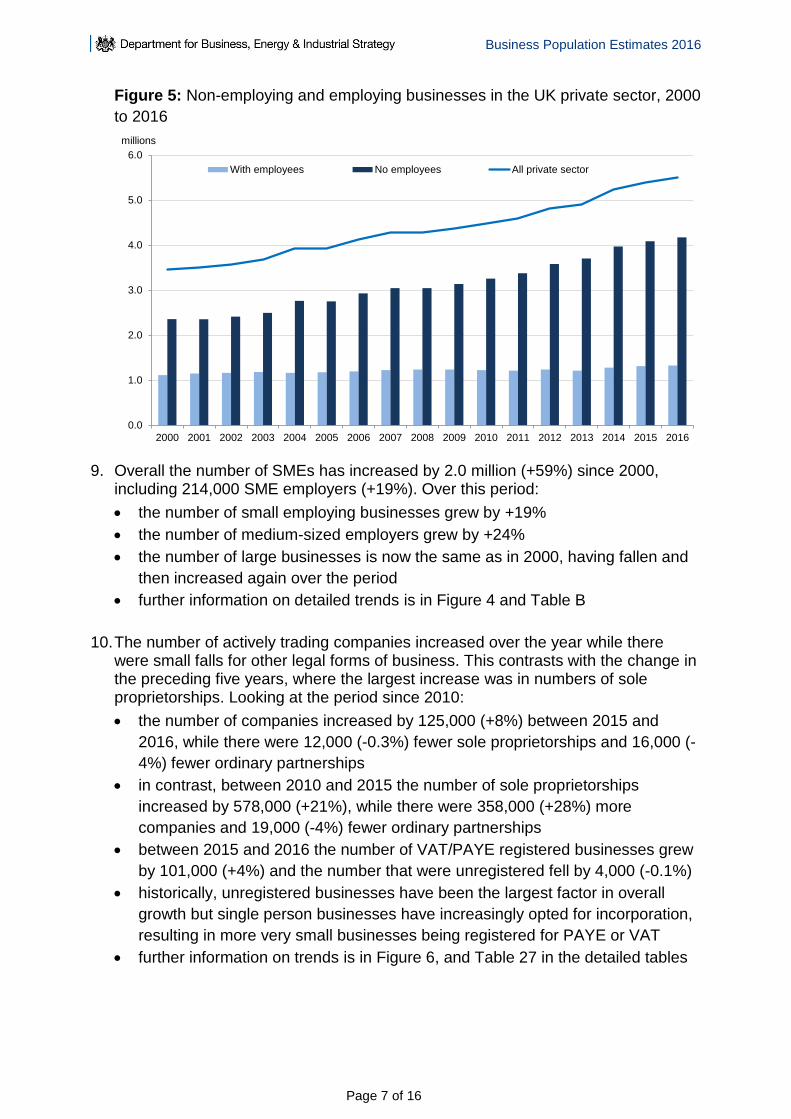
Figure 5: Non-employing and employing businesses in the UK private sector, 2000
to 2016
9. Overall the number of SMEs has increased by 2.0 million (+59%) since 2000, including 214,000 SME employers (+19%). Over this period:
the number of small employing businesses grew by +19%
the number of medium-sized employers grew by +24%
the number of large businesses is now the same as in 2000, having fallen and
then increased again over the period
further information on detailed trends is in Figure 4 and Table B
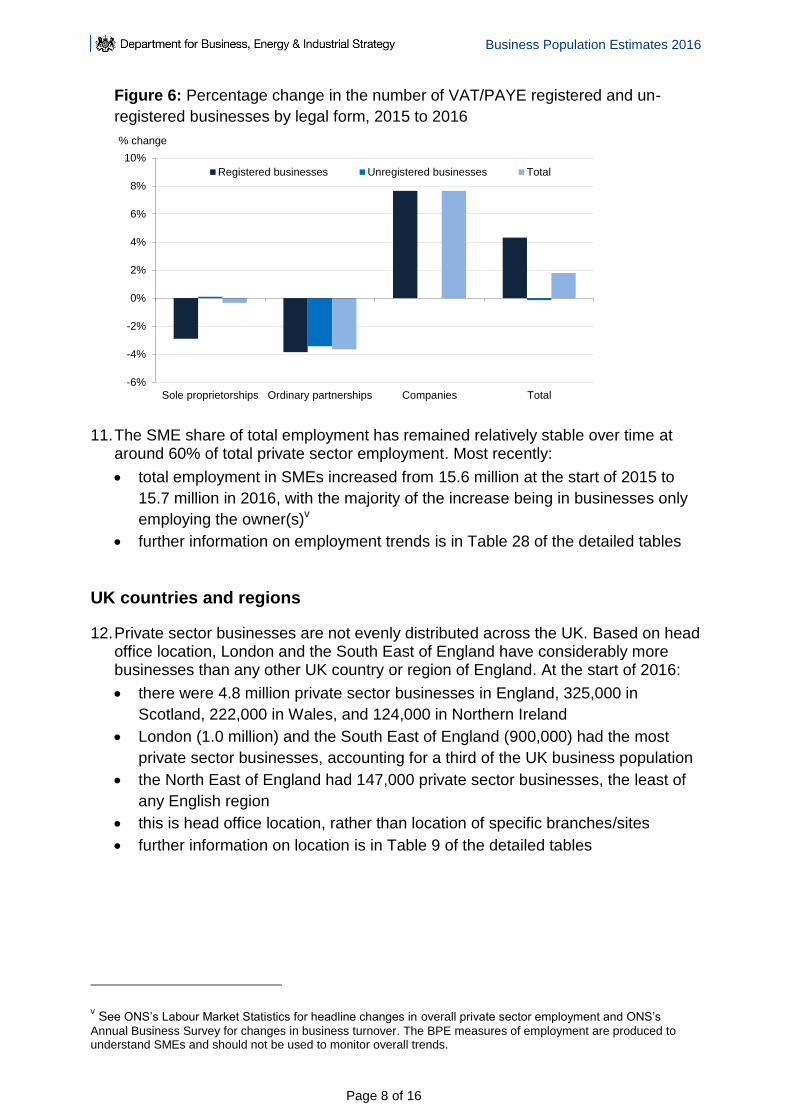
10. The number of actively trading companies increased over the year while there were small falls for other legal forms of business. This contrasts with the change in the preceding five years, where the largest increase was in numbers of sole proprietorships. Looking at the period since 2010:
the number of companies increased by 125,000 (+8%) between 2015 and
2016, while there were 12,000 (-0.3%) fewer sole proprietorships and 16,000 (-
4%) fewer ordinary partnerships
in contrast, between 2010 and 2015 the number of sole proprietorships
increased by 578,000 (+21%), while there were 358,000 (+28%) more
companies and 19,000 (-4%) fewer ordinary partnerships
between 2015 and 2016 the number of VAT/PAYE registered businesses grew
by 101,000 (+4%) and the number that were unregistered fell by 4,000 (-0.1%)
historically, unregistered businesses have been the largest factor in overall
growth but single person businesses have increasingly opted for incorporation,
resulting in more very small businesses being registered for PAYE or VAT
further information on trends is in Figure 6, and Table 27 in the detailed tables
0.0
1.0
2.0
3.0
4.0
5.0
6.0
2000 2001 2002 2003 2004 2005 2006 2007 2008 2009 2010 2011 2012 2013 2014 2015 2016
millions
With employees No employees All private sector
Business Population Estimates 2016
Page 8 of 16
Figure 6: Percentage change in the number of VAT/PAYE registered and un-
registered businesses by legal form, 2015 to 2016
11. The SME share of total employment has remained relatively stable over time at around 60% of total private sector employment. Most recently:
total employment in SMEs increased from 15.6 million at the start of 2015 to
15.7 million in 2016, with the majority of the increase being in businesses only
employing the owner(s)v
further information on employment trends is in Table 28 of the detailed tables
UK countries and regions
12. Private sector businesses are not evenly distributed across the UK. Based on head office location, London and the South East of England have considerably more businesses than any other UK country or region of England. At the start of 2016:
there were 4.8 million private sector businesses in England, 325,000 in
Scotland, 222,000 in Wales, and 124,000 in Northern Ireland
London (1.0 million) and the South East of England (900,000) had the most
private sector businesses, accounting for a third of the UK business population
the North East of England had 147,000 private sector businesses, the least of
any English region
this is head office location, rather than location of specific branches/sites
further information on location is in Table 9 of the detailed tables
v See ONS’s Labour Market Statistics for headline changes in overall private sector employment and ONS’s
Annual Business Survey for changes in business turnover. The BPE measures of employment are produced to understand SMEs and should not be used to monitor overall trends.
-6%
-4%
-2%
0%
2%
4%
6%
8%
10%
Sole proprietorships Ordinary partnerships Companies Total
% change
Registered businesses Unregistered businesses Total
Business Population Estimates 2016
Page 9 of 16
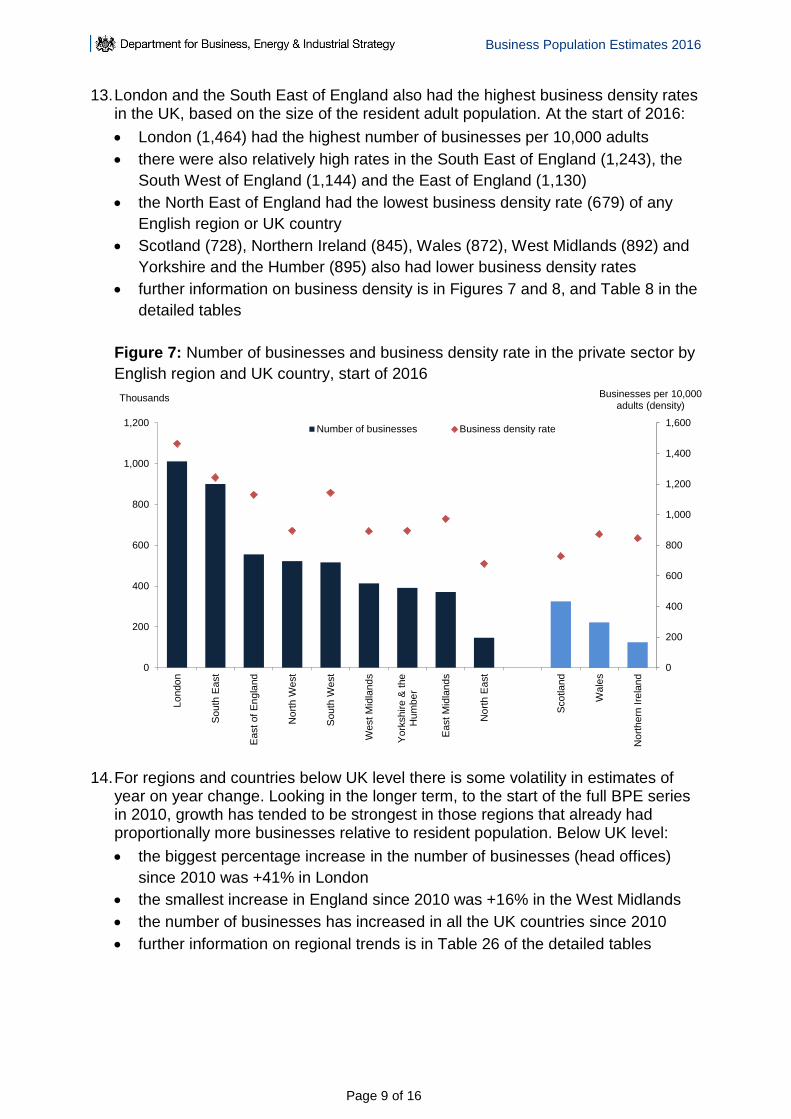
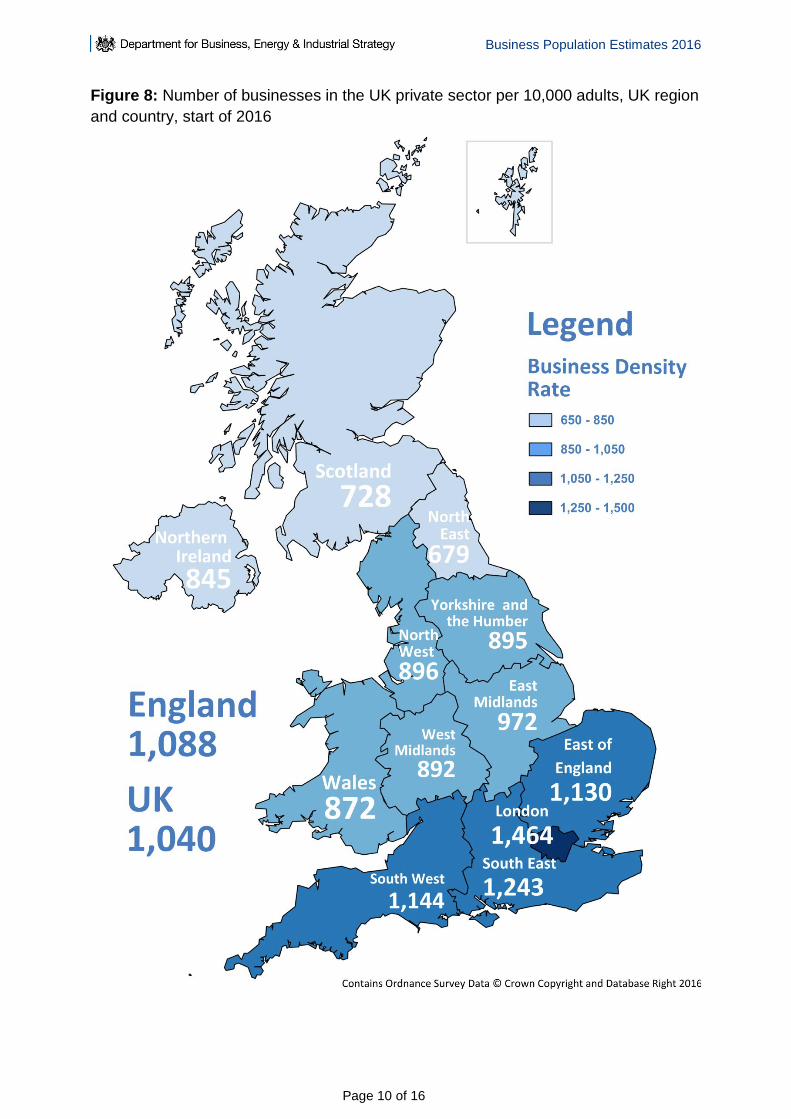
13. London and the South East of England also had the highest business density rates in the UK, based on the size of the resident adult population. At the start of 2016:
London (1,464) had the highest number of businesses per 10,000 adults
there were also relatively high rates in the South East of England (1,243), the
South West of England (1,144) and the East of England (1,130)
the North East of England had the lowest business density rate (679) of any
English region or UK country
Scotland (728), Northern Ireland (845), Wales (872), West Midlands (892) and
Yorkshire and the Humber (895) also had lower business density rates
further information on business density is in Figures 7 and 8, and Table 8 in the
detailed tables
Figure 7: Number of businesses and business density rate in the private sector by
English region and UK country, start of 2016
14. For regions and countries below UK level there is some volatility in estimates of year on year change. Looking in the longer term, to the start of the full BPE series in 2010, growth has tended to be strongest in those regions that already had proportionally more businesses relative to resident population. Below UK level:
the biggest percentage increase in the number of businesses (head offices)
since 2010 was +41% in London
the smallest increase in England since 2010 was +16% in the West Midlands
the number of businesses has increased in all the UK countries since 2010
further information on regional trends is in Table 26 of the detailed tables
0
200
400
600
800
1,000
1,200
1,400
1,600
0
200
400
600
800
1,000
1,200
Lo
ndo
n
South
East
East of
En
gla
nd
No
rth
West
South
West
West M
idla
nd
s
York
shir
e &
the
Hu
mbe
r
East M
idla
nd
s
No
rth
East
Sco
tla
nd
Wale
s
No
rth
ern
Ire
lan
d
Businesses per 10,000 adults (density)
Thousands
Number of businesses Business density rate
Business Population Estimates 2016
Page 10 of 16
Figure 8: Number of businesses in the UK private sector per 10,000 adults, UK region
and country, start of 2016
Business Population Estimates 2016
Page 11 of 16
Industries
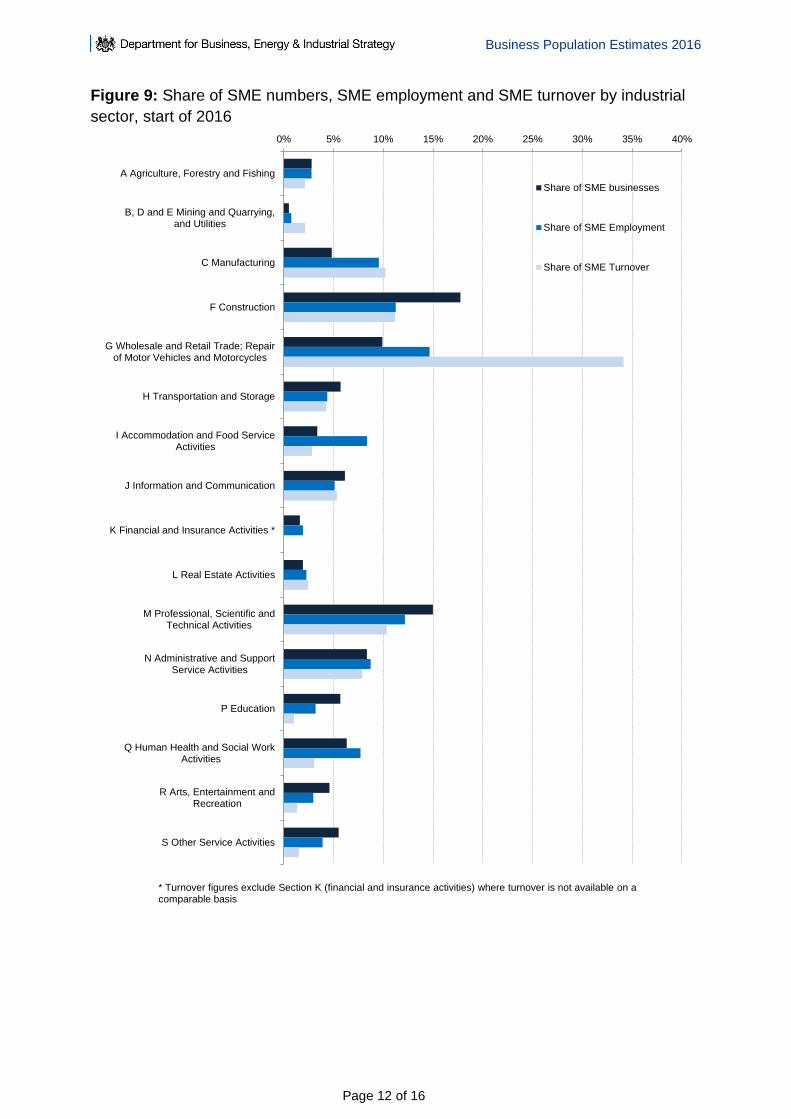
15. SMEs account for over 99% of the overall population in each of the main industry sectors and are therefore distributed similarly to the business population overall. At the start of 2016:
just under a fifth (975,000) of all SMEs were operating in Construction,
compared with less than 1% in the Mining, Quarrying and Utilities sector
there were also a considerable number of SMEs operating in the Professional,
Scientific and Technical Activities (823,000 or 15%), and Wholesale and Retail
Trade and Repair sectors (543,000 or 10%)
there were 28,000 SMEs in Mining and Quarrying and Utilities
16. Although Construction is the largest industrial sector in terms of SME numbers, Wholesale and Retail Trade had the highest share of both SME employment and turnover. At the start of 2016:
Wholesale and Retail Trade and Repair accounted for 15% of all SME
employment and over a third of SME turnover in the UK private sector
almost a third of SME turnover was spread across three more sectors:
Construction (11%), Manufacturing (10%) and Professional, Scientific and
Technical (10%)
further information for industries in Figure 9, and Table 5 in the detailed tables
Business Population Estimates 2016
Page 12 of 16
Figure 9: Share of SME numbers, SME employment and SME turnover by industrial
sector, start of 2016
0% 5% 10% 15% 20% 25% 30% 35% 40%
A Agriculture, Forestry and Fishing
B, D and E Mining and Quarrying,and Utilities
C Manufacturing
F Construction
G Wholesale and Retail Trade; Repairof Motor Vehicles and Motorcycles
H Transportation and Storage
I Accommodation and Food ServiceActivities
J Information and Communication
K Financial and Insurance Activities *
L Real Estate Activities
M Professional, Scientific andTechnical Activities
N Administrative and SupportService Activities
P Education
Q Human Health and Social Work Activities
R Arts, Entertainment andRecreation
S Other Service Activities
* Turnover figures exclude Section K (financial and insurance activities) where turnover is not available on a comparable basis
Share of SME businesses
Share of SME Employment
Share of SME Turnover
Business Population Estimates 2016
Page 13 of 16
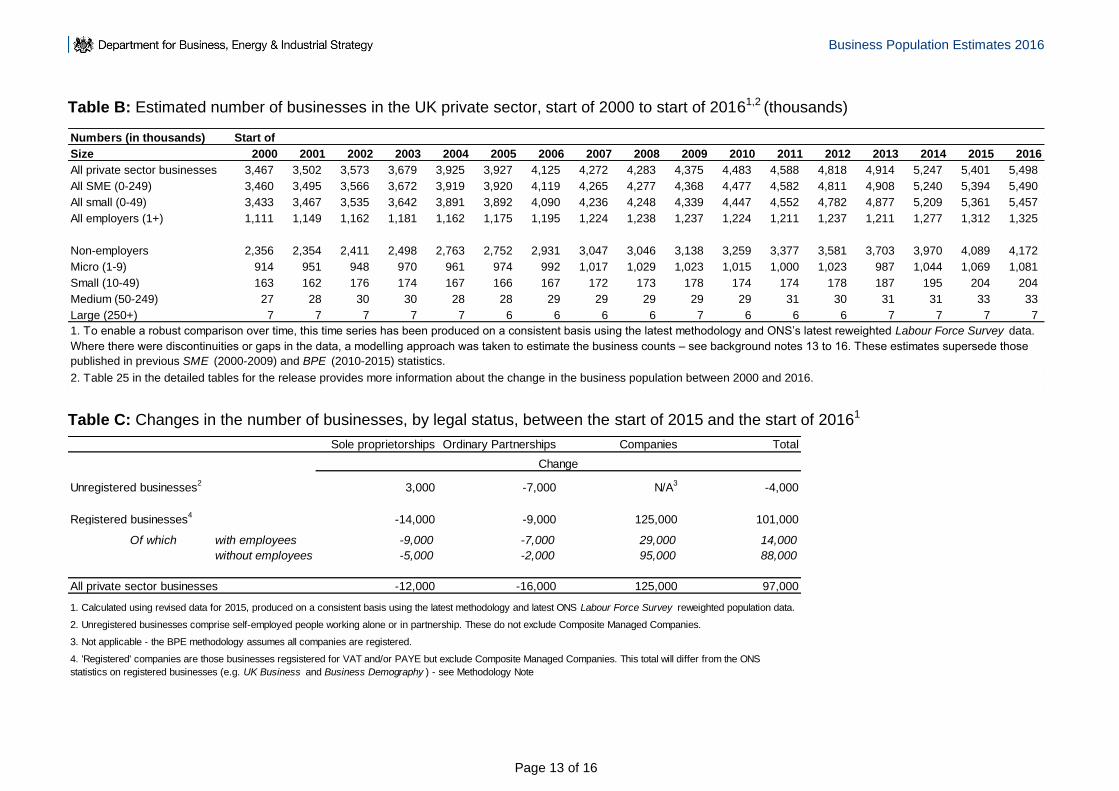
Table B: Estimated number of businesses in the UK private sector, start of 2000 to start of 20161,2 (thousands)
Table C: Changes in the number of businesses, by legal status, between the start of 2015 and the start of 20161
Numbers (in thousands) Start of
Size 2000 2001 2002 2003 2004 2005 2006 2007 2008 2009 2010 2011 2012 2013 2014 2015 2016
All private sector businesses 3,467 3,502 3,573 3,679 3,925 3,927 4,125 4,272 4,283 4,375 4,483 4,588 4,818 4,914 5,247 5,401 5,498
All SME (0-249) 3,460 3,495 3,566 3,672 3,919 3,920 4,119 4,265 4,277 4,368 4,477 4,582 4,811 4,908 5,240 5,394 5,490
All small (0-49) 3,433 3,467 3,535 3,642 3,891 3,892 4,090 4,236 4,248 4,339 4,447 4,552 4,782 4,877 5,209 5,361 5,457
All employers (1+) 1,111 1,149 1,162 1,181 1,162 1,175 1,195 1,224 1,238 1,237 1,224 1,211 1,237 1,211 1,277 1,312 1,325
Non-employers 2,356 2,354 2,411 2,498 2,763 2,752 2,931 3,047 3,046 3,138 3,259 3,377 3,581 3,703 3,970 4,089 4,172
Micro (1-9) 914 951 948 970 961 974 992 1,017 1,029 1,023 1,015 1,000 1,023 987 1,044 1,069 1,081
Small (10-49) 163 162 176 174 167 166 167 172 173 178 174 174 178 187 195 204 204
Medium (50-249) 27 28 30 30 28 28 29 29 29 29 29 31 30 31 31 33 33
Large (250+) 7 7 7 7 7 6 6 6 6 7 6 6 6 7 7 7 7
1. To enable a robust comparison over time, this time series has been produced on a consistent basis using the latest methodology and ONS’s latest reweighted Labour Force Survey data.
Where there were discontinuities or gaps in the data, a modelling approach was taken to estimate the business counts – see background notes 13 to 16. These estimates supersede those
published in previous SME (2000-2009) and BPE (2010-2015) statistics.
2. Table 25 in the detailed tables for the release provides more information about the change in the business population between 2000 and 2016.
Sole proprietorships Ordinary Partnerships Companies Total
Unregistered businesses2
3,000 -7,000 N/A3
-4,000
Registered businesses4
-14,000 -9,000 125,000 101,000
Of which with employees -9,000 -7,000 29,000 14,000
without employees -5,000 -2,000 95,000 88,000
All private sector businesses -12,000 -16,000 125,000 97,000
Change
4. 'Registered' companies are those businesses regsistered for VAT and/or PAYE but exclude Composite Managed Companies. This total will differ from the ONS
statistics on registered businesses (e.g. UK Business and Business Demography ) - see Methodology Note
2. Unregistered businesses comprise self-employed people working alone or in partnership. These do not exclude Composite Managed Companies.
3. Not applicable - the BPE methodology assumes all companies are registered.
1. Calculated using revised data for 2015, produced on a consistent basis using the latest methodology and latest ONS Labour Force Survey reweighted population data.
Business Population Estimates 2016
Page 14 of 16
Notes for this release
1) Business Population Estimates 2016 is the latest in a series providing estimates of the total number of private sector businesses in the UK. BPE estimates the total number of UK private sector businesses at a point in time, including those that are registered for VAT or PAYE and those that are unregistered (see note 13 for more information). Related ONS publications report on only the VAT/PAYE registered businesses.
2) To aid the interpretation of these statistics, it is highly recommended that users refer to the Methodology and Quality Note that accompanies this release.
3) Information on the employment and turnover in these businesses is also provided. The function of the employment and turnover data here is primarily to (i) classify businesses by employee size band and (ii) calculate shares of employment and turnover across industrial sectors, regions and legal statuses. This edition includes an employment time-series in Table 28 of the detailed tables. However, users should note that these employment estimates are indicative and that ONS publishes other sources of employment data more suitable for monitoring total jobs and people in employment. See the Workforce Jobs series, the Business Registers Employment Survey (BRES), and the wider Labour Market Statistics (refer to the Methodology and Quality Note for more information).
4) A Guide explaining how this publication relates to other National Statistics on business population and demography has been published to help users understand the differences and choose the most appropriate source.
5) All figures in this document can also be found in the accompanying Excel file of detailed tables.
6) All statistics relating to 2016 released in this publication are new. Statistics for years 2013 to 2015 have been revised for this edition using the latest re-weighted ONS Labour Force Survey population data. For more detail, see note 15 and the revisions policy in the Methodology and Quality Note.
Definitions
7) In this release a small business is defined as a business with 0-49 employees, a medium-sized business is one with 50-249 employees, and a large business is one with 250 or more employees. Small and medium-sized enterprises (SMEs) are defined as businesses with 0-249 employees.
8) Within the scope of the Business Population Estimates, companies with a single employee director are counted as zero employee businesses.
9) The definition of the private sector used in this publication excludes the non-profit sector, but includes public corporations and nationalised bodies.
10) Turnover data throughout this release excludes both SIC2007 Section K (Financial and insurance activities) where turnover is not available on a comparable basis.
11) Businesses that have sites (and employees) in more than one region or country are counted here only in the region or country where they are registered. These
Business Population Estimates 2016
Page 15 of 16
estimates may therefore differ from actual employment in a region, since some people in one region will work for businesses that are registered in another region.
12) All figures and percentages in this document are rounded. Therefore totals may not exactly match the sum of their parts. Suppression and controlled rounding have been used to protect the data in this publication from disclosure. For further information, please refer to the Methodology and Quality Note.
Overview of Methodology
13) There is no single database containing all private sector businesses in the UK. The main source for this publication is the Inter-Departmental Business Register (IDBR), managed by the Office for National Statistics (ONS), which is used to provide the number of VAT/PAYE registered businesses in the UK. This publication also includes estimates of smaller non employing (unregistered) businesses which are calculated using a combination of information from the ONS Labour Force Survey and HMRC self-assessment tax return data. More detail of the estimation process is provided in the Methodology and Quality Note.
14) This edition uses the same methodology as that used since the 2011 edition of this publication. However, the methodology is not directly comparable to that used for BPE 2010 or to the older SME Statistics series (1994-2009). Time series data presented here will be substantially different from estimates published in earlier years due to the incorporation of updated Labour Force Survey data and new cases added to the IDBR.
15) To enable robust comparison over time, a time series is calculated using the latest methodology and data. This shows annual estimates of numbers of private sector businesses in the UK between 2000 and 2016. Estimates for UK countries/English regions and for different legal forms are provided for years since 2010 (the first year for which consistent estimates can be produced).
16) Known impacts from changes to HMRC systems have been adjusted for – further details are in the methodology note.
Data users and uses
17) The Business Population Estimates are used extensively by government, the public, public bodies and businesses to analyse the scale, structure and significance of the total business population in the UK and to monitor change over time. For example, they are used by:
government in understanding the likely impact of policy changes and monitoring the impact of the recession on different sections of the business population
businesses in understanding market share and planning marketing strategies
by banks in developing an understanding of their customer base
by foreign firms in making UK location decisions
by academics to inform research into businesses at local and national level
by a range of public bodies in decision making and in evaluating the success of regeneration and business related policies
by public and private business support providers in targeting business support
Business Population Estimates 2016
Page 16 of 16
18) More detailed information on the users and use made of this series is available in the BPE User Engagement Strategy.
National Statistics publication
19) This National Statistics publication is produced to high professional standards set out in the Code of Practice for Official Statistics and the Pre-Release Access to Official Statistics Order (2008). These statistics were assessed for compliance against the Code of Practice for Official Statistics by the UKSA during 2011-12 and in October 2012 their National Statistics designation was confirmed. They are produced free from any political interference.
20) The United Kingdom Statistics Authority has designated these statistics as National Statistics, in accordance with the Statistics and Registration Service Act 2007 and signifying compliance with the Code of Practice for Official Statistics.
21) Designation can be broadly interpreted to mean that the statistics:
meet identified user needs;
are well explained and readily accessible;
are produced according to sound methods, and
are managed impartially and objectively in the public interest.
22) Once statistics have been designated as National Statistics it is a statutory requirement that the Code of Practice shall continue to be observed.
© Crown copyright 2016 This publication is licensed under the terms of the Open Government Licence v3.0 except where otherwise stated. To view this licence, visit nationalarchives.gov.uk/doc/open-government-licence/version/3 or write to the Information Policy Team, The National Archives, Kew, London TW9 4DU, or email: [email protected] we have identified any third party copyright information you will need to obtain permission from the copyright holders concerned. This publication available from www.gov.uk/beis If you require this publication in an alternative format, e-mail [email protected] or call 0207 215 5000 URN BEIS/16/34