statistical data and reporting guidelines: important to get your paper published
TRANSCRIPT
STATISTICAL DATA AND REPORTING GUIDELINES: IMPORTANT TO GET YOUR PAPER PUBLISHED
Graeme L. Hickey University of Liverpool & EJCTS / ICVTS [email protected]

CONFLICT OF INTEREST
None to declare
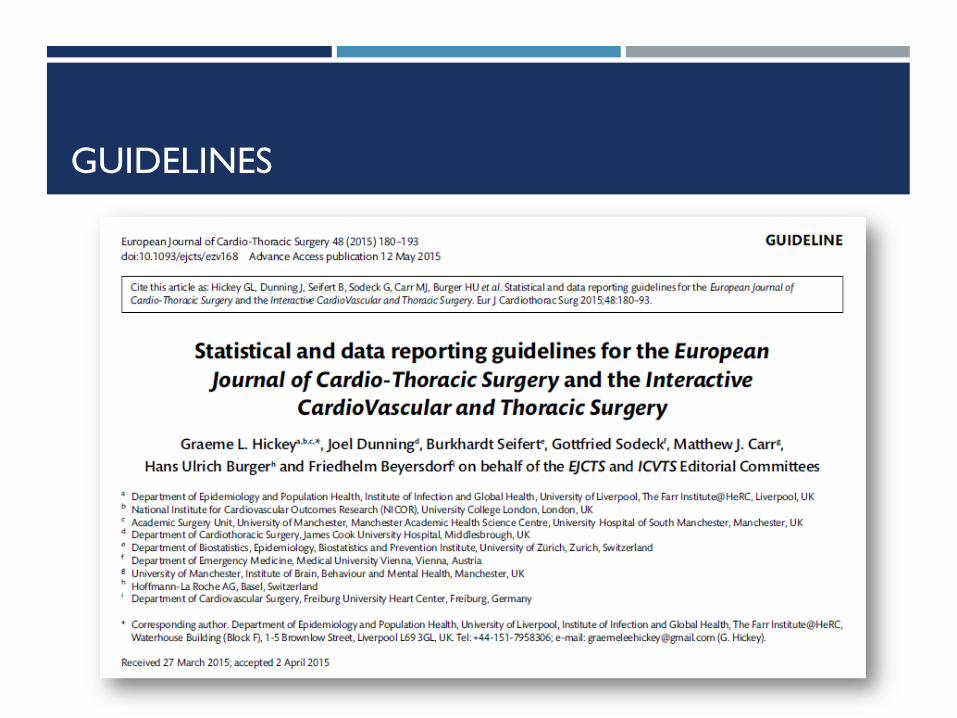
GUIDELINES
SUMMARY
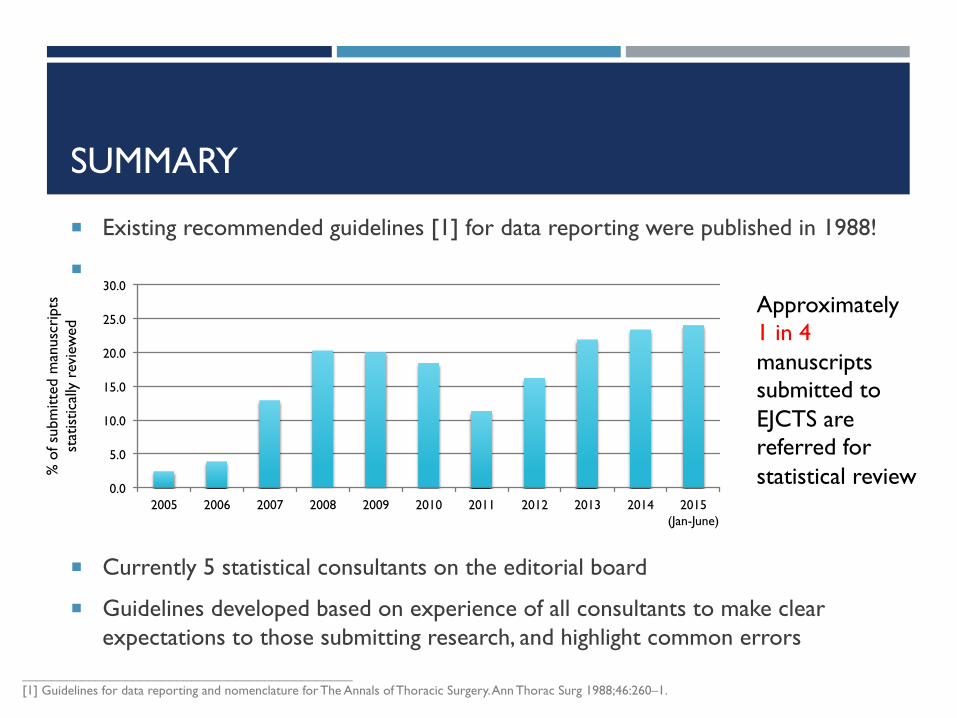
! Existing recommended guidelines [1] for data reporting were published in 1988!
!
! Currently 5 statistical consultants on the editorial board
! Guidelines developed based on experience of all consultants to make clear expectations to those submitting research, and highlight common errors
_____________________________________________ [1] Guidelines for data reporting and nomenclature for The Annals of Thoracic Surgery. Ann Thorac Surg 1988;46:260–1.
0.0
5.0
10.0
15.0
20.0
25.0
30.0
2005 2006 2007 2008 2009 2010 2011 2012 2013 2014 2015 (Jan-June)
Approximately 1 in 4 manuscripts submitted to EJCTS are referred for statistical review %
of s
ubm
itted
man
uscr
ipts
st
atis
tical
ly r
evie
wed
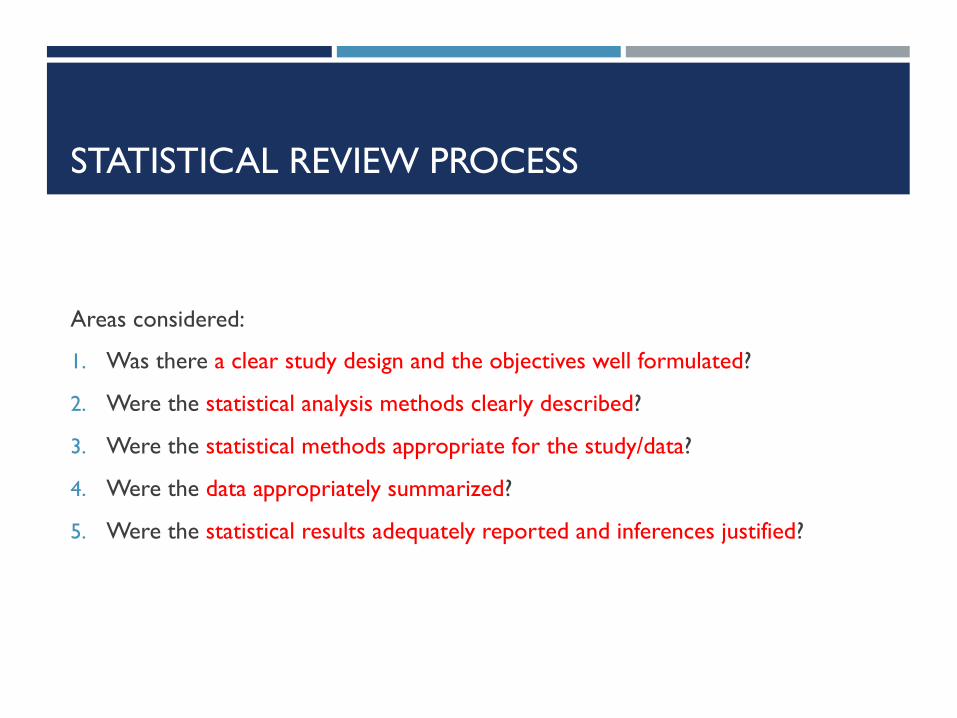
STATISTICAL REVIEW PROCESS
Areas considered:
1. Was there a clear study design and the objectives well formulated?
2. Were the statistical analysis methods clearly described?
3. Were the statistical methods appropriate for the study/data?
4. Were the data appropriately summarized?
5. Were the statistical results adequately reported and inferences justified?
1. EXISTING REPORTING GUIDELINES
EJCTS Guidelines supplement existing reporting statements—not replace them!
1. STUDY DESIGN: CORE REQUIREMENTS
! Objective / hypothesis and type of study
! Data acquisition methods (incl. post-discharge follow-up)
! Inclusion and exclusion criteria
! Sample size rationale – calculations should be reproducible
! Randomization and blinding (if relevant)
! Potential sources of bias ! statistical adjustment methods used
1. STUDY DESIGN: DEFINITIONS
! Explicitly define outcomes, e.g.
! ‘(Peri-)operative mortality’ – in-hospital or 30-day?
! Time origin for time-to-event variables – surgery, randomisation, discharge, etc.?
! All-cause or cause-specific mortality?
! Use accepted definitions where available
! E.g. valve [1] & TAVI [2]
! Avoid ambiguous or undefined study variables
! E.g. ‘normal’ vs. ‘abnormal’ white cell count
_____________________________________________ [1] Akins CW, et al. Guidelines for reporting mortality and morbidity after cardiac valve interventions. Eur J Cardiothorac Surg 2008;33: 523–8. [2] Kappetein AP, et al. Updated standardized endpoint definitions for transcatheter aortic valve implantation: the Valve Academic Research Consortium-2 consensus document (VARC-2). Eur J Cardiothorac Surg 2012;42:S45–60.
2. DESCRIPTION OF STATISTICAL ANALYSIS
! A description of statistical methods used, and when they were used
! Additional information request for advanced statistical methods
! Handling of missing data
! Phrasing and terminology, e.g. incidence vs. prevalence or multivariate vs. multivariable
2. DESCRIPTION OF STATISTICAL ANALYSIS: REGRESSION MODELS
! Inclusion of adjustment covariates
! Univariable screening
! Stepwise regression methods (details of algorithm required)
! Covariates forced into model
! All covariates included
! Consideration to over-fitting and stability?
! Functional form of continuous covariates (e.g. transformations, dichotomization)
2. DESCRIPTION OF STATISTICAL ANALYSIS: PROPENSITY SCORE MATCHING
Limited guidance, but recommendations in literature [1] include:
! Evaluate balance between baseline variables using standardised difference, not just hypothesis tests
! Provide details of matching algorithms used (incl. caliper details, match ratio, with/without replacement) – not just software!
! Lack of balance requires further iterations of propensity score model building (e.g. interaction terms) – don’t stop at first attempt!
! Describe statistical methodology used to estimate treatment effects in the matched data
_____________________________________________ [1] Austin, P. C. (2007). Propensity-score matching in the cardiovascular surgery literature from 2004 to 2006: a systematic review and suggestions for improvement. The Journal of Thoracic and Cardiovascular Surgery, 134(5), 1128–35.
3. APPROPRIATE METHODS
! Regression models should have assumptions checked, and if necessary be assessed using suitable diagnostics and goodness-of-fit tests
! E.g. Proportional hazards assumption for Cox regression models
! Correct statistical model / methodology for data
! E.g. using logistic regression when a Cox model should have been used
! E.g. independent samples test for paired data
! Multivariable models should have an adequate event-per-variable ratio
! E.g. fitting a logistic regression model with 7 covariates to data with 20 events and 1000 subjects using maximum likelihood would be inappropriate
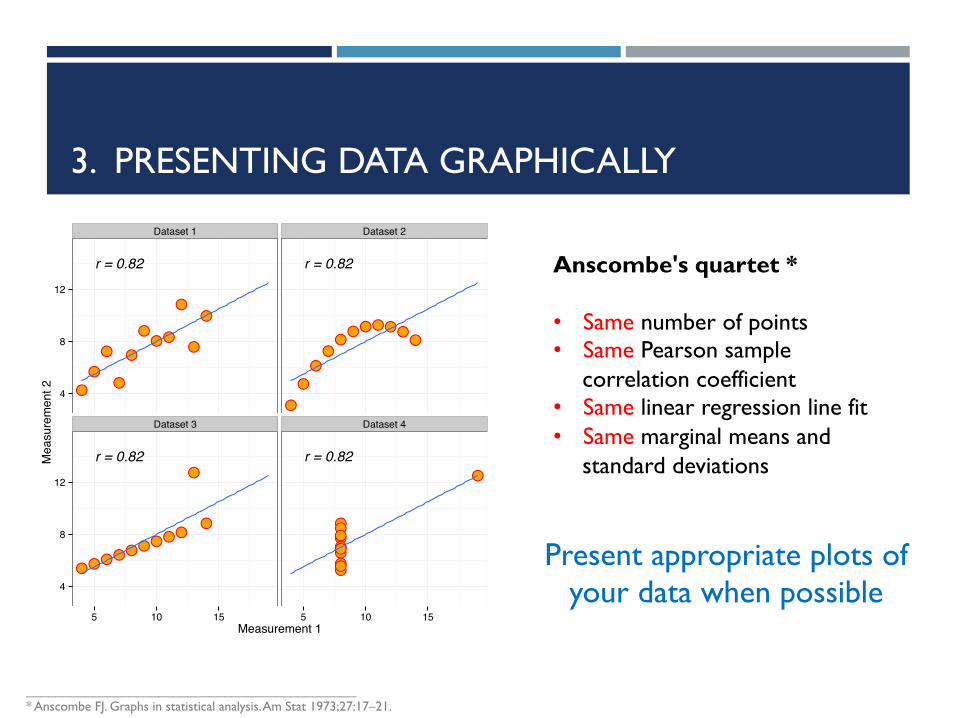
3. PRESENTING DATA GRAPHICALLY
●●
●● ●
●
●
●
●
●●
r = 0.82
●●
●● ●●
●
●
●
●
●
r = 0.82
●●
●
●●
●
●●
●
●●
r = 0.82
●●
●●●
●
●
●
●
●●
r = 0.82
Dataset 1 Dataset 2
Dataset 3 Dataset 4
4
8
12
4
8
12
5 10 15 5 10 15Measurement 1
Mea
sure
men
t 2
Anscombe's quartet * • Same number of points • Same Pearson sample
correlation coefficient • Same linear regression line fit • Same marginal means and
standard deviations
Present appropriate plots of your data when possible
_____________________________________________ * Anscombe FJ. Graphs in statistical analysis. Am Stat 1973;27:17–21.
4. DATA REPORTING
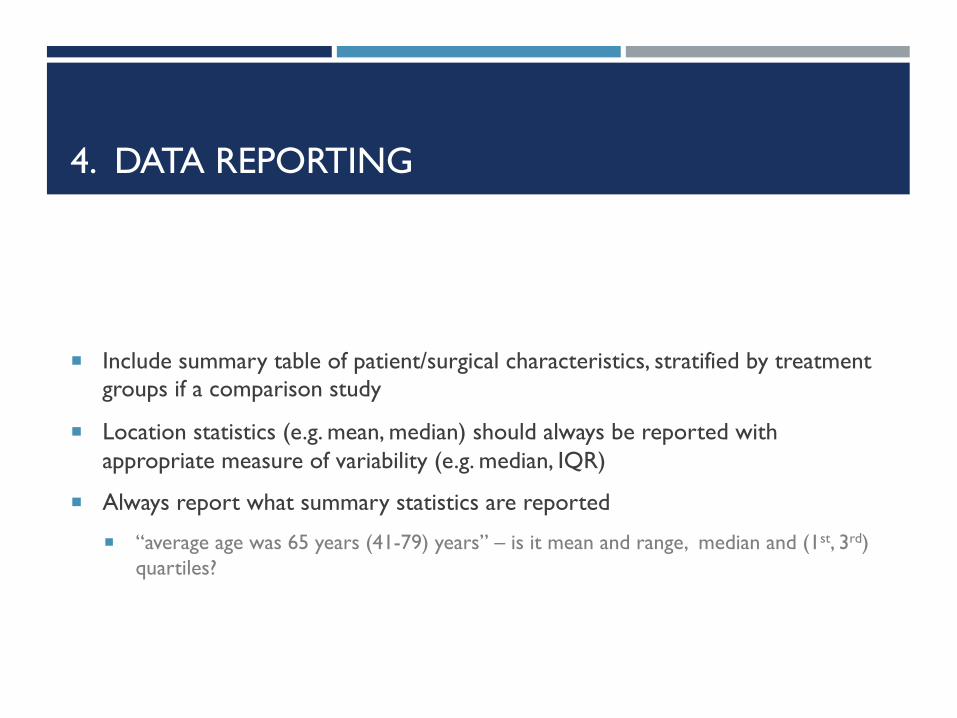
! Include summary table of patient/surgical characteristics, stratified by treatment groups if a comparison study
! Location statistics (e.g. mean, median) should always be reported with appropriate measure of variability (e.g. median, IQR)
! Always report what summary statistics are reported
! “average age was 65 years (41-79) years” – is it mean and range, median and (1st, 3rd) quartiles?
23
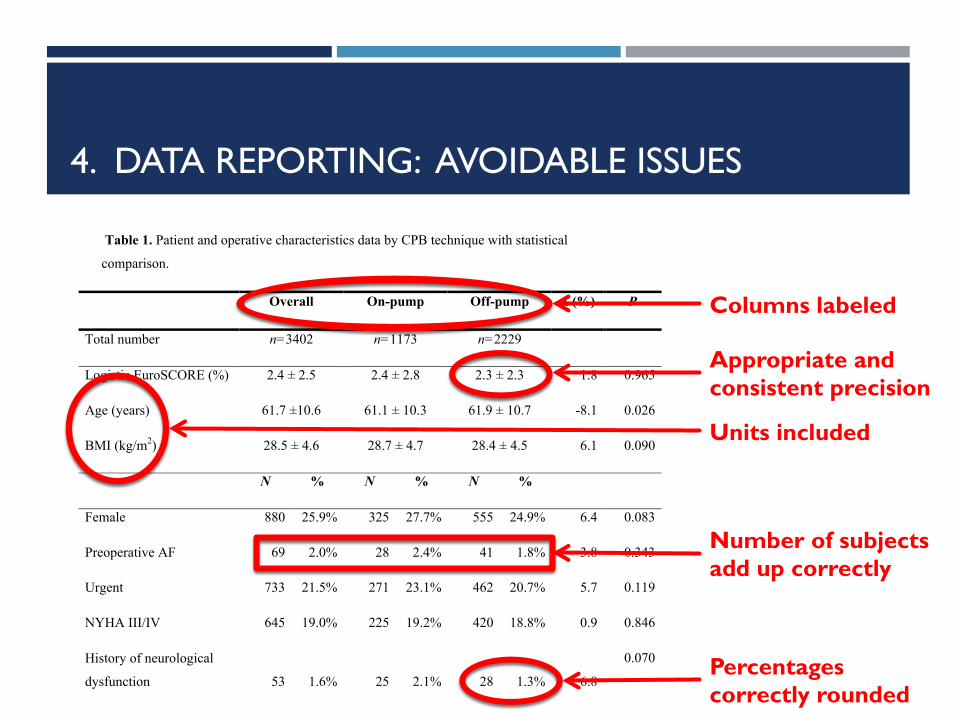
Table 1. Patient and operative characteristics data by CPB technique with statistical
comparison. 518
Overall On-pump Off-pump Δ (%) P
Total number n=3402 n=1173 n=2229
Logistic EuroSCORE (%) 2.4 ± 2.5 2.4 ± 2.8 2.3 ± 2.3 1.8 0.965
Age (years) 61.7 ±10.6 61.1 ± 10.3 61.9 ± 10.7 -8.1 0.026
BMI (kg/m2) 28.5 ± 4.6 28.7 ± 4.7 28.4 ± 4.5 6.1 0.090
N % N % N %
Female 880 25.9% 325 27.7% 555 24.9% 6.4 0.083
Preoperative AF 69 2.0% 28 2.4% 41 1.8% 3.8 0.343
Urgent 733 21.5% 271 23.1% 462 20.7% 5.7 0.119
NYHA III/IV 645 19.0% 225 19.2% 420 18.8% 0.9 0.846
History of neurological
dysfunction 53 1.6% 25 2.1% 28 1.3% 6.8
0.070
Diabetes (insulin or diet
controlled) 600 17.6% 207 17.6% 393 17.6% 0.0
>0.999
History of hypertension 2269 66.7% 764 65.1% 1505 67.5% -5.1 0.172
Recent MI 480 14.1% 177 15.1% 303 13.6% 4.3 0.255
Creatinine >200µmol//l 33 1.0% 11 0.9% 22 1.0% -0.5 >0.999
History of pulmonary
disease 361 10.6% 115 9.8% 246 11.0% -4.0
0.293
Extracardiac arteriopathy 226 6.6% 89 7.6% 137 6.1% 5.7 0.126
4. DATA REPORTING: AVOIDABLE ISSUES
Units included
Percentages correctly rounded
Number of subjects add up correctly
Columns labeled
Appropriate and consistent precision
4. DATA REPORTING: CHARTS
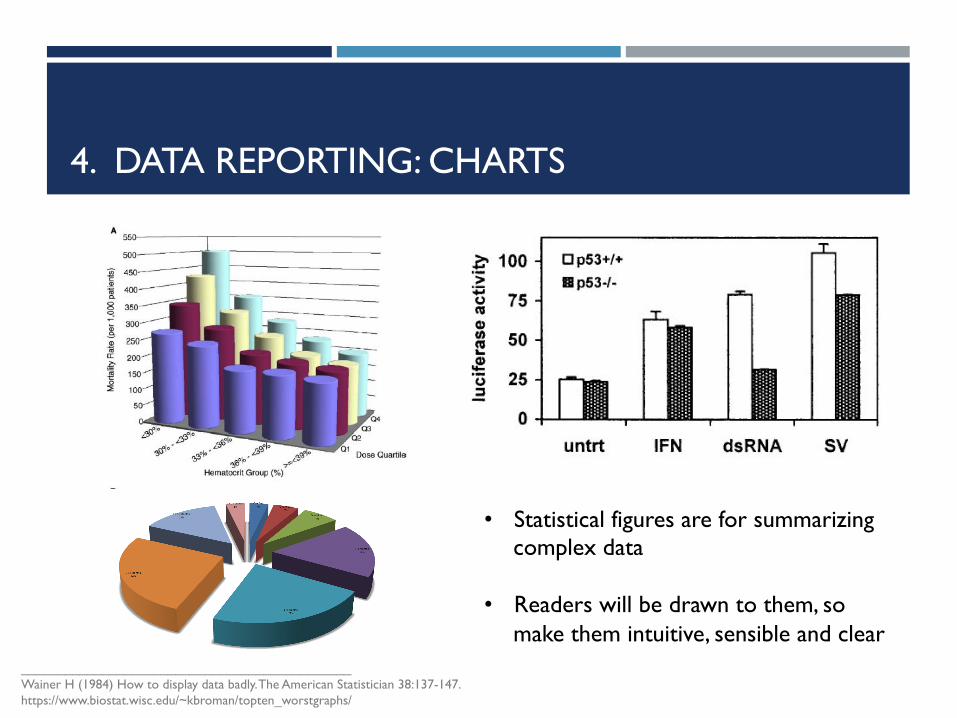
_____________________________________________ Wainer H (1984) How to display data badly. The American Statistician 38:137-147. https://www.biostat.wisc.edu/~kbroman/topten_worstgraphs/
• Statistical figures are for summarizing complex data
• Readers will be drawn to them, so
make them intuitive, sensible and clear
5. RESULTS
! P-values alone ≠ results ! effect sizes and confidence intervals
! Full regression models should be reported – not just significant terms
! Details of any deviations from the planned study
! P-values and statistics reported to appropriate precision
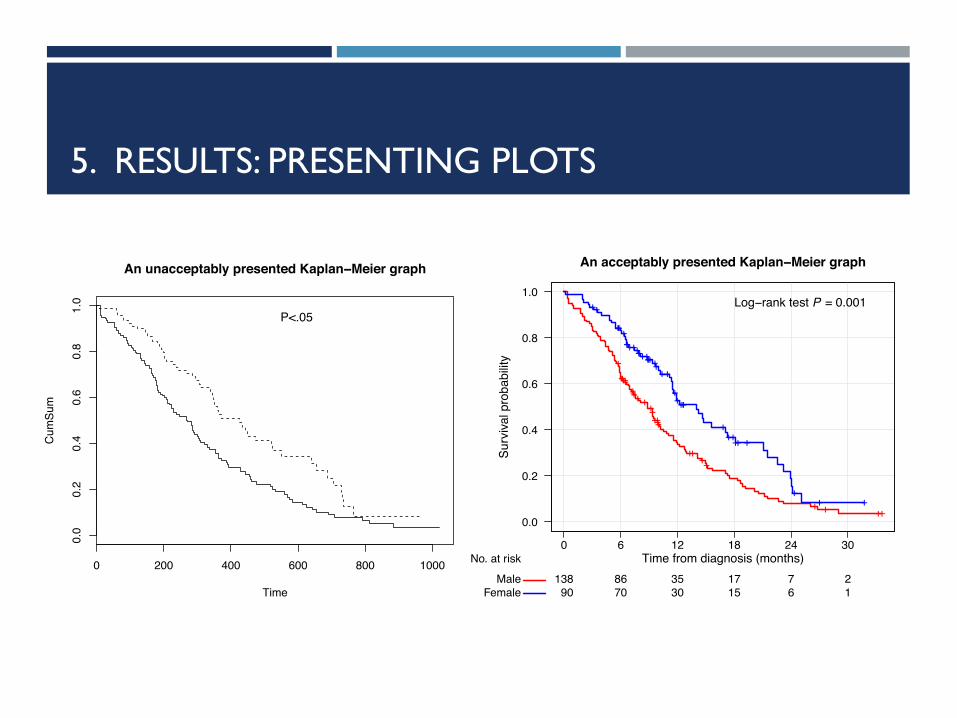
5. RESULTS: PRESENTING PLOTS
0 200 400 600 800 1000
0.0
0.2
0.4
0.6
0.8
1.0
Time
Cum
Sum
An unacceptably presented Kaplan−Meier graph
P<.05
0.0
0.2
0.4
0.6
0.8
1.0
0 6 12 18 24 30Time from diagnosis (months)
Surv
ival p
roba
bilit
y
MaleFemale
138 86 35 17 7 290 70 30 15 6 1
No. at risk
++++++
+++++++++++
++ ++
+ + ++
++++++
+++++++++++++++++++++
+++++ +
++ +
An acceptably presented Kaplan−Meier graph
Log−rank test P = 0.001
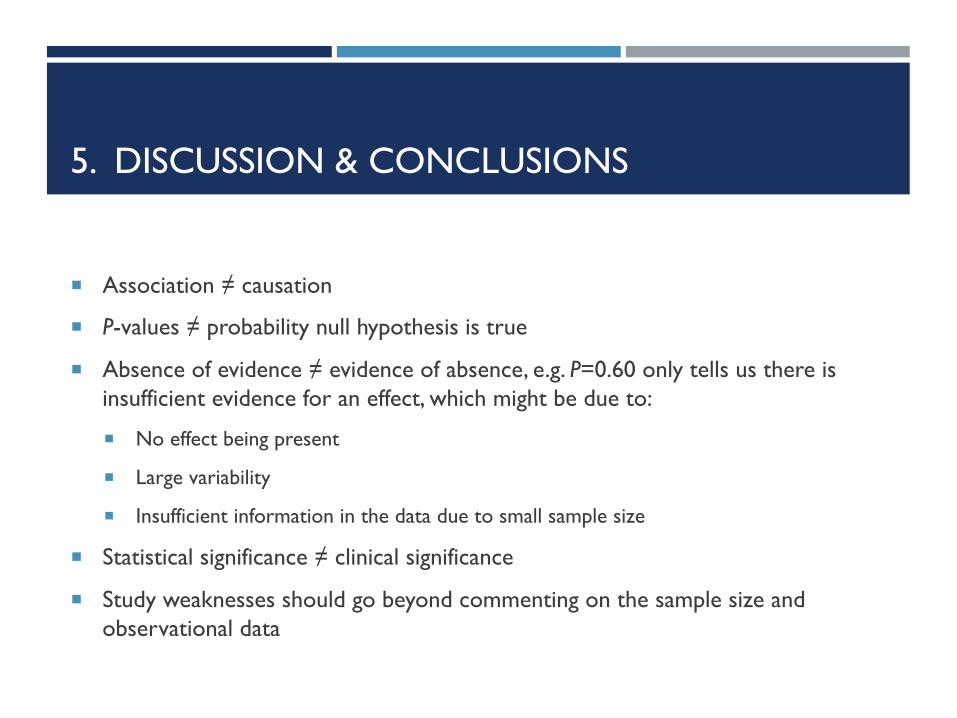
5. DISCUSSION & CONCLUSIONS
! Association ≠ causation
! P-values ≠ probability null hypothesis is true
! Absence of evidence ≠ evidence of absence, e.g. P=0.60 only tells us there is insufficient evidence for an effect, which might be due to:
! No effect being present
! Large variability
! Insufficient information in the data due to small sample size
! Statistical significance ≠ clinical significance
! Study weaknesses should go beyond commenting on the sample size and observational data
CONCLUSIONS
! EJCTS & ICVTS Statistical and Data Reporting Guidelines inform authors on what statistical reviewers are looking for
! A well analyzed study allows reviewers to focus on what is important—the science!
! It is advised that a biostatistician be involved in the analysis
! Correct and well-reported (and correct) statistical analysis essential to getting your paper published!

ACKNOWLEDGEMENTS
Editorial Board Friedhelm Beyersdorf (Editor-in-Chief) Joel Dunning (Associate Editor) Judy Gaillard (Managing Editor) Franziska Lueder (Editorial Manager)
Assistant Editors (Statistical Consultants) Burkhardt Seifert Gottfried Sodeck Matthew J. Carr Hans Ulrich Burger Graeme L. Hickey
+ all other editorial members