statement of fiscal policy to be laid on the table of the ... · pdf file19 revenue...
TRANSCRIPT
GOVERNMENT OF ANDHRA PRADESH
Statement of Fiscal Policy to be laid on the
table of the A.P. State Legislature
in March, 2015
(As required under section 5 of the Andhra Pradesh
Fiscal Responsibility and Budget Management Act, 2005)
YANAMALA RAMAKRISHNUDU FINANCE MINISTER

2013-14 2014-15 2013-14 2014-15
Actuals RE Actuals RE
1 2 3 4 5 6
Real Sector
1 GSDP at factor cost
(a) at Constant Prices (2004-2005) 246724 264521 -42.90 7.21
(b) at Current Prices 464183 520030 -38.47 12.03
(i) Agriculture Sector 129227 143498 -24.85 11.04
(ii) Industry Sector 98097 107224 -49.21 9.30
(iii) Services Sector 236859 269308 -39.16 13.70
Government Finances
1 Revenue Receipts (2 +3) 110718.84 84066.05 6.63 -24.07
2 Tax Revenue (2.1+2.2) 86255.42 55313.88 7.62 -35.87
2.1 Own Tax Revenue 64123.53 38475.11 7.10 -40.00
2.2 State’s Share in Central Taxes 22131.89 16838.77 9.18 -23.92
3 Non-Tax Revenue (3.1 + 3.2) 24463.42 28752.17 3.29 17.53
3.1 State's Own Non Tax revenue 15472.86 8921.39 -3.29 -42.34
3.2 Central Transfers 8990.56 19830.78 16.98 120.57
4 Capital Receipts (5+6+7) 17537.99 19676.72 3.36 12.19
5 Recovery of loans -3114.26 1069.01 -831.44 -134.33
6 Other Receipts 0.00 0.00
7 Borrowing and other liabilities etc (Net) 20652.25 18607.71 24.85 -9.90
8 Total Receipts (1+ 4) 128256.83 103742.77 6.18 -19.11
9 Non-Plan Expenditure (10+12) 86237.37 83144.01 10.49 -3.59
10 Revenue Account (Non-Plan) 86237.20 83144.01 11.33 -3.59
Of which:
11 (a) Interest payments 12910.64 9676.23 10.71 -25.05
(b) Subsidies 14298.46 24673.03 21.55 72.56
(c) Wages & Salaries 30569.01 29000.44 8.90 -5.13
(d) Pension Payments 13682.78 9778.37 13.18 -28.54
12 Capital Account (Non-Plan) 0.17 0.00 -99.97 -100.00
13 Plan Expenditure (14+15) 39417.26 22311.16 -9.83 -43.40
14 Revenue Account (Plan) 24137.29 15164.62 -4.38 -37.17
15 Capital Account (Plan) 15279.97 7146.54 -17.28 -53.23
16Total Expenditure (9+13) (Excl. prl.
Repayment)125654.63 105455.17 3.20 -16.08
17 Revenue Expenditure (10+14) 110374.49 98308.63 7.47 -10.93
18 Capital Expenditure (12+15) 15280.14 7146.54 -19.84 -53.23
19 Revenue Deficit/Surplus (1-17) 344.35 -14242.58 -69.47 -4236.08
20 Fiscal Deficit/Surplus {(1+5+6)-16} -18050.05 -20320.11 3.10 12.58
21 Primary Deficit/Surplus (20-11a) -5139.41 -10643.88 -12.09 107.10
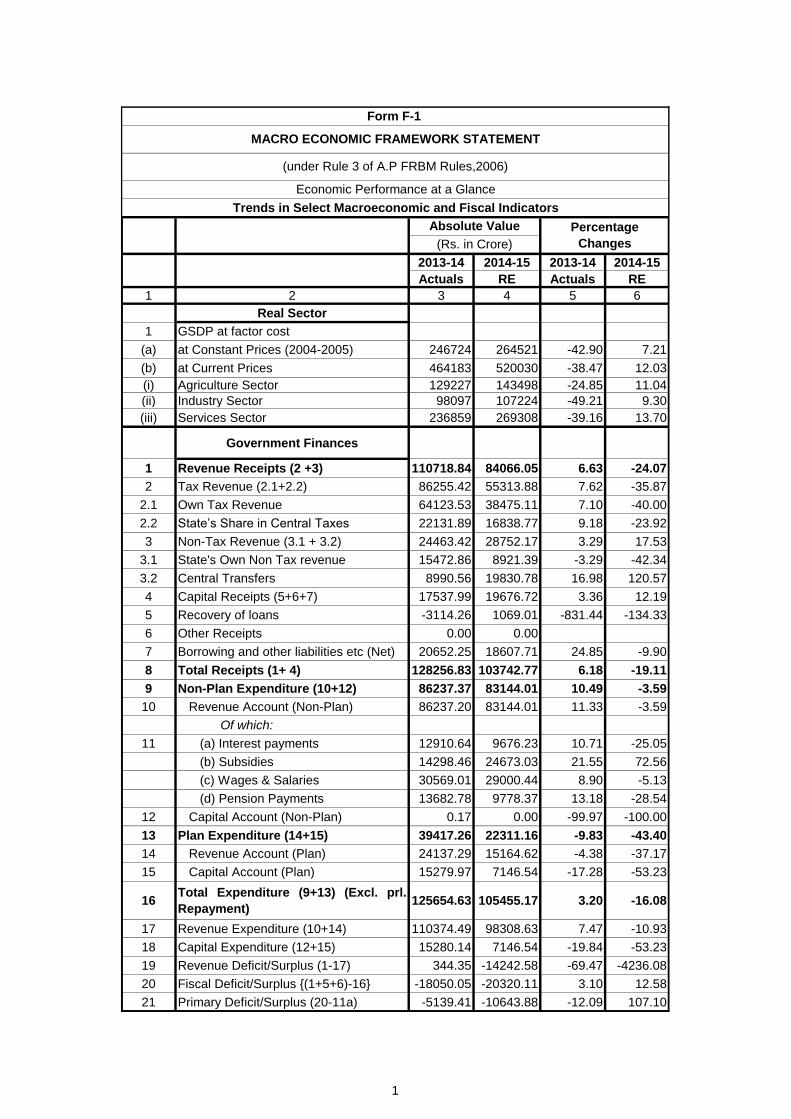
Form F-1
MACRO ECONOMIC FRAMEWORK STATEMENT
Economic Performance at a Glance
Trends in Select Macroeconomic and Fiscal Indicators
(under Rule 3 of A.P FRBM Rules,2006)
Percentage
Changes
Absolute Value
(Rs. in Crore)
1

2
MACRO – ECONOMIC FRAMEWORK STATEMENT
The macro economic framework statement is mandatory under section 5 and 6 of the Andhra Pradesh Fiscal Responsibility and Budget Management (APFRBM) Act – 2005. It requires the state Government to present an overview of the economy along with the analysis of growth and the sectoral composition of GSDP and an assessment of state government finances and future prospects to the State Legislature.
Overview of the economy: The state economy grew at an average rate of 7.02% from 2004-05 to 2014-15(AE) at constant (2004-05) prices.
The GSDP at Constant (2004-05) Prices for the year 2014-15(AE) is estimated at Rs.264521crores as against Rs. 246724 crores for 2013-14 (FRE) reflecting a growth of 7.21 %.
GROSS STATE DOMESTIC PRODUCT(GSDP) OF ANDHRA PRADESH - ADVANCE ESTIMATES - 2014-15
(Rs. in Crores)
SECTOR 2011-12 (TRE)
2012-13 (SRE)
2013-14 (FRE)
2014-15 (A.E)
CURRENT PRICES
Agriculture Value 95254 114013 129227 143498
Growth Rate 8.53 19.69 13.34 11.04
Industry Value 90481 92508 98097 107224
Growth Rate 20.92 2.24 6.04 9.30
Services Value 176510 203547 236859 269307
Growth Rate 12.23 15.32 16.37 13.70
GSDP Value 362245 410068 464183 520030
Growth Rate 13.25 13.20 13.20 12.03
Per Capita Income
Value 64773 72301 81397 90517
Growth Rate 10.28 11.62 12.58 11.21
CONSTANT PRICES (2004-05)
Agriculture Value 51624 55473 59879 63414
Growth Rate 3.21 7.46 7.94 5.90
Industry Value 50911 48690 49187 51771
Growth Rate 12.94 -4.36 1.02 5.25
Services Value 118750 126077 137658 149336
Growth Rate 4.93 6.17 9.19 8.48
GSDP Value 221285 230240 246724 264521
Growth Rate 6.25 4.05 7.16 7.21
Per Capita Income
Value 38556 39645 42170 44831
Growth Rate 2.25 2.82 6.37 6.31
3
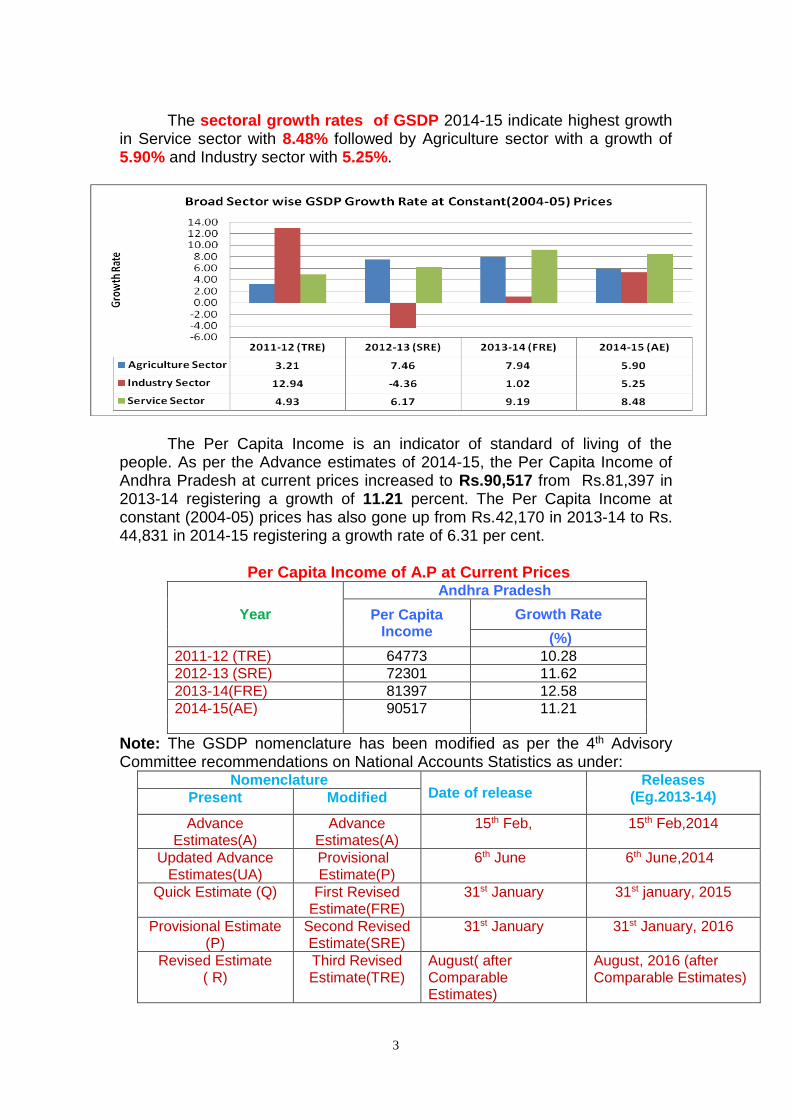
The sectoral growth rates of GSDP 2014-15 indicate highest growth
in Service sector with 8.48% followed by Agriculture sector with a growth of 5.90% and Industry sector with 5.25%.
The Per Capita Income is an indicator of standard of living of the
people. As per the Advance estimates of 2014-15, the Per Capita Income of Andhra Pradesh at current prices increased to Rs.90,517 from Rs.81,397 in 2013-14 registering a growth of 11.21 percent. The Per Capita Income at constant (2004-05) prices has also gone up from Rs.42,170 in 2013-14 to Rs. 44,831 in 2014-15 registering a growth rate of 6.31 per cent.
Per Capita Income of A.P at Current Prices
Year
Andhra Pradesh
Per Capita Income
Growth Rate
(%)
2011-12 (TRE) 64773 10.28
2012-13 (SRE) 72301 11.62
2013-14(FRE) 81397 12.58
2014-15(AE) 90517 11.21
Note: The GSDP nomenclature has been modified as per the 4th Advisory Committee recommendations on National Accounts Statistics as under:
Nomenclature Date of release
Releases (Eg.2013-14) Present Modified
Advance Estimates(A)
Advance Estimates(A)
15th Feb, 15th Feb,2014
Updated Advance Estimates(UA)
Provisional Estimate(P)
6th June 6th June,2014
Quick Estimate (Q) First Revised Estimate(FRE)
31st January 31st january, 2015
Provisional Estimate (P)
Second Revised Estimate(SRE)
31st January 31st January, 2016
Revised Estimate ( R)
Third Revised Estimate(TRE)
August( after Comparable Estimates)
August, 2016 (after Comparable Estimates)
(in percentages)
2016-17 2017-18
1
Revenue Deficit/Surplus as
percentage of Total Revenue
Receipts (TRR)
0.31 -6.59 -16.94 -8.10 -9.00 -7.36
2 Target -3.00 -3.00 -3.00 -3.00 -3.00 -3.00
Achievem
ent-2.11 -2.30 -3.88 -3.00
3 Target 28.20 27.60 27.60 24.33 24.74 25.09
Achievem
ent20.09 21.13 24.70 25.05
4 [Any additional target(s)] Nil Nil Nil Nil
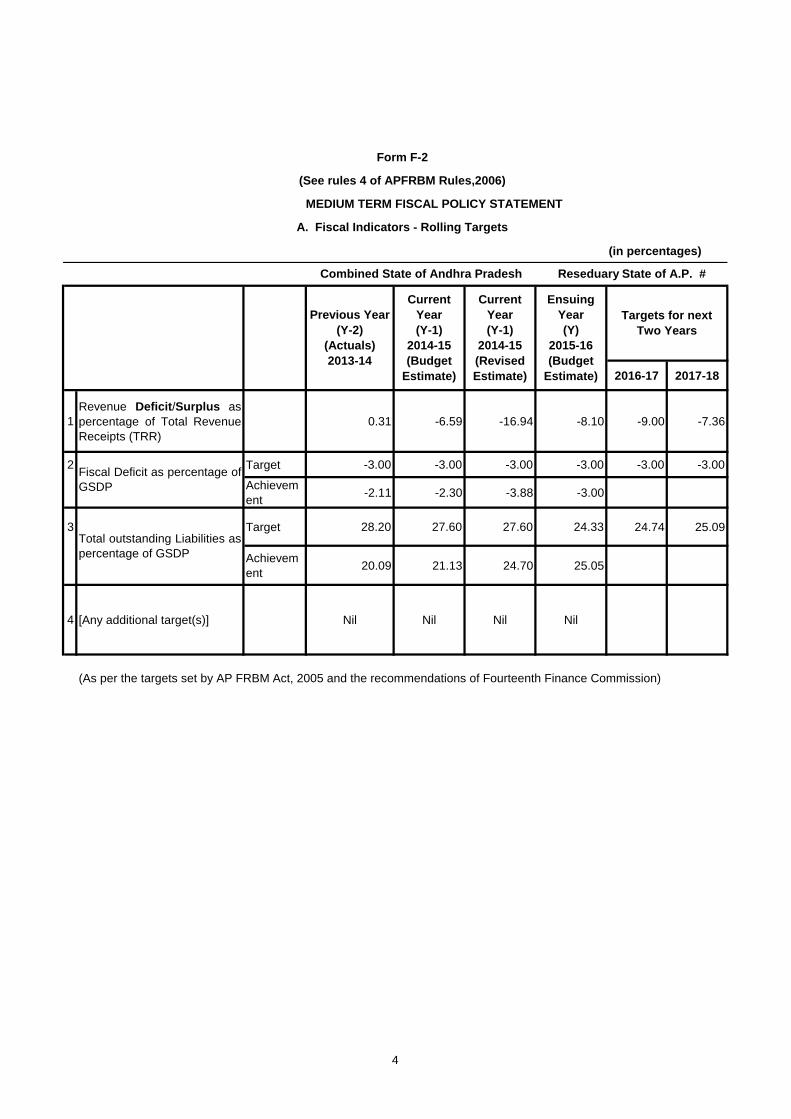
(As per the targets set by AP FRBM Act, 2005 and the recommendations of Fourteenth Finance Commission)
Combined State of Andhra Pradesh Reseduary State of A.P. #
Form F-2
(See rules 4 of APFRBM Rules,2006)
MEDIUM TERM FISCAL POLICY STATEMENT
A. Fiscal Indicators - Rolling Targets
Fiscal Deficit as percentage of
GSDP
Total outstanding Liabilities as
percentage of GSDP
Targets for next
Two Years
Previous Year
(Y-2)
(Actuals)
2013-14
Current
Year
(Y-1)
2014-15
(Budget
Estimate)
Current
Year
(Y-1)
2014-15
(Revised
Estimate)
Ensuing
Year
(Y)
2015-16
(Budget
Estimate)
4

5
FORM - F 3
FISCAL POLICY STRATEGY STATEMENT (under Rule 6 of APFRBM Rules 2006)
The State’s Fiscal Policy Strategy statement set out below is mandated under section 5 and 6 of the Fiscal Responsibility and Budget Management (FRBM) Act, 2005 to be laid before the Legislature. The Strategy Statement shall include a policy overview and the outlook for the ensuing year on taxation, expenditure, borrowings, sinking and contingency fund. As mandated in the above Act, the State Government had to eliminate Revenue Deficit by 31st March, 2009 by reducing 0.32 percentage points in GSDP every year. At the same time fiscal deficit had to be brought down to 3% of GSDP by reducing 0.25 percent points every year. The State Government maintained revenue surplus every year. As recommended by the 13th Finance Commission the State Government has restricted Fiscal Deficit below 3% i.e. at 2.11% of GSDP for the year 2013-14 and the fiscal deficit would be 3.88% of GSDP for the year 2014-15 (RE). In the present bifurcation scenario, it is not possible to adhere the conditionalties prescribed in the APFRBM Act, 2005 and the State Government also pursuing with Government of India for relaxation of FRBM targets. The State Fiscal Policy strategy is to control revenue expenditure by cutting administrative costs with the use of available modern technology on the one hand and mobilize enough resources by improving tax administration on the other hand, so as to enhance investment in productive capital assets and social sectors in order to attain sustainable and equitable economic growth. Tax Revenue: The desirable path to fiscal correction lies through financial empowerment i.e., by expanding the scope and size of revenue flows into the budget. Our strategy for revenue augmentation is by improvement of tax administration, facilitation of revenue buoyancy, minimizing of transaction costs and rationalization of tax structure. Hence, the focus is on streamlining and strengthening existing tax and non-tax collection, mechanism and plugging of revenue leakages. Thus, our endeavor is to optimize revenue collection without imposing additional taxes. According to Accounts 2013-14, the State’s own tax revenue was Rs.64,123 crore and as per 2014-15 (RE) it was Rs.38,475 crore. In the context of State reorganization and taking into account average growth rate in tax collection in residuary state of Andhra Pradesh a moderate average growth of 15% is estimated in tax collection and the Tax Revenue in B.E. 2015-16 is estimated at Rs.44,423 crore.

6
COMMERCIAL TAXES DEPARTMENT
The Commercial Taxes Department contributes approximately 65% of the total revenue of the State. The APVAT Act and Central Sales Tax (CST) Act are the two main sources of Revenue. The Revenue realised during the year 2013-14 was Rs.50,542.15 Crores in the combined state of A.P.. The Revenue realized during the year 2014-15 upto January, 2015 is Rs.21,287.12 Crores. The total revenue achievement under VAT, CST and other taxes such as Entertainment Tax, Profession Tax, Luxury Tax, Entry Tax, RD Cess etc. is Rs.21,287.12 Crores during the year 2014-15 upto January, 2015, which constitutes 86.88% of proportionate target with a growth rate of 12.01%. Increase in Rates of Taxes A Tax at the rate of Rs.4/- per liter has been levied on sale of petrol by Oil Marketing Companies in addition to the existing tax rate of 31% on sale value of Petrol. A similar tax at the rate of Rs.4/- per liter has been levied on sale of Diesel by Oil Marketing Companies in addition to the existing tax rate of 22.25% on sale value of Diesel is also levied. These changes are effected vide G.o. Ms.No.27 Rev.(CT-II) Dept., dated 05.02.2015. Reduction in Rates of Taxes. The rate of tax / VAT on Aviation Turbine Fuel was reduced from 16%, to 1% vide G.O. Ms.No.319 Rev. (CT-II) Dept., dated 18.09.2014. Exemption under VAT were given in respect of:
1. APSRTC was exempted from payment of Entry Tax on the buses transfer to the successor state of A.P. by APSRTC after reorganization of the State vide G.O. Ms.No.347 Rev.(CT-II) Dept. dated 17.10.2014.
2. Exemption from payment of Entry Tax was accorded to the ISUZU pickup Trucks (5 nos.) called “D-Max”vehicles of M/s. ISUZU Motors India Pvt. Ltd., Chennai intended for donation to the Govt. of A.P. to help in the rehabilitation work in cyclone effected Visakhapatnam, Vide G.O. ms.No.20. Re. (CT-II) Dept., dated 03.02.2015.
Major Government Orders issued in the Year 2014-15
1. Considering the request of the representatives from Trade and Industry in the Cyclone effected districts of Srikakulam, Vizianagaram and Visakhapatnam in the light of unprecedented havoc and disruption of normal life caused by the Hudhud Cyclone in the above effected districts, time was granted till 30.11.2014 to the dealers in those 3 districts for filing returns and payment of taxes due in the month of October, 2014 under the APVAT and CST Acts without levy penalty and interest vide G.O. Rt No.959, Rev.(CT-II) Dept., dated 01.11.2014.

7
2. The Government issued G.O. Ms.No.248, dt. 30.05.2014 an introduced Sub-rule 1-A making June, 2nd 2014 as the effective date of registration (EDR) for all the registrations obtained during the month of June, 2014. Similarly two provisions were introduced after Sub-rule 1 of Rule 23 redefining the tax period of May 2014 as the period from 01.05.2014 to 01.06.2014. Similarly the proviso after sub-rule 2 was modified for non VAT dealers also.
3. The Government issued G.O. Ms.No.26, dt. 05.02.2015 amending Rule 23 in order to facilitate filing of annexures to VAT 200 returns. Similarly Rule 55 was amended facilitating issuance of electronically generated way bills to the dealers. In the same G.O. rule 55 was amended in order to facilitate registration of transporters so that they can generate Form 650 electronically through the official website of Commercial Taxes Department of A.P. The Transporter will file this information at the border check post.
STAMPS AND REGISTRATION DEPARTMENT: The Revenue from Stamp duty and Registration Charges contributes nearly 0.377% to the GSDP of the State. There has been a change in the Tax Structures in the year 2014-2015. The Revenue achievement during the 2014-2015 (provisional) was Rs.2672.40 Crores as against the receipts of Rs.1795.81 Crores in 2013-2014. A Positive growth of 48.81% recorded during 2014-2015 which contributes much Revenues to the State exchequer and efforts are being made for achievement of assigned targets for the current financial year. Revision of Stamp duty and Registration Fees (During Financial Year 2014-2015). Stamp duties on sales / partitions / Gift / Settlements were increased on par with other states like Maharastra and Punjab and Registration Fees also increased from 0.5% to 1% on Sales. Major Government Orders issued during Financial year 2014-2015.
Type of Document
Stamp Duty Government Order No. and Date
Sale 5% G.O. Ms.No.394 dt. 26-11-2014
Gift 2% (As defined u/s 56(2) of IT Act 1961 and Govt. / Local Bodies / UDAs) 5% in other cases
G.O. Ms.No.395 dt. 26-11-2014
Settlement 2% in favour of Family Members 3% in other cases
G.O. Ms.No.395 dt. 26-11-2014
Partition Deed 1% in favour of Family Members 2% in other cases
G.O. Ms.No.395 dt. 26-11-2014
Sale 1% G.O. Ms.No.393 dt. 26-11-2014
8
PROHIBITION AND EXCISE DEPARTMENT The States can regulate trade in potable alcohol vide constitutional provisions found in entry 51 list II of the 7the schedule. Revenue from the sale of liquor is a principal source. In the State of Andhra Pradesh, this activity is governed by the A.P. Excise Act 1968. It was in the year 1994, that Government decided that cheaply available country liquor i.e. Arrack should be banned so that the poorer classes of the society should not fall a prey to alcohol. Since then clean potable IMFL made from ENA is made available through Andhra Pradesh Beverages Corporation, a wholly owned A.P. Government company. (3926) A4 shops are established for the license period 2014-15 against (4380) shops notified and about (770) Restaurant and Bars licensed to sell Liquor in the State. There is no change in the number of A4 shops notified for the last (7) years. While the privilege to sell by shop is given by way of drawl of lots for a period of (1) year, the Privilege to sell by bar is renewed for the year 2014-15. Manufacture of Spirit, IMFL (Spirits), Beer and Wine is governed by the A.P. Distillery, Brewery, Winery Rules 2006. The VAT on liquor was transferred from Excise head to Sales Tax from 2012-13 onwards. TRANSPORT DEPARTMENT The Government collects taxes from motor vehicles under the provisions of Andhra Pradesh Motor Vehicles Taxation Act, 1963 and fees under Motor Vehicles Act, 1988 and Andhra Pradesh Motor Vehicles Rules, 1989 and notifications issued there under. For the year 2013-14 an amount of Rs.1517.83 Crores is collected in the residuary State of Andhra Pradesh. The Government has further collected an amount of Rs.1520.27 Crores upto January, 2015 in the current year with a growth rate of 17.19% over the corresponding period of previous year. Non-Tax Revenue: The State’s own Non-tax Revenue is estimated at Rs.8,921 crores in R.E 2014-15 which includes the revenue from mines & minerals at Rs.1,137 crores, interest receipts at Rs.183 crores and Rural Development cess at Rs.522 crores. State’s own Non-tax Revenue is estimated at Rs.5,341 crores in B.E. 2015-16 which includes Rs.1,359 crores under mines & minerals Rs.590 crores under Rural Development cess and also Rs.183 crores towards interest receipts. Government have dispensed charging contra interest on cumulative Capital Outlay on Irrigation/Power Projects.

9
The State Government is very keen to improve non tax revenues and finding out all possible ways to optimize. As a first step in this regard, Government has announced a new sand mining policy, the monitoring of sand quarry has been entrusted to DWACRA groups. Expenditure strategy: The strategy of Government’s expenditure management is to redirect Government expenditure away from less productive schemes towards investments in improvement of quality of life of people and strengthen their social and economic assets through improved health, education and other social services and to strengthen operation & maintenance expenditure to maintain productivity levels of existing public infrastructure. The policy emphasizes increased spending on social sectors, including rural employment, education and health. Thus the focus of the Government is to allow realistic increases in non-plan revenue expenditure and augment capital outlays. The Government strategy in revenue expenditure is to control non-development expenditure mostly administrative and debt services so as to enhance development expenditure on social sectors. Zero based Budgeting
6. Before coming up with the proposed budget for 2015-16, the Government have done an elaborate exercise and reviewed all the existing schemes with reference to their efficacy, relevance and the need for redesigning them to suit the changed times and aspirations of the people. The exercise was aimed at making the budget outcome based reflecting the needs and expected specific goals. A pre-budget workshop was held at Vijayawada on 7-1-2015 followed by detailed discussions with all line departments during February this year. As part of the discussions, critical review of all existing staff vacancies and an assessment of staff requirement for carrying out the programs was also taken up. This exercise has helped the budget to acquire the required sharpness, focus and relevance. The total increase in the size of the Budget from Rs.1,11,823 crores (B.E. 2014-15) to Rs.1,13,048 crores (BE 2015-16) is only 1.1%, the increase in Plan Budget from Rs.26,672 crores to Rs.34,412 crores which is 29.02 % and increase in capital budget from Rs.7,069 crores to Rs.9,818 crores which is 38.88% is a significant achievement. The Government taken all steps to bring down non-plan expenditure from Rs.85,151 crores to Rs.78,636 crores and non-plan Revenue expenditure from Rs.78,976 crore to Rs.73,223 crores. The Government gives utmost importance to expenditure in sectors which would create further assets.

10
Debt Management: Effective debt management is vital for fiscal management. A pro-active approach to debt management is essential for better budget formulation that is consistent with the medium term fiscal policy. The main objective of debt management in the State is to ensure the financing of the budget and refinancing of the debt is done at the lowest possible cost in medium- to long-term, consistent with a prudent degree of risk. Thus the strategy is geared to reduce not only the cost of funds borrowed, effectively, but also to reduce significantly the debt service costs over the medium term period. The debt, which stood at 29.55% of GSDP in 2004-05, declined to 20.09% in the year 2013-14. However, it is expected to rise to 24.70% in the year 2014-15 (RE) which is mainly due to bifurcation of state of Andhra Pradesh and the apportionment debt of combined state has yet to be finalized by the Government of India between the state of Telangana and Residuary state of Andhra Pradesh. Guarantees Assessment: The FRBM Act stipulates to limit the amount of annual incremental risk weighted guarantees to 90% of the Total Revenue Receipts (TRR) in the year preceding the current year. The guarantees registered for the years 2013-14 and 2014-15 (RE) to the TRR of the last preceding year is at 33.40% and 22.87% respectively.

1 Gross Fiscal Deficit as Percentage of GSDP -2.11 -3.88
2 Revenue Deficit/Surplus as Percentage of Gross Fiscal Deficit -1.91 70.09
3 Revenue Deficit/Surplus as Percentage of GSDP 0.04 -2.72
4 Revenue Deficit/Surplus as Percentage of TRR 0.31 -16.94
5 Total Liabilities -GSDP Ratio (%) 20.09 24.70
6 Total Liabilities - Total Revenue Receipts (%) 154.94 153.77
7 Total Liabilities –State’s Own Revenue Receipts (%) 215.52 272.73
8 State’s Own Revenue Receipts to Revenue Expenditure (%) 72.11 48.21
9 Capital Outlay as Percentage of Gross Fiscal Deficit -105.09 -39.37
10 Interest Payment as Percentage of Revenue Receipts 11.66 11.51
11 Salary Expenditure as Percentage of Revenue Receipts 29.22 34.50
12 Pension Expenditure as Percentage of Revenue Receipts 12.36 11.63
13
Non-developmental RevenueExpenditure as Percentage of aggregate
disbursements(TRE) 34.73 31.00
14
Gross Transfers from the Centre as Percentage of Aggregate
Disbursements(TRE) 28.20 37.30
15 Non-tax Revenue as Percentage of TRR 13.97 10.61
Item2013-14
(Actuals) %
FORM D-1
[See rule 6 of APFRBM Rules, 2006]
SELECT FISCAL INDICATORS
2014-15
(R.E) %
11
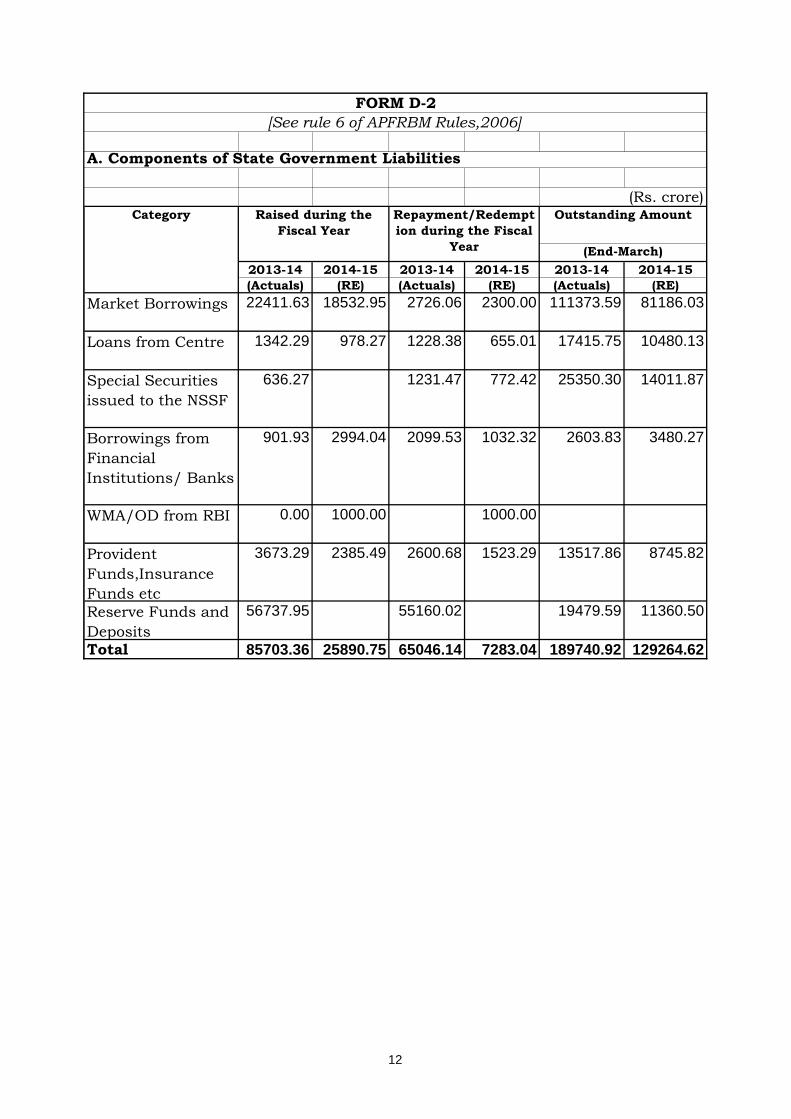
(Rs. crore)
2013-14 2014-15 2013-14 2014-15 2013-14 2014-15
(Actuals) (RE) (Actuals) (RE) (Actuals) (RE)
Market Borrowings 22411.63 18532.95 2726.06 2300.00 111373.59 81186.03
Loans from Centre 1342.29 978.27 1228.38 655.01 17415.75 10480.13
Special Securities
issued to the NSSF
636.27 1231.47 772.42 25350.30 14011.87
Borrowings from
Financial
Institutions/ Banks
901.93 2994.04 2099.53 1032.32 2603.83 3480.27
WMA/OD from RBI 0.00 1000.00 1000.00
Provident
Funds,Insurance
Funds etc
3673.29 2385.49 2600.68 1523.29 13517.86 8745.82
Reserve Funds and
Deposits
56737.95 55160.02 19479.59 11360.50
Total 85703.36 25890.75 65046.14 7283.04 189740.92 129264.62
FORM D-2
[See rule 6 of APFRBM Rules,2006]
A. Components of State Government Liabilities
Category Raised during the
Fiscal Year
Repayment/Redempt
ion during the Fiscal
Year
Outstanding Amount
(End-March)
12
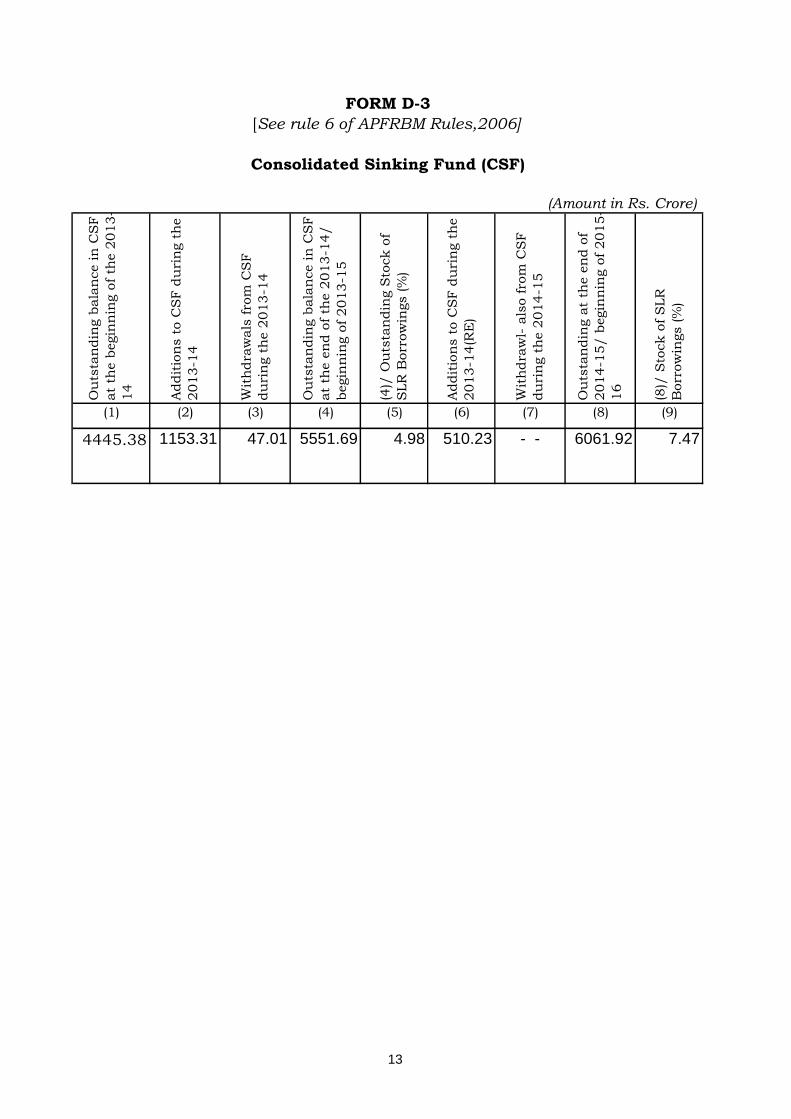
(Amount in Rs. Crore)
(1) (2) (3) (4) (5) (6) (7) (8) (9)
4445.38 1153.31 47.01 5551.69 4.98 510.23 - - 6061.92 7.47
Ou
tsta
ndin
g b
ala
nce in
CS
F
at
the b
egin
nin
g o
f th
e 2
013-
14
Addit
ion
s t
o C
SF
du
rin
g t
he
2013-1
4
Wit
hdra
wals
fro
m C
SF
du
rin
g t
he 2
013-1
4
Ou
tsta
ndin
g b
ala
nce in
CS
F
at
the e
nd o
f th
e 2
013-1
4/
begin
nin
g o
f 2013-1
5
FORM D-3
[See rule 6 of APFRBM Rules,2006]
Consolidated Sinking Fund (CSF)
(4)/
Ou
tsta
ndin
g S
tock o
f
SLR
Borr
ow
ings (%
)
Wit
hdra
wl-
als
o f
rom
CS
F
du
rin
g t
he 2
014-1
5
(8)/
Sto
ck o
f S
LR
Borr
ow
ings (%
)
Addit
ion
s t
o C
SF
du
rin
g t
he
2013-1
4(R
E)
Ou
tsta
ndin
g a
t th
e e
nd o
f
2014-1
5/ b
egin
nin
g o
f 2015-
16
13
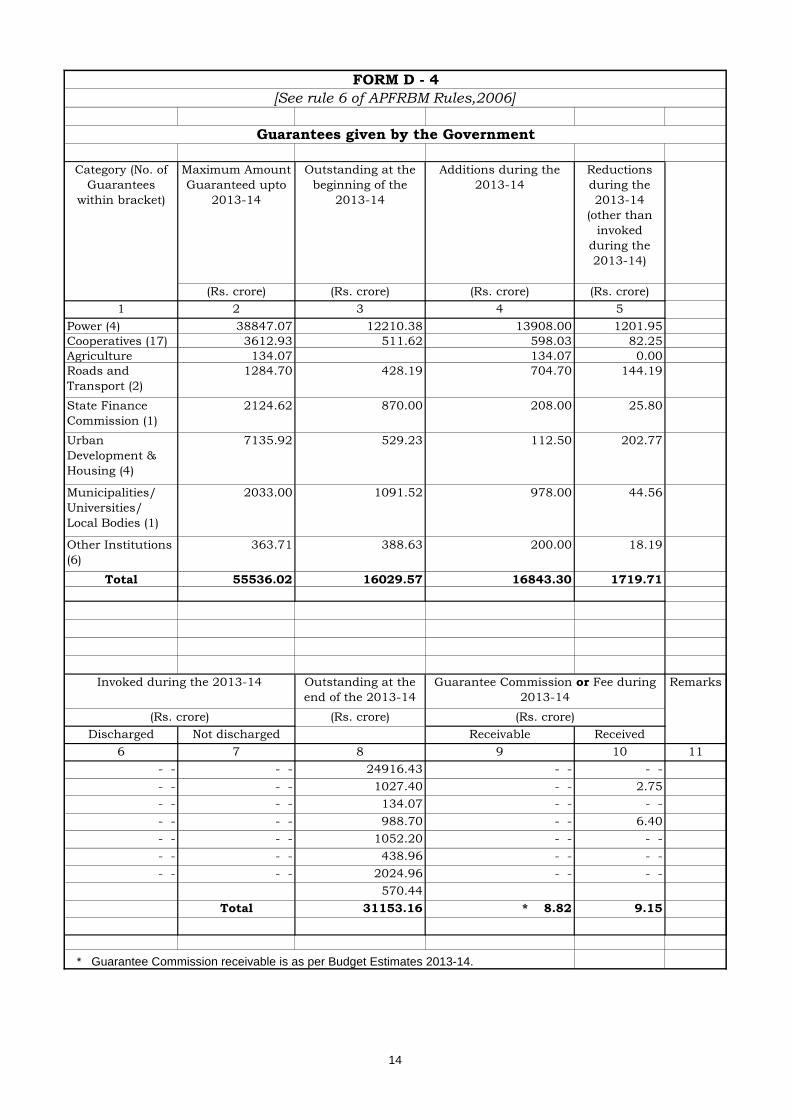
Maximum Amount
Guaranteed upto
2013-14
Outstanding at the
beginning of the
2013-14
Additions during the
2013-14
Reductions
during the
2013-14
(other than
invoked
during the
2013-14)
(Rs. crore) (Rs. crore) (Rs. crore) (Rs. crore)
1 2 3 4 5
Power (4) 38847.07 12210.38 13908.00 1201.95
Cooperatives (17) 3612.93 511.62 598.03 82.25
Agriculture 134.07 134.07 0.00
Roads and
Transport (2)
1284.70 428.19 704.70 144.19
State Finance
Commission (1)
2124.62 870.00 208.00 25.80
Urban
Development &
Housing (4)
7135.92 529.23 112.50 202.77
Municipalities/
Universities/
Local Bodies (1)
2033.00 1091.52 978.00 44.56
Other Institutions
(6)
363.71 388.63 200.00 18.19
Total 55536.02 16029.57 16843.30 1719.71
Outstanding at the
end of the 2013-14
(Rs. crore)
Discharged Not discharged Receivable Received
6 7 8 9 10 11
- - - - 24916.43 - - - -
- - - - 1027.40 - - 2.75
- - - - 134.07 - - - -
- - - - 988.70 - - 6.40
- - - - 1052.20 - - - -
- - - - 438.96 - - - -
- - - - 2024.96 - - - -
570.44
Total 31153.16 * 8.82 9.15
* Guarantee Commission receivable is as per Budget Estimates 2013-14.
Guarantee Commission or Fee during
2013-14
(Rs. crore)
FORM D - 4
[See rule 6 of APFRBM Rules,2006]
Guarantees given by the Government
RemarksInvoked during the 2013-14
(Rs. crore)
Category (No. of
Guarantees
within bracket)
14

(Amount in Rs. Crores)Risk weights
2013-14 2014-15 2013-14 2014-15
Direct
Liabilities
100
16836.00 7482.97 16836.00 7482.97
High Risk 75
Medium Risk 50
Low Risk 25
Very Low Risk 5
14317.46 6366.85 14317.46 6366.85
Total
Outstanding 31153.46 13849.82 31153.46 13849.82
Risk weighted outstanding
Guarantee in the Previous
Year and the Current Year
FORM D-5
[See rule 6 of APFRBM Rules,2006]
Outstanding Risk –weighted Guarantees
Default
Probability
Amount outstanding as in the
Previous Year and the Current
Year
15

(Amount in Rs. Crore)Amount of
Guarantees
Likely to be Invoked
during the 2014-15
(1) (2) (3) (4) (5) (6)
FORM D-6
[See rule 6 of APFRBM Rules,2006]
Guarantee Redemption Fund (GRF)
Outstanding
Amount in GRF
at the end of the
2014-15
- - 856.95
Outstanding
invoked
guarantees at the
end of the 2013-
14
Outstanding
Amount in GRF
at the end of the
2013-14
Addition to
GRF during
the 2014-15
Withdrawal
from the GRF
during the
2014-15
- - 849.41 - - 7.54
16
17
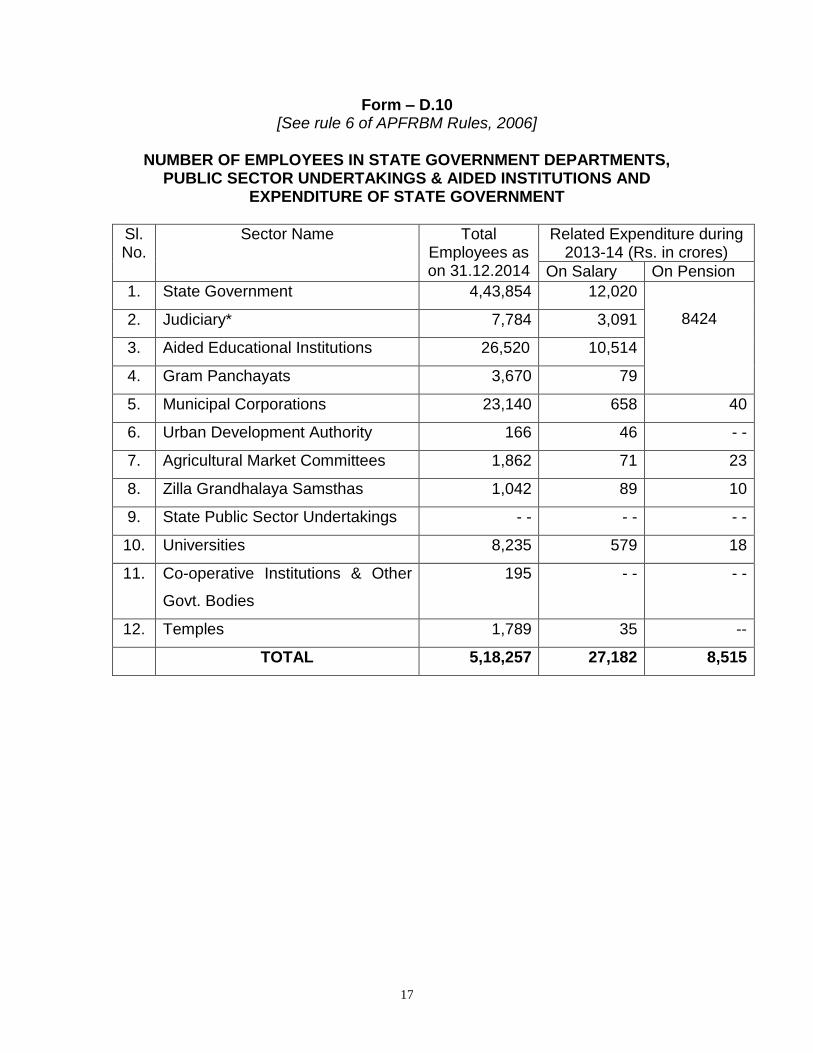
Form – D.10 [See rule 6 of APFRBM Rules, 2006]
NUMBER OF EMPLOYEES IN STATE GOVERNMENT DEPARTMENTS,
PUBLIC SECTOR UNDERTAKINGS & AIDED INSTITUTIONS AND EXPENDITURE OF STATE GOVERNMENT
Sl. No.
Sector Name Total Employees as on 31.12.2014
Related Expenditure during 2013-14 (Rs. in crores)
On Salary On Pension
1. State Government 4,43,854 12,020
8424 2. Judiciary* 7,784 3,091
3. Aided Educational Institutions 26,520 10,514
4. Gram Panchayats 3,670 79
5. Municipal Corporations 23,140 658 40
6. Urban Development Authority 166 46 - -
7. Agricultural Market Committees 1,862 71 23
8. Zilla Grandhalaya Samsthas 1,042 89 10
9. State Public Sector Undertakings - - - - - -
10. Universities 8,235 579 18
11. Co-operative Institutions & Other
Govt. Bodies
195 - - - -
12. Temples 1,789 35 --
TOTAL 5,18,257 27,182 8,515