centre for budget and governance accountability€¦ · conclusion 18 9. appendix 19. 1 ... (frbm)...
TRANSCRIPT

Centre for Budget and Governance AccountabilityCentre for Budget and Governance AccountabilityCentre for Budget and Governance AccountabilityCentre for Budget and Governance AccountabilityCentre for Budget and Governance Accountability(A programme of NCAS)
Response to Union Budget 2005-06
State Intervention in Favour of the Poor:Decisive or Disappointing?

Report Prepared By
CBGA RESEARCH TEAM
Nandan JhaRamanand Ram
Siba Sankar MohantySubrat Das
Vineet Kohli
EDITORIAL ASSISTANCE
Subrat Das
EDITORIAL INPUTS
Praveen JhaAmitabh Behar
ADVOCACY & MEDIA
Deepak L. XavierAnurag Srivastava
Shivani Sen
CIRCULATION
Shallu AngraKhwaja Mobin-Ur-Rehman
DESIGN & PRINTING
Kriti Creative Studio
Cell : 9810314474
PUBLISHED BY
Centre for Budget and Governance Accountability
(A programme of NCAS)
B 64, Second Floor, Sarvodaya Enclave,
New Delhi – 110 017, India
Tel: 91-11-26537603
Email: [email protected]
(for private circulation only)
© CBGA, 2005
The contents of this report may be reproduced by voluntary organisations, social action groups,people’s organisations, public interest professionals and citizens for non-commercial purposes with
due acknowledgement of the source. Any other form of reproduction, storage in retrieval systemor transmission by any means requires prior permission from the publisher.
34
PREFACE
Centre for Budget and Governance Accountability (CBGA) is a Delhi based programme of the
National Centre for Advocacy Studies (NCAS). CBGA is an attempt to promote transparent,
accountable and participatory governance, and a people-centred perspective in preparation and
implementation of budgets. Over the last three years, CBGA has been responding to the Union
Budget, throwing light on the priorities and policies driving the budgetary allocations and discussing
their implications for the poor and marginalised sections of the population.
The verdict of the people of India in the General Elections of 2004 was not only a mandate for
protecting the hard earned democratic space for different sections of our society, but was also a
clear mandate against the anti people economic policies pursued by the previous NDA government
in the guise of economic reforms. The aspirations of common people increased with the
announcement of the National Common Minimum Programme of the UPA Government. However,
many of the promises made in the NCMP remained unaddressed in the first budget placed by the
Finance Minister Mr. P. Chidambaram in July last year. Now that the Government has presented the
Union Budget for 2005-06, its first budget for a full financial year, it is extremely important to
make an informed assessment of the policy priorities driving this budget and the implications of
the budgetary proposals from the perspective of the poor and marginalised people.
While many observers, political parties and sections of the media respond to the budget solely on
the basis of the Budget Speech of the Finance Minister, in our understanding a proper assessment
of the budget requires an in-depth analysis of the various allocations and policy pronouncements.
This what our response to the Union Budget attempts to do. It focuses on allocations and proposals
relating to Agriculture, Rural Employment Generation and Poverty Alleviation, Education, Health,
Socially Marginalised Groups, Women and Children, and those relating to Resource Mobilisation.
We hope our endeavour towards demystifying the budget and informing various stakeholders about
its implications for the economically and socially vulnerable sections of the population will be
useful in seeking transparency in and accountability for governance, especially in the domain of
budgets.
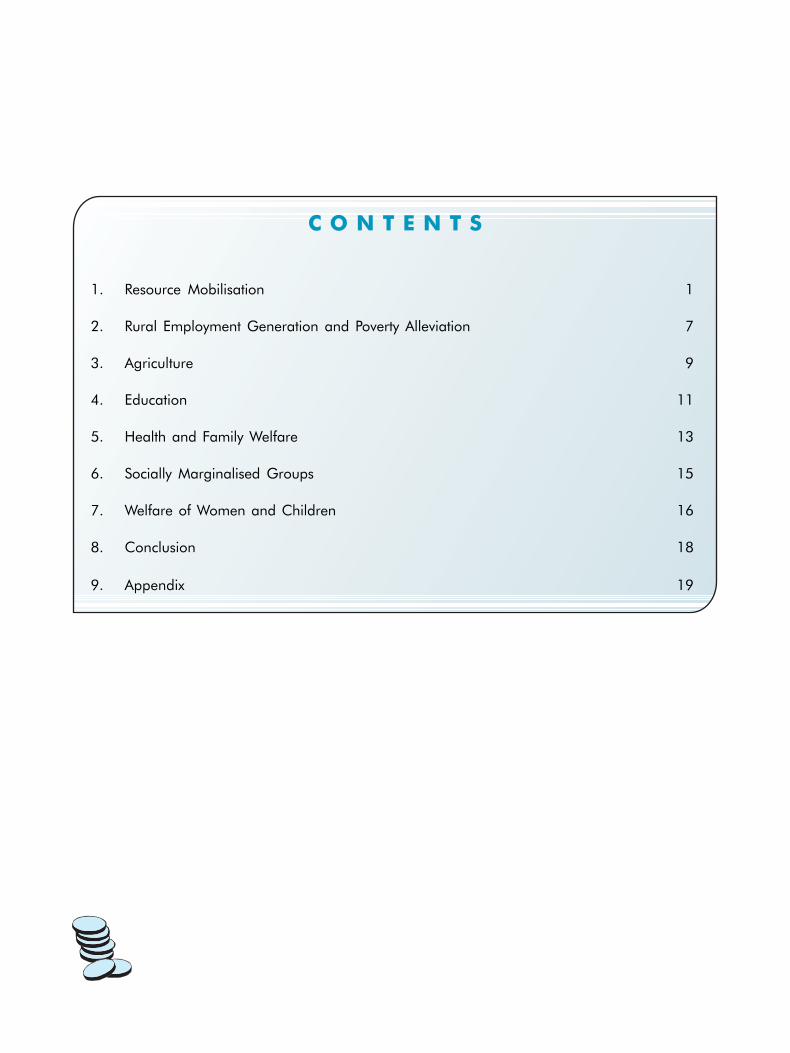
C O N T E N T S
1. Resource Mobilisation 1
2. Rural Employment Generation and Poverty Alleviation 7
3. Agriculture 9
4. Education 11
5. Health and Family Welfare 13
6. Socially Marginalised Groups 15
7. Welfare of Women and Children 16
8. Conclusion 18
9. Appendix 19
1
RESPONSE TO UNION BUDGET 2005-06
State Intervention in Favour of the Poor: Decisive or Disappointing?
Union Budget for 2005-06, UPA Government’s first Budget for a full year, has drawn significant attention
from many quarters. While people with stakes in the stock markets, financial services sector and
certain sections of the industry have been waiting to see the extent to which Mr. P. Chidambaram
gives a push to economic reforms in the Budget, a majority including political parties, civil society
organizations, grassroots activists, academicians and above all, common people, have been waiting
to witness the UPA Government fulfil its promises made in the National Common Minimum Programme
(NCMP). “The NCMP leans towards decisive intervention by the state in favour of the poor,” said the
Finance Minister in his Budget speech. In order to find out whether state intervention in favour of the
poor, as envisaged in this Budget, is decisive or disappointing, one needs to read the fine print of the
Budget rather than judge the speech delivered by Mr. Chidambaram. This is what we attempt to do
in the following sections of this Response to the Union Budget 2005-06.
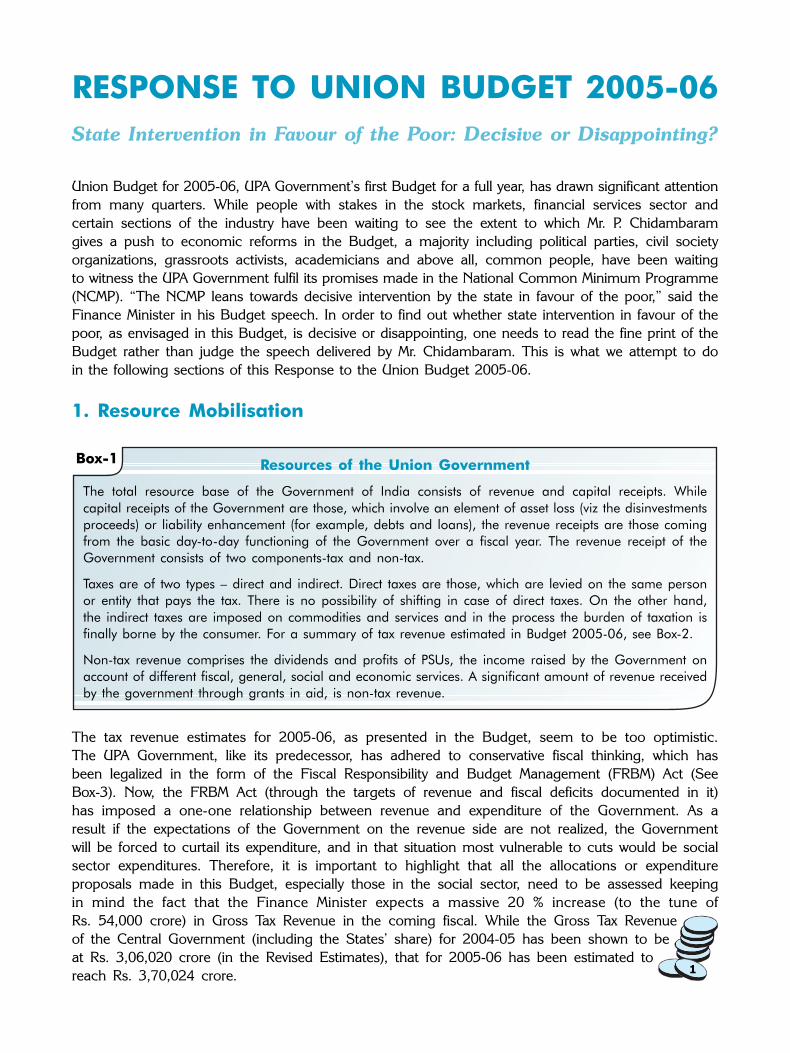
1. Resource Mobilisation
Box-1 Resources of the Union Government
The total resource base of the Government of India consists of revenue and capital receipts. While
capital receipts of the Government are those, which involve an element of asset loss (viz the disinvestments
proceeds) or liability enhancement (for example, debts and loans), the revenue receipts are those coming
from the basic day-to-day functioning of the Government over a fiscal year. The revenue receipt of the
Government consists of two components-tax and non-tax.
Taxes are of two types – direct and indirect. Direct taxes are those, which are levied on the same person
or entity that pays the tax. There is no possibility of shifting in case of direct taxes. On the other hand,
the indirect taxes are imposed on commodities and services and in the process the burden of taxation is
finally borne by the consumer. For a summary of tax revenue estimated in Budget 2005-06, see Box-2.
Non-tax revenue comprises the dividends and profits of PSUs, the income raised by the Government on
account of different fiscal, general, social and economic services. A significant amount of revenue received
by the government through grants in aid, is non-tax revenue.
The tax revenue estimates for 2005-06, as presented in the Budget, seem to be too optimistic.
The UPA Government, like its predecessor, has adhered to conservative fiscal thinking, which has
been legalized in the form of the Fiscal Responsibility and Budget Management (FRBM) Act (See
Box-3). Now, the FRBM Act (through the targets of revenue and fiscal deficits documented in it)
has imposed a one-one relationship between revenue and expenditure of the Government. As a
result if the expectations of the Government on the revenue side are not realized, the Government
will be forced to curtail its expenditure, and in that situation most vulnerable to cuts would be social
sector expenditures. Therefore, it is important to highlight that all the allocations or expenditure
proposals made in this Budget, especially those in the social sector, need to be assessed keeping
in mind the fact that the Finance Minister expects a massive 20 % increase (to the tune of
Rs. 54,000 crore) in Gross Tax Revenue in the coming fiscal. While the Gross Tax Revenue
of the Central Government (including the States’ share) for 2004-05 has been shown to be
at Rs. 3,06,020 crore (in the Revised Estimates), that for 2005-06 has been estimated to
reach Rs. 3,70,024 crore.

2
Tax Revenue in Union Budget 2005-06
Types of Taxes Budget Estimate 2005-06
(Rupees crore)
DIRECT TAXES(a) Taxes on Income and Expenditure
I t includes Corporat ion Taxes (0020), Income Tax (0021), 176812.00Hotel Receipts Tax (0023), Interest Tax (major head-0024)and others (0028)
(b) Taxes on Property & Capital TransactionsI t includes Estate Duty (0031), Taxes on Wealth (0032) 265.00and Gif t Tax (0033)
INDIRECT TAXES Taxes on Commodities and Services
It includes Customs (0037), Union Excise Duties (0038), Taxes on Sale, 192215.00Trade, etc. (0040), Service Tax (0044), Other Taxes (0045).
Taxes of Union Territories Without Legislature 732.52
Box-2
1.1 If the tax revenue estimates of Budget 2005-06 get realized, Direct Taxes collected by the Union
Government would stand at roughly 5 % of the estimated GDP1 , up from 4.3 % of GDP in 2004-
05 (see Table 1.1 in the Appendix). As regards the gross Indirect Taxes collected by the Union
Government (including the States’ share), while the Revised Estimates (RE) for 2004-05 put the
1 Gross Domestic Product (GDP): Gross Domestic Product is defined as the market value of all final goods and
services produced by the factors of production located in the country during a period of one financial year. It can be
measured by taking into account all final expenditures in the economy. The formula for calculating GDP is Y = C + I +
G + (X –M): Where, Y is the GDP, C is the private consumption expenditure, I is the investment expenditure, G is
government purchase of goods and services, X is the value of exports and M is the value of imports. The figure
we arrive at by applying the formula is called the GDP at market prices. If we deduct the net indirect taxes
from the above figure, we get GDP at factor cost. GDP is commonly used as an indicator of a nation’s
growth, though there are serious limitations in using GDP as an indicator of growth.

3
amount at roughly 5.5 % of GDP, the Budget Estimates (BE) for 2005-06 put the same at 5.4 %
of the estimated GDP. The increasing proportion of direct taxes in total tax revenue of the
Government marks a gradual improvement towards a more progressive tax regime in the country.
1.2 Introduction of Fringe Benefits Tax2 in this Budget is a positive development. Similarly, the
proposal to levy a 2 % duty on branded jewellery and 8 % duty on mosaic tiles mark some of
the welcome indirect tax proposals of the Budget. Also, the proposed setting up of Large
Taxpayer Units (LTUs)3 in major cities and Help Centres for smaller taxpayers can be expected
to prove effective in facilitating greater tax collection by the Government.
However, on many counts the tax proposals of the Finance Minister leave us disappointed when
we take into account the acute need today for generating greater tax revenue from the affluent
sections of the population.
1.3 It is noteworthy that the Finance Minister had estimated for a Gross Tax Revenue of roughly Rs.
3,18,000 crore in BE of 2004-05, which has come down to Rs. 3,06,000 crore in RE. This
shortfall of Rs. 12,000 crore could further increase in the actual collections. For the coming
fiscal year, i.e., 2005-06, the Finance Minister expects the additional tax revenue of Rs. 54,000
crore to come mainly from two sources, which are a whopping 34 % increase in Corporation
Tax Revenue (i.e., from Rs. 83,000 crore in RE 2004-05 to Rs. 1,10,573 crore in BE 2005-06)
and a 21 % increase in the revenue from Union Excise Duties (i.e., from Rs. 1,00,720 crore in
RE 2004-05 to Rs. 1,21,533 crore in BE 2005-06). And, when we look at the figures of tax
collection in 2004-05 (i.e., BE and RE), it is these two taxes where the shortfall in revenue is
prominent. The Corporation Tax Revenue shows a shortfall (in comparison to the Budget
Estimate) of Rs. 5,000 crore and Union Excise Duties register a shortfall of Rs. 9,000 crore. It
seems highly improbable that the Government will be able to collect the significantly higher
amount of tax revenue in the coming fiscal, which it has projected.
1.4 Given the fact that Tax-GDP ratio of the Union Government, as per RE 2004-05 figures, is still
at 9.8 %, one of the lowest in the world, and income inequality in the country has aggravated
Fiscal Responsibility and Budget Management Act, 2003
The Fiscal Responsibility and Budget Management Act, 2003 is based on the presumption that the fiscal
deficit is the key parameter (adversely) affecting all other macroeconomic variables. The Act provides
that the Union Government shall specify the annual targets of reducing revenue and fiscal deficits and
shall keep the deficits under control. The proponents of this Act argue that large fiscal deficits may lead
to huge accumulation of public debt and shall induce inflationary pressures in the economy. However,
many development economists are of the view that if the fiscal deficit is dominantly in the form of
capital expenditure, it contributes to future growth and in fact can create so much demand in the
economy that private investment may crowd-in to supplement public investment. As long as there is an
excess capacity in the economy, the apprehension that deficits create inflationary pressure is illogical.
Box-3
2 Fringe Benefit Tax: The salary given to the employees of the corporate houses in India generally consists of twocomponents. First, the basic salary on which income tax is levied and collected. The second category is called fringebenefits, which includes the perks and other benefits, given to the employees over their main taxable income. In thepresent budget, the government has introduced a tax on these fringe benefits.3 Large Tax-payers’ Units (LTU): In the present budget, the Finance Minister has proposed to set up taxcollection units in places where large tax-payers reside or work. For example, in certain places like Juhu beachin Mumbai where most of the film stars reside (who come under large tax-payers’ category), the governmentwill set up units to simplify tax collection process and shall facilitate the process proactively so that thesetaxpayers need not trouble themselves in the cumbersome calculations and compliance processes.
4
over the last decade, the substantial relief in income taxes given to the salaried class, and
especially those who earn higher incomes, was not at all necessary. In fact, it has been argued
that the Finance Minister has provided more relief to those in the higher income bracket. While
people with an annual income of Rs. 1.5 lakh stand to gain a tax relief of Rs. 14,000, those
earning over Rs. 10 lakh in a year will benefit by Rs. 45,000 from the concessions. Thus,
among the salaried tax paying class, the proposals of this Budget will lead to a more regressive
tax structure.
1.5 The reduction in overall corporate income tax rates on domestic companies again disappoints
all those who have been arguing for the Government taxing the rich to a greater extent. In fact,
had the Government adopted a pro-poor approach, it would have raised personal income tax
rates for people earning higher incomes (say, more than Rs. 4 lakh per annum) to the earlier
existing level of corporate taxes, but the UPA Government has done just the opposite - it has
brought down corporate income tax rates.
1.6 In the domain of indirect taxes, the substantial exemptions in service taxes, reductions in customs
duties on capital goods imports, and the lowering of the peak rate of customs duties for non-
agricultural products could fail the attempt of the Finance Minister to generate greater tax
revenue in the coming fiscal.
1.7 The negligible hike in Securities Transaction Tax4 (from 0.015 % to 0.02 %) shows the lack of
political will on the part of the UPA Government to attempt curbing speculative trading and
simultaneously generating more resources. Also, the Finance Minister has chosen not to tax
the trading in derivatives5 , though his argument that derivatives trading should not be treated
as speculative trading has not convinced many. In fact, one of the most visible lacunae of the
Budget 2005-06 is that it does not have any measure aimed at checking the inflow of hot
money into the economy.
1.8 As regards the measures to cut down the size of black economy, proposals made by the Finance
Minister seem to be weak. Interestingly, one of the proposals, i.e., a tax of 0.1 % on withdrawal
of cash of over Rs. 10,000 in a single day, might be taken back very soon. Similarly, the
Finance Minister has not put forward any strong measure to improve significantly tax compliance
in the country. In fact, the dependence on voluntary tax compliance by the Government could
prove a major obstacle in meeting the tax revenue targets in 2005-06.
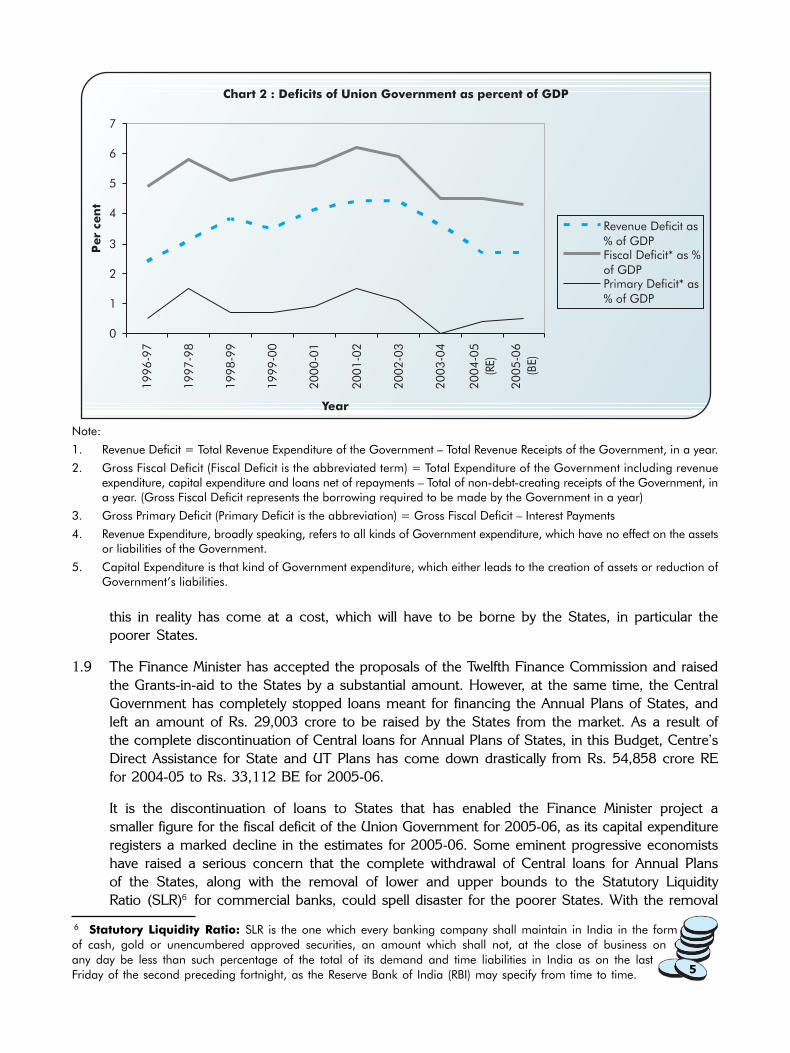
The projected deficits for the year 2005-06 (see Table 1.3) put the fiscal deficit of the Union
Government at 4.3 % of the estimated GDP, reduced from 4.5 % of GDP in 2004-05. The
Finance Minister has impressed many with this ‘feat’ of being able to reduce the fiscal deficit
while he has raised Government spending on social sector as well as rural development. But
4 Security Transaction Tax (STT): The securities transaction is defined as a transaction of purchase and sale of
securities entered into in any recognised stock exchange in India. STT is applicable at different rates on the value of the
“taxable securities transaction,” on or after the date on which Chapter VII of the Finance (No 2) Bill, 2004 came into
force (i.e. the specified date) and is payable by the buyer and the seller of the securities. For this purpose, “securities”
are defined under section 2(h) of the Securities Contracts (Regulation) Act, 1956 (SCRA) to include: (i) shares, scrips,
stocks, bonds, debentures, debenture stock or other marketable securities of a like nature in or of any incorporated
company or other body corporate; (ii) derivative; (iii) units or any other instrument issued by any collective investment
scheme to the investors in such schemes; (iv) security receipt as defined in section 2(zg) of the Securitisation and
Reconstruction of Financial Assets and Enforcement of Security Interest Act, 2002; (v) Government securities; (vi)
such other instruments as declared by the Central Government; and (vii) rights or interest in securities.
5 Derivatives: An instrument that has its price derived from, the price of an underlying asset. Assets may
not themselves be traded. For example, stock options, Commission Free Shares (CFDs), etc.
5
Note:
1. Revenue Deficit = Total Revenue Expenditure of the Government – Total Revenue Receipts of the Government, in a year.
2. Gross Fiscal Deficit (Fiscal Deficit is the abbreviated term) = Total Expenditure of the Government including revenueexpenditure, capital expenditure and loans net of repayments – Total of non-debt-creating receipts of the Government, ina year. (Gross Fiscal Deficit represents the borrowing required to be made by the Government in a year)
3. Gross Primary Deficit (Primary Deficit is the abbreviation) = Gross Fiscal Deficit – Interest Payments
4. Revenue Expenditure, broadly speaking, refers to all kinds of Government expenditure, which have no effect on the assetsor liabilities of the Government.
5. Capital Expenditure is that kind of Government expenditure, which either leads to the creation of assets or reduction ofGovernment’s liabilities.
this in reality has come at a cost, which will have to be borne by the States, in particular the
poorer States.
1.9 The Finance Minister has accepted the proposals of the Twelfth Finance Commission and raised
the Grants-in-aid to the States by a substantial amount. However, at the same time, the Central
Government has completely stopped loans meant for financing the Annual Plans of States, and
left an amount of Rs. 29,003 crore to be raised by the States from the market. As a result of
the complete discontinuation of Central loans for Annual Plans of States, in this Budget, Centre’s
Direct Assistance for State and UT Plans has come down drastically from Rs. 54,858 crore RE
for 2004-05 to Rs. 33,112 BE for 2005-06.
It is the discontinuation of loans to States that has enabled the Finance Minister project a
smaller figure for the fiscal deficit of the Union Government for 2005-06, as its capital expenditure
registers a marked decline in the estimates for 2005-06. Some eminent progressive economists
have raised a serious concern that the complete withdrawal of Central loans for Annual Plans
of the States, along with the removal of lower and upper bounds to the Statutory Liquidity
Ratio (SLR)6 for commercial banks, could spell disaster for the poorer States. With the removal
6 Statutory Liquidity Ratio: SLR is the one which every banking company shall maintain in India in the form
of cash, gold or unencumbered approved securities, an amount which shall not, at the close of business on
any day be less than such percentage of the total of its demand and time liabilities in India as on the last
Friday of the second preceding fortnight, as the Reserve Bank of India (RBI) may specify from time to time.
6
of SLR requirements, the banks will not be bound to hold State Government securities, and
hence only those States that have better financial health will be able to borrow from the banks
in any significant amount. This could lead to a crisis for the backward States.
1.10 We must note that this stated loan amount of Rs. 29,003 crore, if given to the States, will go
towards financing their Annual Plans. But the Centre is leaving the implementation of the Plans
in States on market forces for the sake of showing a smaller figure for its fiscal deficit. It is but
obvious that debt liability of the States, and hence that of the country as a whole, does not
reduce by this step. But those obsessed with showing a reduction in fiscal deficit of the Union
Government must be very happy.
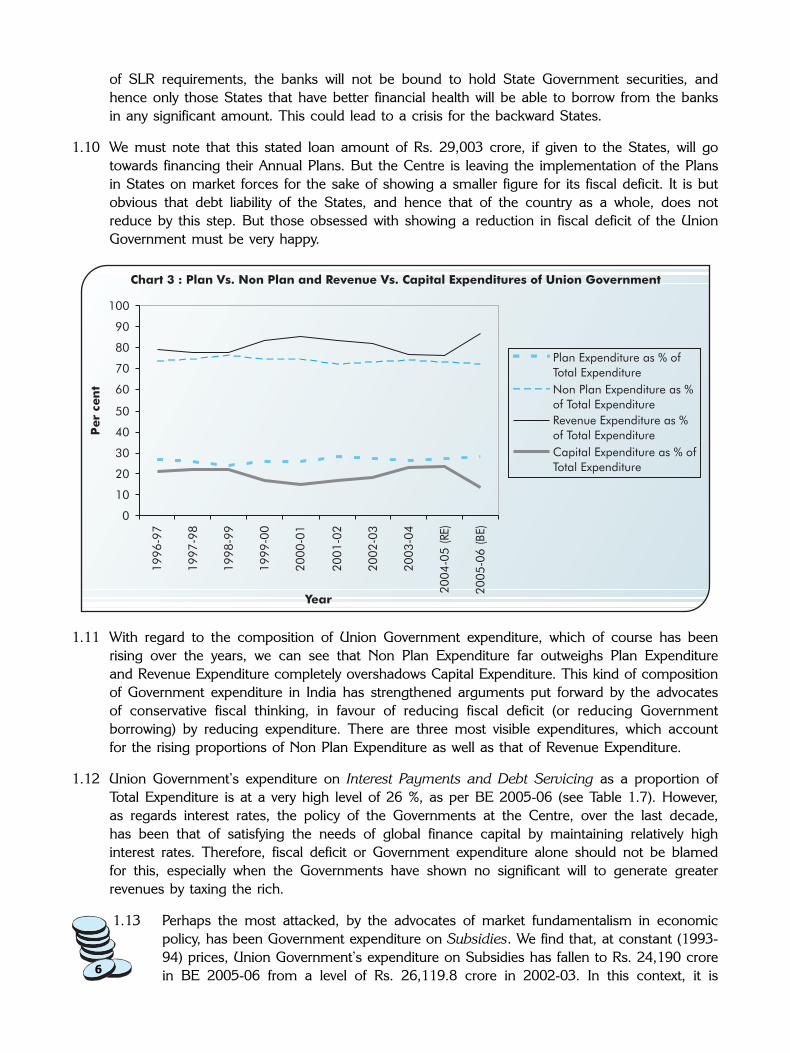
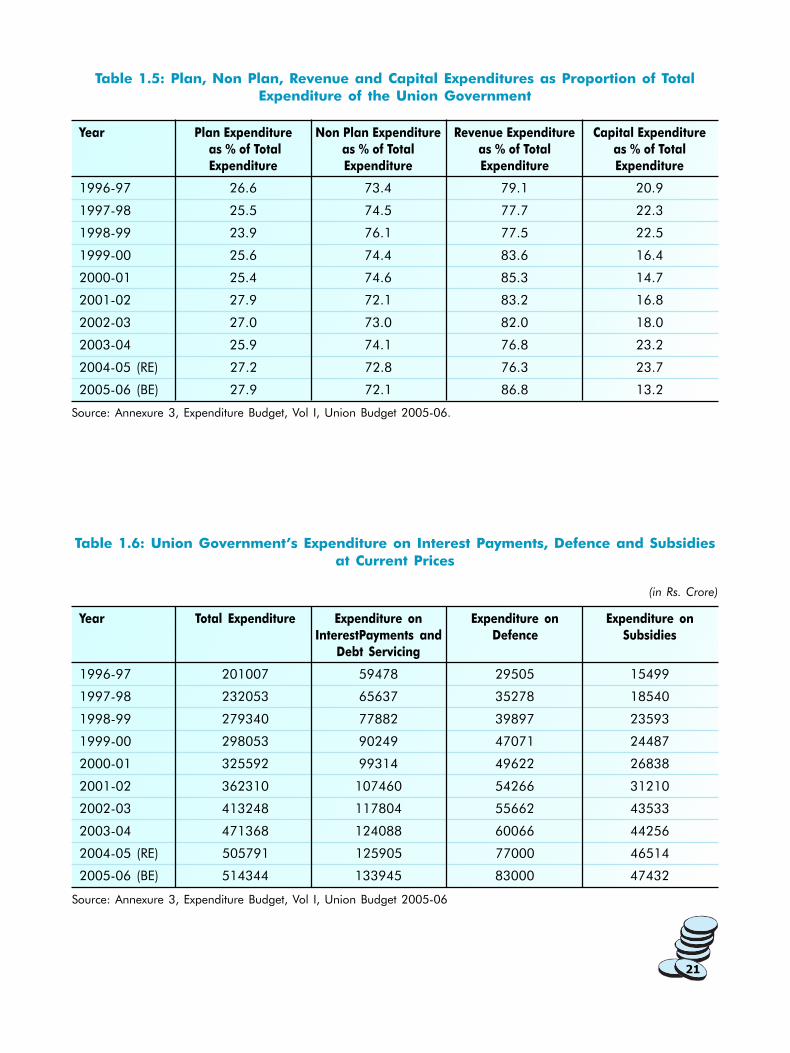
1.11 With regard to the composition of Union Government expenditure, which of course has been
rising over the years, we can see that Non Plan Expenditure far outweighs Plan Expenditure
and Revenue Expenditure completely overshadows Capital Expenditure. This kind of composition
of Government expenditure in India has strengthened arguments put forward by the advocates
of conservative fiscal thinking, in favour of reducing fiscal deficit (or reducing Government
borrowing) by reducing expenditure. There are three most visible expenditures, which account
for the rising proportions of Non Plan Expenditure as well as that of Revenue Expenditure.
1.12 Union Government’s expenditure on Interest Payments and Debt Servicing as a proportion of
Total Expenditure is at a very high level of 26 %, as per BE 2005-06 (see Table 1.7). However,
as regards interest rates, the policy of the Governments at the Centre, over the last decade,
has been that of satisfying the needs of global finance capital by maintaining relatively high
interest rates. Therefore, fiscal deficit or Government expenditure alone should not be blamed
for this, especially when the Governments have shown no significant will to generate greater
revenues by taxing the rich.
1.13 Perhaps the most attacked, by the advocates of market fundamentalism in economic
policy, has been Government expenditure on Subsidies. We find that, at constant (1993-
94) prices, Union Government’s expenditure on Subsidies has fallen to Rs. 24,190 crore
in BE 2005-06 from a level of Rs. 26,119.8 crore in 2002-03. In this context, it is
7
pertinent to note that given the nature of international trade in agriculture and the growing
crisis in Indian agriculture, subsidies for agriculture are essential. However, the nature of some
of the subsidies needs to be changed, for instance, in case of fertilizers, instead of subsidising
chemical fertilizers, Government should rather subsidise organic fertilizers.
1.14 The third item that accounts for a large share of Union Government expenditure is that on
Defence. As shown in Table 1.7 (in the Appendix), the expenditure on Defence as a proportion
of the total expenditure of the Union Government has risen from 12.7 % in 2003-04 to 16.1 %
in BE 2005-06. In view of the acute need for substantially higher expenditure on social sectors
and agriculture, the resource constraints of the Government, and the recent strides made in
the Indo-Pak peace process, it was highly desirable that the allocations for Defence be reduced
in 2005-06. However, the Finance Minister has chosen to raise the same by almost Rs. 6000
crore above the Revised figures for 2004-05.
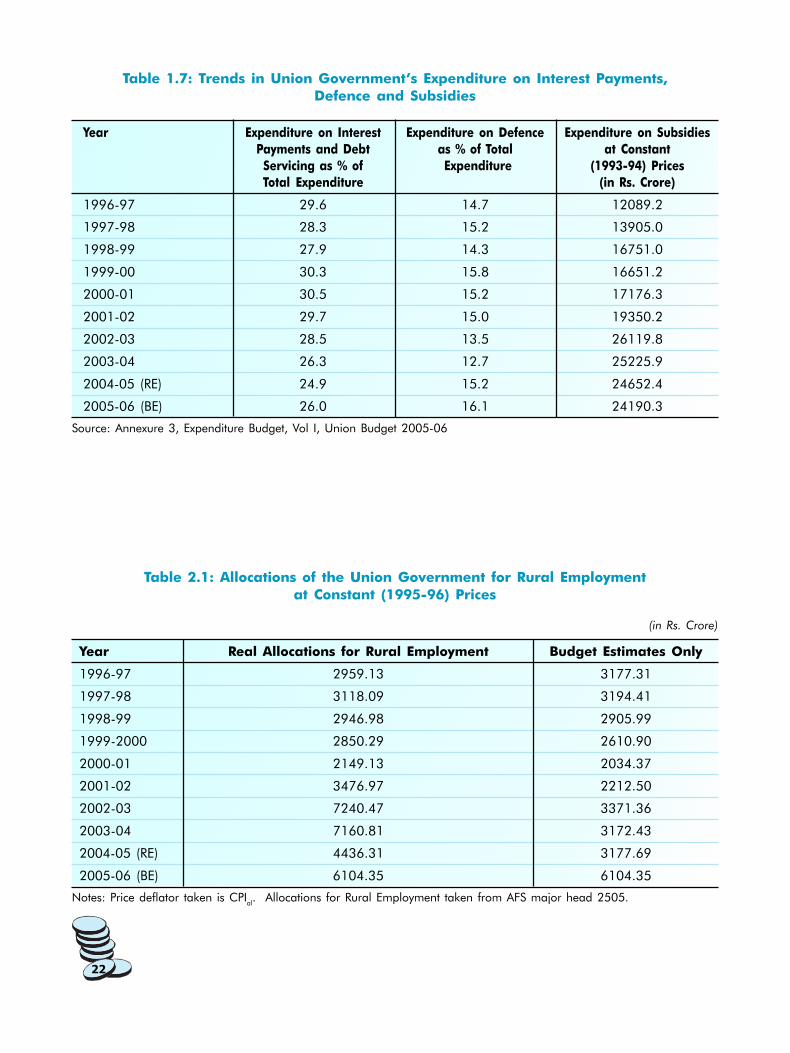
2. Rural Employment Generation and Poverty Alleviation
On December 21st 2004, the Ministry of Rural Development placed the long awaited National Rural
Employment Guarantee Bill in the Parliament. In the Budget 2005-06, the Finance Minister has almost
doubled the allocations to touch Rs. 9000 crore. However, it is worthwhile to mention here that
during 2004-05, the Finance Minister had reduced the allocation from Rs. 9639.9 crore in 2003-04
RE to Rs 4590 crore in 2004-05 BE.
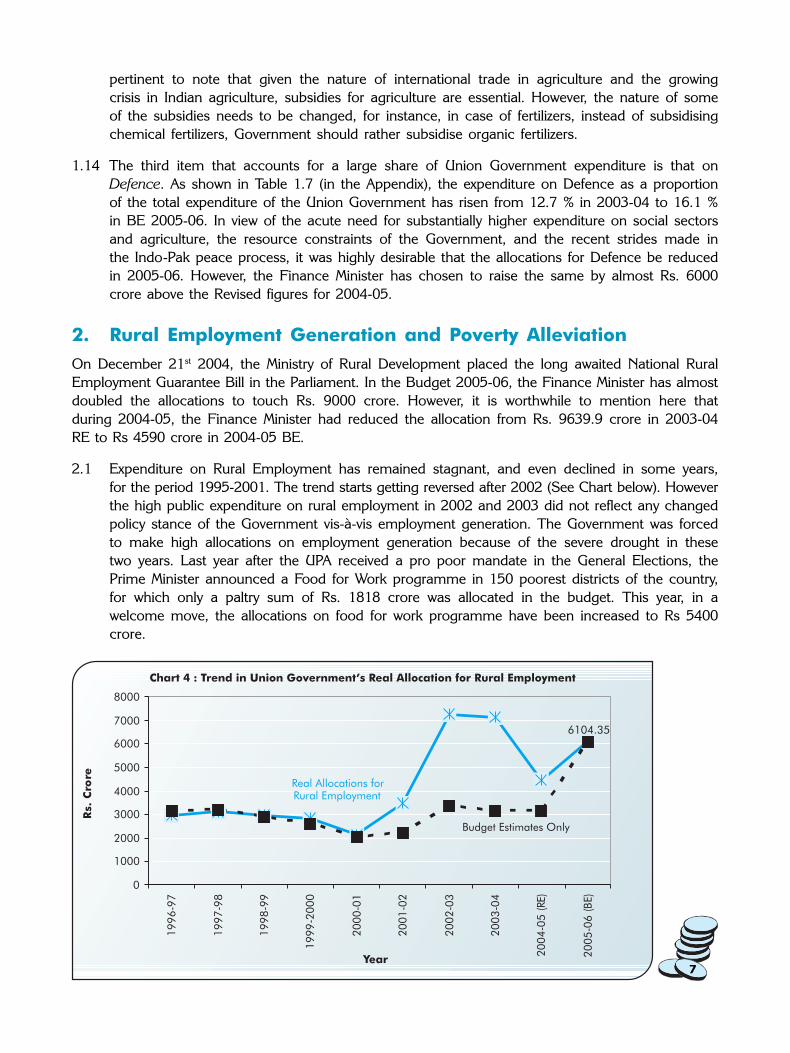
2.1 Expenditure on Rural Employment has remained stagnant, and even declined in some years,
for the period 1995-2001. The trend starts getting reversed after 2002 (See Chart below). However
the high public expenditure on rural employment in 2002 and 2003 did not reflect any changed
policy stance of the Government vis-à-vis employment generation. The Government was forced
to make high allocations on employment generation because of the severe drought in these
two years. Last year after the UPA received a pro poor mandate in the General Elections, the
Prime Minister announced a Food for Work programme in 150 poorest districts of the country,
for which only a paltry sum of Rs. 1818 crore was allocated in the budget. This year, in a
welcome move, the allocations on food for work programme have been increased to Rs 5400
crore.
8
2.2 The allocated Rs. 5400 crore will only cover the cost of cash component of the Food for Work
Programme. Foodgrain requirement of this programme estimated at 50 lakh tonnes, in the
Finance Minister’s own words7 , will cost the Government another Rs. 5600 crore. However this
amount has not been included in the budget estimates on Food for Work programme. Perhaps,
the Government will simply require the FCI to release these 50 lakh tonnes of foodgrains. Since
the cost of foodgrain component has to be borne by the Government, this cost should have
been included in the budget estimates. Not including expenditure, that the Government is going
to incur, in the budget estimates, clearly goes against all norms of transparent functioning.
2.3 The total amount allocated for food for work programme (which will be converted into
Employment Guarantee Scheme (EGS) once the bill is passed) is far too short of the requirements
of a universal EGS. Clearly, the Finance Minister is interested in getting the Employment
Guarantee Bill passed in its present diluted form.
2.4 Ministry of Rural Development has been implementing two flagship programmes for the last
five years- Sampoorna Gramin Rozgar Yojana (SGRY) for creating wage employment opportunities
and providing food security along with creation of community assets, and Swarnajayanti Gram
Swarozgar Yojana (SGSY) for providing self-employment opportunities to rural BPL households.
The Budget 2005-06 proposes for a reduction in the allocations for both the programmes,
from Rs. 4590 crore in BE 2004-05 to Rs. 3600 crore for SGRY (a 20 % cut) and from Rs. 900
crore in RE 2004-05 to Rs. 862 crore for SGSY. Also, the foodgrains component for SGRY is
nil. Additional funding for National Food for Work Programme (at least partly) at the cost of
reduced funds for SGRY and SGSY does not speak highly of the intention of the UPA Government
to honour the promises made in NCMP.
2.5 Rural Infrastructure Development
a. The Finance Minister in his speech announced an increase in expenditure on Rural Housing
(Indira Awas Yojana) by Rs. 250 crore in 2005-06. However, this increase is over the
budget estimate of 2004-05. When compared with the revised estimates of 2004-05,
there is a decline in expenditure on Rural Housing by Rs. 120 crore.
b. A proposal has been made to contribute Rs. 1200 crore towards Universal Service
Obligation with the objective of providing telephone facilities in the rural areas. However,
this allocation is same as the revised estimates for the year 2004-05.
c. In order to connect villages by all-weather roads, the Finance Minister has proposed an
additional Budgetary Support to the tune of Rs. 1600 crore (Expenditure Budget Volume
2, Demand No. 79) under the Prime Minister’s Gram Sadak Yojana. However, in
Government’s own admission an amount of Rs. 79,000 crore is required to connect all
the villages by all-weather roads by the end of Tenth Plan. Compared with this huge
requirement, the amount allocated in this direction seems grossly inadequate.
d. The expenditure (BE) on National Highway Development Project has gone up from
Rs. 4771.49 crore in 2004-05 to Rs. 6221.04 crore in 2005-06 (Expenditure Budget
Volume 2). The Government has also imposed an additional cess of 50 paise per litre on
petrol and diesel for development of highways. Considering the high inflationary potential
7 In his Budget Speech (Para-13), the Finance Minister Mr. P. Chidambaram announced that under the
National Food for Work Programme, “for 2005-06, a provision of Rs. 5400 crore for the cash component and
50 lakh MT of foodgrains have been made and, in overall terms, the allocation will increase to Rs. 11,000
crore”.
9
Table 1: Gross Capital Formation in Agriculture in India
Year Percent (%) Share in Gross Capital Formation Investment in
in Agriculture Agriculture as
Private Public % of GDP
1990-91 70.4 29.6 1.92
1995-96 69.1 30.9 1.57
1996-97 71.1 28.9 1.51
1997-98 75.0 25.0 1.43
1998-99 74.0 26.0 1.26
1999-00 75.6 24.4 1.37
2000-01 76.8 23.2 1.28
2001-02 71.1 28.9 1.24
2002-03 76.1 23.9 1.27
2003-04 74.4 25.6 1.31
Source: Economic Survey 2004-05, Government of India
of this cess, and the argument that the funds for National Highway Development Project
are already sufficient, this may not be a wise move.
e. The Finance Minister has announced a massive Programme for Rural Electrification
beginning in 2005-06, which will cover 1.25 lakh villages in 5 years. For this purpose, he
has provided Rs. 1100 crore. However, in Annexure 3.3 of Expenditure Budget Volume 1,
under the broad category of Central Assistance for State Plans, the allocations for Rural
Electrification are nil. We wonder if the arrangements in this case too are going to be
made in such a way that fiscal deficit of the Union Government does not go up but the
cost of expenditure is borne by some other agency!
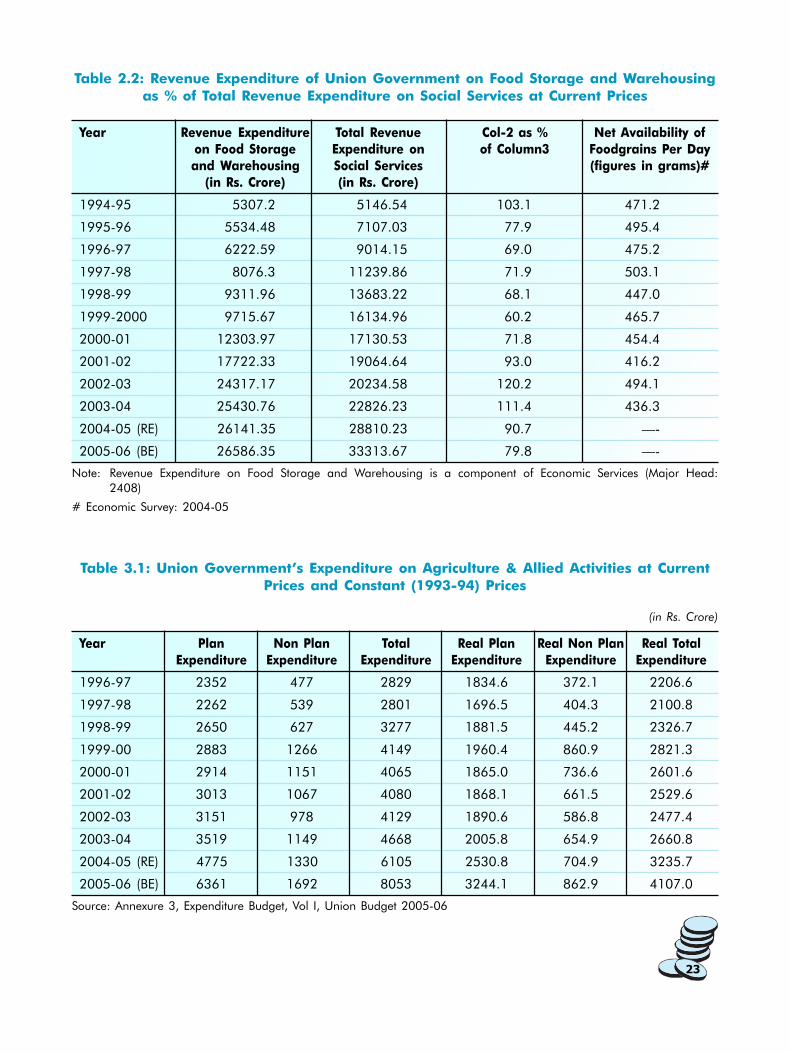
3. Agriculture
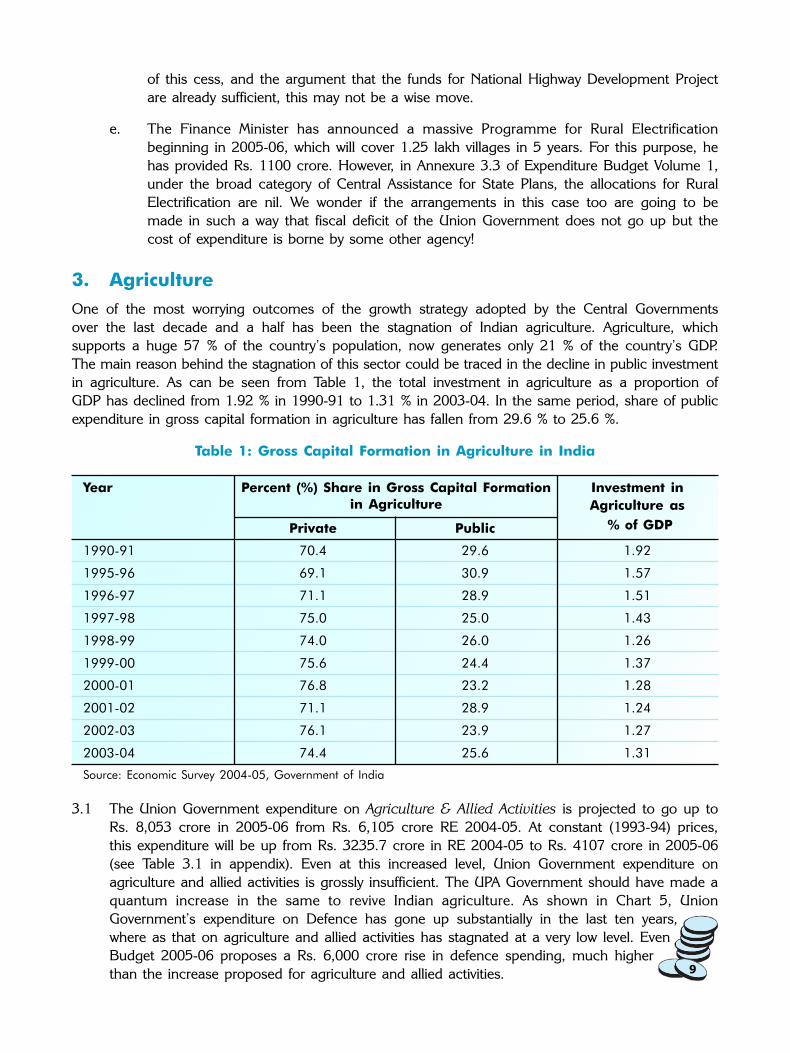
One of the most worrying outcomes of the growth strategy adopted by the Central Governments
over the last decade and a half has been the stagnation of Indian agriculture. Agriculture, which
supports a huge 57 % of the country’s population, now generates only 21 % of the country’s GDP.
The main reason behind the stagnation of this sector could be traced in the decline in public investment
in agriculture. As can be seen from Table 1, the total investment in agriculture as a proportion of
GDP has declined from 1.92 % in 1990-91 to 1.31 % in 2003-04. In the same period, share of public
expenditure in gross capital formation in agriculture has fallen from 29.6 % to 25.6 %.
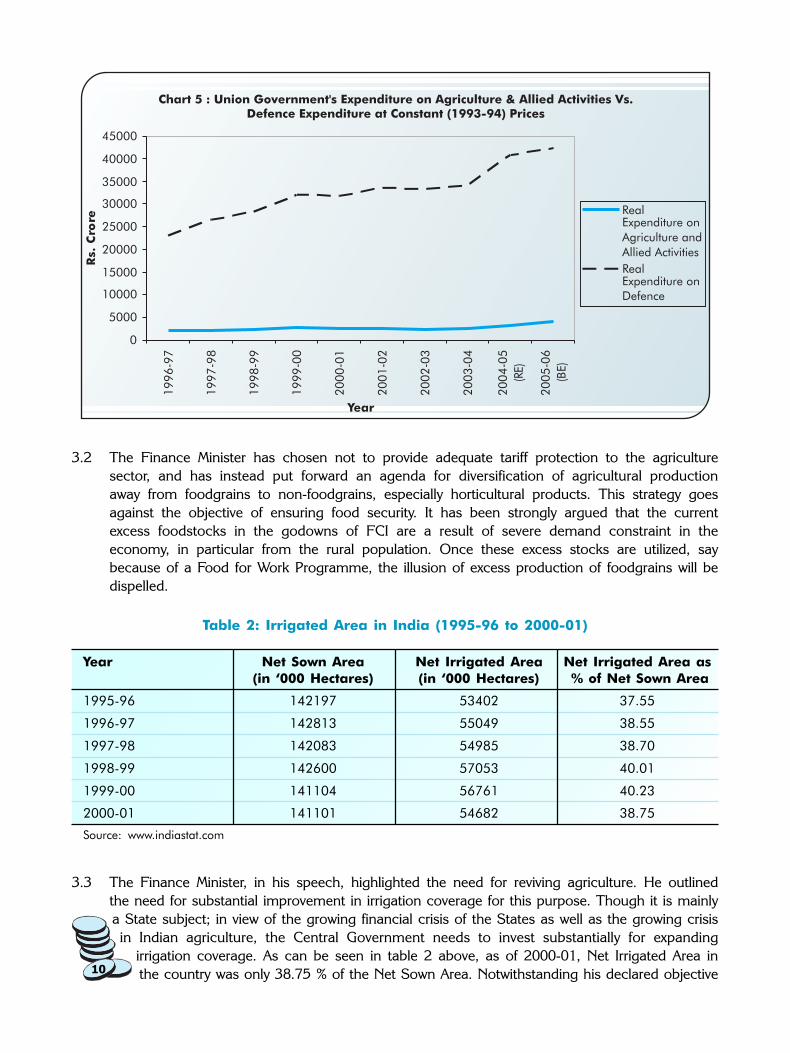
3.1 The Union Government expenditure on Agriculture & Allied Activities is projected to go up to
Rs. 8,053 crore in 2005-06 from Rs. 6,105 crore RE 2004-05. At constant (1993-94) prices,
this expenditure will be up from Rs. 3235.7 crore in RE 2004-05 to Rs. 4107 crore in 2005-06
(see Table 3.1 in appendix). Even at this increased level, Union Government expenditure on
agriculture and allied activities is grossly insufficient. The UPA Government should have made a
quantum increase in the same to revive Indian agriculture. As shown in Chart 5, Union
Government’s expenditure on Defence has gone up substantially in the last ten years,
where as that on agriculture and allied activities has stagnated at a very low level. Even
Budget 2005-06 proposes a Rs. 6,000 crore rise in defence spending, much higher
than the increase proposed for agriculture and allied activities.
10
Table 2: Irrigated Area in India (1995-96 to 2000-01)
Year Net Sown Area Net Irrigated Area Net Irrigated Area as
(in ‘000 Hectares) (in ‘000 Hectares) % of Net Sown Area
1995-96 142197 53402 37.55
1996-97 142813 55049 38.55
1997-98 142083 54985 38.70
1998-99 142600 57053 40.01
1999-00 141104 56761 40.23
2000-01 141101 54682 38.75
Source: www.indiastat.com
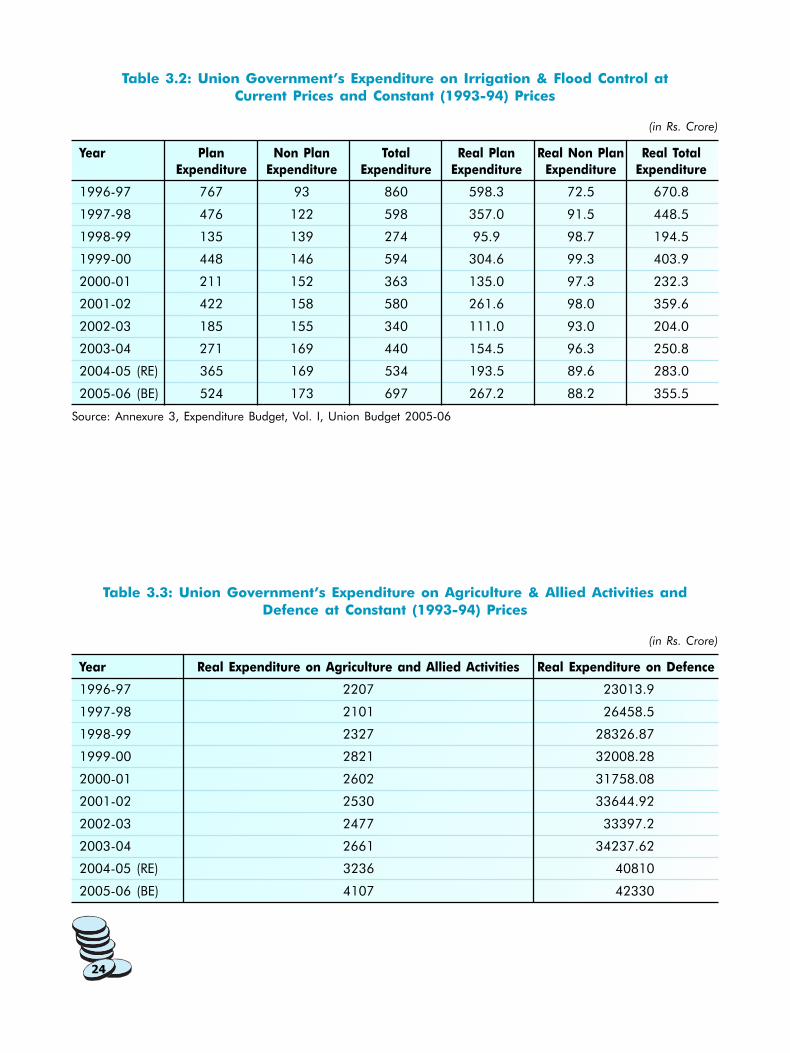
3.2 The Finance Minister has chosen not to provide adequate tariff protection to the agriculture
sector, and has instead put forward an agenda for diversification of agricultural production
away from foodgrains to non-foodgrains, especially horticultural products. This strategy goes
against the objective of ensuring food security. It has been strongly argued that the current
excess foodstocks in the godowns of FCI are a result of severe demand constraint in the
economy, in particular from the rural population. Once these excess stocks are utilized, say
because of a Food for Work Programme, the illusion of excess production of foodgrains will be
dispelled.
3.3 The Finance Minister, in his speech, highlighted the need for reviving agriculture. He outlined
the need for substantial improvement in irrigation coverage for this purpose. Though it is mainly
a State subject; in view of the growing financial crisis of the States as well as the growing crisis
in Indian agriculture, the Central Government needs to invest substantially for expanding
irrigation coverage. As can be seen in table 2 above, as of 2000-01, Net Irrigated Area in
the country was only 38.75 % of the Net Sown Area. Notwithstanding his declared objective
11
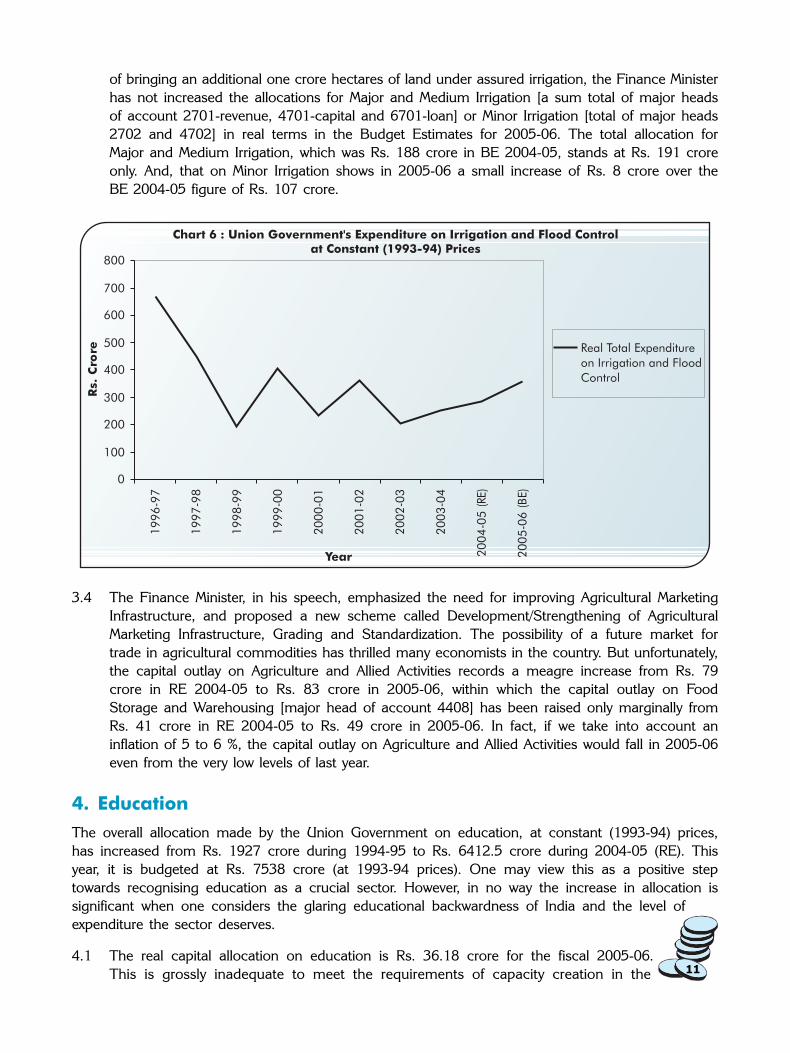
of bringing an additional one crore hectares of land under assured irrigation, the Finance Minister
has not increased the allocations for Major and Medium Irrigation [a sum total of major heads
of account 2701-revenue, 4701-capital and 6701-loan] or Minor Irrigation [total of major heads
2702 and 4702] in real terms in the Budget Estimates for 2005-06. The total allocation for
Major and Medium Irrigation, which was Rs. 188 crore in BE 2004-05, stands at Rs. 191 crore
only. And, that on Minor Irrigation shows in 2005-06 a small increase of Rs. 8 crore over the
BE 2004-05 figure of Rs. 107 crore.
3.4 The Finance Minister, in his speech, emphasized the need for improving Agricultural Marketing
Infrastructure, and proposed a new scheme called Development/Strengthening of Agricultural
Marketing Infrastructure, Grading and Standardization. The possibility of a future market for
trade in agricultural commodities has thrilled many economists in the country. But unfortunately,
the capital outlay on Agriculture and Allied Activities records a meagre increase from Rs. 79
crore in RE 2004-05 to Rs. 83 crore in 2005-06, within which the capital outlay on Food
Storage and Warehousing [major head of account 4408] has been raised only marginally from
Rs. 41 crore in RE 2004-05 to Rs. 49 crore in 2005-06. In fact, if we take into account an
inflation of 5 to 6 %, the capital outlay on Agriculture and Allied Activities would fall in 2005-06
even from the very low levels of last year.
4. Education
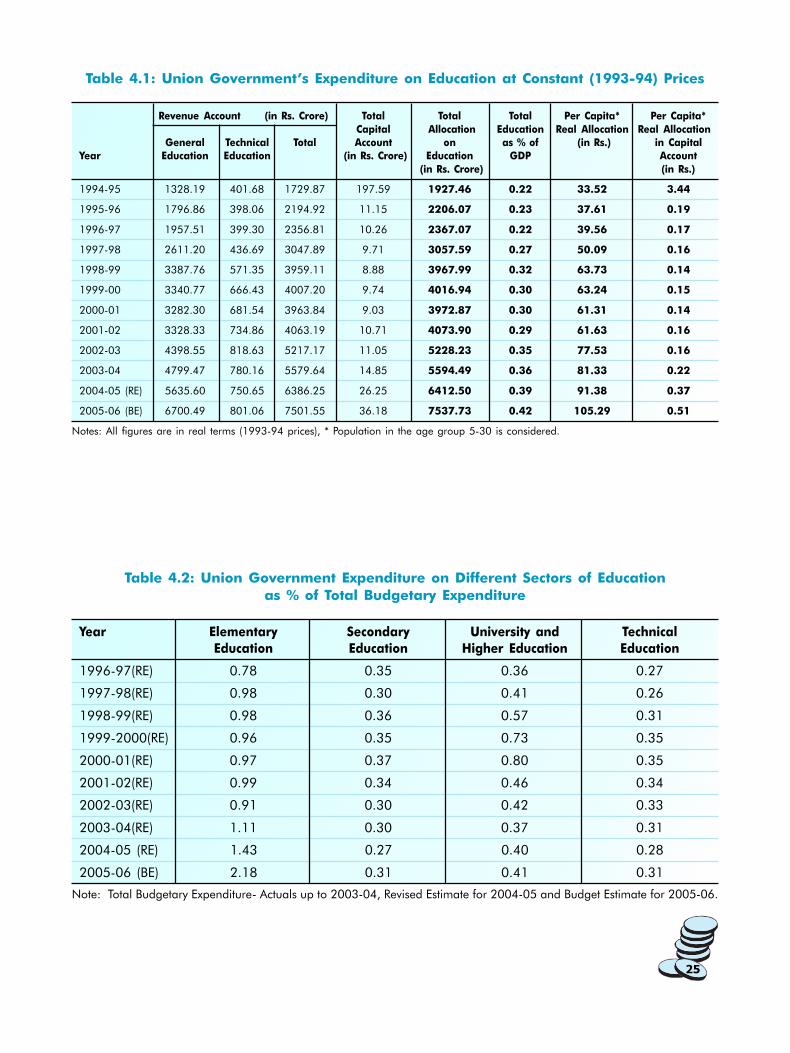
The overall allocation made by the Union Government on education, at constant (1993-94) prices,
has increased from Rs. 1927 crore during 1994-95 to Rs. 6412.5 crore during 2004-05 (RE). This
year, it is budgeted at Rs. 7538 crore (at 1993-94 prices). One may view this as a positive step
towards recognising education as a crucial sector. However, in no way the increase in allocation is
significant when one considers the glaring educational backwardness of India and the level of
expenditure the sector deserves.
4.1 The real capital allocation on education is Rs. 36.18 crore for the fiscal 2005-06.
This is grossly inadequate to meet the requirements of capacity creation in the
12
education sector in India. It is almost one sixth of the actual real capital expenditure incurred
(Rs. 197.59 crore) on education during 1994-95. (See Table-4.1 in appendix)
4.2 Allocation for different sectors of education as a proportion of total budgetary allocation shows
a clear positive tilt of Government’s emphasis towards elementary education (see Table- 4.2 in
appendix). Over the years the Governments have been apathetic towards secondary and higher
education and the present Budget is no exception to it. The share of secondary, higher and
technical education in total budgetary allocation for the year 2005-06 is much less than that
during the years of NDA coalition.
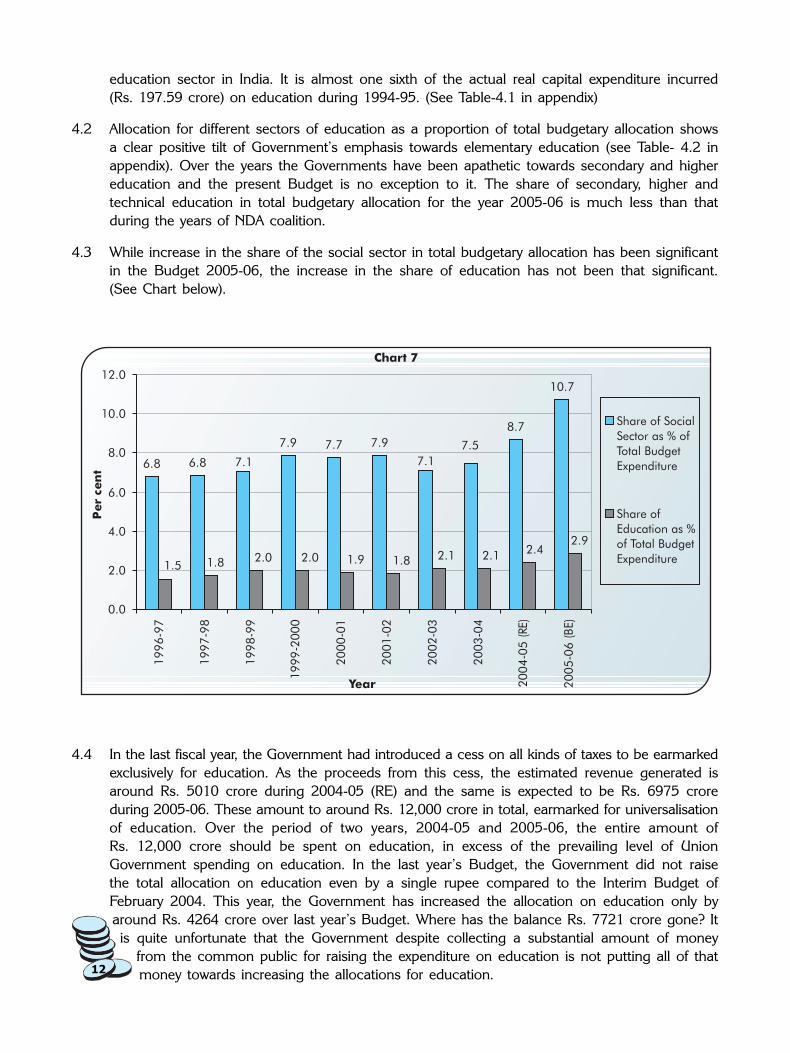
4.3 While increase in the share of the social sector in total budgetary allocation has been significant
in the Budget 2005-06, the increase in the share of education has not been that significant.
(See Chart below).
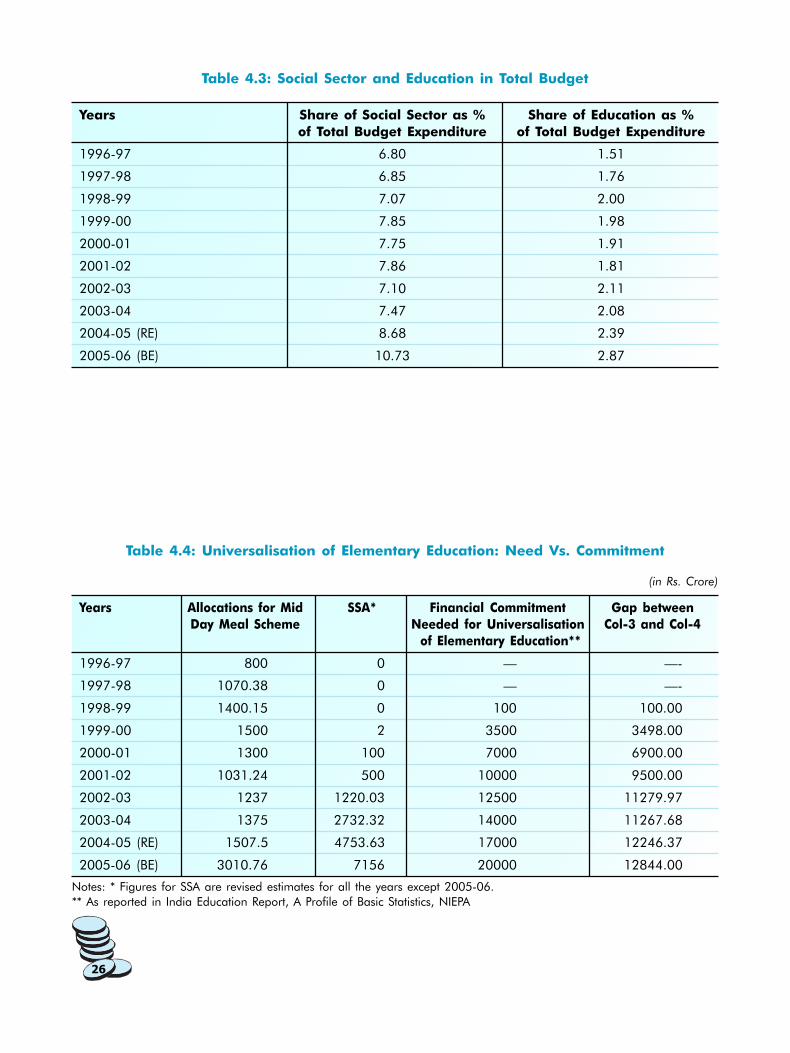
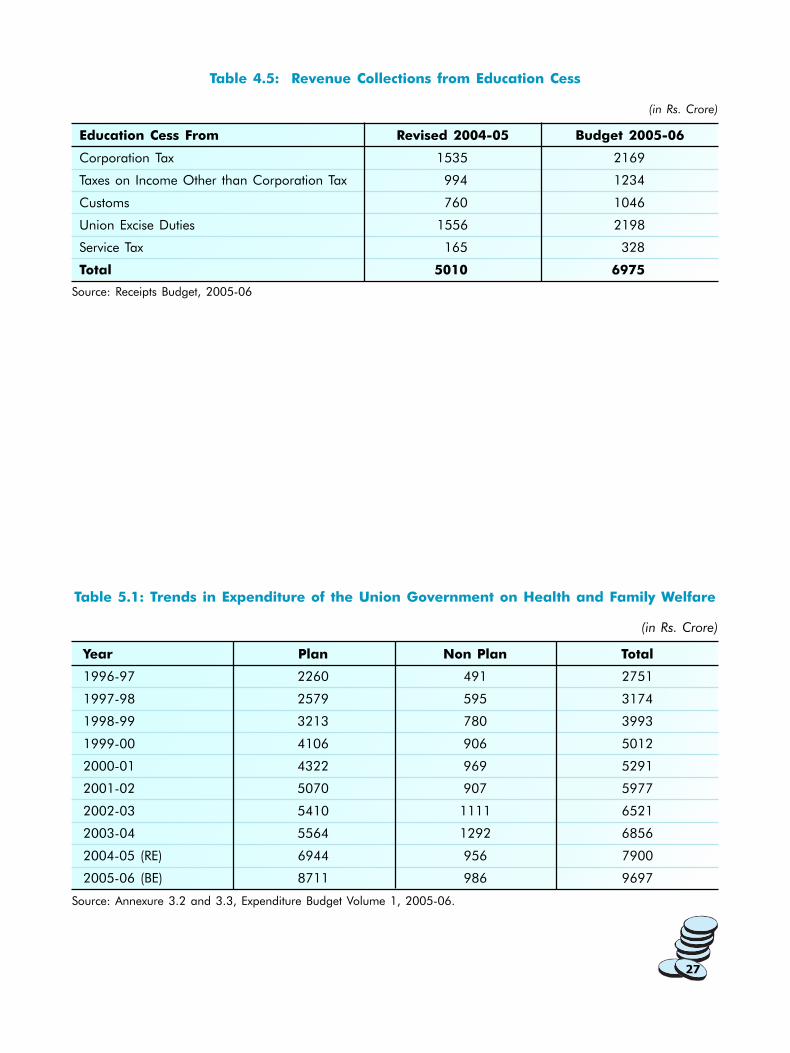
4.4 In the last fiscal year, the Government had introduced a cess on all kinds of taxes to be earmarked
exclusively for education. As the proceeds from this cess, the estimated revenue generated is
around Rs. 5010 crore during 2004-05 (RE) and the same is expected to be Rs. 6975 crore
during 2005-06. These amount to around Rs. 12,000 crore in total, earmarked for universalisation
of education. Over the period of two years, 2004-05 and 2005-06, the entire amount of
Rs. 12,000 crore should be spent on education, in excess of the prevailing level of Union
Government spending on education. In the last year’s Budget, the Government did not raise
the total allocation on education even by a single rupee compared to the Interim Budget of
February 2004. This year, the Government has increased the allocation on education only by
around Rs. 4264 crore over last year’s Budget. Where has the balance Rs. 7721 crore gone? It
is quite unfortunate that the Government despite collecting a substantial amount of money
from the common public for raising the expenditure on education is not putting all of that
money towards increasing the allocations for education.

13
4.5 Since 1999-00, the Union Government has till now allocated around Rs. 16,467 crore for Sarva
Shiksha Abhiyan (SSA), the only comprehensive scheme for universalisation of elementary
education. As per the estimates of the Tapas Majumdar Committee on Universalisation of
Elementary Education, by now, the Government was required to spend around Rs. 84,104
crore for this purpose. This shows an astoundingly huge gap of around Rs. 67641 crore in the
level of spending that was required and the amount that has been spent.
5. Health and Family Welfare
Access of primary healthcare to the “aam aadmi” has been a major issue for a long time and
there has been huge concern even within the Government over it. Our healthcare system is one of
the most privatised systems in the world. Total public expenditure on health in India accounts for
only 17 % of the total spending on this sector and in terms of percent of GDP it stands at
0.87 %. Out of the many pro-poor promises, the NCMP sought to increase public spending on
health to at least 2-3 % of GDP over the next five years, with focus on primary healthcare. It further
said that a national scheme for health insurance for poor families would be introduced and the
UPA Government would take all steps to ensure availability of life-saving drugs at reasonable prices.
5.1 Given the bad shape of State finances, the responsibility of meeting the target set for
expenditure on health in NCMP lies predominantly with the Central Government. An additional
allocation of Rs. 5,600 crore (for total public expenditure on health to be of 2 % of GDP)
and Rs. 11,200 crore (for a total public expenditure on health to be of 3 % of GDP) is needed
annually over the next five years, to reach the level of spending promised in the NCMP, if the
target is to be achieved by 2009. Although, the allocations in the current financial year (2004-
05) and the estimates for the ensuing year (2005-06) have been increased significantly, which
is a welcome step, they are still far below the requirements of the levels promised in NCMP.
Total Expenditure of the Union Government on Health and Family Welfare is projected to go
up from Rs. 7,900 crore in RE 2004-05 to Rs. 9,697 crore in BE 2005-06. Thus, as against
the NCMP mandated increase in allocations to Health and Family Welfare to the tune of
Rs. 5600 crore, the allocations actually increased lag far behind. Nonetheless, the allocations
have been increased by roughly Rs. 1800 crore, which is a move in the positive direction.
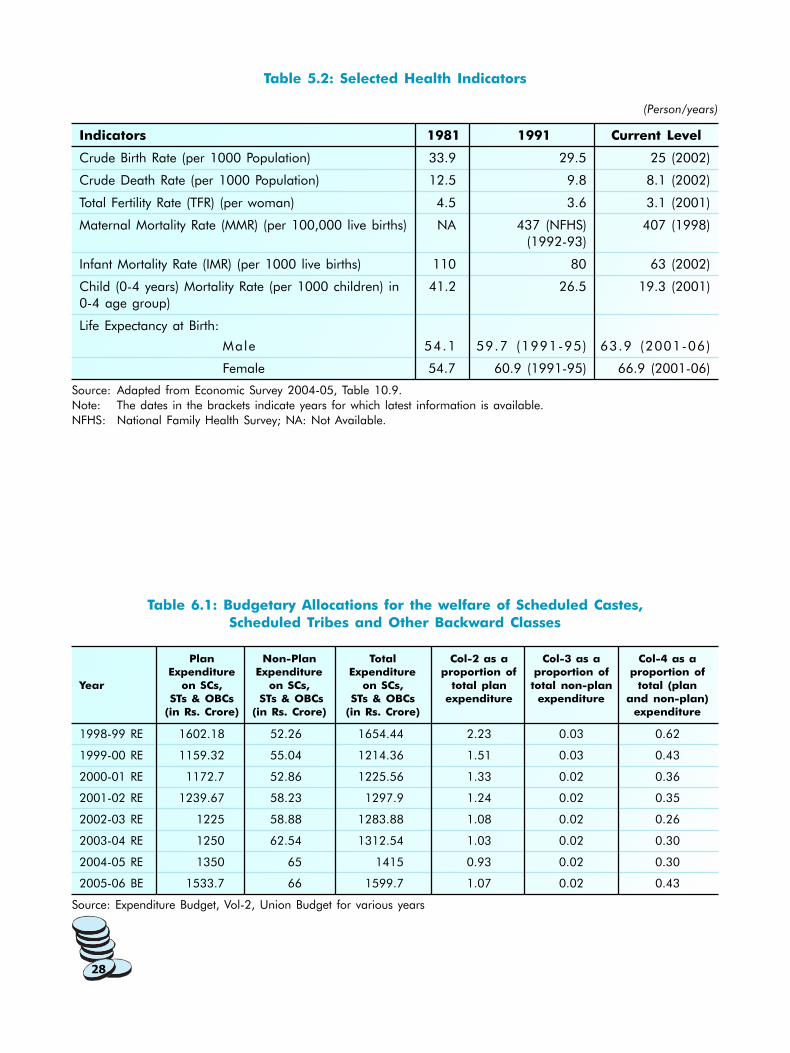
5.2 It is worthwhile to emphasise here that we have made significant strides in terms of major
health indicators over the past two and a half decades (see Table 5.2 in appendix). As the
public expenditure on health has remained very low in respect of most indicators, this
development can be attributed, among other things, to the existence of a liberal Patent Regime,
which facilitated cheap availability of drugs to common people. However, the country still
continues to lag behind several other countries in the region. Table No. 3 paints a clear picture
in this regard.

14
Table 3: India’s Global Position in terms of Major Health Indicators
Country Life Expectancy Under-five mortality rate Infant mortality rate Maternal mortality ratio
at birth (years) (per 1000 live births) (per 1000 live births) (per 100,000) live births
2000-05 1990 2002 1990 2002 2000
China 71 49 39 38 31 56
India 64 123 93 80 67 540
Nepal 60 145 91 100 66 740
Pakistan 61 128 107 96 83 500
Sri Lanka 72 23 19 19 17 92
Bangladesh 61 144 77 96 51 380
South Asia 63 126 95 84 69 NA
NA: Not Available
Source: Economic Survey 2004-05 (Table 10.10, citing Human Development Report 2004, UNDP).
5.3 The Tenth Plan has also set targets in this regard. It hopes to reduce Infant Mortality Rate to 45
per 1000 by 2007 and 28 per 1000 live births by 2012. Another target set by the Tenth Plan
pertains to Maternal Mortality Rate (MMR), which hopes to bring down MMR to 2 per 1000 live
births by 2007 and 1 per 1000 live birth by 2012. Given the huge gaps between the set targets
and the existing scenario (See Box-4), decisive intervention by the Government in this sector
Health Scenario in India
� Infant Mortality Rate (IMR): 63 per 1000 live births (as of 2002).
� MMR (maternal deaths per 100,000 live births) in 1998 was 407, or , 4.07 per 1000 live births.
� An estimated 5.1 million people in the country were living with HIV/AIDS by the end of 2003. In
the age group of 15-49 years, one out of every 100 persons is HIV positive.
� Tuberculosis (TB) claims about 4.17 lakh deaths in the country every year.
� There is only one Doctor (Modern System) for 1716 people in the country (as of 2003).
Source: Economic Survey 2004-05
will be very crucial for the welfare of the poor people. Also, now that we have adopted a
restrictive Patent Regime in the country, we need to increase public spending on health even
further so that through public research and innovations, along with increased domestic patenting
activity, we shall be able to provide cheap drugs to common people.
5.4 To this end, the announcement by the Finance Minister regarding National Rural Health Mission
(NRHM) to be launched this financial year (2005-06) is a welcome move. In Finance Minister’s
own words “its focus will be strengthening primary health care through grassroot level public
health interventions based on community ownership”. The increase in the allocations to Health
and Family Welfare Ministry, as noted earlier, “will finance the NRHM and its components like
training of health volunteers, providing more medicines and strengthening the primary and
community health centre system”. The next step by the government would be to spell out a
comprehensive policy in this regard. The Government should ensure that it is properly
implemented and allocations are increased progressively over the period to make this scheme
worthwhile. In this context, the proposal to increase the excise duty rate on cigarettes by
about 10 % and the imposition of a surcharge of 10 % on ad valorem duties on other
Box-4
15
tobacco products, the proceeds of which will be used to finance the NRHM, along the lines of
education cess, is a welcome move. The Proposed surcharge on pan masala and tobacco
products is expected to generate revenue of Rs. 700 crore (Receipts Budget, 2005-06).
5.5 Another significant development in this sector is that work on the six AIIMS-like institutions will
start in 2005-06 to augment medical education in deficient States. Rs. 280 crore has been
provided for this purpose under the Pradhan Mantri Swasthya Suraksha Yojana, (Expenditure
Budget Volume 2), which also includes provision for various medical hospitals-cum-research
institutes and medical councils. The combined allocations stood at Rs. 78 crore in the revised
estimates of current year, which has been raised substantially to Rs 280 crore in the ensuing
year. Thus, about Rs. 200 crore of Plan Outlay would go towards setting up the six AIIMS-like
institutions.
5.6 As highlighted in the Economic Survey 2004-05, we have to address the problems arising
from the prevalence of T.B. and HIV/AIDS. Annually, around 4.17 lakh people in the country
die every year because of T.B. By the end of 2003, around 51 lakh people were living with
HIV/AIDS. Almost 1 out of every 100 adults (age group15-49) suffers from HIV/AIDS. The
Government has responded positively to these concerns and raised the plan allocation (Budget
Estimate) for National AIDS control organisation from Rs. 232 crore in 2004-05 to Rs. 476.5
crore in 2005-06 (Expenditure Budget Volume 2). T.B. control programmes have registered
an increase in budget estimates from Rs. 115 crore in 2004-05 to Rs. 166.4 crore (Expenditure
Budget Volume 2).
6. Socially Marginalised Groups
The Finance Minister, in his Budget speech, explicitly stated the goal to bring scheduled castes and
scheduled tribes into the development process. He claims that through the programmes of various
Ministries/Departments of his Government, a sum of Rs. 6,253 crore will be spent for the development
of SCs and STs. The proposal of providing Rajiv Gandhi National Fellowship to two thousand SC and
ST students for pursuing M. Phil and Ph.D. courses in selected universities is a welcome step. However,
this provision has not been clearly mentioned in the budget documents.
The total budgetary allocation for the specific purpose of welfare of Scheduled Castes, Scheduled
Tribes and Other Backward Classes has been increased from Rs 1,415 crore in 2004-05 to Rs 1533.7
crore in 2005-06. Though Budget 2005-06 witnesses a better deal for the socially marginalized groups
than before, the allocations are not adequate to bring about any significant improvement in the
socio-economic conditions of such groups.
6.1 The plan budgetary allocation of the Union Government for the welfare of SCs, STs and OBCs
has declined even in absolute terms from Rs 1602.18 crore in 1998-99 to Rs 1533.7 crore in
2005-06 (see Table 6.1 in appendix).
6.2 The plan budgetary allocation for the welfare of SCs, STs and OBCs as a proportion of total
plan expenditure has declined from 2.23 % in 1998-99 to 1.07 % in 2005-06.
6.3 The overall budgetary allocation (plan and non-plan) for the welfare of SCs, STs and OBCs as
a proportion of total budgetary expenditure has declined from 0.62 % in 1998-99 to 0.30 % in
2004-05. This has increased to 0.43 % in 2005-06. Even this marginal increase is well
below the 1998-99 figure.
6.4 The per capita budgetary allocation for the welfare of the Schedule Castes was just
Rs 42.50 in 2000-01. This has increased to just Rs 52.50 in 2005-06 (see Table-6.2).

16
6.5 The above picture is even worse if we take into account real per capita budgetary allocation (at
1993-94 prices) for the welfare of Scheduled castes. The real per capita budgetary allocation
for the welfare of SCs has declined from Rs 27.25 in 2000-01 to Rs 26.85 in 2005-06.
Table-4: Per Capita budgetary allocation of the Union Government
for the Welfare of Scheduled Castes
Year Per Capita* Allocation Per Capita* Allocation on SCs at
on SCs constant (1993-94) prices
(in Rs) (in Rs)
2000-01(RE) 42.58 27.25
2001-02(RE) 43.42 26.92
2002-03(RE) 43.39 26.03
2003-04(RE) 44.12 25.15
2004-05(RE) 45.40 24.06
2005-06(BE) 52.65 26.85
Source: Expenditure Budget, Vol-2, Union Budget for various years
7. Welfare of Women and Children
Introduction of Gender Budgeting in Union Budget of India is a welcome initiative. However, the very
short period of two months given to the Ministries/Departments for making an analysis of the gender-
sensitivity of their demands (or expenditure proposals) and specific schemes for women was grossly
inadequate for a crucial exercise like gender budgeting. We can hope that this beginning in the
correct direction will be consolidated in the next budget making process.
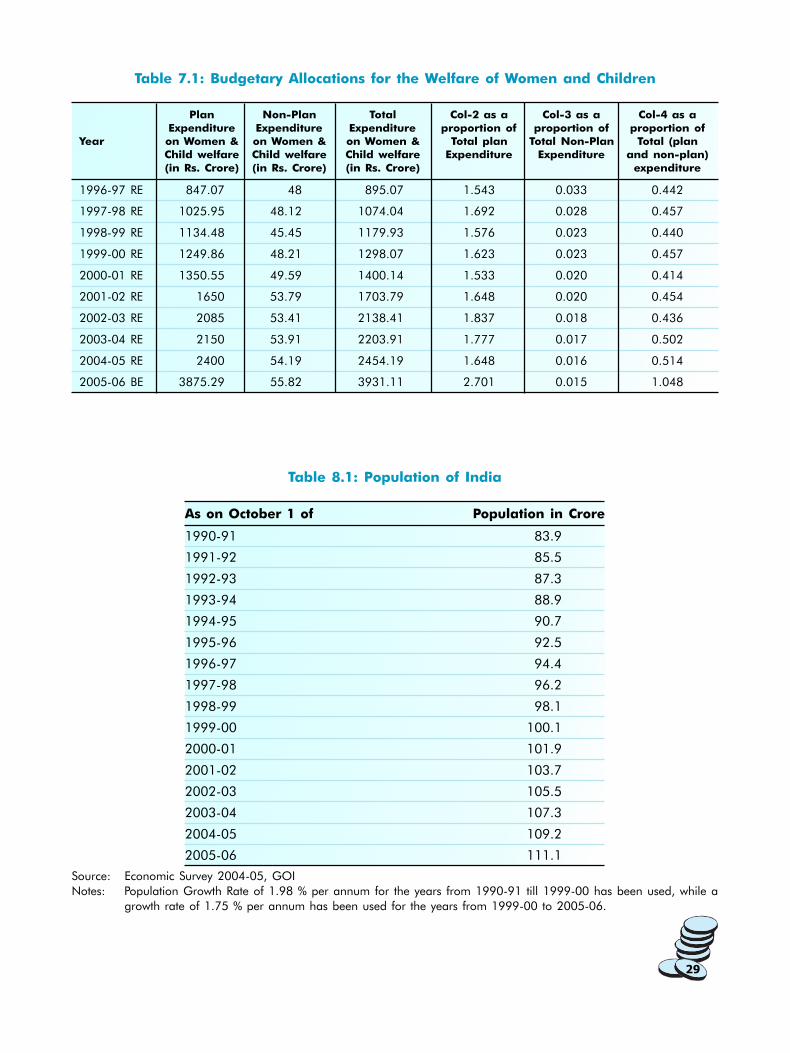
7.1 It is evident from Table-7.1 (Appendix) that the budgetary allocation for the welfare of the
Women and Children as a proportion of Total Expenditure has increased only marginally from
around 0.44 % in 1996-97 to 0.51 % in 2004-05. This year’s Budget projects a noticeable rise
in the allocations for the welfare of Women and Children. The budgetary allocation as a proportion
of total Plan and Non-Plan expenditure for the welfare of the Women and Child Development is
projected to increase from 0.51 % in 2004-05 to 1.048 % in 2005-06. This is a welcome move
in allocating resources towards women and children. However, it has been estimated that the
population of the country’s Women and Children (below 14 years of age) taken together would
be 66.35 crore in 2005-06. Thus the total budgetary allocation of Rs 3931.11 crore is far from
adequate.
7.2 Gender Budget was mentioned for the first time in the Budget Speech of 2000-01. It is to be
noticed that the National Development Council adopted “Empowerment of Women” as specific
objective of the Tenth Five Year Plan. Inclusion of Gender Budget in the mainstream Budget is
important keeping in mind the declining sex ratio and accentuating gender biases in our male-
dominated society. This year the Finance Minister has introduced a separate statement
highlighting the gender sensitivities of the budgetary allocations under 10 demands for grants.
The Department Of Women and Child Development is the nodal agency to accomplish the
task of sensitising all the Ministries for gender budgeting.
7.3 The total budgetary allocation for Gender Budgeting is Rs 14,379 crore. However, total
Gender budgetary allocation as a proportion of Total Expenditure of the Union
Government projected for 2005-06 (Rs. 5,14,344 Crore) is only 2.8 %. The exercise of

17
determining gender sensitive budgetary allocations under various Ministries/Departments shows
that the Government has mainly focused gender sensitive budgetary allocations to the Department
of Family Welfare, Department of Women and Child Development and the Department of Drinking
Water Supply (see Table-5). We find that gender sensitive budgetary allocations are grossly
inadequate in the Department of Elementary Education and Literacy, Department of Secondary
and Higher Education and Ministry of Labour and Employment
� The gender budgetary allocation on elementary education and literacy for girl child is just
2.03 % of total allocations for Department of Elementary Education and Literacy.
� The gender budgetary allocation for improving the working conditions of Child/Women
Labour (Demand No.61) has been only 10.49 % of the total allocations for Ministry of
Labour and Employment.
� The gender budgetary allocation is too small in the Ministry of Social Justice and
Empowerment, just 4.08 % of the total allocations.
� The gender budgetary allocation in the Department of Rural Development for Swarnjayanti
Gram Swarozgar Yojana and Sampoorna Gramin Rojgar Yojana is only 7.76 %
Table 5: Share of Gender Budgeting in Various Ministries
Share of Gender
Budgetary
Gender Allocations to Allocation in
Demand for Ministry/Department Budgetary the Ministry/ the Ministry/
Grants Allocations Department Department
(in Rs. Crore) (in Rs. Crore) (in %)
Demand No.49 Department of Family Welfare 4687.56 6453.49 72.64
Demand No.56 Transfers to Union Territory 2.03 838.05 0.24
Governments (Delhi and Pondichery)
Demand No.57 Department of Elementary Education 255 12536.53 2.03
and Literacy
Demand No.58 Department of Secondary and 9 5800.5 0.16
Higher Education
Demand No.59 Department of Women and Child 3487.36 3931.11 88.71
Development
Demand No.61 Ministry of Labour and Employment 125.05 1192.09 10.49
Demand No.65 Ministry of Non-Conventional 47.5 605.38 7.85
Energy Sources
Demand No.79 Department of Rural Development 1424.9 18353.87 7.76
Demand No.81 Department of Drinking Water Supply 4275.07 4751.42 89.97
Demand No.88 Ministry of Social Justice and 65.21 1599.7 4.08
Empowerment
Source: Expenditure Budget, Vol-1, 2005-06.
18
7.4 Thus, we must welcome the inception of the exercise of the various Ministries determining what
proportions of their total allocations are expected to benefit women specifically, as this exercise
reveals the grossly inadequate gender sensitive allocations under most Ministries/Departments.
It is equally important to assess the impact of such gender sensitive spending by the Government,
and more importantly, advocate for significantly higher public expenditure for the welfare of
women.
8. Conclusion
To conclude, we can say that Budget 2005-06 does mark a change, though small, in policy priorities
of the Union Government in favour of rural population and the social sector. In fact the root cause
for this welcome change can be traced in the larger political processes in the country, which have
witnessed the ouster of Governments pursuing neo-liberal economic policies ardently. However, there
is no quantum jump in the budgetary allocations for the priority sectors along the lines suggested in
the NCMP. The main reason for this half-hearted attempt to address the problems of rural poor and
social sectors seems to be the conservative fiscal thinking, which has been given legal teeth through
the FRBM Act.
19
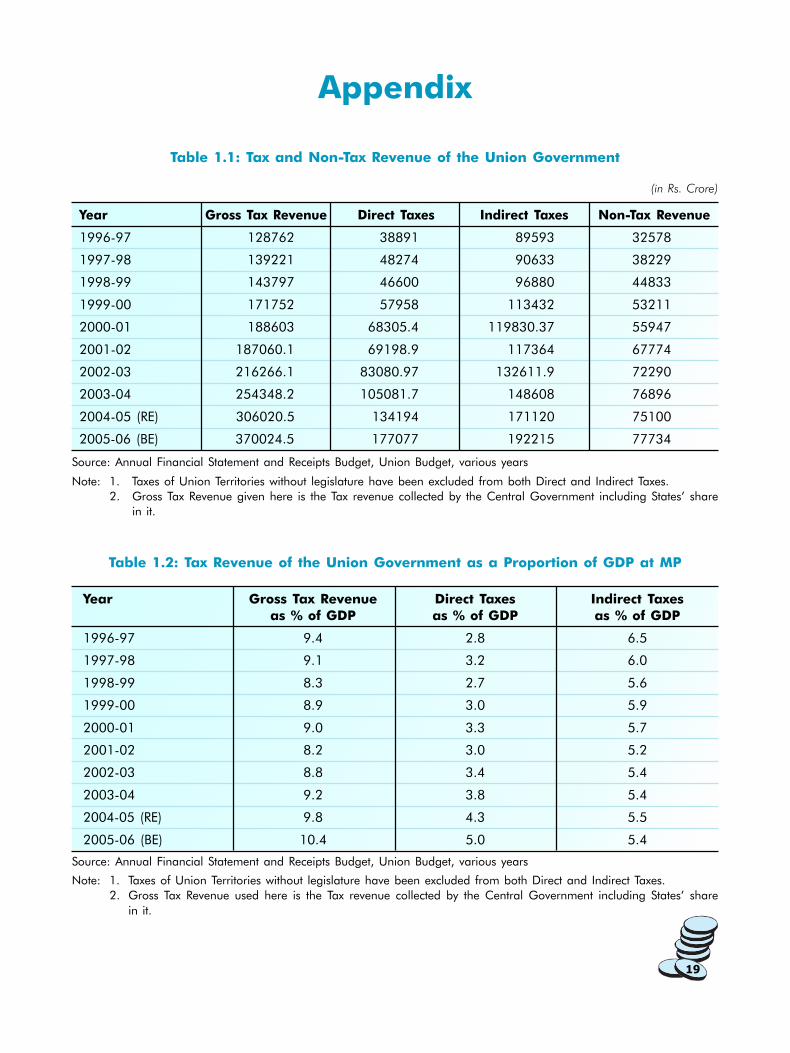
Appendix
Table 1.1: Tax and Non-Tax Revenue of the Union Government
(in Rs. Crore)
Year Gross Tax Revenue Direct Taxes Indirect Taxes Non-Tax Revenue
1996-97 128762 38891 89593 32578
1997-98 139221 48274 90633 38229
1998-99 143797 46600 96880 44833
1999-00 171752 57958 113432 53211
2000-01 188603 68305.4 119830.37 55947
2001-02 187060.1 69198.9 117364 67774
2002-03 216266.1 83080.97 132611.9 72290
2003-04 254348.2 105081.7 148608 76896
2004-05 (RE) 306020.5 134194 171120 75100
2005-06 (BE) 370024.5 177077 192215 77734
Source: Annual Financial Statement and Receipts Budget, Union Budget, various years
Note: 1. Taxes of Union Territories without legislature have been excluded from both Direct and Indirect Taxes.
2. Gross Tax Revenue given here is the Tax revenue collected by the Central Government including States’ share
in it.
Table 1.2: Tax Revenue of the Union Government as a Proportion of GDP at MP
Year Gross Tax Revenue Direct Taxes Indirect Taxes
as % of GDP as % of GDP as % of GDP
1996-97 9.4 2.8 6.5
1997-98 9.1 3.2 6.0
1998-99 8.3 2.7 5.6
1999-00 8.9 3.0 5.9
2000-01 9.0 3.3 5.7
2001-02 8.2 3.0 5.2
2002-03 8.8 3.4 5.4
2003-04 9.2 3.8 5.4
2004-05 (RE) 9.8 4.3 5.5
2005-06 (BE) 10.4 5.0 5.4
Source: Annual Financial Statement and Receipts Budget, Union Budget, various years
Note: 1. Taxes of Union Territories without legislature have been excluded from both Direct and Indirect Taxes.
2. Gross Tax Revenue used here is the Tax revenue collected by the Central Government including States’ share
in it.

20
Table 1.3: Deficits of the Union Government as a Proportion of GDP at MP
Year Revenue Deficit as Fiscal Deficit* as Primary Deficit* as
% of GDP % of GDP % of GDP
1996-97 2.4 4.9 0.5
1997-98 3.1 5.8 1.5
1998-99 3.8 5.1 0.7
1999-00 3.5 5.4 0.7
2000-01 4.1 5.6 0.9
2001-02 4.4 6.2 1.5
2002-03 4.4 5.9 1.1
2003-04 3.6 4.5 0
2004-05 (RE) 2.7 4.5 0.4
2005-06 (BE) 2.7 4.3 0.5
Source: Budget at a Glance, Union Budget, 2005-06, 1999-00, 1998-99
Note: * Gross Fiscal Deficit and Gross Primary Deficit have been abbreviated as Fiscal Deficit and Primary Deficit,
respectively.
Table 1.4: Trends in Expenditure of the Union Government at Current Prices
(in Rs. Crore)
Year Total Plan Non-plan Revenue Capital
Expenditure Expenditure Expenditure Expenditure Expenditure
1996-97 201007 53534 147473 158933 42074
1997-98 232053 59077 172976 180335 51718
1998-99 279340 66818 212522 216461 62879
1999-00 298053 76182 221871 249078 48975
2000-01 325592 82669 242923 277839 47753
2001-02 362310 101194 261116 301468 60842
2002-03 413248 111470 301778 338713 74535
2003-04 471368 122280 349088 362140 109228
2004-05 (RE) 505791 137387 368404 386069 119722
2005-06 (BE) 514344 143497 370847 446512 67832
Source: Annexure 3, Expenditure Budget, Vol I, Union Budget 2005-06
21
Table 1.5: Plan, Non Plan, Revenue and Capital Expenditures as Proportion of Total
Expenditure of the Union Government
Year Plan Expenditure Non Plan Expenditure Revenue Expenditure Capital Expenditure
as % of Total as % of Total as % of Total as % of Total
Expenditure Expenditure Expenditure Expenditure
1996-97 26.6 73.4 79.1 20.9
1997-98 25.5 74.5 77.7 22.3
1998-99 23.9 76.1 77.5 22.5
1999-00 25.6 74.4 83.6 16.4
2000-01 25.4 74.6 85.3 14.7
2001-02 27.9 72.1 83.2 16.8
2002-03 27.0 73.0 82.0 18.0
2003-04 25.9 74.1 76.8 23.2
2004-05 (RE) 27.2 72.8 76.3 23.7
2005-06 (BE) 27.9 72.1 86.8 13.2
Source: Annexure 3, Expenditure Budget, Vol I, Union Budget 2005-06.
Table 1.6: Union Government’s Expenditure on Interest Payments, Defence and Subsidies
at Current Prices
(in Rs. Crore)
Year Total Expenditure Expenditure on Expenditure on Expenditure on
InterestPayments and Defence Subsidies
Debt Servicing
1996-97 201007 59478 29505 15499
1997-98 232053 65637 35278 18540
1998-99 279340 77882 39897 23593
1999-00 298053 90249 47071 24487
2000-01 325592 99314 49622 26838
2001-02 362310 107460 54266 31210
2002-03 413248 117804 55662 43533
2003-04 471368 124088 60066 44256
2004-05 (RE) 505791 125905 77000 46514
2005-06 (BE) 514344 133945 83000 47432
Source: Annexure 3, Expenditure Budget, Vol I, Union Budget 2005-06
22
Table 1.7: Trends in Union Government’s Expenditure on Interest Payments,
Defence and Subsidies
Year Expenditure on Interest Expenditure on Defence Expenditure on Subsidies
Payments and Debt as % of Total at Constant
Servicing as % of Expenditure (1993-94) Prices
Total Expenditure (in Rs. Crore)
1996-97 29.6 14.7 12089.2
1997-98 28.3 15.2 13905.0
1998-99 27.9 14.3 16751.0
1999-00 30.3 15.8 16651.2
2000-01 30.5 15.2 17176.3
2001-02 29.7 15.0 19350.2
2002-03 28.5 13.5 26119.8
2003-04 26.3 12.7 25225.9
2004-05 (RE) 24.9 15.2 24652.4
2005-06 (BE) 26.0 16.1 24190.3
Source: Annexure 3, Expenditure Budget, Vol I, Union Budget 2005-06
Table 2.1: Allocations of the Union Government for Rural Employment
at Constant (1995-96) Prices
(in Rs. Crore)
Year Real Allocations for Rural Employment Budget Estimates Only
1996-97 2959.13 3177.31
1997-98 3118.09 3194.41
1998-99 2946.98 2905.99
1999-2000 2850.29 2610.90
2000-01 2149.13 2034.37
2001-02 3476.97 2212.50
2002-03 7240.47 3371.36
2003-04 7160.81 3172.43
2004-05 (RE) 4436.31 3177.69
2005-06 (BE) 6104.35 6104.35
Notes: Price deflator taken is CPIal. Allocations for Rural Employment taken from AFS major head 2505.
23
Table 2.2: Revenue Expenditure of Union Government on Food Storage and Warehousing
as % of Total Revenue Expenditure on Social Services at Current Prices
Year Revenue Expenditure Total Revenue Col-2 as % Net Availability of
on Food Storage Expenditure on of Column3 Foodgrains Per Day
and Warehousing Social Services (figures in grams)#
(in Rs. Crore) (in Rs. Crore)
1994-95 5307.2 5146.54 103.1 471.2
1995-96 5534.48 7107.03 77.9 495.4
1996-97 6222.59 9014.15 69.0 475.2
1997-98 8076.3 11239.86 71.9 503.1
1998-99 9311.96 13683.22 68.1 447.0
1999-2000 9715.67 16134.96 60.2 465.7
2000-01 12303.97 17130.53 71.8 454.4
2001-02 17722.33 19064.64 93.0 416.2
2002-03 24317.17 20234.58 120.2 494.1
2003-04 25430.76 22826.23 111.4 436.3
2004-05 (RE) 26141.35 28810.23 90.7 —-
2005-06 (BE) 26586.35 33313.67 79.8 —-
Note: Revenue Expenditure on Food Storage and Warehousing is a component of Economic Services (Major Head:
2408)
# Economic Survey: 2004-05
Table 3.1: Union Government’s Expenditure on Agriculture & Allied Activities at Current
Prices and Constant (1993-94) Prices
(in Rs. Crore)
Year Plan Non Plan Total Real Plan Real Non Plan Real Total
Expenditure Expenditure Expenditure Expenditure Expenditure Expenditure
1996-97 2352 477 2829 1834.6 372.1 2206.6
1997-98 2262 539 2801 1696.5 404.3 2100.8
1998-99 2650 627 3277 1881.5 445.2 2326.7
1999-00 2883 1266 4149 1960.4 860.9 2821.3
2000-01 2914 1151 4065 1865.0 736.6 2601.6
2001-02 3013 1067 4080 1868.1 661.5 2529.6
2002-03 3151 978 4129 1890.6 586.8 2477.4
2003-04 3519 1149 4668 2005.8 654.9 2660.8
2004-05 (RE) 4775 1330 6105 2530.8 704.9 3235.7
2005-06 (BE) 6361 1692 8053 3244.1 862.9 4107.0
Source: Annexure 3, Expenditure Budget, Vol I, Union Budget 2005-06
24
Table 3.2: Union Government’s Expenditure on Irrigation & Flood Control at
Current Prices and Constant (1993-94) Prices
(in Rs. Crore)
Year Plan Non Plan Total Real Plan Real Non Plan Real Total
Expenditure Expenditure Expenditure Expenditure Expenditure Expenditure
1996-97 767 93 860 598.3 72.5 670.8
1997-98 476 122 598 357.0 91.5 448.5
1998-99 135 139 274 95.9 98.7 194.5
1999-00 448 146 594 304.6 99.3 403.9
2000-01 211 152 363 135.0 97.3 232.3
2001-02 422 158 580 261.6 98.0 359.6
2002-03 185 155 340 111.0 93.0 204.0
2003-04 271 169 440 154.5 96.3 250.8
2004-05 (RE) 365 169 534 193.5 89.6 283.0
2005-06 (BE) 524 173 697 267.2 88.2 355.5
Source: Annexure 3, Expenditure Budget, Vol. I, Union Budget 2005-06
Table 3.3: Union Government’s Expenditure on Agriculture & Allied Activities and
Defence at Constant (1993-94) Prices
(in Rs. Crore)
Year Real Expenditure on Agriculture and Allied Activities Real Expenditure on Defence
1996-97 2207 23013.9
1997-98 2101 26458.5
1998-99 2327 28326.87
1999-00 2821 32008.28
2000-01 2602 31758.08
2001-02 2530 33644.92
2002-03 2477 33397.2
2003-04 2661 34237.62
2004-05 (RE) 3236 40810
2005-06 (BE) 4107 42330
25
Table 4.1: Union Government’s Expenditure on Education at Constant (1993-94) Prices
Revenue Account (in Rs. Crore) Total Total Total Per Capita* Per Capita*
Capital Allocation Education Real Allocation Real Allocation
General Technical Total Account on as % of (in Rs.) in Capital
Year Education Education (in Rs. Crore) Education GDP Account
(in Rs. Crore) (in Rs.)
1994-95 1328.19 401.68 1729.87 197.59 1927.46 0.22 33.52 3.44
1995-96 1796.86 398.06 2194.92 11.15 2206.07 0.23 37.61 0.19
1996-97 1957.51 399.30 2356.81 10.26 2367.07 0.22 39.56 0.17
1997-98 2611.20 436.69 3047.89 9.71 3057.59 0.27 50.09 0.16
1998-99 3387.76 571.35 3959.11 8.88 3967.99 0.32 63.73 0.14
1999-00 3340.77 666.43 4007.20 9.74 4016.94 0.30 63.24 0.15
2000-01 3282.30 681.54 3963.84 9.03 3972.87 0.30 61.31 0.14
2001-02 3328.33 734.86 4063.19 10.71 4073.90 0.29 61.63 0.16
2002-03 4398.55 818.63 5217.17 11.05 5228.23 0.35 77.53 0.16
2003-04 4799.47 780.16 5579.64 14.85 5594.49 0.36 81.33 0.22
2004-05 (RE) 5635.60 750.65 6386.25 26.25 6412.50 0.39 91.38 0.37
2005-06 (BE) 6700.49 801.06 7501.55 36.18 7537.73 0.42 105.29 0.51
Notes: All figures are in real terms (1993-94 prices), * Population in the age group 5-30 is considered.
Table 4.2: Union Government Expenditure on Different Sectors of Education
as % of Total Budgetary Expenditure
Year Elementary Secondary University and Technical
Education Education Higher Education Education
1996-97(RE) 0.78 0.35 0.36 0.27
1997-98(RE) 0.98 0.30 0.41 0.26
1998-99(RE) 0.98 0.36 0.57 0.31
1999-2000(RE) 0.96 0.35 0.73 0.35
2000-01(RE) 0.97 0.37 0.80 0.35
2001-02(RE) 0.99 0.34 0.46 0.34
2002-03(RE) 0.91 0.30 0.42 0.33
2003-04(RE) 1.11 0.30 0.37 0.31
2004-05 (RE) 1.43 0.27 0.40 0.28
2005-06 (BE) 2.18 0.31 0.41 0.31
Note: Total Budgetary Expenditure- Actuals up to 2003-04, Revised Estimate for 2004-05 and Budget Estimate for 2005-06.
26
Table 4.3: Social Sector and Education in Total Budget
Years Share of Social Sector as % Share of Education as %
of Total Budget Expenditure of Total Budget Expenditure
1996-97 6.80 1.51
1997-98 6.85 1.76
1998-99 7.07 2.00
1999-00 7.85 1.98
2000-01 7.75 1.91
2001-02 7.86 1.81
2002-03 7.10 2.11
2003-04 7.47 2.08
2004-05 (RE) 8.68 2.39
2005-06 (BE) 10.73 2.87
Table 4.4: Universalisation of Elementary Education: Need Vs. Commitment
(in Rs. Crore)
Years Allocations for Mid SSA* Financial Commitment Gap between
Day Meal Scheme Needed for Universalisation Col-3 and Col-4
of Elementary Education**
1996-97 800 0 — —-
1997-98 1070.38 0 — —-
1998-99 1400.15 0 100 100.00
1999-00 1500 2 3500 3498.00
2000-01 1300 100 7000 6900.00
2001-02 1031.24 500 10000 9500.00
2002-03 1237 1220.03 12500 11279.97
2003-04 1375 2732.32 14000 11267.68
2004-05 (RE) 1507.5 4753.63 17000 12246.37
2005-06 (BE) 3010.76 7156 20000 12844.00
Notes: * Figures for SSA are revised estimates for all the years except 2005-06.
** As reported in India Education Report, A Profile of Basic Statistics, NIEPA
27
Table 4.5: Revenue Collections from Education Cess
(in Rs. Crore)
Education Cess From Revised 2004-05 Budget 2005-06
Corporation Tax 1535 2169
Taxes on Income Other than Corporation Tax 994 1234
Customs 760 1046
Union Excise Duties 1556 2198
Service Tax 165 328
Total 5010 6975
Source: Receipts Budget, 2005-06
Table 5.1: Trends in Expenditure of the Union Government on Health and Family Welfare
(in Rs. Crore)
Year Plan Non Plan Total
1996-97 2260 491 2751
1997-98 2579 595 3174
1998-99 3213 780 3993
1999-00 4106 906 5012
2000-01 4322 969 5291
2001-02 5070 907 5977
2002-03 5410 1111 6521
2003-04 5564 1292 6856
2004-05 (RE) 6944 956 7900
2005-06 (BE) 8711 986 9697
Source: Annexure 3.2 and 3.3, Expenditure Budget Volume 1, 2005-06.
28
Table 5.2: Selected Health Indicators
(Person/years)
Indicators 1981 1991 Current Level
Crude Birth Rate (per 1000 Population) 33.9 29.5 25 (2002)
Crude Death Rate (per 1000 Population) 12.5 9.8 8.1 (2002)
Total Fertility Rate (TFR) (per woman) 4.5 3.6 3.1 (2001)
Maternal Mortality Rate (MMR) (per 100,000 live births) NA 437 (NFHS) 407 (1998)
(1992-93)
Infant Mortality Rate (IMR) (per 1000 live births) 110 80 63 (2002)
Child (0-4 years) Mortality Rate (per 1000 children) in 41.2 26.5 19.3 (2001)
0-4 age group)
Life Expectancy at Birth:
Male 54.1 59.7 (1991-95) 63.9 (2001-06)
Female 54.7 60.9 (1991-95) 66.9 (2001-06)
Source: Adapted from Economic Survey 2004-05, Table 10.9.
Note: The dates in the brackets indicate years for which latest information is available.
NFHS: National Family Health Survey; NA: Not Available.
Table 6.1: Budgetary Allocations for the welfare of Scheduled Castes,
Scheduled Tribes and Other Backward Classes
Plan Non-Plan Total Col-2 as a Col-3 as a Col-4 as a
Expenditure Expenditure Expenditure proportion of proportion of proportion of
Year on SCs, on SCs, on SCs, total plan total non-plan total (plan
STs & OBCs STs & OBCs STs & OBCs expenditure expenditure and non-plan)
(in Rs. Crore) (in Rs. Crore) (in Rs. Crore) expenditure
1998-99 RE 1602.18 52.26 1654.44 2.23 0.03 0.62
1999-00 RE 1159.32 55.04 1214.36 1.51 0.03 0.43
2000-01 RE 1172.7 52.86 1225.56 1.33 0.02 0.36
2001-02 RE 1239.67 58.23 1297.9 1.24 0.02 0.35
2002-03 RE 1225 58.88 1283.88 1.08 0.02 0.26
2003-04 RE 1250 62.54 1312.54 1.03 0.02 0.30
2004-05 RE 1350 65 1415 0.93 0.02 0.30
2005-06 BE 1533.7 66 1599.7 1.07 0.02 0.43
Source: Expenditure Budget, Vol-2, Union Budget for various years
29
Table 7.1: Budgetary Allocations for the Welfare of Women and Children
Plan Non-Plan Total Col-2 as a Col-3 as a Col-4 as a
Expenditure Expenditure Expenditure proportion of proportion of proportion of
Year on Women & on Women & on Women & Total plan Total Non-Plan Total (plan
Child welfare Child welfare Child welfare Expenditure Expenditure and non-plan)
(in Rs. Crore) (in Rs. Crore) (in Rs. Crore) expenditure
1996-97 RE 847.07 48 895.07 1.543 0.033 0.442
1997-98 RE 1025.95 48.12 1074.04 1.692 0.028 0.457
1998-99 RE 1134.48 45.45 1179.93 1.576 0.023 0.440
1999-00 RE 1249.86 48.21 1298.07 1.623 0.023 0.457
2000-01 RE 1350.55 49.59 1400.14 1.533 0.020 0.414
2001-02 RE 1650 53.79 1703.79 1.648 0.020 0.454
2002-03 RE 2085 53.41 2138.41 1.837 0.018 0.436
2003-04 RE 2150 53.91 2203.91 1.777 0.017 0.502
2004-05 RE 2400 54.19 2454.19 1.648 0.016 0.514
2005-06 BE 3875.29 55.82 3931.11 2.701 0.015 1.048
Table 8.1: Population of India
As on October 1 of Population in Crore
1990-91 83.9
1991-92 85.5
1992-93 87.3
1993-94 88.9
1994-95 90.7
1995-96 92.5
1996-97 94.4
1997-98 96.2
1998-99 98.1
1999-00 100.1
2000-01 101.9
2001-02 103.7
2002-03 105.5
2003-04 107.3
2004-05 109.2
2005-06 111.1
Source: Economic Survey 2004-05, GOI
Notes: Population Growth Rate of 1.98 % per annum for the years from 1990-91 till 1999-00 has been used, while a
growth rate of 1.75 % per annum has been used for the years from 1999-00 to 2005-06.

30
Source: Economic Survey 2004-05, GOI
Notes: * Extrapolated using 6.9% as the growth rate of GDP and a 6% rate of inflation.# Extrapolated assuming a 7 % growth of GDP and a 6% rate of inflation
Table 8.2: GDP at current Market Prices
Year GDP at mp (in Rs Crore)
1991-92 653117
1992-93 748367
1993-94 859220
1994-95 1012770
1995-96 1188012
1996-97 1368209
1997-98 1522547
1998-99 1740985
1999-00 1936831
2000-01 2089500
2001-02 2271984
2002-03 2463324
2003-04 2760025
2004-05* 3127494
2005-06# 3547204

31
Table 8.3: Wholesale Price Indices - all commodities, all India
Average of Weeks WPI Price Deflator CPIal
Price Deflator
in the Year for CPIal
1991-92 83.8 1.19 — —
1992-93 92.3 1.08 — —
1993-94 100 1 — —
1994-95 112.6 0.88 — —
1995-96 121.6 0.82 234 1.00
1996-97 127.2 0.78 256 0.91
1997-98 132.8 0.75 264 0.89
1998-99 140.7 0.71 293 0.80
1999-00 145.3 0.68 306 0.76
2000-01 155.7 0.64 305 0.77
2001-02 161.3 0.62 309 0.76
2002-03 166.8 0.6 319 0.73
2003-04 175.9 0.57 331 0.71
2004-05* 186.6 0.53 338$ 0.69
2005-06# 197.8 0.51 345$ 0.68
Source: Economic Survey 2004-05, GOI
Note: WPI stands for Wholesale Price Index all India for all commodities and CPIAL
stands for Consumer Price Index
for agricultural labourers.$ Projected on the basis of previous years’ estimates
*Average of first 39 weeks of 2004-05# Estimated assuming a 6% rate of inflation

FOR MORE INFORMATION, CONTACT:
Centre for Budget and Governance Accountability(A programme of NCAS) B 64, Second Floor, Sarvodaya Enclave, New Delhi – 110 017, IndiaTelefax: 91-11-26537603 Email: [email protected]
cbgaNational Centre for Advocacy StudiesSerenity Complex, Ramnagar Colony, Pune – 411 021, Maharashtra, IndiaTelefax: 91-20-22952003 / 4 Email: [email protected] Website: www.ncasindia.org (f
or p
rivat
e ci
rcul
atio
n on
ly)
Non-Plan Assistance to
Sate & UT Govts.
6 paise
State & UT Plan
Assistance
5 paise
Central Plan
18 paise
Interest
22 paise
Defence
14 paise
Subsidies
7 paise
Other Non-Plan
Expenditure
12 paise
States’ share of
Taxes & Duties
16 paise