state water project operations data€¦ · 19 governor edmund g. brown california aqueduct, ......
TRANSCRIPT

State of California The Resources Agency
DEPARTMENT OF WATER RESOURCES Division of Operations and Maintenance
STATE WATER PROJECT OPERATIONS DATA
For the month of: July 2016
Edmund G. Brown Jr. Governor
State of California
John Laird Secretary for Resources The Resources Agency
Grant Davis Director
Department of Water Resources

This monthly report of operational data for the State Water Project (SWP) has been published since January 1965. Monthly SWP Operations Data Reports from January 1990 have been made available on the Internet at www.water.ca.gov/swp/operationscontrol/projectwide.cfm. It provides the State Water Contractors, public agencies, consultants, and others with the daily and monthly status of SWP's water and power operations.
Please note that this report contains data that is preliminary and subject to revisions.
Printed copies of these reports may be available for a fee.
For details, please contact:
State of California Department of Water Resources
P.O. Box 942836 Sacramento, CA 94236-0001
Or call the DWR Publications Desk at (916) 653-1079
Please direct questions and comments regarding the contents of this report to the Regulatory Compliance and Reporting Branch, Reporting Section at (916) 574-2677.

State of California The Resources Agency
DEPARTMENT OF WATER RESOURCES Division of Operations and Maintenance
STATE WATER PROJECT OPERATIONS DATA
For the month of: July 2016
Edmund G. Brown Jr. Governor
State of California
John Laird Secretary for Resources The Resources Agency
Grant Davis Director
Department of Water Resources

ii
State of California EDMUND G. BROWN JR., Governor
The Resources Agency JOHN LAIRD, Secretary for Resources
Department of Water Resources Grant Davis, Director
Department of Water Resources Cindy Messer, Chief Deputy Director
JOEL LEDESMA
Deputy Director
GARY BARDINI
Deputy Director
CHRISTY JONES
Deputy Director
VACANT
Deputy Director
KATHIE KISHABA
Deputy Director
TARYN RAVAZZINI
Deputy Director
DIVISION OF OPERATIONS AND MAINTENANCE
David Duval .......................................................................... Chief, Division of Operations and Maintenance
This report was prepared under the direction of
Vacant .......................................................................................................... Chief, Operations Control Office
Molly White ................................................................................ Principal Engineer, Water Operations Office
Tracy Hinojosa .................................. Supervising Engineer, Regulatory Compliance and Reporting Branch
Vacant ...................................................................................... Senior Engineer, Data Management Section
By the Reporting Section
Mary Valdez ................................................................................................ Section Chief, Reporting Section
Clay Thomas ............................................................... Water Resources Engineering Associate (Specialist)
Edna Smith .................................................................. Water Resources Engineering Associate (Specialist)
Vacant ........................................................................ Water Resources Engineering Associate (Specialist)
The organization shown above represents staff and positions relevant to this report as of month of
publication, December 2017. It is the Department’s policy to not show staff in “Acting” or
“Temporary” positions.

iii
Table of Contents
Page
Organization Page ............................................................................................................................... ii
Table of Contents ............................................................................................................................... iii
Monthly Highlights .............................................................................................................................. 1
Oroville Field Division Water Operations
Table Page
1 Antelope Lake, Daily Operation .......................................................................................................... 2
2 Frenchman Lake, Daily Operation ...................................................................................................... 3
3 Lake Davis, Daily Operation ............................................................................................................... 4
4 Lake Oroville, Daily Operation ............................................................................................................ 5
5 Thermalito Forebay, Including Diversion Pool and Power Canal, Daily Operation ............................ 6
6 Thermalito Afterbay, Daily Operation ................................................................................................. 7
7 Oroville-Thermalito Complex, Water Temperature Data ................................................................... 8
Delta Field Division Water Operations
8 North Bay Aqueduct, Delta Field Division .......................................................................................... 9
9 Delta Field Division Plant Data ......................................................................................................... 10
10 Clifton Court Forebay, Daily Operation of Gates .............................................................................. 11
11 Governor Edmund G. Brown California Aqueduct, Delta Field Division, Monthly Deliveries ................................................................................................... 12
12 South Bay Aqueduct, Delta Field Division, Monthly Deliveries ........................................................ 13
13 Lake Del Valle, Daily Operation ....................................................................................................... 14
San Luis Field Division Water Operations
14 Consolidated State-Federal O'Neill Forebay, Daily Operations ....................................................... 15
15 Consolidated State-Federal San Luis Reservoir, Daily Operations ................................................. 16
16 San Luis Field Division Plant Data ................................................................................................... 17
17 Consolidated State-Federal Los Banos Reservoir, Daily Operations .............................................. 18
18 Consolidated State-Federal Little Panoche Reservoir, Daily Operations ........................................ 19
19 Governor Edmund G. Brown California Aqueduct, San Luis Field Division, Monthly Deliveries .................................................................................................................. 20
20 Consolidated State-Federal San Luis Canal, Daily Operations ....................................................... 22
San Joaquin Field Division Water Operations
21 San Joaquin Field Division Plant Data ............................................................................................. 23
22 Governor Edmund G. Brown California Aqueduct, San Joaquin Field Division, Monthly Deliveries .................................................................................................................. 24
23 Governor Edmund G. Brown California Aqueduct, San Joaquin Field Division, Monthly Deliveries (Coastal Branch) ...................................................................................... 27

iv
Southern Field Division Water Operations
24 Southern Field Division Plant Data ................................................................................................... 28
25 Pyramid Lake, Daily Operation ......................................................................................................... 29
26 Elderberry Forebay, Daily Operation ................................................................................................ 30
27 Castaic Lake, Daily Operation .......................................................................................................... 31
28 Governor Edmund G. Brown California Aqueduct, Southern Field Division,
Monthly Deliveries (West Branch) .......................................................................................... 32
29 Silverwood Lake, Daily Operation .................................................................................................... 33
30 Lake Perris, Daily Operation ............................................................................................................ 34
31 Governor Edmund G. Brown California Aqueduct, Southern Field Division,
Monthly Deliveries (East Branch) ........................................................................................... 35
Water Quality Operations
32 Water Quality at Selected SWP Locations ....................................................................................... 37
33 Water Quality at Selected Delta Stations ......................................................................................... 38
34 Pesticides, Herbicides, and Other Organic Substances Detected in the SWP ................................ 39
Energy Operations
35 Oroville and Delta Field Divisions Energy Data ............................................................................... 40
36 San Luis Field Division Energy Data ................................................................................................ 41
37 San Joaquin Field Division Pumping Plant Energy Load Data ........................................................ 42
38 Southern Field Division Energy Data ............................................................................................... 43

MONTHLY HIGHLIGHTS
The following activities, actions, and conditions affected State Water Project (SWP) operations during July 2016:
Statewide precipitation was about 110 percent of average for water year 2015−2016 through July 31. Precipitation percentages are used in this report to express historical and regional comparisons. Additional and more specific information is available on the internet at: “http://cdec.water.ca.gov/snow_rain.html”.
Snowpack data is compiled four times annually, for the months of January, February, March, and April, by the California Department of Water Resources (DWR) in Bulletin 120. The Bulletin also contains forecasts of seasonal runoff volume from the State's major watersheds, summaries of precipitation, and reservoir storages in various regions of the State. July snowpack data is not available.
Cumulative unimpaired runoff for the Sacramento River Region for water year 2015−2016 was 16.8 maf, 96 percent of average. Statewide runoff for water year 2015−2016 was 95 percent of average.
Statewide reservoir storage was 85 percent of average to date. Total storage in major SWP reservoirs at the end of July was 3.03 maf compared to 2.05 maf at this time in 2015. On July 31, end-of-month storage at Lake Oroville was 2.33 maf, compared to 1.16 maf at this time in 2015. The State share of San Luis Reservoir’s end-of-month storage was 155 taf, compared to 481 taf at this time in 2015. The combined storage in SWP’s southern reservoirs was 537 taf, compared to 412 taf at this time in 2015.
The cumulative California State Water Project deliveries to date through July were 1.42 maf, excluding Oroville Field Division (OFD). Total deliveries through this same period in 2015 were 950 taf. The cumulative OFD deliveries to date through July were 547 taf. Total OFD deliveries through this same period in 2015 were 414 taf. Water deliveries are a combination of project, transfer, and exchange classifications.
By mutual agreement between the U.S. Bureau of Reclamation (USBR) and DWR in accordance with Article 6(h) of the Coordinated Operation Agreement (COA), conditions remained “Balanced” with accounting throughout July. “Balanced” conditions exist when DWR and USBR agree that releases from upstream reservoirs plus unregulated flow approximately equal the water supply needed to meet Sacramento Valley in-basin uses, plus exports. The end-of-month USBR COA balance was 58,269 cfs in favor of DWR.
There were no measurable earthquakes that occurred during the month of July.
During the month of July, there were no reports on fish salvage.
On July 3, Barker Slough Pumping Plant (PP) Unit 4 was made available after being forced out of service on July 2 for a low slump alarm. On July 6, Banks PP Unit 6 was made available after being forced out of service on July 5 due to a man door leak. On July 6, Cherry Valley Pump Station (PS) Unit 1 was made available after being forced out of service on July 2 due to a variable frequency drive cooling fan failure. On July 7, Greenspot (PS) Unit 4 was made available after being forced out of service on July 5 due to variable frequency drive controller board issues. On July 8, Cherry Valley (PS) Unit 1 was made available after being forced out of service on July 7 due to variable frequency drive failure. On July 13, Barker Slough (PP) Unit 3 was made available after being forced out of service on low forebay level. On July 14, Gianelli (PGP) Units 1 and 2 were made available after being scheduled out of service on July 12 for Penstock repair.. On July 18, South Bay (PP) Unit 13 was made available after being forced out of service on July 17 due to excitation problems. On July 20, Oso (PP) Unit 1 was made available after being forced out of service on July 11 due to trash rack problems. On July 25, Edmonston (PP) Unit 8 was made available after tripping that morning due to motor acceleration trouble.
1

Table 1. Antelope LakeDaily Operation
(in acre-feet except as noted)
Capacity: 22,566 ac-ft
Outflow in cfs
Regulated Release
Jun 30 5,001.33 21,947
1 5,001.27 21,893 -54 20 0 0 0 10 30 3
2 5,001.22 21,847 -46 20 0 0 0 10 30 7
3 5,001.17 21,802 -45 20 0 0 0 10 30 7
4 5,001.12 21,756 -46 20 0 0 0 10 30 7
5 5,001.09 21,729 -27 20 0 0 0 10 15 1
6 5,001.02 21,665 -64 20 0 0 0 10 33 1
7 5,000.97 21,620 -45 20 0 0 0 10 30 7
8 5,000.89 21,548 -72 20 0 0 0 10 37 1
9 5,000.84 21,503 -45 20 0 0 0 10 30 7
10 5,000.79 21,458 -45 20 0 0 0 10 30 7
11 5,000.74 21,413 -45 20 0 0 0 10 30 7
12 5,000.69 21,368 -45 20 0 0 0 10 30 7
13 5,000.64 21,323 -45 20 0 0 0 10 30 7
14 5,000.60 21,287 -36 20 0 0 0 10 19 1
15 5,000.51 21,206 -81 20 0 0 0 10 42 1
16 5,000.45 21,253 47 20 0 0 0 10 22 46
17 5,000.40 21,108 -145 20 0 0 0 10 74 1
18 5,000.34 21,054 -54 20 0 0 0 10 30 3
19 5,000.27 20,992 -62 20 0 0 0 10 32 1
20 5,000.23 20,957 -35 20 0 0 0 10 30 12
21 5,000.18 20,912 -45 20 0 0 0 10 30 7
22 5,000.05 20,797 -115 20 0 0 0 18 60 2
23 5,000.00 20,753 -44 20 0 0 0 20 23 1
24 4,999.94 20,692 -61 20 0 0 0 20 40 9
25 4,999.89 20,647 -45 20 0 0 0 20 24 1
26 4,999.84 20,603 -44 20 0 0 0 20 23 1
27 4,999.78 20,550 -53 20 0 0 0 20 28 1
28 4,999.71 20,488 -62 20 0 0 0 15 35 4
29 4,999.62 20,409 -79 20 0 0 0 15 41 1
30 4,999.55 20,348 -61 20 0 0 0 15 35 4
31 4,999.49 20,295 -53 20 0 0 0 15 35 8
Total cfs-days 620 0 0 0 388 1,008 175
Total ac-ft -1,652 1,230 0 0 0 769 1,999 347
July 2016
Date
Water
Surface
Elevation
(in feet)
StorageStorage
ChangeStream-
flow
Maint.
Water
Supply
Contract
Water
Right
Computed
Inflow
(cfs) Spill
Estimated
Evaporation
And
Seepage
Total
Outflow
2

Daily Operation
(in acre-feet except as noted)
Capacity: 55,477 ac-ft
Outflow in cfs
Regulated Release
Jun 30 5,561.99 23,268
1 5,561.93 23,212 -56 2 15 0 0 11 28 0
2 5,561.86 23,148 -64 2 15 0 0 15 32 0
3 5,561.80 23,092 -56 2 15 0 0 11 28 0
4 5,561.74 23,037 -55 2 15 0 0 11 28 0
5 5,561.63 22,937 -100 2 42 0 0 6 50 0
6 5,561.51 22,867 -70 2 42 0 0 0 44 9
7 5,561.38 22,708 -159 2 42 0 0 36 80 0
8 5,561.26 22,599 -109 2 42 0 0 11 55 0
9 5,561.13 22,481 -118 2 42 0 0 15 59 0
10 5,560.99 22,354 -127 2 42 0 0 20 64 0
11 5,560.88 22,255 -99 2 33 0 0 15 50 0
12 5,560.78 22,165 -90 2 33 0 0 10 45 0
13 5,560.68 22,076 -89 2 33 0 0 10 45 0
14 5,560.62 22,022 -54 2 3 0 0 22 27 0
15 5,560.56 21,968 -54 2 16 0 0 9 27 0
16 5,560.49 21,906 -62 2 16 0 0 13 31 0
17 5,560.41 21,835 -71 2 16 0 0 18 36 0
18 5,560.35 21,781 -54 2 9 0 0 16 27 0
19 5,560.28 21,719 -62 2 18 0 0 11 31 0
20 5,560.20 21,648 -71 2 20 0 0 14 36 0
21 5,560.13 21,586 -62 2 11 0 0 18 31 0
22 5,560.08 21,542 -44 2 11 0 0 9 22 0
23 5,560.03 21,498 -44 2 14 0 0 6 22 0
24 5,559.97 21,445 -53 2 14 0 0 11 27 0
25 5,559.87 21,357 -88 2 38 0 0 4 44 0
26 5,559.76 21,262 -95 2 33 0 0 13 48 0
27 5,559.63 21,147 -115 2 49 0 0 7 58 0
28 5,559.49 21,025 -122 2 49 0 0 11 62 0
29 5,559.34 20,895 -130 2 52 0 0 12 66 0
30 5,559.17 20,748 -147 2 52 0 0 20 74 0
31 5,559.01 20,610 -138 2 52 0 0 16 70 0
Total cfs-days 62 884 0 0 400 1,347 6
Total ac-ft -2,658 123 1,753 0 0 794 2,670 12
1/ Last Chance Creek Water District.
2/ Negative inflows are a result of skewed water surface elevation.
Computed
Inflow
(cfs)
2/
Spill
Estimated
Evaporation
And
Seepage
Total
Outflow
Table 2. Frenchman Lake
Date
Water
Surface
Elevation
(in feet)
StorageStorage
Change
July 2016
Stream-
flow
Maint.
Water
Supply
Contract
Water
Right
1/
3

Daily Operation (in acre-feet except as noted)
Capacity: 84,371 ac-ft
Outflow in cfsRegulated Release
Jun 30 5,766.66 54,378 1 5,766.63 54,283 -95 10 2 1 0 36 49 1 2 5,766.60 54,189 -94 10 2 1 0 34 47 0 3 5,766.57 54,094 -95 10 2 1 0 51 64 17 4 5,766.54 54,000 -94 10 2 1 0 34 47 0 5 5,766.51 53,906 -94 10 2 1 0 34 47 0 6 5,766.48 53,811 -95 10 2 1 0 34 47 0 7 5,766.45 53,717 -94 10 2 1 0 35 48 1 8 5,766.42 53,623 -94 10 2 1 0 35 48 1 9 5,766.38 53,498 -125 10 2 1 0 50 63 0
10 5,766.35 53,404 -94 10 2 1 0 35 48 1 11 5,766.32 53,311 -93 10 2 1 0 33 46 0 12 5,766.29 53,217 -94 10 2 1 0 34 48 0 13 5,766.27 53,155 -62 10 2 1 0 45 59 28 14 5,766.24 53,062 -93 10 2 1 0 33 47 0 15 5,766.21 52,968 -94 10 2 1 0 48 62 14 16 5,766.19 52,906 -62 10 2 1 0 48 62 31 17 5,766.15 52,789 -117 10 2 1 0 46 60 1 18 5,766.10 52,627 -162 10 2 1 0 68 81 0 19 5,766.07 52,534 -93 10 2 1 0 50 63 17 20 5,766.05 52,472 -62 10 2 1 0 62 75 44 21 5,766.01 52,349 -123 10 2 1 0 50 63 1 22 5,766.98 52,256 -93 10 2 1 0 62 75 29 23 5,766.95 52,164 -92 10 2 1 0 44 57 12 24 5,766.93 52,102 -62 10 2 1 0 30 43 12 25 5,766.90 52,010 -92 10 2 1 0 33 47 0 26 5,766.87 51,918 -92 10 2 1 0 44 58 12 27 5,766.84 51,826 -92 10 2 1 0 62 76 30 28 5,766.81 51,734 -92 10 2 1 0 44 58 12 29 5,766.78 51,642 -92 10 2 1 0 38 51 5 30 5,766.75 51,550 -92 10 2 1 0 63 76 30 31 5,765.72 51,459 -91 10 2 1 0 32 45 0
Total cfs-days 310 66 44 0 1,347 1,767 299 Total ac-ft -2,919 615 131 87 0 2,672 3,505 586
2/ Includes Plumas County Flood Control & Water Conservation District and Grizzly Ranch.
3/ Negative inflows are a result of skewed water surface elevation.
4
1/ Includes unclassified non-project diversions to local agencies (Valberde and Ramelli).
Table 3. Lake Davis
Date
WaterSurface
Elevation(in feet)
Storage StorageChange
July 2016
Stream-flow
Maint.
WaterRight
1/
WaterSupply
Contract2/
ComputedInflow(cfs)
3/
Spill
EstimatedEvaporation
And Seepage
TotalOutflow
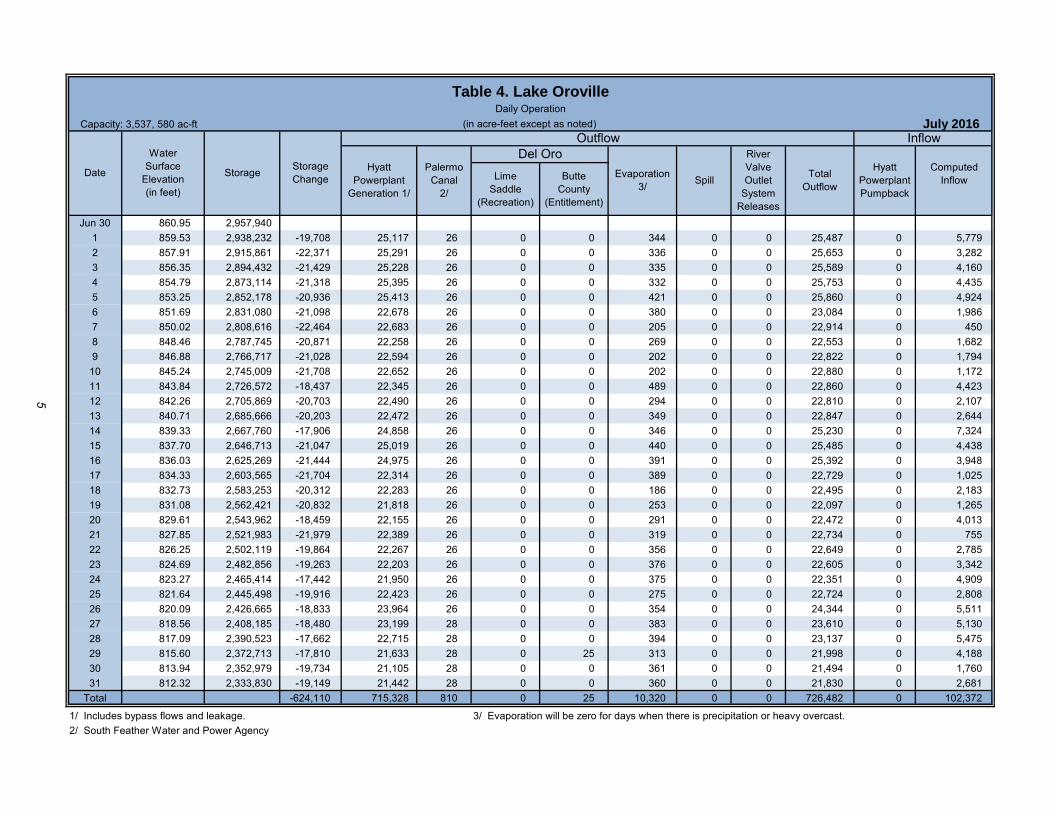
Capacity: 3,537, 580 ac-ft
Lime
Saddle
(Recreation)
Butte
County
(Entitlement)
Jun 30 860.95 2,957,940
1 859.53 2,938,232 -19,708 25,117 26 0 0 344 0 0 25,487 0 5,779
2 857.91 2,915,861 -22,371 25,291 26 0 0 336 0 0 25,653 0 3,282
3 856.35 2,894,432 -21,429 25,228 26 0 0 335 0 0 25,589 0 4,160
4 854.79 2,873,114 -21,318 25,395 26 0 0 332 0 0 25,753 0 4,435
5 853.25 2,852,178 -20,936 25,413 26 0 0 421 0 0 25,860 0 4,924
6 851.69 2,831,080 -21,098 22,678 26 0 0 380 0 0 23,084 0 1,986
7 850.02 2,808,616 -22,464 22,683 26 0 0 205 0 0 22,914 0 450
8 848.46 2,787,745 -20,871 22,258 26 0 0 269 0 0 22,553 0 1,682
9 846.88 2,766,717 -21,028 22,594 26 0 0 202 0 0 22,822 0 1,794
10 845.24 2,745,009 -21,708 22,652 26 0 0 202 0 0 22,880 0 1,172
11 843.84 2,726,572 -18,437 22,345 26 0 0 489 0 0 22,860 0 4,423
12 842.26 2,705,869 -20,703 22,490 26 0 0 294 0 0 22,810 0 2,107
13 840.71 2,685,666 -20,203 22,472 26 0 0 349 0 0 22,847 0 2,644
14 839.33 2,667,760 -17,906 24,858 26 0 0 346 0 0 25,230 0 7,324
15 837.70 2,646,713 -21,047 25,019 26 0 0 440 0 0 25,485 0 4,438
16 836.03 2,625,269 -21,444 24,975 26 0 0 391 0 0 25,392 0 3,948
17 834.33 2,603,565 -21,704 22,314 26 0 0 389 0 0 22,729 0 1,025
18 832.73 2,583,253 -20,312 22,283 26 0 0 186 0 0 22,495 0 2,183
19 831.08 2,562,421 -20,832 21,818 26 0 0 253 0 0 22,097 0 1,265
20 829.61 2,543,962 -18,459 22,155 26 0 0 291 0 0 22,472 0 4,013
21 827.85 2,521,983 -21,979 22,389 26 0 0 319 0 0 22,734 0 755
22 826.25 2,502,119 -19,864 22,267 26 0 0 356 0 0 22,649 0 2,785
23 824.69 2,482,856 -19,263 22,203 26 0 0 376 0 0 22,605 0 3,342
24 823.27 2,465,414 -17,442 21,950 26 0 0 375 0 0 22,351 0 4,909
25 821.64 2,445,498 -19,916 22,423 26 0 0 275 0 0 22,724 0 2,808
26 820.09 2,426,665 -18,833 23,964 26 0 0 354 0 0 24,344 0 5,511
27 818.56 2,408,185 -18,480 23,199 28 0 0 383 0 0 23,610 0 5,130
28 817.09 2,390,523 -17,662 22,715 28 0 0 394 0 0 23,137 0 5,475
29 815.60 2,372,713 -17,810 21,633 28 0 25 313 0 0 21,998 0 4,188
30 813.94 2,352,979 -19,734 21,105 28 0 0 361 0 0 21,494 0 1,760
31 812.32 2,333,830 -19,149 21,442 28 0 0 360 0 0 21,830 0 2,681
Total -624,110 715,328 810 0 25 10,320 0 0 726,482 0 102,372
1/ Includes bypass flows and leakage. 3/ Evaporation will be zero for days when there is precipitation or heavy overcast.
2/ South Feather Water and Power Agency
Table 4. Lake Oroville
Inflow
Daily Operation
(in acre-feet except as noted) July 2016
Date
Water
Surface
Elevation
(in feet)
StorageStorage
Change
Outflow
Total
Outflow
Hyatt
Powerplant
Pumpback
River
Valve
Outlet
System
Releases
Computed
Inflow
Hyatt
Powerplant
Generation 1/
Palermo
Canal
2/
Del Oro
Evaporation
3/Spill
5

Capacity: 25,120 ac-ft
Inflow Outflow
Lake
Oroville
Releases
2/
Kelly
Ridge
Generation
Thermalito
Pumping-
Generating Plant
Pumpback
Thermalito
Pumping-
Generating Plant
Generation
3/
Butte
County
Cal Water
Thermalito
Water and
Sewer
Releases
To
River
4/
Hyatt
Powerplant
Pumpback
Jun 30 24,521
1 24,568 47 25,117 382 0 15,868 12 6 8,113 0 -1,453
2 24,650 82 25,291 370 0 15,868 12 6 8,212 0 -1,481
3 24,640 -10 25,228 288 0 15,868 12 6 8,152 0 -1,488
4 24,785 145 25,395 318 0 15,868 12 6 8,132 0 -1,550
5 24,927 142 25,413 308 0 15,868 12 6 8,172 0 -1,521
6 24,929 2 22,678 288 0 15,868 12 6 8,192 0 1,114
7 25,073 144 22,683 288 0 15,868 12 7 8,192 0 1,252
8 24,869 -204 22,258 281 0 15,868 12 7 8,172 0 1,316
9 25,075 206 22,594 293 0 15,868 12 7 8,192 0 1,398
10 25,221 146 22,652 292 0 15,868 11 7 8,212 0 1,300
11 25,098 -123 22,345 280 0 15,868 11 7 8,152 0 1,290
12 25,193 95 22,490 318 0 15,868 11 7 8,132 0 1,305
13 25,251 58 22,472 390 0 15,868 11 7 8,172 0 1,254
14 25,022 -229 24,858 469 0 15,868 11 7 8,132 0 -1,538
15 25,227 205 25,019 469 0 15,868 11 7 8,113 0 -1,284
16 25,333 106 24,975 431 0 15,868 11 7 8,132 0 -1,282
17 25,358 25 22,314 472 0 15,868 11 7 8,152 0 1,277
18 25,294 -64 22,283 471 0 15,868 11 7 8,152 0 1,220
19 25,181 -113 21,818 471 0 15,868 11 7 8,172 0 1,656
20 25,133 -48 22,155 472 0 15,868 11 7 8,113 0 1,324
21 25,282 149 22,389 472 0 15,868 11 7 8,132 0 1,306
22 25,284 2 22,267 472 0 15,868 11 7 8,152 0 1,301
23 25,295 11 22,203 472 0 15,868 11 7 8,132 0 1,354
24 24,945 -350 21,950 472 0 15,868 11 7 8,251 0 1,365
25 25,204 259 22,423 449 0 15,868 11 7 8,170 0 1,443
26 25,341 137 23,964 459 0 15,207 11 7 8,113 0 -948
27 25,214 -127 23,199 469 0 14,876 11 7 8,152 0 -749
28 24,532 -682 22,715 469 0 14,876 11 7 8,210 0 -762
29 25,112 580 21,633 475 0 14,876 11 7 8,170 0 1,536
30 25,127 15 21,105 474 0 14,876 11 7 8,170 0 1,500
31 25,264 137 21,442 415 0 14,876 11 7 8,230 0 1,404
Total 743 715,328 12,449 0 486,287 350 211 253,045 0 12,859
1/ Sum of Thermalito Forebay and Diversion Pool. 3/ Includes Bypass flows at Thermalito.
2/ Sum of releases from Lake Oroville through Hyatt plant, and spill. 4/ The sum of the flows from fish barrier dam and the fish hatchery.
Table 5. Thermalito ForebayIncluding Diversion Pool and Power Canal
Daily Operation(in acre-feet except as noted) July 2016
DateStorage
1/
Storage
Change
Losses (-)
And
Gains (+)
6

Table 6. Thermalito AfterbayDaily Operation
(in acre-feet except as noted)
Capacity: 57,040 ac-ft
Inflow Outflow
Thermalito
Pumping-
Generating Plant
Generation
1/
Sutter
Butte
Canal
Western
Canal
Lateral
Richvale
Canal
Western
Canal
Afterbay
River
Outlet
Thermalito
Pumping-
Generating Plant
Pumpback
Jun 30 135.30 51,974
1 135.30 51,974 0 15,868 2,936 17 726 1,967 9,977 0 -245 18,090
2 135.31 52,016 42 15,868 2,995 18 720 1,937 9,997 0 -159 18,209
3 135.30 51,974 -42 15,868 3,015 23 714 1,973 9,997 0 -188 18,149
4 135.28 51,891 -83 15,868 3,015 23 714 2,003 9,977 0 -219 18,109
5 135.29 51,933 42 15,868 3,035 23 714 2,003 9,977 0 -74 18,149
6 135.29 51,933 0 15,868 3,035 23 698 2,062 9,918 0 -133 18,110
7 135.32 52,057 124 15,868 3,015 25 681 2,102 9,937 0 16 18,129
8 135.29 51,933 -124 15,868 3,094 25 696 2,142 9,937 0 -97 18,109
9 135.26 51,809 -124 15,868 3,134 25 726 2,181 9,937 0 11 18,129
10 135.19 51,520 -289 15,868 3,154 25 734 2,182 9,937 0 -125 18,149
11 135.18 51,479 -41 15,868 3,114 25 732 2,122 9,897 0 -19 18,049
12 135.18 51,479 0 15,868 3,134 25 734 2,103 9,897 0 24 18,029
13 135.18 51,479 0 15,868 3,114 23 734 2,122 9,897 0 22 18,069
14 135.17 51,437 -42 15,868 3,134 21 718 2,142 9,897 0 2 18,029
15 135.16 51,396 -41 15,868 3,134 29 692 2,162 9,917 0 25 18,030
16 135.15 51,355 -41 15,868 3,094 35 698 2,142 9,937 0 -2 18,069
17 135.18 51,479 124 15,868 3,094 35 704 2,122 9,937 0 149 18,089
18 135.13 51,273 -206 15,868 3,094 33 688 2,103 9,897 0 -259 18,049
19 135.11 51,191 -82 15,868 3,074 31 677 2,083 9,877 0 -208 18,049
20 135.15 51,355 164 15,868 3,055 29 659 2,083 9,917 0 38 18,030
21 135.19 51,520 165 15,868 3,035 29 655 2,063 9,957 0 35 18,089
22 135.22 51,644 124 15,868 2,995 29 655 2,083 9,937 0 -46 18,089
23 135.28 51,891 247 15,868 2,956 29 657 2,083 9,937 0 40 18,069
24 135.35 52,181 290 15,868 2,916 29 655 2,063 9,957 0 41 18,208
25 135.38 52,306 125 15,868 2,896 31 653 2,003 9,857 0 -303 18,027
26 135.25 51,767 -539 15,207 2,916 31 655 2,003 9,996 0 -145 18,109
27 134.97 50,617 -1,150 14,876 2,936 31 655 2,023 9,897 0 -485 18,049
28 134.57 48,993 -1,624 14,876 2,936 31 655 2,023 9,857 0 -999 18,067
29 134.27 47,791 -1,202 14,876 2,936 31 655 1,984 9,897 0 -576 18,067
30 134.11 47,155 -636 14,876 2,916 29 655 1,922 9,937 0 -54 18,107
31 133.97 46,602 -553 14,876 2,915 27 655 1,874 9,937 0 -21 18,167
Total -5,372 486,287 93,820 840 21,360 63,860 307,826 0 -3,951 560,871
1/ Includes Bypass flows at Thermalito.
2/ The sum of the flows from the fish barrier dam, fish hatchery, and afterbay river outlet.
July 2016
Losses (-)
and
Gains (+)
Total
Releases
to River
2/
Date
Water
Surface
Elevation
(in feet)
StorageStorage
Change
7

Table 7. Oroville-Thermalito ComplexWater Temperature Data
(in degrees Fahrenheit)
Mean Daily Temperature
Date
Thermalito
Afterbay
Outlet
Fish
Hatchery
1 65.7 60.5
2 65.0 61.2
3 65.8 61.4
4 65.8 62.0
5 65.9 62.2
6 66.6 61.0
7 66.2 56.5
8 66.6 56.9
9 65.5 57.5
10 65.9 58.2
11 65.8 59.8
12 65.8 60.2
13 65.7 60.5
14 65.7 60.9
15 65.2 61.4
16 65.5 61.6
17 64.9 61.7
18 65.3 61.4
19 66.1 62.3
20 66.3 62.8
21 65.6 61.6
22 66.8 57.5
23 67.9 58.3
24 67.1 58.8
25 65.7 59.4
26 65.7 60.1
27 65.9 60.6
28 66.1 60.9
29 66.4 61.3
30 65.4 61.8 Note: Water surface elevations on Table 4 are taken at Oroville Dam at midnight and may differ slightly from31 65.6 61.9 those shown on this table which are normally taken at midday and upstream from Oroville Dam.
July 2016
600
650
700
750
800
850
900
40 45 50 55 60 65 70 75 80 85
Elev
atio
n in
Fee
t
Temperature
Lake Oroville Temperature Profile on July 19, 2016
Water Surface Elevation 832.32 Ft
Structures No. 1 and No. 2 Intake Elevation: 784 feet
9 shutter in place
8

(In acre-feet)
Operating Pool
Beginning and Ending
Barker Slough Pumping
Plant0.17 (Into the North Bay Aqueduct) 5,385
Travis Surge Tank 8.78
8.80Solano County Water Agency Travis
AFB119 119
Solano County Water Agency Fairfield /
Vacaville 24"532 532
Solano County Water Agency Fairfield /
Vacaville 42"1,583 1,583
2 17.00Solano County Water Agency Central
SolanoStub
Cordelia Forebay 21.23 0
Cordelia Pumping Plant &
Cordelia Spillway21.30 3,274
Solano County Water Agency Vallejo 1,146 9 1,137
Solano County Water Agency
Benicia1,172 1,172
Cordelia Surge Tank 23.33 0
Creston Surge Tank
Connection25.65 0
26.95Napa County Flood Control & WCD
American Canyon 26 6
27.27Napa County Flood Control & WCD
American Canyon 30
Napa Terminal Tank 27.58 City of Napa 668 668
27.60Napa County Flood Control & WCD
American Canyon 1282 282
Deliveries
Table 8. North Bay AqueductDelta Field Division, Monthly Deliveries
PermitTable
A
Reach
No.No.
Article
21
Turnout
MileStructure
Total
DiversionsArticle
56C
July 2016
Settlement Water
Balanced Excess
10.54
1
1
3A
2
3B
Napa Pipeline 21.33
9

Table 9. Delta Field Division Plant Data
(in acre-feet)
North Bay Aqueduct California Aqueduct South Bay Aqueduct
Del Valle Pumping Plant
Total SWP Pumped ReleasedInto
Lake
Into
Aqueduct
Gravity Flow
Through Plant
Into Aqueduct
1 112 128 11,816 11,816 0 0 560 0 0 0
2 185 125 14,056 14,056 0 0 580 0 0 0
3 166 111 11,319 11,319 0 0 700 0 0 0
4 165 118 11,942 11,942 0 0 648 0 0 0
5 186 123 12,232 12,232 0 0 299 0 0 0
6 193 122 13,445 13,445 0 0 504 0 0 30
7 185 114 14,728 14,728 0 0 620 0 0 0
8 190 124 14,149 14,149 0 0 570 0 0 0
9 188 121 13,758 13,758 0 0 183 0 0 167
10 181 126 14,091 14,091 0 0 421 0 0 0
11 173 112 14,242 14,242 0 0 594 0 0 0
12 163 100 14,445 14,445 0 0 563 0 0 0
13 183 112 14,056 14,056 0 0 540 0 0 0
14 179 108 13,599 13,599 0 0 539 0 0 0
15 189 102 13,899 13,899 0 0 640 0 0 0
16 186 106 9,284 9,284 0 0 579 0 0 0
17 159 88 6,792 6,792 0 0 42 0 0 0
18 161 95 2,791 2,791 0 0 752 0 0 0
19 152 78 1,304 1,304 0 0 598 0 0 0
20 150 81 2,588 2,588 0 0 215 0 0 0
21 162 83 7,236 7,236 0 0 96 0 0 0
22 183 105 11,475 11,475 0 0 588 0 0 0
23 183 116 11,893 11,893 0 0 634 0 0 92
24 191 117 11,752 11,752 0 0 605 0 0 92
25 171 99 12,818 12,818 0 0 564 0 0 92
26 171 98 13,981 13,981 0 0 631 0 0 92
27 163 82 14,050 14,050 0 0 727 0 0 92
28 174 83 13,881 13,881 0 0 586 0 0 71
29 182 95 14,053 14,053 0 0 580 0 0 77
30 176 97 13,062 13,062 0 0 580 0 0 92
31 183 105 12,532 12,532 0 0 523 0 0 92
Total 5,385 3,274 361,269 361,269 0 0 16,261 0 0 989
July 2016
Date Barker Slough
Pumping
Plant
Cordelia
Pumping
Plant
South Bay
Pumping
Plant
Banks Pumping Plant DMC/CA Intertie (DCI)
10

Opened Closed Opened Closed Opened Closed Opened Closed Opened Closed
1 00:01 01:30 04:30 11:00 14:00 20:30 11,493
2 00:01 02:30 05:15 11:45 13,475
3 00:30 03:15 06:15 12:30 16:00 19:00 11,092
4 00:01 04:15 07:00 13:30 16:30 19:00 12,490
5 00:01 05:15 07:45 14:00 17:00 20:50 12,876
6 00:01 06:00 08:30 14:45 19:10 21:15 13,466
7 00:35 07:00 09:15 15:30 19:15 23:00 14,215
8 00:45 07:45 10:45 16:15 20:15 23:45 14,221
9 00:45 08:45 10:45 17:00 20:00 23:30 14,220
10 00:45 10:00 11:45 16:44 20:45 14,219
11 05:59 08:39 11:00 12:45 17:30 19:44 22:30 14,043
12 02:00 08:00 11:00 22:38 14,234
13 02:45 09:00 12:00 22:06 14,230
14 03:15 09:45 13:00 22:50 14,236
15 00:01 01:15 04:00 10:45 13:45 21:45 14,219
16 00:01 02:00 04:45 11:15 8,284
17 00:01 03:00 05:30 10:20 7,920
18 11:39 12:45 15:45 18:49 1,370
19 01:00 03:45 1,369
20 01:00 04:00 09:10 13:45 3,351
21 00:01 05:00 08:15 14:30 18:05 7,923
22 06:30 09:10 15:00 18:00 11,888
23 07:15 09:45 15:45 18:00 21:30 11,884
24 00:01 08:00 11:30 16:15 19:30 22:30 11,898
25 00:01 09:00 11:45 17:00 20:15 23:40 12,878
26 00:01 06:15 09:30 17:00 19:55 22:15 14,224
27 02:15 08:45 11:45 20:30 14,225
28 02:15 08:45 11:45 20:30 14,221
29 03:15 09:45 12:45 21:08 14,224
30 00:01 01:15 04:15 10:45 13:45 12,873
31 02:30 05:00 11:45 15:15 19:45 12,873
364,134 Total inflow for the month in AF:
Date
Table 10. Clifton Court ForebayDaily Operation of Gates
July 2016Time Amount
of inflow
in Acre-Feet
11

(In acre-feet)
Operating Pool
Beginning and Ending
1A 1.83 Byron-Bethany I.D. 3,023 3,023
1Banks
Pumping Plant3.32 361,269
South Bay
Pumping Plant4.49
Bethany Reservoir
(Into the South Bay Aqueduct)16,261
Check
No. 15.95
8.08Alameda Co. Zone 7 WA
Mountain House Golf Course0
Inflow to California Aqueduct from
Delta Mendota Canal0
Outflow to Delta Mendota Canal from
California Aqueduct0
2Check
No. 212.01
12.47 Musco Olive 41 41
Check
No. 318.29
22.16 Tracy Golf & Country Club 0
Check
No. 423.99
5Check
No. 529.73
6Check
No. 634.24
35.22Turlock Fruit Company
Inflow0
Check
No. 739.91
42.46 Oak Flat Water District-A 65 65
42.9 Western Hills WD 106 106
43.81 Oak Flat Water District-B 110 81 19 10
44.64 Oak Flat Water District-C 104 94 10
Check
No. 845.97
46.18 Oak Flat Water District-D 178 4 170 4
Oak Flat Totals: 457 179 0 0 264 14
Check
No. 951.3
10Check
No. 1056.86
11Check
No. 1161.4
66.14 Veteran's Cemetery 78 78
Check
No. 1266.71 343,004
1
2A
2B
Delta Mendota
Canal - California
Aqueduct Intertie
( DCI )
9.1
9
12
2
3
4
7
8
Table 11. Governor Edmund G. Brown California AqueductDelta Field Division, Monthly Deliveries
Reach
No.
Deliveries
Table
AUSBR
CVP
Supply
Article
56C
Local
(non-
SWP)
Turnout
July 2016
Total
Diver-
sionsNo. Structure Mile
12

(In acre-feet)Operating Pool
Beginning and Ending
South BayPumping Plant
3.17 Granite - Vasco Rd. (Temp.) 0 3.18 Oakland Scavenger Zone 7 10 10
Check No. 1 3.912 Check No. 2 5.21
7.15 Zone 7 Altamont 0 Check Zone 7 Patterson Storage Exchange 0 No. 3 Zone 7 Patterson Project Water 829 829
4 Check No. 4 10.685 Check No. 5 12.29
Zone 7Wente #1
Zone 7Wente #2
IsingProject Water
Check No. 6 14.65Zone 7
Arroyo Mocho Project WaterCheck No. 7 16.38
Zone 7Wente #3
Zone 7Wente #4
Zone 7Norman Nursery
Zone 7Concannon Project Water
Pumped into Lake Del Valle 0 Pumped into South Bay Aqueduct 0 Gravity into South Bay Aqueduct 989
Arroyo Valle #1 & #2Storage Exchange: 182 182
Project Water 420 406 1/ 14 Storage Released 0
Inflow Release 62 62 East Bay Regional Park Dist.
Del Valle RecreationZone 7
Wente #5So. Livermore Project 2,695 2,695
So. Livermore Inflow Released 0 So. Livermore Stored Exchanged 0
19.21 Zone 7 - Kalthrof Detjens 184 184 ACWD Storage Exchange 0 Vallecitos Project Water 0
City of San FranciscoSan Antonio
ACWD - Bayside 1 & 2Project Water 0
Storage Released 0 Storage Exchange: 2,119 2,119
S.C.V.W.D.Meter
1/ This is Table A water for a new turnout in reach 5, Olivina 1.2/ Exchanged Table A water.
rec.
8,879 879 2/ 8,000
0
99 99
8 8
71 71
5 5
119 119
0
1,144 1,144
14.16
14.78
232 232
51 51
0 149
22.50
25.97
28.97
9.49
14.31
7
16.63
18.63
8
Deliveries throughDel Valle
Branch Pipeline
16.57
8
9 35.86
La Costa Tunnel
Mission Tunnel
4
6
5
Del Valle BranchPipeline Junction
19.20
Santa ClaraPipeline
7
13.55
6
July 2016
Table 12. South Bay AqueductDelta Field Division, Monthly Deliveries
0.00
LocalNo.
Other
Deliveries
Article56C
ReachNo.
16.69
16.70
1
Table A
TotalDiver-sionsStructure Mile
Turnout
2
1
(into South Bay Aqueduct) 16,261
13

Table 13. Lake Del ValleDaily Operation
Capacity: 77,111 ac-ft
Inflow Outflow
Jun 30 702.51 39,569
1 702.44 39,519 -49 -33 0 0 0 1 15 16 0.00
2 702.41 39,498 -21 -3 0 0 0 1 17 18 0.00
3 702.39 39,484 -14 4 0 0 0 1 17 18 0.00
4 702.36 39,463 -21 -4 0 0 0 1 16 17 0.00
5 702.34 39,449 -14 4 0 0 0 1 17 18 0.00
6 702.28 39,407 -42 6 0 0 30 1 17 48 0.00
7 702.32 39,435 28 41 0 0 0 1 12 13 0.00
8 702.28 39,407 -28 -13 0 0 0 1 14 15 0.00
9 702.13 39,302 -106 74 0 0 167 0 13 180 0.00
10 701.94 39,169 -133 -117 0 0 0 0 16 16 0.00
11 701.94 39,169 0 15 0 0 0 0 15 15 0.00
12 701.92 39,155 -14 2 0 0 0 0 16 16 0.00
13 701.92 39,155 0 14 0 0 0 0 14 14 0.00
14 701.92 39,155 0 15 0 0 0 0 15 15 0.00
15 701.89 39,134 -21 -1 0 0 0 0 20 20 0.00
16 701.79 39,064 -70 -55 0 0 0 0 15 15 0.00
17 701.78 39,057 -7 9 0 0 0 0 16 16 0.00
18 701.75 39,036 -21 -4 0 0 0 0 17 17 0.00
19 701.71 39,008 -28 -15 0 0 0 0 13 13 0.00
20 701.70 39,001 -7 6 0 0 0 0 13 13 0.00
21 701.58 38,918 -84 -68 0 0 0 0 16 16 0.00
22 701.35 38,758 -160 -142 0 0 0 0 18 18 0.00
23 701.25 38,688 -69 42 0 0 92 0 19 111 0.00
24 701.15 38,619 -69 43 0 0 92 0 20 112 0.00
25 701.01 38,522 -97 14 0 0 92 0 19 111 0.00
26 700.93 38,467 -55 56 0 0 92 0 19 111 0.00
27 700.84 38,405 -62 55 0 0 92 0 25 117 0.00
28 700.70 38,308 -97 -3 0 0 71 0 23 94 0.00
29 700.62 38,253 -55 41 0 0 77 0 19 96 0.00
30 700.54 38,198 -55 56 0 0 92 0 19 111 0.00
31 700.42 38,115 -83 23 0 0 92 0 14 106 0.00
Total -1,454 62 0 0 989 8 519 1,516 0.00
1/ Total inflow from stream gaging station above Lang Canyon and accretions/depletions. 3/ To East Bay Regional Park District.
2/ Project water released to South Bay Aqueduct through Del Valle Pumping Plant. NR=No Records
Date
Water
Surface
Elevation
(feet)
StorageStorage
Change
(in acre-feet except as noted) July 2016
Precipitation
(inches)Natural
1/
From
South Bay
Aqueduct
Arroyo
Valle
South Bay
Aqueduct
2/
Recreation
Deliveries
3/
EvaporationTotal
Outflow
14

United States State of California
Department of the Interior The Resources Agency
Bureau of Reclamation Department of Water Resources
Central Valley Project State Water Project
Inflow (cfs) Outflow (cfs)
Jun 30 220.45 44,322
1 221.21 46,311 1,989 0 143 3,739 5,619 851 0 7,293 28 -326
2 220.85 45,368 -943 0 0 2,632 6,802 2,596 0 7,009 28 -276
3 219.94 42,997 -2,371 0 0 2,512 5,493 2,379 0 6,673 27 -121
4 219.77 42,557 -440 0 0 2,532 5,743 2,226 0 6,095 27 -149
5 219.88 42,841 284 0 0 3,179 5,776 2,278 0 6,386 27 -121
6 219.88 42,841 0 0 0 2,911 6,230 2,279 0 6,628 27 -207
7 220.79 45,210 2,369 0 0 3,950 6,892 2,315 0 6,977 9 -347
8 221.90 48,124 2,914 0 0 3,857 6,771 2,322 0 6,472 9 -356
9 222.42 49,501 1,377 0 0 2,786 7,014 2,239 0 6,428 9 -430
10 222.19 48,889 -612 0 0 1,552 6,737 2,095 0 6,187 10 -306
11 222.11 48,677 -212 0 0 1,548 6,783 1,918 0 6,089 10 -421
12 222.87 50,699 2,022 0 0 2,626 7,100 1,996 0 6,451 10 -250
13 223.87 53,377 2,678 0 0 2,158 6,920 1,248 0 6,242 10 -228
14 222.45 49,580 -3,797 0 0 0 6,569 1,644 0 6,383 3 -453
15 221.25 46,416 -3,164 0 0 546 6,417 1,683 0 6,404 3 -468
16 220.79 45,210 -1,206 0 0 3,296 4,617 2,243 0 6,023 3 -252
17 220.30 43,931 -1,279 0 0 3,574 3,091 2,176 0 4,730 4 -400
18 219.74 42,480 -1,451 0 0 5,753 1,026 1,910 0 5,359 4 -238
19 218.73 39,901 -2,579 0 0 5,529 12 1,855 0 4,833 4 -149
20 218.64 39,674 -227 0 0 5,384 967 1,982 0 4,426 4 -53
21 219.59 42,093 2,419 0 0 4,747 3,796 2,283 0 5,155 4 119
22 219.69 42,351 258 0 0 2,462 5,108 2,182 0 4,998 5 -255
23 220.31 43,957 1,606 0 0 1,519 6,400 2,024 0 5,254 5 174
24 221.40 46,810 2,853 0 0 4,103 5,382 1,803 0 6,073 5 -166
25 222.71 50,273 3,463 0 0 2,601 6,128 1,613 0 5,424 4 58
26 221.99 48,360 -1,913 0 0 0 6,510 1,753 0 5,528 4 -189
27 221.61 47,362 -998 0 0 590 6,822 1,586 0 6,051 4 -274
28 222.54 49,820 2,458 0 0 1,400 6,825 1,415 0 5,528 4 -39
29 222.76 50,406 586 0 0 469 6,979 1,514 0 5,438 18 -183
30 223.39 52,089 1,683 0 0 465 6,098 547 0 5,133 18 -16
31 223.96 53,619 1,530 0 0 458 6,303 371 0 5,424 19 -176
Total 9,297 0 143 78,878 172,930 57,326 0 183,094 346 -6,498
Mean cfs 0 5 2,544 5,578 1,849 0 5,906 11 -210
Acre-feet 9,297 0 284 156,458 343,004 113,703 0 363,167 686 -12,893
1/ Pump-in located at Mile 79.67R.
Table 14. Consolidated State-Federal O'Neill ForebayDaily Operations
July 2016
Capacity 56,430 ac-ft
Date
Water
Surface
Elevation
(in feet)
Storage
(ac-ft)
Storage
Change
(ac-ft)
Computed
Losses (-)
Gains (+)
(cfs)
Pump
In
1/
Deliv-
eries
2/
O'Neill
Pumping
Generating
Plant
(Pumped)
Gianelli
Pumping
Generating
Plant
(Generation)
California
Aqueduct
O'Neill
Pumping
Generating
Plant
(Generation)
2/ Includes 90 AF delivered to DFG at O'Neill Forebay, 1 AF to Parks & Rec., 0 AF for the Cattle Program, and 595 AF
to San Luis Water District.
Gianelli
Pumping
Generating
Plant
(Pumped)
Dos
Amigos
Pumping
Plant
15

United States State of California
Department of the Interior The Resources Agency
Bureau of Reclamation Department of Water Resources
Central Valley Project Capacity: 2,027,835 ac-ft State Water Project
Inflow (cfs) Outflow (cfs)
Jun 30 378.52 362,753
1 377.34 354,585 -8,168 0 3,739 343 0 -36
2 376.50 348,811 -5,774 0 2,632 303 0 24
3 375.66 342,892 -5,919 0 2,512 280 0 -192
4 374.83 337,310 -5,582 0 2,532 286 0 4
5 373.81 330,493 -6,817 0 3,179 277 0 19
6 372.89 324,387 -6,106 0 2,911 157 0 -10
7 371.73 316,746 -7,641 0 3,950 21 0 119
8 370.37 307,872 -8,874 0 3,857 23 0 -594
9 369.54 302,500 -5,372 0 2,786 24 0 102
10 369.03 299,217 -3,283 0 1,552 13 1 -89
11 368.54 296,075 -3,142 0 1,548 34 0 -2
12 367.42 288,940 -7,135 0 2,626 49 0 -922
13 366.73 284,576 -4,364 0 2,158 51 0 9
14 366.68 284,261 -315 0 0 87 0 -72
15 366.46 282,875 -1,386 0 546 117 0 -36
16 365.37 276,048 -6,827 0 3,296 117 0 -29
17 364.22 268,914 -7,134 0 3,574 117 0 94
18 362.32 257,284 -11,630 0 5,753 115 0 5
19 360.49 246,273 -11,011 0 5,529 115 0 93
20 358.70 235,686 -10,587 0 5,384 118 0 164
21 357.08 226,265 -9,421 0 4,747 119 0 116
22 356.19 221,155 -5,110 0 2,462 132 0 18
23 355.61 217,851 -3,304 0 1,519 126 0 -21
24 354.16 209,679 -8,172 0 4,103 118 0 101
25 353.19 204,284 -5,395 0 2,601 123 0 4
26 353.13 203,952 -332 0 0 137 0 -30
27 352.87 202,517 -1,435 0 590 151 0 18
28 352.30 199,386 -3,131 0 1,400 167 0 -12
29 352.07 198,128 -1,258 0 469 175 0 9
30 351.80 196,655 -1,473 0 465 177 0 -101
31 351.55 195,296 -1,359 0 458 260 0 32
Total -167,457 0 78,878 4,332 1 -1,215
Mean cfs 0 2,544 140 0 -39
Acre-feet -167,457 0 156,458 8,590 1 -2,408
1/ Pacheco Tunnel, San Felipe Split; Santa Clara 4,913 AF, Casa De Fruta 0 AF, and San Benito 3,677 AF.
Parks
and
Rec.
Del.
Pacheco
Tunnel
1/
Table 15. Consolidated State-Federal San Luis ReservoirDaily Operations
July 2016
Date
Water
Surface
Elev.
(in feet)
Storage
(ac-ft)
Storage
Change
(ac-ft)
Computed
Losses (-)
Gains (+)
(cfs)
Gianelli
Pumping
Generating
Plant
(Pumped)
Gianelli
Pumping
Generating
Plant
(Generation)
16

(in acre-feet)
1 14,466 12,393 7,416 3,872 0 0 680
2 13,902 11,840 5,221 1,669 0 0 601
3 13,236 10,608 4,983 624 0 0 555
4 12,089 9,486 5,022 658 0 0 567
5 12,667 10,043 6,306 559 0 0 549
6 13,147 10,528 5,774 5,773 0 0 311
7 13,839 11,257 7,835 1,538 0 0 41
8 12,837 10,251 7,650 43 0 0 45
9 12,750 10,115 5,526 158 0 0 47
10 12,272 9,622 3,079 3,078 0 0 25
11 12,078 9,445 3,071 3,071 0 0 67
12 12,796 10,139 5,209 -341 0 0 97
13 12,381 9,714 4,281 -97 0 0 101
14 12,661 9,995 0 0 0 0 172
15 12,702 10,026 1,083 1,083 0 0 232
16 11,947 9,295 6,538 4,833 0 0 232
17 9,382 7,294 7,089 7,090 0 0 232
18 10,630 8,550 11,411 8,788 0 0 228
19 9,586 7,495 10,967 8,300 0 0 228
20 8,779 6,713 10,679 7,662 0 0 234
21 10,225 8,128 9,416 3,111 0 0 236
22 9,914 9,914 4,884 4,883 0 0 261
23 10,421 10,422 3,013 3,012 0 0 249
24 12,046 12,046 8,138 8,139 0 0 234
25 10,759 10,759 5,159 5,160 0 0 243
26 10,965 10,965 0 0 0 0 271
27 12,002 12,002 1,170 1,170 0 0 299
28 10,965 10,965 2,777 2,777 0 0 331
29 10,786 10,786 930 931 0 0 347
30 10,181 10,181 922 922 0 0 351
31 10,759 10,759 909 909 0 0 515
Total 363,167 311,736 156,458 89,375 0 0 8,590
2/ Provisional, subject to change.
Table 16. San Luis Field Division Plant Data
1/ Negative values may appear in SWP columns and indicate a mismatch of scheduled CVP energy and actual pumping;
adjustments to SWP water shares are made to balance the mismatch.
July 2016
Total
Pumping
SWP
Pumping
1/ 2/
Federal
Date
Dos Amigos
Pumping Plant
Gianelli
Pumping - Generating Plant
San Felipe
Project
Total
Pumping
SWP
Pumping
1/ 2/
Total
Generation
SWP
Generation
1/ 2/
17

United States State of California
Department of the Interior The Resources Agency
Bureau of Reclamation Department of Water Resources
Central Valley Project State Water Project
Jun 30 327.44 20,407
1 327.42 20,398 -9 0 0 0 -9
2 327.38 20,379 -19 0 0 0 -19
3 327.35 20,365 -14 0 0 0 -14
4 327.31 20,346 -19 0 0 0 -19
5 327.30 20,342 -4 0 0 0 -4
6 327.25 20,318 -24 0 0 0 -24
7 327.22 20,304 -14 0 0 0 -14
8 327.19 20,290 -14 0 0 0 -14
9 327.16 20,276 -14 0 0 0 -14
10 327.14 20,267 -9 0 0 0 -9
11 327.11 20,253 -14 0 0 0 -14
12 327.08 20,239 -14 0 0 0 -14
13 327.06 20,230 -9 0 0 0 -9
14 327.05 20,225 -5 0 0 0 -5
15 327.02 20,211 -14 0 0 0 -14
16 326.98 20,193 -18 0 0 0 -18
17 326.94 20,174 -19 0 0 0 -19
18 326.92 20,165 -9 0 0 0 -9
19 326.91 20,160 -5 0 0 0 -5
20 326.87 20,141 -19 0 0 0 -19
21 326.84 20,128 -13 0 0 0 -13
22 326.82 20,118 -10 0 0 0 -10
23 326.80 20,109 -9 0 0 0 -9
24 326.76 20,090 -19 0 0 0 -19
25 326.74 20,081 -9 0 0 0 -9
26 326.72 20,072 -9 0 0 0 -9
27 326.69 20,058 -14 0 0 0 -14
28 326.68 20,053 -5 0 0 0 -5
29 326.64 20,035 -18 0 0 0 -18
30 326.62 20,026 -9 0 0 0 -9
31 326.58 20,007 -19 0 0 0 -19
Total -400 0 0 0 -400
Mean cfs 0 0 0
Acre-feet -400 0 0 0 -400
Capacity 34,560 ac-ft
Estimated
Inflow
(cfs)
Estimated
Outflow (cfs)
Table 17. Consolidated State-Federal Los Banos ReservoirDaily Operations
July 2016
Computed
Losses (-)
Gains (+)
(ac-ft)Spill Outlet
Date
Water
Surface
Elev.
(in feet)
Storage
(ac-ft)
Storage
Change
(ac-ft)
18

United States State of California
Department of the Interior The Resources Agency
Bureau of Reclamation Department of Water Resources
Central Valley Project Capacity: 5,580 ac-ft State Water Project
Jun 30 599.30 649
1 599.30 649 0 0 0 0 0
2 Not Observed 649 0 0 0 0 0
3 Not Observed 649 0 0 0 0 0
4 Not Observed 649 0 0 0 0 0
5 Not Observed 649 0 0 0 0 0
6 Not Observed 649 0 0 0 0 0
7 Not Observed 649 0 0 0 0 0
8 Not Observed 649 0 0 0 0 0
9 Not Observed 649 0 0 0 0 0
10 Not Observed 649 0 0 0 0 0
11 Not Observed 649 0 0 0 0 0
12 Not Observed 649 0 0 0 0 0
13 Not Observed 649 0 0 0 0 0
14 Not Observed 649 0 0 0 0 0
15 Not Observed 649 0 0 0 0 0
16 Not Observed 649 0 0 0 0 0
17 Not Observed 649 0 0 0 0 0
18 Not Observed 649 0 0 0 0 0
19 Not Observed 649 0 0 0 0 0
20 Not Observed 649 0 0 0 0 0
21 Not Observed 649 0 0 0 0 0
22 Not Observed 649 0 0 0 0 0
23 Not Observed 649 0 0 0 0 0
24 Not Observed 649 0 0 0 0 0
25 Not Observed 649 0 0 0 0 0
26 Not Observed 649 0 0 0 0 0
27 Not Observed 649 0 0 0 0 0
28 Not Observed 649 0 0 0 0 0
29 Not Observed 649 0 0 0 0 0
30 Not Observed 649 0 0 0 0 0
31 597.30 557 -92 0 0 0 -92
Total -92 0 0 0 -92
Mean cfs 0 0 0
Acre-feet -92 0 0 0 -92
Table 18. Consolidated State-Federal Little Panoche ReservoirDaily Operations
July 2016
Date
Water
Surface
Elev.
(in feet)
Storage
(ac-ft)
Storage
Change
(ac-ft)
Estimated
Inflow
(cfs)
Estimated
Outflow (cfs)Computed
Losses (-)
Gains (+)
(ac-ft)Spill Outlet
19

(In acre-feet)
Operating Pool Deliveries
Beginning and Ending
2B 12 Check No. 12 66.71 343,004
Department of Parks and Recreation 1 1 0
San Felipe Division
Santa Clara Water District4,913 4,913
Casa de Fruita
Santa Clara Water District0
San Felipe Division
San Benito Water District3,677 3,677
Reach 3A Subtotal: 8,591 8,590 0 1 0
Department of Parks and Recreation 1 1 0
Cattle Program 0
Department of Fish & Game 90 50 41
70.91
Thru
85.08 (Floodwater Inflow)
Reach 3 Subtotal: 686 595 0 51 40
Dos Amigos
Pumping Plant86.73 363,167
89.03
Thru San Luis Water District
94.06
89.66
Thru Pacheco Water District
89.67
89.68 Panoche Water District 42 42
89.70 City of Dos Palos 76 76
Check No. 14 95.06
98.15
Thru San Luis Water District
104.20
96.15
Thru
102.64 (Floodwater Inflow)
102.64 Broadview Water District 0
105.22
Thru Westlands Water District
108.64
Check No.15 108.50
Reach 4 Subtotal: 19,820 18,857 963 0 0
San Felipe Division Total: 8,590 8,590 0 0 0
Pacheco Water District Total: 219 219 0 0 0
Broadview Water District Total: 0 0 0 0 0
City of Dos Palos Total: 76 76 0 0 0
SLWD Reach 4 Subtotal: 10,860 10,860 0 0 0
Panoche Water District Total: 3,547 3,547 0 0 0
SLWD Total: 11,455 11,455 0 0 0
Westlands WD Reach 4 Subtotal: 4,155 4,155 0 0 0
1/ Includes 776 AF of Table A water transferrred to a non-SWPC and 187 AF of Art.56C transferred to a non-SWPC.
14
4
15
3 13
70.85
Reach
No.Turnout
O'Neill Forebay
3A San Luis Reservoir
Table 19. Governor Edmund G. Brown California AqueductSan Luis Field Division, Monthly Deliveries
TransferDWR
Recreation
USBR
RecreationNo. Structure Mile
July 2016Total
Diver-
sionsUSBR
San Luis Water District 595 595
Panoche Water District 3,505 3,505
8,585 8,585
219 219
2,275 2,275
5,118 4,155 1/ 963
20

(In acre-feet)
Operating Pool
Beginning and Ending
(Reverse flow, Kings River) 0
110.52 Westlands Water District 10,796 10,796
Thru Dept. of Fish and Game @ Lat. 4L 0
122.05 Dept. of Fish and Game @ Lat. 6L 0
Dept. of Fish and Game @ Lat. 7L 0
Check No. 16 122.07
124.18
Thru Westlands Water District
132.74
Check No. 17 132.95
133.81
Thru Westlands Water District
142.61
Pleasant Valley
Pumping Plant143.16 Westlands Water District 8,967 2,758 2/ 6,209
143.16 City of Coalinga 414 414
Check No. 18 143.23
Reach 5 Subtotal: 32,991 26,782 6,209 0 0
Alta Gas 0
City of Huron 0
County of Kings to Lemoore NAS 251 251
County of Kings through WWD 30L 0
Westlands Water District 7,598 6,168 2/ 1,430
Check No. 19 155.64
Reach 6 Subtotal: 7,849 6,168 1,681 0 0
156.34 City of Huron 86 86
156.40 SWP Construction @ Lat. 24R 0
Thru
163.69
Check No. 20 164.69
164.79 City of Avenal 221 221
167.04
Thru Westlands Water District
171.67
Check No. 21 172.40 301,723
Reach 7 Total: 6,272 5,149 1,123 0 0
Alta Gas: 0 0 0 0 0
Westlands WD Total: 50,295 41,533 8,762 0 0
City of Coalinga Total: 414 414 0 0 0
City of Huron Total: 86 86 0 0 0
1/ County of Kings to Lemoore NAS: 251 0 251 0 0
City of Avenal Total: 221 221 0 0 0
Total San Luis Field Division Deliveries: 75,246 66,141 9,013 52 40
19
20
7
21
USBRMile
Reach
No.Turnout
Total
Diver-
sionsNo. Structure
145.26
Thru
151.19
5
16
17
6
18
Table 19. Governor Edmund G. Brown California AqueductSan Luis Field Division, Monthly Deliveries (Continued)
Deliveries
Transfer DWR
Recreation
USBR
Recreation
July 2016
6,713 6,713
6,101 6,101
1,528 1,528
Westlands Water District 4,437 3,314 2/ 1,123
1/ SWP transfer from County of Kings to Lemoore NAS thru WWD.
2/ Transfer of Table A water to non-SWPC.
21

United States State of California
Department of the Interior The Resources Agency
Bureau of Reclamation Department of Water Resources
Central Valley Project State Water Project
Inflow (cfs) Outflow (cfs)
Jun 30 28,682
1 29,285 603 64 7,293 199 89 969 6,059 263
2 29,374 89 68 7,009 199 89 969 5,823 48
3 29,396 22 74 6,673 199 89 947 5,545 44
4 29,174 -222 91 6,095 199 89 970 5,064 24
5 28,989 -185 101 6,386 199 88 971 5,306 -17
6 28,613 -376 100 6,628 199 88 971 5,506 -153
7 29,177 564 103 6,977 199 88 971 5,797 259
8 29,242 65 107 6,472 163 52 808 5,377 -146
9 28,920 -322 85 6,428 163 52 808 5,341 -311
10 28,808 -112 102 6,187 163 51 809 5,140 -182
11 29,224 416 104 6,089 163 51 809 5,059 99
12 29,358 134 102 6,451 163 50 810 5,359 -103
13 28,764 -594 100 6,242 163 50 811 5,186 -432
14 28,863 99 101 6,383 163 49 811 5,303 -109
15 29,215 352 117 6,404 163 72 793 5,321 5
16 29,516 301 113 6,023 163 72 793 5,005 49
17 29,147 -369 134 4,730 173 73 794 3,929 -80
18 28,778 -369 128 5,359 175 73 794 4,452 -179
19 28,217 -561 117 4,833 175 73 795 4,016 -174
20 27,810 -407 141 4,426 175 74 795 3,677 -52
21 28,349 539 119 5,155 174 74 795 4,282 323
22 28,161 -188 126 4,998 171 30 777 4,153 -88
23 28,699 538 117 5,254 171 30 777 4,366 244
24 29,598 899 125 6,073 171 30 777 5,046 280
25 29,303 -295 114 5,424 178 31 776 4,506 -196
26 28,976 -327 63 5,528 178 31 776 4,592 -178
27 29,280 304 51 6,051 178 31 776 5,027 63
28 28,995 -285 47 5,528 178 31 776 4,592 -141
29 29,081 86 50 5,438 222 30 968 4,518 293
30 28,891 -190 45 5,133 222 29 968 4,264 209
31 29,845 954 44 5,424 223 29 968 4,506 738
Total 1,163 2,953 183,094 5,624 1,788 26,332 152,116 400
Mean cfs 95 5,906 181 58 849 4,907 13
Acre-feet 1,163 5,858 363,167 11,155 3,547 52,230 301,723 793
1/ San Luis Canal includes Pools 14 through 21 of the California Aqueduct.
2/ Includes 219 AF to Pacheco W.D., 76 AF to the City of Dos Palos and 10,860 AF to San Luis Water District.
3/ Includes 86 AF to the City of Huron, 221 AF to the City of Avenal, 414 AF to the City of Coalinga, 0 AF to City of Huron P&R@ 22R, 251 AF to Lemoore N.A.S. @ 29L, 0 AF to GWF @ 30L, 0 AF to Kings County @ 30L, 0 AF to Broadview WD @ 4L,
0 AF to DFG @ 4L, 0 AF to Pilibos Wildlife @ 4L, 0 AF to Mendota Water Fowl Habitat Area @ 6L, 0 AF DFG @ 7L, 0 AF
Non-Project Water, 51,258 AF to Westlands Water District.
Flow
Past
Check 21
Table 20. Consolidated State-Federal San Luis Canal 1/Daily Operations
July 2016
Date
Storage
In Canal
(ac-ft)
Storage
Change
(ac-ft)
Computed
Losses (-)
Gains (+)
(cfs)
Non-
Project
Dos Amigos
Pumping
Plant
San Luis Water
District
Pools 14 & 15
2/
Panoche Water
District
Pools 14 & 15
Westlands
Water District
Pools 15 thru 21
3/
22

(in acre-feet)
Coastal Aqueduct California Aqueduct
1 597 528 107 93 109 7,601 7,005 6,823 6,447
2 725 665 96 87 96 7,713 7,072 6,839 6,542
3 777 711 122 109 123 7,688 7,424 7,191 6,878
4 806 706 110 101 112 6,663 6,337 6,013 5,719
5 782 673 110 93 103 6,614 6,169 5,793 5,496
6 331 594 86 76 84 7,289 6,497 6,247 5,904
7 650 585 124 116 123 6,947 6,260 6,034 5,686
8 762 673 117 107 117 6,813 6,280 6,027 5,629
9 807 678 107 76 107 7,103 6,493 6,244 5,874
10 777 675 108 98 110 6,790 6,519 6,375 6,093
11 698 550 123 112 121 6,561 6,013 5,831 5,560
12 688 518 112 103 114 6,441 5,715 5,560 5,158
13 730 552 110 126 109 6,244 5,639 5,574 5,157
14 733 556 104 94 105 6,506 5,625 5,613 5,157
15 714 531 112 101 111 6,316 5,749 5,699 5,157
16 765 573 137 127 137 6,402 5,703 5,481 5,157
17 686 683 107 92 107 5,849 5,535 5,455 5,157
18 699 638 116 107 114 5,252 4,897 4,748 4,402
19 775 712 120 108 120 4,078 3,309 3,132 2,846
20 717 622 107 99 107 2,913 2,335 2,101 1,964
21 705 534 128 116 129 3,062 2,389 2,156 2,072
22 708 540 99 89 100 3,557 2,946 2,773 2,426
23 739 719 125 113 125 4,891 4,469 4,247 4,017
24 825 540 125 114 125 6,920 6,383 6,435 6,214
25 711 616 108 96 107 6,480 6,253 6,006 5,753
26 698 528 108 97 109 5,792 5,285 5,019 4,617
27 605 511 126 120 126 6,158 5,700 5,484 5,130
28 738 667 114 104 113 5,852 5,474 5,208 4,748
29 726 588 120 110 119 5,948 5,650 5,421 5,049
30 783 668 105 92 101 5,905 5,196 5,069 4,762
31 695 552 99 92 99 5,664 5,365 5,307 5,082
Total 22,152 18,886 3,492 3,168 3,482 188,012 171,686 165,905 155,853
Badger Hill
Pumping Plant
Devil's Den
Pumping Plant
Table 21. San Joaquin Field Division Plant DataJuly 2016
Chrisman
Pumping Plant
Edmonston
Pumping Plant
Bluestone
Pumping Plant
Polonio Pass
Pumping Plant
Buena Vista
Pumping Plant
Teerink
Pumping Plant
Date Las Perillas
Pumping Plant
23

(In acre-feet)
Operating Pool
Beginning and Ending
7 21 Check No. 21 172.40 301,723
Empire West Side ID TL - A 517 517
County of Kings TL - A 799 666 102 1/ 31
Tulare Lake Basin WSD TL-A 0
175.18 Dudley Ridge WD - 1 886 745 2/ 141
177.54 Dudley Ridge WD - 1B 85 2/ 85
180.64 Tulare Lake Basin WSD - C 0
180.65 Dudley Ridge WD - 1A 482 2/ 482
182.99 Dudley Ridge WD - 2 893 3/ 893
Tulare Lake Basin WSD TL - B 0
County of Kings TL-B 0
184.00 Dudley Ridge WD - Paramount 2 1/ 2
31A 184.63 Coastal Branch 22,152
184.78 Dudley Ridge WD - 3 1,277 4/ 1,277
Dudley Ridge Reach 8D Total: 3,625 745 0 0 0 2,880
Tulare Lake Basin WSD Total: 0 0 0 0 0 0
Check No. 22 184.82
Kern County Water Agency
Lost Hills Water Dist. - 1
Kern County Water Agency
Lost Hills Water Dist. - 2
Kern County Water Agency
Lost Hills Water Dist. - 3
Kern County Water Agency
Berrenda Mesa - 2
Kern County Water Agency
Lost Hills Water Dist. - 4
Check No. 23 197.05
Kern County Water Agency
Lost Hills Water Dist. - 7
Kern County Water Agency
Lost Hills Water Dist. - 5
Kern County Water Agency
Lost Hills Water Dist. - 8
Kern County Water Agency
Semitropic WSD - 3
Check No. 24 207.94
Kern County Water Agency
Belridge Water Storage Dist. - 1A
Kern National Wildlife Refuge
USBR BV-1B
Kern County Water Agency
Buena Vista WSD 1B
KCWA Semitropic WSD 18,663 7,500 8,400 5/ 2,763
KCWA Semitropic WSD Penstocks 0
USBR Total: 0
K.C.W.A. Reach 10A Subtotal: 39,599 28,436 0 0 8,400 2,763
1/ Delivery under multi pool.
3/ Includes 185 AF exchanged Table A and 708 AF Table A transfer.
4/ Includes 559 AF Table A transfer, 299 AF exchanged Table A and 419 AF delivery under multi pool.
5/ CVP exchange.
K.C.W.A. Reach 9 Subtotal:
2/ Exchanged Table A water.
205.26
206.99
209.71
209.78
209.80
22
8D
8D
172.66
201.24
9 23
189.69
191.18
194.22
196.40
196.75
183.00
10A
24
25
202.05
2,113
600
8
16,748
881
514
1,880
580
1,577 1,577
15,234
1,142 1,142
0
16,748
881
8
1,880
580
15,234 0 0 0 0
600
514
10,127
2,113
Table 22. Governor Edmund G. Brown California AqueductSan Joaquin Field Division, Monthly Deliveries
Article 56C Other
Reach
No.Turnout
Total
Diver-
sions
July 2016
8C
Deliveries
USBRPump-in
RecoveryNo. Structure Mile
Table
A
10,127
24

(In acre-feet)Operating Pool
Beginning and Ending
Kern County Water AgencyBelridge - 2
Kern County Water AgencyBelridge - 3
Kern County Water AgencyBelridge - 4
Kern County Water AgencyBelridge - 5A-C
Kern County Water AgencyBelridge - 5D
Check No. 25 217.79K.C.W.A. Reach 11B Subtotal: 18,692 17,135 0 1,557 0 0
Kern County Water AgencyBelridge - 6
Kern County Water AgencyWest Kern - 3
Check No. 26 224.92Kern County Water Agency
Buena Vista - 6Check No. 27 231.73
Kern County Water AgencyBuena Vista - 2
Kern County WA CVC 254 254 DRWD CVC 0 Tulare Co. 0
Lower Tule River 0 Fresno Co. 0 Pixley ID 0
Hacienda DWR Wells 0 Check No. 28 238.11
1/ Arvin Edison Total: 0 0 0 0 0 0 Reach 12E Subtotal: 9,401 9,401 0 0 0 0
Kern Water Bank Inflow 0 Kern Water Bank Outflow 0
241.02 Kern River Intertie (inflow) 0 KCWA Buena Vista WSD - 7 0 KCWA Buena Vista WSD - 5 141 141 Kern County Water Agency
Buena Vista - 3Check No. 29 244.54
Kern County Water AgencyBuena Vista - 4
Buena VistaPumping Plant 250.99 188,012
K.C.W.A. Reach 13B Subtotal: 1,248 1,248 0 0 0 0 Kern County Water Agency
West Kern - 2Kern County Water Agency
256.11 Wheeler Ridge-Maricopa - 2535 535
0
0
1,107 1,107
3,921 3,921
5,226 5,226
87 87
16,452 14,895 1,557
2,153 2,153
0
11B25
217.13
216.62
214.11
210.75
12E
0
30
13B
249.85
238.19
242.85
243.09
29
Table 22. Governor Edmund G. Brown California Aqueduct
OtherReach
No. TurnoutTotalDiver-sionsNo. Structure Mile
Deliveries
Pump-in Recovery
San Joaquin Field Division, Monthly Deliveries (Continued)
Article 56CUSBRTable
A
July 2016
230.37
1/ Arvin Edison Contractors include Rag Gulch WD, Kern-Tulare WD, Fresno County, Hills Valley ID, Tri Valley WD, Tulare County, Lower Tule River ID and Pixley ID.
430 430
0
254.473114A
27
28238.04
235.75
12D 26219.58
25

(In acre-feet)
Operating Pool
Beginning and Ending
31 Check No. 31 256.14
Kern County Water Agency
Wheeler Ridge-Maricopa - 3
Kern County Water Agency
Wheeler Ridge-Maricopa - 4
Check No. 32 261.72
KCWA Reach 14A Subtotal: 4,686 4,686 0 0 0 0
Kern County Water Agency
Wheeler Ridge-Maricopa - 5
Kern County Water Agency
Wheeler Ridge-Maricopa - 6
Check No. 33 267.36
Kern County Water Agency
Wheeler Ridge-Maricopa - 7
Check No. 34 271.27
Reach 14B Total: 10,181 10,034 0 147 0 0
Kern County Water Agency
Wheeler Ridge-Maricopa - 8
Kern County Water Agency
Wheeler Ridge-Maricopa - 9
Kern County Water Agency
Arvin-Edison WSD
Reach 14C Total: 4,274 4,254 0 20 0 0
Teerink
Pumping Plant278.13 171,686
Kern County Water Agency
Wheeler Ridge-Maricopa - 9A
Kern County Water Agency
Wheeler Ridge-Maricopa - 10
Reach 15-A Total: 3,925 3,918 0 7 0 0
Chrisman
Pumping Plant280.36 165,905
Kern County Water Agency
Wheeler Ridge-Maricopa - 11
Check No. 37 283.95
Kern County Water Agency
Wheeler Ridge-Maricopa - 12
Kern County Water Agency
Wheeler Ridge-Maricopa - 13A
Kern County Water Agency
Wheeler Ridge-Maricopa - 13
Check No. 38 287.09
Kern County Water Agency
39 Wheeler Ridge-Maricopa - 13B
Check No. 39 290.21
Kern County Water Agency
Wheeler Ridge-Maricopa - 14
Kern County Water Agency
40 Wheeler Ridge-Maricopa - 15
Kern County Water Agency
Tehachapi Cummings CWD
K.C.W.A. Reach 16A Subtotal: 3,694 3,694 0 0 0 0
Edmonston
Pumping Plant
USBR
34
264.42
266.91
Structure Mile
5,736 5,736
652
0 3,085
147
260.44
0 1,066
799
279.02
280.06
270.24
272.39
276.09
15A
36
16A
35
37
17E
282.06
285.01
286.39
287.06
287.62
291.26
38
293.45
293.07
Table 22. Governor Edmund G. Brown California AqueductSan Joaquin Field Division, Monthly Deliveries (Continued)
277.30
Article
56COther
Reach
No.Turnout
Total
Diver-
sions
Table
ANo.
14C
July 2016
14A
14B
32
33
Pump-in
Recovery
258.61
Deliveries
2,702 2,702
3,646 3,646
467 467
1,105 1,085 20
2,851 2,844 7
1,074 1,074
36 36
0
0
115 115
1,426 1,426
262 262
155,853
1,233 1,233
622 622
26

(In acre-feet)
Operating Pool
Coastal Branch
Control
Las Perillas
Pumping Plant
Badger Hill
Pumping Plant
Coastal
Check No. 3
Castaic Lake WA
(Devil's Den WD #1)
Coastal
Check No. 4
Coastal
Check No. 5
Kern County Water Agency
Berrenda Mesa - 3
Kern County Water Agency
Berrenda Mesa - 1
Kern County Water Agency
Berrenda Mesa - PO
Devil's Den
Pumping Plant
K.C.W.A. Reach 31A Subtotal: 16,717 16,717 0 0 0 0
K.C.W.A. Total: 128,081 115,187 0 1,731 8,400 2,763
Bluestone
Pumping Plant
Polonio Pass
Pumping Plant
(CCWA) Polonio Pass
Treatment Plant
Shandon T.O. 38.23 Santa Barbara County (CCWA) 2,941 1,505 110 1/ 1,326
Tank Site 2 58.63 Central Coast: 0
Chorro Valley T.O. 69.31 San Luis Obispo County (CCWA) 467 467
Energy Dissipater 78.12
Lopez T.O. SLOCFC & WCD 0
CCWA Total: 3,408 1,972 0 0 110 1,326
Guadalupe T.O. 102.70 SBCFC & WCD 0
Santa Maria T.O. 107.43 SBCFC & WCD 0
So. Cal. Water T.O. 109.20 SBCFC & WCD 0
SBCFC & WCD Total: 0
Tank Site 5 115.42
1/ Includes 851 AF Table A exchange and 475 AF Article 56C transfer.
85.86
27.81
19.05
26.54
C-11
C-12
33A
34
35
38
C-7
Tank Site 1C-9
C-10
3,168
July 2016
1,672
15,045 15,045
USBRTable
A
0
18,886
Other
Deliveries
0
Article 56C
0.02
1.16
0
1,672
0
22,152
22,152
3.79
4.27
7.21
9.34
14.83
9.34
12.20
0
Table 23. Governor Edmund G. Brown California AqueductSan Joaquin Field Division, Monthly Deliveries (Coastal Branch)
3,492
Pump-in
Recovery
Beginning and EndingTotal
Diver-
sionsNo.
31A
C-1
C-2
C-3
C-4
C-5
C-6
Reach
No.Turnout
Structure Mile
Green Valley Water District
0
0
C-8
14.86
13.30
3,482
27

(in acre-feet)
West Branch
Mojave Siphon Powerplant
1 2,612 2,789 0 0 3,047 0 2,831 0 487 3,492 3,363 0 0 3,521 98 76 40
2 2,772 2,798 0 0 1,218 0 2,933 0 802 3,585 3,278 0 0 3,427 98 76 40
3 2,661 3,157 0 0 1,124 0 2,899 0 793 3,079 3,898 0 0 3,385 98 76 40
4 1,489 1,471 0 0 969 0 2,905 0 1,050 3,987 4,119 0 0 3,463 98 76 40
5 1,370 1,487 0 0 1,506 0 2,805 0 1,016 3,987 3,803 0 0 3,434 83 65 40
6 1,451 1,675 0 0 2,190 0 2,975 0 999 3,987 3,588 0 0 3,586 96 76 40
7 1,549 1,593 0 0 1,071 0 2,790 0 1,008 3,987 3,885 0 0 3,668 96 76 40
8 1,496 1,674 0 0 1,444 0 1,817 0 1,992 3,700 3,311 0 0 3,849 97 76 40
9 1,595 1,685 0 0 1,017 0 2,897 0 915 3,801 3,743 0 0 3,650 98 76 40
10 2,024 444 0 0 792 0 2,919 0 1,074 3,987 4,063 0 0 3,733 98 76 40
11 1,225 1,616 0 0 1,357 0 2,841 0 1,009 3,987 4,030 0 0 3,778 98 76 40
12 932 1,430 0 0 1,483 90 2,902 0 1,050 3,987 3,637 0 0 3,569 98 76 40
13 1,000 1,441 0 0 1,179 0 2,932 0 1,000 3,987 3,657 0 0 3,713 98 76 40
14 803 1,499 0 0 1,307 0 2,814 0 1,050 3,987 3,501 0 0 3,588 98 76 28
15 887 1,205 0 0 1,860 0 2,836 0 1,174 3,987 4,024 0 0 3,741 89 71 28
16 862 1,059 0 0 851 0 2,837 0 1,095 3,987 3,890 0 0 3,578 78 59 16
17 1,012 928 0 0 1,290 392 2,826 0 992 3,987 3,965 0 0 3,565 71 58 16
18 959 605 0 0 1,091 0 2,918 0 413 3,390 3,424 0 0 3,738 50 0 16
19 160 10 0 0 0 0 2,566 0 0 2,597 2,539 0 0 3,749 27 0 16
20 0 499 0 0 0 640 2,041 0 0 1,774 1,977 0 0 3,351 27 0 16
21 0 347 0 0 0 0 1,778 0 0 1,487 1,338 0 800 1,948 58 0 16
22 851 515 0 0 1,170 0 1,870 0 0 1,497 1,539 0 0 1,626 58 36 5
23 1,597 563 0 0 1,379 0 2,354 0 0 1,904 1,797 0 0 1,356 94 76 0
24 1,913 1,126 0 0 2 0 2,858 0 661 3,592 2,090 0 860 1,884 96 73 0
25 1,542 1,170 0 0 1,608 0 2,861 0 1,116 3,798 2,476 0 1,438 1,792 96 75 36
26 1,059 1,182 0 0 1,043 635 2,737 0 744 3,523 3,681 0 0 2,755 91 76 40
27 1,805 1,359 0 0 1,109 0 2,835 0 364 3,101 3,298 0 0 3,030 90 76 40
28 1,003 1,180 0 0 1,119 0 2,739 0 1,008 3,778 3,397 0 0 3,035 87 76 40
29 898 1,221 0 0 1,114 0 2,843 0 901 3,738 3,371 0 0 3,167 88 76 40
30 1,478 1,222 0 0 1,748 0 2,312 0 384 2,817 2,992 0 0 3,253 89 76 40
31 1,328 1,159 0 0 0 0 2,874 0 901 3,578 3,121 0 0 3,184 92 76 40
Total 40,333 40,109 0 0 35,088 1,757 83,345 0 23,998 106,075 100,795 0 3,098 99,116 2,633 1,957 953
1/ Values supplied by LADWP, not verified by DWR.
Table 24. Southern Field Division Plant Data
Green
Spot
Crafton
Hills
Cherry
ValleyLeakage
Bypass
Flume
Pearblossom
Pumping
Plant
East Branch East Branch Extension
Devil
Canyon
Powerplant
GenerationTehachapi
Afterbay
Genera-
tion
Oso
Pumping
PlantPump-
back
1/
Genera-
tion
1/
Gorman Crk.
Improvement
Channel
July 2016
Alamo PowerplantCastaic
PowerplantDate
BypassGenera-
tion
Genera-
tionLeakage
Warne Powerplant
28

Capacity: 171,200 ac-ft
Inflow
Project Natural Project
Jun 30 2,573.93 164,700
1 2,573.68 164,384 -316 0 2,789 0 2 3,047 0 4 0 -56
2 2,574.84 165,853 1,469 0 2,798 0 2 1,218 0 4 0 -109
3 2,576.45 167,908 2,055 0 3,157 0 1 1,124 0 5 0 26
4 2,576.72 168,254 346 0 1,471 0 2 969 0 5 0 -153
5 2,576.72 168,254 0 0 1,487 0 2 1,506 0 5 0 22
6 2,576.33 167,754 -500 0 1,675 0 2 2,190 0 5 0 18
7 2,576.65 168,164 410 0 1,593 0 2 1,071 0 5 0 -109
8 2,576.80 168,357 193 0 1,674 0 2 1,444 0 5 0 -34
9 2,577.25 168,935 578 0 1,685 0 3 1,017 1 5 0 -87
10 2,577.00 168,613 -322 0 444 0 3 792 0 5 0 28
11 2,577.08 168,716 103 0 1,616 0 3 1,357 0 5 0 -154
12 2,577.10 168,742 26 90 1,430 0 4 1,483 0 4 0 -11
13 2,577.19 168,858 116 0 1,441 0 4 1,179 0 4 0 -146
14 2,577.85 169,708 850 0 1,499 0 4 1,307 0 4 0 658
15 2,576.71 168,241 -1,467 0 1,205 0 4 1,860 0 4 0 -812
16 2,576.83 168,395 154 0 1,059 0 4 851 0 4 0 -54
17 2,576.84 168,408 13 392 928 0 4 1,290 0 4 0 -17
18 2,576.33 167,754 -654 0 605 0 4 1,091 0 4 0 -168
19 2,576.33 167,754 0 0 10 0 4 0 0 4 0 -10
20 2,577.19 168,858 1,104 640 499 0 4 0 0 4 0 -35
21 2,577.48 169,231 373 0 347 0 4 0 0 4 0 26
22 2,576.97 168,575 -656 0 515 0 4 1,170 0 4 0 -1
23 2,576.17 167,549 -1,026 0 563 0 3 1,379 0 4 0 -209
24 2,576.97 168,575 1,026 0 1,126 0 4 2 0 4 0 -98
25 2,576.57 168,061 -514 0 1,170 0 4 1,608 0 4 0 -76
26 2,576.89 168,472 411 635 1,182 0 3 1,043 1 4 0 -361
27 2,577.04 168,665 193 0 1,359 0 3 1,109 0 4 0 -56
28 2,577.03 168,652 -13 0 1,180 0 3 1,119 0 4 0 -73
29 2,576.98 168,588 -64 0 1,221 0 3 1,114 0 4 0 -170
30 2,576.62 168,126 -462 0 1,222 0 3 1,748 0 4 0 65
31 2,577.46 169,205 1,079 0 1,159 0 3 0 0 4 0 -79
Total 4,505 1,757 40,109 0 97 35,088 2 133 0 -2,235
1/ Values supplied by LADWP, not verified by DWR.
Natural
Outflow
Warne
Power-
plant
(in acre-feet except as noted)
Table 25. Pyramid LakeDaily Operation
Date
Water
Surface
Elevation
(in feet)
StorageStorage
Change
To Piru Creek
Del.
To
United
W.A.
July 2016
Computed
Losses (-)
And
Gains (+)
Castaic
Powerplant
Pumpback
1/
Gorman
Creek
Improv.
Channel
Stream
Flow
Castaic
Powerplant
Generation
1/
Recrea-
tion
Deliveries
29

Daily Operation
(in acre-feet except as noted)
Capacity: 32,476 ac-ft
Inflow Outflow
Jun 30 1512.00 19,962
1 1510.92 19,540 -422 3,047 0 0 0 3,506 37
2 1507.60 18,272 -1,268 1,218 0 0 0 2,358 -128
3 1510.54 19,393 1,121 1,124 0 0 0 0 -3
4 1512.91 20,321 928 969 0 0 0 0 -41
5 1498.69 15,075 -5,246 1,506 0 0 0 6,850 98
6 1491.55 12,714 -2,361 2,190 0 0 0 4,492 -59
7 1495.12 13,871 1,157 1,071 0 0 0 0 86
8 1499.21 15,254 1,383 1,444 0 0 0 0 -61
9 1502.15 16,283 1,029 1,017 0 0 0 0 12
10 1504.34 17,069 786 792 0 0 0 0 -6
11 1508.01 18,426 1,357 1,357 0 0 0 0 0
12 1511.71 19,848 1,422 1,483 0 90 0 0 29
13 1509.16 18,862 -986 1,179 0 0 0 2,186 21
14 1506.18 17,743 -1,119 1,307 0 0 0 2,404 -22
15 1506.30 17,788 45 1,860 0 0 0 1,827 12
16 1507.06 18,070 282 851 0 0 0 556 -13
17 1509.47 18,981 911 1,290 0 392 0 0 13
18 1512.19 20,037 1,056 1,091 0 0 0 0 -35
19 1508.60 18,650 -1,387 0 0 0 0 1,538 151
20 1503.87 16,899 -1,751 0 0 640 0 963 -148
21 1503.87 16,899 0 0 0 0 0 0 0
22 1506.99 18,044 1,145 1,170 0 0 0 0 -25
23 1510.60 19,416 1,372 1,379 0 0 0 0 -7
24 1510.57 19,404 -12 2 0 0 0 0 -14
25 1514.55 20,978 1,574 1,608 0 0 0 0 -34
26 1510.54 19,393 -1,585 1,043 0 635 0 2,098 105
27 1506.16 17,736 -1,657 1,109 0 0 0 2,694 -72
28 1504.77 17,226 -510 1,119 0 0 0 1,588 -41
29 1505.24 17,398 172 1,114 0 0 0 956 14
30 1509.98 19,177 1,779 1,748 0 0 0 0 31
31 1509.98 19,177 0 0 0 0 0 0 0
Total -785 35,088 0 1,757 0 34,016 -100
1/ Values supplied by LADWP, not verified by DWR.
Table 26. Elderberry Forebay
July 2016
Date
Water
Surface
Elevation
(in feet)
StorageStorage
Change
Computed
Losses (-)
And
Gains (+)
Castaic
Powerplant
Generation
1/
Natural
Castaic
Powerplant
Pumpback
1/
To
Castaic Lake
NaturalProject
1/
30

Daily Operation
(in acre-feet except as noted)
Capacity: 323,699 ac-ft
Inflow Outflow
Natural Project
Jun 30 1477.61 246,297
1 1478.85 248,676 2,379 0 3,506 0 1,019 0 0 -108
2 1479.56 250,044 1,368 0 2,358 0 1,016 0 0 26
3 1479.07 249,099 -945 0 0 0 940 0 0 -5
4 1478.83 248,637 -462 0 0 0 971 0 0 509
5 1481.50 253,802 5,165 0 6,850 0 1,080 0 0 -605
6 1483.19 257,101 3,299 0 4,492 0 975 0 0 -218
7 1482.71 256,162 -939 0 0 0 974 0 0 35
8 1482.22 255,205 -957 0 0 0 880 0 0 -77
9 1481.82 254,425 -780 0 0 0 875 0 0 95
10 1481.26 253,336 -1,089 0 0 0 725 0 0 -364
11 1480.86 252,559 -777 0 0 0 941 0 0 164
12 1480.32 251,513 -1,046 0 0 0 1,137 0 0 91
13 1480.93 252,695 1,182 0 2,186 0 1,074 0 0 70
14 1481.54 253,880 1,185 0 2,404 0 1,089 0 0 -130
15 1481.95 254,678 798 0 1,827 0 1,076 0 0 47
16 1481.55 253,900 -778 0 556 0 1,084 0 0 -250
17 1481.13 253,083 -817 0 0 0 989 0 0 172
18 1480.58 252,016 -1,067 0 0 0 976 0 0 -91
19 1480.80 252,443 427 0 1,538 0 950 26 18 -117
20 1480.75 252,346 -97 0 963 0 915 0 44 -101
21 1480.08 251,048 -1,298 0 0 0 985 0 43 -270
22 1479.51 249,947 -1,101 0 0 0 943 0 0 -158
23 1479.07 249,099 -848 0 0 0 981 0 0 133
24 1478.51 248,022 -1,077 0 0 0 939 0 0 -138
25 1478.04 247,120 -902 0 0 0 1,113 0 0 211
26 1478.69 248,368 1,248 0 2,098 0 1,000 0 0 150
27 1479.43 249,793 1,425 0 2,694 0 1,185 0 0 -84
28 1479.65 250,217 424 0 1,588 0 1,138 0 0 -26
29 1479.53 249,986 -231 0 956 0 1,271 0 0 84
30 1478.85 248,676 -1,310 0 0 0 1,219 0 0 -91
31 1478.38 247,773 -903 0 0 0 1,019 0 0 116
Total 1,476 0 34,016 0 31,479 26 105 -930
1/ Values supplied by LADWP, not verified by DWR.
Table 27. Castaic Lake
Date
Water
Surface
Elevation
(in feet)
StorageStorage
Change
July 2016
Computed
Losses (-)
And
Gains (+)
From Elderberry
Forebay 1/ Natural Deliveries
Released
To Castaic
Lagoon
Disposition
of Natural
Inflows
31

(In acre-feet)
Operating Pool
Beginning and Ending
29A 42Oso
Pumping Plant1.49 40,333
Quail Antelope Valley-East Kern Re-
Lake Water Agency moved
Quail Lake Antelope Valley-East Kern
Embankment Water Agency
29GWarne
Powerplant14.07
(Excludes 0 AF of flow thru Gorman
Creek Imp. Channel)40,109
USFS
Pyramid Recreation (T300)
United WA (T300) 0
Pyramid California State Park
Dam Piru Fish (T300)
Castaic
Powerplant25.82 (1,757 AF pump-back ) 2/ 35,088
Elderberry
Forebay
Forebay
Dam
Castaic California State Park
Lake Castaic Lake Recreation (T301)
Castaic
Dam
MWDSC 78" & 132" (T302) 26,786 19,915 3/ 6,871
Castaic Lake WA
18", 24" & 54" (T303)301 301
Castaic Lake WA
(T304)3,946 3,946
MWD-Ventura Co. WPD (T302) 204 204
0
Disposition of Natural inflows 26
Releases to Castaic Lagoon 105
Reach 30 Subtotal: 31,479 24,366 242 0 0 6,871
Castaic
Lagoon
California State Park
Recreation to Lagoon (T353)0
Castaic Lagoon
Outlet31.87 186
1/ Reach 30 actually terminates at mile 31.50. It is shown here as including the outlet works at mile 31.55.
All deliveries from the outlet works and from the Lagoon are billed to Reach 30.
2/ Value supplied by LADWP, not verified by DWR.
3/ Delivery of multi pool water.
W6
28.12
31.47
Castaic
Lake
Outlet
31.55
29J
W4
W3
W530
1/
2 2
5.02
7.82
OtherTable
A
29H
Pyramid
Lake
29F
W2
17.10
Stub
Table 28. Governor Edmund G. Brown California AqueductSouthern Field Division, Monthly Deliveries (West Branch)
Total
Diver-
sions
Deliveries
Rec.Article
56C
Article
14B
Reach
No.Turnout
July 2016
No. Structure Mile
0
242 242
32

Daily Operation
(in acre-feet except as noted)
Capacity: 74,970 ac-ft
Outflow
Project
Jun 30 3348.15 68,447
1 3348.22 68,512 65 3,363 0 0 5 0 3,521 0 0 228 0
2 3347.74 68,066 -446 3,278 0 0 5 1 3,427 0 0 -291 0
3 3348.19 68,484 418 3,898 0 0 5 0 3,385 0 0 -90 0
4 3348.76 69,014 530 4,119 0 0 6 0 3,463 0 0 -120 0
5 3349.31 69,528 514 3,803 0 0 4 0 3,434 0 1 150 0
6 3349.33 69,547 19 3,588 0 0 6 1 3,586 0 0 24 0
7 3349.72 69,913 366 3,885 0 0 4 0 3,668 0 0 153 0
8 3348.93 69,173 -740 3,311 0 0 5 0 3,849 0 0 -197 0
9 3349.25 69,472 299 3,743 0 0 6 0 3,650 0 1 213 0
10 3349.42 69,632 160 4,063 0 0 6 1 3,733 0 0 -163 0
11 3349.67 69,866 234 4,030 0 0 7 0 3,778 0 0 -11 0
12 3349.86 70,045 179 3,637 0 0 7 1 3,569 0 0 119 0
13 3349.93 70,111 66 3,657 0 0 6 0 3,713 0 0 128 0
14 3349.75 69,941 -170 3,501 0 0 7 0 3,588 0 0 -76 0
15 3350.13 70,299 358 4,024 0 0 7 1 3,741 0 1 84 0
16 3350.37 70,525 226 3,890 0 0 5 0 3,578 0 0 -81 0
17 3350.70 70,837 312 3,965 0 0 4 0 3,565 0 0 -84 0
18 3350.30 70,459 -378 3,424 0 0 5 1 3,738 0 0 -58 0
19 3348.97 69,210 -1,249 2,539 0 0 6 0 3,749 0 0 -33 0
20 3347.43 67,780 -1,430 1,977 0 0 5 0 3,351 0 0 -51 0
21 3346.95 67,337 -443 1,338 800 0 4 1 1,948 0 0 -628 0
22 3346.80 67,199 -138 1,539 0 0 6 0 1,626 0 0 -45 0
23 3347.15 67,521 322 1,797 0 0 4 0 1,356 0 0 -115 0
24 3348.17 68,465 944 2,090 860 0 5 0 1,884 0 0 -117 0
25 3350.49 70,639 2,174 2,476 1,438 0 5 1 1,792 0 0 58 0
26 3351.40 71,501 862 3,681 0 0 5 0 2,755 0 1 -58 0
27 3351.52 71,615 114 3,298 0 0 5 0 3,030 0 0 -149 0
28 3351.91 71,987 372 3,397 0 0 5 0 3,035 0 0 15 0
29 3352.21 72,274 287 3,371 0 0 5 1 3,167 0 0 89 0
30 3351.84 71,920 -354 2,992 0 0 6 0 3,253 0 0 -87 0
31 3351.90 71,977 57 3,121 0 0 10 0 3,184 0 1 131 0
Total 3,530 100,795 3,098 0 171 9 99,116 0 5 -1,062 0
1/ Project water delivered from Mojave Siphon in exchange for like amount of natural stream flow.
Natural
Stream
Flow
Delivered
to
CLAWA
Rec.
Table 29. Silverwood Lake
Date
Water
Surface
Elevation
(in feet)
StorageStorage
Change
July 2016
San
Bernardino
Tunnel
InflowComputed
Losses (-)
And
Gains (+)
Las
Flores
Ranch
Exchange
1/
Del.
To
Mojave
W.A.
Natural
To
Mojave
River
Mojave
Siphon
Power-
plant
Mojave
Bypass
Flume
33

Daily Operation(in acre-feet except as noted)
Capacity: 131,452 ac-ft
Jun 30 1548.22 49,0451 1548.88 50,080 1,035 54 0 9 990 2 1548.08 48,827 -1,253 54 0 9 -1,298 3 1548.12 48,889 62 54 0 10 18 4 1548.10 48,858 -31 54 0 8 -77 5 1548.08 48,827 -31 54 0 9 -76 6 1548.11 48,873 46 54 0 9 1 7 1548.10 48,858 -15 54 0 9 -60 8 1548.05 48,780 -78 54 0 9 -123 9 1548.11 48,873 93 54 0 9 48 10 1548.20 49,014 141 54 0 10 97 11 1548.18 48,983 -31 54 0 9 -76 12 1548.13 48,905 -78 54 0 9 -123 13 1548.14 48,920 15 53 0 78 40 14 1548.04 48,764 -156 53 0 17 -192 15 1548.15 48,934 170 53 0 9 126 16 1548.08 48,827 -107 53 0 9 -151 17 1548.12 48,889 62 53 0 22 31 18 1548.14 48,920 31 53 0 18 -4 19 1548.07 48,811 -109 53 0 107 -55 20 1548.08 48,827 16 53 0 206 169 21 1546.99 47,141 -1,686 53 0 236 -1,503 22 1547.89 48,531 1,390 53 0 226 1,563 23 1547.74 48,298 -233 53 0 259 -27 24 1547.50 47,927 -371 53 0 267 -157 25 1547.37 47,726 -201 53 0 277 23 26 1547.31 47,634 -92 53 0 277 132 27 1547.31 47,634 0 53 0 277 224 28 1547.30 47,618 -16 53 0 277 208 29 1547.21 47,480 -138 53 0 276 85 30 1547.26 47,557 77 53 0 287 311 31 1547.26 47,557 0 53 0 286 233
Total -1,488 1,655 0 3,520 377 1/ Readings are not taken on a daily basis. End of month only. 2/ Includes deliveries to MWD from Reach 28J and recreation water to California State Park at Lake Perris.
Table 30. Lake Perris
July 2016
Inflow1/
ComputedLosses (-)Gains (+)
1/
Date
WaterSurface
Elevation(in feet)
Storage StorageChange
Outflow
Pumpback1/ and 2/
Deliveries 1/ and 2/
34

(In acre-feet) Operating Pool
Beginning and Ending
Edmonston
Pumping Plant
41 298.65 KCWA Tej.-Cas 0
17F Check No. 41 303.41
304.80 AVEK WA- (T432) 11 11
Check No. 42 304.99
Alamo
Powerplant305.73
(Includes 83,345 AF generation, 0 AF
plant bypass, and 23,998 AF
Tehachapi Bypass)
107,343
306.71 AVEK 305th Street West (T287) 874 874
308.05 AVEK 294th Street West (T267) 68 68
Check No. 43 309.70311.84 LADWP Connection 0
313.50 AVEK 245th Street West (T269) 0 Check No. 44 314.81
314.93 AVEK 235th Street West (T270) 0 315.57 AVEK 225th Street West (T271) 0
Check No. 45 319.74Antelope Valley-East Kern WA
Fairmont (T272)Mojave Water Agency
Fairmont (T272)Check No. 46 323.84
Reach 19 Total: 942 942 0 0 0 0 47 Check No. 47 326.77
Antelope Valley-East Kern WA
Willow Springs (T273)
Antelope Valley-East Kern WA Re-
120th Street West moved
Check No. 48 330.82
49 Check No. 49 335.93
Antelope Valley-East Kern WA
Quartz Hill (T274)
Antelope Valley-East Kern WA
Rancho Vista (T275)
340.92 AVEK WA-Temp (T387) 0
Check No. 50 341.51
342.06 AVEK WA-Temp (T386) 0
Check No. 51 342.07
Antelope Valley-East Kern WA
30th Street West (T414)
Check No. 52 343.74
346.98 Palmdale WD (T276) Temp. 1,543 418 2/ 1,125
Antelope Valley-East Kern WA
Acton Treatment Plant (T277)
Check No. 53 348.17
54 Check No. 54 350.25
55 Check No. 55 352.70
56 Check No. 56 354.76
354.97AVEK WA- Delivered through
Littlerock Creek ID (T278)0
354.97 Palmdale WD (T276) 0
354.97 Palmdale WD (T391) 0
Check No. 57 356.93
357.60 95th Street East (T279) 0
357.72 96th Street East (T280) 57 57 359.76 East Side Treatment Plant (T281) 315 315
2/ Table A transfer.
1/ Includes 13 AF of pump-in recovery and 1,471 AF delivery under multi pool.
329.65
21
20A
57
52
339.68
336.73
348.14
Antelope Valley-
East Kern WA
342.95
Table 31. Governor Edmund G. Brown California AqueductSouthern Field Division, Monthly Deliveries (East Branch)
42
July 2016
40
Mile
Deliveries
17E
Other
Reach
No.Turnout
Total
Diver-
sionsRec. Transfer
Table
A
293.45
No. Structure
Article
56C
155,853
323.19
50
48
51
326.91
46
19
44
45
22A
58
20B
43
18A
0
57 57
0
1/ 1,484
79 79
3,921 2,437
54 54
0
35

(In acre-feet)
Operating Pool
Beginning and Ending
Pearblossom
Pumping Plant
59 Check No. 59 366.09
366.50 AVEK Big Rock Siphon (T368) 0
Check No. 60 373.94
61 Check No. 61 379.00
62 Check No. 62 384.26
Mojave WA (T282) 380 380
Check No. 63 Mojave WA (T422) 0
64 Check No. 64 395.10
65 Check No. 65 400.32
Mojave Water Agency
Morongo 24" & 42" (T284)
Check No. 66 403.41
Mojave Siphon 405.58 Las Flores Ranch Exchange 0 0
Mojave Siphon
Powerplant
MWA CS DAM (T288) 0
California State Park
Silverwood Silverwood (T288)
Lake Crestline-Lake Arrowhead WA
State Project Water (T289) 171 171
Non-Project Water (T289) 0
Devil Canyon
Powerplant412.73 99,116
MWD-Rialto (T290) 237 237
MWD-Rialto (T293) 29,962 29,962
MWD-Rialto (T294) 37,633 37,633
Desert Water Agency
Transfer (T293)
Coachella Valley WD (T293) 0
Coachella Valley WD (T294) 0
San Gabriel Valley MWD (T290) 2,831 2,831
MWD EBX-1 (T290) 0
MWD EBX-1 (T291) 0
San Bernardino Valley MWD (T291) 5,201 4,554 2/ 647
San Bernardino Valley MWD (T428) 0
San Bernardino Valley MWD (T403) 676 676
San Bernardino Valley MWD (T407) 1,004 1,004
San Gorgonio Pass WA (T413) 953 953
San Bernardino Valley MWD Total 6,881 6,234 0 0 0 647
28G 425.46
Coachella Valley (T295) 0
Coachella Valley (T296) 0
Desert Water Agency (T296) 0
MWD-SC Box Springs (T295) 6,660 6,660
440.05 MWD-SC (T296) 11,475 11,475
442.00 MWD-SC (T297) 276 276
MWD-SC 54" & 78" (T299) 3,220 3,220
Coachella Valley (T2969) 0
Desert Water Agency (T299) 0
Ca. St. Pk. Lake Perris Rec. (T298) 24 24
MWD Total: 116,249 109,378 0 0 0 6,871
2/ Includes 141 AF Exchanged Table A water and 506 AF Table A delivered through reach VCA-R26A turnout T290.
28H
28J
26A
San Bernardino
Intake Tunnel
Devil
Canyon
Afterbay
Control
Structures
25
69
68
Lake
Perris
EBXEast Branch
Extension
433.06
99,116
407.65
23
Rec.Table
A
Total
Diver-
sions
103,893
Deliveries
Other
58
60
63
66
405.65
Santa Ana Valley
Pipeline
24
443.44
Table 31. Governor Edmund G. Brown California AqueductSouthern Field Division, Monthly Deliveries (East Branch, Continued)
Reach
No.
106,075
Turnout
No. Structure Mile
22B
389.20
360.61
401.10
July 2016
TransferArticle
56C
407.70
412.88
1,113 1,113
9
1/ Delivery under multi pools.
(Includes 100,795 AF generation, 0 AF
leakage, and 3,098 AF Bypass flume.)
566 1/ 566
9
36

Alkalinity mg/l as CaCO3 39 68 55 50 78 60 63 64 79Antimony mg/l <0.001 <0.001 <0.001 <0.001 <0.001 <0.001 <0.001 <0.001 <0.001Arsenic mg/l <0.001 0 0 0 0 0 0 0 0Beryllium mg/l <0.001 <0.001 <0.001 <0.001 <0.001 <0.001 <0.001 <0.001 <0.001Boron mg/l <0.1 0 <0.1 <0.1 0 0 0 0 0Bromide mg/l <0.01 0 0 0 0 0 0 0 0Calcium mg/l 8 10 13 11 21 15 16 17 22Chloride mg/l as C 1 12 48 44 85 55 59 61 79Chromium mg/l as C <0.001 <0.001 <0.001 <0.001 <0.001 <0.001 <0.001 0 <0.001Copper mg/l <0.001 0 0 0 0 0 0 0 0Hardness mg/l 34 61 40 61 106 76 86 88 114Iron mg/l 0 0 0 0 0 0 0 0 0Lead mg/l as CaCO3 <0.001 <0.001 <0.001 <0.001 <0.001 <0.001 <0.001 <0.001 <0.001Magnesium mg/l 3 9 2 8 13 9 11 11 14Manganese mg/l <0.005 0 <0.005 <0.005 <0.005 <0.005 <0.005 <0.005 <0.005Nitrate + Nitrite mg/l <0.01 0 0 0 0 0 <0.01 0 0Organic Carbon, Dissolved mg/l NR 4.6a 3.1a 3 4 3.1a 3 4 4.1aOrganic Carbon, Total mg/l as N NR 4.5a 2.5a 3 4 2.8a 3 4 3.9aPhosphate-Ortho mg/l as P <0.01 0 0 0 0 0 NR 0 0Phosphorus-Total mg/l <0.01 0 0 0 0 0 0 0 0Selenium mg/l <0.001 <0.001 <0.001 <0.001 0 <0.001 0 0 0Sodium mg/l 3 15 32 30 57 40 44 45 59Specific Conductance µS/cm 86 201 312 288 523 372 383 405 520Sulfate mg/l 2 11 17 15 38 30 31 32 46Total Dissolved Solids mg/l 56 119 173 160 290 206 217 227 289Turbidity NTU 2 7 3 7 4 4 5 4 2Zinc mg/l <0.005 <0.005 <0.005 <0.005 <0.005 <0.005 0 <0.005 <0.005
mg/L = milligrams per liter N.T.U. = Nephelometric turbidity NR = No data recorded at this location.
*NOTE: A grab sample is a single sample chosen to represent conditions in a given matrix (usually natural water) at a specific location, depth, and time.a DOC > TOC confirmed on re-analysis.
Table 32. Water Quality At Selected SWP LocationsJuly 2016
Constituent Units
ThermalitoAfterbay
AtOutlet
North BayAqueduct
Barker SloughPumping Plant
DeltaMendotaCanal At
McCabe Rd.
California Aqueduct
BanksPumping Plant
O'NeillForebayOutlet
(Check 13)
KettlemanCity
(Check 21)
Devil CanyonHeadworks
NearHwy 119
(Check 29)
TehachapiAfterbay
(Check 41)
37

Cl in mg/l
md md md md 14dm md 14dm md md md md
1 6.72 4.61 6,998 6,998 9,691 2.53 8.94 0.68 0.51 0.62 0.49 0.28 0.00 0.27 41
2 6.99 4.78 6,386 6,692 9,681 2.54 9.04 0.94 0.55 0.73 0.51 0.28 0.00 0.26 41
3 7.12 4.77 7,636 6,775 9,201 2.76 9.45 1.05 0.60 0.81 0.54 0.29 0.00 0.26 41
4 7.09 4.76 7,020 6,836 9,788 2.79 9.39 1.05 0.63 0.82 0.57 0.30 0.00 0.28 41
5 6.92 4.69 7,001 6,869 9,930 2.51 8.79 1.00 0.66 0.78 0.59 0.30 0.00 0.29 46
6 6.71 4.56 7,083 6,905 10,246 2.44 8.46 0.84 0.68 0.76 0.61 0.30 0.00 0.30 47
7 6.42 4.43 7,127 7,036 10,562 2.32 7.96 0.74 0.68 0.72 0.62 0.32 0.00 0.32 47
8 6.03 4.31 6,972 7,028 10,464 2.13 7.55 0.56 0.68 0.69 0.63 0.31 0.00 0.32 47
9 5.50 4.11 6,967 7,021 10,445 1.96 7.03 0.43 0.68 0.66 0.65 0.29 0.00 0.32 47
10 5.41 3.90 6,776 6,997 10,320 1.76 6.34 0.35 0.67 0.63 0.66 0.28 0.00 0.33 47
11 5.61 3.86 7,232 7,018 10,517 1.64 6.10 0.29 0.67 0.62 0.67 0.27 0.00 0.34 65
12 5.84 3.97 7,418 7,051 10,703 1.74 6.73 0.29 0.66 0.65 0.68 0.25 0.00 0.36 67
13 5.90 3.98 6,651 7,021 10,814 1.85 6.82 0.28 0.65 0.68 0.69 0.26 0.00 0.33 69
14 6.21 4.22 6,624 6,992 10,817 2.11 7.85 0.35 0.63 0.74 0.71 0.27 0.00 0.30 68
15 6.43 4.50 6,493 6,959 10,728 2.59 9.91 0.47 0.62 0.85 0.72 0.27 0.00 0.29 68
16 6.57 4.71 10,072 7,154 10,512 3.07 10.74 0.71 0.60 0.98 0.74 0.27 0.00 0.26 68
17 6.75 4.66 10,027 7,323 10,337 3.01 10.18 0.75 0.58 0.97 0.75 0.28 0.00 0.29 68
18 6.63 4.49 13,378 7,659 10,320 2.65 8.73 0.67 0.55 0.85 0.75 0.29 0.00 0.30 71
19 6.46 4.33 13,942 7,990 10,660 2.19 7.64 0.58 0.52 0.73 0.75 0.30 0.00 0.30 72
20 6.37 4.27 13,219 8,251 10,902 1.83 6.74 0.50 0.50 0.65 0.74 0.29 0.00 0.31 72
21 6.31 4.23 10,930 8,379 10,902 1.67 6.37 0.45 0.48 0.62 0.74 0.28 0.00 0.31 74
22 6.08 4.05 8,765 8,396 10,775 1.49 5.68 0.36 0.46 0.57 0.73 0.27 0.00 0.30 75
23 5.79 4.10 9,116 8,436 11,042 1.46 5.47 0.33 0.46 0.57 0.72 0.28 0.00 0.29 75
24 5.68 4.16 8,790 8,450 10,791 1.48 5.67 0.34 0.45 0.58 0.72 0.29 0.00 0.30 75
25 5.85 4.24 8,512 8,445 10,894 1.42 5.57 0.29 0.45 0.58 0.71 0.28 0.00 0.30 81
26 6.06 4.17 8,017 8,429 10,968 1.40 5.30 0.28 0.45 0.56 0.71 0.26 0.00 0.31 82
27 6.32 4.29 8,056 8,415 11,020 1.50 5.68 0.25 0.45 0.58 0.70 0.27 0.00 0.32 84
28 6.59 4.50 7,922 8,397 10,973 1.67 6.59 0.30 0.45 0.62 0.69 0.26 0.00 0.31 83
29 6.51 4.49 8,118 8,388 11,022 1.80 7.14 0.39 0.44 0.66 0.68 0.25 0.00 0.29 82
30 6.49 4.28 8,119 8,379 11,208 1.80 0.00 0.50 0.43 0.71 0.66 0.26 0.00 0.29 82
31 6.39 4.18 8,501 8,429 11,470 1.90 0.00 0.60 0.42 0.76 0.65 0.26 0.00 0.28 82
Clifton Court Cl(mg/l)=200X EC - 25 e = Estimated f = Excess Delta conditions with fish concerns.
N.R. = No Record. r = Excess delta conditions with export/inflow ratio concerns. dm = Daily Mean
N.C. = Not computed due to insufficient data. s = Balanced water conditions with storage withdrawals. md = Mean Daily
Table 33. Water Quality At Selected Delta StationsJuly 2016
Highest
High Tide
Actual High
Half Tide
Contra
Costa
Canal
IntakeMean
Daily
Monthly
Average
Clifton
Court
Cache
Slough
Delta
Mendota
Canal
Date
Flow In CFS Electrical Conductivity in milliSiemens/cm
Net Delta
Outflow Index Rio
VistaAntioch
Chipps
IslandEmmaton
Jersey
Point
Antioch Tides
(feet above mean sea level)
38

Substances Detected In the SWPJuly 2016
North Bay Aqueduct At June 17, 2016 Atrazine 0.02Barker Slough Pumping Plant Metolachlor 0.06
California Aqueduct At June 17, 2016 Atrazine 0.03Banks Pumping Plant
O'Neill Forebay Outlet June 14, 2016 Simazine 0.03Check 13
Delta Mendota Canal At June 14, 2016 Metalochlor 0.15McCabe Road
California Aqueduct Near June 14, 2016 None 0.00Kettleman City (Check 21)
California Aqueduct At June 14, 2016 Simazine 0.03Near Highway 119 (Check 29)
California Aqueduct at June 14, 2016 Simazine 0.03Tehachapi Afterbay (Check 41)
California Aqueduct At June 15, 2016 Simazine 0.03Devil Canyon 2nd Afterbay( 2nd Afterbay )
1/ Locations are normally sampled during March, June, and September. Monthly reports will include data for the month in which samples were most recently taken.2/ Micrograms per liter.
39
Sampling LocationSample
Date1/
ChemicalDetected
Concentrationµg/l2/
Table 34. Pesticides, Herbicides, and Other Organic

Table 35. Oroville and Delta Field Divisions Energy Data
(in kWh)
Generation Load
1 13,986,566 0 38,494 48,192 3,287,304 3,287,304 417,816 238
2 14,019,016 0 36,219 44,519 3,937,704 3,937,704 434,784 234
3 14,003,220 0 31,674 38,748 3,158,424 3,158,424 524,796 233
4 14,010,920 0 32,118 42,586 3,379,208 3,379,208 483,834 232
5 14,026,265 0 36,032 44,810 3,429,568 3,429,568 389,332 222
6 13,978,855 0 39,171 44,810 3,761,784 3,761,784 389,446 215
7 14,015,199 0 36,864 40,114 4,119,880 4,119,880 469,774 212
8 13,719,156 0 37,751 45,309 3,950,216 3,950,216 435,546 212
9 13,890,459 0 37,702 45,001 3,825,800 3,825,800 151,970 217
10 13,901,558 0 35,697 46,757 3,936,752 3,936,752 340,334 216
11 13,707,408 0 33,308 39,278 3,982,424 3,982,424 469,932 222
12 13,696,936 0 32,033 32,988 4,007,720 4,007,720 443,584 217
13 13,682,614 0 36,916 40,270 3,912,280 3,912,280 426,369 227
14 13,383,601 0 35,389 37,137 3,791,432 3,791,432 422,428 242
15 13,478,652 0 38,297 34,599 3,889,560 3,889,560 500,805 235
16 13,487,188 0 38,133 36,253 2,612,880 2,612,880 455,752 230
17 13,374,790 0 29,660 26,662 1,915,352 1,915,352 330,462 223
18 13,297,812 0 31,224 32,573 698,512 698,512 571,032 215
19 13,293,698 0 29,596 29,430 375,096 375,096 506,944 213
20 13,194,698 0 28,233 29,812 734,632 734,632 488,615 217
21 13,201,617 0 31,322 30,674 2,032,168 2,032,168 86,313 218
22 13,092,398 0 38,697 34,296 3,224,824 3,224,824 456,827 223
23 13,026,233 0 36,907 37,232 3,332,056 3,332,056 495,002 233
24 12,815,253 0 39,255 37,055 3,281,208 3,281,208 472,851 237
25 13,059,101 0 33,393 33,368 3,600,800 3,600,800 444,973 235
26 12,527,174 0 35,703 32,539 3,927,312 3,927,312 494,066 244
27 12,295,360 0 31,589 30,652 3,942,040 3,942,040 560,273 244
28 11,914,848 0 34,018 30,732 3,945,664 3,945,664 451,062 245
29 12,511,378 0 35,729 34,073 3,939,992 3,939,992 447,294 247
30 12,188,660 0 35,322 32,915 3,655,672 3,655,672 445,673 236
31 12,338,106 0 35,351 35,546 3,501,648 3,501,648 423,360 227
Total 413,118,739 0 1,081,797 1,148,930 101,089,912 101,089,912 13,431,249 7,061
July 2016
DateOroville Thermalito
ComplexBarker Slough
PumpingPlant
CordeliaPumping Plant
Load
Banks Pumping Plant South BayPumping Plant
Load
Del VallePumping Plant
LoadTotalLoad
SWPLoad
40

Table 36. San Luis Field Division Energy Data
(in kWh)
TotalLoad
SWPLoad 1/
TotalGeneration
SWPGeneration 1/
TotalLoad
SWPLoad 1/
1 1,290,557 1,290,557 1,169,344 1,169,344 9,801 9,801
2 1,368,452 1,368,452 1,298,704 1,298,704 10,098 10,098
3 1,504,494 1,504,494 2,014,815 2,014,815 7,568 7,568
4 1,547,316 1,547,316 2,901,679 2,901,679 0 0
5 1,443,685 1,443,685 1,560,438 1,560,438 1,694 1,694
6 1,133,368 1,133,368 1,265,176 1,265,176 10,395 10,395
7 1,415,707 1,415,707 1,342,748 1,342,748 6,985 6,985
8 1,577,318 1,577,318 1,188,891 1,188,891 8,569 8,569
9 1,525,268 1,525,268 1,585,166 1,585,166 0 0
10 1,496,237 1,496,237 1,772,716 1,772,716 968 968
11 1,963,148 1,963,148 1,817,464 1,817,464 5,676 5,676
12 1,551,209 1,551,209 1,898,292 1,898,292 0 0
13 1,620,659 1,620,659 1,745,986 1,745,986 0 0
14 1,840,487 1,840,487 1,885,180 1,885,180 0 0
15 1,777,313 1,777,313 1,707,024 1,707,024 132 132
16 1,879,864 1,879,864 1,733,138 1,733,138 5,819 5,819
17 1,841,594 1,841,594 1,663,068 1,663,068 6,688 6,688
18 1,738,492 1,738,492 1,631,993 1,631,993 6,908 6,908
19 1,543,255 1,543,255 1,585,991 1,585,991 5,896 5,896
20 1,629,671 1,629,671 1,447,061 1,447,061 6,864 6,864
21 1,788,804 1,788,804 1,135,057 1,135,057 9,086 9,086
22 1,864,075 1,864,075 686,939 686,939 11,880 11,880
23 1,813,790 1,813,790 735,471 735,471 7,876 7,876
24 1,932,871 1,932,871 1,154,989 1,154,989 9,977 9,977
25 1,894,531 1,894,531 1,048,234 1,048,234 9,526 9,526
26 1,780,585 1,780,585 1,120,889 1,120,889 8,657 8,657
27 1,678,763 1,678,763 1,600,467 1,600,467 4,312 4,312
28 1,841,270 1,841,270 1,379,103 1,379,103 8,041 8,041
29 1,759,428 1,759,428 1,455,817 1,455,817 6,402 6,402
30 1,779,775 1,779,775 1,220,428 1,220,428 5,335 5,335
31
Total 49,821,986 49,821,986 44,752,268 44,752,268 175,153 175,153
July 2016
DateDos Amigos Pumping Plant Gianelli Pumping-Generating Plant
1/ Negative values may appear in SWP columns and indicate a mismatch of scheduled CVP energy and actual pumping; adjustments to SWP water shares are made to balance the mismatch.
41

Table 37. San Joaquin Field Division Plant Energy Load Data
(in kWh)
LasPerillas
BadgerHill
Devil'sDen Bluestone Polonio Buena
Vista Teerink Chrisman Edmonston
1 46,194 112,678 74,656 70,558 75,358 1,833,721 1,837,067 4,018,058 14,388,003
2 56,266 135,792 66,817 63,027 66,561 1,838,072 1,850,411 4,027,034 14,600,304
3 61,249 148,989 84,174 78,363 85,006 1,832,924 1,947,182 4,260,531 15,450,804
4 63,464 151,892 77,855 72,906 77,348 1,587,758 1,651,662 3,537,721 12,743,595
5 61,817 148,740 74,310 66,876 72,296 1,577,093 1,609,769 3,445,882 12,237,129
6 52,477 126,482 59,699 55,241 59,085 1,745,055 1,702,053 3,687,244 13,098,159
7 51,999 122,564 85,337 80,340 85,324 1,663,283 1,641,764 3,571,722 12,689,244
8 60,226 143,542 80,769 76,623 81,144 1,631,740 1,650,087 3,580,247 12,591,612
9 63,618 150,381 73,974 69,019 74,085 1,697,301 1,709,762 3,691,886 13,138,686
10 60,669 143,911 74,816 70,769 75,520 1,612,836 1,719,266 3,785,243 13,606,083
11 54,425 130,532 84,959 79,679 83,127 1,560,260 1,592,656 3,476,715 12,466,008
12 53,898 125,843 77,824 73,755 78,942 1,532,894 1,515,742 3,294,797 11,591,208
13 57,912 131,928 75,985 70,374 75,919 1,496,142 1,499,542 3,298,658 11,584,458
14 58,071 132,199 72,408 68,219 72,388 1,556,597 1,491,534 3,299,109 11,581,596
15 56,651 128,644 76,725 73,059 77,041 1,501,976 1,518,494 3,343,923 11,577,573
16 60,247 136,699 93,946 90,185 94,391 1,517,958 1,505,974 3,236,398 11,576,385
17 54,385 127,656 74,177 66,788 74,159 1,389,497 1,460,135 3,220,404 11,574,225
18 55,331 130,069 80,478 76,394 79,327 1,257,210 1,298,597 2,814,020 9,890,883
19 61,035 143,640 82,849 77,161 83,240 979,218 882,466 1,891,670 6,420,789
20 56,310 134,663 73,983 71,179 73,870 710,966 628,702 1,306,635 4,407,642
21 55,787 129,512 88,430 82,746 88,913 741,334 642,082 1,338,777 4,647,834
22 55,258 130,480 69,134 63,961 69,646 848,713 789,435 1,657,689 5,520,582
23 58,293 141,022 85,944 80,768 85,974 1,165,394 1,182,042 2,531,243 9,011,898
24 64,344 154,986 85,780 81,285 85,866 1,648,499 1,707,525 3,749,108 13,761,954
25 55,479 134,770 74,688 69,294 74,151 1,537,546 1,655,640 3,573,405 12,938,049
26 55,602 127,701 74,463 69,789 75,273 1,389,681 1,394,183 2,976,380 10,380,906
27 54,015 122,900 84,240 78,338 83,099 1,475,118 1,507,678 3,240,655 11,532,753
28 57,573 137,324 78,600 74,310 78,604 1,409,962 1,439,932 3,098,282 10,669,023
29 56,862 137,057 82,314 78,374 82,220 1,427,882 1,495,885 3,228,841 11,328,849
30 61,443 146,806 72,422 66,195 70,266 1,412,037 1,381,835 3,001,977 10,696,887
31 55,146 130,314 68,899 65,790 69,042 1,360,854 1,433,610 3,160,630 11,397,483
Total 1,776,046 4,199,716 2,410,655 2,261,365 2,407,185 44,939,521 45,342,712 98,344,884 349,100,604
July 2016
DateCoastal Branch California Aquedect
42

Table 38. Southern Field Division Energy Data
(in kWh)
OsoPumping
PlantLoad
WarnePowerplantGeneration
CastaicPowerplant
SWPGen 1/
AlamoPowerplantGeneration
PearblossomPumping
PlantLoad
Devil Canyon
PowerplantGeneration
Mojave Siphon
PowerplantGeneration
Greenspot
PumpingPlant
CraftonHills
PumpingPlant
CherryValley
PumpingPlant
1 690,932 1,601,519 0 321,529 2,338,108 4,284,500 272,411 65,140 65,480 4,058
2 733,452 1,602,385 0 330,282 2,396,104 4,155,077 268,308 65,030 65,395 3,906
3 701,293 1,781,438 0 325,035 2,484,435 4,113,083 309,198 64,996 65,345 4,008
4 400,058 861,972 0 320,758 2,685,116 4,215,744 313,140 62,589 65,362 4,133
5 364,222 870,804 0 311,318 2,683,665 4,156,394 302,353 53,162 56,311 4,063
6 389,718 977,289 0 327,965 2,681,019 4,308,887 290,314 61,913 65,304 4,090
7 411,527 928,117 0 305,481 2,682,749 4,438,184 310,309 64,381 65,338 4,092
8 375,264 961,878 0 202,788 2,480,202 4,623,742 265,262 65,884 65,389 3,971
9 424,918 963,544 0 324,361 2,544,767 4,393,642 306,803 66,278 65,388 3,943
10 543,365 263,426 0 322,333 2,678,402 4,510,195 311,262 66,252 65,374 3,936
11 328,700 935,542 0 318,140 2,682,824 4,471,905 308,984 66,435 65,352 3,876
12 250,557 818,114 0 319,611 2,685,458 4,315,705 294,382 66,453 65,321 4,115
13 266,339 818,816 0 319,287 2,679,305 4,503,813 297,185 66,837 65,378 5,114
14 218,054 861,038 0 308,017 2,679,857 4,376,020 291,668 66,859 65,406 4,208
15 239,133 674,406 0 311,209 2,678,009 4,517,122 305,849 59,782 61,356 2,029
16 236,059 601,214 0 310,935 2,678,833 4,352,929 299,761 50,578 50,366 1,254
17 267,973 534,827 0 311,597 2,677,001 4,348,764 302,987 45,432 50,431 1,259
18 258,974 369,260 0 321,255 2,288,177 4,542,980 263,404 13,213 328 1,259
19 50,366 0 0 299,655 1,757,984 4,538,614 196,745 15,101 0 1,284
20 8,864 301,636 0 234,945 1,195,028 4,058,572 151,898 16,073 0 1,301
21 8,929 208,346 0 205,181 998,338 2,404,321 108,707 14,364 0 1,338
22 228,906 313,173 0 219,537 1,017,827 1,982,592 128,874 39,444 33,451 825
23 427,253 345,546 0 271,380 1,290,273 1,660,806 139,557 65,506 66,088 567
24 507,339 633,555 0 319,660 2,407,400 2,325,042 171,197 67,044 65,628 532
25 432,663 670,883 0 329,694 2,563,119 2,223,853 194,381 66,250 65,602 3,090
26 283,107 671,061 0 314,626 2,374,090 3,390,095 280,519 62,677 65,619 3,897
27 476,858 782,706 0 326,081 2,083,825 3,739,856 252,653 61,485 65,967 3,911
28 268,017 669,030 0 309,537 2,541,864 3,733,376 272,773 59,367 65,605 3,906
29 242,722 680,894 0 319,843 2,515,611 3,907,487 272,907 60,214 65,860 3,929
30 389,227 682,871 0 265,652 1,893,185 3,969,911 221,514 61,350 66,598 3,927
31 351,456 659,993 0 330,968 2,403,270 3,911,468 253,562 60,830 65,528 3,877
Total 10,776,245 23,045,283 0 9,358,660 71,745,845 120,474,679 7,958,867 1,720,919 1,694,570 95,698
1/ Energy delivered to SWP by LADWP at Sylmar substation; not necessarily related to actual Castaic operations.
July 2016
Date
West Branch East Branch East Branch Extension
43