state-specific prevalence of quit attempts among adult ... · have you stopped smoking for 1 day or...
TRANSCRIPT
Morbidity and Mortality Weekly ReportWeekly / Vol. 68 / No. 28 July 19, 2019
INSIDE627 Successive Norovirus Outbreaks at an Event
Center — Nebraska, October–November, 2017631 Notes from the Field: Hurricane Florence–Related
Emergency Department Visits — North Carolina, 2018633 QuickStats
Continuing Education examination available at https://www.cdc.gov/mmwr/cme/conted_info.html#weekly.
U.S. Department of Health and Human ServicesCenters for Disease Control and Prevention
State-Specific Prevalence of Quit Attempts Among Adult Cigarette Smokers — United States, 2011–2017
Kimp Walton, MS1; Teresa W. Wang, PhD1; Gillian L. Schauer, PhD2,3; Sean Hu, MD1; Henraya F. McGruder, PhD1; Ahmed Jamal, MBBS1; Stephen Babb, MPH1
From 1965 to 2017, the prevalence of cigarette smoking among U.S. adults aged ≥18 years decreased from 42.4% to 14.0%, in part because of increases in smoking cessation (1,2). Increasing smoking cessation can reduce smoking-related disease, death, and health care expenditures (3). Increases in cessation are driven in large part by increases in quit attempts (4). Healthy People 2020 objective 4.1 calls for increasing the proportion of U.S. adult cigarette smokers who made a past-year quit attempt to ≥80% (5). To assess state-specific trends in the prevalence of past-year quit attempts among adult cigarette smokers, CDC analyzed data from the 2011–2017 Behavioral Risk Factor Surveillance System (BRFSS) surveys for all 50 states, the District of Columbia (DC), Guam, and Puerto Rico. During 2011–2017, quit attempt prevalence increased in four states (Kansas, Louisiana, Virginia, and West Virginia), declined in two states (New York and Tennessee), and did not significantly change in the remaining 44 states, DC, and two territories. In 2017, the prevalence of past-year quit attempts ranged from 58.6% in Wisconsin to 72.3% in Guam, with a median of 65.4%. In 2017, older smokers were less likely than younger smokers to make a quit attempt in most states. Implementation of comprehensive state tobacco control programs and evidence-based tobacco control interven-tions, including barrier-free access to cessation treatments, can increase the number of smokers who make quit attempts and succeed in quitting (2,3).
BRFSS is an annual state-based telephone (landline and cellular) survey of a randomly selected representative sample of noninstitutionalized U.S. adults aged ≥18 years.* During 2011–2017, BRFSS sample sizes ranged from 441,456 (2014) to 506,467 (2011). Median survey response rates ranged from
* https://www.cdc.gov/brfss.
45.3% (2017) to 53.0% (2011) for landlines and from 27.9% (2011) to 47.2% (2015) for cellular phones.
Overall and age group–specific (18–24, 25–44, 45–64, and ≥65 years) prevalences of smokers who made quit attempts were calculated for 2011–2017 for the 50 states, DC, Guam, and Puerto Rico. Making a past-year quit attempt was defined as answering yes to the question, “During the past 12 months, have you stopped smoking for 1 day or longer because you were trying to quit smoking?” Past-year quit attempts were assessed among both current cigarette smokers† and former cigarette smokers who quit within the past year.§ Chi-square tests were performed to examine differences in past-year quit attempts between the years 2011 and 2017 (p<0.05). Logistic regression was used to assess overall changes in prevalence
† Current cigarette smokers were defined as persons aged ≥18 years who reported smoking at least 100 cigarettes in their lifetime and smoking “every day” or “some days” at the time of the survey.
§ Former cigarette smokers were defined as persons aged ≥18 years who reported smoking at least 100 cigarettes in their lifetime and who do not smoke now. Quitting within the past year was defined as answering “within the past month,” “within the past 3 months,” “within the past 6 months,” or “within the past year” to the question “How long has it been since you last smoked a cigarette, even one or two puffs?”
Morbidity and Mortality Weekly Report
622 MMWR / July 19, 2019 / Vol. 68 / No. 28 US Department of Health and Human Services/Centers for Disease Control and Prevention
The MMWR series of publications is published by the Center for Surveillance, Epidemiology, and Laboratory Services, Centers for Disease Control and Prevention (CDC), U.S. Department of Health and Human Services, Atlanta, GA 30329-4027.Suggested citation: [Author names; first three, then et al., if more than six.] [Report title]. MMWR Morb Mortal Wkly Rep 2019;68:[inclusive page numbers].
Centers for Disease Control and PreventionRobert R. Redfield, MD, Director
Anne Schuchat, MD, Principal Deputy DirectorChesley L. Richards, MD, MPH, Deputy Director for Public Health Science and Surveillance
Rebecca Bunnell, PhD, MEd, Director, Office of ScienceBarbara Ellis, PhD, MS, Acting Director, Office of Science Quality, Office of Science
Michael F. Iademarco, MD, MPH, Director, Center for Surveillance, Epidemiology, and Laboratory Services
MMWR Editorial and Production Staff (Weekly)Charlotte K. Kent, PhD, MPH, Editor in Chief
Jacqueline Gindler, MD, EditorMary Dott, MD, MPH, Online Editor
Terisa F. Rutledge, Managing Editor Douglas W. Weatherwax, Lead Technical Writer-Editor
Glenn Damon, Soumya Dunworth, PhD, Teresa M. Hood, MS, Technical Writer-Editors
Martha F. Boyd, Lead Visual Information SpecialistMaureen A. Leahy, Julia C. Martinroe,
Stephen R. Spriggs, Tong Yang,Visual Information Specialists
Quang M. Doan, MBA, Phyllis H. King, Terraye M. Starr, Moua Yang,
Information Technology SpecialistsMMWR Editorial Board
Timothy F. Jones, MD, ChairmanMatthew L. Boulton, MD, MPH
Virginia A. Caine, MD Katherine Lyon Daniel, PhD
Jonathan E. Fielding, MD, MPH, MBADavid W. Fleming, MD
William E. Halperin, MD, DrPH, MPH
Robin Ikeda, MD, MPH Phyllis Meadows, PhD, MSN, RNJewel Mullen, MD, MPH, MPA
Jeff Niederdeppe, PhDPatricia Quinlisk, MD, MPH
Stephen C. Redd, MD Patrick L. Remington, MD, MPH
Carlos Roig, MS, MAWilliam Schaffner, MD
Morgan Bobb Swanson, BS
during 2011–2017, controlling for sex, age group, and race/ethnicity (p<0.05). Quartiles were mapped and assessed by U.S. Census region.¶ All analyses were conducted using SAS-callable SUDAAN software (version 11.0.3; RTI International) to account for the complex survey sampling design.
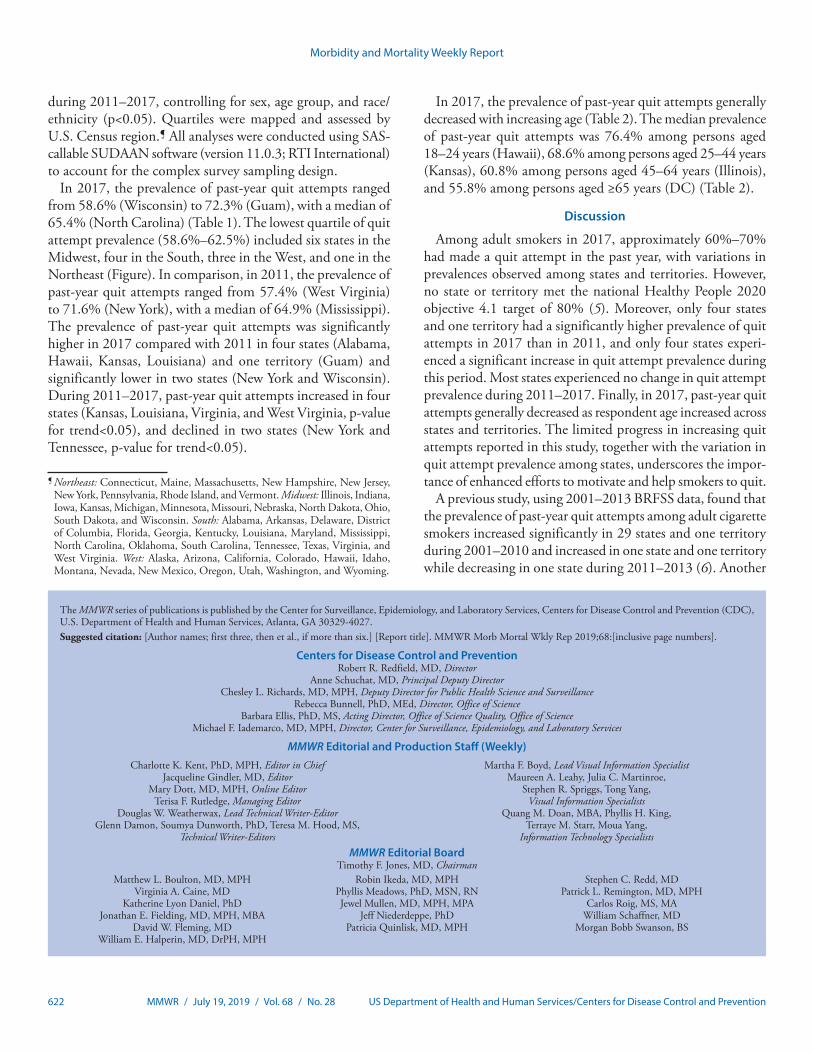
In 2017, the prevalence of past-year quit attempts ranged from 58.6% (Wisconsin) to 72.3% (Guam), with a median of 65.4% (North Carolina) (Table 1). The lowest quartile of quit attempt prevalence (58.6%–62.5%) included six states in the Midwest, four in the South, three in the West, and one in the Northeast (Figure). In comparison, in 2011, the prevalence of past-year quit attempts ranged from 57.4% (West Virginia) to 71.6% (New York), with a median of 64.9% (Mississippi). The prevalence of past-year quit attempts was significantly higher in 2017 compared with 2011 in four states (Alabama, Hawaii, Kansas, Louisiana) and one territory (Guam) and significantly lower in two states (New York and Wisconsin). During 2011–2017, past-year quit attempts increased in four states (Kansas, Louisiana, Virginia, and West Virginia, p-value for trend<0.05), and declined in two states (New York and Tennessee, p-value for trend<0.05).
¶ Northeast: Connecticut, Maine, Massachusetts, New Hampshire, New Jersey, New York, Pennsylvania, Rhode Island, and Vermont. Midwest: Illinois, Indiana, Iowa, Kansas, Michigan, Minnesota, Missouri, Nebraska, North Dakota, Ohio, South Dakota, and Wisconsin. South: Alabama, Arkansas, Delaware, District of Columbia, Florida, Georgia, Kentucky, Louisiana, Maryland, Mississippi, North Carolina, Oklahoma, South Carolina, Tennessee, Texas, Virginia, and West Virginia. West: Alaska, Arizona, California, Colorado, Hawaii, Idaho, Montana, Nevada, New Mexico, Oregon, Utah, Washington, and Wyoming.
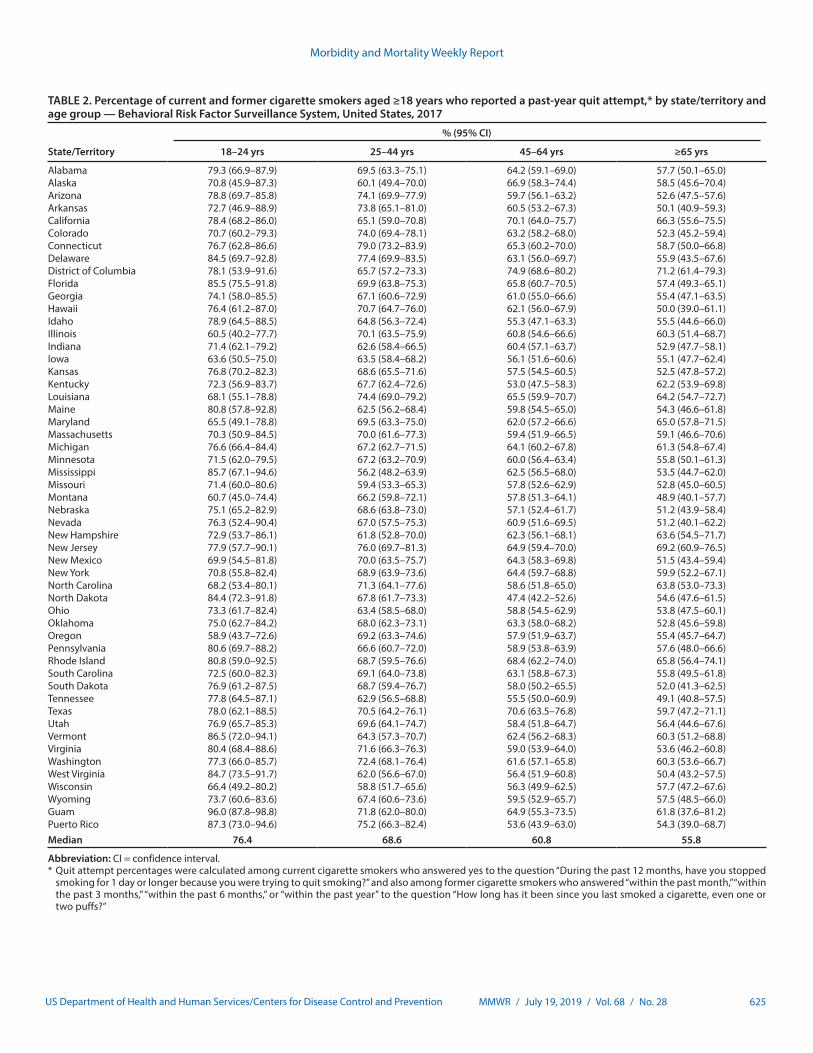
In 2017, the prevalence of past-year quit attempts generally decreased with increasing age (Table 2). The median prevalence of past-year quit attempts was 76.4% among persons aged 18–24 years (Hawaii), 68.6% among persons aged 25–44 years (Kansas), 60.8% among persons aged 45–64 years (Illinois), and 55.8% among persons aged ≥65 years (DC) (Table 2).
Discussion
Among adult smokers in 2017, approximately 60%–70% had made a quit attempt in the past year, with variations in prevalences observed among states and territories. However, no state or territory met the national Healthy People 2020 objective 4.1 target of 80% (5). Moreover, only four states and one territory had a significantly higher prevalence of quit attempts in 2017 than in 2011, and only four states experi-enced a significant increase in quit attempt prevalence during this period. Most states experienced no change in quit attempt prevalence during 2011–2017. Finally, in 2017, past-year quit attempts generally decreased as respondent age increased across states and territories. The limited progress in increasing quit attempts reported in this study, together with the variation in quit attempt prevalence among states, underscores the impor-tance of enhanced efforts to motivate and help smokers to quit.
A previous study, using 2001–2013 BRFSS data, found that the prevalence of past-year quit attempts among adult cigarette smokers increased significantly in 29 states and one territory during 2001–2010 and increased in one state and one territory while decreasing in one state during 2011–2013 (6). Another
Morbidity and Mortality Weekly Report
MMWR / July 19, 2019 / Vol. 68 / No. 28 623US Department of Health and Human Services/Centers for Disease Control and Prevention
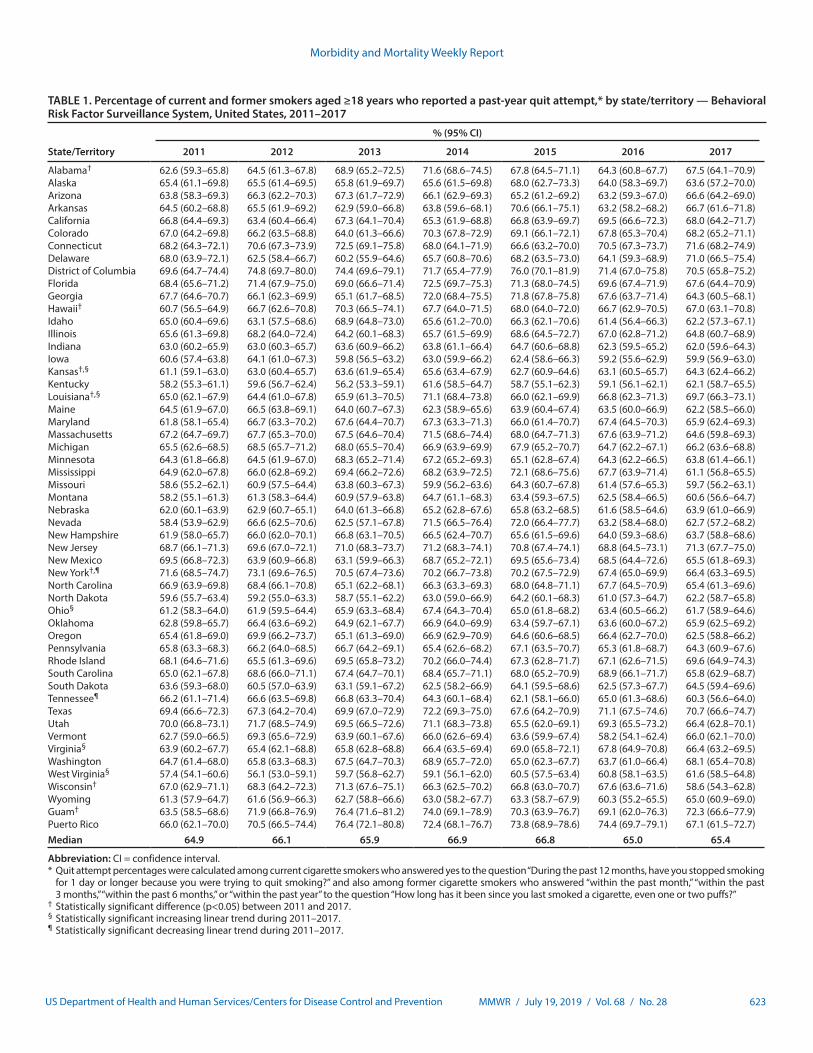
TABLE 1. Percentage of current and former smokers aged ≥18 years who reported a past-year quit attempt,* by state/territory — Behavioral Risk Factor Surveillance System, United States, 2011–2017
State/Territory
% (95% CI)
2011 2012 2013 2014 2015 2016 2017
Alabama† 62.6 (59.3–65.8) 64.5 (61.3–67.8) 68.9 (65.2–72.5) 71.6 (68.6–74.5) 67.8 (64.5–71.1) 64.3 (60.8–67.7) 67.5 (64.1–70.9)Alaska 65.4 (61.1–69.8) 65.5 (61.4–69.5) 65.8 (61.9–69.7) 65.6 (61.5–69.8) 68.0 (62.7–73.3) 64.0 (58.3–69.7) 63.6 (57.2–70.0)Arizona 63.8 (58.3–69.3) 66.3 (62.2–70.3) 67.3 (61.7–72.9) 66.1 (62.9–69.3) 65.2 (61.2–69.2) 63.2 (59.3–67.0) 66.6 (64.2–69.0)Arkansas 64.5 (60.2–68.8) 65.5 (61.9–69.2) 62.9 (59.0–66.8) 63.8 (59.6–68.1) 70.6 (66.1–75.1) 63.2 (58.2–68.2) 66.7 (61.6–71.8)California 66.8 (64.4–69.3) 63.4 (60.4–66.4) 67.3 (64.1–70.4) 65.3 (61.9–68.8) 66.8 (63.9–69.7) 69.5 (66.6–72.3) 68.0 (64.2–71.7)Colorado 67.0 (64.2–69.8) 66.2 (63.5–68.8) 64.0 (61.3–66.6) 70.3 (67.8–72.9) 69.1 (66.1–72.1) 67.8 (65.3–70.4) 68.2 (65.2–71.1)Connecticut 68.2 (64.3–72.1) 70.6 (67.3–73.9) 72.5 (69.1–75.8) 68.0 (64.1–71.9) 66.6 (63.2–70.0) 70.5 (67.3–73.7) 71.6 (68.2–74.9)Delaware 68.0 (63.9–72.1) 62.5 (58.4–66.7) 60.2 (55.9–64.6) 65.7 (60.8–70.6) 68.2 (63.5–73.0) 64.1 (59.3–68.9) 71.0 (66.5–75.4)District of Columbia 69.6 (64.7–74.4) 74.8 (69.7–80.0) 74.4 (69.6–79.1) 71.7 (65.4–77.9) 76.0 (70.1–81.9) 71.4 (67.0–75.8) 70.5 (65.8–75.2)Florida 68.4 (65.6–71.2) 71.4 (67.9–75.0) 69.0 (66.6–71.4) 72.5 (69.7–75.3) 71.3 (68.0–74.5) 69.6 (67.4–71.9) 67.6 (64.4–70.9)Georgia 67.7 (64.6–70.7) 66.1 (62.3–69.9) 65.1 (61.7–68.5) 72.0 (68.4–75.5) 71.8 (67.8–75.8) 67.6 (63.7–71.4) 64.3 (60.5–68.1)Hawaii† 60.7 (56.5–64.9) 66.7 (62.6–70.8) 70.3 (66.5–74.1) 67.7 (64.0–71.5) 68.0 (64.0–72.0) 66.7 (62.9–70.5) 67.0 (63.1–70.8)Idaho 65.0 (60.4–69.6) 63.1 (57.5–68.6) 68.9 (64.8–73.0) 65.6 (61.2–70.0) 66.3 (62.1–70.6) 61.4 (56.4–66.3) 62.2 (57.3–67.1)Illinois 65.6 (61.3–69.8) 68.2 (64.0–72.4) 64.2 (60.1–68.3) 65.7 (61.5–69.9) 68.6 (64.5–72.7) 67.0 (62.8–71.2) 64.8 (60.7–68.9)Indiana 63.0 (60.2–65.9) 63.0 (60.3–65.7) 63.6 (60.9–66.2) 63.8 (61.1–66.4) 64.7 (60.6–68.8) 62.3 (59.5–65.2) 62.0 (59.6–64.3)Iowa 60.6 (57.4–63.8) 64.1 (61.0–67.3) 59.8 (56.5–63.2) 63.0 (59.9–66.2) 62.4 (58.6–66.3) 59.2 (55.6–62.9) 59.9 (56.9–63.0)Kansas†,§ 61.1 (59.1–63.0) 63.0 (60.4–65.7) 63.6 (61.9–65.4) 65.6 (63.4–67.9) 62.7 (60.9–64.6) 63.1 (60.5–65.7) 64.3 (62.4–66.2)Kentucky 58.2 (55.3–61.1) 59.6 (56.7–62.4) 56.2 (53.3–59.1) 61.6 (58.5–64.7) 58.7 (55.1–62.3) 59.1 (56.1–62.1) 62.1 (58.7–65.5)Louisiana†,§ 65.0 (62.1–67.9) 64.4 (61.0–67.8) 65.9 (61.3–70.5) 71.1 (68.4–73.8) 66.0 (62.1–69.9) 66.8 (62.3–71.3) 69.7 (66.3–73.1)Maine 64.5 (61.9–67.0) 66.5 (63.8–69.1) 64.0 (60.7–67.3) 62.3 (58.9–65.6) 63.9 (60.4–67.4) 63.5 (60.0–66.9) 62.2 (58.5–66.0)Maryland 61.8 (58.1–65.4) 66.7 (63.3–70.2) 67.6 (64.4–70.7) 67.3 (63.3–71.3) 66.0 (61.4–70.7) 67.4 (64.5–70.3) 65.9 (62.4–69.3)Massachusetts 67.2 (64.7–69.7) 67.7 (65.3–70.0) 67.5 (64.6–70.4) 71.5 (68.6–74.4) 68.0 (64.7–71.3) 67.6 (63.9–71.2) 64.6 (59.8–69.3)Michigan 65.5 (62.6–68.5) 68.5 (65.7–71.2) 68.0 (65.5–70.4) 66.9 (63.9–69.9) 67.9 (65.2–70.7) 64.7 (62.2–67.1) 66.2 (63.6–68.8)Minnesota 64.3 (61.8–66.8) 64.5 (61.9–67.0) 68.3 (65.2–71.4) 67.2 (65.2–69.3) 65.1 (62.8–67.4) 64.3 (62.2–66.5) 63.8 (61.4–66.1)Mississippi 64.9 (62.0–67.8) 66.0 (62.8–69.2) 69.4 (66.2–72.6) 68.2 (63.9–72.5) 72.1 (68.6–75.6) 67.7 (63.9–71.4) 61.1 (56.8–65.5)Missouri 58.6 (55.2–62.1) 60.9 (57.5–64.4) 63.8 (60.3–67.3) 59.9 (56.2–63.6) 64.3 (60.7–67.8) 61.4 (57.6–65.3) 59.7 (56.2–63.1)Montana 58.2 (55.1–61.3) 61.3 (58.3–64.4) 60.9 (57.9–63.8) 64.7 (61.1–68.3) 63.4 (59.3–67.5) 62.5 (58.4–66.5) 60.6 (56.6–64.7)Nebraska 62.0 (60.1–63.9) 62.9 (60.7–65.1) 64.0 (61.3–66.8) 65.2 (62.8–67.6) 65.8 (63.2–68.5) 61.6 (58.5–64.6) 63.9 (61.0–66.9)Nevada 58.4 (53.9–62.9) 66.6 (62.5–70.6) 62.5 (57.1–67.8) 71.5 (66.5–76.4) 72.0 (66.4–77.7) 63.2 (58.4–68.0) 62.7 (57.2–68.2)New Hampshire 61.9 (58.0–65.7) 66.0 (62.0–70.1) 66.8 (63.1–70.5) 66.5 (62.4–70.7) 65.6 (61.5–69.6) 64.0 (59.3–68.6) 63.7 (58.8–68.6)New Jersey 68.7 (66.1–71.3) 69.6 (67.0–72.1) 71.0 (68.3–73.7) 71.2 (68.3–74.1) 70.8 (67.4–74.1) 68.8 (64.5–73.1) 71.3 (67.7–75.0)New Mexico 69.5 (66.8–72.3) 63.9 (60.9–66.8) 63.1 (59.9–66.3) 68.7 (65.2–72.1) 69.5 (65.6–73.4) 68.5 (64.4–72.6) 65.5 (61.8–69.3)New York†,¶ 71.6 (68.5–74.7) 73.1 (69.6–76.5) 70.5 (67.4–73.6) 70.2 (66.7–73.8) 70.2 (67.5–72.9) 67.4 (65.0–69.9) 66.4 (63.3–69.5)North Carolina 66.9 (63.9–69.8) 68.4 (66.1–70.8) 65.1 (62.2–68.1) 66.3 (63.3–69.3) 68.0 (64.8–71.1) 67.7 (64.5–70.9) 65.4 (61.3–69.6)North Dakota 59.6 (55.7–63.4) 59.2 (55.0–63.3) 58.7 (55.1–62.2) 63.0 (59.0–66.9) 64.2 (60.1–68.3) 61.0 (57.3–64.7) 62.2 (58.7–65.8)Ohio§ 61.2 (58.3–64.0) 61.9 (59.5–64.4) 65.9 (63.3–68.4) 67.4 (64.3–70.4) 65.0 (61.8–68.2) 63.4 (60.5–66.2) 61.7 (58.9–64.6)Oklahoma 62.8 (59.8–65.7) 66.4 (63.6–69.2) 64.9 (62.1–67.7) 66.9 (64.0–69.9) 63.4 (59.7–67.1) 63.6 (60.0–67.2) 65.9 (62.5–69.2)Oregon 65.4 (61.8–69.0) 69.9 (66.2–73.7) 65.1 (61.3–69.0) 66.9 (62.9–70.9) 64.6 (60.6–68.5) 66.4 (62.7–70.0) 62.5 (58.8–66.2)Pennsylvania 65.8 (63.3–68.3) 66.2 (64.0–68.5) 66.7 (64.2–69.1) 65.4 (62.6–68.2) 67.1 (63.5–70.7) 65.3 (61.8–68.7) 64.3 (60.9–67.6)Rhode Island 68.1 (64.6–71.6) 65.5 (61.3–69.6) 69.5 (65.8–73.2) 70.2 (66.0–74.4) 67.3 (62.8–71.7) 67.1 (62.6–71.5) 69.6 (64.9–74.3)South Carolina 65.0 (62.1–67.8) 68.6 (66.0–71.1) 67.4 (64.7–70.1) 68.4 (65.7–71.1) 68.0 (65.2–70.9) 68.9 (66.1–71.7) 65.8 (62.9–68.7)South Dakota 63.6 (59.3–68.0) 60.5 (57.0–63.9) 63.1 (59.1–67.2) 62.5 (58.2–66.9) 64.1 (59.5–68.6) 62.5 (57.3–67.7) 64.5 (59.4–69.6)Tennessee¶ 66.2 (61.1–71.4) 66.6 (63.5–69.8) 66.8 (63.3–70.4) 64.3 (60.1–68.4) 62.1 (58.1–66.0) 65.0 (61.3–68.6) 60.3 (56.6–64.0)Texas 69.4 (66.6–72.3) 67.3 (64.2–70.4) 69.9 (67.0–72.9) 72.2 (69.3–75.0) 67.6 (64.2–70.9) 71.1 (67.5–74.6) 70.7 (66.6–74.7)Utah 70.0 (66.8–73.1) 71.7 (68.5–74.9) 69.5 (66.5–72.6) 71.1 (68.3–73.8) 65.5 (62.0–69.1) 69.3 (65.5–73.2) 66.4 (62.8–70.1)Vermont 62.7 (59.0–66.5) 69.3 (65.6–72.9) 63.9 (60.1–67.6) 66.0 (62.6–69.4) 63.6 (59.9–67.4) 58.2 (54.1–62.4) 66.0 (62.1–70.0)Virginia§ 63.9 (60.2–67.7) 65.4 (62.1–68.8) 65.8 (62.8–68.8) 66.4 (63.5–69.4) 69.0 (65.8–72.1) 67.8 (64.9–70.8) 66.4 (63.2–69.5)Washington 64.7 (61.4–68.0) 65.8 (63.3–68.3) 67.5 (64.7–70.3) 68.9 (65.7–72.0) 65.0 (62.3–67.7) 63.7 (61.0–66.4) 68.1 (65.4–70.8)West Virginia§ 57.4 (54.1–60.6) 56.1 (53.0–59.1) 59.7 (56.8–62.7) 59.1 (56.1–62.0) 60.5 (57.5–63.4) 60.8 (58.1–63.5) 61.6 (58.5–64.8)Wisconsin† 67.0 (62.9–71.1) 68.3 (64.2–72.3) 71.3 (67.6–75.1) 66.3 (62.5–70.2) 66.8 (63.0–70.7) 67.6 (63.6–71.6) 58.6 (54.3–62.8)Wyoming 61.3 (57.9–64.7) 61.6 (56.9–66.3) 62.7 (58.8–66.6) 63.0 (58.2–67.7) 63.3 (58.7–67.9) 60.3 (55.2–65.5) 65.0 (60.9–69.0)Guam† 63.5 (58.5–68.6) 71.9 (66.8–76.9) 76.4 (71.6–81.2) 74.0 (69.1–78.9) 70.3 (63.9–76.7) 69.1 (62.0–76.3) 72.3 (66.6–77.9)Puerto Rico 66.0 (62.1–70.0) 70.5 (66.5–74.4) 76.4 (72.1–80.8) 72.4 (68.1–76.7) 73.8 (68.9–78.6) 74.4 (69.7–79.1) 67.1 (61.5–72.7)Median 64.9 66.1 65.9 66.9 66.8 65.0 65.4
Abbreviation: CI = confidence interval.* Quit attempt percentages were calculated among current cigarette smokers who answered yes to the question “During the past 12 months, have you stopped smoking
for 1 day or longer because you were trying to quit smoking?” and also among former cigarette smokers who answered “within the past month,” “within the past 3 months,” “within the past 6 months,” or “within the past year” to the question “How long has it been since you last smoked a cigarette, even one or two puffs?”
† Statistically significant difference (p<0.05) between 2011 and 2017.§ Statistically significant increasing linear trend during 2011–2017.¶ Statistically significant decreasing linear trend during 2011–2017.
Morbidity and Mortality Weekly Report
624 MMWR / July 19, 2019 / Vol. 68 / No. 28 US Department of Health and Human Services/Centers for Disease Control and Prevention
67.2–72.365.5–67.162.6–65.458.6–62.5
DCGUPR
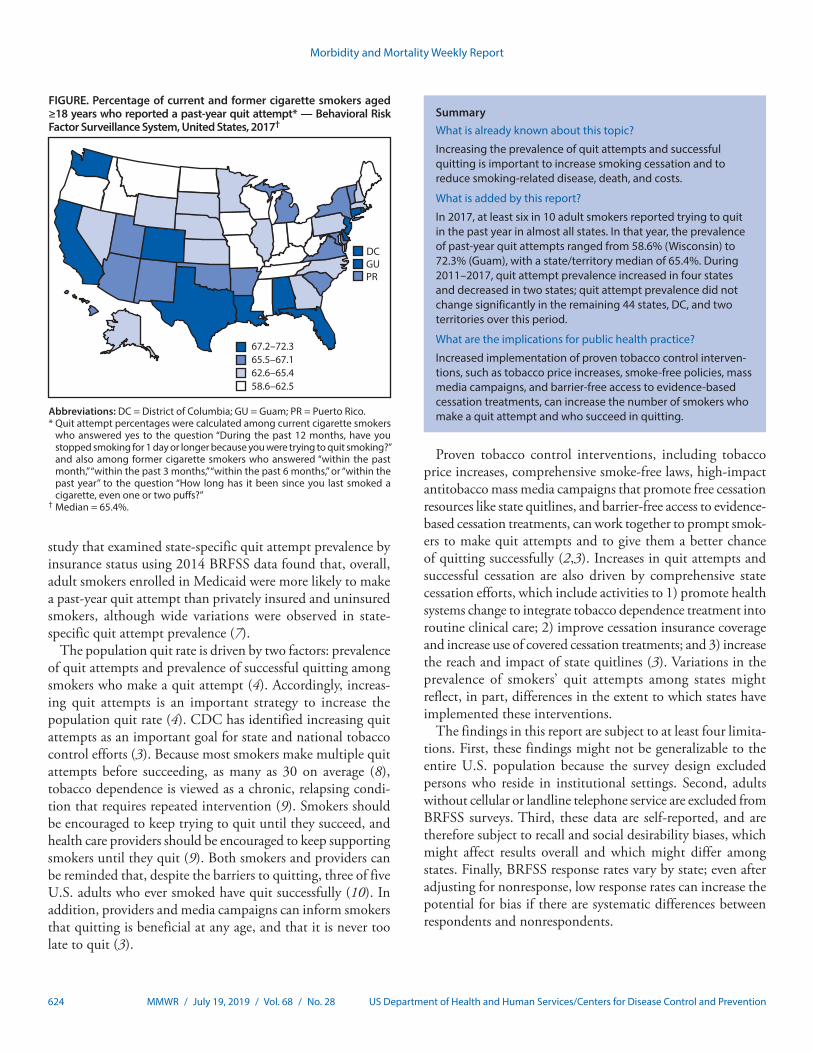
FIGURE. Percentage of current and former cigarette smokers aged ≥18 years who reported a past-year quit attempt* — Behavioral Risk Factor Surveillance System, United States, 2017†
Abbreviations: DC = District of Columbia; GU = Guam; PR = Puerto Rico.* Quit attempt percentages were calculated among current cigarette smokers
who answered yes to the question “During the past 12 months, have you stopped smoking for 1 day or longer because you were trying to quit smoking?” and also among former cigarette smokers who answered “within the past month,” “within the past 3 months,” “within the past 6 months,” or “within the past year” to the question “How long has it been since you last smoked a cigarette, even one or two puffs?”
† Median = 65.4%.
study that examined state-specific quit attempt prevalence by insurance status using 2014 BRFSS data found that, overall, adult smokers enrolled in Medicaid were more likely to make a past-year quit attempt than privately insured and uninsured smokers, although wide variations were observed in state-specific quit attempt prevalence (7).
The population quit rate is driven by two factors: prevalence of quit attempts and prevalence of successful quitting among smokers who make a quit attempt (4). Accordingly, increas-ing quit attempts is an important strategy to increase the population quit rate (4). CDC has identified increasing quit attempts as an important goal for state and national tobacco control efforts (3). Because most smokers make multiple quit attempts before succeeding, as many as 30 on average (8), tobacco dependence is viewed as a chronic, relapsing condi-tion that requires repeated intervention (9). Smokers should be encouraged to keep trying to quit until they succeed, and health care providers should be encouraged to keep supporting smokers until they quit (9). Both smokers and providers can be reminded that, despite the barriers to quitting, three of five U.S. adults who ever smoked have quit successfully (10). In addition, providers and media campaigns can inform smokers that quitting is beneficial at any age, and that it is never too late to quit (3).
Proven tobacco control interventions, including tobacco price increases, comprehensive smoke-free laws, high-impact antitobacco mass media campaigns that promote free cessation resources like state quitlines, and barrier-free access to evidence-based cessation treatments, can work together to prompt smok-ers to make quit attempts and to give them a better chance of quitting successfully (2,3). Increases in quit attempts and successful cessation are also driven by comprehensive state cessation efforts, which include activities to 1) promote health systems change to integrate tobacco dependence treatment into routine clinical care; 2) improve cessation insurance coverage and increase use of covered cessation treatments; and 3) increase the reach and impact of state quitlines (3). Variations in the prevalence of smokers’ quit attempts among states might reflect, in part, differences in the extent to which states have implemented these interventions.
The findings in this report are subject to at least four limita-tions. First, these findings might not be generalizable to the entire U.S. population because the survey design excluded persons who reside in institutional settings. Second, adults without cellular or landline telephone service are excluded from BRFSS surveys. Third, these data are self-reported, and are therefore subject to recall and social desirability biases, which might affect results overall and which might differ among states. Finally, BRFSS response rates vary by state; even after adjusting for nonresponse, low response rates can increase the potential for bias if there are systematic differences between respondents and nonrespondents.
SummaryWhat is already known about this topic?
Increasing the prevalence of quit attempts and successful quitting is important to increase smoking cessation and to reduce smoking-related disease, death, and costs.
What is added by this report?
In 2017, at least six in 10 adult smokers reported trying to quit in the past year in almost all states. In that year, the prevalence of past-year quit attempts ranged from 58.6% (Wisconsin) to 72.3% (Guam), with a state/territory median of 65.4%. During 2011–2017, quit attempt prevalence increased in four states and decreased in two states; quit attempt prevalence did not change significantly in the remaining 44 states, DC, and two territories over this period.
What are the implications for public health practice?
Increased implementation of proven tobacco control interven-tions, such as tobacco price increases, smoke-free policies, mass media campaigns, and barrier-free access to evidence-based cessation treatments, can increase the number of smokers who make a quit attempt and who succeed in quitting.
Morbidity and Mortality Weekly Report
MMWR / July 19, 2019 / Vol. 68 / No. 28 625US Department of Health and Human Services/Centers for Disease Control and Prevention
TABLE 2. Percentage of current and former cigarette smokers aged ≥18 years who reported a past-year quit attempt,* by state/territory and age group — Behavioral Risk Factor Surveillance System, United States, 2017
State/Territory
% (95% CI)
18–24 yrs 25–44 yrs 45–64 yrs ≥65 yrs
Alabama 79.3 (66.9–87.9) 69.5 (63.3–75.1) 64.2 (59.1–69.0) 57.7 (50.1–65.0)Alaska 70.8 (45.9–87.3) 60.1 (49.4–70.0) 66.9 (58.3–74.4) 58.5 (45.6–70.4)Arizona 78.8 (69.7–85.8) 74.1 (69.9–77.9) 59.7 (56.1–63.2) 52.6 (47.5–57.6)Arkansas 72.7 (46.9–88.9) 73.8 (65.1–81.0) 60.5 (53.2–67.3) 50.1 (40.9–59.3)California 78.4 (68.2–86.0) 65.1 (59.0–70.8) 70.1 (64.0–75.7) 66.3 (55.6–75.5)Colorado 70.7 (60.2–79.3) 74.0 (69.4–78.1) 63.2 (58.2–68.0) 52.3 (45.2–59.4)Connecticut 76.7 (62.8–86.6) 79.0 (73.2–83.9) 65.3 (60.2–70.0) 58.7 (50.0–66.8)Delaware 84.5 (69.7–92.8) 77.4 (69.9–83.5) 63.1 (56.0–69.7) 55.9 (43.5–67.6)District of Columbia 78.1 (53.9–91.6) 65.7 (57.2–73.3) 74.9 (68.6–80.2) 71.2 (61.4–79.3)Florida 85.5 (75.5–91.8) 69.9 (63.8–75.3) 65.8 (60.7–70.5) 57.4 (49.3–65.1)Georgia 74.1 (58.0–85.5) 67.1 (60.6–72.9) 61.0 (55.0–66.6) 55.4 (47.1–63.5)Hawaii 76.4 (61.2–87.0) 70.7 (64.7–76.0) 62.1 (56.0–67.9) 50.0 (39.0–61.1)Idaho 78.9 (64.5–88.5) 64.8 (56.3–72.4) 55.3 (47.1–63.3) 55.5 (44.6–66.0)Illinois 60.5 (40.2–77.7) 70.1 (63.5–75.9) 60.8 (54.6–66.6) 60.3 (51.4–68.7)Indiana 71.4 (62.1–79.2) 62.6 (58.4–66.5) 60.4 (57.1–63.7) 52.9 (47.7–58.1)Iowa 63.6 (50.5–75.0) 63.5 (58.4–68.2) 56.1 (51.6–60.6) 55.1 (47.7–62.4)Kansas 76.8 (70.2–82.3) 68.6 (65.5–71.6) 57.5 (54.5–60.5) 52.5 (47.8–57.2)Kentucky 72.3 (56.9–83.7) 67.7 (62.4–72.6) 53.0 (47.5–58.3) 62.2 (53.9–69.8)Louisiana 68.1 (55.1–78.8) 74.4 (69.0–79.2) 65.5 (59.9–70.7) 64.2 (54.7–72.7)Maine 80.8 (57.8–92.8) 62.5 (56.2–68.4) 59.8 (54.5–65.0) 54.3 (46.6–61.8)Maryland 65.5 (49.1–78.8) 69.5 (63.3–75.0) 62.0 (57.2–66.6) 65.0 (57.8–71.5)Massachusetts 70.3 (50.9–84.5) 70.0 (61.6–77.3) 59.4 (51.9–66.5) 59.1 (46.6–70.6)Michigan 76.6 (66.4–84.4) 67.2 (62.7–71.5) 64.1 (60.2–67.8) 61.3 (54.8–67.4)Minnesota 71.5 (62.0–79.5) 67.2 (63.2–70.9) 60.0 (56.4–63.4) 55.8 (50.1–61.3)Mississippi 85.7 (67.1–94.6) 56.2 (48.2–63.9) 62.5 (56.5–68.0) 53.5 (44.7–62.0)Missouri 71.4 (60.0–80.6) 59.4 (53.3–65.3) 57.8 (52.6–62.9) 52.8 (45.0–60.5)Montana 60.7 (45.0–74.4) 66.2 (59.8–72.1) 57.8 (51.3–64.1) 48.9 (40.1–57.7)Nebraska 75.1 (65.2–82.9) 68.6 (63.8–73.0) 57.1 (52.4–61.7) 51.2 (43.9–58.4)Nevada 76.3 (52.4–90.4) 67.0 (57.5–75.3) 60.9 (51.6–69.5) 51.2 (40.1–62.2)New Hampshire 72.9 (53.7–86.1) 61.8 (52.8–70.0) 62.3 (56.1–68.1) 63.6 (54.5–71.7)New Jersey 77.9 (57.7–90.1) 76.0 (69.7–81.3) 64.9 (59.4–70.0) 69.2 (60.9–76.5)New Mexico 69.9 (54.5–81.8) 70.0 (63.5–75.7) 64.3 (58.3–69.8) 51.5 (43.4–59.4)New York 70.8 (55.8–82.4) 68.9 (63.9–73.6) 64.4 (59.7–68.8) 59.9 (52.2–67.1)North Carolina 68.2 (53.4–80.1) 71.3 (64.1–77.6) 58.6 (51.8–65.0) 63.8 (53.0–73.3)North Dakota 84.4 (72.3–91.8) 67.8 (61.7–73.3) 47.4 (42.2–52.6) 54.6 (47.6–61.5)Ohio 73.3 (61.7–82.4) 63.4 (58.5–68.0) 58.8 (54.5–62.9) 53.8 (47.5–60.1)Oklahoma 75.0 (62.7–84.2) 68.0 (62.3–73.1) 63.3 (58.0–68.2) 52.8 (45.6–59.8)Oregon 58.9 (43.7–72.6) 69.2 (63.3–74.6) 57.9 (51.9–63.7) 55.4 (45.7–64.7)Pennsylvania 80.6 (69.7–88.2) 66.6 (60.7–72.0) 58.9 (53.8–63.9) 57.6 (48.0–66.6)Rhode Island 80.8 (59.0–92.5) 68.7 (59.5–76.6) 68.4 (62.2–74.0) 65.8 (56.4–74.1)South Carolina 72.5 (60.0–82.3) 69.1 (64.0–73.8) 63.1 (58.8–67.3) 55.8 (49.5–61.8)South Dakota 76.9 (61.2–87.5) 68.7 (59.4–76.7) 58.0 (50.2–65.5) 52.0 (41.3–62.5)Tennessee 77.8 (64.5–87.1) 62.9 (56.5–68.8) 55.5 (50.0–60.9) 49.1 (40.8–57.5)Texas 78.0 (62.1–88.5) 70.5 (64.2–76.1) 70.6 (63.5–76.8) 59.7 (47.2–71.1)Utah 76.9 (65.7–85.3) 69.6 (64.1–74.7) 58.4 (51.8–64.7) 56.4 (44.6–67.6)Vermont 86.5 (72.0–94.1) 64.3 (57.3–70.7) 62.4 (56.2–68.3) 60.3 (51.2–68.8)Virginia 80.4 (68.4–88.6) 71.6 (66.3–76.3) 59.0 (53.9–64.0) 53.6 (46.2–60.8)Washington 77.3 (66.0–85.7) 72.4 (68.1–76.4) 61.6 (57.1–65.8) 60.3 (53.6–66.7)West Virginia 84.7 (73.5–91.7) 62.0 (56.6–67.0) 56.4 (51.9–60.8) 50.4 (43.2–57.5)Wisconsin 66.4 (49.2–80.2) 58.8 (51.7–65.6) 56.3 (49.9–62.5) 57.7 (47.2–67.6)Wyoming 73.7 (60.6–83.6) 67.4 (60.6–73.6) 59.5 (52.9–65.7) 57.5 (48.5–66.0)Guam 96.0 (87.8–98.8) 71.8 (62.0–80.0) 64.9 (55.3–73.5) 61.8 (37.6–81.2)Puerto Rico 87.3 (73.0–94.6) 75.2 (66.3–82.4) 53.6 (43.9–63.0) 54.3 (39.0–68.7)Median 76.4 68.6 60.8 55.8
Abbreviation: CI = confidence interval.* Quit attempt percentages were calculated among current cigarette smokers who answered yes to the question “During the past 12 months, have you stopped
smoking for 1 day or longer because you were trying to quit smoking?” and also among former cigarette smokers who answered “within the past month,” “within the past 3 months,” “within the past 6 months,” or “within the past year” to the question “How long has it been since you last smoked a cigarette, even one or two puffs?”

Morbidity and Mortality Weekly Report
626 MMWR / July 19, 2019 / Vol. 68 / No. 28 US Department of Health and Human Services/Centers for Disease Control and Prevention
The variation in quit attempt prevalences among states described in this report suggests that states have an opportunity to further increase the prevalence of quit attempts. Increased implementation of proven tobacco control interventions (e.g., tobacco price increases, smoke-free policies, media campaigns, and barrier-free access to cessation treatments) can increase the number of smokers who make a quit attempt and who succeed in quitting (2,3). Implementation of these interventions might also reduce the variation in quit attempt prevalences among states observed in this study. Increasing quit attempts among adult smokers can help drive increases in smoking cessation. In addition, it is important to continue tracking cessation behaviors, including quit attempts, among states and territories to monitor future trends in these behaviors.
Corresponding author: Kimp Walton, [email protected], 770-488-5493.
1Office on Smoking and Health, National Center for Chronic Disease Prevention and Health Promotion, CDC; 2McKing Consulting, Atlanta, Georgia; 3Department of Health Services, School of Public Health, University of Washington, Seattle, Washington.
All authors have completed and submitted the ICMJE form for disclosure of potential conflicts of interest. No potential conflicts of interest were disclosed.
References 1. Wang TW, Asman K, Gentzke AS, et al. Tobacco product use among
adults—United States, 2017. MMWR Morb Mortal Wkly Rep 2018;67:1225–32. https://doi.org/10.15585/mmwr.mm6744a2
2. US Department of Health and Human Services. The health consequences of smoking—50 years of progress: a report of the Surgeon General. Atlanta, GA: US Department of Health and Human Services, CDC; 2014.
3. CDC. Best practices for comprehensive tobacco control programs—2014. Atlanta, GA: US Department of Health and Human Services, CDC; 2014. https://www.cdc.gov/tobacco/stateandcommunity/best_practices/index.htm
4. Zhu SH, Lee M, Zhuang YL, Gamst A, Wolfson T. Interventions to increase smoking cessation at the population level: how much progress has been made in the last two decades? Tob Control 2012;21:110–8. https://doi.org/10.1136/tobaccocontrol-2011-050371
5. US Department of Health and Human Services. Healthy people 2020: tobacco use objectives. Washington, DC: US Department of Health and Human Services. https://www.healthypeople.gov/2020/topics-objectives/topic/tobacco-use/objectives
6. Lavinghouze SR, Malarcher A, Jama A, Neff L, Debrot K, Whalen L. Trends in quit attempts among adult cigarette smokers—United States, 2001–2013. MMWR Morb Mortal Wkly Rep 2015;64:1129–35. https://doi.org/10.15585/mmwr.mm6440a1
7. Naavaal S, Malarcher A, Xu X, Zhang L, Babb S. Variations in cigarette smoking and quit attempts by health insurance among US adults in 41 states and 2 jurisdictions, 2014. Public Health Rep 2018;133:191–9. https://doi.org/10.1177/0033354917753120
8. Chaiton M, Diemert L, Cohen JE, et al. Estimating the number of quit attempts it takes to quit smoking successfully in a longitudinal cohort of smokers. BMJ Open 2016;6:e011045. https://doi.org/10.1136/bmjopen-2016-011045
9. Fiore MC, Jaen CR, Baker TB, et al. Treating tobacco use and dependence: 2008 update. Clinical practice guideline. Rockville, MD: US Department of Health and Human Services, Public Health Service; 2008.
10. Babb S, Malarcher A, Schauer G, Asman K, Jamal A. Quitting smoking among adults—United States, 2000–2015. MMWR Morb Mortal Wkly Rep 2017;65:1457–64. https://doi.org/10.15585/mmwr.mm6552a1
Morbidity and Mortality Weekly Report
MMWR / July 19, 2019 / Vol. 68 / No. 28 627US Department of Health and Human Services/Centers for Disease Control and Prevention
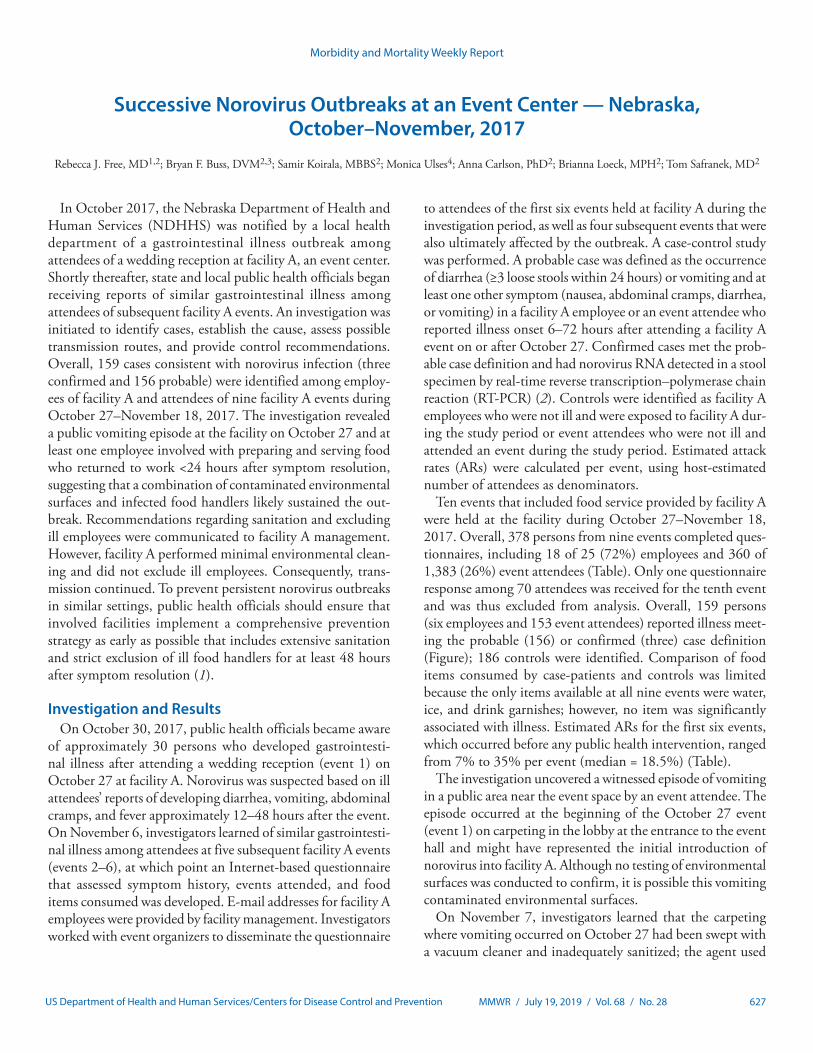
Successive Norovirus Outbreaks at an Event Center — Nebraska, October–November, 2017
Rebecca J. Free, MD1,2; Bryan F. Buss, DVM2,3; Samir Koirala, MBBS2; Monica Ulses4; Anna Carlson, PhD2; Brianna Loeck, MPH2; Tom Safranek, MD2
In October 2017, the Nebraska Department of Health and Human Services (NDHHS) was notified by a local health department of a gastrointestinal illness outbreak among attendees of a wedding reception at facility A, an event center. Shortly thereafter, state and local public health officials began receiving reports of similar gastrointestinal illness among attendees of subsequent facility A events. An investigation was initiated to identify cases, establish the cause, assess possible transmission routes, and provide control recommendations. Overall, 159 cases consistent with norovirus infection (three confirmed and 156 probable) were identified among employ-ees of facility A and attendees of nine facility A events during October 27–November 18, 2017. The investigation revealed a public vomiting episode at the facility on October 27 and at least one employee involved with preparing and serving food who returned to work <24 hours after symptom resolution, suggesting that a combination of contaminated environmental surfaces and infected food handlers likely sustained the out-break. Recommendations regarding sanitation and excluding ill employees were communicated to facility A management. However, facility A performed minimal environmental clean-ing and did not exclude ill employees. Consequently, trans-mission continued. To prevent persistent norovirus outbreaks in similar settings, public health officials should ensure that involved facilities implement a comprehensive prevention strategy as early as possible that includes extensive sanitation and strict exclusion of ill food handlers for at least 48 hours after symptom resolution (1).
Investigation and ResultsOn October 30, 2017, public health officials became aware
of approximately 30 persons who developed gastrointesti-nal illness after attending a wedding reception (event 1) on October 27 at facility A. Norovirus was suspected based on ill attendees’ reports of developing diarrhea, vomiting, abdominal cramps, and fever approximately 12–48 hours after the event. On November 6, investigators learned of similar gastrointesti-nal illness among attendees at five subsequent facility A events (events 2–6), at which point an Internet-based questionnaire that assessed symptom history, events attended, and food items consumed was developed. E-mail addresses for facility A employees were provided by facility management. Investigators worked with event organizers to disseminate the questionnaire
to attendees of the first six events held at facility A during the investigation period, as well as four subsequent events that were also ultimately affected by the outbreak. A case-control study was performed. A probable case was defined as the occurrence of diarrhea (≥3 loose stools within 24 hours) or vomiting and at least one other symptom (nausea, abdominal cramps, diarrhea, or vomiting) in a facility A employee or an event attendee who reported illness onset 6–72 hours after attending a facility A event on or after October 27. Confirmed cases met the prob-able case definition and had norovirus RNA detected in a stool specimen by real-time reverse transcription–polymerase chain reaction (RT-PCR) (2). Controls were identified as facility A employees who were not ill and were exposed to facility A dur-ing the study period or event attendees who were not ill and attended an event during the study period. Estimated attack rates (ARs) were calculated per event, using host-estimated number of attendees as denominators.
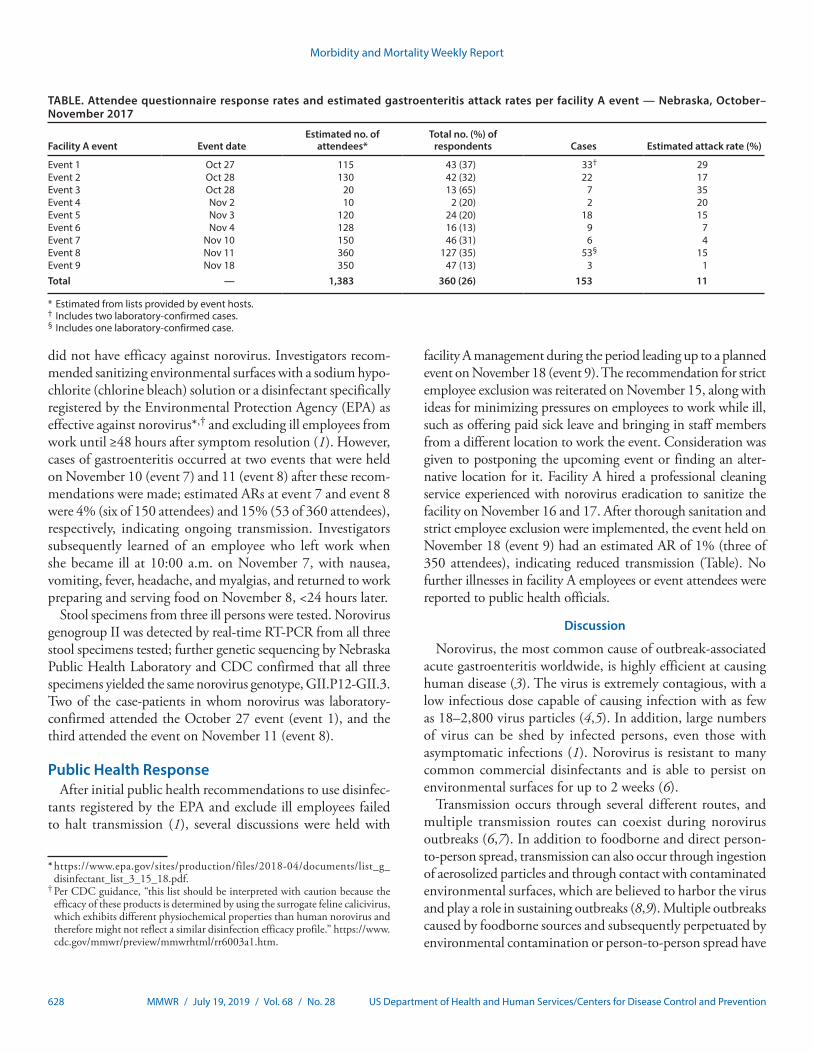
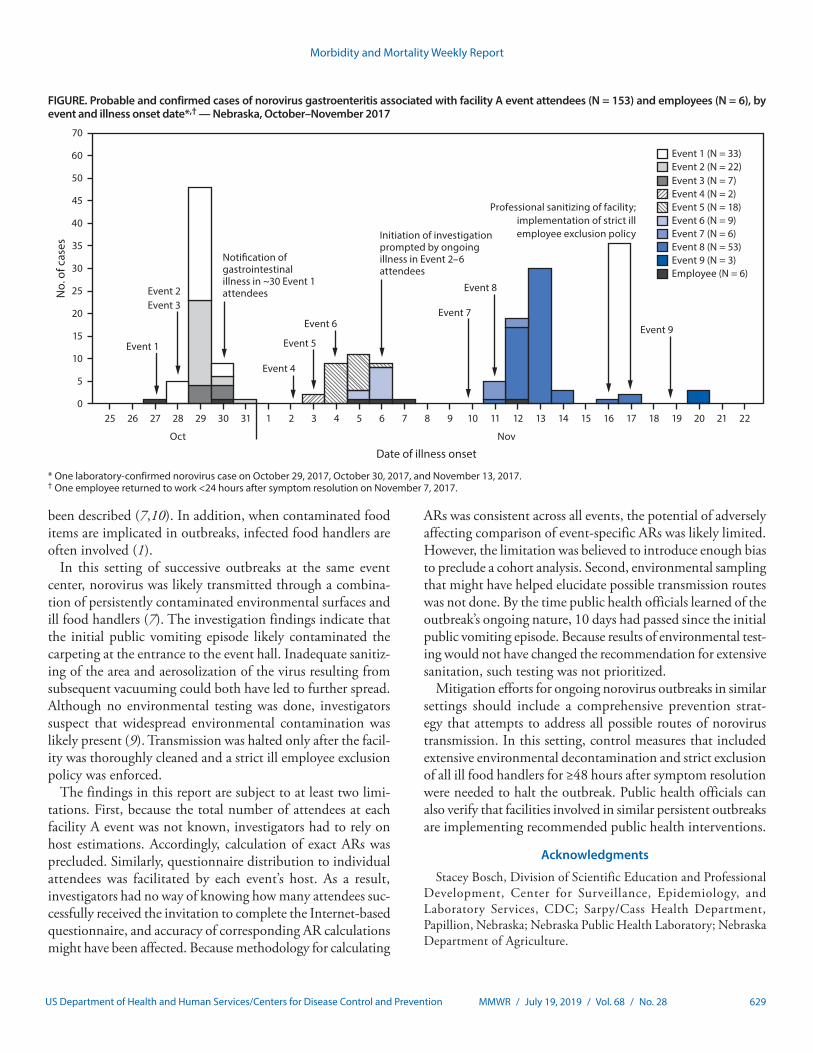
Ten events that included food service provided by facility A were held at the facility during October 27–November 18, 2017. Overall, 378 persons from nine events completed ques-tionnaires, including 18 of 25 (72%) employees and 360 of 1,383 (26%) event attendees (Table). Only one questionnaire response among 70 attendees was received for the tenth event and was thus excluded from analysis. Overall, 159 persons (six employees and 153 event attendees) reported illness meet-ing the probable (156) or confirmed (three) case definition (Figure); 186 controls were identified. Comparison of food items consumed by case-patients and controls was limited because the only items available at all nine events were water, ice, and drink garnishes; however, no item was significantly associated with illness. Estimated ARs for the first six events, which occurred before any public health intervention, ranged from 7% to 35% per event (median = 18.5%) (Table).
The investigation uncovered a witnessed episode of vomiting in a public area near the event space by an event attendee. The episode occurred at the beginning of the October 27 event (event 1) on carpeting in the lobby at the entrance to the event hall and might have represented the initial introduction of norovirus into facility A. Although no testing of environmental surfaces was conducted to confirm, it is possible this vomiting contaminated environmental surfaces.
On November 7, investigators learned that the carpeting where vomiting occurred on October 27 had been swept with a vacuum cleaner and inadequately sanitized; the agent used
Morbidity and Mortality Weekly Report
628 MMWR / July 19, 2019 / Vol. 68 / No. 28 US Department of Health and Human Services/Centers for Disease Control and Prevention
TABLE. Attendee questionnaire response rates and estimated gastroenteritis attack rates per facility A event — Nebraska, October–November 2017
Facility A event Event dateEstimated no. of
attendees*Total no. (%) of
respondents Cases Estimated attack rate (%)
Event 1 Oct 27 115 43 (37) 33† 29Event 2 Oct 28 130 42 (32) 22 17Event 3 Oct 28 20 13 (65) 7 35Event 4 Nov 2 10 2 (20) 2 20Event 5 Nov 3 120 24 (20) 18 15Event 6 Nov 4 128 16 (13) 9 7Event 7 Nov 10 150 46 (31) 6 4Event 8 Nov 11 360 127 (35) 53§ 15Event 9 Nov 18 350 47 (13) 3 1Total — 1,383 360 (26) 153 11
* Estimated from lists provided by event hosts.† Includes two laboratory-confirmed cases.§ Includes one laboratory-confirmed case.
did not have efficacy against norovirus. Investigators recom-mended sanitizing environmental surfaces with a sodium hypo-chlorite (chlorine bleach) solution or a disinfectant specifically registered by the Environmental Protection Agency (EPA) as effective against norovirus*,† and excluding ill employees from work until ≥48 hours after symptom resolution (1). However, cases of gastroenteritis occurred at two events that were held on November 10 (event 7) and 11 (event 8) after these recom-mendations were made; estimated ARs at event 7 and event 8 were 4% (six of 150 attendees) and 15% (53 of 360 attendees), respectively, indicating ongoing transmission. Investigators subsequently learned of an employee who left work when she became ill at 10:00 a.m. on November 7, with nausea, vomiting, fever, headache, and myalgias, and returned to work preparing and serving food on November 8, <24 hours later.
Stool specimens from three ill persons were tested. Norovirus genogroup II was detected by real-time RT-PCR from all three stool specimens tested; further genetic sequencing by Nebraska Public Health Laboratory and CDC confirmed that all three specimens yielded the same norovirus genotype, GII.P12-GII.3. Two of the case-patients in whom norovirus was laboratory-confirmed attended the October 27 event (event 1), and the third attended the event on November 11 (event 8).
Public Health ResponseAfter initial public health recommendations to use disinfec-
tants registered by the EPA and exclude ill employees failed to halt transmission (1), several discussions were held with
* https://www.epa.gov/sites/production/files/2018-04/documents/list_g_disinfectant_list_3_15_18.pdf.
† Per CDC guidance, “this list should be interpreted with caution because the efficacy of these products is determined by using the surrogate feline calicivirus, which exhibits different physiochemical properties than human norovirus and therefore might not reflect a similar disinfection efficacy profile.” https://www.cdc.gov/mmwr/preview/mmwrhtml/rr6003a1.htm.
facility A management during the period leading up to a planned event on November 18 (event 9). The recommendation for strict employee exclusion was reiterated on November 15, along with ideas for minimizing pressures on employees to work while ill, such as offering paid sick leave and bringing in staff members from a different location to work the event. Consideration was given to postponing the upcoming event or finding an alter-native location for it. Facility A hired a professional cleaning service experienced with norovirus eradication to sanitize the facility on November 16 and 17. After thorough sanitation and strict employee exclusion were implemented, the event held on November 18 (event 9) had an estimated AR of 1% (three of 350 attendees), indicating reduced transmission (Table). No further illnesses in facility A employees or event attendees were reported to public health officials.
Discussion
Norovirus, the most common cause of outbreak-associated acute gastroenteritis worldwide, is highly efficient at causing human disease (3). The virus is extremely contagious, with a low infectious dose capable of causing infection with as few as 18–2,800 virus particles (4,5). In addition, large numbers of virus can be shed by infected persons, even those with asymptomatic infections (1). Norovirus is resistant to many common commercial disinfectants and is able to persist on environmental surfaces for up to 2 weeks (6).
Transmission occurs through several different routes, and multiple transmission routes can coexist during norovirus outbreaks (6,7). In addition to foodborne and direct person-to-person spread, transmission can also occur through ingestion of aerosolized particles and through contact with contaminated environmental surfaces, which are believed to harbor the virus and play a role in sustaining outbreaks (8,9). Multiple outbreaks caused by foodborne sources and subsequently perpetuated by environmental contamination or person-to-person spread have
Morbidity and Mortality Weekly Report
MMWR / July 19, 2019 / Vol. 68 / No. 28 629US Department of Health and Human Services/Centers for Disease Control and Prevention
FIGURE. Probable and confirmed cases of norovirus gastroenteritis associated with facility A event attendees (N = 153) and employees (N = 6), by event and illness onset date*,† — Nebraska, October–November 2017
0
5
10
15
20
25
30
35
40
45
50
60
70
No.
of c
ases
Date of illness onset
Event 1 (N = 33)Event 2 (N = 22)Event 3 (N = 7)Event 4 (N = 2)Event 5 (N = 18)Event 6 (N = 9)Event 7 (N = 6)Event 8 (N = 53)Event 9 (N = 3)Employee (N = 6)
Event 1
Event 2Event 3
Event 4
Event 5
Event 6 Event 9
Event 8
Event 7
Noti�cation ofgastrointestinalillness in ~30 Event 1attendees
Initiation of investigationprompted by ongoingillness in Event 2–6attendees
25 26 27 28
Oct Nov
29 30 31 1 2 3 4 5 6 7 8 9 10 11 12 13 14 15 16 17 18 19 20 21 22
Professional sanitizing of facility;implementation of strict illemployee exclusion policy
* One laboratory-confirmed norovirus case on October 29, 2017, October 30, 2017, and November 13, 2017.† One employee returned to work <24 hours after symptom resolution on November 7, 2017.
been described (7,10). In addition, when contaminated food items are implicated in outbreaks, infected food handlers are often involved (1).
In this setting of successive outbreaks at the same event center, norovirus was likely transmitted through a combina-tion of persistently contaminated environmental surfaces and ill food handlers (7). The investigation findings indicate that the initial public vomiting episode likely contaminated the carpeting at the entrance to the event hall. Inadequate sanitiz-ing of the area and aerosolization of the virus resulting from subsequent vacuuming could both have led to further spread. Although no environmental testing was done, investigators suspect that widespread environmental contamination was likely present (9). Transmission was halted only after the facil-ity was thoroughly cleaned and a strict ill employee exclusion policy was enforced.
The findings in this report are subject to at least two limi-tations. First, because the total number of attendees at each facility A event was not known, investigators had to rely on host estimations. Accordingly, calculation of exact ARs was precluded. Similarly, questionnaire distribution to individual attendees was facilitated by each event’s host. As a result, investigators had no way of knowing how many attendees suc-cessfully received the invitation to complete the Internet-based questionnaire, and accuracy of corresponding AR calculations might have been affected. Because methodology for calculating
ARs was consistent across all events, the potential of adversely affecting comparison of event-specific ARs was likely limited. However, the limitation was believed to introduce enough bias to preclude a cohort analysis. Second, environmental sampling that might have helped elucidate possible transmission routes was not done. By the time public health officials learned of the outbreak’s ongoing nature, 10 days had passed since the initial public vomiting episode. Because results of environmental test-ing would not have changed the recommendation for extensive sanitation, such testing was not prioritized.
Mitigation efforts for ongoing norovirus outbreaks in similar settings should include a comprehensive prevention strat-egy that attempts to address all possible routes of norovirus transmission. In this setting, control measures that included extensive environmental decontamination and strict exclusion of all ill food handlers for ≥48 hours after symptom resolution were needed to halt the outbreak. Public health officials can also verify that facilities involved in similar persistent outbreaks are implementing recommended public health interventions.
Acknowledgments
Stacey Bosch, Division of Scientific Education and Professional Development, Center for Surveillance, Epidemiology, and Laboratory Services, CDC; Sarpy/Cass Health Department, Papillion, Nebraska; Nebraska Public Health Laboratory; Nebraska Department of Agriculture.
Morbidity and Mortality Weekly Report
630 MMWR / July 19, 2019 / Vol. 68 / No. 28 US Department of Health and Human Services/Centers for Disease Control and Prevention
SummaryWhat is already known about this topic?
Norovirus, an extremely contagious cause of gastroenteritis, can be transmitted by infected food workers and is difficult to remove from contaminated surfaces.
What is added by this report?
An investigation into an ongoing gastrointestinal illness outbreak identified 159 persons reporting illness meeting the case definition; laboratory testing confirmed norovirus cases. Public health recommendations were not strictly followed, and transmission continued for approximately 2 weeks. Halting transmission required a coordinated approach involving thorough environmental decontamination and a strict ill employee exclusion policy.
What are the implications for public health practice?
Mitigation efforts for ongoing norovirus outbreaks in similar settings should include a comprehensive prevention strategy that addresses all possible routes of norovirus transmission.
Corresponding author: Rebecca J. Free, [email protected], 402-471-1495.
1Epidemic Intelligence Service, CDC; 2Division of Public Health, Nebraska Department of Health and Human Services, Lincoln, Nebraska; 3Career Epidemiology Field Officer Program, Division of State and Local Readiness, Center for Preparedness and Response, CDC; 4Sarpy/Cass Health Department, Papillion, Nebraska.
All authors have completed and submitted the ICMJE form for disclosure of potential conflicts of interest. No potential conflicts of interest were disclosed.
References 1. CDC. Updated norovirus outbreak management and disease prevention
guidelines. MMWR Recomm Rep 2011;60(No. RR-03). 2. Cannon JL, Barclay L, Collins NR, et al. Genetic and epidemiologic
trends of norovirus outbreaks in the United States from 2013 to 2016 demonstrated emergence of novel GII.4 recombinant viruses. J Clin Microbiol 2017;55:2208–21. https://doi.org/10.1128/JCM.00455-17
3. Hall AJ. Noroviruses: the perfect human pathogens? J Infect Dis 2012;205:1622–4. https://doi.org/10.1093/infdis/jis251
4. Teunis PF, Moe CL, Liu P, et al. Norwalk virus: how infectious is it? J Med Virol 2008;80:1468–76. https://doi.org/10.1002/jmv.21237
5. Atmar RL, Opekun AR, Gilger MA, et al. Determination of the 50% human infectious dose for Norwalk virus. J Infect Dis 2014;209:1016–22. https://doi.org/10.1093/infdis/jit620
6. Lopman B, Gastañaduy P, Park GW, Hall AJ, Parashar UD, Vinjé J. Environmental transmission of norovirus gastroenteritis. Curr Opin Virol 2012;2:96–102. https://doi.org/10.1016/j.coviro.2011.11.005
7. Isakbaeva ET, Widdowson MA, Beard RS, et al. Norovirus transmission on cruise ship. Emerg Infect Dis 2005;11:154–8. https://doi.org/10.3201/eid1101.040434
8. Bonifait L, Charlebois R, Vimont A, et al. Detection and quantification of airborne norovirus during outbreaks in healthcare facilities. Clin Infect Dis 2015;61:299–304. https://doi.org/10.1093/cid/civ321
9. Cheesbrough JS, Green J, Gallimore CI, Wright PA, Brown DW. Widespread environmental contamination with Norwalk-like viruses (NLV) detected in a prolonged hotel outbreak of gastroenteritis. Epidemiol Infect 2000;125:93–8. https://doi.org/10.1017/S095026889900432X
10. Godoy P, Alsedà M, Bartolomé R, et al. Norovirus gastroenteritis outbreak transmitted by food and vomit in a high school. Epidemiol Infect 2016;144:1951–8. https://doi.org/10.1017/S0950268815003283
Morbidity and Mortality Weekly Report
MMWR / July 19, 2019 / Vol. 68 / No. 28 631US Department of Health and Human Services/Centers for Disease Control and Prevention
Notes from the Field
Hurricane Florence–Related Emergency Department Visits — North Carolina, 2018
Lauren J. Tanz, ScD1,2; Molly N. Hoffman, MPH2,3; Dana Dandeneau, MPH2,3; Zachary Faigen, MSPH2; Zack Moore, MD2;
Scott Proescholdbell, MPH2; Susan M. Kansagra, MD2
On September 14, 2018, Hurricane Florence made landfall near Wrightsville Beach, North Carolina, as a Category 1 hurri-cane. Parts of eastern North Carolina experienced 20–30 inches of rain over 80 hours, a record-breaking storm surge of 9 to 13 feet, and maximum sustained wind speeds of approximately 80 miles per hour (1,2). Surveillance for health outcomes dur-ing hurricanes, including emergency department (ED) visits, informs decisions regarding resource allocation and inter-ventions and identifies opportunities to improve emergency preparedness for future disasters.
The North Carolina Disease Event Tracking and Epidemiologic Collection Tool (NC DETECT) is a syndromic surveillance system, collecting data from all 124 civilian EDs in North Carolina. NC DETECT receives data from EDs daily in near real-time on patient demographics, chief complaint, triage notes, diagnosis codes, vital signs, and disposition. NC DETECT was queried to identify Hurricane Florence–related ED visits, defined as ED visits during September 7–28, 2018, resulting from forces of the disaster (e.g., wind and flooding) or direct consequences of these forces (e.g., structural collapse), disruption of normal services, storm preparation or cleanup, stress or anxiety from the storm, or need for shelter. The query was modified from previous hurricane queries in NC DETECT to capture Hurricane Florence–related ED visits with “hurricane,” “Florence,” “flood,” or “storm” in the chief complaint or triage notes.* Record-level data, includ-ing patient demographics, chief complaint, and triage notes, were abstracted. Three epidemiologists at the North Carolina Division of Public Health independently reviewed ED visits identified from the keyword query. Visits that indicated the hurricane was a contributing factor and fit the case definition, by reviewer consensus, were considered hurricane-related and were included in the analysis. The reviewers then further clas-sified these hurricane-related ED visits, by consensus, into one of four health categories: injuries, illnesses, medication refills, or other. Percentages of ED visits in each category were compared for periods before (September 7–13), during (September 14–17), and after (September 18–28) Hurricane Florence. Log-binomial models were used to estimate
* The keyword query excluded ED visits with “thyroid” to avoid capturing visits related to thyroid storm condition.
prevalence ratios (PRs) and 95% confidence intervals (CIs) using SAS (version 9.4; SAS Institute).
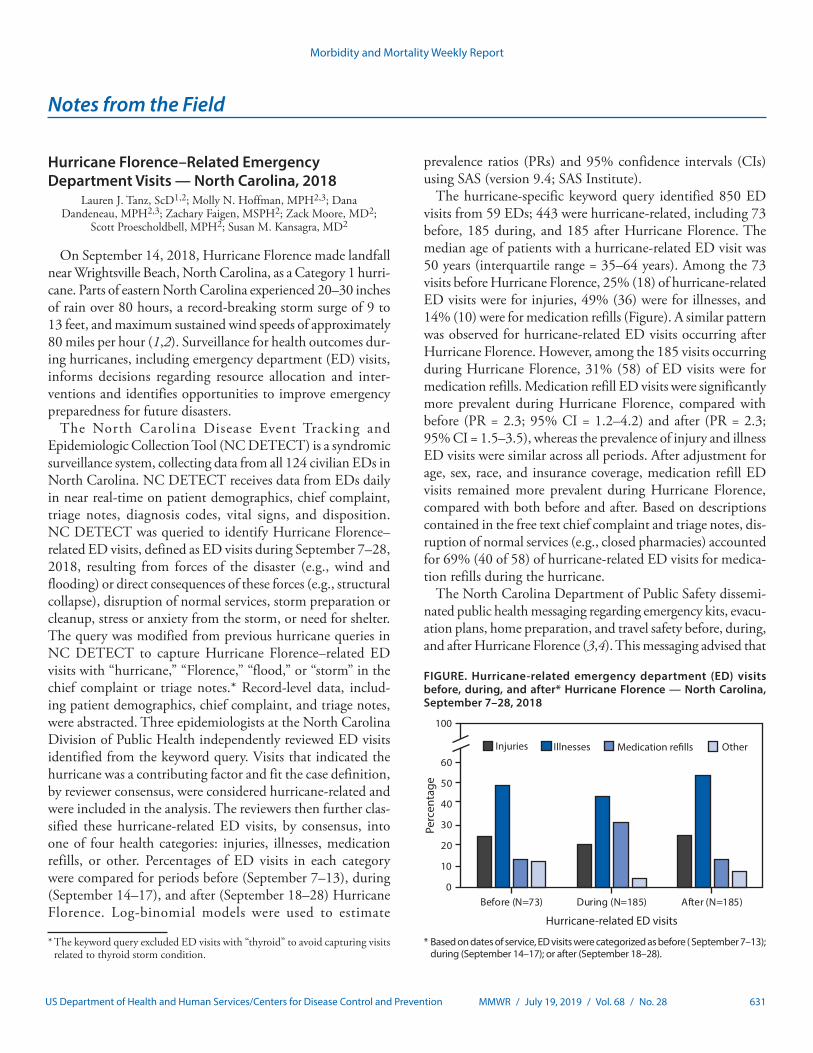
The hurricane-specific keyword query identified 850 ED visits from 59 EDs; 443 were hurricane-related, including 73 before, 185 during, and 185 after Hurricane Florence. The median age of patients with a hurricane-related ED visit was 50 years (interquartile range = 35–64 years). Among the 73 visits before Hurricane Florence, 25% (18) of hurricane-related ED visits were for injuries, 49% (36) were for illnesses, and 14% (10) were for medication refills (Figure). A similar pattern was observed for hurricane-related ED visits occurring after Hurricane Florence. However, among the 185 visits occurring during Hurricane Florence, 31% (58) of ED visits were for medication refills. Medication refill ED visits were significantly more prevalent during Hurricane Florence, compared with before (PR = 2.3; 95% CI = 1.2–4.2) and after (PR = 2.3; 95% CI = 1.5–3.5), whereas the prevalence of injury and illness ED visits were similar across all periods. After adjustment for age, sex, race, and insurance coverage, medication refill ED visits remained more prevalent during Hurricane Florence, compared with both before and after. Based on descriptions contained in the free text chief complaint and triage notes, dis-ruption of normal services (e.g., closed pharmacies) accounted for 69% (40 of 58) of hurricane-related ED visits for medica-tion refills during the hurricane.
The North Carolina Department of Public Safety dissemi-nated public health messaging regarding emergency kits, evacu-ation plans, home preparation, and travel safety before, during, and after Hurricane Florence (3,4). This messaging advised that
FIGURE. Hurricane-related emergency department (ED) visits before, during, and after* Hurricane Florence — North Carolina, September 7–28, 2018
0
10
20
30
40
50
60
Before (N=73) During (N=185) After (N=185)
100
Perc
enta
ge
Injuries Illnesses OtherMedication re�lls
Hurricane-related ED visits
* Based on dates of service, ED visits were categorized as before ( September 7–13); during (September 14–17); or after (September 18–28).
Morbidity and Mortality Weekly Report
632 MMWR / July 19, 2019 / Vol. 68 / No. 28 US Department of Health and Human Services/Centers for Disease Control and Prevention
prescription medicines should be included in home emergency kits. However, during the hurricane, 31% of hurricane-related ED visits were for medication refill. Therefore, it is important that effective messaging to the public, health care providers, and pharmacists before hurricanes emphasize that medications should be refilled to last throughout the storm. North Carolina law permits coverage for extra prescription medication refills during a state of emergency.† Proactive automated pharmacy notifications encouraging patients to refill medications before a potential natural disaster have resulted in small increases in medication refills (5). This approach might reduce medication refill ED visits during future natural disasters. In addition, the keyword query used for surveillance of Hurricane Florence–related ED visits in North Carolina could be applied in CDC’s National Syndromic Surveillance Program BioSense Platform and easily modified for use in other states and for other types of natural disasters. This action could enhance natural disaster surveillance nationwide and lead to further query refinement and data analysis that can benefit public health.† Coverage for extra prescriptions during a state of emergency or disaster. Chap
58 Sect 58-3-228, North Carolina General Statutes, North Carolina General Assembly (2018). https://www.ncleg.net/EnactedLegislation/Statutes/HTML/BySection/Chapter_58/GS_58-3-228.html.
Corresponding author: Lauren J. Tanz, [email protected], 919-707-5202.
1Epidemic Intelligence Service, CDC; 2Division of Public Health, North Carolina Department of Health and Human Services, Raleigh, North Carolina; 3Council of State and Territorial Epidemiologists, Atlanta, Georgia.
All authors have completed and submitted the ICMJE form for disclosure of potential conflicts of interest. No potential conflicts of interest were disclosed.
References1. National Weather Service. Historical Hurricane Florence, September 12–15,
2018. Newport, NC: US Department of Commerce, National Oceanic and Atmospheric Administration, National Weather Service; 2018. https://www.weather.gov/mhx/Florence2018
2. National Hurricane Center and Central Pacific Hurricane Center. Hurricane Florence advisory number 61. Miami, FL: US Department of Commerce, National Oceanic and Atmospheric Administration, National Hurricane Center and Central Pacific Hurricane Center; 2018. https://www.nhc.noaa.gov/archive/2018/al06/al062018.public.061.shtml
3. North Carolina Department of Public Safety. North Carolina readies for Florence as storm strengthens today [Press release]. Raleigh, NC: North Carolina Department of Public Safety; 2018. https://www.ncdps.gov/news/press-releases/2018/09/09/north-carolina-readies-florence-storm-strengthens-today
4. North Carolina Department of Public Safety. As Florence continues grinding across NC, more hazardous floods, power outages expected [Press release]. Raleigh, NC: North Carolina Department of Public Safety; 2018. https://www.ncdps.gov/news/press-releases/2018/09/14/florence-continues-grinding-across-nc-more-hazardous-floods-power
5. Lurie N, Bunton A, Grande K, Margolis G, Howell B, Shrank WH. A public-private partnership for proactive pharmacy-based outreach and acquisition of needed medication in advance of severe winter weather. JAMA Intern Med 2017;177:271–2. https://doi.org/10.1001/jamainternmed.2016.7208
Morbidity and Mortality Weekly Report
MMWR / July 19, 2019 / Vol. 68 / No. 28 633US Department of Health and Human Services/Centers for Disease Control and Prevention
QuickStats
FROM THE NATIONAL CENTER FOR HEALTH STATISTICS
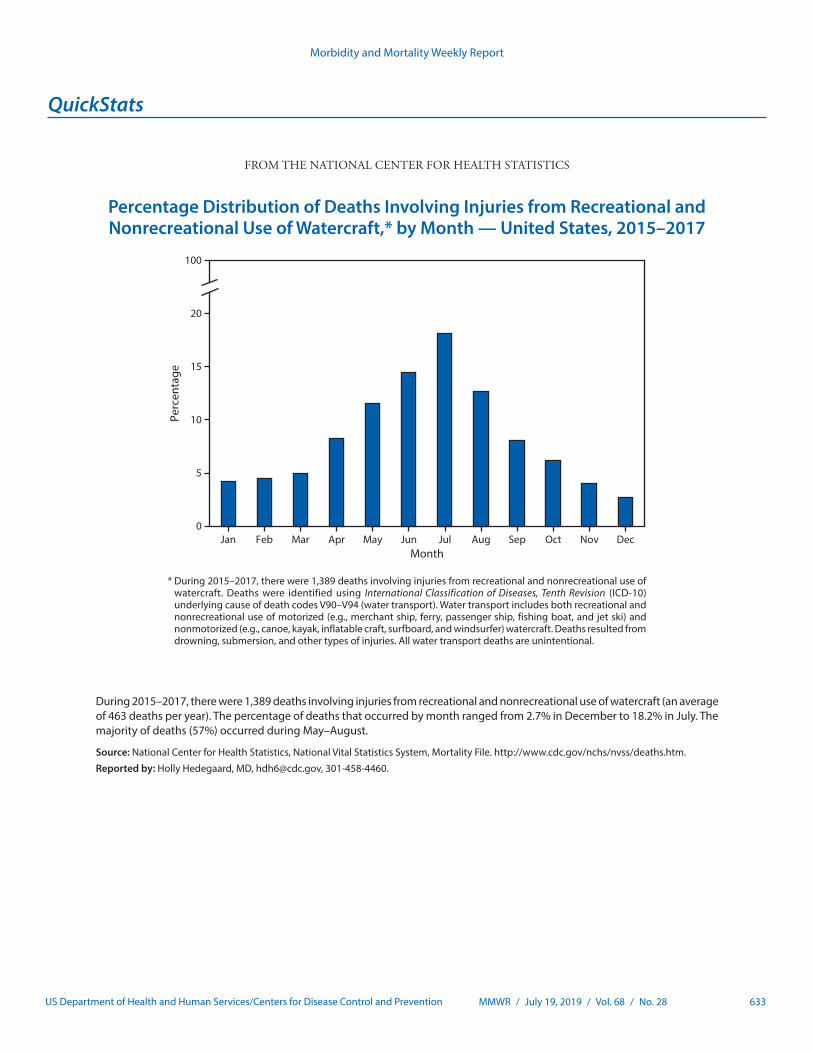
Percentage Distribution of Deaths Involving Injuries from Recreational and Nonrecreational Use of Watercraft,* by Month — United States, 2015–2017
0
5
10
15
20
100
Jan Feb Mar Apr May Jun Jul Aug Sep Oct Nov DecMonth
Perc
enta
ge
* During 2015–2017, there were 1,389 deaths involving injuries from recreational and nonrecreational use of watercraft. Deaths were identified using International Classification of Diseases, Tenth Revision (ICD-10) underlying cause of death codes V90–V94 (water transport). Water transport includes both recreational and nonrecreational use of motorized (e.g., merchant ship, ferry, passenger ship, fishing boat, and jet ski) and nonmotorized (e.g., canoe, kayak, inflatable craft, surfboard, and windsurfer) watercraft. Deaths resulted from drowning, submersion, and other types of injuries. All water transport deaths are unintentional.
During 2015–2017, there were 1,389 deaths involving injuries from recreational and nonrecreational use of watercraft (an average of 463 deaths per year). The percentage of deaths that occurred by month ranged from 2.7% in December to 18.2% in July. The majority of deaths (57%) occurred during May–August.
Source: National Center for Health Statistics, National Vital Statistics System, Mortality File. http://www.cdc.gov/nchs/nvss/deaths.htm.
Reported by: Holly Hedegaard, MD, [email protected], 301-458-4460.


Morbidity and Mortality Weekly Report
ISSN: 0149-2195 (Print)
The Morbidity and Mortality Weekly Report (MMWR) Series is prepared by the Centers for Disease Control and Prevention (CDC) and is available free of charge in electronic format. To receive an electronic copy each week, visit MMWR at https://www.cdc.gov/mmwr/index.html.
Readers who have difficulty accessing this PDF file may access the HTML file at https://www.cdc.gov/mmwr/index2019.html. Address all inquiries about the MMWR Series, including material to be considered for publication, to Executive Editor, MMWR Series, Mailstop E-90, CDC, 1600 Clifton Rd., N.E., Atlanta, GA 30329-4027 or to [email protected].
All material in the MMWR Series is in the public domain and may be used and reprinted without permission; citation as to source, however, is appreciated.
MMWR and Morbidity and Mortality Weekly Report are service marks of the U.S. Department of Health and Human Services.
Use of trade names and commercial sources is for identification only and does not imply endorsement by the U.S. Department of Health and Human Services.
References to non-CDC sites on the Internet are provided as a service to MMWR readers and do not constitute or imply endorsement of these organizations or their programs by CDC or the U.S. Department of Health and Human Services. CDC is not responsible for the content of these sites. URL addresses listed in MMWR were current as of the date of publication.