state route 74 lower ortega highway … state route 74 lower ortega highway widening orange county,...
TRANSCRIPT

DRAFT
STATE ROUTE 74
LOWER ORTEGA HIGHWAY WIDENING
Orange County, California District 12 – ORA – 74, (KP 1.7/3.0) PM 1.0/1.9
EA 086900
TRAFFIC STUDY Prepared by: Austin-Foust Associates, Inc. 2223 Wellington Avenue, Suite 300 Santa Ana, California 92701-3161 (714) 667-0496 July 18, 2008

________ State Route 74 – Lower Ortega Highway Widening i Austin-Foust Associates, Inc. Traffic Study 575015rpt(7-18-08).doc
CONTENTS Page 1.0 INTRODUCTION Project Description ........................................................................................................................1-1 Scope and Methodology ................................................................................................................1-2 Performance Criteria......................................................................................................................1-3 Related Studies ..............................................................................................................................1-3 The Ranch Plan (Reference 1) ................................................................................................1-6 SR-241 Extension (Reference 2).............................................................................................1-6 1-5/SR-74 Interchange (Reference 3) .....................................................................................1-6 References .....................................................................................................................................1-6
2.0 TRANSPORTATION SETTING Existing Conditions .......................................................................................................................2-1 Future Growth................................................................................................................................2-1 Future Roadway Network..............................................................................................................2-6 Traffic Forecasts ............................................................................................................................2-6 Truck Volumes......................................................................................................................2-11 Traffic Components ..............................................................................................................2-11 Pedestrians ............................................................................................................................2-16
3.0 TRAFFIC ANALYSIS 2035 Traffic Forecasts ...................................................................................................................3-1 Levels of Service ...........................................................................................................................3-1 Measures of Effectiveness .............................................................................................................3-1
4.0 SPECIAL ISSUES No-Build Traffic Diversion ...........................................................................................................4-1 SR-241 Extension ..........................................................................................................................4-3 Master Plan of Arterial Highways .................................................................................................4-6 Growth Inducing Impacts ..............................................................................................................4-6 APPENDICES: A: Caltrans Capacity Guidelines B: HCM Calculations and Syncho Summaries

________ State Route 74 – Lower Ortega Highway Widening ii Austin-Foust Associates, Inc. Traffic Study 575015rpt.doc
LIST OF FIGURES Page
1-1 Study Area...............................................................................................................................1-4
2-1 2008 AM Peak Hour and ADT Volumes ................................................................................2-2 2-2 2008 PM Peak Hour and ADT Volumes.................................................................................2-3 2-3 RSA’s and CAA’s...................................................................................................................2-9 2-4 2035 Highway System ..........................................................................................................2-10 2-5 2008 and 2035 ADT Volumes (000s) ...................................................................................2-13 2-6 Project Sub-Areas .................................................................................................................2-14
3-1 2035 ADT and AM Peak Hour Volumes ................................................................................3-2 3-2 2035 PM Peak Hour Volumes.................................................................................................3-3
4-1 ADT Difference 2035 No Build Minus Base Case .................................................................4-2 4-2 2035 Base Case ADT Volumes...............................................................................................4-4 4-3 2035 Without SR-241 Extension ADT Volumes (000s).........................................................4-5 4-4 2035 MPAH ADT Volumes (000s) ........................................................................................4-7

________ State Route 74 – Lower Ortega Highway Widening iii Austin-Foust Associates, Inc. Traffic Study 575015rpt.doc
LIST OF TABLES Page
1-1 Performance Criteria ...............................................................................................................1-5
2-1 Existing Level of Service (LOS) – Roadway Segments .........................................................2-4 2-2 Existing Delay by Intersection Movements ............................................................................2-5 2-3 Demographic Projections ........................................................................................................2-7 2-4 Ortega Highway Link Volumes ............................................................................................2-12 2-5 Trip Components – Project Section of SR-74.......................................................................2-15
3-1 2035 Roadway Segment Summary .........................................................................................3-4 3-2 Intersection Performance Summary ........................................................................................3-5 3-3 Peak Hour Speed Summary ....................................................................................................3-8 3-4 VMT Summary .....................................................................................................................3-10
A-1 Caltrans TIA Guidelines ........................................................................................................A-2

State Route 74 – Lower Ortega Highway Widening 1-1 Austin-Foust Associates, Inc. Traffic Study 575015rpt(7-18-08).doc
Chapter 1.0 INTRODUCTION
This report presents traffic analysis information for the Lower SR-74 Widening Project. It has
been prepared to provide supporting data for the Environmental Impact Report (EIR) being prepared for
widening this section of highway.
PROJECT DESCRIPTION
The proposed project is located on a section of SR-74 (Ortega Highway) within the City of San
Juan Capistrano, east of I-5 from Calle Entradero (PM 1.0/KP 1.7) to the City of San Juan
Capistrano/Orange County line (PM 1.9/KP 3.0). Currently, there are two 12-foot (3.6-meters) lanes in
each direction and no median throughout the project area. The project will provide one additional 12-foot
(3.6 meters) wide lane in each direction, as well as a 12-foot (3.6 meters) wide painted median.
Throughout most of its length, a five foot (1.5 meter) paved shoulder will be provided on each
side of the roadway to accommodate Class II (striped on-road) bicycle facilities. From Avenida Siega to
the City/County limits, the shoulder/bike lane will transition to an eight-foot wide (2.4 meter wide)
shoulder to merge with the County portion of the widening project.
There are five roadways that intersect with SR-74 from the south within the Project Limits: Calle
Entradero, Via Cordova, Via Cristal, Via Errecarte, and Avenida Siega. North of SR-74, Via Cordova
becomes Hunt Club Drive, and Avenida Siega becomes Shade Tree Lane. The other two connections to
the south are Tee intersections. Additionally, to the north, Palm Hill Drive, Strawberry Lane, and Toyon
Drive provide access to private property. Each intersection will be modified/widened to accommodate
the additional lanes, median, and shoulders. Where there are existing right-turn pockets (Via Cordova
and Via Cristal), the right-turn pocket will remain. No new intersections are proposed, and no existing
intersections are proposed to be signalized (no intersections meet a signal warrant).
There are two Build Alternatives, the differences being in the amount of widening on the north
side versus the south side of the roadway. Build Alternative 1 proposes eliminating the sidewalk on the
north side of State Route 74 to accommodate the widening. The south sidewalk would be maintained in

State Route 74 – Lower Ortega Highway Widening 1-2 Austin-Foust Associates, Inc. Traffic Study 575015rpt(7-18-08).doc
its current location with the exception of a portion of sidewalk at the intersection of Via Cordova, where
the sidewalk would be shifted to the south and reconstructed to provide for the right-turn pocket at this
intersection. A new sidewalk would be constructed on the south side to just east of Avenida Siega, where
it would connect to the County sidewalk system being constructed with the County portion of the project.
Under Build Alternative 2, the sidewalk on the north side of SR-74 between Calle Entradero and
Via Cordova would be retained, but would be reconstructed. This existing meandering sidewalk would
be reconstructed as a straight sidewalk (not curvilinear) within the existing public right-of-way. A short
retaining wall would be required along the existing limit of the public right-of-way, which is delineated
by the south side edge of the existing equestrian trail.
SCOPE AND METHODOLOGY
The traffic analysis evaluates the project in a 2035 time frame, comparing the No-Build
Alternative with the two Build Alternatives. Peak hour traffic forecasts are used to derive a number of
performance measures as described in the next section of this chapter. It should be noted that for traffic
analysis purposes, there is no difference between the two Build Alternatives since the lane configurations
are the same for each. Hence, throughout this report they are referred to as the Build Alternatives.
The traffic forecast data used for the analysis has been prepared using the South County Sub-Area
Model (SCSAM) which, in turn, was derived from the Orange County Transportation Analysis Model
(OCTAM) version 3.1. The SCSAM has undergone certification by the Orange County Transportation
Authority (OCTA) and thereby is consistent with the subarea modeling guidelines established by that
agency. The sub-area model serves a number of applications in South Orange County including local
area traffic analyses in Laguna Niguel, San Juan Capistrano, Mission Viejo and unincorporated Orange
County areas. The consistency requirements ensure that the traffic model data is derived in a regional
context, in this case with OCP-2004 demographic projections for Orange County and General Plan land
use buildout for the cities of Mission Viejo, San Juan Capistrano, Laguna Niguel, and the communities of
Las Flores and Ladera Ranch. For the Rancho Mission Viejo area east of the city, the land use plan as
approved in 2004 and modified under a subsequent Settlement Agreement has been used in the traffic
forecasting assumptions.
Other considerations in the traffic forecast database include future roadways in South Orange
County, including Master Plan of Arterial Highways (MPAH) additions such as La Pata Avenue and a
State Route 74 – Lower Ortega Highway Widening 1-3 Austin-Foust Associates, Inc. Traffic Study 575015rpt(7-18-08).doc
southward extension of SR-241 along the recently adopted alignment. A more detailed discussion of the
assumptions used in the analysis can be found in Chapter 2.0 of this report.
PERFORMANCE CRITERIA
The study area for the analysis is shown in Figure 1-1. Peak hour and average daily traffic (ADT)
volumes for this section of roadway are used to compare traffic performance for the Build Alternatives
versus the No Build project alternative.
Table 1-1 summarizes the performance criteria used in the analysis. For roadway sections within
the project limits, a volume-to-capacity (V/C) based analysis was performed. The peak hour lane
capacity for the Build Alternatives uses the Caltrans guidelines for multi-lane highways (see Table A-1 in
the appendix). For the No-Build, the capacity was reduced by 15 percent to account for the existing
facility being two lanes with substandard shoulders and other constraints (the 15 percent reduction was
estimated by examining the various factors affecting capacity as discussed in the Highway Capacity
Manual (HCM)).
It might be noted that the HCM uses a methodology for two-lane highways that is based on the
ability to pass. The LOS is calculated for two-directional peak hour flows with LOS being a function of
the calculated “Percent Time Spent Following (PTSF).” While V/C is also calculated, it is not used for
determining LOS. Since no passing is possible along Ortega Highway, and a 45 MPH speed limit is
posted along the existing two-lane section, the HCM methodology is not considered applicable to this
section of Highway.
In addition to the V/C link analysis, an intersection analysis was performed using the Highway
Capacity Manual (HCM) stopped delay methodology for all the study area intersections. In this case,
SYNCHRO 6.0 was used to derive delay values at the legs of the intersections subject to stop control.
RELATED STUDIES
Several recent studies have relevance with respect to this project. Some brief comments on each
are as follows:


State Route 74 – Lower Ortega Highway Widening 1-5 Austin-Foust Associates, Inc. Traffic Study 575015rpt(7-18-08).doc
Table 1-1
PERFORMANCE CRITERIA
ROADWAY SECTIONS V/C Calculation Methodology Based on peak hour volume/capacity (V/C) ratios calculated using the following lane capacities:
A maximum capacity of 1,785 vehicles per hour per lane (vphpl) for the No-Build Alternative (i.e., a two-lane highway).
A maximum capacity of 2,100 vphpl for the Build Alternatives (i.e., a four-lane highway). Performance Standard Level of Service D (peak hour V/C less than or equal to .88). ARTERIAL INTERSECTIONS Stopped Delay Calculation Methodology Highway Capacity Manual (HCM) methodology using SYNCHRO 6.0 Performance Standard
Level of Service D - stopped delay less than or equal to 50 seconds (applies only to vehicles entering or exiting a side street).
MEASURES OF EFFECTIVENESS The following measures are derived for the section of highway in the project limits: Average Speed by direction for AM and PM peak hours

State Route 74 – Lower Ortega Highway Widening 1-6 Austin-Foust Associates, Inc. Traffic Study 575015rpt(7-18-08).doc
The Ranch Plan (Reference 1)
This project will have 14,000 dwelling units plus commercial and business park uses. It was
approved by the Orange County Board of Supervisors in 2004, and updated as part of a subsequent
settlement agreement with parties pursuing potential litigation. The EIR for that project provided the
environmental documentation for the County portion of the SR-74 widening.
SR-241 Extension (Reference 2)
As part of the South County Transportation Infrastructure Improvement Plan (SOCTIIP), various
alignments of the SR-241 extension were analyzed. The volumes in this report assume that extension
along the alignment that was selected as part of the SOCTIIP process. The implications with respect to
the project not being built by 2035 are discussed in Chapter 4.0.
I-5/SR-74 Interchange (Reference 3)
Improvements to this interchange have been the subject of a Caltrans Project Study Report (PSR).
A Project Report and accompanying environmental documentation are currently nearing completion.
REFERENCES
1. “SR-74 (Ortega Highway) Widening Project Traffic Study,” Austin-Foust Associates, Inc., February 2008.
2. “South Orange County Transportation Infrastructure Improvement Project Traffic And
Circulation Technical Report,” Austin-Foust Associates, Inc., December 2003.
3. “I-5/Ortega Highway Interchange Traffic Analysis For Project Report,” Austin-Foust Associates, Inc., February 2008.

State Route 74 – Lower Ortega Highway Widening 2-1 Austin-Foust Associates, Inc. Traffic Study 575015rpt.doc
Chapter 2.0 TRANSPORTATION SETTING
This chapter describes the transportation setting for the proposed project. Existing conditions are
presented followed by growth forecasts for use in the traffic analysis.
EXISTING CONDITIONS
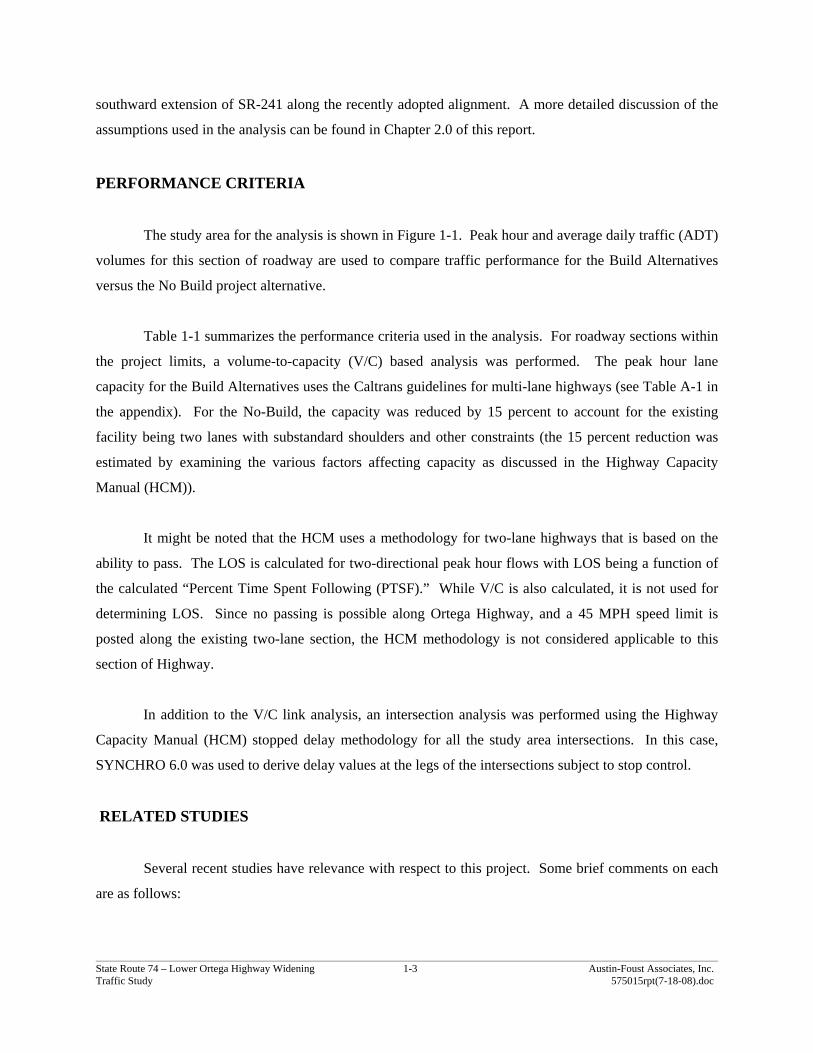
The existing (2008) ADT and peak hour volumes along the section of SR-74, between La Novia
Avenue and the easterly project limits, can be seen in Figures 2-1 and 2-2. While only the roadway
segments and intersections within the project are analyzed in this traffic study, the extended forecasts
given here show the continuity of flow along this section of SR-74.
Application of the highway segment and intersection performance criteria outlined in Chapter 1.0
gives the level of service (LOS) results presented in Table 2-1. As can be seen here, the two-lane section
of roadway at the west end of the project limits is showing LOS “E” for westbound traffic during the AM
peak hour.
The side street delay values are listed in Table 2-2. It should be noted that these side street delay
values are calculated using the Highway Capacity Manual (HCM) procedures. Such calculations assume
certain gap acceptance parameters and may not be representative of actual conditions or driver behavior at
individual locations. The HCM values are accepted practice for comparative purposes when intersection
LOS (delay < 50 sec/veh) is being evaluated.
For the side street exiting and entering movements, the calculated delay exceeds the acceptable
LOS for several movements and locations.
FUTURE GROWTH
As background to the 2035 analysis year projections, demographic data is presented for the areas
that generally contribute to traffic growth along the proposed project. This information is taken from the


State Route 74 – Lower Ortega Highway Widening 2-4 Austin-Foust Associates, Inc. Traffic Study 575015rpt.doc
Table 2-1
EXISTING LEVEL OF SERVICE (LOS)
-Roadway Segments
Peak Hour Lane Design Number Facility Peak Hour Location Capacity of Lanes Capacity Volume* V/C LOS SR-74 w/o Via Cordova/Hunt Club AM 2,100 1 1,785 1,617 0.94 E PM 2,100 1 1,785 1,360 0.76 D SR-74 w/o Via Cristal AM v 1 1,785 1,577 0.88 D PM 2,100 1 1,785 1,303 0.73 D SR-74 w/o Avenida Siega AM 2,100 1 1,785 1,553 0.87 D PM 2,100 1 1,785 1,267 0.71 D SR-74 e/o Avenida Siega AM 2,100 1 1,785 1,552 0.87 D PM 2,100 1 1,785 1,263 0.71 D *Highest one-way volume (westbound in the AM and eastbound in the PM) Level of service values as follows: A V/C < .30 B V/C .30 - .47 C V/C .48 - .68 D V/C .69 - .88 E V/C .89 – 1.00 F V/C > 1.00

State Route 74 – Lower Ortega Highway Widening 2-5 Austin-Foust Associates, Inc. Traffic Study 575015rpt.doc
Table 2-2
EXISTING DELAY BY INTERSECTION MOVEMENTS
DELAY (sec/veh) INTERSECTION EBL WBL NBL NBR SBL SBR 6. Calle Entradero & Ortega Hwy AM Peak Hour Existing 21 9 58 4 118 10 PM Peak Hour Existing 2 17 90 13 68 4 7. Via Cordova/Hunt Club & Ortega Hwy AM Peak Hour Existing 26 12 147 10 146 14 PM Peak Hour Existing 4 22 32 34 97 5 8. Via Cristal & Ortega Hwy AM Peak Hour Existing -- 17 * 13 -- -- PM Peak Hour Existing -- 32 141 16 -- -- 9. Strawberry & Ortega Hwy AM Peak Hour Existing 59 -- -- -- * * PM Peak Hour Existing 2 -- -- -- 40 5 10. Via Errecarte & Ortega Hwy AM Peak Hour Existing -- 6 153 38 -- -- PM Peak Hour Existing -- 8 57 25 -- -- 11. Avd Siega & Ortega Hwy AM Peak Hour Existing 92 9 * 10 * * PM Peak Hour Existing 2 23 53 20 44 0 * Denotes greater than 200 seconds of delay
LOS ranges: 0 – 10 sec A 10 – 15 sec B 15 – 25 sec C 25 – 35 sec D 35 – 50 sec E

State Route 74 – Lower Ortega Highway Widening 2-6 Austin-Foust Associates, Inc. Traffic Study 575015rpt.doc
Orange County Projections 2006 (OCP- 2006), and shows growth in population and employment for five-
year intervals from 2005 through 2035.
The OCP-2006 projections of population and employment for selected areas in the vicinity of the
project can be seen in Table 2-3 (Figure 2-3 shows the referenced areas). The project is located at the
most northerly end of Community Analysis Area (CAA) 68 at the boundary between CAA’s 64 and 59.
Traffic growth in this area between 2005 and 2035 is anticipated to be around 40 percent when both
population and employment are considered (as noted below, not all this growth occurs on SR-74 because
of new regional roadway connections).
FUTURE ROADWAY NETWORK
The future highway network in the vicinity of the project is shown in Figure 2-4. The
assumptions used here represent a future “committed” network, which generally comprises funded
improvements. New regional linkages include the La Pata Avenue southward extension and the SR-241
southward extension along the recently adopted A7C-FEC-M Alignment.
The future network does not include certain roadways that are on the County Master Plan of
Arterial Highways (MPAH) such as the extensions of San Juan Creek Road and Camino Las Ramblas to
La Pata Avenue. Nor is the future northward extension of Alipaz Street in the City of San Juan
Capistrano included in the committed network assumptions. These MPAH roadways are discussed in a
special section in Chapter 4.0.
TRAFFIC FORECASTS
As discussed in Chapter 1.0, the traffic forecast data was produced using the South County Sub-
Area Model (SCSAM). The SCSAM was derived from OCTAM 3.1, and has been used for numerous
transportation studies in South Orange County including the I-5/SR-74 Interchange Project Report.
Two major changes affect the growth in traffic between now and 2035:
1. Development of the Ranch Plan area with both residential and non-residential land uses.
2. New regional linkages, specifically SR-241 and La Pata Avenue.

State Route 74 – Lower Ortega Highway Widening 2-7 Austin-Foust Associates, Inc. Traffic Study 575015rpt.doc
Table 2-3
DEMOGRAPHIC PROJECTIONS
2005 2010 2015 2020 2025 2030 2035 RSA’s* POPULATION RSA C-43 Amount 284,955 300,281 323,325 339,723 354,229 361,412 362,060 5 Year Growth 5.4% 7.7% 5.1% 4.3% 2.0% 0.2% Cumulative Growth 5.4% 13.5% 19.2% 24.3% 26.8% 27.1% RSA D-40 Amount 62,784 65,933 67,343 68,330 68,668 69,129 69,269 5 Year Growth 5.0% 2.1% 1.5% 0.5% 0.7% 0.2% Cumulative Growth 5.0% 7.3% 8.8% 9.4% 10.1% 10.3% Combined Amount 347,739 366,214 390,668 408,053 422,897 430,541 431,329 5 Year Growth 5.3% 6.7% 4.5% 3.6% 1.8% 0.2% Cumulative Growth 5.3% 12.3% 17.3% 21.6% 23.8% 24.0% RSA’s* EMPLOYMENT RSA C-43 Amount 84,269 110,740 123,773 130,961 135,104 135,511 135,684 5 Year Growth 31.4% 11.8% 5.8% 3.2% 0.3% 0.1% Cumulative Growth 31.4% 46.9% 55.4% 60.3% 60.8% 61.0% RSA D-40 Amount 15,049 15,631 16,590 16,732 16,801 16,953 17,006 5 Year Growth 3.9% 6.1% 0.9% 0.4% 0.9% 0.3% Cumulative Growth 3.9% 10.2% 11.2% 11.6% 12.7% 13.0% Combined Amount 99,318 126,371 140,363 147,693 151,905 152,464 152,690 5 Year Growth 27.2% 11.1% 5.2% 2.9% 0.4% 0.1% Cumulative Growth 27.2% 41.3% 48.7% 52.9% 53.5% 53.7% SELECTED CAA’s* POPULATION RSA C-43 CAA 59 74,005 84,163 102,160 112,922 119,820 120,657 120,752 CAA 70 26,317 27,228 28,434 29,399 29,773 30,003 30,035 Total 100,322 111,391 130,594 142,321 149,593 150,660 150,787 5 Year Growth 11.0% 17.2% 9.0% 5.1% 0.7% 0.1% Cumulative Growth 11.0% 30.2% 41.9% 49.1% 50.2% 50.3% RSA D-40 CAA 64 62,784 65,933 67,343 68,330 68,668 69,129 69,269 5 Year Growth 5.0% 2.1% 1.5% 0.5% 0.7% 0.2% Cumulative Growth 5.0% 7.3% 8.8% 9.4% 10.1% 10.3% Combined TOTAL 163,106 177,324 197,937 210,651 218,261 219,789 220,056 5 Year Growth 8.7% 11.6% 6.4% 3.6% 0.7% 0.1% Cumulative Growth 8.7% 21.4% 29.1% 33.8% 34.8% 34.9%
Cont.

State Route 74 – Lower Ortega Highway Widening 2-8 Austin-Foust Associates, Inc. Traffic Study 575015rpt.doc
Table 2-3 (cont) DEMOGRAPHIC PROJECTIONS 2005 2010 2015 2020 2025 2030 2035 SELECTED CAA’s (cont) EMPLOYMENT RSA C-43 CAA 59 14,696 18,453 23,295 27,620 27,711 27,918 27,979 CAA 70 2,781 2,846 2,863 2,876 2,894 2,902 2,908 Total 17,477 21,299 26,158 30,496 30,605 30,820 30,887 5 Year Growth 21.9% 22.8% 16.6% 0.4% 0.7% 0.2% Cumulative Growth 21.9% 49.7% 74.5% 75.1% 76.3% 76.7% RSA D-40 CAA 64 15,049 15,631 16,590 16,732 16,801 16,953 17,006 5 Year Growth 3.9% 6.1% 0.9% 0.4% 0.9% 0.3% Cumulative Growth 3.9% 10.2% 11.2% 11.6% 12.7% 13.0% Combined TOTAL 32,526 36,930 42,748 47,228 47,406 47,773 47,893 5 Year Growth 13.5% 15.8% 10.5% 0.4% 0.8% 0.3% Cumulative Growth 13.5% 31.4% 45.2% 45.7% 46.9% 47.2%
* See Figure 2-3 for RSA and CAA locations.

State Route 74 - Lower Ortega Highway WideningTraffic Study 2-9
Austin-Foust Associates, Inc.575015Fig2-3.pdf


State Route 74 – Lower Ortega Highway Widening 2-11 Austin-Foust Associates, Inc. Traffic Study 575015rpt.doc
Table 2-4 summarizes ADT and peak hour forecasts for a number of locations along SR-74
between I-5 and Antonio Parkway. Since all the growth in traffic is through traffic, the percentage
growth is lower at the west end of the corridor (near I-5) compared to the east end (near Antonio
Parkway). Additional traffic data can be found in Figure 2-5 which shows existing and future ADT
volumes just east of the project area.
It might be noted that ADT forecasts for SR-74 are lower than given in the previous traffic study
for this project. This is related to changes in land use for the westernmost part of The Ranch Plan, and
changes in the planned configuration for the SR-241 interchange with Cow Camp Road. The changes are
greater in the ADT volumes than in the peak hour volumes.
Truck Volumes
Trucks comprise a substantial proportion of the total traffic volumes through the project. This is
related to the Prima Deshecha Land Fill operation on La Pata Avenue and to existing sand and gravel
operations along Ortega Highway. Recent counts by Caltrans show that trucks comprise 19.6 percent of
the traffic in the project portion of SR-74. This percentage has been used for peak hour intersection level
of service (LOS) analyses for both existing and future conditions.
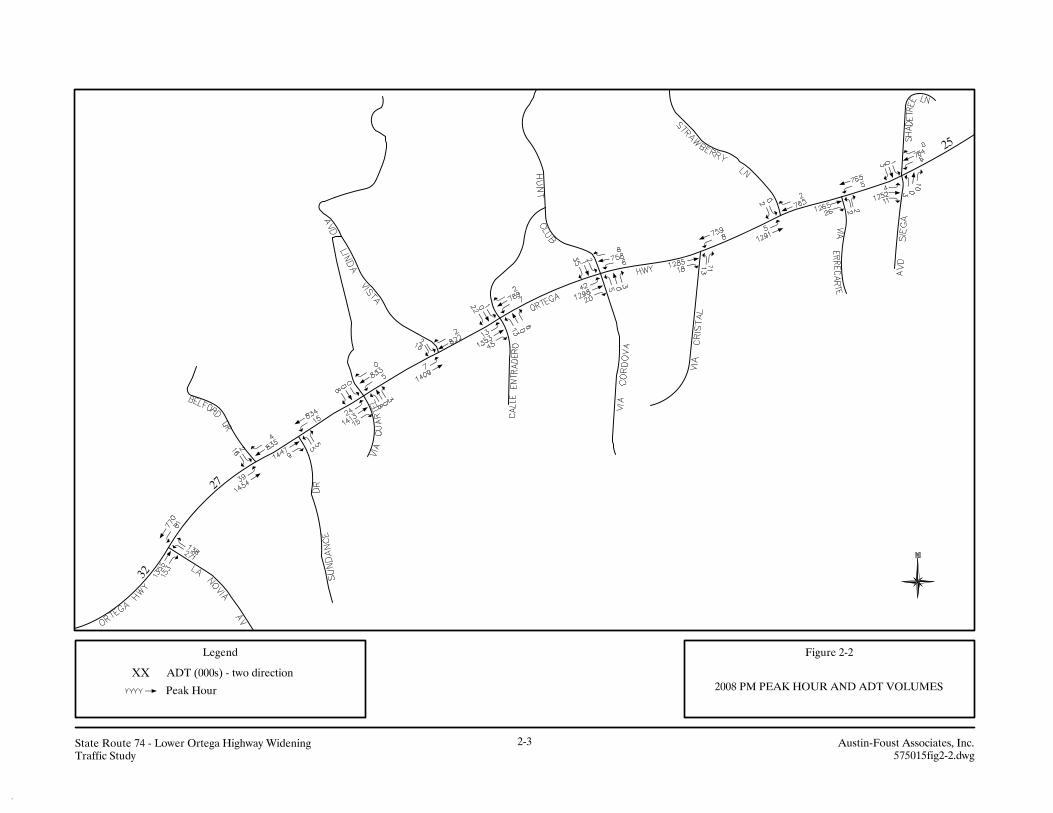
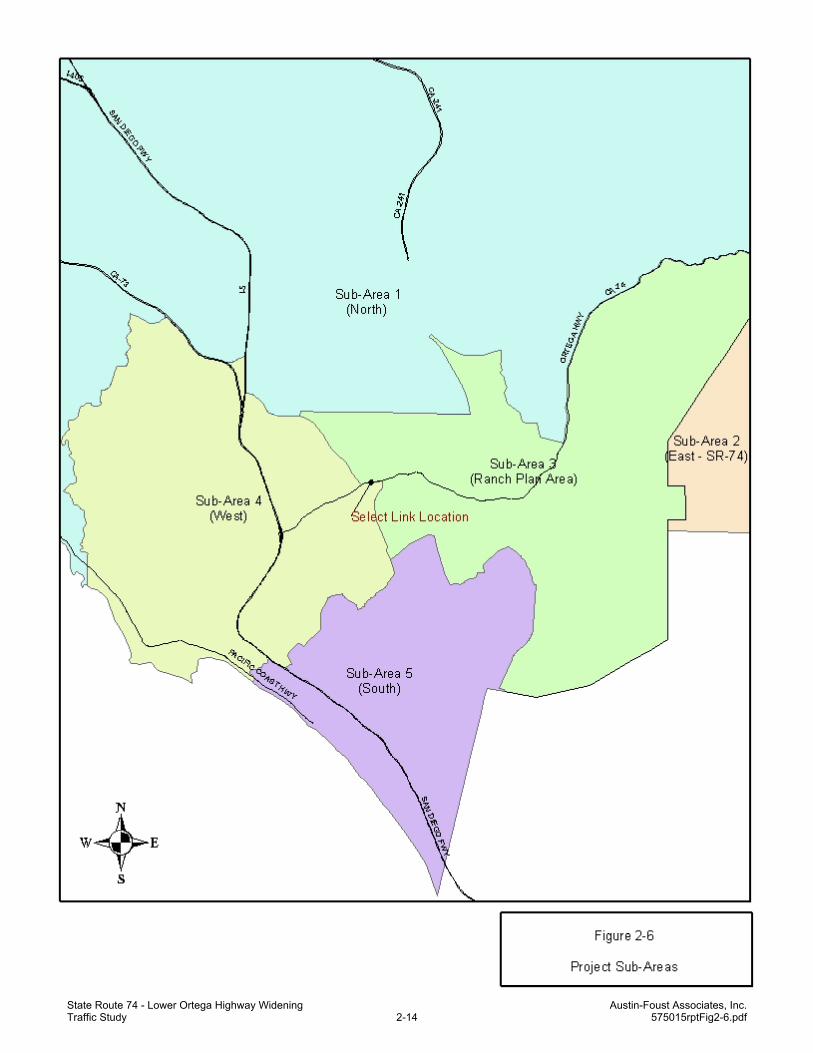
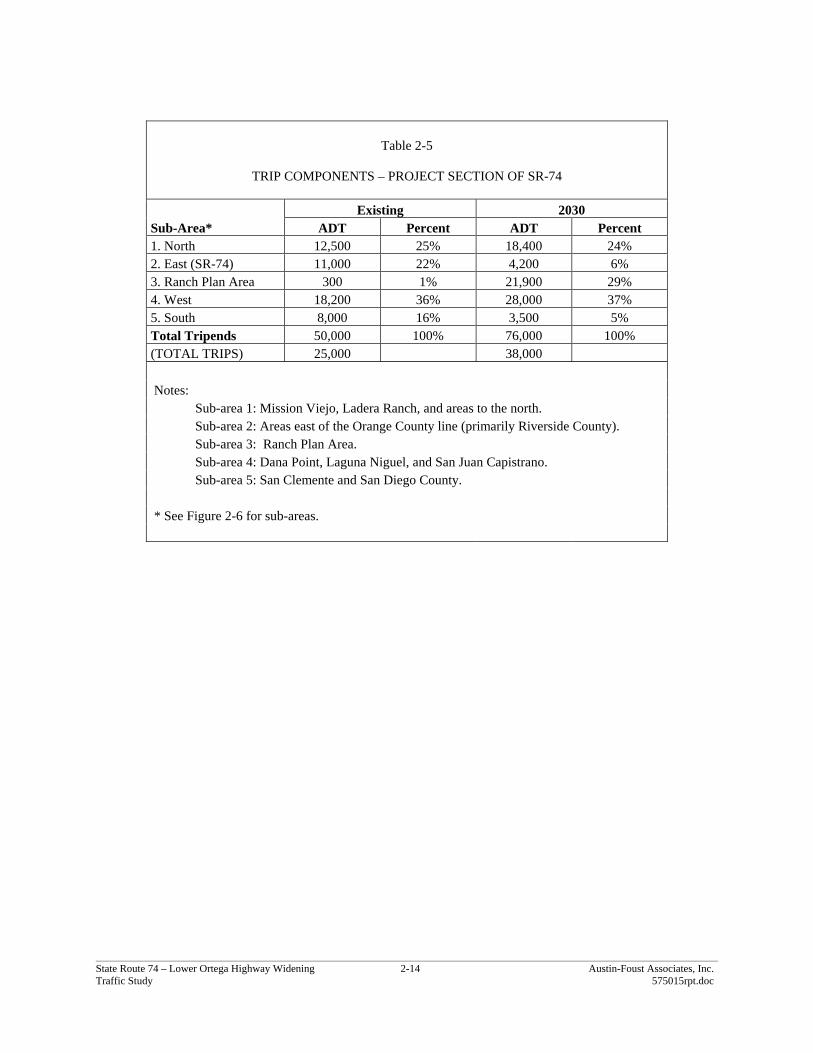
Traffic Components
Using select link data from the SCSAM, an estimate was made of the geographic components of
traffic using the project roadway section. Five sub-areas were used as shown in Figure 2-6 and the results
are shown in Table 2-5. The trip generation results count each trip twice (once at each end of the trip) and
hence total to twice the actual ADT volume on the roadway link.
Significant changes in trip components occur from existing to future, largely related to the land
use and highway system changes noted earlier. For example, the traffic component from Riverside
County is considerably less while the Ranch Plan becomes a higher proportion of the total traffic in the
future.

________ SR-74 (Ortega Highway) Widening Project 2-12 Austin-Foust Associates, Inc. Supplemental Traffic Study 575015rpt.doc
Table 2-4
ORTEGA HIGHWAY LINK VOLUMES
EXISTING 2035 2035 INCREASE Location Direction AM PM ADT AM PM ADT AM PM ADT Westbound 2,010 1,740 2,510 2,230 24.9% 28.2% East of I-5 Eastbound 1,340 2,140 2,420 2,750 80.6% 28.5% Total 3,350 3,880 39,000 4,930 4,980 53,000 47.2% 28.4% 35.9% Westbound 1,920 1,040 2,523 1,515 31.4% 45.7% West of La Novia Eastbound 1,260 1,510 1,625 2,120 29.0% 40.4% Total 3,180 2,550 32,000 4,148 3,635 44,000 30.4% 42.5% 37.5% Westbound 1,689 851 2,260 1,365 33.8% 60.4% East of La Novia Eastbound 905 1,493 1,250 2,140 38.1% 43.3% Total 2,594 2,344 28,000 3,510 3,505 40,000 35.3% 49.5% 42.9% Westbound 1,617 798 2,188 1,312 35.3% 64.4% East of C. Entradero Eastbound 913 1,360 1,258 2,007 37.8% 47.6% Total 2,530 2,158 27,000 3,446 3,319 39,000 36.2% 53.8% 44.4% Westbound 1,550 770 2,123 1,284 37.0% 66.8% East City Limits Eastbound 880 1,260 1,224 1,910 39.1% 51.6% Total 2,430 2,030 25,000 3,347 3,194 38,000 37.7% 57.3% 46.2%

State Route 74 - Lower Ortega Highway WideningTraffic Study 2-14
Austin-Foust Associates, Inc. 575015rptFig2-6.pdf
State Route 74 – Lower Ortega Highway Widening 2-14 Austin-Foust Associates, Inc. Traffic Study 575015rpt.doc
Table 2-5
TRIP COMPONENTS – PROJECT SECTION OF SR-74
Existing 2030 Sub-Area* ADT Percent ADT Percent 1. North 12,500 25% 18,400 24% 2. East (SR-74) 11,000 22% 4,200 6% 3. Ranch Plan Area 300 1% 21,900 29% 4. West 18,200 36% 28,000 37% 5. South 8,000 16% 3,500 5% Total Tripends 50,000 100% 76,000 100% (TOTAL TRIPS) 25,000 38,000 Notes: Sub-area 1: Mission Viejo, Ladera Ranch, and areas to the north. Sub-area 2: Areas east of the Orange County line (primarily Riverside County). Sub-area 3: Ranch Plan Area. Sub-area 4: Dana Point, Laguna Niguel, and San Juan Capistrano. Sub-area 5: San Clemente and San Diego County. * See Figure 2-6 for sub-areas.

State Route 74 – Lower Ortega Highway Widening 2-16 Austin-Foust Associates, Inc. Traffic Study 575015rpt.doc
Pedestrians
There are currently no schools in the immediate vicinity of the project and none are planned for
the future. Hence, pedestrian traffic within the project is anticipated to be minimal.

State Route 74 – Lower Ortega Highway Widening 3-1 Austin-Foust Associates, Inc. Traffic Study 575015rpt(7-18-08).doc
Chapter 3.0 TRAFFIC ANALYSIS
This chapter presents the results from a 2035 analysis of the proposed project. Comparison data
is given for the No-Build Alternative as the baseline setting for the analysis and the Build Alternatives
described in Chapter 1.0.
2035 TRAFFIC FORECASTS
The 2035 peak hour and ADT traffic forecasts are illustrated in Figures 3-1 and 3-2. These
forecasts are used for both the No-Build and Build Alternatives. As will be seen in the analysis results
presented in the next section, the volumes exceed capacity under the No-Build Alternative. Potential
affects of this, such as traffic diversion and peak spreading, are discussed in the next chapter.
LEVELS OF SERVICE
Table 3-1 summarizes the 2035 roadway segment level of service (LOS) for the roadway sections
within the project limits. For each of the AM and PM peak hours, the highest directional volume has
been used for the analysis. As can be seen here, the roadway segments are forecast to operate at
unacceptable levels of service under the 2035 No Build Alternative. Under the 2035 Build Alternatives,
the roadway segments are forecast to operate at an acceptable level of service.
Side street delay results for the side street entering movements are presented in Table 3-2 (see
Appendix B for the actual calculations). It can be seen that under both the No-Build and Build
Alternatives, unacceptable delays (delay > 50 sec/veh) occur. Some left turning vehicles may make a
right turn and then a U-turn, and under the Build Alternatives the road will be wide enough to allow this
maneuver.
MEASURES OF EFFECTIVENESS
The primary measure of effectiveness (MOE) used to compare No-Build to Build conditions is
the average vehicle speed for the section of highway being improved. Information for the MOE was


State Route 74 – Lower Ortega Highway Widening 3-4 Austin-Foust Associates, Inc. Traffic Study 575015rpt.doc
Table 3-1
2035 ROADWAY SEGMENT SUMMARY
2035 NO-BUILD 2035 BUILD Location
Peak Hour
Volume*
Number of Lanes
Peak Hour Capacity
(One-Way)*
V/C
LOS
Number of Lanes
Peak Hour Capacity
(One-Way)*
V/C
LOS SR-74 w/o Via Cordova/Hunt Club AM 2,188 1 1,785 1.23 F 2 4,200 .52 C PM 2,007 1 1,785 1.12 F 2 4,200 .48 C SR-74 w/o Via Cristal AM 2,148 1 1,785 1.20 F 2 4,200 .51 C PM 1,950 1 1,785 1.09 F 2 4,200 .46 B SR-74 w/o Avenida Siega AM 2,124 1 1,785 1.19 F 2 4,200 .51 C PM 1,914 1 1,785 1.07 F 2 4,200 .46 B SR-74 e/o Avenida Siega AM 2,123 1 1,785 1.19 F 2 4,200 .51 C PM 1,910 1 1,785 1.07 F 2 4,200 .45 B *Highest one-way volume (westbound in the AM and eastbound in the PM) Level of service values as follows: A V/C < .30 B V/C .30 - .47 C V/C .48 - .68 D V/C .69 - .88 E V/C .89 – 1.00 F V/C > 1.00

State Route 74 – Lower Ortega Highway Widening 3-5 Austin-Foust Associates, Inc. Traffic Study 575015rpt.doc
Table 3-2
INTERSECTION PERFORMANCE SUMMARY
DELAY (sec/veh) INTERSECTION EBL WBL NBL NBR SBL SBR 6. Calle Entradero & Ortega Hwy AM Peak Hour Existing 21 9 58 4 118 10 2035 No-Build 19 12 59 3 149 15 2035 Build 19 12 67 6 144 15 PM Peak Hour Existing 2 17 90 13 68 4 2035 No-Build 19 102 * 25 * 12 2035 Build 7 3 79 15 56 9 7. Via Cordova/Hunt Club & Ortega Hwy AM Peak Hour Existing 26 12 147 10 146 14 2035 No-Build 25 22 * 36 * 19 2035 Build 25 1 * 9 * 19 PM Peak Hour Existing 4 22 32 34 97 5 2035 No-Build 12 * * * * 10 2035 Build 7 8 74 7 80 7 8. Via Cristal & Ortega Hwy AM Peak Hour Existing -- 17 * 13 -- -- 2035 No-Build -- 13 * 21 -- -- 2035 Build -- 14 157 8 -- -- PM Peak Hour Existing -- 32 141 16 -- -- 2035 No-Build -- * * 103 -- -- 2035 Build -- 26 65 16 -- -- 9. Strawberry & Ortega Hwy AM Peak Hour Existing 59 -- -- -- * * 2035 No-Build 91 -- -- -- * * 2035 Build 39 -- -- -- 155 23 PM Peak Hour Existing 2 -- -- -- 40 5 2035 No-Build 39 -- -- -- * * 2035 Build 3 -- -- -- 82 9
Cont.

State Route 74 – Lower Ortega Highway Widening 3-6 Austin-Foust Associates, Inc. Traffic Study 575015rpt.doc
Table 3-2 (cont) INTERSECTION PERFORMANCE SUMMARY
DELAY (sec/veh) INTERSECTION EBL WBL NBL NBR SBL SBR 10. Via Errecarte & Ortega Hwy AM Peak Hour Existing -- 6 153 38 -- -- 2035 No-Build -- 23 * * -- -- 2035 Build -- 2 87 15 -- -- PM Peak Hour Existing -- 8 57 25 -- -- 2035 No-Build -- 39 * 16 -- -- 2035 Build -- 15 41 13 -- -- 11. Avd Siega & Ortega Hwy AM Peak Hour Existing 9 9 * 10 * * 2035 No-Build * 8 * 20 * * 2035 Build * 10 * 6 * * PM Peak Hour Existing 2 23 53 20 44 9 2035 No-Build 9 43 83 59 * 87 2035 Build 10 18 30 15 43 3 * Denotes greater than 200 seconds of delay
LOS ranges: 0 – 10 sec A 10 – 15 sec B 15 – 25 sec C 25 – 35 sec D 35 – 50 sec E

State Route 74 – Lower Ortega Highway Widening 3-7 Austin-Foust Associates, Inc. Traffic Study 575015rpt(7-18-08).doc
prepared using data from Synchro 6.0 and SIMTRAFFIC and the results are summarized in Table 3-3
(Appendix B contains the Synchro summary tables).
A comparison between 2035 No-Build and 2035 Build indicates a significant increase in the
average travel speed during peak periods. Under the No-Build Alternative, delays would be even greater
than that shown here due to queuing affects at the merge points.
A vehicle miles traveled (VMT) summary for the project is given in Table 3-4. The peak period
derivations and the speed distribution are estimated from typical flow relationships for facilities that are
congested (as in the No-Build Alternative) and facilities with adequate levels of service and flowing at
speeds close to the speed limit during peak hours (as in the Build Alternatives).

State Route 74 – Lower Ortega Highway Widening 3-8 Austin-Foust Associates, Inc. Traffic Study 575015rpt.doc
Table 3-3
PEAK HOUR SPEED SUMMARY
AVG SPEED (mph) LOCATION EBT WBT 6. Calle Entradero & Ortega Hwy AM Peak Hour Existing 34 40 2035 No-Build 31 36 2035 Build 37 36 PM Peak Hour Existing 31 40 2035 No-Build 8* 38 2035 Build 34 38 7. Via Cordova/Hunt Club & Ortega Hwy AM Peak Hour Existing 36 39 2035 No-Build 33 35 2035 Build 37 35 PM Peak Hour Existing 30 40 2035 No-Build 22 38 2035 Build 36 38 8. Via Cristal & Ortega Hwy AM Peak Hour Existing 38 34 2035 No-Build 36 34 2035 Build 37 37 PM Peak Hour Existing 35 38 2035 No-Build 34 35 2035 Build 36 39 9. Strawberry & Ortega Hwy AM Peak Hour Existing 37 33 2035 No-Build 35 33 2035 Build 37 38 PM Peak Hour Existing 35 38 2035 No-Build 33 36 2035 Build 36 40
Cont.

State Route 74 – Lower Ortega Highway Widening 3-9 Austin-Foust Associates, Inc. Traffic Study 575015rpt.doc
Table 3-3 (Cont) PEAK HOUR SPEED SUMMARY AVG SPEED (mph) LOCATION EBT WBT 10. Via Errecarte & Ortega Hwy AM Peak Hour Existing 35 33 2035 No-Build 31 34 2035 Build 36 38 PM Peak Hour Existing 31 38 2035 No-Build 29 36 2035 Build 35 41 11. Avd Siega & Ortega Hwy AM Peak Hour Existing 34 32 2035 No-Build 32 33 2035 Build 37 39 PM Peak Hour Existing 32 38 2035 No-Build 29 35 2035 Build 35 40 Average for the Section AM Peak Hour Existing 36 35 2035 No-Build 33 34 2035 Build 37 37 PM Peak Hour Existing 32 39 2035 No-Build 26 36 2035 Build 36 39 * This low speed reflects the merging from four to two lanes

State Route 74 – Lower Ortega Highway Widening 3-10 Austin-Foust Associates, Inc. Traffic Study 575015rpt.doc
Table 3-4
VMT SUMMARY
2035 No-Build 2035 Build VMT Derivation Peak Off-Peak ADT Peak Off-Peak ADT Length (miles) 0.9 0.9 0.9 0.9 0.9 0.9 Volume 17,000 12,000 39,000 13,000 16,000 39,000 VMT 15,300 10,800 35,100 11,700 14,400 35,100 Hours 6 18 24 4 20 24 VMT Distribution <10 MPH 0% 0% 0% 0% 0% 0% 10 - 20 mph 5% 0% 5% 0% 0% 0% 20 - 30 mph 60% 5% 35% 5% 5% 5% 30 - 40 mph 30% 90% 55% 90% 90% 90% >40 mph 5% 5% 5% 5% 5% 5% Total 100% 100% 100% 100% 100% 100%
State Route 74 – Lower Ortega Highway Widening 4-1 Austin-Foust Associates, Inc. Traffic Study 575015rpt(7-18-08).doc
Chapter 4.0 SPECIAL ISSUES
This chapter discusses a number of special issues with respect to traffic in the project area. These
include potential traffic diversions under the No-Build Alternative, the Orange County Master Plan of
Arterial Highways (MPAH), and growth-inducing impacts of the Build Alternatives.
NO-BUILD TRAFFIC DIVERSION
The traffic analysis in Chapter 3.0 showed that 2035 peak hour demand volumes will exceed the
capacity of the No-Build Alternative. Under such circumstances, queuing would occur at the merge
sections, and the following would occur:
1. Traffic diversion to alternate routes.
2. Peak hour traffic demand spread into the shoulders of the peak periods.
Quantifying these affects can be somewhat speculative since they represent future driver behavior
in relation to a future over-capacity situation. The approach taken here has been to use the South County
Sub-Area Model (SCSAM) to forecast the diversion and assume that non-diverted peak hour demand in
excess of the capacity is spread into the shoulders of the peak period. This provides some degree of
quantitative assessment, and shows the potential diversion increases on parallel facilities.
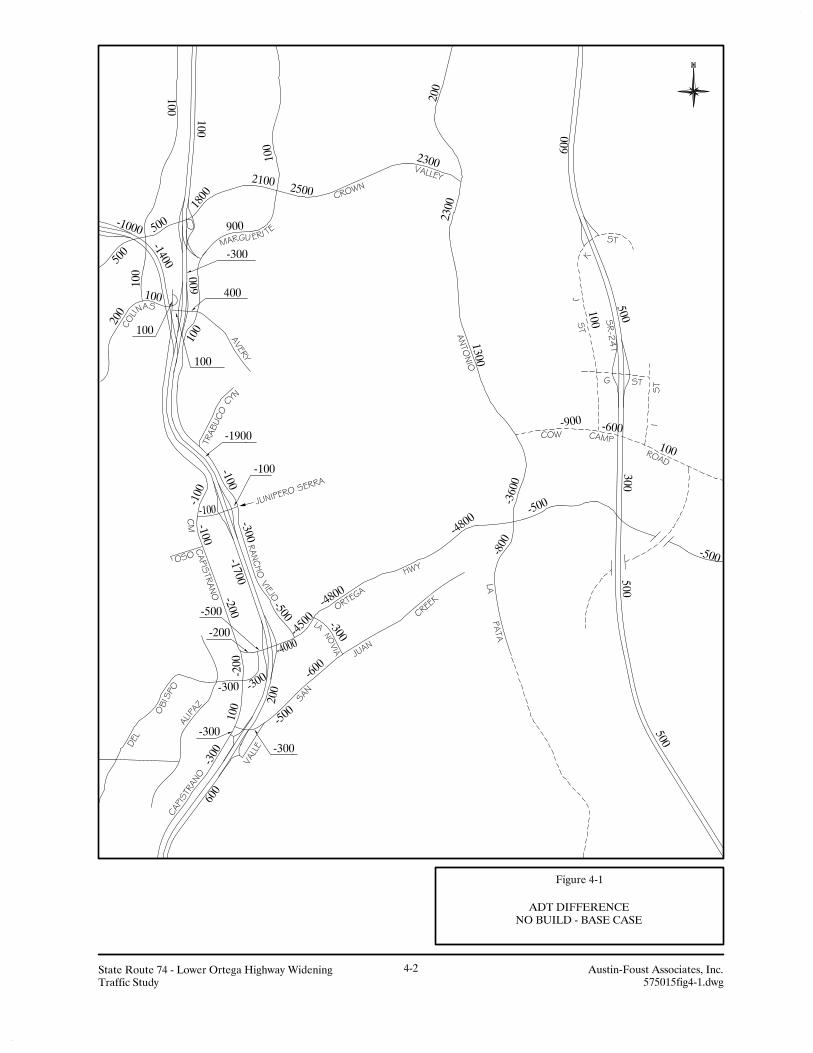
The diversion results for the roadway system in the project vicinity are illustrated in Figure 4-1.
The total 2035 diversion estimated by SCSAM is 5,500 ADT, and in the immediate vicinity of the
project, three major diversion components are involved:
1. Trips on La Pata Avenue that are diverted to other facilities such as I-5 and SR-241 or to Antonio
Parkway (around 1,000 ADT).
2. Trips on Ortega Highway east of Antonio Parkway that are diverted to other facilities such as
Cow Camp Road (around 500 ADT).

State Route 74 – Lower Ortega Highway Widening 4-3 Austin-Foust Associates, Inc. Traffic Study 575015rpt.doc
3. Trips on Antonio Parkway north of Ortega Highway that are diverted to the north on Antonio
Parkway or SR-241 (around 4,000 ADT).
In the section of Antonio Parkway north of Ortega Highway, component 1 adds trips (around 200
ADT) while components 2 and 3 divert trips (around 500 ADT), giving the net reduction of 4,300 ADT.
When all east-west roadways are considered, the 4,800 diverted daily trips are estimated to be
distributed as follows:
Location ADT 1. La Paz/Alicia Parkway/Oso Parkway 800 2. Crown Valley Parkway 2,500 3. Camino de los Mares 200 4. Avenida Vista Hermosa 300 5. Avenida Pico 500 6. SR-241 South 500
Total 4,800
As would be expected, the major diversion would be to Crown Valley Parkway. The diversion
would occur in response to substantial queue buildup during peak periods as traffic merged from two-
lanes to one.
SR-241 EXTENSION
The traffic forecast data presented here assumes two new regional roadway links in the project
vicinity; the southward extension of La Pata Avenue and the southward extension of SR-241 to I-5. The
former is funded and is in the process of finalizing the necessary environmental documentation for
construction. It is thereby considered a fully committed roadway that will be in place by 2035. The SR-
241 is currently in the design stages and seeking final permits. Since there is some potential for this not
being built in the currently planned alignment and configurations, an evaluation is given here as to the
effect on the widening project if this is delayed.
Figure 4-2 shows Base Case 2030 volumes from the SCSAM for this general area, and Figure 4-3
shows comparative volumes without the SR-241 extension. (Note that the volume comparison given here
is for 2030 since there is not currently a 2035 version of SCSAM or the OCTAM parent model (for the
analysis results presented in this report, volumes were extrapolated to 2035 for the section of Ortega


State Route 74 – Lower Ortega Highway Widening 4-6 Austin-Foust Associates, Inc. Traffic Study 575015rpt(7-18-08).doc
Highway being studied). Consistent with the SOCTIIP and Ranch Plan EIR’s, an arterial is assumed
along the SR-241 alignment as far south as Cow Camp Road.
The major differences occur on La Pata Avenue and Antonio Parkway. Traffic demand along
Ortega Highway is slightly higher, but not more than 10 percent. This is largely because La Pata Avenue
and Antonio Parkway provide alternate routes for most of the traffic in the project section. Reference to
the V/C results for the Build Alternatives show that an increase of 10 percent would not exceed the
capacity of the four-lane roadway under the Build Alternatives.
MASTER PLAN OF ARTERIAL HIGHWAYS
The Master Plan of Arterial Highways (MPAH) shows two roadways in the project vicinity that
were not assumed in the 2035 network; the extension of San Juan Creek Road to La Pata Avenue and the
extension of Camino Las Ramblas to La Pata Avenue. The latter has been shown in the past to carry only
low volumes, with very little affect on Ortega Highway. The San Juan Creek Road extension, however, is
immediately south of and parallel to the project section of Ortega Highway.
Figure 4-4 shows 2035 ADT volumes with the San Juan Creek Road extension. The affect on the
project section is relatively low, with less than a 10 percent reduction in traffic (for the reasons discussed
in the previous section, the data given here is for 2030). The 7,000 ADT on the extension involves some
new trips (e.g., between La Novia Avenue and La Pata Avenue) and more direct routing for some San
Juan Creek Road trips (e.g., to and from SR-241).
GROWTH INDUCING IMPACTS
Future demographic projections for the areas contributing traffic to the project were discussed in
Chapter 2.0. By 2030, future development is projected to be almost fully built out, with minimal growth
shown for 2030 to 2035. In this regard, land use entitlements in that area have resulted in open space
dedications that remove the land from potential future development. Accordingly, there is almost no
available land for future development beyond what is forecast for 2035. Furthermore, no additional
capacity is planned for SR-74 over to Riverside County. Under the circumstances, there is minimal
growth inducing impacts from the project.


State Route 74 – Lower Ortega Highway Widening A-1 Austin-Foust Associates, Inc. Traffic Study 575015rpt.doc
APPENDIX A
CALTRANS CAPACITY GUIDELINES

________ State Route 74 – Lower Ortega Highway Widening A-2 Austin-Foust Associates, Inc. Traffic Study 575015rpt.doc
Table A-1
CALTRANS TIA GUIDELINES
BASIC FREEWAY SEGMENTS @ 65 mi/hr
LOS
Maximum Density
(pc/mi/ln)
Minimum Speed (mph)
Maximum V/C
Maximum Service
Flow Rate (pc/hr/ln)
A 11 65.0 0.30 710 B 18 65.0 0.50 1170 C 26 64.6 0.71 1680 D 35 59.7 0.89 2090 E 45 52.3 1.00 2350 SIGNALIZED INTERSECTIONS and RAMP TERMINALS
LOS Control Delay per Vehicle (sec/veh)
A 10 B ≤10-20 C >20-35 D >35-55 E >55-80 F >80 MULTI-LANE HIGHWAYS @ 55 mi/hr
LOS
Maximum Density
(pc/mi/ln)
Minimum Speed (mph)
Maximum V/C
Maximum Service
Flow Rate (pc/hr/ln)
A 11 55.0 0.29 600 B 18 55.0 0.47 990 C 26 54.9 0.68 1430 D 35 52.9 0.88 1850 E 41 51.2 1.00 2100
Dotted line represents the transition between LOS ‘C’ and LOS ‘D’

________ SR-74 (Ortega Highway) Widening Project B-1 Austin-Foust Associates, Inc. Supplemental Traffic Study 575015rpt.doc
APPENDIX B
HCM CALCULATIONS AND SYNCHRO SUMMARIES

Existing (2008)AM Peak Hour SimTraffic Report
State Route 74 - Lower Ortega Highway Widening Austin-Foust Associates, Inc.Traffic Study 575015AppB.pdf
1: La Novia & Ortega Hwy Performance by movement Movement WBL WBR NBT NBR SBL SBT AllTotal Delay (hr) 4.1 0.3 3.8 1.9 1.8 3.4 15.3Delay / Veh (s) 36.4 8.2 18.0 14.3 38.1 8.1 15.9Stop Delay (hr) 3.7 0.2 2.8 1.4 1.5 1.1 10.8St Del/Veh (s) 32.8 6.6 13.2 11.0 31.8 2.6 11.2Avg Speed (mph) 11 20 15 18 9 25 17Vehicles Entered 411 114 766 473 170 1522 3456Vehicles Exited 410 114 760 474 165 1517 3440Hourly Exit Rate 410 114 760 474 165 1517 3440
6: Ortega Hwy & Calle Entradero Performance by movement Movement EBL EBT EBR WBL WBT WBR NBL NBR SBL SBR AllTotal Delay (hr) 0.0 0.5 0.0 0.0 0.3 0.0 0.3 0.0 0.2 0.1 1.4Delay / Veh (s) 21.8 2.1 0.0 10.5 0.7 0.0 57.3 3.9 119.8 9.8 2.0Stop Delay (hr) 0.0 0.0 0.0 0.0 0.0 0.0 0.3 0.0 0.2 0.1 0.6St Del/Veh (s) 20.7 0.1 0.0 9.3 0.0 0.0 57.5 4.2 118.3 10.2 0.9Avg Speed (mph) 9 34 26 15 40 27 3 11 1 9 34Vehicles Entered 3 893 3 7 1577 5 16 13 6 24 2547Vehicles Exited 3 894 3 7 1578 5 18 13 6 24 2551Hourly Exit Rate 3 894 3 7 1578 5 18 13 6 24 2551
7: Ortega Hwy & Hunt Club Performance by movement Movement EBL EBT EBR WBL WBT WBR NBL NBT NBR SBL SBT SBRTotal Delay (hr) 0.3 0.4 0.0 0.0 0.4 0.0 0.7 0.1 0.1 0.2 0.6 0.2Delay / Veh (s) 27.9 1.6 0.5 13.2 0.9 0.2 147.6 346.5 9.8 145.9 324.9 13.6Stop Delay (hr) 0.3 0.0 0.0 0.0 0.0 0.0 0.7 0.1 0.1 0.2 0.6 0.2St Del/Veh (s) 26.2 0.0 0.0 12.0 0.0 0.0 146.8 345.8 9.6 146.3 325.4 13.7Avg Speed (mph) 8 36 32 12 39 26 2 1 13 1 0 6Vehicles Entered 34 858 4 7 1508 24 18 1 20 5 8 50Vehicles Exited 37 860 4 7 1509 24 17 1 20 5 7 49Hourly Exit Rate 37 860 4 7 1509 24 17 1 20 5 7 49
7: Ortega Hwy & Hunt Club Performance by movement Movement AllTotal Delay (hr) 2.9Delay / Veh (s) 4.2Stop Delay (hr) 2.2St Del/Veh (s) 3.1Avg Speed (mph) 26Vehicles Entered 2537Vehicles Exited 2540Hourly Exit Rate 2540
8: Ortega Hwy & Via Cristal Performance by movement Movement EBT EBR WBL WBT NBL NBR AllTotal Delay (hr) 0.2 0.0 0.0 1.6 8.8 0.0 10.7Delay / Veh (s) 0.9 0.0 20.8 3.8 1592.4 12.3 15.8Stop Delay (hr) 0.0 0.0 0.0 0.0 8.9 0.0 8.9St Del/Veh (s) 0.0 0.0 16.9 0.0 1594.5 12.5 13.1Avg Speed (mph) 38 25 16 34 0 14 17Vehicles Entered 873 2 4 1532 25 13 2449Vehicles Exited 872 2 4 1530 16 13 2437Hourly Exit Rate 872 2 4 1530 16 13 2437
B-2

Existing (2008)AM Peak Hour SimTraffic Report
State Route 74 - Lower Ortega Highway Widening Austin-Foust Associates, Inc.Traffic Study 575015AppB.pdf
9: Ortega Hwy & Strawberry Performance by movement Movement EBL EBT WBT WBR SBL SBR AllTotal Delay (hr) 0.1 0.6 0.9 0.0 0.4 0.4 2.3Delay / Veh (s) 60.3 2.5 2.1 0.2 256.1 328.9 3.5Stop Delay (hr) 0.1 0.0 0.1 0.0 0.4 0.4 1.0St Del/Veh (s) 58.6 0.0 0.2 0.0 255.4 329.6 1.4Avg Speed (mph) 8 37 33 24 1 1 31Vehicles Entered 4 880 1532 6 5 4 2431Vehicles Exited 4 873 1532 6 6 4 2425Hourly Exit Rate 4 873 1532 6 6 4 2425
10: Ortega Hwy & Via Errecarte Performance by movement Movement EBT EBR WBL WBT NBL NBR AllTotal Delay (hr) 0.4 0.0 0.0 1.0 0.3 0.1 1.8Delay / Veh (s) 1.5 0.4 8.9 2.3 153.3 38.2 2.6Stop Delay (hr) 0.0 0.0 0.0 0.0 0.3 0.1 0.4St Del/Veh (s) 0.0 0.0 5.8 0.0 153.2 38.2 0.6Avg Speed (mph) 35 24 16 33 2 7 31Vehicles Entered 870 9 2 1526 8 5 2420Vehicles Exited 868 9 2 1523 8 5 2415Hourly Exit Rate 868 9 2 1523 8 5 2415
11: Ortega Hwy & Shade Tree Performance by movement Movement EBL EBT EBR WBL WBT WBR NBL NBR SBL SBR AllTotal Delay (hr) 0.2 0.4 0.0 0.0 2.6 0.0 0.2 0.0 0.2 0.4 4.0Delay / Veh (s) 93.5 1.7 0.3 10.1 6.1 2.9 246.9 9.2 449.8 202.0 5.9Stop Delay (hr) 0.2 0.0 0.0 0.0 1.4 0.0 0.2 0.0 0.3 0.4 2.5St Del/Veh (s) 92.1 0.0 0.0 9.0 3.4 1.7 245.1 9.9 457.2 203.1 3.7Avg Speed (mph) 3 34 24 22 32 26 2 14 1 1 28Vehicles Entered 6 856 7 5 1519 7 4 4 2 7 2417Vehicles Exited 6 852 7 5 1517 7 3 4 2 7 2410Hourly Exit Rate 6 852 7 5 1517 7 3 4 2 7 2410
Total Network Performance
Total Delay (hr) 50.6Delay / Veh (s) 50.2Stop Delay (hr) 26.5St Del/Veh (s) 26.2Avg Speed (mph) 31Vehicles Entered 3653Vehicles Exited 3606Hourly Exit Rate 3606
B-3

Existing (2008)PM Peak Hour SimTraffic Report
State Route 74 - Lower Ortega Highway Widening Austin-Foust Associates, Inc.Traffic Study 575015AppB.pdf
1: La Novia & Ortega Hwy Performance by movement Movement WBL WBR NBT NBR SBL SBT AllTotal Delay (hr) 2.4 0.6 4.9 0.4 1.1 1.3 10.7Delay / Veh (s) 32.7 15.2 13.2 8.9 44.5 6.1 14.0Stop Delay (hr) 2.2 0.6 2.8 0.3 1.0 0.4 7.3St Del/Veh (s) 29.8 13.9 7.6 6.1 40.2 2.0 9.5Avg Speed (mph) 12 16 16 21 8 28 17Vehicles Entered 268 146 1326 161 89 764 2754Vehicles Exited 267 145 1333 161 90 763 2759Hourly Exit Rate 267 145 1333 161 90 763 2759
6: Ortega Hwy & Calle Entradero Performance by movement Movement EBL EBT EBR WBL WBT WBR NBL NBR SBL SBR AllTotal Delay (hr) 0.0 1.1 0.0 0.0 0.2 0.0 0.2 0.0 0.1 0.0 1.7Delay / Veh (s) 5.0 2.8 0.6 18.6 0.7 0.0 89.7 13.0 69.1 3.6 2.6Stop Delay (hr) 0.0 0.0 0.0 0.0 0.0 0.0 0.2 0.0 0.1 0.0 0.4St Del/Veh (s) 2.2 0.0 0.0 16.8 0.0 0.0 89.9 13.0 68.4 4.2 0.6Avg Speed (mph) 20 31 25 11 40 29 2 8 2 13 31Vehicles Entered 12 1422 46 6 788 4 10 1 4 18 2311Vehicles Exited 11 1421 46 6 784 4 10 1 4 19 2306Hourly Exit Rate 11 1421 46 6 784 4 10 1 4 19 2306
7: Ortega Hwy & Hunt Club Performance by movement Movement EBL EBT EBR WBL WBT WBR NBL NBR SBL SBT SBR AllTotal Delay (hr) 0.1 1.2 0.0 0.1 0.1 0.0 0.0 0.1 0.2 0.0 0.0 1.8Delay / Veh (s) 6.1 3.4 0.2 22.8 0.6 0.0 33.1 33.8 97.8 23.4 4.4 3.0Stop Delay (hr) 0.1 0.0 0.0 0.0 0.0 0.0 0.0 0.1 0.2 0.0 0.0 0.5St Del/Veh (s) 3.5 0.0 0.0 22.0 0.0 0.0 32.4 34.1 97.1 22.1 4.5 0.7Avg Speed (mph) 18 30 31 8 40 27 7 6 1 4 10 29Vehicles Entered 54 1282 14 8 763 9 3 8 8 1 24 2174Vehicles Exited 55 1284 14 8 764 9 3 9 7 1 24 2178Hourly Exit Rate 55 1284 14 8 764 9 3 9 7 1 24 2178
8: Ortega Hwy & Via Cristal Performance by movement Movement EBT EBR WBL WBT NBL NBR AllTotal Delay (hr) 0.6 0.0 0.1 0.4 0.6 0.0 1.7Delay / Veh (s) 1.6 0.1 33.4 1.9 142.3 15.7 3.0Stop Delay (hr) 0.0 0.0 0.1 0.0 0.6 0.0 0.7St Del/Veh (s) 0.0 0.0 31.6 0.0 141.4 16.1 1.3Avg Speed (mph) 35 25 12 38 3 12 33Vehicles Entered 1270 16 6 761 16 10 2079Vehicles Exited 1269 16 6 763 16 11 2081Hourly Exit Rate 1269 16 6 763 16 11 2081
9: Ortega Hwy & Strawberry Performance by movement Movement EBL EBT WBT WBR SBL SBR AllTotal Delay (hr) 0.0 1.2 0.2 0.0 0.1 0.0 1.5Delay / Veh (s) 6.4 3.5 0.9 0.0 41.6 5.1 2.7Stop Delay (hr) 0.0 0.0 0.0 0.0 0.1 0.0 0.1St Del/Veh (s) 2.1 0.0 0.0 0.0 40.4 4.8 0.2Avg Speed (mph) 26 35 38 25 4 14 35Vehicles Entered 1 1270 758 6 8 9 2052Vehicles Exited 1 1272 758 6 9 9 2055Hourly Exit Rate 1 1272 758 6 9 9 2055
B-4

Existing (2008)PM Peak Hour SimTraffic Report
State Route 74 - Lower Ortega Highway Widening Austin-Foust Associates, Inc.Traffic Study 575015AppB.pdf
10: Ortega Hwy & Via Errecarte Performance by movement Movement EBT EBR WBL WBT NBL NBR AllTotal Delay (hr) 0.8 0.0 0.0 0.2 0.0 0.0 1.1Delay / Veh (s) 2.4 0.3 9.3 0.8 57.8 24.5 1.9Stop Delay (hr) 0.0 0.0 0.0 0.0 0.0 0.0 0.1St Del/Veh (s) 0.0 0.0 8.3 0.0 56.7 24.5 0.1Avg Speed (mph) 31 24 15 38 5 9 33Vehicles Entered 1253 26 6 766 2 3 2056Vehicles Exited 1252 26 6 767 2 3 2056Hourly Exit Rate 1252 26 6 767 2 3 2056
11: Ortega Hwy & Shade Tree Performance by movement Movement EBL EBT EBR WBL WBT WBR NBL NBR SBL SBR AllTotal Delay (hr) 0.0 0.8 0.0 0.0 0.3 0.0 0.1 0.1 0.0 0.0 1.3Delay / Veh (s) 3.5 2.3 1.0 24.3 1.4 0.3 53.7 19.0 44.2 7.7 2.3Stop Delay (hr) 0.0 0.0 0.0 0.0 0.2 0.0 0.1 0.1 0.0 0.0 0.4St Del/Veh (s) 1.8 0.0 0.0 23.4 0.7 0.2 52.8 20.0 44.3 8.5 0.7Avg Speed (mph) 20 32 23 11 38 30 5 11 5 13 33Vehicles Entered 7 1236 9 4 753 7 5 12 1 11 2045Vehicles Exited 7 1232 9 4 755 7 6 12 1 11 2044Hourly Exit Rate 7 1232 9 4 755 7 6 12 1 11 2044
Total Network Performance
Total Delay (hr) 34.2Delay / Veh (s) 42.9Stop Delay (hr) 9.5St Del/Veh (s) 11.9Avg Speed (mph) 32Vehicles Entered 2875Vehicles Exited 2876Hourly Exit Rate 2876
B-5

2035 No-BuildAM Peak Hour SimTraffic Report
State Route 74 - Lower Ortega Highway Widening Austin-Foust Associates, Inc.Traffic Study 575015AppB.pdf
1: La Novia & Ortega Hwy Performance by movement Movement WBL WBR NBT NBR SBL SBT AllTotal Delay (hr) 4.2 0.5 7.0 2.1 1.6 4.2 19.4Delay / Veh (s) 34.8 13.5 21.3 16.1 44.4 9.3 17.6Stop Delay (hr) 3.7 0.4 4.8 1.6 1.3 1.3 13.2St Del/Veh (s) 31.2 11.7 14.8 12.2 38.3 2.9 12.0Avg Speed (mph) 11 18 14 18 8 24 17Vehicles Entered 428 121 1183 462 125 1655 3974Vehicles Exited 430 121 1175 461 126 1644 3957Hourly Exit Rate 430 121 1175 461 126 1644 3957
6: Ortega Hwy & Calle Entradero Performance by movement Movement EBL EBT EBR WBL WBT WBR NBL NBR SBL SBR AllTotal Delay (hr) 0.0 1.0 0.0 0.0 0.4 0.0 0.3 0.0 0.1 0.0 1.9Delay / Veh (s) 12.3 2.9 0.1 5.5 0.9 0.0 59.1 2.3 150.6 8.9 2.3Stop Delay (hr) 0.0 0.0 0.0 0.0 0.0 0.0 0.3 0.0 0.1 0.0 0.5St Del/Veh (s) 8.8 0.1 0.0 2.9 0.0 0.0 59.4 2.6 149.0 9.4 0.6Avg Speed (mph) 13 31 26 20 39 30 3 13 1 9 33Vehicles Entered 7 1300 4 1 1682 3 18 12 2 18 3047Vehicles Exited 7 1298 4 1 1680 3 19 12 2 18 3044Hourly Exit Rate 7 1298 4 1 1680 3 19 12 2 18 3044
7: Ortega Hwy & Hunt Club Performance by movement Movement EBL EBT EBR WBL WBT WBR NBL NBT NBR SBL SBT SBRTotal Delay (hr) 0.2 0.9 0.0 0.0 0.4 0.0 0.7 0.0 0.2 0.3 1.4 0.2Delay / Veh (s) 21.4 2.5 0.3 22.7 1.0 0.3 297.9 36.1 1181.7 992.8 11.9Stop Delay (hr) 0.2 0.0 0.0 0.0 0.0 0.0 0.7 0.0 0.2 0.3 1.4 0.2St Del/Veh (s) 18.6 0.0 0.0 21.6 0.0 0.0 297.7 36.2 1180.7 995.8 12.0Avg Speed (mph) 10 33 30 8 38 24 1 20 7 0 0 6Vehicles Entered 35 1251 3 3 1615 12 9 1 16 2 6 47Vehicles Exited 35 1253 3 3 1616 11 9 0 15 1 4 47Hourly Exit Rate 35 1253 3 3 1616 11 9 0 15 1 4 47
7: Ortega Hwy & Hunt Club Performance by movement Movement AllTotal Delay (hr) 4.3Delay / Veh (s) 5.2Stop Delay (hr) 3.0St Del/Veh (s) 3.6Avg Speed (mph) 24Vehicles Entered 3000Vehicles Exited 2997Hourly Exit Rate 2997
8: Ortega Hwy & Via Cristal Performance by movement Movement EBT EBR WBL WBT NBL NBR AllTotal Delay (hr) 0.5 0.0 0.0 1.7 10.0 0.0 12.3Delay / Veh (s) 1.5 0.1 16.8 3.9 3001.5 20.7 15.2Stop Delay (hr) 0.0 0.0 0.0 0.0 10.0 0.0 10.1St Del/Veh (s) 0.1 0.0 13.0 0.0 3000.6 20.5 12.4Avg Speed (mph) 36 25 18 34 0 12 18Vehicles Entered 1261 7 6 1623 18 5 2920Vehicles Exited 1263 7 5 1625 6 5 2911Hourly Exit Rate 1263 7 5 1625 6 5 2911
B-6

2035 No-BuildAM Peak Hour SimTraffic Report
State Route 74 - Lower Ortega Highway Widening Austin-Foust Associates, Inc.Traffic Study 575015AppB.pdf
9: Ortega Hwy & Strawberry Performance by movement Movement EBL EBT WBT WBR SBL SBR AllTotal Delay (hr) 0.2 1.2 1.0 0.0 0.3 0.3 3.1Delay / Veh (s) 94.1 3.6 2.3 0.0 967.6 246.2 3.8Stop Delay (hr) 0.2 0.0 0.2 0.0 0.3 0.3 1.0St Del/Veh (s) 90.6 0.0 0.5 0.0 964.4 246.5 1.3Avg Speed (mph) 5 35 33 24 0 1 31Vehicles Entered 7 1260 1624 5 2 6 2904Vehicles Exited 7 1254 1624 5 1 5 2896Hourly Exit Rate 7 1254 1624 5 1 5 2896
10: Ortega Hwy & Via Errecarte Performance by movement Movement EBT EBR WBL WBT NBL NBR AllTotal Delay (hr) 0.8 0.0 0.0 1.1 0.9 1.1 4.0Delay / Veh (s) 2.4 0.2 25.2 2.5 850.4 775.0 5.0Stop Delay (hr) 0.0 0.0 0.0 0.2 1.0 1.1 2.3St Del/Veh (s) 0.0 0.0 23.3 0.4 857.4 776.0 2.8Avg Speed (mph) 31 24 8 34 1 1 25Vehicles Entered 1235 20 6 1619 5 6 2891Vehicles Exited 1234 20 6 1619 3 5 2887Hourly Exit Rate 1234 20 6 1619 3 5 2887
11: Ortega Hwy & Shade Tree Performance by movement Movement EBL EBT EBR WBL WBT WBR NBL NBR SBL SBR AllTotal Delay (hr) 2.5 0.7 0.0 0.0 1.2 0.0 4.3 0.0 1.7 1.2 11.8Delay / Veh (s) 2259.1 2.2 0.3 11.3 2.7 0.7 5200.1 18.6 2982.8 1123.5 14.7Stop Delay (hr) 2.5 0.0 0.0 0.0 0.0 0.0 4.3 0.0 1.7 1.3 9.8St Del/Veh (s) 2257.3 0.1 0.0 8.0 0.0 0.0 5194.6 19.5 2980.6 1125.4 12.3Avg Speed (mph) 0 32 24 15 33 26 0 10 0 0 15Vehicles Entered 6 1221 6 4 1619 4 7 4 5 5 2881Vehicles Exited 2 1223 6 4 1620 4 0 4 0 4 2867Hourly Exit Rate 2 1223 6 4 1620 4 0 4 0 4 2867
Total Network Performance
Total Delay (hr) 426.6Delay / Veh (s) 375.0Stop Delay (hr) 385.4St Del/Veh (s) 338.8Avg Speed (mph) 28Vehicles Entered 4131Vehicles Exited 4059Hourly Exit Rate 4059
B-7

2035 No-BuildPM Peak Hour SimTraffic Report
State Route 74 - Lower Ortega Highway Widening Austin-Foust Associates, Inc.Traffic Study 575015AppB.pdf
1: La Novia & Ortega Hwy Performance by movement Movement WBL WBR NBT NBR SBL SBT AllTotal Delay (hr) 2.8 1.3 49.6 2.9 2.7 3.1 62.5Delay / Veh (s) 33.9 28.0 95.9 78.0 100.7 8.8 58.6Stop Delay (hr) 2.5 1.2 43.3 2.7 2.6 1.1 53.4St Del/Veh (s) 30.6 25.4 83.7 70.5 94.5 3.2 50.0Avg Speed (mph) 12 12 8 12 4 24 11Vehicles Entered 297 170 1871 137 99 1282 3856Vehicles Exited 295 171 1850 136 98 1274 3824Hourly Exit Rate 295 171 1850 136 98 1274 3824
6: Ortega Hwy & Calle Entradero Performance by movement Movement EBL EBT EBR WBL WBT WBR NBL NBR SBL SBR AllTotal Delay (hr) 0.1 14.0 0.1 0.2 0.3 0.0 4.1 0.0 2.9 0.1 21.9Delay / Veh (s) 30.5 29.5 10.4 102.3 0.9 0.0 1856.6 24.7 2090.7 11.2 25.2Stop Delay (hr) 0.0 7.4 0.0 0.2 0.0 0.0 4.1 0.0 2.9 0.1 14.9St Del/Veh (s) 18.5 15.6 3.8 102.4 0.0 0.0 1858.7 25.1 2091.6 11.7 17.1Avg Speed (mph) 7 8 14 3 40 28 0 5 0 8 10Vehicles Entered 7 1719 34 8 1318 6 13 7 7 27 3146Vehicles Exited 7 1704 34 8 1317 6 3 7 4 27 3117Hourly Exit Rate 7 1704 34 8 1317 6 3 7 4 27 3117
7: Ortega Hwy & Hunt Club Performance by movement Movement EBL EBT EBR WBL WBT WBR NBL NBR SBL SBR AllTotal Delay (hr) 0.2 3.9 0.0 1.4 0.3 0.0 1.6 0.6 0.6 0.1 8.6Delay / Veh (s) 18.8 8.8 0.2 1005.8 0.9 0.0 5583.3 505.1 10.0 10.3Stop Delay (hr) 0.1 0.6 0.0 1.4 0.0 0.0 1.6 0.6 0.6 0.1 4.9St Del/Veh (s) 12.3 1.4 0.0 1006.5 0.0 0.0 5645.3 505.0 10.1 5.9Avg Speed (mph) 11 22 28 0 39 28 0 1 0 7 18Vehicles Entered 30 1608 8 6 1287 5 2 4 1 42 2993Vehicles Exited 30 1607 8 5 1285 5 0 4 0 43 2987Hourly Exit Rate 30 1607 8 5 1285 5 0 4 0 43 2987
8: Ortega Hwy & Via Cristal Performance by movement Movement EBT EBR WBL WBT NBL NBR AllTotal Delay (hr) 0.8 0.0 1.0 1.3 4.7 0.3 8.2Delay / Veh (s) 1.9 0.5 256.2 3.5 2137.4 101.8 10.0Stop Delay (hr) 0.0 0.0 1.0 0.0 4.7 0.3 6.0St Del/Veh (s) 0.0 0.2 253.3 0.0 2133.3 102.9 7.4Avg Speed (mph) 34 25 2 35 0 4 21Vehicles Entered 1587 16 14 1292 14 11 2934Vehicles Exited 1585 16 14 1298 2 11 2926Hourly Exit Rate 1585 16 14 1298 2 11 2926
9: Ortega Hwy & Strawberry Performance by movement Movement EBL EBT WBT WBR SBL SBR AllTotal Delay (hr) 0.0 2.0 0.5 0.0 1.2 2.3 6.1Delay / Veh (s) 43.9 4.6 1.4 0.0 1448.2 919.2 7.5Stop Delay (hr) 0.0 0.1 0.0 0.0 1.2 2.3 3.6St Del/Veh (s) 38.6 0.1 0.0 0.0 1448.7 921.2 4.5Avg Speed (mph) 10 33 36 26 0 0 25Vehicles Entered 3 1592 1294 5 4 9 2907Vehicles Exited 3 1587 1297 5 3 9 2904Hourly Exit Rate 3 1587 1297 5 3 9 2904
B-8

2035 No-BuildPM Peak Hour SimTraffic Report
State Route 74 - Lower Ortega Highway Widening Austin-Foust Associates, Inc.Traffic Study 575015AppB.pdf
10: Ortega Hwy & Via Errecarte Performance by movement Movement EBT EBR WBL WBT NBL NBR AllTotal Delay (hr) 1.4 0.0 0.0 0.5 0.1 0.0 2.1Delay / Veh (s) 3.1 0.5 40.6 1.5 496.7 16.4 2.6Stop Delay (hr) 0.0 0.0 0.0 0.0 0.1 0.0 0.2St Del/Veh (s) 0.1 0.0 38.9 0.0 495.3 16.2 0.3Avg Speed (mph) 29 23 6 36 1 12 31Vehicles Entered 1573 21 2 1296 1 5 2898Vehicles Exited 1570 22 2 1299 1 5 2899Hourly Exit Rate 1570 22 2 1299 1 5 2899
11: Ortega Hwy & Shade Tree Performance by movement Movement EBL EBT EBR WBL WBT WBR NBL NBR SBL SBR AllTotal Delay (hr) 0.0 1.3 0.0 0.1 1.2 0.0 0.0 0.1 0.2 0.1 3.0Delay / Veh (s) 9.7 3.0 0.6 43.2 3.4 3.5 84.7 56.8 637.0 86.3 3.8Stop Delay (hr) 0.0 0.0 0.0 0.1 0.6 0.0 0.0 0.1 0.2 0.1 1.1St Del/Veh (s) 9.1 0.0 0.0 42.5 1.8 3.3 82.5 58.9 634.5 86.7 1.4Avg Speed (mph) 14 29 23 7 35 28 7 5 1 4 30Vehicles Entered 1 1563 7 7 1291 7 2 8 2 4 2892Vehicles Exited 1 1560 7 7 1294 7 1 8 1 3 2889Hourly Exit Rate 1 1560 7 7 1294 7 1 8 1 3 2889
Total Network Performance
Total Delay (hr) 269.5Delay / Veh (s) 253.8Stop Delay (hr) 162.5St Del/Veh (s) 153.1Avg Speed (mph) 17Vehicles Entered 4003Vehicles Exited 3641Hourly Exit Rate 3641
B-9

2035 BuildAM Peak Hour SimTraffic Report
State Route 74 - Lower Ortega Highway Widening Austin-Foust Associates, Inc.Traffic Study 575015AppB.pdf
1: La Novia & Ortega Hwy Performance by movement Movement WBL WBR NBT NBR SBL SBT AllTotal Delay (hr) 4.0 0.3 6.1 2.1 2.0 9.2 23.8Delay / Veh (s) 36.1 10.4 18.9 16.4 49.0 15.7 19.5Stop Delay (hr) 3.6 0.3 4.3 1.6 1.6 2.9 14.3St Del/Veh (s) 32.5 9.1 13.1 12.9 39.7 4.9 11.7Avg Speed (mph) 11 19 16 18 8 18 16Vehicles Entered 401 106 1169 458 149 2129 4412Vehicles Exited 401 105 1171 454 149 2118 4398Hourly Exit Rate 401 105 1171 454 149 2118 4398
6: Ortega Hwy & Calle Entradero Performance by movement Movement EBL EBT EBR WBL WBT WBR NBL NBR SBL SBR AllTotal Delay (hr) 0.0 0.5 0.0 0.0 1.0 0.0 0.4 0.0 0.2 0.1 2.2Delay / Veh (s) 20.2 1.4 0.3 12.7 1.7 0.5 67.0 5.6 145.4 14.6 2.2Stop Delay (hr) 0.0 0.0 0.0 0.0 0.0 0.0 0.4 0.0 0.2 0.1 0.7St Del/Veh (s) 18.6 0.1 0.0 11.6 0.0 0.0 67.3 5.9 144.4 15.1 0.7Avg Speed (mph) 10 37 26 14 36 26 3 10 1 7 33Vehicles Entered 2 1296 6 4 2201 5 21 10 4 14 3563Vehicles Exited 2 1298 6 4 2200 5 21 9 4 14 3563Hourly Exit Rate 2 1298 6 4 2200 5 21 9 4 14 3563
7: Ortega Hwy & Hunt Club Performance by movement Movement EBL EBT EBR WBL WBT WBR NBL NBR SBL SBT SBR AllTotal Delay (hr) 0.3 0.5 0.0 0.0 0.9 0.0 0.5 0.0 0.4 0.6 0.3 3.6Delay / Veh (s) 26.8 1.3 0.0 2.2 1.5 0.4 214.9 8.7 348.5 354.3 19.0 3.6Stop Delay (hr) 0.3 0.0 0.0 0.0 0.0 0.0 0.5 0.0 0.4 0.6 0.3 2.2St Del/Veh (s) 25.0 0.0 0.0 1.1 0.0 0.0 214.3 8.6 348.4 353.5 19.2 2.2Avg Speed (mph) 8 37 31 22 35 23 2 13 0 0 5 27Vehicles Entered 45 1244 4 4 2132 19 10 11 4 8 64 3545Vehicles Exited 45 1240 4 4 2131 19 9 11 4 5 64 3536Hourly Exit Rate 45 1240 4 4 2131 19 9 11 4 5 64 3536
8: Ortega Hwy & Via Cristal Performance by movement Movement EBT EBR WBL WBT NBL NBR AllTotal Delay (hr) 0.4 0.0 0.0 1.4 0.9 0.0 2.7Delay / Veh (s) 1.1 0.1 16.1 2.3 157.3 8.0 2.8Stop Delay (hr) 0.0 0.0 0.0 0.0 0.9 0.0 0.9St Del/Veh (s) 0.0 0.0 13.6 0.0 156.7 8.4 1.0Avg Speed (mph) 37 26 18 37 3 15 35Vehicles Entered 1244 9 6 2142 21 9 3431Vehicles Exited 1245 9 6 2143 19 9 3431Hourly Exit Rate 1245 9 6 2143 19 9 3431
9: Ortega Hwy & Strawberry Performance by movement Movement EBL EBT WBT WBR SBL SBR AllTotal Delay (hr) 0.1 0.8 0.6 0.0 0.2 0.1 1.8Delay / Veh (s) 41.3 2.3 0.9 0.1 156.2 63.1 1.9Stop Delay (hr) 0.1 0.0 0.0 0.0 0.2 0.1 0.4St Del/Veh (s) 39.3 0.0 0.0 0.0 155.0 63.1 0.4Avg Speed (mph) 10 37 38 24 1 3 36Vehicles Entered 8 1241 2144 4 5 6 3408Vehicles Exited 8 1241 2142 4 5 6 3406Hourly Exit Rate 8 1241 2142 4 5 6 3406
B-10

2035 BuildAM Peak Hour SimTraffic Report
State Route 74 - Lower Ortega Highway Widening Austin-Foust Associates, Inc.Traffic Study 575015AppB.pdf
10: Ortega Hwy & Via Errecarte Performance by movement Movement EBT EBR WBL WBT NBL NBR AllTotal Delay (hr) 0.4 0.0 0.0 0.5 0.1 0.0 1.0Delay / Veh (s) 1.2 0.2 3.7 0.8 88.3 15.4 1.1Stop Delay (hr) 0.0 0.0 0.0 0.0 0.1 0.0 0.1St Del/Veh (s) 0.0 0.0 2.2 0.0 87.0 15.2 0.1Avg Speed (mph) 36 25 21 38 4 12 37Vehicles Entered 1230 16 3 2135 4 4 3392Vehicles Exited 1228 16 3 2135 4 4 3390Hourly Exit Rate 1228 16 3 2135 4 4 3390
11: Ortega Hwy & Shade Tree Performance by movement Movement EBL EBT EBR WBL WBT WBR NBL NBR SBL SBR AllTotal Delay (hr) 0.1 0.4 0.0 0.0 0.6 0.0 0.2 0.0 0.4 0.7 2.3Delay / Veh (s) 288.9 1.1 0.1 10.0 1.0 0.5 286.4 4.9 437.1 352.6 2.5Stop Delay (hr) 0.1 0.0 0.0 0.0 0.3 0.0 0.2 0.0 0.4 0.7 1.7St Del/Veh (s) 288.1 0.0 0.0 9.5 0.5 0.4 290.0 5.7 436.5 354.1 1.8Avg Speed (mph) 2 37 25 20 39 28 2 16 0 1 32Vehicles Entered 2 1225 5 3 2129 5 4 5 2 7 3387Vehicles Exited 1 1221 5 3 2128 5 3 5 3 7 3381Hourly Exit Rate 1 1221 5 3 2128 5 3 5 3 7 3381
Total Network Performance
Total Delay (hr) 62.2Delay / Veh (s) 49.0Stop Delay (hr) 20.5St Del/Veh (s) 16.1Avg Speed (mph) 32Vehicles Entered 4597Vehicles Exited 4552Hourly Exit Rate 4552
B-11

2035 BuildPM Peak Hour SimTraffic Report
State Route 74 - Lower Ortega Highway Widening Austin-Foust Associates, Inc.Traffic Study 575015AppB.pdf
1: La Novia & Ortega Hwy Performance by movement Movement WBL WBR NBT NBR SBL SBT AllTotal Delay (hr) 2.5 1.1 77.1 4.1 3.3 2.9 90.9Delay / Veh (s) 32.6 26.6 143.5 135.0 116.5 8.2 85.5Stop Delay (hr) 2.2 1.0 70.0 3.8 3.1 0.9 81.1St Del/Veh (s) 29.7 24.4 130.2 126.9 109.9 2.7 76.2Avg Speed (mph) 12 12 8 10 4 25 11Vehicles Entered 272 143 1944 111 107 1274 3851Vehicles Exited 272 143 1926 108 98 1263 3810Hourly Exit Rate 272 143 1926 108 98 1263 3810
6: Ortega Hwy & Calle Entradero Performance by movement Movement EBL EBT EBR WBL WBT WBR NBL NBR SBL SBR AllTotal Delay (hr) 0.0 1.1 0.0 0.0 0.4 0.0 0.3 0.0 0.1 0.0 1.9Delay / Veh (s) 9.0 1.9 0.5 4.1 1.1 0.2 77.9 14.2 56.7 8.5 2.0Stop Delay (hr) 0.0 0.0 0.0 0.0 0.0 0.0 0.3 0.0 0.1 0.0 0.5St Del/Veh (s) 6.9 0.0 0.0 3.3 0.0 0.0 78.6 14.7 55.8 9.0 0.5Avg Speed (mph) 16 34 25 22 38 27 3 8 2 10 34Vehicles Entered 9 2015 29 2 1318 4 13 9 3 20 3422Vehicles Exited 9 2012 29 2 1321 4 13 9 4 20 3423Hourly Exit Rate 9 2012 29 2 1321 4 13 9 4 20 3423
7: Ortega Hwy & Hunt Club Performance by movement Movement EBL EBT EBR WBL WBT WBR NBL NBR SBL SBT SBR AllTotal Delay (hr) 0.1 0.8 0.0 0.0 0.3 0.0 0.1 0.0 0.1 0.0 0.1 1.5Delay / Veh (s) 8.2 1.6 0.0 9.0 0.9 0.1 74.7 7.3 81.0 45.6 7.0 1.6Stop Delay (hr) 0.1 0.0 0.0 0.0 0.0 0.0 0.1 0.0 0.1 0.0 0.1 0.4St Del/Veh (s) 6.5 0.0 0.0 7.8 0.0 0.1 74.0 7.1 80.1 43.8 7.1 0.4Avg Speed (mph) 17 36 31 12 38 25 4 14 1 2 9 34Vehicles Entered 38 1914 14 2 1281 7 3 6 5 1 43 3314Vehicles Exited 38 1918 14 3 1279 7 3 6 5 1 41 3315Hourly Exit Rate 38 1918 14 3 1279 7 3 6 5 1 41 3315
8: Ortega Hwy & Via Cristal Performance by movement Movement EBT EBR WBL WBT NBL NBR AllTotal Delay (hr) 0.8 0.0 0.1 0.5 0.3 0.1 1.7Delay / Veh (s) 1.4 0.4 27.1 1.5 66.6 15.4 1.9Stop Delay (hr) 0.0 0.0 0.0 0.0 0.3 0.1 0.5St Del/Veh (s) 0.0 0.0 25.5 0.0 65.2 15.7 0.5Avg Speed (mph) 36 24 13 39 6 12 36Vehicles Entered 1890 23 7 1272 18 18 3228Vehicles Exited 1892 23 7 1271 18 18 3229Hourly Exit Rate 1892 23 7 1271 18 18 3229
9: Ortega Hwy & Strawberry Performance by movement Movement EBL EBT WBT WBR SBL SBR AllTotal Delay (hr) 0.0 1.6 0.2 0.0 0.1 0.0 1.9Delay / Veh (s) 7.1 3.0 0.5 0.0 83.2 8.9 2.1Stop Delay (hr) 0.0 0.0 0.0 0.0 0.1 0.0 0.1St Del/Veh (s) 3.4 0.0 0.0 0.0 81.5 8.8 0.2Avg Speed (mph) 25 36 40 26 3 12 36Vehicles Entered 3 1906 1274 6 5 8 3202Vehicles Exited 3 1899 1271 6 5 8 3192Hourly Exit Rate 3 1899 1271 6 5 8 3192
B-12

2035 BuildPM Peak Hour SimTraffic Report
State Route 74 - Lower Ortega Highway Widening Austin-Foust Associates, Inc.Traffic Study 575015AppB.pdf
10: Ortega Hwy & Via Errecarte Performance by movement Movement EBT EBR WBL WBT NBL NBR AllTotal Delay (hr) 0.8 0.0 0.0 0.1 0.1 0.0 1.1Delay / Veh (s) 1.6 0.8 15.6 0.4 42.3 13.3 1.2Stop Delay (hr) 0.0 0.0 0.0 0.0 0.1 0.0 0.1St Del/Veh (s) 0.0 0.0 14.8 0.0 40.9 13.2 0.1Avg Speed (mph) 35 23 12 41 7 13 36Vehicles Entered 1880 25 4 1281 5 6 3201Vehicles Exited 1878 25 4 1282 5 6 3200Hourly Exit Rate 1878 25 4 1282 5 6 3200
11: Ortega Hwy & Shade Tree Performance by movement Movement EBL EBT EBR WBL WBT WBR NBL NBR SBL SBR AllTotal Delay (hr) 0.0 0.8 0.0 0.0 0.2 0.0 0.0 0.0 0.0 0.0 1.1Delay / Veh (s) 11.7 1.5 0.3 18.7 0.5 0.2 31.7 14.3 42.8 2.6 1.2Stop Delay (hr) 0.0 0.0 0.0 0.0 0.1 0.0 0.0 0.0 0.0 0.0 0.3St Del/Veh (s) 10.2 0.0 0.0 18.3 0.3 0.1 30.0 15.2 42.6 3.3 0.3Avg Speed (mph) 14 35 24 13 40 31 8 11 4 17 36Vehicles Entered 6 1864 9 9 1275 6 2 11 3 3 3188Vehicles Exited 5 1855 9 9 1280 6 2 11 4 3 3184Hourly Exit Rate 5 1855 9 9 1280 6 2 11 4 3 3184
Total Network Performance
Total Delay (hr) 122.4Delay / Veh (s) 111.1Stop Delay (hr) 83.0St Del/Veh (s) 75.3Avg Speed (mph) 31Vehicles Entered 4005Vehicles Exited 3928Hourly Exit Rate 3928
B-13