state-owned enterprises in the italian corporate network ... · miscellanea di studi in onore di...
TRANSCRIPT

Alberto Rinaldi <[email protected]> is assistant professor in the Dipartimento di Economia Politica at the Università di Modena e Reggio Emilia, and RECent. Michelangelo Vasta <[email protected]> is associate professor in the Dipartimento di Economia Politica at the Università di Siena. © Business History Conference, 2009. All rights reserved.
URL: http://www.thebhc.org/publications/BEHonline/2009/rinaldiandvasta.pdf.
State-Owned Enterprises in the Italian Corporate Network, 1972-1983
Alberto Rinaldi and Michelangelo Vasta
State-owned enterprises pervaded Italian capitalism from the 1930s to 1999. Historians have stressed the relevance of state-owned enterprises to capital-intensive industries, but argued they also might curb private-sector growth. While researchers have mapped the extension of the major Italian state-owned groups, private companies in the Italian corporate network remain largely unexplored. We use the interlocking directorates technique to assess Antonio Chiesi’s thesis that in the mid-1970s the Italian corporate network was marked by two distinct centers, one state-owned and one private. We base our analysis on Imita.db for 1972 and 1983, using both network analysis and a prosopographic approach. Contrary to Chiesi’s results using a different sample, in 1972 the Italian corporate network was characterized by one large center, comprising both private and state-owned companies. By 1983, however, system cohesion had decreased sharply; state-owned enterprises had disappeared from its center, and the Italian corporate network, as Chiesi argued, had two distinct centers.
The Italian corporate system is characterized by the presence of large holdings, a wide diffusion of family properties and state-owned enter-prises, and a small firm size compared to that of other advanced countries. These aspects are among the most debated by historians: from Pietro Grifone’s formulation on the centrality of finance capital and Franco

Alberto Rinaldi and Michelangelo Vasta // State-Owned Enterprises in the Italian Corporate Network, 1972-1983
2
Bonelli’s arguments on capitalism and the state-controlled enterprise, to the neo-Chandlerian interpretations of the same phenomena, these subjects have been explored through the various seasons of Italian economic historiography.1 Many elements, including the limited size of the domestic market, a general shortage of capital, and a lack of natural resources have contributed to the rise of one of the largest state-owned enterprise systems in the Western world. If the founding of a few German-type universal banks in the last decade of the nineteenth century guaranteed a certain equilibrium to the system and provided it with the resources needed to catch up to the technological trajectories of the Second Industrial Revolution, the 1930s Great Depression marked a breaking point. The original and efficacious solution to facing the crisis was the 1933 founding of the Istituto per la Ricostruzione Industriale (IRI), which took over the universal banks and their industrial securities. The end of the fascist regime in 1945 did not change much in this respect. The state-owned enterprise area expanded after World War II: IRI still remained the main pillar of the system, but a second pillar, the state energy super-holding, Ente Nazionale Idrocarburi (ENI), was founded in 1953. The ―Golden Age‖ was a period when state intervention in its different forms (planning, anti-cyclical policies, and support to private enterprises) played an essential role in securing a Gerschenkron-type convergence toward the technological frontier of mass production.2 The oil crises of the 1970s were an important turning point for the Western economies. Italian-owned enterprise started its long parabola, from the 1980s to the early 1990s, when pervasive privatization led to its actual dismantling.
1 Pietro Grifone, Il capitale finanziario in Italia: La politica economica del fascismo (Turin, 1945); Franco Bonelli, ―Il capitalismo italiano: linee generali di interpretazione,‖ Storia d’Italia Einaudi: Annali I. Dal feudalesimo al capitalismo (Turin, 1979), 1195-255; Franco Amatori, ―Il tormentato sviluppo della grande impresa industriale fra Stato e famiglie: il caso italiano in prospettiva storica,‖ in Proprietà e governo delle imprese italiane, ed. Giuseppe Airoldi, Franco Amatori, and Giorgio Invernizzi (Milan, 1995), 241-52; and Alfred D. Chandler, Franco Amatori, and Takashi Hikino, ―Historical and Comparative Contours of Big Business,‖ in Big Business and the Wealth of Nations, ed. Alfred D. Chandler, Franco Amatori, and Takashi Hikino (Cambridge, Mass., 1997), 3-23. For an updated survey on Italian historiography and some recent studies on Italian business history, see Renato Giannetti and Michelangelo Vasta, eds., Evolution of Italian Enterprises in the Twentieth Century (New York, 2006). 2 Alexander Gerschenkron, Economic Backwardness in Historical Perspective (Cambridge, Mass., 1962); Pierangelo Toninelli, ―Ascesa e declino dell’impresa pubblica in Italia (1860-2000): una nota sul ruolo dello stato nella crescita,‖ in Miscellanea di studi in onore di Giorgio Mori, 2 vols., ed. Anna Maria Falchero et al. (Varese, 2003), 2: 629-61.

Alberto Rinaldi and Michelangelo Vasta // State-Owned Enterprises in the Italian Corporate Network, 1972-1983
3
Despite the relevance of state-owned enterprise in Italian economic history and the rich historical debate it generated, only a limited number of empirical studies are available and only recently have researchers mapped the extension of the major Italian state-owned groups.3 However, their links with private companies and, more generally, their role in the Italian corporate network remain largely unexplored. Our aim in this essay is to explore this subject, as well as the control positions and group structures that followed from it after the end of the ―Golden Age‖ (1972-1983), using the interlocking directorates (ID) technique.
Italian Corporate System Company control is the exercise of influence over its strategic directions and allocation choices. This subject has assumed considerable importance in all industrial economies. The analysis of the relationships between those who have the wealth and those who manage it has attracted the attention of numerous scholars who have discussed the efficiency of various configurations.4 Several theoretical approaches have been developed to analyze the features of ownership structures. The ―law and finance‖ approach suggests that legal protection of investors is the crucial determinant of capital market development, ownership concentration, and organizational structures, and argues that legal protection is ultimately a by-product of a country’s legal tradition.5 According to this view, if a country offers a high level of protection to shareholders, typical of common law regulation, its economy will be characterized by a higher incidence of widely held companies, as described by Adolf Berle and Gardiner Means.6 Countries with a low level of shareholder protection,
3 Pierangelo Toninelli and Michelangelo Vasta, ―State-Owned Enterprises (1936-1983),‖ in Forms of Enterprises in Twentieth-Century Italy: Boundaries, Structures and Policies, ed. Andrea Colli and Michelangelo Vasta (Northampton, Mass., 2009), forthcoming. 4 Sanford J. Grossman and Oliver D. Hart, ―The Costs and Benefits of Ownership: A Theory of Vertical and Lateral Integration,‖ Journal of Political Economy 94 (Aug. 1986), 691-719; Alfred D. Chandler, Jr., Scale and Scope (Cambridge, Mass., 1990); David M. Kreps, ―Corporate Culture and Economic Theory,‖ in Perspectives on Positive Political Economy, ed. James E. Alt and Kenneth A. Shepsle (Cambridge, England, 1990), 90-143; Paul Milgrom and John Roberts, Economics, Organization and Management (Englewood Cliffs, N.J., 1992). 5 Rafael La Porta et al. , ―Law and Finance,‖ Journal of Political Economy 106 (Dec. 1998): 1113-55; Rafael La Porta, Florencio Lopez de Silanes, and Andrei Shleifer, ―Corporate Ownership around the World,‖ Journal of Finance 54 (April 1999): 471-517. 6 Adolf A. Berle and Gardiner C. Means, The Modern Corporation and Private Property (New York, 1932).

Alberto Rinaldi and Michelangelo Vasta // State-Owned Enterprises in the Italian Corporate Network, 1972-1983
4
typical of civil law regulation, are generally characterized by a greater ownership concentration with a large diffusion of cross-shareholdings, differential voting rights, and pyramidal groups.7 Control is so valuable in these latter countries that companies will strive to make it uncontestable.8 An alternative approach, known as ―political economy,‖ has resulted from observing that the structure of financial systems is not uniform over time.9 Proponents of this view maintain that a country’s financial system and governance structure are not determined by unchanging institutional factors, but mainly by the behavior and structure of interest groups that change over time. One prediction of these theorists is that ownership is more concentrated in countries where the state plays a bigger role in the economy.10
Allocation of control over companies and the rules that govern the process have contributed significantly to determining the efficiency of the Italian economic system.11 Thus, these factors have been used to analyze it.12 In this essay, we deal with the control structures of Italian capitalism by using the ID technique, which was fairly widespread during the first half of the twentieth century; it has been re-utilized by sociologists, economists, and economic historians for a variety of purposes, including analysis of inter-company links. ―Interlock‖ is the link created between two units when a subject belongs to both—that is, a director of two or more companies in the case of ownership structure. The analysis of ID comprises the reconstruction of the articulation of inter-individual and inter-company links by quantitative techniques of varying complexities. A distinction can be drawn between those who maintain that the existence of ID is irrelevant and those who believe that it is important for corporate control analysis. Among the former are the theorists of managerial control
7 Daniel Wolfenzon, ―A Theory of Pyramidal Ownership,‖ mimeo, Harvard University (Cambridge, Mass., 1998). 8 La Porta, Lopez de Silanes, and Shleifer, ―Corporate Ownership around the World.‖ 9 Raghuram G. Rajan and Luigi Zingales, ―The Great Reversals: The Politics of Financial Development in the Twentieth Century,‖ Journal of Finance Economics 69 (July 2003): 5-50. 10 Marco Pagano and Paolo Volpin, ―The Political Economy of Finance,‖ Centre for Economic Policy Research (CEPR) discussion paper, no. 3231 (2002). 11 Fabrizio Barca et al., Aspetti proprietari e mercato delle imprese, vol. 1: Proprietà, modelli di controllo e riallocazione nelle imprese industriali (Bologna, 1994); Fabrizio Barca, ed., Storia del capitalismo italiano dal dopoguerra a oggi (Rome, 1997). 12 Alexander Aganin and Paolo Volpin, ―History of Corporate Ownership in Italy,‖ European Corporate Governance Institute (ECGI) Finance Working Paper, no. 17 (2003).

Alberto Rinaldi and Michelangelo Vasta // State-Owned Enterprises in the Italian Corporate Network, 1972-1983
5
of the company, who hold that the control function is exercised by management inside the company. The board of directors works only as an organ of representation and to provide an image for the market. In these models, based primarily on the historical experience of the American public company, directors do not play any operative role in the company. The existence of ID is thus interpreted as an instrument of representation, useful only to reinforce the prestige of some companies or individuals.13
Among those who support the value of the ID method, two approaches can be identified. The first, which dates to the Marxist theory of the hegemony of finance capital, states that the financial control of credit flows and, more rarely, of part of the company’s equity, enables banks to determine companies’ policy.14 The presence of bank fiduciaries on company boards serves as a major instrument to enforce this control.
A second approach involves models of resource dependence, which justify the existence of ID based on companies’ optimizing behavior. Restrictions on access to resources, information, or markets stimulate companies to create business groups, whose presence can be detected through the existence of ID. The hypothesis is that companies use ID as a means to co-opt or absorb (partially or completely) other organizations with which they are interdependent.15
These different perspectives are mutually exclusive, as each attributes the existence of ID to one reason, justified by the theory. More recently, theorists have advanced an alternative pluralistic interpretation of ID. This approach places emphasis not on the reason, but on the plurality of modalities in which the phenomenon of ID manifests itself. The underlying idea is that ID analysis cannot verify any theory ex ante but can
13 Thomas Koenig, Robert N. Gogel and John A. Sonquist, ―Models of the Significance of Interlocking Corporate Directorates,‖ American Journal of Economics and Sociology 38 (April 1979): 173-85. 14 Rudolf Hilferding, Das Finanzkapital (Munich, 1910). 15 Howard E. Aldrich and Jeffrey Pfeffer, ―Environments of Organizations,‖ in Annual Review of Sociology, 2, ed. Alex Inkeles, James S. Coleman, and Neil J. Smelser (Palo Alto, Calif., 1976), 79-105; Jeffrey Pfeffer and Gerald R. Salancik, The External Control of Organizations: A Resource Dependence Perspective (New York, 1978); Jeffrey Pfeffer, ―A Resource Dependence Perspective on Intercorporate Relations,‖ in Intercorporate Relations: The Structural Analysis of Business, ed. Mark S. Mizruchi and Michael Schwartz (Cambridge, Mass., 1992), 25-55; Ronald S. Burt, ―Cooptive Corporate Actor Networks: A Reconsideration of Interlocking Directorates Involving American Manufactur-ing,‖ Administrative Science Quarterly 25 (Dec. 1980): 557-82.

Alberto Rinaldi and Michelangelo Vasta // State-Owned Enterprises in the Italian Corporate Network, 1972-1983
6
be very useful in the understanding of a wide range of themes in business history and, more generally, in the ownership structure of a country.16
Researchers who analyze the structure of the Italian corporate network through a reconstruction of ID during the fascist period are limited to a few pioneering studies.17 However, the panorama of available studies for the period following World War II is unquestionably more larger. Immediately after the war, the Economic Commission of the Ministry for the Constituent Assembly made a very detailed survey of Italian joint-stock companies.18 The study eventually became the object of a political clash and was never published. Nevertheless, the results were made known in numerous works, due to the commitment of one of the members of the commission, Emanuele Rienzi of the Socialist Party.19 The results of the survey verified that a few large corporate groups dominated Italy’s entire economic life by controlling, directly or indirectly, three-quarters of the share capital of private firms, despite the presence of many small shareholders. The concentration of capital was greatest in the mining, iron and steel, mechanical, electrical, chemical, and textile industries. Within this framework, the four larger electrical-commercial holdings (Edison, Società Adriatica di Elettricità [Sade], La Centrale, and Strade Ferrrate Meridionali [Bastogi]) were particularly prominent. Intertwining relations linked these companies to each other and to the other major private groups, such as Fiat (motor vehicles), Montecatini (chemistry), Italcementi (cement), Falck (steel), Pirelli (rubber and cables), Snia-Viscosa (manufactured fibers), and Italgas (gas), as well as to the big state-owned holding, IRI. Rienzi himself, using techniques that
16 Mark Granovetter, ―The Nature of Economic Relationship,‖ in Explorations in Economic Sociology, ed. Richard Swedberg (New York, 1993), 3-41. 17 Marino Zorzini, ―L’organizzazione dell’industria idro-elettrica in Italia,‖ Economia 7 (Sept.-Oct. 1925): 166-76; Pierpaolo Luzzatto Fegiz, ―Il consiglio di amministrazione e l’interdipendenza delle imprese,‖ Giornale degli economisti 43 (March 1928): 197-231. 18 Ministero per la Costituente, Rapporto della commissione economica (Rome, 1947). 19 Confederazione Italiana del Lavoro (CGIL), Struttura dei monopoli industriali in Italia (Rome, 1948); Radar [Emanuele Rienzi], Organizzazione del capitale finanziario italiano (Rome, 1948); Emanuele Rienzi, ―The Distribution of Share Capital of Italian Banking Companies,‖ Banca Nazionale del Lavoro Quarterly Review 1 (April 1947-8): 10-19; E. Zerini [pseudonym of Emanuele Rienzi], ―L’economia capitalistica e i vari aspetti delle egemonie economiche in Italia,‖ parts I, II and III, Critica economica, 5, 6, 7 (Jan.-Feb., April, June 1947): 75-102, 108-42, 67-98.

Alberto Rinaldi and Michelangelo Vasta // State-Owned Enterprises in the Italian Corporate Network, 1972-1983
7
were not particularly refined, also analyzed the role that individuals who were notably recurrent on boards of directors played.20
In the early 1960s, the existence of a ―power of availability,‖ concentrated primarily in the hands of several financial groups linked to the electricity companies that were nationalized in 1962, was confirmed. This power managed a dense network of connections that branched out in all directions and toward all other industrial sectors.21 When analyzing the effects of nationalizing the electricity industry, Guglielmo Ragozzino noted that this put an end to a system of industrial and financial relations founded on the great electrical-commercial firms, which had maintained close relations with the banking and insurance systems. The consequence was the emergence of a new order in which the larger family groups, such as Fiat and Pirelli, returned to occupy a central position within Italian capitalism.22
In the 1980s, Antonio M. Chiesi introduced the use of formalized network analysis to Italy in two works.23 He pointed out the peculiarities of the Italian corporate network, attributing them to the range and modalities of state intervention in the economy. He also illustrated the existence, in the mid-1970s, of two large poles based on state- and privately owned enterprises.24 Their integration was guaranteed by the zipper function carried out by companies such as Società Meridionale Finanziaria (SME), Bastogi, and, to a lesser extent, Società Nazionale Industria Applicazioni (SNIA)-Viscosa and Tubificio di Brescia. Several of the major players from companies in both poles sat on their boards of directors. Chiesi also emphasized the absence of the two most important private groups, Fiat and Pirelli, from the center of the network.
20 Radar, Organizzazione del capitale finanziario, 44. 21 Eugenio Benedetti and Marco A. Toniolli, ―Concentrazione industriale e potere di disposizione,‖ Rivista internazionale di scienze economiche e commerciali 10 (July 1963): 633-52. 22 Guglielmo Ragozzino, ―Una mappa del grande capitale in Italia,‖ Rassegna sindacale. Quaderni 7 (Oct. 1969): 39-73. 23 Antonio M. Chiesi, ―L’élite finanziaria italiana,‖ Rassegna italiana di sociologia 23 (Oct.-Dec. 1982): 571-95; Antonio M. Chiesi, ―Property, Capital and Network Structure in Italy,‖ in Networks of Corporate Power: A Comparative Analysis of Ten Countries, ed. Frans N. Stokman, Rolf Ziegler, and John Scott (Cambridge, England, 1985), 199-214. 24 The state was of considerably greater importance in the Italian economy than in other Western countries. Around the mid-1970s, state-owned enterprises in Italy furnished 100 percent of energy production, 53 percent of mining, 49 percent of the steel and iron industry, 10 percent of engineering, 9 percent of chemistry, in addition to having a monopoly over the telecommunications system, and to controlling 26 percent of the transport sector.

Alberto Rinaldi and Michelangelo Vasta // State-Owned Enterprises in the Italian Corporate Network, 1972-1983
8
Thus, in contrast with Ragozzino’s thesis, Chiesi observed a wider marginalization of the private groups that intervened after the nationaliza-tion of the electricity industry, to the advantage of the state-owned groups in the network. However, Giovanni Ferri and Sandro Trento later arrived at substantially different results. Using a reduced sample of companies, they held that interactions between state-owned and private enterprises characterized the Italian capitalistic structure, at least until 1970.25 We recently came to the same conclusion using a sample of almost 25,000 companies; we conclude that state- and privately owned enterprises were strongly interconnected at least from the early 1950s to the early 1970s.26
The Source The source we used for this work is Notizie statistiche sulle principali società italiane per azioni, edited by the Associazione fra le Società Italiane per Azioni. The Imita (IMprese ITAliane) database (Imita.db) is an electronic version of this source.27 This dataset contains information regarding companies, boards of directors, and balance sheets of a large sample of Italian joint-stock companies for several benchmark years.28 The source includes all the joint-stock companies listed on one of the Italian stock exchanges, together with those companies located in Italy whose share capital at the closure of the last balance was higher than a set threshold, which varied from year to year.29 Overall, this resource contains data on more than 38,000 companies, almost 300,000 directors, and more than 100,000 balance sheets. Representativeness, in terms of
25 Giovanni Ferri and Sandro Trento, ―La dirigenza delle grandi banche e delle grandi imprese: ricambio e legami,‖ in Storia del capitalismo italiano, ed. Fabrizio Barca (Rome, 1997), 405-27. 26 Alberto Rinaldi and Michelangelo Vasta, ―The Structure of Italian Capitalism, 1952-72: New Evidence Using the Interlocking Directorates Technique,‖ Financial History Review 12 (Oct. 2005): 173-98. 27 Imita.db, one of the largest datasets on companies in historical perspective available in the world, is accessible online. URL: http://imitadb.unisi.it. For details on the database, see Michelangelo Vasta, ―Appendix: the source and the Imita.db dataset,‖ in Evolution of Italian Enterprises in the 20th Century, ed. Renato Giannetti and Michelangelo Vasta (New York, 2006), 269-73. 28 Data for companies and boards of directors are available for 1911, 1913, 1921, 1927, 1936, 1952, 1960, 1972, and 1983; for balance sheets, time series are available for the span from 1900 to 1971. 29 The threshold was set at 1 million Italian lire until 1940, with the sole exception of 1914, when it amounted to 500,000 lire. In 1952, the threshold was raised to 10 million, then to 25 in 1956, 50 in 1961, and 100 from 1964 through 1972. Finally, for the benchmark year 1983 the threshold was further raised to 2 billion lire.
Alberto Rinaldi and Michelangelo Vasta // State-Owned Enterprises in the Italian Corporate Network, 1972-1983
9
capital, is very high, as the sample covers well over 90 percent of the total universe in all but the first two benchmark years (1911 and 1913) and the last (1983), for which the proportion is around 85 percent.30
In this essay, we focus on the most recent benchmark years in the dataset: 1972 and 1983. During this interval the threshold set for including a company in the Notizie statistiche rose from 100 million to 2 billion lire. As a consequence, there were about twice as many companies registered in 1972 as in 1983. To select our 1983 sample, we kept the 5,565 companies included in the original source (the Notizie statistiche), while for 1972 we selected the 5,565 companies with the highest value of share capital. Thus, we can compare our two samples without bias.
As for the directors, we used only data for members of a board of directors in the strict sense, leaving out the members of Collegi sindacali.31 We have carefully standardized the names of the directors to make them as homogeneous as possible. However, we estimate that the information on boards of directors contained in Imita.db has a margin of error of about one percent, as is the case with other similar databases.32 These errors are mainly due to cases of homonymy, misprints, or shortcomings in the source.
The Structure of the Network An interlock, as noted, is the link formed between two companies when a person is a director of both. The subject of this link is a multiple director (MD). In this work, we have used primary interlocks without taking into account either the directionality or the strength of the links.33 To
30 For 1983, there are not enough official data on the representativeness of the sample. According to a recent estimate, such a weight could, nevertheless, reach 83.3 percent of the total of Italian joint-stock companies. See Centro di Ricerca Interuniversitario per gli Studi Economici Applicati (CERISE), Rapporto finale dello Studio di fattibilità per: Dimensione e performance dell’impresa pubblica italiana (1993-1991) (Siena, 2006). 31 Collegi sindacali are special committees of auditors for firms, and are similar to supervisory boards. See John Scott, ―Theoretical Framework and Research Design,‖ in Networks of Corporate Power, 1-19. 32 Beth Mintz and Michael Schwarz, The Power Structure of American Business (Chicago, Ill., 1985). 33 It is assumed that the direction of the interlock goes from the company in which an individual director has a more important position to that in which the position is of lesser importance. In the case of strength, the connections between two companies are weighted by taking into account the number of directors who sit on both boards of directors. See Johannes M. Pennings, Interlocking Directorates (San Francisco, Calif., 1980); Stanley Wasserman and Katherine Faust, eds., Social Network Analysis: Methods and Applications (Cambridge, Mass., 1994).

Alberto Rinaldi and Michelangelo Vasta // State-Owned Enterprises in the Italian Corporate Network, 1972-1983
10
understand a network’s structure through the analysis of ID, we must adopt two viewpoints: one concerning the single subject (that is, the director) and the other, the company. As a network’s structure results from an accumulation of directorships held by individuals, we must first consider the boards of directors.
The average size of an Italian board of directors fell slightly from 4.94 to 4.76 members between 1972 and 1983 (see Table 1). These values are a little higher than those observed in 1952 and 1960 using a different sample, which yielded an average of 4.5 members per board.34
An important measure in the system’s description is the ratio of MD to the total number of directors. As shown in Table 1, this ratio was stable at about 23 percent between the two benchmark years, which indicates that in both years the links between companies were guaranteed by a similar proportion of directors. However, this value is lower than those observed in 1952 and 1960 using a larger sample, when it fluctuated around 25 percent. Another synthetic indicator is the cumulation ratio (CR)—that is, the average number of positions held by a single director. This showed a small decrease between 1972 and 1983 (from 1.50 to 1.44), and was lower than in 1952 and 1960, when its value was around 1.60.35
TABLE 1 Descriptive Statistics of the System
1972 1983
Companies 5,565 5,559*
Seats 27,470 26,470
Directors 18,278 18,354
Average Board Size 4.94 4.76
Cumulation Ratio 1.50 1.44
% Multiple Directors 23.0 23.2
Source: All the tables in this essay were constructed by the authors from data in the Imita.db. * We excluded six companies from 1983 that did not have a board of directors.
34 Rinaldi and Vasta, ―The Structure of Italian Capitalism.‖ 35 Ibid.

Alberto Rinaldi and Michelangelo Vasta // State-Owned Enterprises in the Italian Corporate Network, 1972-1983
11
The presence of MDs holding a total of more than ten offices is indicative of concentration in the system. Table 2 shows that the total proportion of seats held by such directors—commonly referred to as ―big linkers‖ (BL)—dropped from 4.27 percent in 1972 to 1.70 percent in 1983. These directors are commonly referred to as ―big linkers.‖ Conversely, directors holding only one office constituted more than three-quarters of the total, and accounted for more than half the positions for both benchmark years.
If the network is examined from another viewpoint, that is, by looking at the relationships among companies, some differences appear over the period that do not emerge as clearly as when we consider directors. To measure the degree of system cohesion, we employed three particular indicators that are generally referred to as measures of connectivity.36 The first is the traditional sociometric measure of density, defined as the ratio between the number of links between pairs of units and the number of all possible connections:
D = L(r)/L(p)
where L(r) is the number of real connections and L(p), defined as n(n-1)/2, indicates the number of possible connections. The density indicates the degree of overlap among the companies in the system. Given the same number of companies, a greater density means tighter relations among the sub-systems. An increase in the number of companies causes a decrease in the density index: with the same number of links, increasing the number of companies produces a decrease in density. The index D varies between 0 and 1, that is, for L(r)=0 and L(r)=n(n-1)/2, respectively. These refer to the extreme cases of a total absence of any link and the realization of all possible links. We calculated the index D for the whole population of firms, as well as for a sample composed of the top 250 and 500 companies in share capital.
Mark S. Mizruchi defined the second measure, known as the interlock position ratio (IPR), which represents the proportion of directors with a seat on another board, relative to the number of existing places on all boards of directors.37 This measures the external orientation of the system, and varies between IPR=0 (no link exists) and IPR=1 (each available place on the board of directors gives rise to interlocks). A third measure, concentration first four (CFF), represents the ratio between all interlocks
36 John Scott, Social Network Analysis: A Handbook (London, 1999); Wasserman and Faust, Social Network Analysis. 37 Mark S. Mizruchi, The American Corporate Network, 1904-1974 (Beverly Hills, Calif., 1982).

Alberto Rinaldi and Michelangelo Vasta // State-Owned Enterprises in the Italian Corporate Network, 1972-1983 12
TABLE 2
Distribution of Directorships per Individual in Boards of Directors Ranked by Size
Number
of Seats
1972 1983
Members of Boards Total Seats Members of Boards Total Seats
Absolute
Value % Absolute
Value %
Absolute
Value %
Absolute
Value %
1 14,079 77.03 14,079 51.25 14,094 76.79 14,094 53.25
2-10 4,122 22.55 12,218 44.48 4,226 23.02 11,927 45.06
11-20 68 0.37 932 3.39 33 0.18 426 1.61
21-30 7 0.04 170 0.62 1 0.01 23 0.09
31-40 2 0.01 71 0.26 - - - -
Totals 18,278 100.00 24,470 100.00 18,354 100.00 26,470 100.00

Alberto Rinaldi and Michelangelo Vasta // State-Owned Enterprises in the Italian Corporate Network, 1972-1983
13
and those generated by the first four companies as ranked by the number of interlocks.
TABLE 3 Network Connectivity
1972 1983
Density for the entire sample (x 100)
0.13 0.08
Density for the top 250 firms (x 100)
25.51 14.52
Density for the top 500 firms (x 100)
10.23 5.83
IPR % 0.49 0.47
CFF 1.40 1.16
It is clear from Table 3 that all network connectivity indices showed a sharp decrease between 1972 and 1983. These results indicate a sharp reduction in the cohesion of the system between the two benchmark years. We can better understand the system dynamics by analyzing the structure of ID by companies’ activity sector (see Table 4).
Looking at the overall data we can confirm our previous observation: the proportion of interlocked companies diminished from 71.2 to 68.4 percent between the two benchmark years. The fall was particularly steep for companies operating in agriculture, forestry, and fishing; those in trade, transport, storage, and communication; and manufacturing companies. The financial intermediation sector had the highest proportion of interlocked firms in both benchmark years, even though its share diminished from 88.8 in 1972 to 86.5 percent in 1983. This result seems to confirm that the system was less cohesive in 1983.
An analysis of the average number of interlocks per company by sector of activity further confirms these insights (see Table 5). System cohesion decreased considerably between the two benchmark years. In fact, the average number of interlocks per company was 7.3 in 1972, but dropped to 4.6 in 1983. The system cohesion decline is even more apparent when we compare these data with those from 1952 and 1960, when the average number of interlocks per company was 7.8 and 8.5, respectively.38
38 Rinaldi and Vasta, ―The Structure of Italian Capitalism.‖

Alberto Rinaldi and Michelangelo Vasta // State-Owned Enterprises in the Italian Corporate Network, 1972-1983 14
TABLE 4 Number of Firms Interlocked, by Activity Sector
Activity Sector
Description 1972 1983
Total ID % ID Total ID % ID
A-B Agriculture, forestry and fishing 88 68 77.3 166 102 61.4
C Mining and quarrying 67 47 70.1 34 25 73.5
D Manufacturing industry 3,304 2,303 69.7 2,898 1,853 63.9
E Electricity, gas and water supply 35 28 80.0 26 23 88.5
F Construction 170 117 68.8 243 152 62.6
G-H-I Trade, transport, storage and communication
734 509 69.3 640 383 59.8
J Financial intermediation 511 454 88.8 1,093 945 86.5
j bank Monetary intermediation (banks) 99 91 91.9 80 77 96.3
j other financial Other financial intermediation 322 278 86.3 922 786 85.2
j insurance Insurance and activities auxiliary 90 85 94.4 91 82 90.1
K Real estate, renting, business activities 540 368 68.1 375 270 72.0
L-M-N-O Public administration, health, social work and other social service activities
116 70 60.3 84 51 60.7
Total 5,565 3,964 71.2 5,559 3,804 68.4

Alberto Rinaldi and Michelangelo Vasta // State-Owned Enterprises in the Italian Corporate Network, 1972-1983
15
TABLE 5 Average Number of Interlocks per Firm, by Activity Sector
Activity Sector 1972 1983
A-B 6.5 2.7
C 7.5 3.4
D 6.2 3.6
E 10.7 7.5
F 6.6 3.1
G-H-I 6.7 3.2
J 18.0 8.1
J banks 21.2 19.6
j (other financial) 15.7 3.7
j (insurance) 22.8 14.6
K 5.5 5.0
L-M-N-O 3.9 2.6
Total 7.3 4.6
We then disaggregated the data at a sectoral level. The sectors that showed the greatest connectivity were financial intermediation (banks, insurance, and finance companies) and utilities. In fact, these two sectors had much higher values than all the others with respect to both the share of interlocked companies and the average number of interlocks per company. Banks and insurance companies were prominent within the financial intermediation sector. Insurance companies exhibited the highest values in the system in 1972, but banks superseded them in 1983. However, this trend diminished over time. Financial intermediation dropped from 18.0 to 8.1 links per company from 1972 to 1983, and each of its three subsectors reported a reduced connectivity. The average number of interlocks per company fell from 21.2 to 19.6 for banks, from 22.8 to 14.6 for insurance companies, and from 15.7 to 3.7 for other financial companies, consistent with the diminution of overall system cohesion. The corresponding value of utilities, in turn, declined from 10.7 interlocks per company in 1972 to 7.5 in 1983.

Alberto Rinaldi and Michelangelo Vasta // State-Owned Enterprises in the Italian Corporate Network, 1972-1983
16
An analysis of the top thirty companies ranked by number of inter-locks (see Tables 6a and 6b) reveals further considerations. Note that only ten of the top 30 companies in 1972 also appeared in 1983, indicating substantial changes. In spite of the high rate of turnover among individual companies, however, financial intermediation was the most represented sector in both 1972 and 1983, with 19 and 22 companies out of 30, respectively; manufacturing was stable with 7 companies in both bench-mark years (see Table 7). Nonetheless, a substantial change occurred within the financial intermediation sector, as other financial (finance) companies rose from 10 to 17, while banks fell from 5 to 2, and insurance companies from 4 to 3. However, the most staggering change was the almost total disappearance of state-owned enterprises from the top 30. In fact, we can observe that in 1972 state-owned enterprises were well represented among the most central companies with 9 out of 30.39 Six of them shared at least half of their directors with private companies, which enabled them to be interlocked with several private companies. Conversely, in 1983 the number of state-owned companies within the top 30 dropped to one, the industrial credit institute IMI.
39 We have identified as ―state- owned enterprises‖ those companies in which the state or state-controlled holding companies had a share of at least 20% of the capital. The same threshold is used in the literature to identify participations that enable their holders to exert an ―effective‖ control. See La Porta, Lopez de Silanes and Shleifer, ―Corporate Ownership around the World.‖

Alberto Rinaldi and Michelangelo Vasta // State-Owned Enterprises in the Italian Corporate Network, 1972-1983
17
TABLE 6a The Top 30 Companies, by Number of Interlocks, 1972
(P=Private, SO=State-Owned)
# Company ID Activity Sector Owner-
ship
1 Ras (Riunione adriatica di sicurtà) 167 j (insurance) P
2 Bastogi finanziaria 166 j (other) P
3 L'assicuratrice italiana 128 j (insurance) P
4 Unione italiana di riassicurazione 109 j (insurance) P
5 Efibanca ente finanziario interbancario 108 j (banks) P
6 Franco Tosi 103 D P
7 Banca d’america e d’italia 101 j (banks) P
7 Snia viscosa (Società nazionale industrie applicazioni viscosa) 101 D
P
9 Credito commerciale 99 j (banks) P
10 Sme (Società meridionale finanziaria) 94 j (other) SO
11 Generale immobiliare di lavori di utilità pubblica ed agricola 93 K
P
12 Istituto di credito per le imprese di pubblica utilità 88 j (other) SO
13 La centrale finanziaria generale 87 j (other) P
14 Italgas (Società italiana per il gas) 86 E SO
14 Italcable servizi cablografici radiotelegrafici e radioelettrici 86 I
SO
16 Italpi (Società italiana partecipazioni industriali) 84 j (other) P
17 IMI (Iistituto mobiliare italiano roma) 83 j (other) SO
17 Banca provinciale lombarda 83 j (banks) P
19 Stet (Società finanziaria telefonica) 82 j (other) SO
19 Cementerie siciliane 82 D P
21 Italcementi fabbriche riunite cemento 81 D P
21 Istituto bancario italiano 81 j (banks) P
21 Insud nuove iniziative per il sud 81 j (other) SO
21 Banco di roma 81 j (banks) SO
25 Unione subalpina di assicurazione 80 j (insurance) P
26 Istituto centrale di banche e banchieri 79 j (other) P
27 Italsider 78 D SO
28 Siemens elettra 77 D P
29 Magazzini standa società tutti articoli nazionali dell’arredamen 76 G
P
29 Montedison 76 D P

Alberto Rinaldi and Michelangelo Vasta // State-Owned Enterprises in the Italian Corporate Network, 1972-1983
18
TABLE 6b The Top 30 Companies by Number of Interlocks, 1983
# Company ID Activity Sector
Owner- ship
1 Istituto centrale di banche e banchieri 78 j (other) P
2 Snia bpd 75 D P
3 Unione italiana di riassicurazione 72 j (insurance) P
4 Ras (Riunione italiana di sicurtà) 69 j (insurance) P
5 Società italiana assicurazione crediti (Siac) 64 j (insurance) P
6 Metallurgica italiana smi 58 j (other) P
7 Montedison 57 D P
8 Efibanca ente finanziario interbancario 55 j (other) P
8 Finanziaria di sviluppo fidis 55 j (other) P
10 La centrale finanziaria generale 54 j (other) P
11 Ing. C. Olivetti & c. 53 D P
11 Compagnie industriali riunite cir 53 j (other) P
11 Cigahotels compagnia italiana grandi alberghi
53 j (other) P
11 Euromobiliare 53 j (other) P
15 Fiat auto 52 D P
16 Banca d’america e d’italia 51 j (banks) P
17 Ifil finanziaria di partecipazioni 50 j (other) P
18 Società per lo sviluppo di intese imprenditoriali consortium
49 j (other) P
18 IMI (Iistituto mobiliare italiano roma) 49 j (other) SO
20 Gilardini 48 D P
20 Istituto finanziario per l’industria edilizia finance
48 j (other) P
22 Attività immobiliari 47 K P
22 Generale mobiliare interessenze azionarie gemina
47 j (other) P
24 Bastogi irbs 46 j (other) P
24 Agricola finanziaria 46 j (other) P
24 Compagnia finanziaria ligure piemontese cofilp
46 j (other) P
27 Acciaierie e ferriere lombarde falck 45 D P
28 Teksid 44 D P
28 Nuovo banco ambrosiano 44 j (banks) P
28 Finanziaria regionale piemontese 44 j (other) P

Alberto Rinaldi and Michelangelo Vasta // State-Owned Enterprises in the Italian Corporate Network, 1972-1983
19
TABLE 7 Top 30 Companies by Number of Interlocks and Sector of Activity
Activity Sector
1972 1983
Private State-
Owned Total Private
State-Owned
Total
D 6 1 7 7 - 7
E - 1 1 - - -
G 1 - 1 - - -
I - 1 1 - - -
J 13 6 19 21 1 22
j (banks) 4 1 5 2 - 2
j (other) 5 5 10 16 1 17
j (insurance) 4 - 4 3 - 3
K 1 - 1 1 - 1
Total 21 9 30 29 1 30
The Big Linkers Because an analysis of the behavior of ―big linkers‖ (BL) can be very useful for interpretative purposes, we closely examined the twenty-five most important BL who, in each benchmark year, accumulated the largest number of positions.40 These individuals, together with the age, region of birth, education, and attendance figures for each of them, are listed in Tables 8a and 8b.
Only 3 of 31 BL in 1972 also figured in 1983. This datum shows that the system’s reduced degree of cohesion between the two benchmarks was marked by a sharp discontinuity in the Italian corporate elite. We also find that 21 BL in 1972 sat on the board of at least one state-owned enterprise, and 18 of them held memberships on boards of both private and state-owned enterprises. Conversely, in 1983, only 7 BL sat on at least one state-owned enterprise board and only 5 held positions in both private and state-owned enterprises. In 1972, state-owned enterprises accounted for 161 of the 615 directorships held by the BL (26 percent), while the corresponding figure for 1983 fell to 31 of 376 (8 percent).
40 Actually, we identified 31 BL in 1972 and 27 in 1983, because in both years some individuals held the same number of positions.

Alberto Rinaldi and Michelangelo Vasta // State-Owned Enterprises in the Italian Corporate Network, 1972-1983
20
TABLE 8a Big Linkers, 1972
Name Age Region of
Birth Education P SO Total
1. Spada, Massimo 67 Latium BA: Jurisprudence 33 6 39
2. Zuccolotto, Oscar - - SSD: Electrotechnics 32 - 32
3. Pesenti, Carlo 65 Lombardy BA: Engineering 29 - 29
4. Rovelli, Nino 55 Lombardy BA: Engineering 26 - 26
5. Riffeser, Bruno 46 Trentino-Alto Adige
BA Economics & Bus. Adm.
24 - 24
5. Zurzolo, Antonio 49 Umbria BA: Economics & Bus. Adm.
- 24 24
7. Quaratino, Licio - - BA: Engineering 2 21 23
7. Radice Fossati, Eugenio 62 Lombardy BA: Engineering 22 1 23
9. Dosi, Mario 69 Apulia BA: Jurisprudence 15 6 21
10. Galeati, Giambattista 72 Emilia-Romagna
SSD: Accountancy 19 1 20
10. Martelli, Giuseppe 65 Sardinia BA: Jurisprudence 18 2 20
10. Monti, Attilio 66 Emilia-Romagna
Not indicated 20 - 20
10. Torchiani, Tullio 71 Sardinia BA: Jurisprudence 16 4 20
15. Ferrari, Alberto 58 Emilia-Romagna
BA: Jurisprudence 15 4 19
15. Jacoboni, Attilio 67 Latium BA: Chemistry 1 18 19
17. Baldini, Riccardo 62 Tuscany BA: Engineering 2 16 18
17. Corsi, Giorgio 49 Tuscany BA: Jurisprudence 17 1 18
17. Lolli, Ettore 64 Emilia-Romagna
BA: Engineering 15 3 18
20. Costa, Angelo 71 Liguria BA: Economics & Bus. Adm.
14 3 17
20. Lattuada, Carlo 59 Lombardy SSD: Accountancy 1 16 17
20. Mizzi, Leonida 68 Emilia-Romagna
SSD: Accountancy 16 1 17
23. Vitelli, Giovanni Maria 65 Piedmont BA: Jurisprudence 16 - 16
24. Bassetti, Giansandro 49 Lombardy BA: Economics and Bus. Adm.
15 - 15

Alberto Rinaldi and Michelangelo Vasta // State-Owned Enterprises in the Italian Corporate Network, 1972-1983
21
24. Bucarelli, Domenico - - BA: Engineering 14 1 15
24. Calabria, Fausto 50 Latium BA: Jurisprudence - 15 15
24. Capanna, Alberto 62 Abruzzo BA: Economics & Bus. Adm.
- 15 15
24. Gualino, Renato 60 Piedmont BA: Jurisprudence 15 - 15
24. Roda, Carlo 71 Piedmont BA: Jurisprudence 14 1 15
24. Rossi, Aldo - - BA: Economics & Bus. Adm.
13 2 15
24. Valeri Manera, Mario 51 Liguria BA: Jurisprudence 15 - 15
24. Villa, Alessandro - - BA: Economics and Bus. Adm.
15 - 15
BA=Bachelor of Arts; Bus. Adm.=Business Administration; SSD=Secondary School Diploma; P= Private; SO=State-Owned.
TABLE 8b Big Linkers, 1983
Name Age
Region of Birth Education P SO Total
1. Gianzini, Enrico 69 Lombardy BA: Economics & Bus. Adm.
22 1 23
2. Mattioli, Francesco P. 43 Latium BA: Jurisprudence 19 1 20
3. Spada, Antonio 51 Lombardy BA: Economics & Bus. Adm.
16 - 16
4. Gardini, Raul 50 Emilia-Romagna SSD: Agriculture 15 - 15
4. Pesenti, Carlo 76 Lombardy BA: Engineering 15 - 15
4. Pesenti, Giampiero 52 Lombardy BA: Engineering 15 - 15
4. Segre, Giulio 61 Piedmont SSD: Land Surveyor
15 - 15
8. Garrino, Gian Luigi 48 Piedmont BA: Economics & Bus. Adm.
13 1 14
8. Lattuada, Carlo 70 Lombardy SSD: Accountancy - 14 14
8. Sterza, Giancarlo - - Not indicated 14 - 14
11. Del Pra, Giovanni 49 Friuli-Venezia Giulia
BA: Economics & Bus. Adm.
13 - 13
11. Garuzzo, Giorgio 45 Piedmont BA: Engineering 13 - 13
11. Lazzati, Gaetano 68 Lombardy BA: Economics & Bus. Adm.
13 - 13

Alberto Rinaldi and Michelangelo Vasta // State-Owned Enterprises in the Italian Corporate Network, 1972-1983
22
11. Lucchini, Luigi 64 Lombardy BA: Modern Languages
13 - 13
11. Piantà, Enrico 57 Piedmont BA: Economics & Bus. Adm.
13 - 13
11. Romiti, Cesare 60 Latium BA: Economics & Bus. Adm.
13 - 13
11. Saporiti, Gian Alberto 42 Piedmont Not indicated 13 - 13
18. Belloni, Antonio 64 Lombardy BA: Chemistry 12 - 12
18. Castelnuovo Tedesco, Michele
59 Tuscany BA: Jurisprudence 11 1 12
18. Conciato, Alvise - - BA: Economics & Bus. Adm.
12 - 12
18. De Benedetti, Carlo 49 Piedmont BA: Engineering 12 - 12
18. Falck, Alberto 45 Lombardy BA: Economics & Bus. Adm.
11 1 12
18. Ferruzzi, Arturo 43 Emilia-Romagna Not indicated 12 - 12
18. La Via, Francesco - - BA: Engineering - 12 12
18. Radice Fossati, Eugenio 73 Lombardy BA: Engineering 12 - 12
18. Vezzalini, Giancarlo 51 Emilia-Romagna BA: Engineering 12 - 12
18. Vitale, Marco 47 Lombardy BA: Economics & Bus. Adm.
12 - 12
BA=Bachelor of Arts; Bus. Adm.=Business Administration; SSD=Secondary School Diploma; P= Private; SO=State-Owned.
We also aggregated several types of personal data on BL. The high turnover in the population of BL was marked by a pronounced rejuvenation, which amounted to a real generational change. In fact, the mean age of BL diminished from 61.1 to 55.7 years, the median age fell even further, from 63 to 51.5 years, while the variance nearly doubled during this interval (see Table 9). Limiting the analysis to those BL who numbered at least one seat in a state-owned enterprise confirms a distinct rejuvenation.
Table 10 shows the distribution of BL by birth region. Note that, in 1972, the northwestern regions of most ancient industrialization (Pied-mont, Lombardy, and Liguria) provided only 10 BL out of 26; the more recently industrialized regions of central and northeastern Italy (Trentino Alto Adige, Emilia-Romagna, Tuscany, and Umbria) had nearly caught up with 9 presences. Latium, the South, and the islands were also well repre-sented with 7 BL, overall. All the BL born in the center, the south, and the islands numbered seats in state-owned enterprises, while this was not case for the BL born in the north.

Alberto Rinaldi and Michelangelo Vasta // State-Owned Enterprises in the Italian Corporate Network, 1972-1983
23
In 1983 the situation was reversed, with Lombardy resurging to the preeminent position it had occupied more than thirty years earlier, and Emilia-Romagna falling remarkably behind, superseded by Piedmont as well. Such a circumstance probably reflected a return of the larger private northwestern finance and industrial groups, as a consequence of their massive technological and organizational restructuring (and return to profitability) in the early 1980s. Conversely, the reduction in the number of BL born in the northeast, the center, and the south was associated with the marginalization of state-owned enterprises from the center of the system.
TABLE 9 Big Linkers by Age
Age in Years 1972 1983
Minimum 46.0 (49.0) 42.0 (43.0)
Mean 61.3 (61.1) 55.7 (52.3)
Median 63.0 (64.5) 51.5 (48.5)
Maximum 72.0 (72.0) 76.0 (70.0)
Variance 64.7 (57.4) 108.5 (145.5)
Values in brackets refer to BL with at least one seat in a state-owned enterprise.
TABLE 10 Big Linkers by Birth Region
Region 1972 1983
Piedmont 3 (1) 6 (1)
Lombardy 5 (2) 11 (3)
Liguria 2 (1) 0
Trentino-Alto Adige 1 0
Friuli-Venezia Giulia 0 1
Emilia-Romagna 5 (4) 3
Tuscany 2 (2) 1 (1)
Umbria 1 (1) 0
Latium 3 (3) 2 (1)
Abruzzo 1 (1) 0
Apulia 1 (1) 0
Sardinia 2 (2) 0
Total 26 (18) 24 (6)
Unknown 5 (3) 3 (1)
Values in parentheses refer to BL with at least one seat in a state-owned
enterprise.

Alberto Rinaldi and Michelangelo Vasta // State-Owned Enterprises in the Italian Corporate Network, 1972-1983
24
BL were highly educated (see Table 11), with 26 university graduates out of 31 BL in 1952, and 21 out of 27 in 1983. Significant changes occurred in the type of university degree held. In 1972, degrees in jurisprudence prevailed; in 1983, they had dramatically declined from 11 to 2, and were superseded by degrees in economics and business management. This might be a consequence of the diminution of the BL born in the center-south, where matriculations in the faculties of law are more common than in the north.
TABLE 11 Big Linkers by Level of Education
1972 1983
University Degree 26 (18) 21 (6)
Engineering 7 (5) 7 (1)
Jurisprudence 11 (8) 2 (2)
Economics and business management 7 (4) 10 (3)
Modern Languages - 1
Chemistry 1 (1) 1
Diploma 4 (3) 3 (1)
Accountancy 3 (3) 1 (1)
Electrotechnics 1 -
Agriculture - 1
Land surveyor - 1
Other or not indicated 1 3
Total 31 (21) 27 (7)
Note: Values in parentheses refer to BL with at least one seat in a state-owned enterprise.
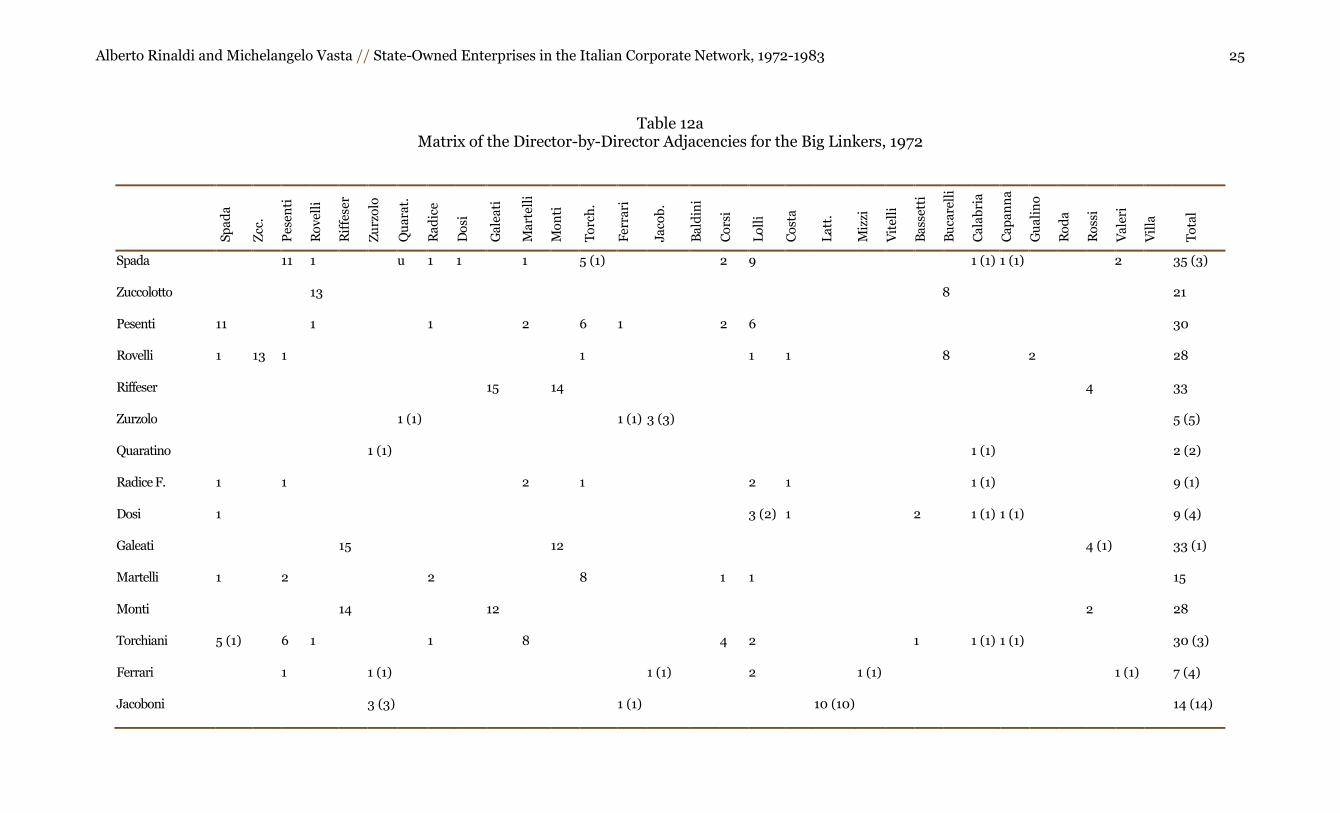
Tables 12a and 12b supply the director-by-director matrices of the adjacencies, which indicate the ID existing between the BL in the two benchmark years.41 The total number of ID between BL dropped from 402 in 1972 to 264 in 1983. Of course this result is biased because the population of BL decreased from 31 to 27 during this interval. However, if we take the average number of ID per BL, we find that the value dropped from 13.0 in 1972 to 9.8 in 1983, consistent with an overall reduction in the system’s cohesion.
41 In social network analysis, adjacency is the graph theoretical expression of the fact that two agents (in our case, two BL) are directly related or connected with one another (in our case, by sitting on the same company board). See Scott, Social Network Analysis.
Alberto Rinaldi and Michelangelo Vasta // State-Owned Enterprises in the Italian Corporate Network, 1972-1983 25
Table 12a Matrix of the Director-by-Director Adjacencies for the Big Linkers, 1972
S
pa
da
Zcc
.
Pes
enti
Ro
vel
li
Rif
fese
r
Zu
rzo
lo
Qu
ara
t.
Ra
dic
e
Do
si
Ga
lea
ti
Ma
rtel
li
Mo
nti
To
rch
.
Fer
rari
Jaco
b.
Ba
ldin
i
Co
rsi
Lo
lli
Co
sta
La
tt.
Miz
zi
Vit
elli
Ba
sset
ti
Bu
care
lli
Ca
lab
ria
Ca
pa
nn
a
Gu
ali
no
Ro
da
Ro
ssi
Va
leri
Vil
la
To
tal
Spada 11 1 u 1 1 1 5 (1) 2 9 1 (1) 1 (1) 2 35 (3)
Zuccolotto 13 8 21
Pesenti 11 1 1 2 6 1 2 6 30
Rovelli 1 13 1 1 1 1 8 2 28
Riffeser 15 14 4 33
Zurzolo 1 (1) 1 (1) 3 (3) 5 (5)
Quaratino 1 (1) 1 (1) 2 (2)
Radice F. 1 1 2 1 2 1 1 (1) 9 (1)
Dosi 1 3 (2) 1 2 1 (1) 1 (1) 9 (4)
Galeati 15 12 4 (1) 33 (1)
Martelli 1 2 2 8 1 1 15
Monti 14 12 2 28
Torchiani 5 (1) 6 1 1 8 4 2 1 1 (1) 1 (1) 30 (3)
Ferrari 1 1 (1) 1 (1) 2 1 (1) 1 (1) 7 (4)
Jacoboni 3 (3) 1 (1) 10 (10) 14 (14)

Alberto Rinaldi and Michelangelo Vasta // State-Owned Enterprises in the Italian Corporate Network, 1972-1983 26
Baldini 2 (2) 2 (2)
Corsi 2 2 1 4 1 1 1 12
Lolli 9 6 1 2 3 (2) 1 2 2 1 27 (2)
Costa 1 1 1 1 4
Lattuada 10 (10) 10 (10)
Mizzi 1 (1) 1 (1)
Vitelli 0
Bassetti 2 1 1 4
Bucarelli 8 8 1 17
Calabria 1 (1) 1 (1) 1 (1) 1 (1) 1 (1) 5 (5)
Capanna 1 (1) 1 (1) 1 (1) 2 (2) 5
Gualino 2 1 3
Roda 0
Rossi 4 4 (1) 2 10 (1)
Valeri M. 2 1 3
Villa 0
Total 35 (3) 21 30 28 33 5 (5) 2 (2) 9 (1) 9 (4) 33 (1) 15 28 30 (3) 7 (4) 14 (14) 2 (2) 12 27 (2) 4 10 (10) 1 (1) 0 4 17 5 (5) 5 3 0
10
(1) 3 0 402 (58)
Note: Values in parentheses indicate the ID generated by state-owned enterprises.

Alberto Rinaldi and Michelangelo Vasta // State-Owned Enterprises in the Italian Corporate Network, 1972-1983 27
TABLE 12b Matrix of the Director-by-Director Adjacencies for the Big Linkers, 1983
Ma
ttio
li
Sp
ad
a
Ga
rdin
i
Pes
enti
C.
Pes
enti
G.
Seg
re
Ga
rrin
o
La
ttu
ad
a
Ste
rza
Del
Pra
Ga
ruzz
o
La
zza
ti
Lu
cch
ini
Pia
ntà
Ro
mit
i
Sa
po
riti
Bel
lon
i
Ca
stel
un
ov
o
T.
Co
nci
ato
De
Ben
edet
ti
Fa
lck
Fer
ruzz
i
La
Via
Ra
dic
e F
.
Vez
zali
ni
Vit
ale
To
tal
Gianzini 6 1 1 1 1 10
Mattioli 1 5 3 1 6 1 2 19
Spada 2 8
Gardini 10 11
Pesenti C. 1 11 1 13
Pesenti G. 11 2 1 14
Segre 1 1 1 1 1 6 11
Garrino 5 1 6 6 3 3 24
Lattuada 0
Sterza 0
Del Pra 0
Garuzzo 3 1 6 1 6 5 1 4 27
Lazzati 1 2 1 4
Lucchini 1 2 1 1 2 1 1 2 11

Alberto Rinaldi and Michelangelo Vasta // State-Owned Enterprises in the Italian Corporate Network, 1972-1983 28
Piantà 1 1 1 3
Romiti 6 1 6 6 2 5 1 4 31
Saporiti 1 3 5 5 6 20
Belloni 1 1 1 1 4
Castelnovo T. 1 1 1 3
Conciato 1
De Benedetti 6 2 2 1 1 12
Falck 1 2 1 4
Ferruzzi 10 11
La Via 0
Radice F. 1 1 1 4
Vezzalini 2 3 4 4 6 19
Vitale 0
Total 19 8 11 13 14 11 24 0 0 0 27 4 11 3 31 20 4 3 1 12 4 11 0 4 19 0 264

Alberto Rinaldi and Michelangelo Vasta // State-Owned Enterprises in the Italian Corporate Network, 1972-1983
29
In 1972, only three individuals were not connected to any other BL, while another seven had fewer than 10 ID with the other BL. Conversely, there were five BL connected by 30 or more ID. In 1983, there were five individuals who had no ID with any other BL, and for eight, fewer than 10 ID connected them. Conversely, only one individual—Fiat’s managing director Cesare Romiti—had more than 30 ID with the other BL. This circumstance seems indicative of Fiat’s central position within the system.
It is worth noting that in 1972 about one-sixth (58 out of 402) of the ID between BL occurred on boards of state-owned enterprises, whereas in 1983 they generated no ID between BL. Moreover, in 1972 simply through the ID generated by the BL, Italy’s largest state-owned group, IRI, had links with 10 of the 20 major private groups, while two other state-owned groups—ENI and Ente Partecipazioni e Finanziamento Industria Manifat-turiera (EFIM)—were connected to 9 and 2 large private groups, respectively. However, in 1983 the ID generated by the BL linked the IRI group to only 7 of the 20 major private groups, ENI to 2, and EFIM to none.42
On the whole, different types of ID sometimes overlapped, even in the presence of the same BL. The first type consisted of memberships that were superimposed on share control relationships. This was particularly the case for the top managers of large private and state-owned groups on the boards of directors of controlled companies. This type of ID characterizes, for instance, the numerous presences of Cesare Romiti in the Fiat group; Carlo Pesenti in the Italcementi group; Alberto Falck in the Falck group; Nino Rovelli in the Sir-Rumianca group; Carlo De Benedetti in the Olivetti group; Raul Gardini in the Ferruzzi group; and of Alberto Capanna, Riccardo Baldini, and Francesco La Via in the state-controlled IRI group.
More significant, however, were the ID among independent companies. These included those that united industrial groups with banks and insurance companies. Only a few of these interlocks showed a directionality, one typical of the finance capital model, that went from financial intermediation institutions (banks and insurance companies) to industrial firms. This is not surprising, because the banking law of 1936 provided for a clear-cut separation of commercial and industrial credit. The only cases of this type in our sample are probably those of Massimo Spada (whose numerous presences derived from his being the principal fiduciary for Vatican finance), and Alberto Ferrari (managing director of the Banca Nazioanle del Lavoro).
42 The lists of Italy’s twenty largest private industrial groups are drawn, for 1972, from Carlo Monotti, I gruppi industriali in Italia (Turin, 1975), and for 1983, from Mediobanca, Le principali società italiane (1984) (Milan, 1984).

Alberto Rinaldi and Michelangelo Vasta // State-Owned Enterprises in the Italian Corporate Network, 1972-1983
30
Conversely, there were several banking and insurance company ID generated by top managers of large industrial enterprises. In these, the directionality did not move from banks (or insurance companies) to industrial enterprises (as postulated by the finance capital model), but from industrial firms to banks and insurance companies. Thus, in 1972, the oil industry executive Nino Rovelli, owner of Sir-Rumianca, also sat on the board of directors of the insurance company Ras. In the same way, in 1983, Raul Gardini, managing director of Ferruzzi, was also a board member of Credito Romagnolo; while Alberto Falck, president of Falck, was on the Ras board of directors.
This type of ID should not necessarily be seen as an expression of the domination of banks and insurance companies by industrial enterprises.43 Rather, it would seem to be a case of an ID that Johannes Pennings termed ―persuasive.‖44 To understand its nature, consider that the role played by banks and insurance companies was to collect information on general business trends and individual production sectors, which in a sense was similar to the function of trade associations. Banks and insurance companies thus became information depositories that top industry managers could be very interested in accessing. On the other hand, banks and insurance companies could be interested in opening their boards of directors to executives of those industrial enterprises, which, because of their size and solidity, could become their top clients.
Another type of ID consisted of the interlocks generated by individuals who sat on many boards of companies belonging to several different entrepreneurial groups, but who did not have a strong or prevalent affiliation with any of them. Perhaps these were more interesting ID, usually generated by relatively unknown figures, such as Tullio Torchiani (1972), Ettore Lolli (1972), Eugenio Radice Fossati (1972 and 1983), Michele Castelnuovo Tedesco, and Enrico Gianzini (1983). They functioned as ―go-betweens‖ between the main state-owned and private groups, in many ways comparable to the ―network specialists‖ described by Frans N. Stokman and Frans W. Wasseur.45 In addition to contributing
43 Only in very few cases were these ID manifested in correspondence with the exceptions permitted to the general rule that prohibited industries from having control over credit institutions. In fact, maintaining the major banks under the control of IRI during the period after World War II preserved their managerial autonomy; privatization would have occurred to the advantage of the larger industrial groups, but would have been paid for by the banks; see Giuseppe Conti, ―Le banche e il finanziamento industriale,‖ Storia d’Italia Einaudi: Annali 15. L’industria (Turin, 1999), 441-504. 44 Pennings, Interlocking Directorates, 31. 45 Frans N. Stokman and Frans W. Wasseur, ―National Networks in 1976: A Structural Comparison,‖ in Networks of Corporate Power, 20-44.
Alberto Rinaldi and Michelangelo Vasta // State-Owned Enterprises in the Italian Corporate Network, 1972-1983
31
to a more rapid circulation of information, these ID seem to have performed an essential function in ensuring a strategic coordination and stabilization of the positions of control in the most important private entrepreneurial groups, as Raffaele Mattioli, the chairman of the Banca Commerciale bank, originally observed.46
Why State-Owned Enterprises Became Disconnected from Private Companies We have seen that the 1930s rescue operations, during which the state saved Italy’s three largest banks and several industrial companies from bankruptcy by conferring them to IRI, enlarged the state’s presence in the economy to a greater extent than in any other Western industrial nation. The reassertion of the central role of private property in the national economic system confronted the need for coexistence between the state-owned enterprises and private companies, while avoiding domination by either party. To this end, it was necessary to guarantee the stability of control by the major private companies, putting an end to the conflicts that had distinguished relations during the early decades of the twentieth century.47
The 1942 Italian Civil Code favored stabilizing these positions of control by the major private groups.48 This was pursued by resorting to a multiplicity of instruments: the pyramidal group that organized production into an aggregate of legally separate companies linked by chains of control, such that the capital owned by the controlling subject was concentrated in a single company at the head of the group, and the other shareholders’ capital was scattered among the subsidiary companies, rendering them ineffective as voters; cross-participations between head-of-group companies and controlled companies; cross-participations between different groups, realized through bridging companies; ex-changing shares with insurance companies capable of supplying cash support; the possibility of directors collecting the proxy votes of small shareholders without any particular informational obligations or fiduciary duties; and the presence of statutory regulations aimed at discouraging takeovers, such as the right of directors to refuse to enter the names of new
46 Raffaele Mattioli, ―I problemi attuali del credito,‖ Mondo economico 17 (May 1962): 1-5. 47 Barca, Storia del capitalismo italiano; and Giorgio Mori, ―Le guerre parallele: L’industria elettrica in Italia nel periodo della grande guerra,‖ in Il capitalismo industriale in Italia: Processo di industrializzazione e storia d’Italia, ed. Giorgio Mori (Rome, 1977), 141-215. 48 Raffaele Teti, ―Imprese, imprenditori e diritto,‖ Storia d’Italia. Annali 15, L’industria (Turin, 1999), 1215-303.

Alberto Rinaldi and Michelangelo Vasta // State-Owned Enterprises in the Italian Corporate Network, 1972-1983
32
shareholders in the members’ register.49 These instruments were accompanied by sharing board members.50
The post–World War II decades were marked by a further expansion of the area of state-owned enterprises, with the setting-up of two other state-owned holdings, ENI (1953) and EFIM (1962), in addition to IRI. However, in this case, enlarging the state’s presence in the economy was conceived as a way to provide a latecomer nation with those Gerschen-kron-type ―substitutive factors‖ needed for rapid industrialization in order to catch up with more advanced countries; it was not aimed at toppling the central position of private entrepreneurship in the national economy.51
As a consequence, while expanding their area of intervention, state-owned enterprises also strove to establish links with private companies, especially the largest ones. The juridical instrument the state used to intervene in the economy favored the intertwining of state-owned enterprises and private companies; it was constituted by private law companies whose control capital was owned by a public law state-owned holding, although private shareholders also participated. Thus, both the state (through one or more state-owned holdings) and private shareholders were present in the share capital of many state-controlled enterprises; this favored sharing directors between state-controlled enterprises and private companies.
Such a circumstance produced the high level of cohesion in the Italian corporate network during the 1950s and 1960s, when the larger private and state-owned enterprises were strongly interconnected and both present at the center of the system.52 This was still the case in 1972, when the density indexes showed values only slightly lower than those of the previous two decades. State-owned enterprises were well represented
49 Radar, Organizzazione del capitale finanziario; Stefano Battilossi, ―Accumulazione e finanza: Per una storia degli investitori istituzionali in Italia (1945-1990),‖ Annali di storia dell’impresa 8 (1992): 183-259; Franco Amatori and Francesco Brioschi, ―Le grandi imprese private: famiglie e coalizioni,‖ in Barca, Storia del capitalismo italiano, 118-53. 50 Francesca Ferratini Tosi et al., ―Il ceto imprenditoriale nel primo decennio repubblicano. Anticipazioni su un campione di ricerca,‖ Italia contemporanea, 153 (Dec. 1983): 165-81; Ferri and Trento, ―La dirigenza delle grandi banche.‖ 51 Fabrizio Barca and Sandro Trento, ―La parabola delle partecipazioni statali: una missione tradita,‖ in Barca, Storia del capitalismo italiano, 185-236; Franco Amatori, ―Beyond State and Market: Italy’s Futile Search for a Third Way,‖ in The Rise and Fall of State-Owned Enterprises in the Western World, ed. Pierangelo Toninelli (New York, 2000), 128-56; Toninelli, ―Ascesa e declino dell’impresa pubblica in Italia (1860-2000).‖ 52 Rinaldi and Vasta, ―The Structure of Italian Capitalism.‖

Alberto Rinaldi and Michelangelo Vasta // State-Owned Enterprises in the Italian Corporate Network, 1972-1983
33
within the most central firms, and holding positions on the boards of both private and state-owned enterprises was a common practice among BL.
After 1972, state-owned enterprises further expanded and in 1983 were the most extensive in Italian history.53 However, the expansion during this period occurred at a time when both Italy’s large private and, to an even larger extent, state-owned enterprises, suffered massive losses as a consequence of the oil shocks and the general economic turmoil and social unrest of that decade.54
Thus, if state-owned enterprises had regularly paid dividends to their private minority shareholders until 1974, after 1975 they did not because of the economic situation. Moreover, increasing losses undermined the self-financing margins of the state-owned enterprises, with the conse-quence that they had to rely much more than in the past on state-provided borrowed capital and endowment funds.55 This, in turn, made managers of state-owned enterprises dependent to an unprecedented extent on the favors of the leaders of the major political parties (especially the Christian Democrats and the Socialists), who controlled the most important government positions.56
At the same time, the mission of state-owned enterprises underwent a substantial change. In fact, in the face of a dramatic crisis that affected all of Italian big business, the priority for Italy’s economic policy became to rescue the larger private groups and, more generally, to avoid massive lay-offs that could engender social unrest. Within this framework, state-owned holdings agreed to buy private shareholders’ minority participations in those state-controlled companies that were no longer able to pay dividends.57 Thus, the state’s share in several state-controlled companies increased remarkably between 1972 and 1983.58 The result was a substan-tial reduction in the scope for generating ID superimposed on share relationships between state-owned and private enterprises.
Moreover, state-owned enterprises were ordered to take over several private companies facing massive losses that would otherwise close. In so
53 Between 1972 and 1983 the number of companies belonging to Italy’s three largest state-owned-groups—IRI, ENI, and EFIM—rose from 572 to 1,268. In the same interval, their weight in the total share capital of all Italian joint-stock companies surged from 29.8 to 33.3%. See Toninelli and Vasta, ―State-Owned Enterprises (1936-1983).‖ 54 Amatori, ―La grande impresa,‖ Storia d’Italia: Annali 15. L’industria, 689-753. 55 Patrizio Bianchi, La rincorsa frenata: L’industria italiana dall’unità nazionale all’unificazione europea (Bologna, 2002), 217. 56 Toninelli, ―Ascesa e declino dell’impresa pubblica in Italia,‖ 640. 57 Bianchi, La rincorsa frenata, 217. 58 Toninelli and Vasta, ―State-Owned Enterprises.‖

Alberto Rinaldi and Michelangelo Vasta // State-Owned Enterprises in the Italian Corporate Network, 1972-1983
34
doing, state-owned enterprises relieved the financial situation for several private groups, allowing them to divest their more distressed affiliates and, at the same time, defend employment levels, especially in the backward south.59
However, the consequence of these actions was a further worsening of the financial situation for the state-owned groups. Their losses and debt peaked in the early 1980s, making them even more exposed to political pressure.60 The situation implied that in these new circumstances state-owned enterprises had to be run by a new generation of managers more closely tied to the governing political parties.61 However, the managers’ stronger affiliation with political parties made private companies more reluctant to appoint them to their boards of directors, thereby further reducing the margins for the generation of ID between private and state-owned enterprises.
Therefore, our overall impression is contrary to the results obtained by Chiesi.62 Using a different sample, he concluded that, in 1976, two large poles, one state-owned and the other private, which were clearly distinct from one another, marked the center of the Italian corporate network. In 1972, however, there was only one center, which included both the state-owned and the private poles, although the ties between them were somehow less cohesive than in the 1950s and the early 1960s.
By 1983, a substantial change had occurred. The system’s decreased cohesion was accompanied by a marginalization of state-owned enterprises from the center. Thus, the center seemed to hinge on private companies to a much greater extent than in the past. Yet, the sharing of board members interconnected fewer state-owned and private companies, a circumstance more in line with Chiesi’s argument.
Between 1972 and 1983, the system’s center seems to have been reshaped around the pivotal role played by Mediobanca as the only merchant bank operating in Italy at that time. Mediobanca never appeared in the list of the top thirty companies by number of ID; however, nearly two-thirds of the companies on the 1983 list, especially manufacturing companies belonging to the larger family groups and the larger finance companies, were closely allied to it through credit relations, cross-partici-pations, and Mediobanca’s presence in their controlling syndicates.63
59 Barca and Trento, ―La parabola delle partecipazioni statali,‖ 217. 60 Amatori, ―Beyond State and Market,‖ Table 6.4. 61 Barca and Trento, ―La parabola delle partecipazioni statali,‖ 217. 62 Chiesi, ―L’élite finanziaria,‖ and Chiesi, ―Property, Capital and Network Structure.‖ 63 On the history of Mediobanca, see Marcello De Cecco and Giovanni Ferri, Le banche d’affari in Italia (Bologna, 1996); Napoleone Colajanni, Un uomo una banc,. 1946-1991: storia di Enrico Cuccia e della prima Mediobanca (Milan,

Alberto Rinaldi and Michelangelo Vasta // State-Owned Enterprises in the Italian Corporate Network, 1972-1983
35
Conclusions In this essay, we have explored the structure of an Italian corporate network during the period from 1972 to 1982, using the ID technique. The system was very cohesive in 1972. The density indexes showed high values that were only slightly lower than those of the previous two decades; state-owned enterprises were well represented within the most central firms; and holding positions on the boards of both private and state-owned enterprises was a common practice among BL. Thus, contrary to the results obtained by Chiesi using a different sample, we conclude that the Italian corporate network at that time was characterized by the presence of one large center, encompassing the major private and state-owned companies.
However, in 1983 a substantial change occurred. The system’s cohesion had sharply declined. The density indexes showed much lower values; state-owned enterprises had been marginalized; BL showed a lesser propensity to generate ID between private and state-owned enterprises. Thus, the structure of the Italian corporate network in 1983 seemed more in line with Chiesi’s argument, with the presence of two distinct centers: one larger and private, which hinged on the large family groups linked to Mediobanca, the only merchant bank operating in the country, and the other smaller and state-owned.
2000); Giandomenico Piluso, Mediobanca: tra regole e mercato (Milan, 2005). On the role of Mediobanca in the Italian corporate network, see Giovanni Bruno and Luciano Segreto, ―Finanza e industria in Italia (1963-1995),‖ in Storia dell’Italia repubblicana, vol. 3: L’Italia nella crisi mondiale: L’ultimo ventennio, t. 1: Economia e società, ed. Francesco Barbagallo (Turin, 1996), 497-694.