state of indianain.gov/sboa/webreports/b37362.pdf · · 2010-08-16notes to consolidated financial...
TRANSCRIPT

STATE OF INDIANA
AN EQUAL OPPORTUNITY EMPLOYER STATE BOARD OF ACCOUNTS 302 WEST WASHINGTON STREET ROOM E418
INDIANAPOLIS, INDIANA 46204-2765
Telephone: (317) 232-2513 Fax: (317) 232-4711 Web Site: www.in.gov/sboa
Board of Directors Howard Regional Health System 3500 S. Lafountain Street Kokomo, IN 46902
We have reviewed the audit report prepared by Blue & Company, LLC, Independent Public Accountants, for the period January 1, 2009 to December 31, 2009. In our opinion, the audit report was prepared in accordance with the guidelines established by the State Board of Accounts. Per the Independent Public Accountants’ opinion, the financial statements included in the report present fairly the financial condition of the Howard Regional Health System, as of December 31, 2009, and the results of its operations for the period then ended, on the basis of accounting described in the report.
The Independent Public Accountants’ report is filed with this letter in our office as a matter of
public record.
STATE BOARD OF ACCOUNTS
CONSOLIDATED FINANCIAL STATEMENTS
AND
SUPPLEMENTARY INFORMATION
DECEMBER 31, 2009 AND 2008

HOWARD REGIONAL HEALTH SYSTEM
TABLE OF CONTENTS DECEMBER 31, 2009 AND 2008
Page Report of Independent Auditors .................................................................................. 1 Required Supplementary Information
Management’s Discussion and Analysis (Unaudited) ................................................. i Consolidated Financial Statements Consolidated Balance Sheets .................................................................................... 3 Consolidated Statements of Revenues and Expenses .............................................. 5 Consolidated Statements of Changes in Net Assets .................................................. 6 Consolidated Statements of Cash Flows ................................................................... 7 Notes to Consolidated Financial Statements ............................................................. 9 Supplementary Information Consolidating Balance Sheets - December 31, 2009 ............................................... 29 Consolidating Statements of Revenues and Expenses -
Year Ended December 31, 2009 ....................................................................... 31
Consolidating Balance Sheets - December 31, 2008 ............................................... 32 Consolidating Statements of Revenues and Expenses -
Year Ended December 31, 2008 ........................................................................ 34

1
REPORT OF INDEPENDENT AUDITORS
Board of Trustees Howard Regional Health System Kokomo, Indiana We have audited the accompanying consolidated balance sheets of Howard Regional Health System (the System), as of December 31, 2009 and 2008, and the related consolidated statements of revenues and expenses, changes in net assets and cash flows for the years then ended. These consolidated financial statements are the responsibility of the System’s management. Our responsibility is to express an opinion on these consolidated financial statements based on our audits. We did not audit the financial statements of the Howard Regional Health System Foundation, Inc. (the Foundation), a blended component unit, whose statements reflect total assets of $4,077,903 and $4,196,782 as of December 31, 2009 and 2008, respectively, and change in net assets of $290,969 and ($621,908), respectively, for the years then ended. Those statements were audited by other auditors whose report has been furnished to us, and in our opinion, insofar as it relates to the amounts for the Foundation, is based solely on the report of the other auditors. We conducted our audits in accordance with auditing standards generally accepted in the United States; Guidelines for Examination of Entities Receiving Financial Assistance From Governmental Sources and Guidelines for Audits of County and City Hospitals by Independent Certified Public Accountants issued by the Indiana State Board of Accounts. Those standards require that we plan and perform the audits to obtain reasonable assurance about whether the consolidated financial statements are free of material misstatement. An audit includes examining, on a test basis, evidence supporting the amounts and disclosures in the consolidated financial statements. An audit also includes assessing the accounting principles used and significant estimates made by management, as well as evaluating the overall consolidated financial statement presentation. We believe that our audits and the report of the other auditors provide a reasonable basis for our opinion.
2
Board of Trustees Howard Regional Health System Kokomo, Indiana In our opinion, based on our audits and the report of the other auditors, the consolidated financial statements referred to above, present fairly, in all material respects, the consolidated financial position of the System as of December 31, 2009 and 2008 and the results of its consolidated operations, changes in net assets and cash flows for the years then ended, in conformity with accounting principles generally accepted in the United States. Our audits were made for the purpose of forming an opinion on the basic consolidated financial statements taken as a whole. The supplementary information listed in the table of contents is presented for purposes of additional analysis and is not a required part of the consolidated financial statements. This information has been subjected to the auditing procedures applied in the audit of the consolidated financial statements and, in our opinion, is fairly stated, in all material respects, in relation to the consolidated financial statements taken as a whole. Management’s discussion and analysis as listed in the table of contents, is not a required part of the basic consolidated financial statements, but is supplementary information required by accounting principles generally accepted in the United States of America. We have applied certain limited procedures, which consist principally of inquiries of management regarding the methods of measurement and presentation of the required supplementary information. However, we did not audit the information and express no opinion on it.
May 27, 2010

REQUIRED SUPPLEMENTARY INFORMATION

HOWARD REGIONAL HEALTH SYSTEM
MANAGEMENT’S DISCUSSION AND ANALYSIS (UNAUDITED) DECEMBER 31, 2009 AND 2008
i
This section of Howard Regional Health System’s (the System) annual consolidated financial statements presents background information and management’s discussion and analysis (MD&A) of the System’s consolidated financial performance during the year ended December 31, 2009. This MD&A includes a discussion and analysis of the activities and results of the System, its blended component unit, Howard Regional Health System Foundation, and its majority owned subsidiaries as described in the notes to the consolidated financial statements. This MD&A should be read together with the consolidated financial statements included in this report. The System has two county-owned facilities and operates under the Indiana County Hospital Law, Indiana Code 16-22. It has a licensed and staffed 150-bed acute regional hospital and a 30-bed regional rehabilitation hospital both located in Kokomo, Indiana serving a nine county region in north central Indiana. The System provides short-term inpatient and outpatient health care among other services. The Board of County Commissioners of Howard County appoints the Governing Board of the System and a financial benefit/burden relationship exists between the County and the System. For these reasons, the System is considered a component unit of Howard County. HIGHLIGHTS OF THE YEAR ENDED DECEMBER 31, 2009 Howard Regional Health System continues to offer a full range of inpatient and outpatient services. Even adjusting for a decline in volumes, the System continues to be the third largest employer in Howard County with two hospitals on three campuses plus clinics in Greentown, Grissom, and Frankfort. Work continues on the System’s 2009-2012 strategic plan, which focuses on five major areas:
1. Outstanding quality 2. Superior service 3. Exceptional people 4. Ongoing growth 5. Consistent strength
A System-wide initiative to train and coach System leadership and staff began in partnership with the Studer Group. The Studer Group is nationally renowned firm devoted to teaching prescriptive tools and processes that organizations can use immediately to create and sustain service and operational excellence.
HOWARD REGIONAL HEALTH SYSTEM
MANAGEMENT’S DISCUSSION AND ANALYSIS (UNAUDITED) DECEMBER 31, 2009 AND 2008
ii
The goal of this training is to connect each person employed by the System to the five areas listed above, thereby increasing quality of the care provided, patient satisfaction, employee satisfaction, and financial viability for the future. Physician Recruitment The employment of physicians and physician groups is a strategic measure many hospitals are taking to help build patient volumes. Over the past decade, one of the System’s strategies has been to recruit and secure relationships with primary care physicians. This strategy was behind the formation of Community Family Health Center, North Central Indiana Pediatric Center, Pulmonary Care Center, Community OB/GYN Center and our internal medicine practices. In order to fulfill our primary mission of providing exceptional quality care, we have made a commitment to further expand and secure a solid base of primary care physicians. As a result, Dr. Cecelia Powless, OB/GYN, and Dr. Kambiz Karimi, internal medicine, joined the System’s staff in 2009. The System also successfully added additional employed specialists during 2009: Dr. Ayla Bakar, endocrinologist; Dr. Mohammad Nekoomaram, orthopaedics; and in early 2010 Dr. Andrew Mandery, plastic and cosmetic surgeon. Facility Growth Positioning for the future, we continued our strategic plan for facility growth both within the Main Campus hospital and in outpatient areas. The System took over operation of the Imaging Center of North Central Indiana on January 1, 2008. Plans moved forward, which will result in the Woman’s Center being moved to the Imaging Center in 2010. Indiana Health Information Exchange Howard Regional Health System implemented clinical information exchange through Indiana Health Information Exchange’s (IHIE) DOCS4DOCS® service. Both Howard Regional and St. Joseph Hospital, Kokomo, have implemented IHIE’s secure, Web-based service that delivers clinical reports like lab results, reports, and treatment information in real-time, sent instantly to where it needs to be for patient care (outpatient centers and ambulatory practices). Electronic Medical Record Research into potential Electronic Medical Record continued in 2009. The Cerner person-centric solution framework has been chosen to advance the digitization of individual electronic medical records to meet the needs of our hospital, providers and patients.

HOWARD REGIONAL HEALTH SYSTEM
MANAGEMENT’S DISCUSSION AND ANALYSIS (UNAUDITED) DECEMBER 31, 2009 AND 2008
iii
Pandemic Planning In anticipation of the H1N1 pandemic projected for the country, a multi-disciplinary team developed and implemented a comprehensive plan which included opening a Command Center, providing daily/weekly situation reports to all employees, patient triage, and installation of mask/glove/hand sanitizer dispensers throughout the hospital, public and physician communications. Charity Care The System provided approximately $8,723,000 of charity care to the community in 2009. This compares to $8,119,000 in 2008 or a 7% increase. Marketable Securities
We are exposed to market risk related to changes in value of securities. The investment in mutual fund fixed income and equity securities was $26.59 million as of December 31, 2009 compared to $20.99 million as of December 31, 2008. These investments are carried at fair value, with changes in unrealized gains and losses being recorded in investment income (loss). During 2009, we had investment income of approximately $4.82 million compared to an investment loss of approximately $7.03 million in 2008. Interest Rate Swap Agreements We are exposed to market risk related to changes in interest rates and we entered into interest rate swap agreements to manage our exposure to these fluctuations. Our interest rate swap agreements involve the exchange of fixed and variable rate interest payments between two parties, based on common notional principal amounts and maturity dates. The notional amounts of the swap agreements represent balances used to calculate the exchange of cash flows. Our credit risk related to these agreements is considered low because the swap agreements are with creditworthy financial institutions. The interest payments under these agreements are settled on a net basis. These derivatives have been recognized in the financial statements at their respective fair value. Changes in the fair value of these derivatives are included in the statement of revenues and expenses. During 2009, the System recognized an unrealized gain on the swap agreements of approximately $5.77 million compared to an unrealized loss of approximately $7.66 in 2008.
HOWARD REGIONAL HEALTH SYSTEM
MANAGEMENT’S DISCUSSION AND ANALYSIS (UNAUDITED) DECEMBER 31, 2009 AND 2008
iv
Accreditations During 2009, the following accreditations were achieved or renewed: The System is one of only 18 Indiana Emergency Medical Technician-Paramedic Programs to receive accreditation from the Commission on Accreditation of Allied Health Education Programs. The System’s Oncology Program earned a three-year reaccreditation with commendation from the American College of Surgeons Commission on Cancer (CoC), a consortium of professional organizations dedicated to improving survival and quality of life for cancer patients. The System is the only cancer program in Howard County to receive the accreditation. The System was awarded a three-year term of accreditation in Ultrasound Imaging Services by the American College of Radiology (ACR). The ACR-accreditation demonstrates that the System has voluntarily undergone a comprehensive review process and meets nationally accepted high standards of care. The System’s West Campus Specialty Hospital Sleep Disorders Center was accredited by the American Academy of Sleep Medicine. The West Campus Sleep Disorders Center diagnoses and treats a variety of sleep disorders in adults and children over the age of four. These include sleep apnea, obstructive sleep apnea, insomnia, narcolepsy, restless leg syndrome and others. Inpatient imaging services received accreditation by the American College of Radiology (ACR) in Ultrasound. The System is the only ultrasound accredited facility listed on the ACR website. ACR accreditation in Nuclear Medicine and CT was attained in early 2010. Other accreditations and certifications include but are not limited to: The Intersocietal Commission for the Accreditation of Nuclear Medicine Laboratories
(ICANL) The Intersocietal Commission for the Accreditation of Echo Laboratories ICAEL The Intersocietal Commission for the Accreditation of Vascular Laboratories ICAVL American Association of Cardiovascular & Pulmonary Rehabilitation American College of Radiology accreditation in Mammography State of Indiana Family and Social Services Administration, Division of Mental
Health American Diabetes Association Department of Health & Human Services, Health Care Financing Administration
HOWARD REGIONAL HEALTH SYSTEM
MANAGEMENT’S DISCUSSION AND ANALYSIS (UNAUDITED) DECEMBER 31, 2009 AND 2008
v
LOOKING AHEAD TO 2010 We continue to make plans to convert to an electronic medical record system (EMR). With an EMR, complete near real-time records can be viewed anytime from anywhere in the secure network, and records can be accessed concurrently by caregivers who have a need to view the information in the provision of care. Faster access from more places means caregivers have the most current information at their fingertips to make quick and evidence-based healthcare decisions. Quality, patient safety and patient satisfaction will continue to be priorities at the System in the year and years ahead. Working with guidelines provided by state and national healthcare organizations, we are committed to providing exceptional quality, patient-centered care. USING THIS ANNUAL REPORT The System’s consolidated financial statements consist of four statements – a Balance Sheet; a Statement of Revenues and Expenses, a Statement of Changes in Net Assets; and a Statement of Cash Flows. These consolidated financial statements and related notes provide information about the activities and the financial position of the System. The Consolidated Balance Sheet includes all of the System’s assets and liabilities and provides information about the nature and amounts of investments in resources (assets) and the obligations to System creditors (liabilities). All of the current year’s revenue earned and expenses incurred are accounted for in the Consolidated Statement of Revenues and Expenses. The Consolidated Statements of Changes in Net Assets summarizes the changes in net assets for the year. Finally, the Consolidated Statement of Cash Flows’ purpose is to provide information about the System’s cash flows from operating activities, financing activities including capital additions, and investing activities. This statement provides information on the sources and uses of cash and the change in cash balance during the year. THE BALANCE SHEET AND STATEMENT OF REVENUES AND EXPENSES One of the most important questions asked about the System’s finances is, “Is the System as a whole better or worse off as a result of the year's activities?” The balance sheet and the statement of revenues and expenses report information about the System’s resources and its activities in a way that helps answer this question. These statements include all restricted and unrestricted assets and all liabilities using the accrual basis of accounting. All of the current year's revenues and expenses are taken into account regardless of when cash is received or paid.
HOWARD REGIONAL HEALTH SYSTEM
MANAGEMENT’S DISCUSSION AND ANALYSIS (UNAUDITED) DECEMBER 31, 2009 AND 2008
vi
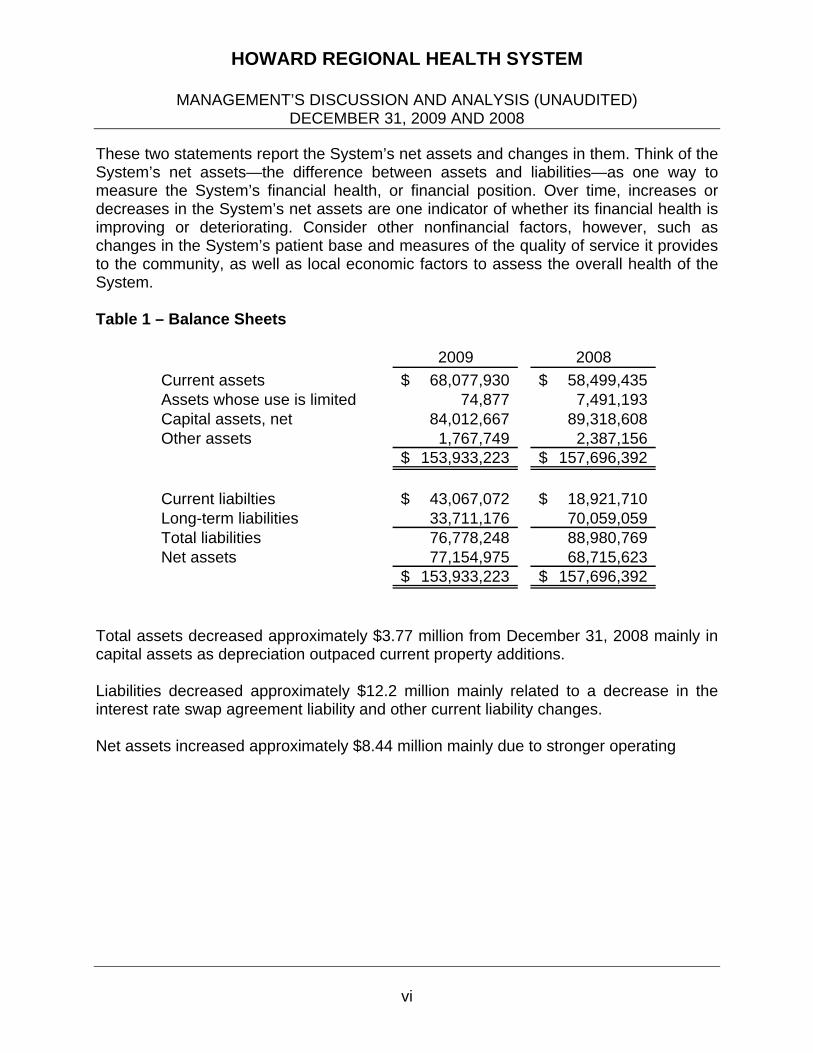
These two statements report the System’s net assets and changes in them. Think of the System’s net assets—the difference between assets and liabilities—as one way to measure the System’s financial health, or financial position. Over time, increases or decreases in the System’s net assets are one indicator of whether its financial health is improving or deteriorating. Consider other nonfinancial factors, however, such as changes in the System’s patient base and measures of the quality of service it provides to the community, as well as local economic factors to assess the overall health of the System. Table 1 – Balance Sheets
2009 2008
Current assets 68,077,930$ 58,499,435$ Assets whose use is limited 74,877 7,491,193 Capital assets, net 84,012,667 89,318,608 Other assets 1,767,749 2,387,156
153,933,223$ 157,696,392$
Current liabilties 43,067,072$ 18,921,710$ Long-term liabilities 33,711,176 70,059,059 Total liabilities 76,778,248 88,980,769 Net assets 77,154,975 68,715,623
153,933,223$ 157,696,392$
Total assets decreased approximately $3.77 million from December 31, 2008 mainly in capital assets as depreciation outpaced current property additions. Liabilities decreased approximately $12.2 million mainly related to a decrease in the interest rate swap agreement liability and other current liability changes. Net assets increased approximately $8.44 million mainly due to stronger operating

HOWARD REGIONAL HEALTH SYSTEM
MANAGEMENT’S DISCUSSION AND ANALYSIS (UNAUDITED) DECEMBER 31, 2009 AND 2008
vii
Table 2 – Statements of Revenues and Expenses
Amount Ratio Amount RatioTotal revenues 157,867,028$ 100.0% 156,318,178$ 100.0%
Salaries and benefits 79,219,704 50.2% 82,886,775 53.0%Supplies and drugs 27,570,181 17.5% 28,924,823 18.5%Purchased services 10,070,495 6.4% 9,168,827 5.9%Depreciation and amortization 9,909,307 6.3% 9,744,425 6.2%Other 27,592,248 17.5% 27,375,982 17.5%
Total operating expenses 154,361,935 97.8% 158,100,832 101.1%
Operating income (loss) 3,505,093 2.2% (1,782,654) -1.1%
Nonoperating revenues (expenses), net 6,771,322 4.3% (18,767,158) -12.0%
Consolidated change in net assets 10,276,415 6.5% (20,549,812) -13.1%
Less amount attributable to non-controlling interest (1,721,258) -1.1% (1,867,104) -1.2%
Change in net assets attributable to controlling interest 8,555,157$ 5.4% (22,416,916)$ -14.3%
2009 2008
Total revenues increased approximately $1.55 million mainly due to net patient service revenue. Expenses decreased approximately $3.74 million mainly through salaries and benefits. Together operating income increased $5.3 million over 2008 to a total of $3.5 million. Nonoperating revenues and expenses increased approximately $25.54 million over 2008 to a total of $6.77 million. Investment income and the unrealized gain on the interest rate swap agreement were the main contributing factors. STATEMENT OF CASH FLOWS The final required statement is the statement of cash flows. The statement reports cash receipts, cash payments and net changes in cash resulting from operations, investing and financing activities. It provides answers to such questions as “Where did cash come from?” “What was cash used for?” and “What was the change in the cash balance during the reporting period?”

HOWARD REGIONAL HEALTH SYSTEM
MANAGEMENT’S DISCUSSION AND ANALYSIS (UNAUDITED) DECEMBER 31, 2009 AND 2008
viii
A summary of cash flows follows: Cash Flows Data 2009 2008
From operating activities 10,461,447$ 12,872,769$ From capital and related financing activities (12,268,526) (19,171,976) From investing activities (556,198) 3,005,009
Change in cash and cash equivalents (2,363,277)$ (3,294,198)$
Total cash and cash equivalents decreased approximately $2.36 million over 2008 as capital additions and debt service payments combined with classification of investments outpaced cash provided by operating activities. SOURCES OF REVENUE The System’s revenues depend upon inpatient occupancy levels, the ancillary services and therapy programs ordered by physicians and provided to patients, the volume of outpatient procedures and the negotiated payment rates for such services. The gross charges typically do not reflect what is actually paid. The System has entered into agreements with third party payers, including government programs and managed care health plans, under which payments for healthcare services provided to patients are based upon predetermined rates per diagnoses or discounts from gross charges. The System receives a significant portion of its revenues from government health programs, principally Medicare and Medicaid, which are highly regulated and subject to frequent and substantial changes. Revenues from Medicare and Medicaid programs increased to 58% of gross revenues in 2009 from 55% in 2008. Legislative changes continue to limit or reduce the levels of payments from these programs. The approximate percentages of gross patient revenues were:
2009 2008Medicare 47% 46%Medicaid 11% 9%Blue Cross/Blue Shield 20% 25%Commercial 13% 13%Other 9% 7%
100% 100%

HOWARD REGIONAL HEALTH SYSTEM
MANAGEMENT’S DISCUSSION AND ANALYSIS (UNAUDITED) DECEMBER 31, 2009 AND 2008
ix
CAPITAL ASSETS
2009 2008 Change
Land 1,002,878$ 1,002,878$ -0-$ Land improvements 6,554,573 6,467,686 86,887 Buildings and improvements 95,378,684 93,655,858 1,722,826 Equipment 62,421,888 63,494,462 (1,072,574) Construction in progress 3,827,495 4,223,373 (395,878)
169,185,518 168,844,257 341,261 Accumulated depreciation 85,172,851 79,525,649 5,647,202
84,012,667$ 89,318,608$ (5,305,941)$
Gross additions to property were approximately $4.98 million before retirements of approximately $4.64 million. Depreciation expense was approximately $9.84 million before retirements of approximately $4.19 million for a net decrease in capital assets of approximately $5.31 million. LONG TERM DEBT As of December 31, 2009, the System had $61.7 million in short term and long term notes and bonds outstanding, a decrease from the $64.1 million as of December 31, 2008. The decrease relates to regular principal payments on existing debt with no additions during 2009. More detailed information about the System’s long term debt is presented in the notes to the consolidated financial statements. ECONOMIC OUTLOOK Management believes that the healthcare industry operating margins will continue to be under significant pressure because of changes in payer mix and growth in operating expenses in excess of the increase in prospective payments under the Medicare and Medicaid programs. The ongoing challenge facing the System and the entire healthcare market is to continue to provide quality patient care in a competitive environment and to attain reasonable rates for the services it provides while managing its costs. The most significant cost factor affecting the System and the industry in general is the spiraling increase in labor costs due to a nationwide shortage of nurses and other healthcare specialists. The System expects the nursing shortage to continue and has implemented various initiatives to better position itself to attract and retain qualified nursing personnel and improve productivity.
HOWARD REGIONAL HEALTH SYSTEM
MANAGEMENT’S DISCUSSION AND ANALYSIS (UNAUDITED) DECEMBER 31, 2009 AND 2008
x
CONTACTING THE SYSTEM’S FINANCIAL MANAGEMENT This report is designed to provide our patients, suppliers, taxpayers, and creditors with a general overview of the System’s finances and to show the System’s accountability for the money it receives. If you have questions about this report or need additional financial information, contact the System at 3500 South Lafountain Street, Kokomo, Indiana 46904, (765) 453-0702.

HOWARD REGIONAL HEALTH SYSTEM
CONSOLIDATED BALANCE SHEETS DECEMBER 31, 2009 AND 2008
See accompanying notes to consolidated financial statements. 3
2009 2008Current assets
Cash and cash equivalents 12,250,295$ 11,937,369$ Investments 19,150,491 15,674,767 Patient accounts receivable, net of estimated uncollectibles
of $10,069,994 in 2009 and $10,145,303 in 2008 19,964,045 21,132,109 Other receivables 2,570,250 3,056,842 Inventory and other current assets 6,258,730 5,755,620 Estimated third party settlements 200,909 122,728 Current portion of assets whose use is limited 7,683,210 820,000
Total current assets 68,077,930 58,499,435
Assets whose use is limitedInternally designated 7,683,210 6,409,051 Held by trustee 74,877 1,902,142
Total assets whose use is limited 7,758,087 8,311,193 Less current portion 7,683,210 820,000
Noncurrent portion of assets whose use is limited 74,877 7,491,193
Capital assets, net 84,012,667 89,318,608 Other assets 1,767,749 2,387,156
Total assets 153,933,223$ 157,696,392$
ASSETS

HOWARD REGIONAL HEALTH SYSTEM
CONSOLIDATED BALANCE SHEETS DECEMBER 31, 2009 AND 2008
See accompanying notes to consolidated financial statements. 4
2009 2008Current liabilities
Accounts payable and accrued expenses 3,541,652$ 4,468,625$ Accrued liabilities 7,836,802 10,273,466 Other current liabilities 962,423 1,625,104 Current portion of revenue bonds payable 855,000 820,000 Current portion of loans payable 705,245 1,042,995 Current portion of capital lease obligations 165,950 691,520 Current portion of revenue bonds payable
due to letter of credit expiration 29,000,000 -0- Total current liabilities 43,067,072 18,921,710
Long term debtRevenue bonds payable 18,220,000 48,075,000 Capital lease obligations 71,627 -0- Loans payable 12,663,025 13,461,939
Total long term debt 30,954,652 61,536,939
Other long term liabilities 2,756,524 8,522,120
Total liabilities 76,778,248 88,980,769
Net assetsInvested in capital assets, net of related debt 22,331,820 25,227,154 Restricted
For debt service 74,877 1,902,142 Expendable for capital improvements 7,683,210 6,409,051 Expendable for other specific purposes 10,885 10,885 Held by Foundation 3,202,847 2,911,877
Total restricted net assets 10,971,819 11,233,955 Unrestricted 41,377,032 29,664,405
Net assets - controlling interest 74,680,671 66,125,514 Non-controlling interest 2,474,304 2,590,109
Total net assets 77,154,975 68,715,623
Total liabilities and net assets 153,933,223$ 157,696,392$
LIABILITIES AND NET ASSETS
HOWARD REGIONAL HEALTH SYSTEM
CONSOLIDATED STATEMENTS OF REVENUES AND EXPENSES YEARS ENDED DECEMBER 31, 2009 AND 2008
See accompanying notes to consolidated financial statements. 5
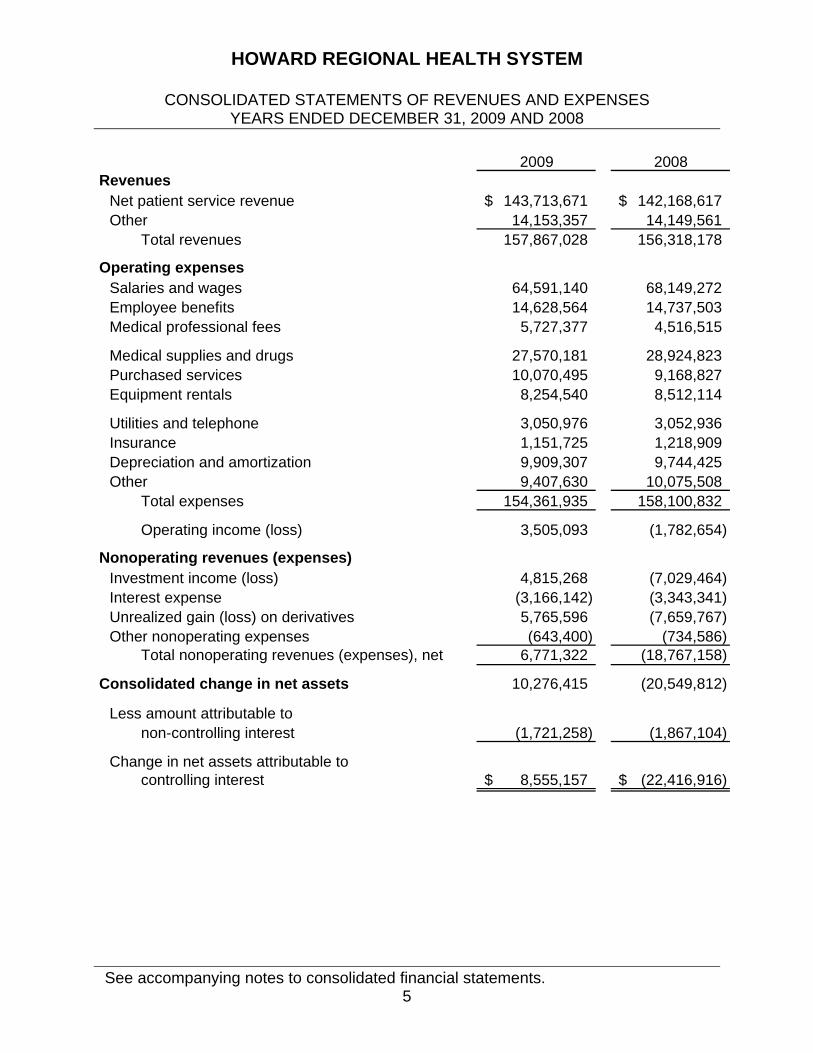
2009 2008Revenues
Net patient service revenue 143,713,671$ 142,168,617$ Other 14,153,357 14,149,561
Total revenues 157,867,028 156,318,178
Operating expensesSalaries and wages 64,591,140 68,149,272 Employee benefits 14,628,564 14,737,503 Medical professional fees 5,727,377 4,516,515
Medical supplies and drugs 27,570,181 28,924,823 Purchased services 10,070,495 9,168,827 Equipment rentals 8,254,540 8,512,114
Utilities and telephone 3,050,976 3,052,936 Insurance 1,151,725 1,218,909 Depreciation and amortization 9,909,307 9,744,425 Other 9,407,630 10,075,508
Total expenses 154,361,935 158,100,832
Operating income (loss) 3,505,093 (1,782,654)
Nonoperating revenues (expenses)Investment income (loss) 4,815,268 (7,029,464) Interest expense (3,166,142) (3,343,341) Unrealized gain (loss) on derivatives 5,765,596 (7,659,767) Other nonoperating expenses (643,400) (734,586)
Total nonoperating revenues (expenses), net 6,771,322 (18,767,158)
Consolidated change in net assets 10,276,415 (20,549,812)
Less amount attributable to non-controlling interest (1,721,258) (1,867,104)
Change in net assets attributable tocontrolling interest 8,555,157$ (22,416,916)$

HOWARD REGIONAL HEALTH SYSTEM
CONSOLIDATED STATEMENTS OF CHANGES IN NET ASSETS YEARS ENDED DECEMBER 31, 2009 AND 2008
See accompanying notes to consolidated financial statements. 6
Controlling Non-controllingInterest Interest Total
Net asset balancesDecember 31, 2007 88,542,430$ 3,153,677$ 91,696,107$
Consolidated change in net assets (22,416,916) 1,867,104 (20,549,812)
Distributions -0- (2,430,672) (2,430,672)
December 31, 2008 66,125,514 2,590,109 68,715,623
Consolidated change in net assets 8,555,157 1,721,258 10,276,415
Distributions -0- (1,837,063) (1,837,063)
December 31, 2009 74,680,671$ 2,474,304$ 77,154,975$
HOWARD REGIONAL HEALTH SYSTEM
CONSOLIDATED STATEMENTS OF CASH FLOWS YEARS ENDED DECEMBER 31, 2009 AND 2008
See accompanying notes to consolidated financial statements. 7
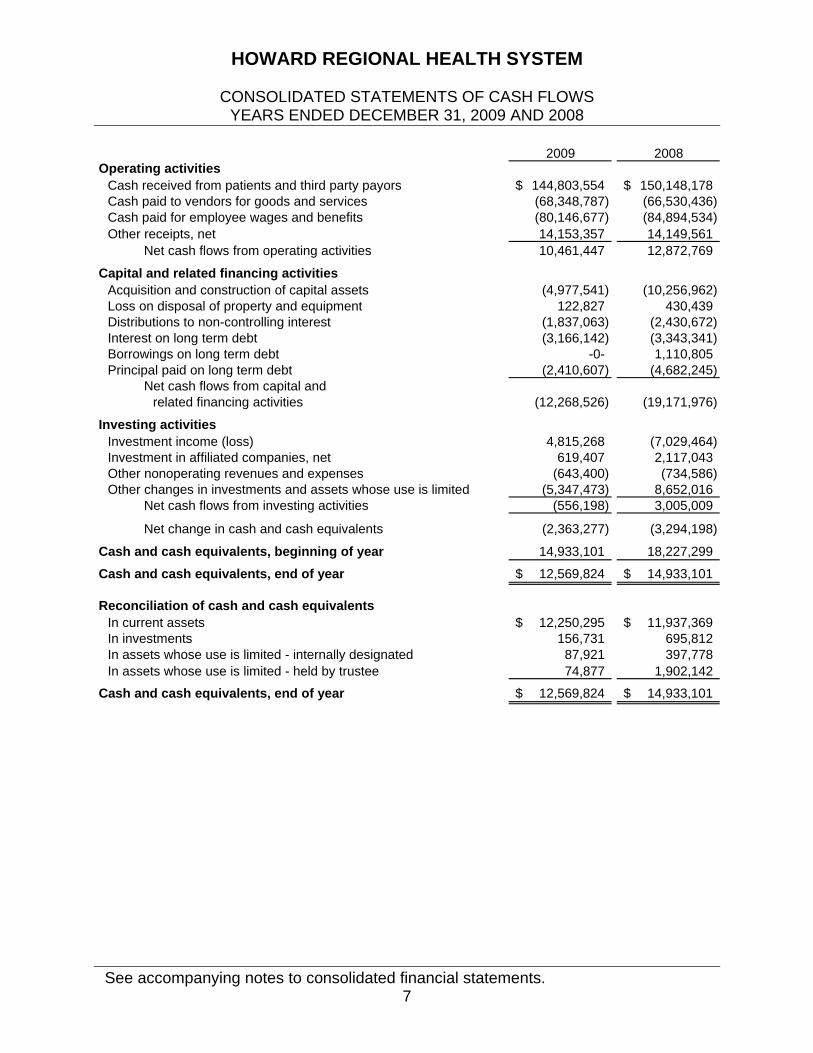
2009 2008Operating activities
Cash received from patients and third party payors 144,803,554$ 150,148,178$ Cash paid to vendors for goods and services (68,348,787) (66,530,436) Cash paid for employee wages and benefits (80,146,677) (84,894,534) Other receipts, net 14,153,357 14,149,561
Net cash flows from operating activities 10,461,447 12,872,769
Capital and related financing activitiesAcquisition and construction of capital assets (4,977,541) (10,256,962) Loss on disposal of property and equipment 122,827 430,439 Distributions to non-controlling interest (1,837,063) (2,430,672) Interest on long term debt (3,166,142) (3,343,341) Borrowings on long term debt -0- 1,110,805 Principal paid on long term debt (2,410,607) (4,682,245)
Net cash flows from capital andrelated financing activities (12,268,526) (19,171,976)
Investing activitiesInvestment income (loss) 4,815,268 (7,029,464) Investment in affiliated companies, net 619,407 2,117,043 Other nonoperating revenues and expenses (643,400) (734,586) Other changes in investments and assets whose use is limited (5,347,473) 8,652,016
Net cash flows from investing activities (556,198) 3,005,009
Net change in cash and cash equivalents (2,363,277) (3,294,198)
Cash and cash equivalents, beginning of year 14,933,101 18,227,299
Cash and cash equivalents, end of year 12,569,824$ 14,933,101$
Reconciliation of cash and cash equivalentsIn current assets 12,250,295$ 11,937,369$ In investments 156,731 695,812 In assets whose use is limited - internally designated 87,921 397,778 In assets whose use is limited - held by trustee 74,877 1,902,142
Cash and cash equivalents, end of year 12,569,824$ 14,933,101$

HOWARD REGIONAL HEALTH SYSTEM
CONSOLIDATED STATEMENTS OF CASH FLOWS YEARS ENDED DECEMBER 31, 2009 AND 2008
See accompanying notes to consolidated financial statements. 8
2009 2008Reconciliation of operating income (loss) to
net cash flows from operating activitiesOperating income (loss) 3,505,093$ (1,782,654)$ Adjustments to reconcile operating income (loss)
to net cash flows from operating activitiesDepreciation and amortization 9,909,307 9,744,425 Bad debts 9,790,137 9,859,435 Changes in operating assets and liabilities
Patient accounts receivable (8,622,073) (7,754,603) Other receivables 486,592 (76,095) Estimated third party settlements (78,181) 5,874,729 Inventory and other assets (503,110) (383,779) Accounts payable and accrued expenses (926,973) (2,007,759) Accrued liabilities and other liabilities (2,436,664) (102,182) Other current liabilities (662,681) (498,748)
Net cash flows from operating activities 10,461,447$ 12,872,769$
Supplemental disclosures of cash flow informationCash paid for interest, net of capitalized interest of
$137,000 in 2009 and $275,000 in 2008 3,166,142$ 3,343,341$
Noncash capital and related financing activitiesCapital lease obligations incurred for use of capital assets -0-$ 128,000$ Net capital assets transferred from subsidiary -0-$ 5,485,409$ Debt and capital lease obligations transferred from subsidiary -0-$ 4,757,177$

HOWARD REGIONAL HEALTH SYSTEM
NOTES TO CONSOLIDATED FINANCIAL STATEMENTS DECEMBER 31, 2009 AND 2008
9
1. SUMMARY OF SIGNIFICANT ACCOUNTING POLICIES
Organization and Reporting Entity
Howard Regional Health System (the System) is a county-owned facility and operates under the Indiana County Hospital Law, Indiana Code 16-22. The System provides short-term inpatient and outpatient health care among other services. The Board of County Commissioners of Howard County appoints the Governing Board of the System and a financial benefit/burden relationship exists between the County and the System. For these reasons, the System is considered a component unit of Howard County. Accounting principles generally accepted in the United States of America require that these consolidated financial statements present the System (primary government) and its significant component units. The component units discussed below are included in the System’s reporting entity because of the significance of their operational or financial relationships with the System. Blended component units, although legally separate entities are in substance part of the government’s operations and exist solely to provide services for the government; data from these units is combined with data of the primary government. Blended Component Units Howard Regional Health System Foundation, Inc. (the Foundation) is a blended component unit of the System. The Foundation is a separate not-for-profit entity organized to support the operations of the System. Financial statements for the Foundation can be obtained by contacting the Foundation office. Other component units included in the consolidated financial statements based on the System’s control of these entities are:
Howard Regional Specialty Care, LLC Midwest Racquetball, Inc. dba Kokomo Sports Center Howard Community Surgery Center, LLC The Imaging Center of North Central Indiana, Inc.
All significant intercompany transactions have been eliminated in the consolidated financial statements.

HOWARD REGIONAL HEALTH SYSTEM
NOTES TO CONSOLIDATED FINANCIAL STATEMENTS DECEMBER 31, 2009 AND 2008
10
Use of Estimates The preparation of consolidated financial statements in conformity with accounting principles generally accepted in the United States of America requires management to make estimates and assumptions that affect the reported amounts of assets and liabilities and disclosures of contingent assets and liabilities at the date of the consolidated financial statements and the reported amounts of revenues and expenses during the reporting period. Actual results could differ from those estimates.
Enterprise Fund Accounting The System utilizes the enterprise fund method of accounting whereby revenues and expenses are recognized on the accrual basis. Substantially all revenues and expenses are subject to accrual. Accounting Standards Pursuant to Governmental Accounting Standards Board (GASB) Statement No. 20, Accounting and Financial Reporting for Proprietary Funds and Other Governmental Entities That Use Proprietary Fund Accounting, the System has elected to apply the provisions of all relevant pronouncements of the Financial Accounting Standards Board (FASB), including those issued after November 30, 1989, that do not conflict with or contradict GASB pronouncements. Investments Certificates of deposit, demand deposits, money market funds and similar negotiable instruments that are not reported as cash and cash equivalents are reported as investments at contract value which approximates fair value. Mutual funds are reported at fair value based on the fund’s market price. . Other investments are generally reported at fair value. Investment income, including changes in the fair value of investments, is reported as nonoperating income in the consolidated statements of revenues and expenses.

HOWARD REGIONAL HEALTH SYSTEM
NOTES TO CONSOLIDATED FINANCIAL STATEMENTS DECEMBER 31, 2009 AND 2008
11
Patient Accounts Receivable and Revenues Patient revenues and the related accounts receivable are recorded at the time services to patients are performed. The System is a provider of services to patients entitled to coverage under Titles XVIII and XIX of the Health Insurance Act (Medicare and Medicaid). The System is reimbursed for Medicare and Medicaid inpatient services based on a fixed price per discharge for each diagnosis related grouping (DRG). The System is reimbursed for Medicare and Medicaid outpatient services based on a fixed price per clinical unit of service. Differences between the total program billed charges and the payments received are reflected as deductions from revenue. At the System's year-end, a cost report is filed with the Medicare program computing reimbursement amounts related to Medicare patients. The difference between computed reimbursement and interim reimbursement is reflected as a receivable from or payable to the third-party program. These programs have audited the year-end cost report filed with the Medicare program through December 31, 2006 with differences reflected as deductions from revenue in 2009. During 2009 and 2008, the System recognized approximately $-0- and $43,000, respectively, to income due to the differences between original estimates and subsequent revisions for the final settlement of cost reports. Laws and regulations governing the Medicare and Medicaid programs are extremely complex and subject to interpretation. Although these audits may result in some changes in these amounts, they are not expected to have a material effect on the accompanying consolidated financial statements. The System has entered into agreements with certain commercial carriers. Reimbursement for services under these agreements includes discounts from established charges and other payment methodologies. Patient charges under these programs, on which no interim payments have been received, are included in patient accounts receivable at the estimated net realizable value of such charges. Management estimates an allowance for uncollectible patient accounts receivable based on an evaluation of historical losses, current economic conditions, and other factors unique to the System’s customer base.
Inventory Inventory is valued at the lower of cost or market with cost being determined on the first-in, first-out (FIFO) method. Inventory consists of medical supplies and pharmaceuticals.

HOWARD REGIONAL HEALTH SYSTEM
NOTES TO CONSOLIDATED FINANCIAL STATEMENTS DECEMBER 31, 2009 AND 2008
12
Assets Whose Use is Limited Assets whose use is limited are stated at fair value in the consolidated financial statements. These assets include investments designated by the System’s Board of Trustees for internal purposes, investments restricted by donors for a specific purpose and investments held by trustees for debt service and capital expenditures. These investments consist primarily of cash and cash equivalents, certificates of deposit, US government securities and mutual funds. Investment income, to the extent not capitalized, is reported as nonoperating income in the consolidated statements of revenues and expenses. Capital Assets and Depreciation Capital assets such as property and equipment are stated at cost and include expenditures for new additions and other costs added to existing facilities which exceed $500 and meet certain useful life thresholds. Maintenance, repairs and minor renewals are expensed as incurred. The System provides for depreciation of property and equipment using annual rates, which are sufficient to depreciate the cost of depreciable assets over their estimated useful lives using the straight-line method. The range of useful lives in computing depreciation is as follows:
Range ofDescription Useful LivesLand improvements 15 yearsBuildings and fixed equipment 4-50 yearsMajor moveable equipment 5-15 years
Net Assets Net assets of the System are classified in various components. Net assets invested in capital assets net of related debt consist of capital assets net of accumulated depreciation and reduced by the current balances of any outstanding borrowings used to finance the purchase or construction of those assets. Restricted net assets consist of debt service, capital improvement and other designations and held by the Foundation. Unrestricted net assets are remaining net assets that do not meet the definition of invested in capital assets net of related debt. Net assets related to non-controlling interest are reported separately on the consolidated balance sheets.
HOWARD REGIONAL HEALTH SYSTEM
NOTES TO CONSOLIDATED FINANCIAL STATEMENTS DECEMBER 31, 2009 AND 2008
13
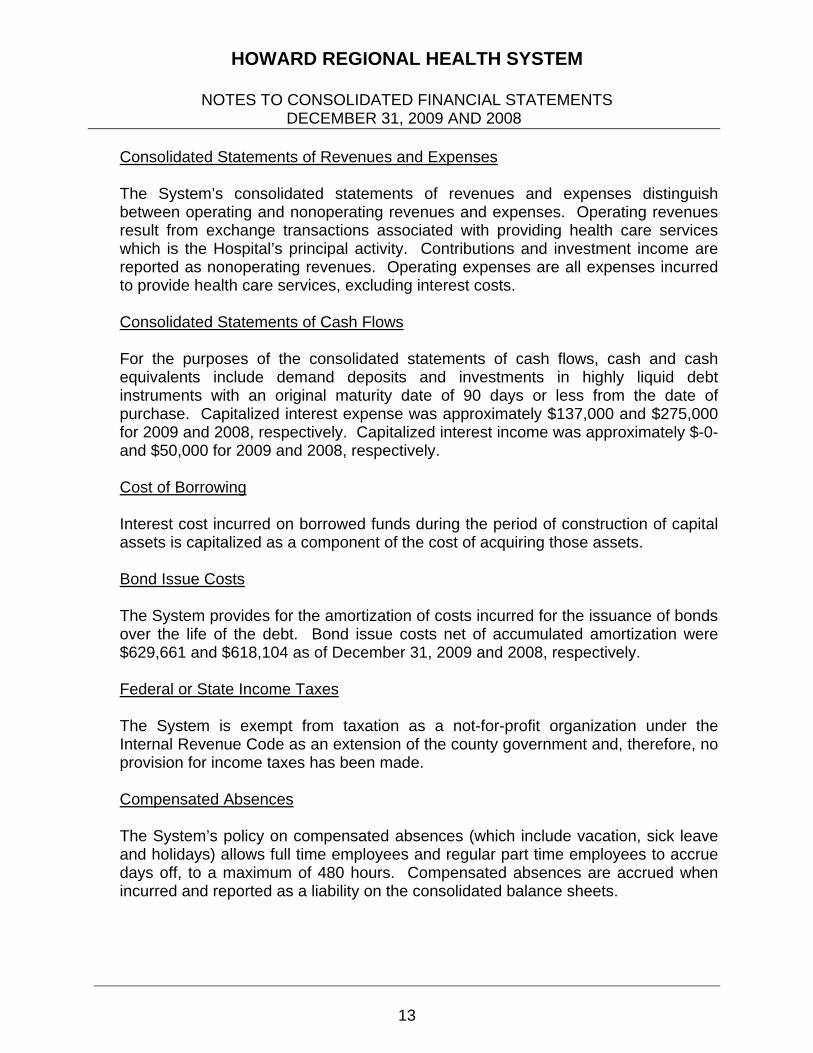
Consolidated Statements of Revenues and Expenses The System’s consolidated statements of revenues and expenses distinguish between operating and nonoperating revenues and expenses. Operating revenues result from exchange transactions associated with providing health care services which is the Hospital’s principal activity. Contributions and investment income are reported as nonoperating revenues. Operating expenses are all expenses incurred to provide health care services, excluding interest costs. Consolidated Statements of Cash Flows For the purposes of the consolidated statements of cash flows, cash and cash equivalents include demand deposits and investments in highly liquid debt instruments with an original maturity date of 90 days or less from the date of purchase. Capitalized interest expense was approximately $137,000 and $275,000 for 2009 and 2008, respectively. Capitalized interest income was approximately $-0- and $50,000 for 2009 and 2008, respectively. Cost of Borrowing
Interest cost incurred on borrowed funds during the period of construction of capital assets is capitalized as a component of the cost of acquiring those assets. Bond Issue Costs The System provides for the amortization of costs incurred for the issuance of bonds over the life of the debt. Bond issue costs net of accumulated amortization were $629,661 and $618,104 as of December 31, 2009 and 2008, respectively.
Federal or State Income Taxes The System is exempt from taxation as a not-for-profit organization under the Internal Revenue Code as an extension of the county government and, therefore, no provision for income taxes has been made.
Compensated Absences The System’s policy on compensated absences (which include vacation, sick leave and holidays) allows full time employees and regular part time employees to accrue days off, to a maximum of 480 hours. Compensated absences are accrued when incurred and reported as a liability on the consolidated balance sheets.
HOWARD REGIONAL HEALTH SYSTEM
NOTES TO CONSOLIDATED FINANCIAL STATEMENTS DECEMBER 31, 2009 AND 2008
14
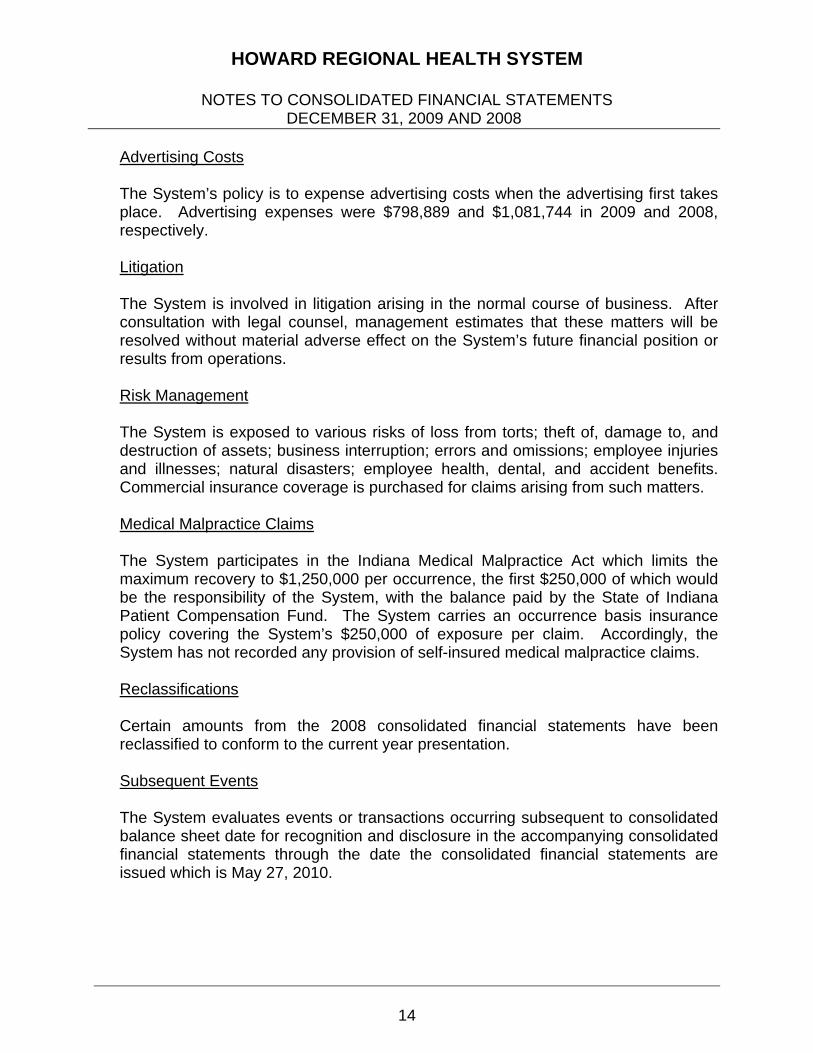
Advertising Costs The System’s policy is to expense advertising costs when the advertising first takes place. Advertising expenses were $798,889 and $1,081,744 in 2009 and 2008, respectively. Litigation The System is involved in litigation arising in the normal course of business. After consultation with legal counsel, management estimates that these matters will be resolved without material adverse effect on the System’s future financial position or results from operations.
Risk Management The System is exposed to various risks of loss from torts; theft of, damage to, and destruction of assets; business interruption; errors and omissions; employee injuries and illnesses; natural disasters; employee health, dental, and accident benefits. Commercial insurance coverage is purchased for claims arising from such matters. Medical Malpractice Claims The System participates in the Indiana Medical Malpractice Act which limits the maximum recovery to $1,250,000 per occurrence, the first $250,000 of which would be the responsibility of the System, with the balance paid by the State of Indiana Patient Compensation Fund. The System carries an occurrence basis insurance policy covering the System’s $250,000 of exposure per claim. Accordingly, the System has not recorded any provision of self-insured medical malpractice claims. Reclassifications Certain amounts from the 2008 consolidated financial statements have been reclassified to conform to the current year presentation.
Subsequent Events The System evaluates events or transactions occurring subsequent to consolidated balance sheet date for recognition and disclosure in the accompanying consolidated financial statements through the date the consolidated financial statements are issued which is May 27, 2010.

HOWARD REGIONAL HEALTH SYSTEM
NOTES TO CONSOLIDATED FINANCIAL STATEMENTS DECEMBER 31, 2009 AND 2008
15
2. ACCOUNTING FOR NON-CONTROLLING INTEREST
In 2009, new accounting guidance relative to the presentation of non-controlling interests in financial statements became effective. The System adopted this guidance and reclassified the non-controlling interest as a component of net assets in the consolidated balance sheets and consolidated statements of changes in net assets. In addition, consolidated change in net assets is shown in two components, displaying the portions attributable to both the controlling interest and non-controlling interest, on the consolidated statements of revenues and expenses. The adoption of this pronouncement did not have an effect on consolidated change in net assets for 2008.
3. NET PATIENT SERVICE REVENUE
The System has agreements with third-party payors that provide for reimbursement to the System at amounts different from its established rates. Estimated contractual adjustments under third-party reimbursement programs represent the difference between the System’s billings at standard rates and amounts reimbursed by third-party payors. They also include any differences between estimated third-party reimbursement settlements for prior years and subsequent final settlements. A summary of the reimbursement arrangements with major third-party payors is as follows:
Medicare Medicare inpatient services are reimbursed based on a predetermined amount for each case based on the diagnosis associated with the patient (Prospective Payment Hospital). These rates vary according to a patient classification system that is based on clinical, diagnostic and other factors. The prospectively determined rates are not subject to retroactive adjustment. The System’s classification of patients under the Prospective Payment Hospital and the appropriateness of patient admissions are subject to validation reviews by the Medicare peer review organization which is under contract with the System to perform such reviews. Medicare outpatient services are primarily reimbursed on predetermined rates based on the services provided.

HOWARD REGIONAL HEALTH SYSTEM
NOTES TO CONSOLIDATED FINANCIAL STATEMENTS DECEMBER 31, 2009 AND 2008
16
Medicaid The System is reimbursed for Medicaid inpatient services under a prospectively determined rate-per-discharge and is not subject to retroactive adjustment. The differences between standard charges and reimbursement from these programs are recorded as contractual adjustments. Reimbursement for Medicaid outpatient services is based on predetermined rates, and is not subject to retroactive cost based settlements. The System is eligible for the Indiana Medicaid Supplemental programs including Medicaid Disproportionate Share Hospital and Municipal Upper Payment Limit programs. The System recognized reimbursement from these programs within net patient revenue of approximately $3,242,000 and $1,687,000 during 2009 and 2008, respectively. These programs are Federal programs administered by the state.
Other Payors The System also has entered into payment agreements with certain commercial insurance carriers and preferred provider organizations. The basis for payment to the System under these agreements includes prospectively determined rates per discharge, discounts from established charges and prospectively determined daily rates.
The following is a summary of net patient service revenue for 2009 and 2008:
2009 2008Inpatient routine services 38,023,052$ 41,114,484$ Inpatient ancillary services 85,174,268 79,613,736Outpatient ancillary services 224,946,627 209,616,317
Gross patient service revenue 348,143,947 330,344,537
Contractual allowance 185,916,805 170,117,330Charity care 8,723,334 8,199,155Bad debts 9,790,137 9,859,435
Deductions from revenue 204,430,276 188,175,920
Net patient service revenue 143,713,671$ 142,168,617$
The System provides care to patients who meet certain criteria under its charity care policy without charge or at amounts less than its established rates. Because the System does not collect amounts deemed to be charity care, they are not reported as revenue.
HOWARD REGIONAL HEALTH SYSTEM
NOTES TO CONSOLIDATED FINANCIAL STATEMENTS DECEMBER 31, 2009 AND 2008
17
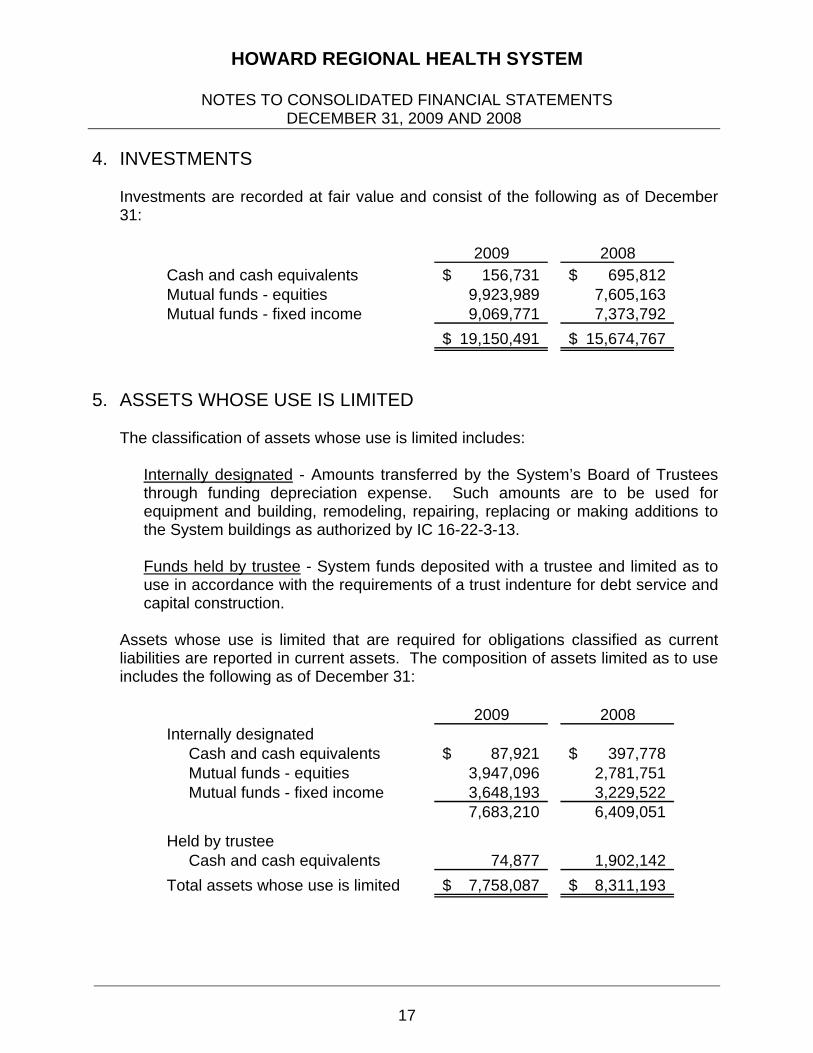
4. INVESTMENTS
Investments are recorded at fair value and consist of the following as of December 31:
2009 2008Cash and cash equivalents 156,731$ 695,812$ Mutual funds - equities 9,923,989 7,605,163 Mutual funds - fixed income 9,069,771 7,373,792
19,150,491$ 15,674,767$
5. ASSETS WHOSE USE IS LIMITED The classification of assets whose use is limited includes:
Internally designated - Amounts transferred by the System’s Board of Trustees through funding depreciation expense. Such amounts are to be used for equipment and building, remodeling, repairing, replacing or making additions to the System buildings as authorized by IC 16-22-3-13.
Funds held by trustee - System funds deposited with a trustee and limited as to use in accordance with the requirements of a trust indenture for debt service and capital construction.
Assets whose use is limited that are required for obligations classified as current liabilities are reported in current assets. The composition of assets limited as to use includes the following as of December 31:
2009 2008Internally designated
Cash and cash equivalents 87,921$ 397,778$ Mutual funds - equities 3,947,096 2,781,751 Mutual funds - fixed income 3,648,193 3,229,522
7,683,210 6,409,051
Held by trusteeCash and cash equivalents 74,877 1,902,142
Total assets whose use is limited 7,758,087$ 8,311,193$

HOWARD REGIONAL HEALTH SYSTEM
NOTES TO CONSOLIDATED FINANCIAL STATEMENTS DECEMBER 31, 2009 AND 2008
18
6. DEPOSITS AND INVESTMENTS Deposits with financial institutions in the State of Indiana at year end were entirely insured by the Federal Depository Insurance Corporation or by the Indiana Public Deposit Insurance Fund. This includes any deposit accounts issued or offered by a qualifying financial institution. Investments are generally carried at fair market value. Net realized gains and losses on security transactions are determined on the specific identification cost basis. Funded depreciation investments consist of cash equivalents and mutual funds. The System’s investments generally are reported at fair value. As of December 31, 2009 and 2008, the System had the following investments and maturities, all of which were held in the System’s name by custodial banks that are agents of the System:
Investment Maturities (in years)Carrying Less More Amount than 1 1-5 6-10 than 10
Mutual funds - equities 13,871,085$ 13,871,085$ -0-$ -0-$ -0-$ Mutual funds - fixed income 12,717,964 12,717,964 -0- -0- -0-
26,589,049$ 26,589,049$ -0-$ -0-$ -0-$
December 31, 2009
Investment Maturities (in years)Carrying Less More Amount than 1 1-5 6-10 than 10
Mutual funds - equities 10,386,914$ 10,386,914$ -0-$ -0-$ -0-$ Mutual funds - fixed income 10,603,314 10,603,314 -0- -0- -0-
20,990,228$ 20,990,228$ -0-$ -0-$ -0-$
December 31, 2008
Interest rate risk – The System does not have a formal investment policy that limits investment maturities as a means of managing its exposure to fair value losses arising from changing interest rates. Credit risk – Statutes authorize the System to invest in interest bearing deposit accounts, passbook savings accounts, certificates of deposit, money market accounts, mutual funds, pooled fund investments, securities backed by the full faith and credit of the United States Treasury and repurchase agreements. The statutes require that repurchase agreements be fully collateralized by U.S. Government or U.S. Government Agency obligations.

HOWARD REGIONAL HEALTH SYSTEM
NOTES TO CONSOLIDATED FINANCIAL STATEMENTS DECEMBER 31, 2009 AND 2008
19
Concentration of credit risk – The System maintains its investments, which at times may exceed federally insured limits. The System has not experienced any losses in such accounts. The System believes that it is not exposed to any significant credit risk on investments. Deposits and investments consist of the following as of December 31:
2009 2008
Carrying amountDeposits 12,569,824$ 14,933,101$ Mutual funds - equities 13,871,085 10,386,914 Mutual funds - fixed income 12,717,964 10,603,314
39,158,873$ 35,923,329$
Included in the balance sheet captionsCash and cash equivalents 12,250,295$ 11,937,369$ Investments 19,150,491 15,674,767 Internally designated 7,683,210 6,409,051 Held by trustee 74,877 1,902,142
39,158,873$ 35,923,329$
7. FAIR VALUE MEASUREMENTS
Major classes of assets and liabilities that are measured at fair value are categorized according to a fair value hierarchy that prioritizes the inputs to value techniques used to measure fair value. The hierarchy gives the highest priority to unadjusted quoted prices in active markets for identical assets or liabilities (Level 1) and the lowest priority to unobservable inputs (Level 3).
Level 1 inputs are readily determinable using unadjusted quoted prices for
identical assets or liabilities in active markets. Level 2 inputs are derived from quoted prices for similar assets or liabilities in
active markets; quoted prices for identical or similar assets or liabilities in inactive markets (other than those included in Level 1) which are observable for the asset or liability, either directly or indirectly.
Level 3 inputs are derived from valuation techniques in which one or more significant inputs or significant value drivers are unobservable.
If the inputs used fall within different levels of the hierarchy, the categorization is based upon the lowest level input that is significant to the fair value measurement.

HOWARD REGIONAL HEALTH SYSTEM
NOTES TO CONSOLIDATED FINANCIAL STATEMENTS DECEMBER 31, 2009 AND 2008
20
Assets and liabilities measured at fair value on a recurring basis as of December 31, 2009 and 2008 are as follows:
Total Level 1 Level 2 Level 3Assets
InvestmentsMutual funds - equities 9,923,989$ 9,923,989$ -0-$ -0-$ Mutual funds - fixed income 9,069,771 9,069,771 -0- -0-
18,993,760$ -0-$ -0-$
Cash equivalents 156,731
Total investments 19,150,491$
Assets whose use is limitedMutual funds - equities 3,947,096$ 3,947,096$ -0-$ -0-$ Mutual funds - fixed income 3,648,193 3,648,193 -0- -0-
7,595,289$ -0-$ -0-$
Cash equivalents 162,798
Total assets whose use is limited 7,758,087$
LiabilitiesInterest rate swap agreement 2,756,524$ -0-$ 2,756,524$ -0-$
December 31, 2009
Total Level 1 Level 2 Level 3Assets
InvestmentsMutual funds - equities 7,605,163$ 7,605,163$ -0-$ -0-$ Mutual funds - fixed income 7,373,792 7,373,792 -0- -0-
14,978,955$ -0-$ -0-$
Cash equivalents 695,812
Total investments 15,674,767$
Assets whose use is limitedMutual funds - equities 2,781,751$ 2,781,751$ -0-$ -0-$ Mutual funds - fixed income 3,229,522 3,229,522 -0- -0-
6,011,273$ -0-$ -0-$
Cash equivalents 2,299,920
Total assets whose use is limited 8,311,193$
LiabilitiesInterest rate swap agreement 8,522,120$ -0-$ 8,522,120$ -0-$
December 31, 2008

HOWARD REGIONAL HEALTH SYSTEM
NOTES TO CONSOLIDATED FINANCIAL STATEMENTS DECEMBER 31, 2009 AND 2008
21
The following methods and assumptions were used by the System in estimating the fair value of its financial instruments:
Cash and cash equivalents, accounts payable, other current liabilities, salaries, wages and related liabilities and estimated third-party settlements: The carrying amount reported in the consolidated balance sheets for cash and cash equivalents, accounts payable, other current liabilities, salaries, wages and related liabilities and estimated third-party settlements approximate fair value.
Long term debt: Fair value of the System’s variable rate revenue bonds is based on current traded value. The carrying value of loans payable and capital lease obligations approximates fair value.
8. CAPITAL ASSETS A summary of capital assets includes the following as of December 31:
December 31, December 31,2008 Additions Retirements Transfers 2009
Land 1,002,878$ -0-$ -0-$ -0-$ 1,002,878$ Land improvements 6,467,686 119,571 (32,684) -0- 6,554,573 Buildings and improvements 93,655,858 552,045 (701,049) 1,871,830 95,378,684 Equipment 63,494,462 1,912,953 (3,855,070) 869,543 62,421,888 Construction in progress 4,223,373 2,392,972 (47,477) (2,741,373) 3,827,495
Total capital assets 168,844,257 4,977,541 (4,636,280) -0- 169,185,518
Less accumulated depreciationLand improvements 1,446,702 579,849 (31,991) -0- 1,994,560 Buildings and improvements 37,844,670 3,590,528 (533,255) -0- 40,901,943 Equipment 40,234,277 5,671,154 (3,629,083) -0- 42,276,348
Total accumulated depreciation 79,525,649 9,841,531 (4,194,329) -0- 85,172,851
Capital assets, net 89,318,608$ (4,863,990)$ (441,951)$ -0-$ 84,012,667$
December 31, December 31,2007 Additions Retirements Transfers 2008
Land 644,187$ -0-$ -0-$ 358,691$ 1,002,878$ Land improvements 3,199,230 126,134 (215,667) 3,357,989 6,467,686 Buildings and improvements 79,933,943 870,763 (475,941) 13,327,093 93,655,858 Equipment 50,954,946 2,684,720 (3,752,573) 13,607,369 63,494,462 Construction in progress 16,903,544 6,575,345 (181,860) (19,073,656) 4,223,373
Total capital assets 151,635,850 10,256,962 (4,626,041) 11,577,486 168,844,257
Less accumulated depreciationLand improvements 1,242,579 418,832 (214,709) -0- 1,446,702 Buildings and improvements 34,676,881 3,340,589 (448,259) 275,459 37,844,670 Equipment 30,785,183 5,917,228 (2,284,752) 5,816,618 40,234,277
Total accumulated depreciation 66,704,643 9,676,649 (2,947,720) 6,092,077 79,525,649
Capital assets, net 84,931,207$ 580,313$ (1,678,321)$ 5,485,409$ 89,318,608$
HOWARD REGIONAL HEALTH SYSTEM
NOTES TO CONSOLIDATED FINANCIAL STATEMENTS DECEMBER 31, 2009 AND 2008
22
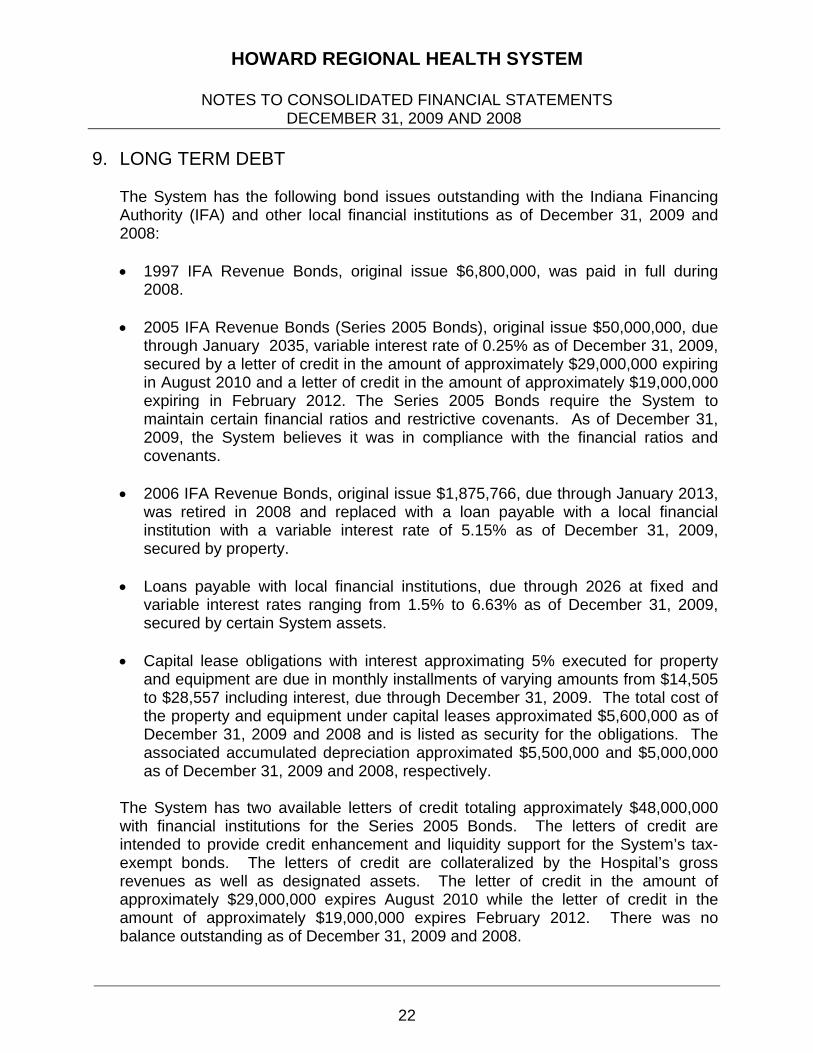
9. LONG TERM DEBT The System has the following bond issues outstanding with the Indiana Financing Authority (IFA) and other local financial institutions as of December 31, 2009 and 2008: 1997 IFA Revenue Bonds, original issue $6,800,000, was paid in full during
2008.
2005 IFA Revenue Bonds (Series 2005 Bonds), original issue $50,000,000, due through January 2035, variable interest rate of 0.25% as of December 31, 2009, secured by a letter of credit in the amount of approximately $29,000,000 expiring in August 2010 and a letter of credit in the amount of approximately $19,000,000 expiring in February 2012. The Series 2005 Bonds require the System to maintain certain financial ratios and restrictive covenants. As of December 31, 2009, the System believes it was in compliance with the financial ratios and covenants.
2006 IFA Revenue Bonds, original issue $1,875,766, due through January 2013,
was retired in 2008 and replaced with a loan payable with a local financial institution with a variable interest rate of 5.15% as of December 31, 2009, secured by property.
Loans payable with local financial institutions, due through 2026 at fixed and variable interest rates ranging from 1.5% to 6.63% as of December 31, 2009, secured by certain System assets.
Capital lease obligations with interest approximating 5% executed for property
and equipment are due in monthly installments of varying amounts from $14,505 to $28,557 including interest, due through December 31, 2009. The total cost of the property and equipment under capital leases approximated $5,600,000 as of December 31, 2009 and 2008 and is listed as security for the obligations. The associated accumulated depreciation approximated $5,500,000 and $5,000,000 as of December 31, 2009 and 2008, respectively.
The System has two available letters of credit totaling approximately $48,000,000 with financial institutions for the Series 2005 Bonds. The letters of credit are intended to provide credit enhancement and liquidity support for the System’s tax-exempt bonds. The letters of credit are collateralized by the Hospital’s gross revenues as well as designated assets. The letter of credit in the amount of approximately $29,000,000 expires August 2010 while the letter of credit in the amount of approximately $19,000,000 expires February 2012. There was no balance outstanding as of December 31, 2009 and 2008.
HOWARD REGIONAL HEALTH SYSTEM
NOTES TO CONSOLIDATED FINANCIAL STATEMENTS DECEMBER 31, 2009 AND 2008
23
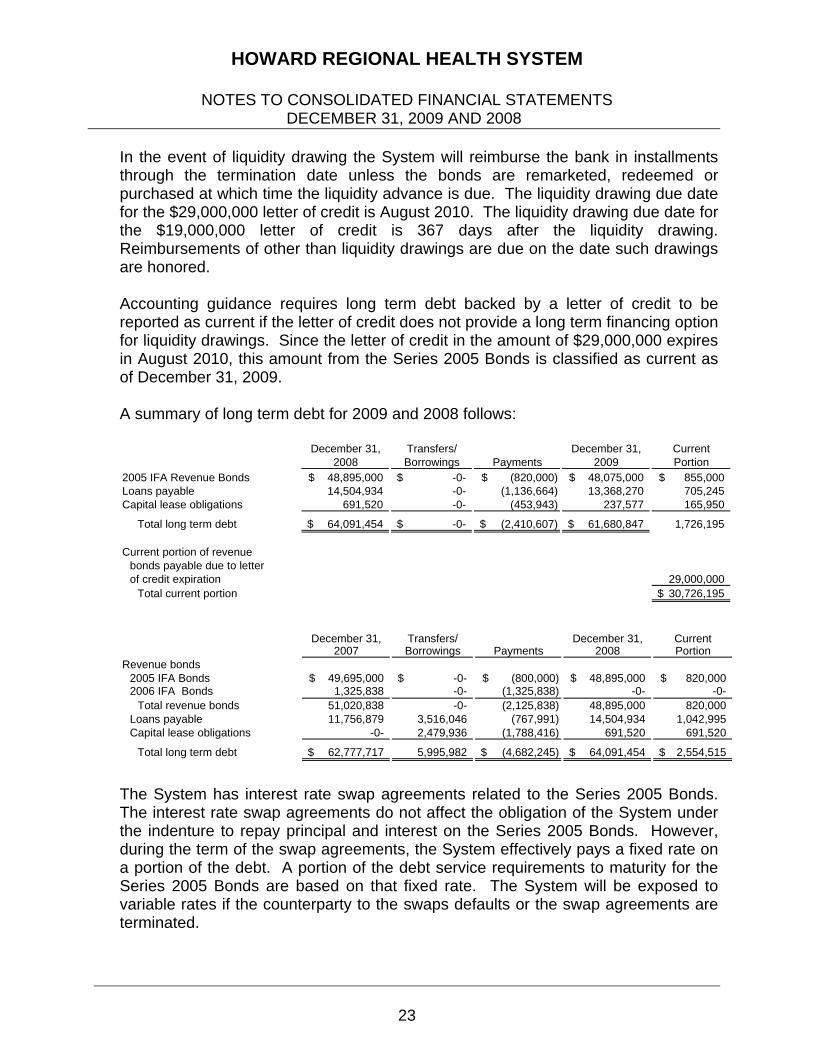
In the event of liquidity drawing the System will reimburse the bank in installments through the termination date unless the bonds are remarketed, redeemed or purchased at which time the liquidity advance is due. The liquidity drawing due date for the $29,000,000 letter of credit is August 2010. The liquidity drawing due date for the $19,000,000 letter of credit is 367 days after the liquidity drawing. Reimbursements of other than liquidity drawings are due on the date such drawings are honored. Accounting guidance requires long term debt backed by a letter of credit to be reported as current if the letter of credit does not provide a long term financing option for liquidity drawings. Since the letter of credit in the amount of $29,000,000 expires in August 2010, this amount from the Series 2005 Bonds is classified as current as of December 31, 2009. A summary of long term debt for 2009 and 2008 follows:
December 31, Transfers/ December 31, Current2008 Borrowings Payments 2009 Portion
2005 IFA Revenue Bonds 48,895,000$ -0-$ (820,000)$ 48,075,000$ 855,000$ Loans payable 14,504,934 -0- (1,136,664) 13,368,270 705,245 Capital lease obligations 691,520 -0- (453,943) 237,577 165,950
Total long term debt 64,091,454$ -0-$ (2,410,607)$ 61,680,847$ 1,726,195
Current portion of revenuebonds payable due to letterof credit expiration 29,000,000
Total current portion 30,726,195$
December 31, Transfers/ December 31, Current2007 Borrowings Payments 2008 Portion
Revenue bonds2005 IFA Bonds 49,695,000$ -0-$ (800,000)$ 48,895,000$ 820,000$ 2006 IFA Bonds 1,325,838 -0- (1,325,838) -0- -0-
Total revenue bonds 51,020,838 -0- (2,125,838) 48,895,000 820,000 Loans payable 11,756,879 3,516,046 (767,991) 14,504,934 1,042,995 Capital lease obligations -0- 2,479,936 (1,788,416) 691,520 691,520
Total long term debt 62,777,717$ 5,995,982 (4,682,245)$ 64,091,454$ 2,554,515$
The System has interest rate swap agreements related to the Series 2005 Bonds. The interest rate swap agreements do not affect the obligation of the System under the indenture to repay principal and interest on the Series 2005 Bonds. However, during the term of the swap agreements, the System effectively pays a fixed rate on a portion of the debt. A portion of the debt service requirements to maturity for the Series 2005 Bonds are based on that fixed rate. The System will be exposed to variable rates if the counterparty to the swaps defaults or the swap agreements are terminated.
HOWARD REGIONAL HEALTH SYSTEM
NOTES TO CONSOLIDATED FINANCIAL STATEMENTS DECEMBER 31, 2009 AND 2008
24
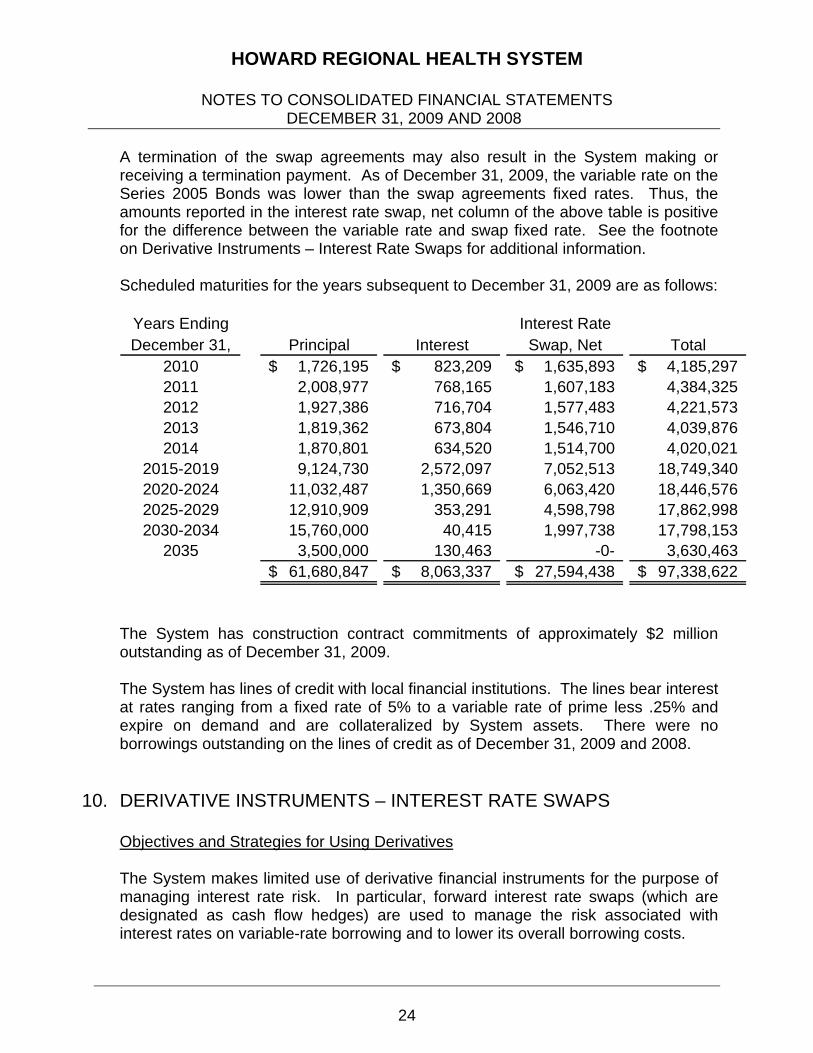
A termination of the swap agreements may also result in the System making or receiving a termination payment. As of December 31, 2009, the variable rate on the Series 2005 Bonds was lower than the swap agreements fixed rates. Thus, the amounts reported in the interest rate swap, net column of the above table is positive for the difference between the variable rate and swap fixed rate. See the footnote on Derivative Instruments – Interest Rate Swaps for additional information. Scheduled maturities for the years subsequent to December 31, 2009 are as follows:
Years Ending Interest RateDecember 31, Principal Interest Swap, Net Total
2010 1,726,195$ 823,209$ 1,635,893$ 4,185,297$ 2011 2,008,977 768,165 1,607,183 4,384,325 2012 1,927,386 716,704 1,577,483 4,221,573 2013 1,819,362 673,804 1,546,710 4,039,876 2014 1,870,801 634,520 1,514,700 4,020,021
2015-2019 9,124,730 2,572,097 7,052,513 18,749,340 2020-2024 11,032,487 1,350,669 6,063,420 18,446,576 2025-2029 12,910,909 353,291 4,598,798 17,862,998 2030-2034 15,760,000 40,415 1,997,738 17,798,153
2035 3,500,000 130,463 -0- 3,630,463 61,680,847$ 8,063,337$ 27,594,438$ 97,338,622$
The System has construction contract commitments of approximately $2 million outstanding as of December 31, 2009. The System has lines of credit with local financial institutions. The lines bear interest at rates ranging from a fixed rate of 5% to a variable rate of prime less .25% and expire on demand and are collateralized by System assets. There were no borrowings outstanding on the lines of credit as of December 31, 2009 and 2008.
10. DERIVATIVE INSTRUMENTS – INTEREST RATE SWAPS
Objectives and Strategies for Using Derivatives The System makes limited use of derivative financial instruments for the purpose of managing interest rate risk. In particular, forward interest rate swaps (which are designated as cash flow hedges) are used to manage the risk associated with interest rates on variable-rate borrowing and to lower its overall borrowing costs.

HOWARD REGIONAL HEALTH SYSTEM
NOTES TO CONSOLIDATED FINANCIAL STATEMENTS DECEMBER 31, 2009 AND 2008
25
On October 3, 2005, the System entered into two interest rate swap agreements with a financial institution for a total principal amount of $40,000,000. The agreements effectively change the System’s interest rate exposure on a portion of its issued Series 2005 Bonds to a fixed 3.55%. The agreements expire January 1, 2035. The System is exposed to credit loss in the event of nonperformance by the other parties to the interest rate swap agreements. However, the System does not anticipate nonperformance by the counterparties.
The derivatives are not designated as hedging instruments, and are marked-to-market on the consolidated balance sheets at fair value. As of December 31, 2009 and 2008, the fair value of the total derivative liability was $2,756,524 and $8,522,120, respectively. The related gain/loss in the consolidated statements of revenues and expenses is included as a component of nonoperating revenues/expenses for the reporting period. During 2009, the System recorded a gain on derivatives of $5,765,596 and a loss on derivatives of $7,659,767 for 2008. See the Fair Value Measurements and Long Term Debt footnotes for additional information.
11. PENSION PLAN The System has a defined contribution pension plan as authorized by IC 16-22-3-11. The plan provides retirement, disability and death benefits to plan members and beneficiaries. The plan was established by written agreement between the System’s Board of Trustees and the plan administrator. The plan administrator issues a publicly available financial report that includes financial statements and required supplementary information of the plan. Contact the System’s human resource department for information on the plan Total pension expense for 2009 and 2008 was $2,634,347 and $2,413,215, respectively. The current employer contribution rate is 6% of annual covered payroll.
12. COMMITMENTS AND CONTINGENCIES
Operating Leases Leases that do not meet the criteria for capitalization are classified as operating leases with related rentals charged to operations as incurred. Leases expire through 2012. Total rental expense in 2009 and 2008 for all operating leases was $4,725,160 and $4,508,242, respectively.
HOWARD REGIONAL HEALTH SYSTEM
NOTES TO CONSOLIDATED FINANCIAL STATEMENTS DECEMBER 31, 2009 AND 2008
26
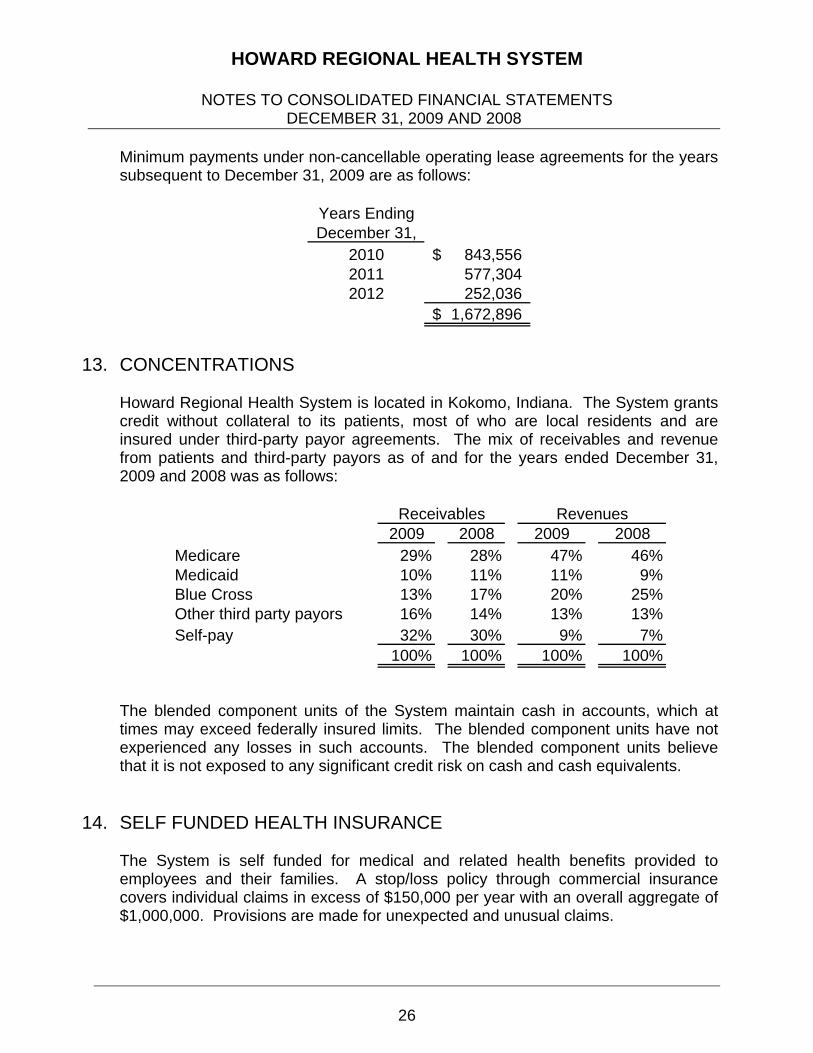
Minimum payments under non-cancellable operating lease agreements for the years subsequent to December 31, 2009 are as follows:
Years EndingDecember 31,
2010 843,556$ 2011 577,304 2012 252,036
1,672,896$
13. CONCENTRATIONS
Howard Regional Health System is located in Kokomo, Indiana. The System grants credit without collateral to its patients, most of who are local residents and are insured under third-party payor agreements. The mix of receivables and revenue from patients and third-party payors as of and for the years ended December 31, 2009 and 2008 was as follows:
2009 2008 2009 2008Medicare 29% 28% 47% 46%Medicaid 10% 11% 11% 9%Blue Cross 13% 17% 20% 25%Other third party payors 16% 14% 13% 13%Self-pay 32% 30% 9% 7%
100% 100% 100% 100%
Receivables Revenues
The blended component units of the System maintain cash in accounts, which at times may exceed federally insured limits. The blended component units have not experienced any losses in such accounts. The blended component units believe that it is not exposed to any significant credit risk on cash and cash equivalents.
14. SELF FUNDED HEALTH INSURANCE
The System is self funded for medical and related health benefits provided to employees and their families. A stop/loss policy through commercial insurance covers individual claims in excess of $150,000 per year with an overall aggregate of $1,000,000. Provisions are made for unexpected and unusual claims.

HOWARD REGIONAL HEALTH SYSTEM
NOTES TO CONSOLIDATED FINANCIAL STATEMENTS DECEMBER 31, 2009 AND 2008
27
Claim expenditures and liabilities are reported when it is probable that a loss has occurred and the amount of the loss can be reasonably estimated. These losses include an estimate of claims that have been incurred but not reported. Self funded health insurance and related expenses were $6,768,466 and $6,728,334 in 2009 and 2008, respectively. A progression of unpaid claims for 2009 and 2008 follows:
2009 2008
Unpaid claims, beginning of year 1,055,318$ 1,162,889$ Incurred claims and changes in estimates 6,768,466 6,728,334Claim payments (6,754,561) (6,835,905)
Unpaid claims, end of year 1,069,223$ 1,055,318$
15. INVESTMENTS IN AFFILIATED COMPANIES
North Central Indiana Linen Service, Inc. The System owns 33% of North Central Indiana Linen Service. The investment is accounted for under the equity method. Summarized financial information as of December 31 follows:
2009 2008Assets 1,192,049$ 1,139,875$ Liabilities 207,722$ 164,572$ Equity 984,327$ 975,303$ Revenue 1,394,421$ 1,560,461$ Expenses 1,385,397$ 1,458,519$ Net income 9,024$ 101,942$
HOWARD REGIONAL HEALTH SYSTEM
NOTES TO CONSOLIDATED FINANCIAL STATEMENTS DECEMBER 31, 2009 AND 2008
28
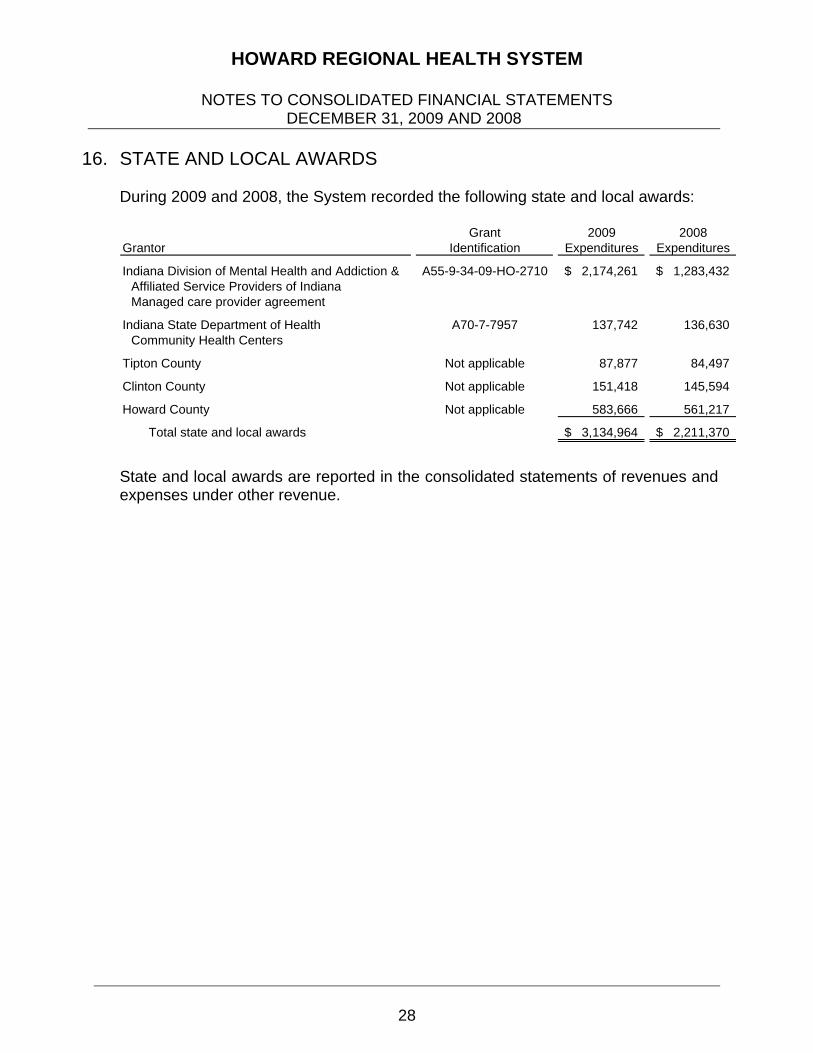
16. STATE AND LOCAL AWARDS
During 2009 and 2008, the System recorded the following state and local awards:
Grant 2009 2008Grantor Identification Expenditures Expenditures
Indiana Division of Mental Health and Addiction & A55-9-34-09-HO-2710 2,174,261$ 1,283,432$ Affiliated Service Providers of IndianaManaged care provider agreement
Indiana State Department of Health A70-7-7957 137,742 136,630 Community Health Centers
Tipton County Not applicable 87,877 84,497
Clinton County Not applicable 151,418 145,594
Howard County Not applicable 583,666 561,217
Total state and local awards 3,134,964$ 2,211,370$
State and local awards are reported in the consolidated statements of revenues and expenses under other revenue.

SUPPLEMENTARY INFORMATION

HOWARD REGIONAL HEALTH SYSTEM
CONSOLIDATING BALANCE SHEETS DECEMBER 31, 2009
See report of independent auditors on pages 1 and 2. 29
Howard Howard Howard Imaging CenterASSETS Regional HRHS Regional Kokomo Community of North
Health System Foundation Specialty Care Sports Center Surgery Center Central Indiana Eliminations TotalCurrent assets
Cash and cash equivalents 8,352,860$ 771,828$ 1,181,917$ 67,662$ 1,638,313$ 237,715$ -0-$ 12,250,295$ Investments 16,811,397 2,339,094 -0- -0- -0- -0- -0- 19,150,491 Patient accounts receivable, net 18,717,611 -0- 1,069,121 -0- -0- 177,313 -0- 19,964,045 Other receivables 3,823,725 61,851 3,597 14,060 1,243,254 -0- (2,576,237) 2,570,250 Inventory and other current assets 5,474,017 -0- 291,816 11,012 449,280 32,605 -0- 6,258,730 Estimated third party settlements 200,909 -0- -0- -0- -0- -0- -0- 200,909 Current portion of assets whose use is limited 7,683,210 -0- -0- -0- -0- -0- -0- 7,683,210
Total current assets 61,063,729 3,172,773 2,546,451 92,734 3,330,847 447,633 (2,576,237) 68,077,930
Assets whose use is limitedInternally designated 7,683,210 -0- -0- -0- -0- -0- -0- 7,683,210 Held by trustee -0- 74,877 -0- -0- -0- -0- -0- 74,877
Total assets whose use is limited 7,683,210 74,877 -0- -0- -0- -0- -0- 7,758,087 Less current portion of assets whose use is limited 7,683,210 -0- -0- -0- -0- -0- -0- 7,683,210
Noncurrent portion of assets whose use is limited -0- 74,877 -0- -0- -0- -0- -0- 74,877
Capital assets, net 79,005,685 187 599,566 684,969 527,845 3,194,415 -0- 84,012,667 Other assets 4,823,511 830,066 730,370 -0- -0- -0- (4,616,198) 1,767,749
Total assets 144,892,925$ 4,077,903$ 3,876,387$ 777,703$ 3,858,692$ 3,642,048$ (7,192,435)$ 153,933,223$
HOWARD REGIONAL HEALTH SYSTEM
CONSOLIDATING BALANCE SHEETS DECEMBER 31, 2009
See report of independent auditors on pages 1 and 2. 30
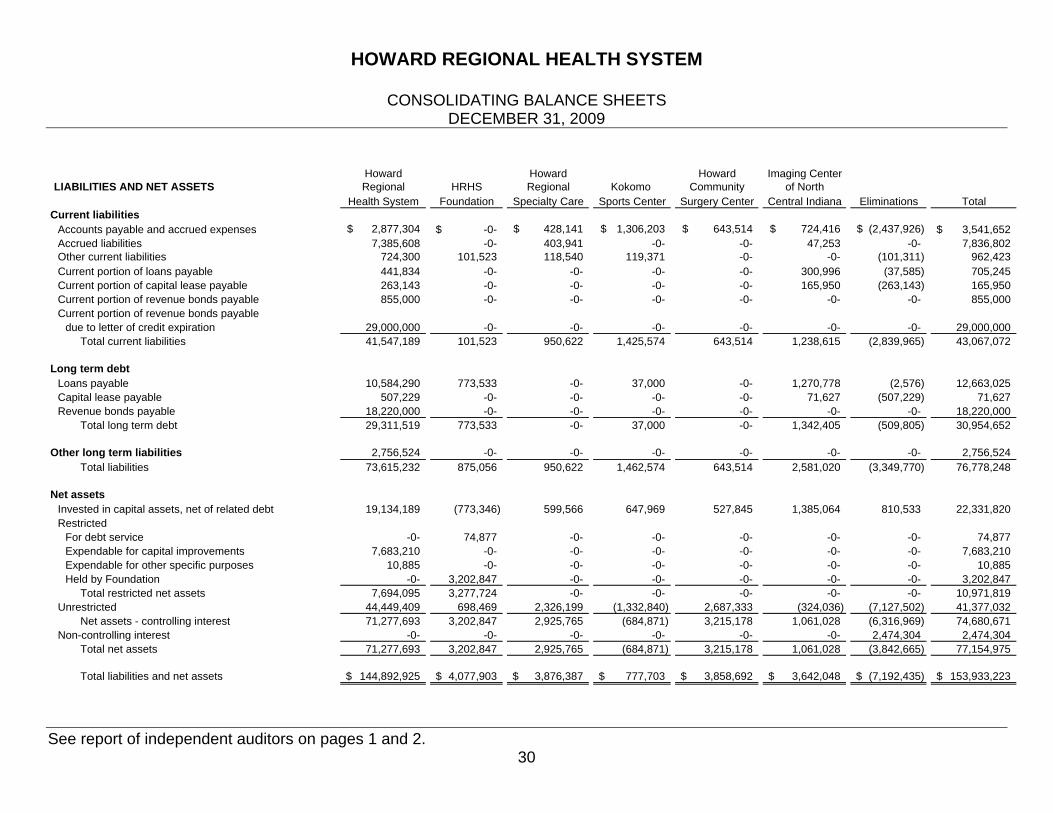
Howard Howard Howard Imaging CenterLIABILITIES AND NET ASSETS Regional HRHS Regional Kokomo Community of North
Health System Foundation Specialty Care Sports Center Surgery Center Central Indiana Eliminations TotalCurrent liabilities
Accounts payable and accrued expenses 2,877,304$ -0-$ 428,141$ 1,306,203$ 643,514$ 724,416$ (2,437,926)$ 3,541,652$ Accrued liabilities 7,385,608 -0- 403,941 -0- -0- 47,253 -0- 7,836,802 Other current liabilities 724,300 101,523 118,540 119,371 -0- -0- (101,311) 962,423 Current portion of loans payable 441,834 -0- -0- -0- -0- 300,996 (37,585) 705,245 Current portion of capital lease payable 263,143 -0- -0- -0- -0- 165,950 (263,143) 165,950 Current portion of revenue bonds payable 855,000 -0- -0- -0- -0- -0- -0- 855,000 Current portion of revenue bonds payable
due to letter of credit expiration 29,000,000 -0- -0- -0- -0- -0- -0- 29,000,000 Total current liabilities 41,547,189 101,523 950,622 1,425,574 643,514 1,238,615 (2,839,965) 43,067,072
Long term debtLoans payable 10,584,290 773,533 -0- 37,000 -0- 1,270,778 (2,576) 12,663,025 Capital lease payable 507,229 -0- -0- -0- -0- 71,627 (507,229) 71,627 Revenue bonds payable 18,220,000 -0- -0- -0- -0- -0- -0- 18,220,000
Total long term debt 29,311,519 773,533 -0- 37,000 -0- 1,342,405 (509,805) 30,954,652
Other long term liabilities 2,756,524 -0- -0- -0- -0- -0- -0- 2,756,524 Total liabilities 73,615,232 875,056 950,622 1,462,574 643,514 2,581,020 (3,349,770) 76,778,248
Net assetsInvested in capital assets, net of related debt 19,134,189 (773,346) 599,566 647,969 527,845 1,385,064 810,533 22,331,820 Restricted
For debt service -0- 74,877 -0- -0- -0- -0- -0- 74,877 Expendable for capital improvements 7,683,210 -0- -0- -0- -0- -0- -0- 7,683,210 Expendable for other specific purposes 10,885 -0- -0- -0- -0- -0- -0- 10,885 Held by Foundation -0- 3,202,847 -0- -0- -0- -0- -0- 3,202,847
Total restricted net assets 7,694,095 3,277,724 -0- -0- -0- -0- -0- 10,971,819 Unrestricted 44,449,409 698,469 2,326,199 (1,332,840) 2,687,333 (324,036) (7,127,502) 41,377,032
Net assets - controlling interest 71,277,693 3,202,847 2,925,765 (684,871) 3,215,178 1,061,028 (6,316,969) 74,680,671 Non-controlling interest -0- -0- -0- -0- -0- -0- 2,474,304 2,474,304
Total net assets 71,277,693 3,202,847 2,925,765 (684,871) 3,215,178 1,061,028 (3,842,665) 77,154,975
Total liabilities and net assets 144,892,925$ 4,077,903$ 3,876,387$ 777,703$ 3,858,692$ 3,642,048$ (7,192,435)$ 153,933,223$
HOWARD REGIONAL HEALTH SYSTEM
CONSOLIDATING STATEMENTS OF REVENUES AND EXPENSES YEAR ENDED DECEMBER 31, 2009
See report of independent auditors on pages 1 and 2. 31
Howard Howard Howard Imaging CenterRegional HRHS Regional Kokomo Community of North
Health System Foundation Specialty Care Sports Center Surgery Center Central Indiana Eliminations TotalRevenues
Net patient service revenue 117,293,528$ -0-$ 13,451,256$ -0-$ 10,211,110$ 2,757,777$ -0-$ 143,713,671$ Other 14,080,938 50,172 894,901 453,612 -0- 17,885 (1,344,151) 14,153,357
Total revenues 131,374,466 50,172 14,346,157 453,612 10,211,110 2,775,662 (1,344,151) 157,867,028
Operating expensesSalaries and wages 53,612,778 -0- 7,323,380 -0- 2,978,090 676,892 -0- 64,591,140Employee benefits 12,756,588 -0- 1,839,476 -0- -0- 32,500 -0- 14,628,564Medical professional fees 4,708,257 -0- 686,653 21,720 -0- 310,747 -0- 5,727,377
Medical supplies and drugs 24,135,446 -0- 832,536 34,676 2,409,567 157,956 -0- 27,570,181Purchased services 8,430,954 -0- 757,514 458,183 426,753 231,319 (234,228) 10,070,495Equipment rentals 6,395,439 -0- 1,100,913 17,757 1,036,019 764,357 (1,059,945) 8,254,540
Utilities and telephone 2,454,050 -0- 364,154 44,804 61,616 126,352 -0- 3,050,976Insurance 987,836 -0- 69,923 10,773 37,503 45,690 -0- 1,151,725Depreciation and amortization 8,886,429 -0- 215,833 87,405 207,063 512,577 -0- 9,909,307Other 8,835,153 -0- 146,522 73,531 247,203 105,221 -0- 9,407,630
Total expenses 131,202,930 -0- 13,336,904 748,849 7,403,814 2,963,611 (1,294,173) 154,361,935
Operating income (loss) 171,536 50,172 1,009,253 (295,237) 2,807,296 (187,949) (49,978) 3,505,093
Nonoperating revenues (expenses)Investment income 4,261,056 547,373 -0- 0 6,831 8 -0- 4,815,268 Interest expense (3,161,009) -0- -0- (109) -0- (55,002) 49,978 (3,166,142) Unrealized gain on derivatives 5,765,596 -0- -0- -0- -0- -0- -0- 5,765,596 Other nonoperating revenues (expenses) 1,310,387 (306,576) 9,546 -0- -0- 233,978 (1,890,735) (643,400)
Nonoperating revenues (expenses), net 8,176,030 240,797 9,546 (109) 6,831 178,984 (1,840,757) 6,771,322
Consolidated change in net assets 8,347,566 290,969 1,018,799 (295,346) 2,814,127 (8,965) (1,890,735) 10,276,415
Less amount attributable to non-controlling interest -0- -0- -0- -0- -0- -0- (1,721,258) (1,721,258)
Change in net assets attributable to controlling intererst 8,347,566$ 290,969$ 1,018,799$ (295,346)$ 2,814,127$ (8,965)$ (3,611,993)$ 8,555,157$

HOWARD REGIONAL HEALTH SYSTEM
CONSOLIDATING BALANCE SHEETS DECEMBER 31, 2008
See report of independent auditors on pages 1 and 2. 32
Howard Howard Howard Imaging CenterASSETS Regional HRHS Regional Kokomo Community of North
Health System Foundation Specialty Care Sports Center Surgery Center Central Indiana Eliminations TotalCurrent assets
Cash and cash equivalents 8,474,642$ 1,025,376$ 1,280,111$ 93,326$ 1,063,743$ 171$ -0-$ 11,937,369$ Investments 13,851,390 1,823,377 -0- -0- -0- -0- -0- 15,674,767 Patient accounts receivable, net 19,575,388 -0- 1,338,089 -0- -0- 218,632 -0- 21,132,109 Other receivables 3,213,723 41,067 14,860 14,010 1,414,453 5,329 (1,646,600) 3,056,842 Inventory and other current assets 5,162,377 -0- 213,445 -0- 347,089 32,709 -0- 5,755,620 Estimated third party settlements 122,728 -0- -0- -0- -0- -0- -0- 122,728 Current portion of assets whose use is limited 820,000 -0- -0- -0- -0- -0- -0- 820,000
Total current assets 51,220,248 2,889,820 2,846,505 107,336 2,825,285 256,841 (1,646,600) 58,499,435
Assets whose use is limitedInternally designated 6,409,051 -0- -0- -0- -0- -0- -0- 6,409,051 Held by trustee 1,835,033 67,109 -0- -0- -0- -0- -0- 1,902,142
Total assets whose use is limited 8,244,084 67,109 -0- -0- -0- -0- -0- 8,311,193 Less current portion of assets whose use is limited 820,000 -0- -0- -0- -0- -0- -0- 820,000
Noncurrent portion of assets whose use is limited 7,424,084 67,109 -0- -0- -0- -0- -0- 7,491,193
Capital assets, net 84,056,906 289 645,562 705,483 535,333 3,375,035 -0- 89,318,608 Other assets 4,814,872 1,239,564 798,146 -0- -0- -0- (4,465,426) 2,387,156
Total assets 147,516,110$ 4,196,782$ 4,290,213$ 812,819$ 3,360,618$ 3,631,876$ (6,112,026)$ 157,696,392$

HOWARD REGIONAL HEALTH SYSTEM
CONSOLIDATING BALANCE SHEETS DECEMBER 31, 2008
See report of independent auditors on pages 1 and 2. 33
Howard Howard Howard Imaging CenterLIABILITIES AND NET ASSETS Regional HRHS Regional Kokomo Community of North
Health System Foundation Specialty Care Sports Center Surgery Center Central Indiana Eliminations TotalCurrent liabilities
Accounts payable and accrued expenses 3,734,279$ -0-$ 429,208$ 1,065,826$ 621,566$ 120,278$ (1,502,532)$ 4,468,625$ Accrued liabilities and other 9,476,453 -0- 719,250 -0- -0- 77,763 -0- 10,273,466 Other current liabilities 1,380,319 174,100 129,789 99,518 -0- 47,151 (205,773) 1,625,104 Current portion of loans payable 417,241 241,312 -0- -0- -0- 384,442 -0- 1,042,995 Current portion of capital lease payable 273,312 -0- -0- -0- -0- 659,520 (241,312) 691,520 Current portion of revenue bonds payable 820,000 -0- -0- -0- -0- -0- -0- 820,000
Total current liabilities 16,101,604 415,412 1,278,247 1,165,344 621,566 1,289,154 (1,949,617) 18,921,710
Long term debtLoans payable 11,019,717 869,493 -0- 37,000 -0- 1,572,729 (37,000) 13,461,939 Capital lease payable 867,547 -0- -0- -0- -0- -0- (867,547) -0- Revenue bonds payable 48,075,000 -0- -0- -0- -0- -0- -0- 48,075,000
Total long term debt 59,962,264 869,493 -0- 37,000 -0- 1,572,729 (904,547) 61,536,939
Other long term liabilities 8,522,120 -0- -0- -0- -0- -0- -0- 8,522,120 Total liabilities 84,585,988 1,284,905 1,278,247 1,202,344 621,566 2,861,883 (2,854,164) 88,980,769
Net assetsInvested in capital assets, net of related debt 22,584,089 (1,110,516) 645,562 668,483 535,333 758,344 1,145,859 25,227,154 Restricted
For debt service 1,835,033 67,109 -0- -0- -0- -0- -0- 1,902,142 Expendable for capital improvements 6,409,051 -0- -0- -0- -0- -0- -0- 6,409,051 Expendable for other specific purposes 10,885 -0- -0- -0- -0- -0- -0- 10,885 Held by Foundation -0- 2,911,877 -0- -0- -0- -0- -0- 2,911,877
Total restricted net assets 8,254,969 2,978,986 -0- -0- -0- -0- -0- 11,233,955 Unrestricted 32,091,064 1,043,407 2,366,404 (1,058,008) 2,203,719 11,649 (6,993,830) 29,664,405
Net assets - controlling interest 62,930,122 2,911,877 3,011,966 (389,525) 2,739,052 769,993 (5,847,971) 66,125,514 Non-controlling interest -0- -0- -0- -0- -0- -0- 2,590,109 2,590,109
Total net assets 62,930,122 2,911,877 3,011,966 (389,525) 2,739,052 769,993 (3,257,862) 68,715,623
Total liabilities and net assets 147,516,110$ 4,196,782$ 4,290,213$ 812,819$ 3,360,618$ 3,631,876$ (6,112,026)$ 157,696,392$
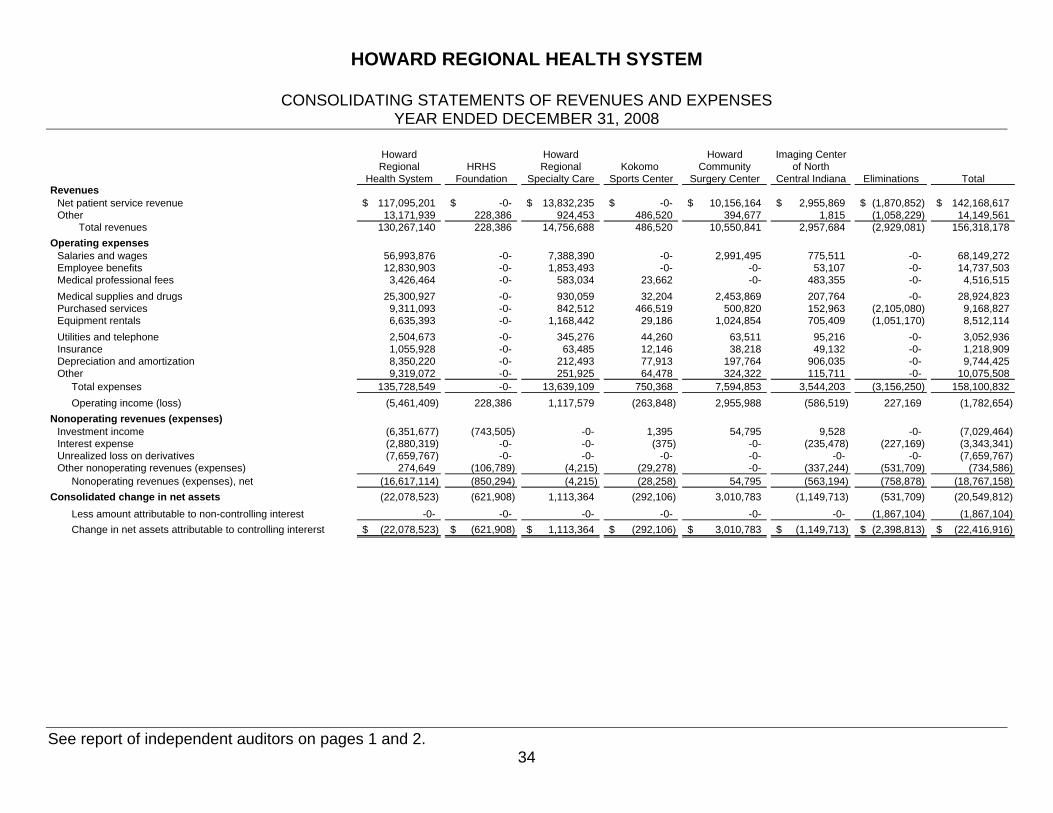
HOWARD REGIONAL HEALTH SYSTEM
CONSOLIDATING STATEMENTS OF REVENUES AND EXPENSES YEAR ENDED DECEMBER 31, 2008
See report of independent auditors on pages 1 and 2. 34
Howard Howard Howard Imaging CenterRegional HRHS Regional Kokomo Community of North
Health System Foundation Specialty Care Sports Center Surgery Center Central Indiana Eliminations TotalRevenues
Net patient service revenue 117,095,201$ -0-$ 13,832,235$ -0-$ 10,156,164$ 2,955,869$ (1,870,852)$ 142,168,617$ Other 13,171,939 228,386 924,453 486,520 394,677 1,815 (1,058,229) 14,149,561
Total revenues 130,267,140 228,386 14,756,688 486,520 10,550,841 2,957,684 (2,929,081) 156,318,178
Operating expensesSalaries and wages 56,993,876 -0- 7,388,390 -0- 2,991,495 775,511 -0- 68,149,272Employee benefits 12,830,903 -0- 1,853,493 -0- -0- 53,107 -0- 14,737,503Medical professional fees 3,426,464 -0- 583,034 23,662 -0- 483,355 -0- 4,516,515
Medical supplies and drugs 25,300,927 -0- 930,059 32,204 2,453,869 207,764 -0- 28,924,823Purchased services 9,311,093 -0- 842,512 466,519 500,820 152,963 (2,105,080) 9,168,827Equipment rentals 6,635,393 -0- 1,168,442 29,186 1,024,854 705,409 (1,051,170) 8,512,114
Utilities and telephone 2,504,673 -0- 345,276 44,260 63,511 95,216 -0- 3,052,936Insurance 1,055,928 -0- 63,485 12,146 38,218 49,132 -0- 1,218,909Depreciation and amortization 8,350,220 -0- 212,493 77,913 197,764 906,035 -0- 9,744,425Other 9,319,072 -0- 251,925 64,478 324,322 115,711 -0- 10,075,508
Total expenses 135,728,549 -0- 13,639,109 750,368 7,594,853 3,544,203 (3,156,250) 158,100,832
Operating income (loss) (5,461,409) 228,386 1,117,579 (263,848) 2,955,988 (586,519) 227,169 (1,782,654)
Nonoperating revenues (expenses)Investment income (6,351,677) (743,505) -0- 1,395 54,795 9,528 -0- (7,029,464) Interest expense (2,880,319) -0- -0- (375) -0- (235,478) (227,169) (3,343,341) Unrealized loss on derivatives (7,659,767) -0- -0- -0- -0- -0- -0- (7,659,767) Other nonoperating revenues (expenses) 274,649 (106,789) (4,215) (29,278) -0- (337,244) (531,709) (734,586)
Nonoperating revenues (expenses), net (16,617,114) (850,294) (4,215) (28,258) 54,795 (563,194) (758,878) (18,767,158)
Consolidated change in net assets (22,078,523) (621,908) 1,113,364 (292,106) 3,010,783 (1,149,713) (531,709) (20,549,812)
Less amount attributable to non-controlling interest -0- -0- -0- -0- -0- -0- (1,867,104) (1,867,104)
Change in net assets attributable to controlling intererst (22,078,523)$ (621,908)$ 1,113,364$ (292,106)$ 3,010,783$ (1,149,713)$ (2,398,813)$ (22,416,916)$