state of the science: methods collect and use data€¦ · state of the science: methods to collect...
TRANSCRIPT

State of the Science: Methods to Collect and Use
Patient Preference Data Overview of methods to collect patient
preference information and active research regarding patient collecting patient preferences.
For the online webcast: Please submit your questions to the panel via the chat box. The
online hosts will be collecting the questions during the session
to be brought to the panel
moderator during the panel discussion.

Moderator:
Telba Irony, Ph.D.Chief, General Surgical Devices BranchCDRH/Office of Surveillance and Biometrics
Panel:
A. Brett Hauber, Ph.D.Research Triangle Institute (RTI‐Health Solutions)
Bennett Levitan, M.D., Ph.D.Janssen Research & Development (Johnson and
Johnson)
Sonal Singh, M.D., M.P.H.Johns Hopkins University
Scott Braithwaite, M.D. Society of Medical Decision Making (SMDM)

Methods for Eliciting Benefit-Risk Preference Data
Patient Preference Initiative Symposium
A. Brett Hauber, Ph.D.
Senior Economics and Vice President
Health Preference Assessment
September 18September 18--19, 201319, 2013
44 4
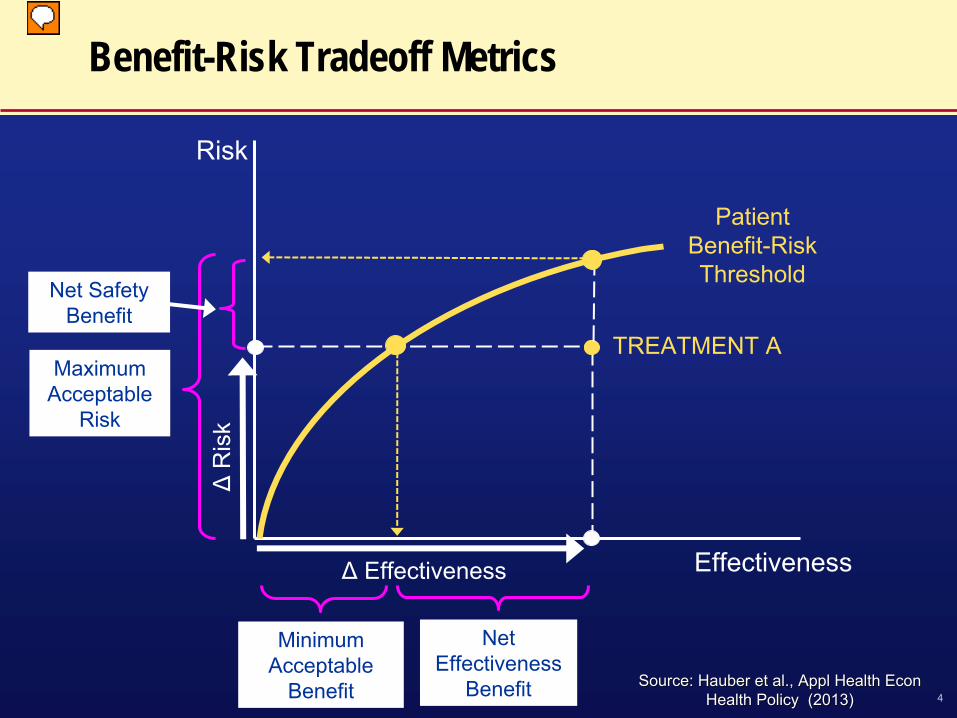
Benefit-Risk Tradeoff Metrics
Risk
EffectivenessΔ
Effectiveness
ΔR
isk
Net Effectiveness
Benefit
Maximum Acceptable
Risk
Minimum Acceptable
Benefit
Net Safety Benefit
Patient Benefit-Risk Threshold
TREATMENT A
Source: Hauber et al., Appl Health Econ Source: Hauber et al., Appl Health Econ Health Policy (2013)Health Policy (2013)
55
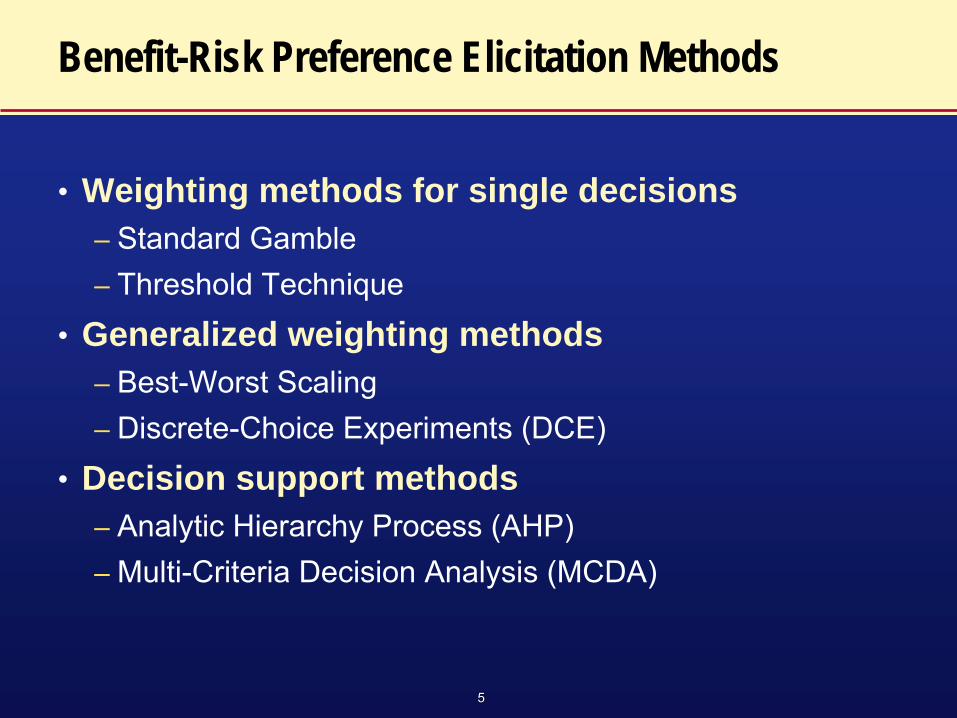
Benefit-Risk Preference Elicitation Methods
•
Weighting methods for single decisions–
Standard Gamble–
Threshold Technique
•
Generalized weighting methods–
Best-Worst Scaling–
Discrete-Choice Experiments (DCE)
•
Decision support methods–
Analytic Hierarchy Process (AHP)–
Multi-Criteria Decision Analysis (MCDA)

66
Benefit-Risk Preference Elicitation Methods
•
Weighting methods for single decisions–
Standard Gamble–
Threshold Technique

77
??
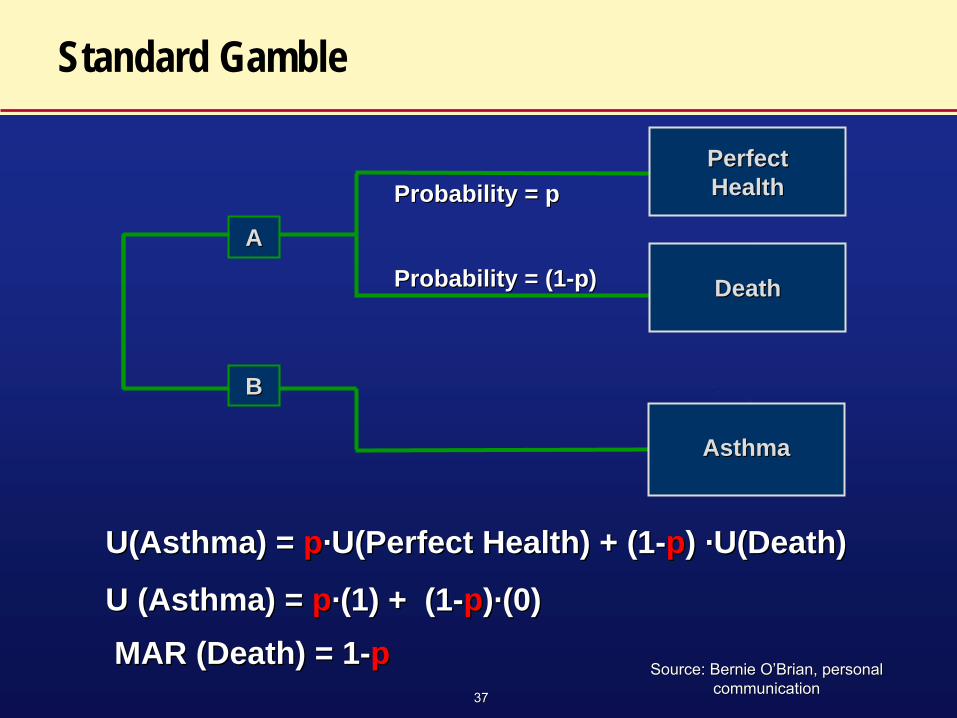
Standard Gamble
U(Asthma) = U(Asthma) = pp··U(Perfect Health) + (1U(Perfect Health) + (1--pp) ) ··U(Death)U(Death)
U (Asthma) = U (Asthma) = pp··(1) + (1(1) + (1--pp))··(0)(0) MAR (Death) = 1MAR (Death) = 1--pp
Probability = pProbability = p
Probability = (1Probability = (1--p)p)AA
BB
Perfect Perfect HealthHealth
DeathDeath
AsthmaAsthma
Source: Bernie OSource: Bernie O’’Brian, personal Brian, personal communicationcommunication

88
Threshold Technique
Source: Kopec JA et al., Source: Kopec JA et al., J. Clin Epidemiol (2007)J. Clin Epidemiol (2007)
Less painLess pain
Greater Greater hypertension hypertension
riskrisk
99
Benefit-Risk Preference Elicitation Methods
•
Generalized weighting methods–
Best-Worst Scaling–
Discrete-Choice Experiments (DCE)
1010
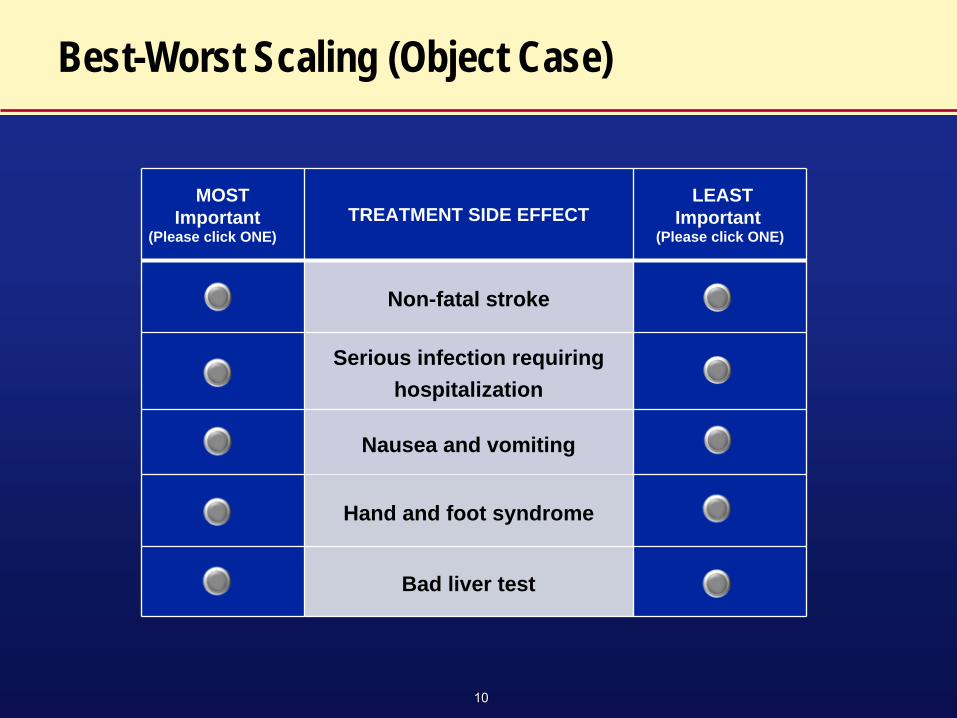
Best-Worst Scaling (Object Case)
MOSTImportant
(Please click ONE)TREATMENT SIDE EFFECT
LEASTImportant
(Please click ONE)
Non-fatal stroke
Serious infection requiring hospitalization
Nausea and vomiting
Hand and foot syndrome
Bad liver test

1111
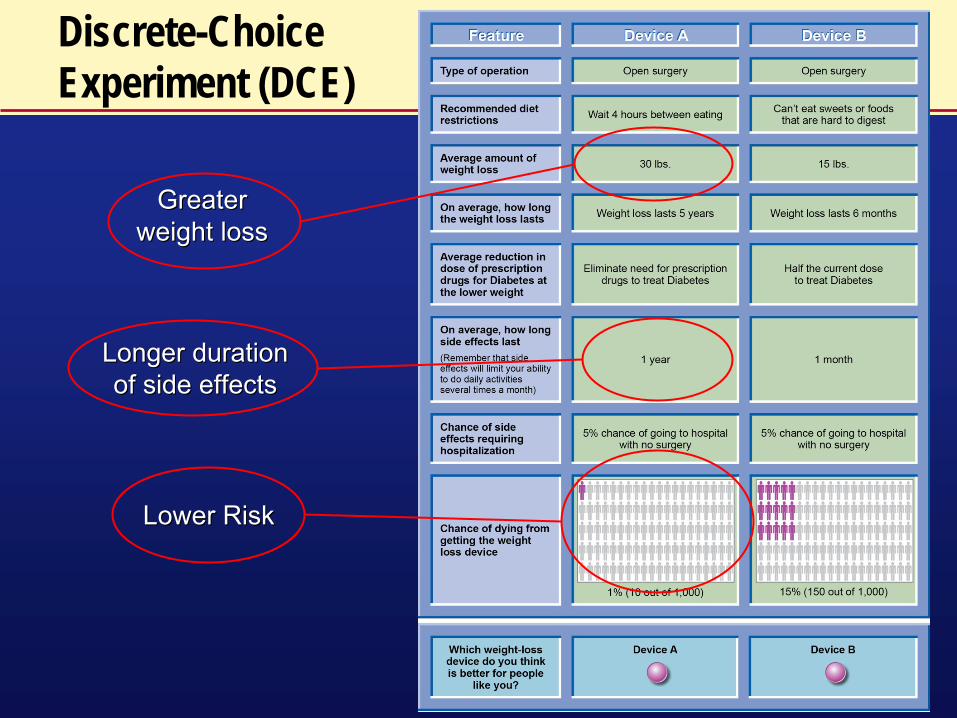
Discrete-Choice Experiment (DCE)
Greater Greater weight lossweight loss
Longer duration Longer duration of side effectsof side effects
Lower RiskLower Risk

1212
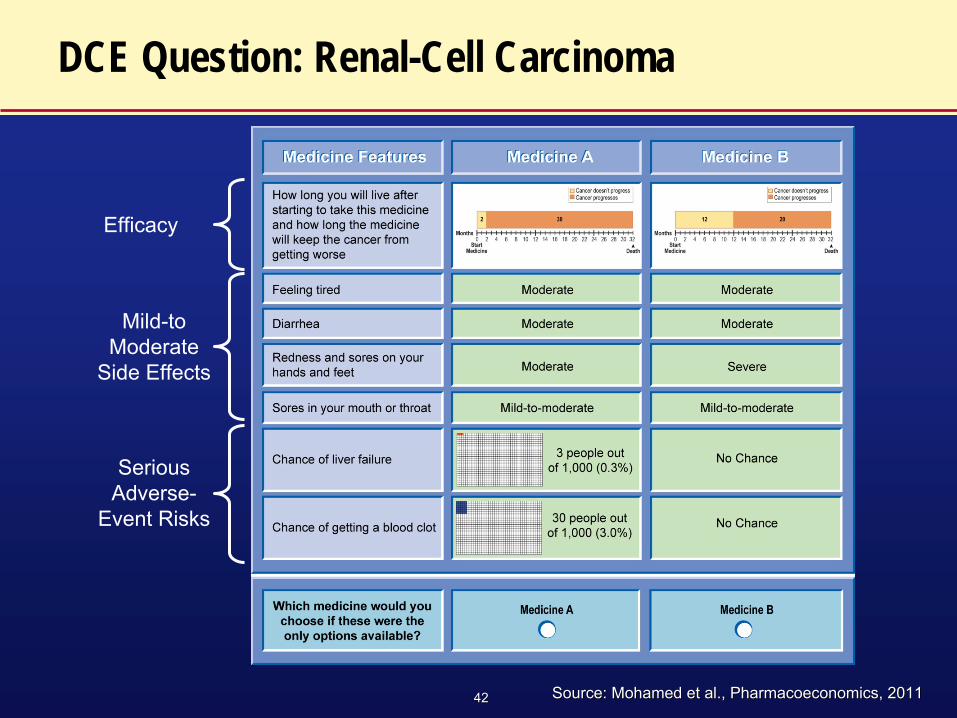
DCE Question: Renal-Cell Carcinoma
Efficacy
Mild-to Moderate
Side Effects
Serious Adverse-
Event Risks
Source: Mohamed et al., Pharmacoeconomics, 2011Source: Mohamed et al., Pharmacoeconomics, 2011
1313
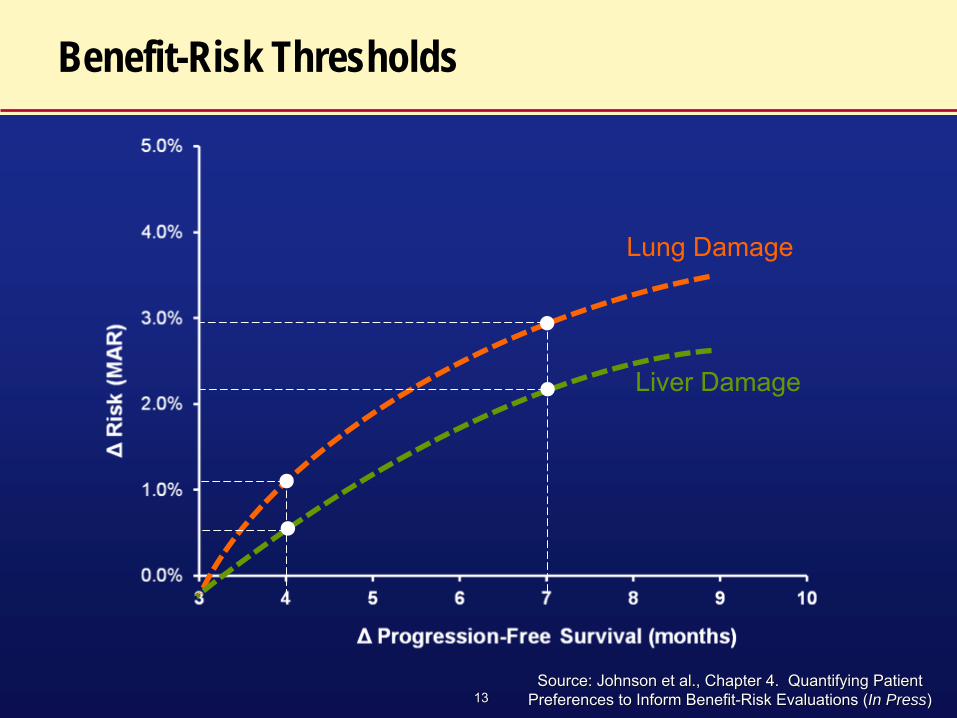
Benefit-Risk Thresholds
Lung Damage
Liver Damage
Source: Johnson et al., Chapter 4. Quantifying Patient Source: Johnson et al., Chapter 4. Quantifying Patient Preferences to Inform BenefitPreferences to Inform Benefit--Risk Evaluations (Risk Evaluations (In PressIn Press) )

1414
Benefit-Risk Preference Elicitation Methods
•
Decision support methods–
Analytic Hierarchy Process (AHP)–
Multi-Criteria Decision Analysis (MCDA)

1515
Criterion 1 Criterion 2 Criterion 3 Criterion 4 Criterion 5
Alternative 1 a1
c1 a1
c2 a1
c3 a1
c4 a1
c5
Alternative 2 a2
c1 a2
c2 a2
c3 a2
c4 a2
c5
Alternative 3 a3
c1 a3
c2 a3
c3 a3
c4 a3
c5
Alternative 4 a4
c1 a4
c2 a4
c3 a4
c4 a4
c5
Alternative 5 a5
c1 a5
c2 a5
c3 a5
c4 a5
c5
Weights W1 W2 W3 W4 W5
where awhere aii
ccjj
is the criteria score (performance) of alternative is the criteria score (performance) of alternative ii on criterion on criterion jj
WWjj
aaii
ccjjValue for Value for
alternative ialternative i== ΣΣ
j=1j=1--nn
Multi-Criteria Decision Analysis (MCDA)
1616
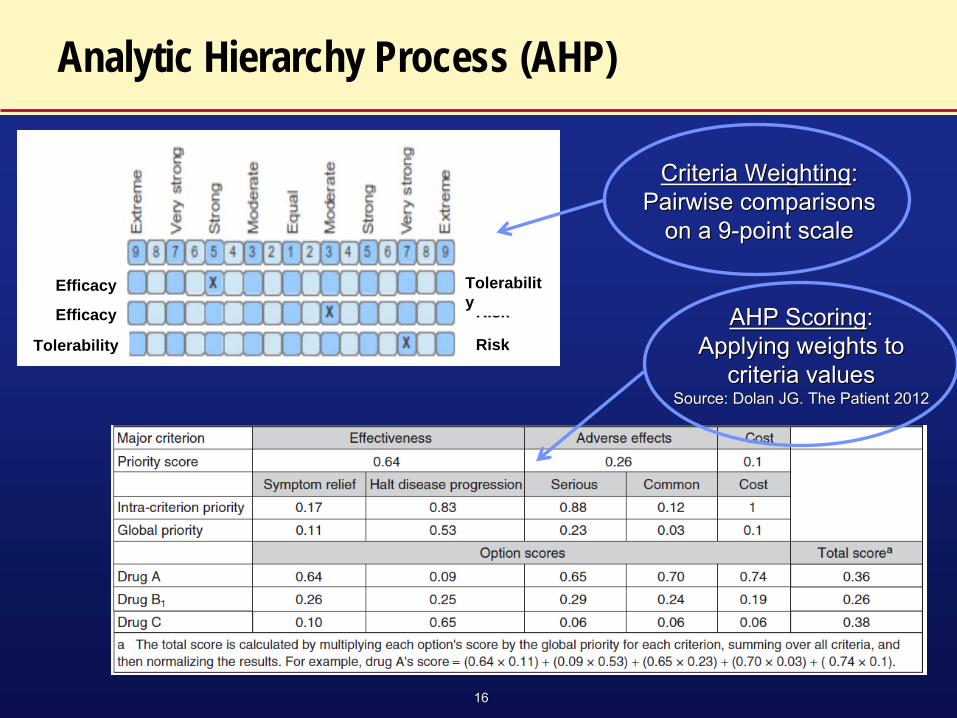
Analytic Hierarchy Process (AHP)
Efficacy
Efficacy
Risk
Risk
Tolerabilit y
Tolerability
Criteria WeightingCriteria Weighting: : Pairwise comparisons Pairwise comparisons
on a 9on a 9--point scalepoint scale
AHP ScoringAHP Scoring: : Applying weights to Applying weights to
criteria valuescriteria valuesSource: Dolan JG. The Patient 2012Source: Dolan JG. The Patient 2012
Multi-criteria Decision Analysis for Patient Preference Assessment
Multi-criteria Decision Analysis for Patient Preference Assessment
Bennett Levitan, MD-PhDDepartment of Epidemiology
Janssen Research and Development, Titusville, NJ
FDA CDRH Patient Preference Initiative Workshop September 18, 2013

18
Topics
• Multi-criteria Decision Analysis for Patient Preferences
• Industry Considerations for Eliciting Patient Preferences

19
Multi-criteria Decision Analysis (MCDA)
• A generic approach to aid decision-making by• Decomposing a complex problem into pieces• Applying judgment to the pieces• Reassembling them into a coherent whole
• Generally conducted by a facilitator with a small group of experts
• Long and successful history in Decision Analysis • Limited application to benefit-risk or patient
considerations until recently
•
Dodgson JS, Spackman M, Pearman A, Phillips LD. Multi-Criteria Analysis: A Manual. London: Department for Communities and Local Government; 2009
•
European Medicines Agency Benefit-Risk Methodology Project, EMA/213482/2010

20
Steps in Multi-criteria Decision Analysis (MCDA)
20
PrOACT URL Decision-making framework•Hammond, Keeney, Raiffa. Smart Choices: A Practical Guide to making Better Decisions. Harvard Bus Sch Press; 1999•Hunink, Glasziou, et al. Decision Making in Health and Medicine.
Cambridge University Press; 2001
Clinical Context
Treatments Endpoints Data Tradeoffs
Uncertainty Risk Tolerance Linked Decisions
Data
Uncertainty Risk Tolerance Linked Decisions

21
Steps in Multi-criteria Decision Analysis (MCDA)
21
Clinical Context Treatments Endpoints Data Tradeoffs
Uncertainty Risk Tolerance Linked Decisions
•
What is the disease and who has it?•
What is it like to have the disease?•
How well do existing treatments work?•
What treatments are we considering?•
Over what time period am I considering treatment?•
Who is seeing this analysis?
•
What is the disease and who has it?•
What is it like to have the disease?•
How well do existing treatments work?•
What treatments are we considering?•
Over what time period am I considering treatment?•
Who is seeing this analysis?
What is the problem I am trying to solve?
Data

22
Steps in Multi-criteria Decision Analysis (MCDA)
22
Clinical Context
Treatments Endpoints Data Tradeoffs
Uncertainty Risk Tolerance Linked Decisions
How do I want to characterize treatment performance?
BenefitsBenefits
HarmsHarms
Benefit 1Benefit 1
Benefit 2Benefit 2
Benefit 3Benefit 3
Harm 1Harm 1
Harm 2Harm 2
Harm 3Harm 3
Harm 4Harm 4
B-R Balance
B-R Balance
BenefitsBenefits
HarmsHarms
B-R Balance
B-R Balance
Identify and pare down the key endpoints (attributes)
Data
23
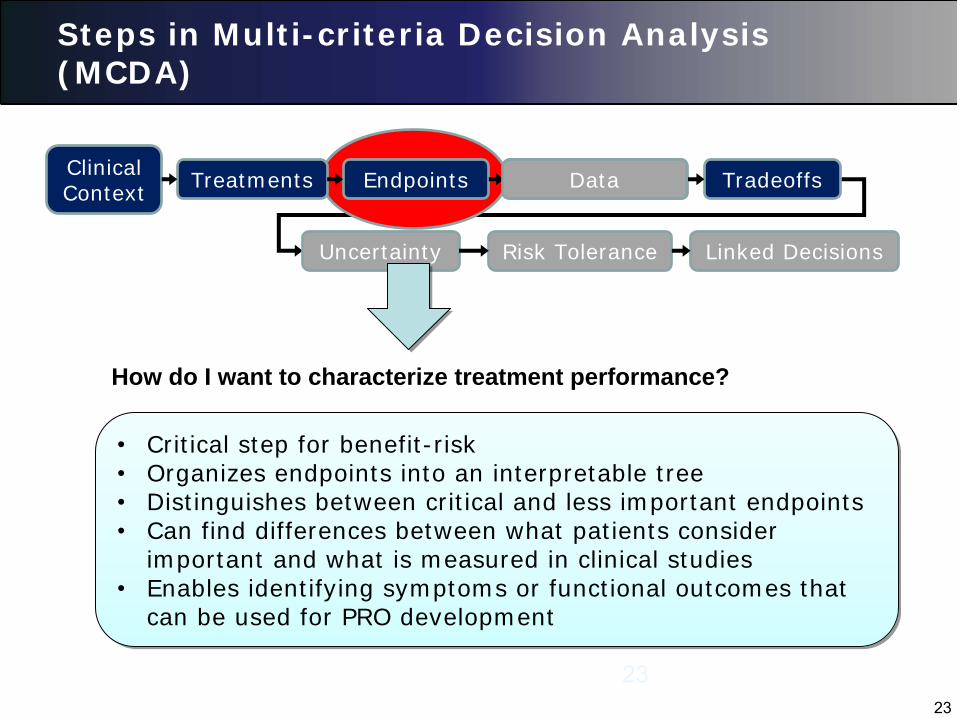
Steps in Multi-criteria Decision Analysis (MCDA)
23
Clinical Context
Treatments Endpoints Data Tradeoffs
Uncertainty Risk Tolerance Linked Decisions
•
Critical step for benefit-risk•
Organizes endpoints into an interpretable tree•
Distinguishes between critical and less important endpoints•
Can find differences between what patients consider important and what is measured in clinical studies
•
Enables identifying symptoms or functional outcomes that can be used for PRO development
•
Critical step for benefit-risk•
Organizes endpoints into an interpretable tree•
Distinguishes between critical and less important endpoints•
Can find differences between what patients consider important and what is measured in clinical studies
•
Enables identifying symptoms or functional outcomes that can be used for PRO development
How do I want to characterize treatment performance?
Data
24
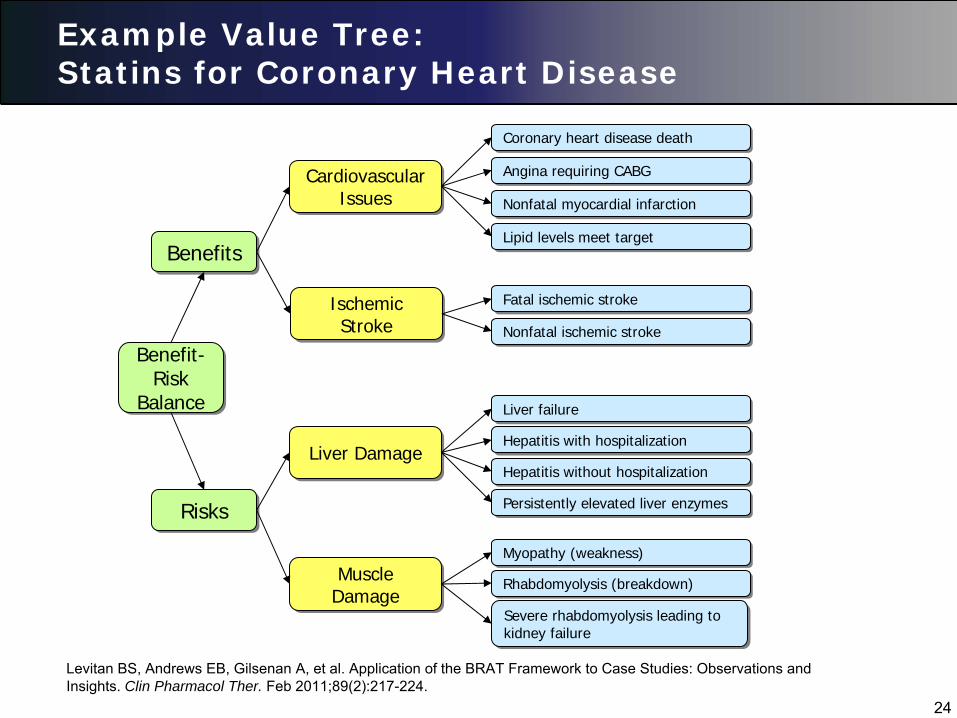
Example Value Tree: Statins for Coronary Heart Disease
Benefit- Risk
Balance
Benefit- Risk
Balance
BenefitsBenefits
RisksRisks
Cardiovascular Issues
Cardiovascular Issues
Ischemic Stroke
Ischemic Stroke
Liver DamageLiver Damage
Muscle Damage Muscle
Damage
Fatal ischemic strokeFatal ischemic stroke
Coronary heart disease deathCoronary heart disease death
Lipid levels meet targetLipid levels meet target
Angina requiring CABGAngina requiring CABG
Nonfatal myocardial infarctionNonfatal myocardial infarction
Nonfatal ischemic strokeNonfatal ischemic stroke
Hepatitis with hospitalizationHepatitis with hospitalization
Hepatitis without hospitalizationHepatitis without hospitalization
Liver failureLiver failure
Persistently elevated liver enzymesPersistently elevated liver enzymes
Myopathy (weakness)Myopathy (weakness)
Severe rhabdomyolysis leading to kidney failure Severe rhabdomyolysis leading to kidney failure
Rhabdomyolysis (breakdown) Rhabdomyolysis (breakdown)
Levitan BS, Andrews EB, Gilsenan A, et al. Application of the BRAT Framework to Case Studies: Observations and Insights. Clin Pharmacol Ther. Feb 2011;89(2):217-224.

25
Steps in Multi-criteria Decision Analysis (MCDA)
25
Clinical Context Treatments Endpoints Data Tradeoffs
Uncertainty Risk Tolerance Linked Decisions
•
Two considerations:•
What changes are important?•
Which endpoints make the biggest difference?•
Example:•
Does 40% vs. 50% chance hepatitis really matter?•
Which is worse:•
Heart attack vs. stroke?•
Muscle weakness vs. hospitalization for hepatitis?
•
Two considerations:•
What changes are important?•
Which endpoints make the biggest difference?•
Example:•
Does 40% vs. 50% chance hepatitis really matter?•
Which is worse:•
Heart attack vs. stroke?•
Muscle weakness vs. hospitalization for hepatitis?
Which endpoints are important and by how much?
Data

26
Steps in Multi-criteria Decision Analysis (MCDA)
Clinical Context Treatments Endpoints Data Tradeoffs
Uncertainty Risk Tolerance Linked Decisions
What changes are important?
0% 100%
How much it matters to me (Utility)
Chance I have a non-fatal stroke
?
10%
All I care about are changes from 0% to 10%:
The lowest and high values relevant to the decision
Data

27
Steps in Multi-criteria Decision Analysis (MCDA)
Clinical Context Treatments Endpoints Data Tradeoffs
Uncertainty Risk Tolerance Linked Decisions
Which endpoints make the biggest difference (weighing!)?
•
Several methods to elicit weights•
Common approach is “swing weighting”•
Facilitated process that can take a few hours•
Results in weights that reflect the relative impact for each endpoint “swinging” from its lowest to highest value
•
Several methods to elicit weights•
Common approach is “swing weighting”•
Facilitated process that can take a few hours•
Results in weights that reflect the relative impact for each endpoint “swinging” from its lowest to highest value
Data
28
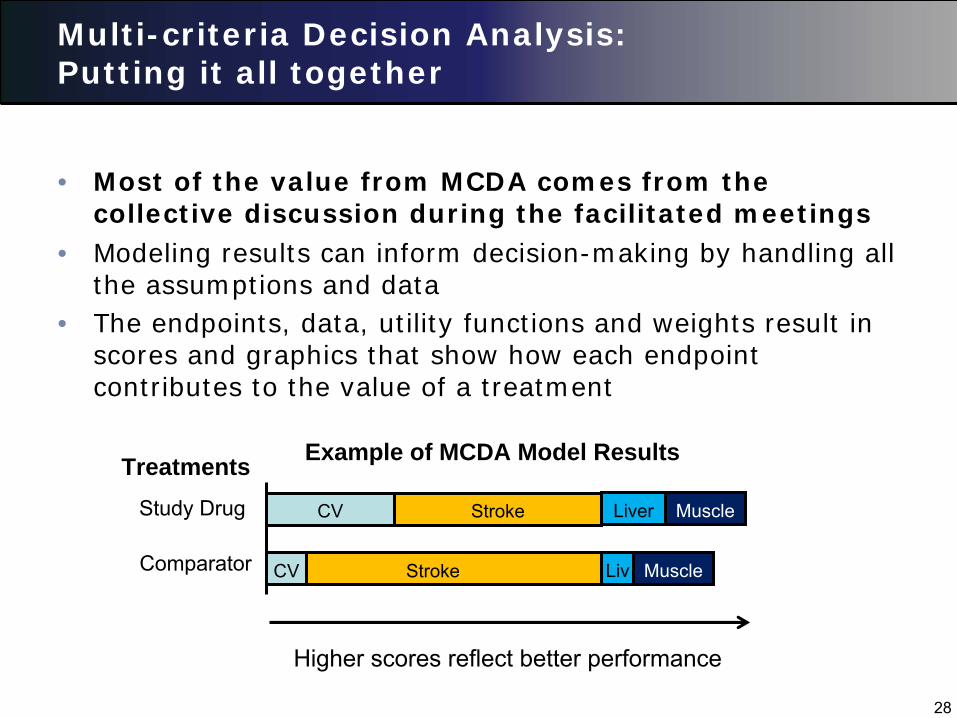
Multi-criteria Decision Analysis: Putting it all together
• Most of the value from MCDA comes from the collective discussion during the facilitated meetings
CV Stroke Liver Muscle
CV Stroke Liv Muscle
TreatmentsStudy Drug
Comparator
Example of MCDA Model Results
Higher scores reflect better performance
• Modeling results can inform decision-making by handling all the assumptions and data
• The endpoints, data, utility functions and weights result in scores and graphics that show how each endpoint contributes to the value of a treatment
29
Agenda
• Multi-criteria Decision Analysis for Patient Preferences
• Industry Considerations for Eliciting Patient Preferences

30
Some Sponsor Considerations for Preference Studies
• Is a preference study needed for benefit-risk?
• When to commit to a preference study?
• What type of study?
• Whose preferences?
• Challenges with multiple regions
• Patients and physicians from a trial or a panel?
• How will the study be viewed by health authorities?
State of the Science: Methods to Collect and Use
Patient Preference Data Overview of methods to collect patient
preference information and active research regarding patient collecting patient preferences.
For the online webcast: Please submit your questions to the panel via the chat box. The
online hosts will be collecting the questions during the session
to be brought to the panel
moderator during the panel discussion.

Moderator:
Telba Irony, Ph.D.Chief, General Surgical Devices BranchCDRH/Office of Surveillance and Biometrics
Panel:
A. Brett Hauber, Ph.D.Research Triangle Institute (RTI‐Health Solutions)
Bennett Levitan, M.D., Ph.D.Janssen Research & Development (Johnson and
Johnson)
Sonal Singh, M.D., M.P.H.Johns Hopkins University
Scott Braithwaite, M.D. Society of Medical Decision Making (SMDM)
Methods for Eliciting Benefit-Risk Preference Data
Patient Preference Initiative Symposium
A. Brett Hauber, Ph.D.
Senior Economics and Vice President
Health Preference Assessment
September 18September 18--19, 201319, 2013

3434 34
Benefit-Risk Tradeoff Metrics
Risk
EffectivenessΔ
Effectiveness
ΔR
isk
Net Effectiveness
Benefit
Maximum Acceptable
Risk
Minimum Acceptable
Benefit
Net Safety Benefit
Patient Benefit-Risk Threshold
TREATMENT A
Source: Hauber et al., Appl Health Econ Source: Hauber et al., Appl Health Econ Health Policy (2013)Health Policy (2013)

3535
Benefit-Risk Preference Elicitation Methods
•
Weighting methods for single decisions–
Standard Gamble–
Threshold Technique
•
Generalized weighting methods–
Best-Worst Scaling–
Discrete-Choice Experiments (DCE)
•
Decision support methods–
Analytic Hierarchy Process (AHP)–
Multi-Criteria Decision Analysis (MCDA)

3636
Benefit-Risk Preference Elicitation Methods
•
Weighting methods for single decisions–
Standard Gamble–
Threshold Technique
3737
??
Standard Gamble
U(Asthma) = U(Asthma) = pp··U(Perfect Health) + (1U(Perfect Health) + (1--pp) ) ··U(Death)U(Death)
U (Asthma) = U (Asthma) = pp··(1) + (1(1) + (1--pp))··(0)(0) MAR (Death) = 1MAR (Death) = 1--pp
Probability = pProbability = p
Probability = (1Probability = (1--p)p)AA
BB
Perfect Perfect HealthHealth
DeathDeath
AsthmaAsthma
Source: Bernie OSource: Bernie O’’Brian, personal Brian, personal communicationcommunication

3838
Threshold Technique
Source: Kopec JA et al., Source: Kopec JA et al., J. Clin Epidemiol (2007)J. Clin Epidemiol (2007)
Less painLess pain
Greater Greater hypertension hypertension
riskrisk

3939
Benefit-Risk Preference Elicitation Methods
•
Generalized weighting methods–
Best-Worst Scaling–
Discrete-Choice Experiments (DCE)

4040
Best-Worst Scaling (Object Case)
MOSTImportant
(Please click ONE)TREATMENT SIDE EFFECT
LEASTImportant
(Please click ONE)
Non-fatal stroke
Serious infection requiring hospitalization
Nausea and vomiting
Hand and foot syndrome
Bad liver test
4141
Discrete-Choice Experiment (DCE)
Greater Greater weight lossweight loss
Longer duration Longer duration of side effectsof side effects
Lower RiskLower Risk
4242
DCE Question: Renal-Cell Carcinoma
Efficacy
Mild-to Moderate
Side Effects
Serious Adverse-
Event Risks
Source: Mohamed et al., Pharmacoeconomics, 2011Source: Mohamed et al., Pharmacoeconomics, 2011

4343
Benefit-Risk Thresholds
Lung Damage
Liver Damage
Source: Johnson et al., Chapter 4. Quantifying Patient Source: Johnson et al., Chapter 4. Quantifying Patient Preferences to Inform BenefitPreferences to Inform Benefit--Risk Evaluations (Risk Evaluations (In PressIn Press) )
4444
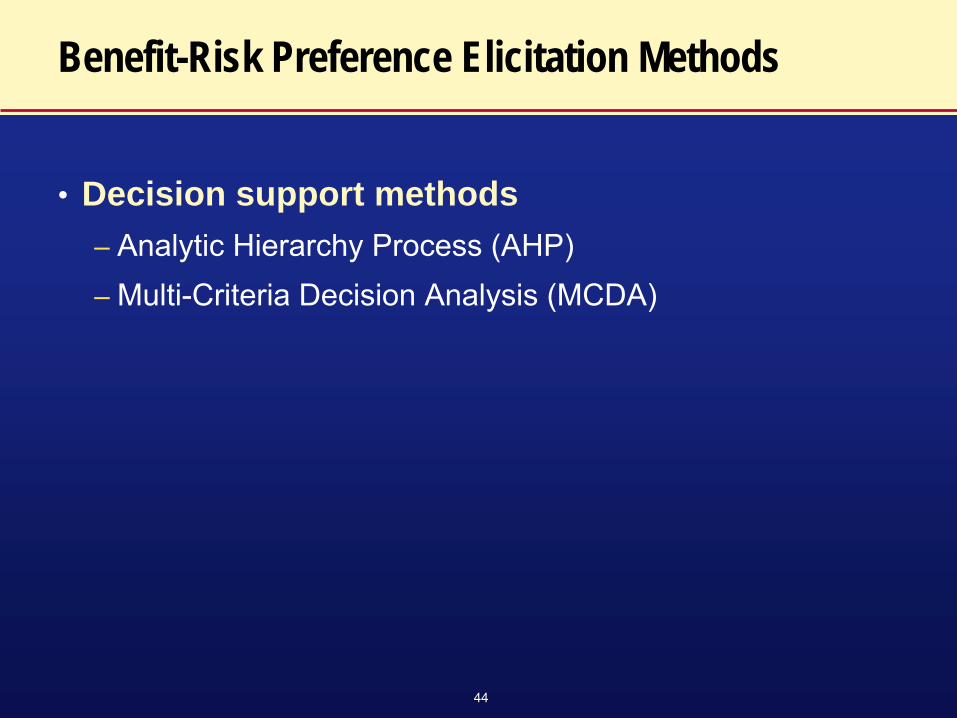
Benefit-Risk Preference Elicitation Methods
•
Decision support methods–
Analytic Hierarchy Process (AHP)–
Multi-Criteria Decision Analysis (MCDA)
4545
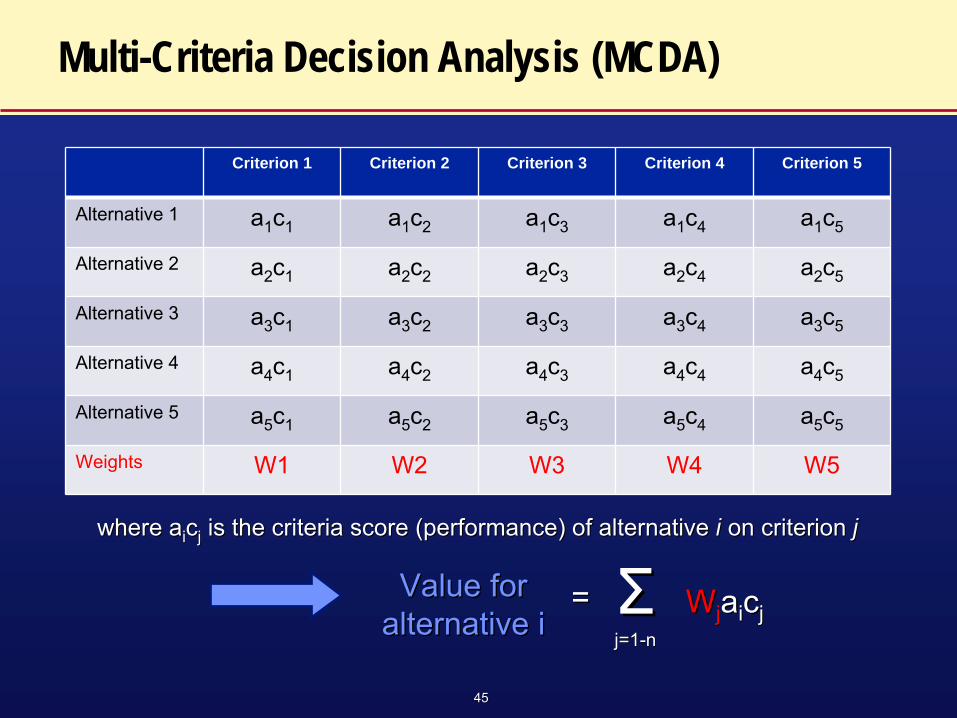
Criterion 1 Criterion 2 Criterion 3 Criterion 4 Criterion 5
Alternative 1 a1
c1 a1
c2 a1
c3 a1
c4 a1
c5
Alternative 2 a2
c1 a2
c2 a2
c3 a2
c4 a2
c5
Alternative 3 a3
c1 a3
c2 a3
c3 a3
c4 a3
c5
Alternative 4 a4
c1 a4
c2 a4
c3 a4
c4 a4
c5
Alternative 5 a5
c1 a5
c2 a5
c3 a5
c4 a5
c5
Weights W1 W2 W3 W4 W5
where awhere aii
ccjj
is the criteria score (performance) of alternative is the criteria score (performance) of alternative ii on criterion on criterion jj
WWjj
aaii
ccjjValue for Value for
alternative ialternative i== ΣΣ
j=1j=1--nn
Multi-Criteria Decision Analysis (MCDA)

4646
Analytic Hierarchy Process (AHP)
Efficacy
Efficacy
Risk
Risk
Tolerabilit y
Tolerability
Criteria WeightingCriteria Weighting: : Pairwise comparisons Pairwise comparisons
on a 9on a 9--point scalepoint scale
AHP ScoringAHP Scoring: : Applying weights to Applying weights to
criteria valuescriteria valuesSource: Dolan JG. The Patient 2012Source: Dolan JG. The Patient 2012
47
Role of the analytic hierarchy process in measuring patient preferences
Sonal Singh MD MPHJohns Hopkins University
48
When is AHP useful as tool
•
Stakeholder engagement and incorporation of experts’ and patient preferences at any stage of health care decision-making
•
Uncertainities about benefit and risk decisions
48

49
Overview of Analytic Hierarchy Process
49

50
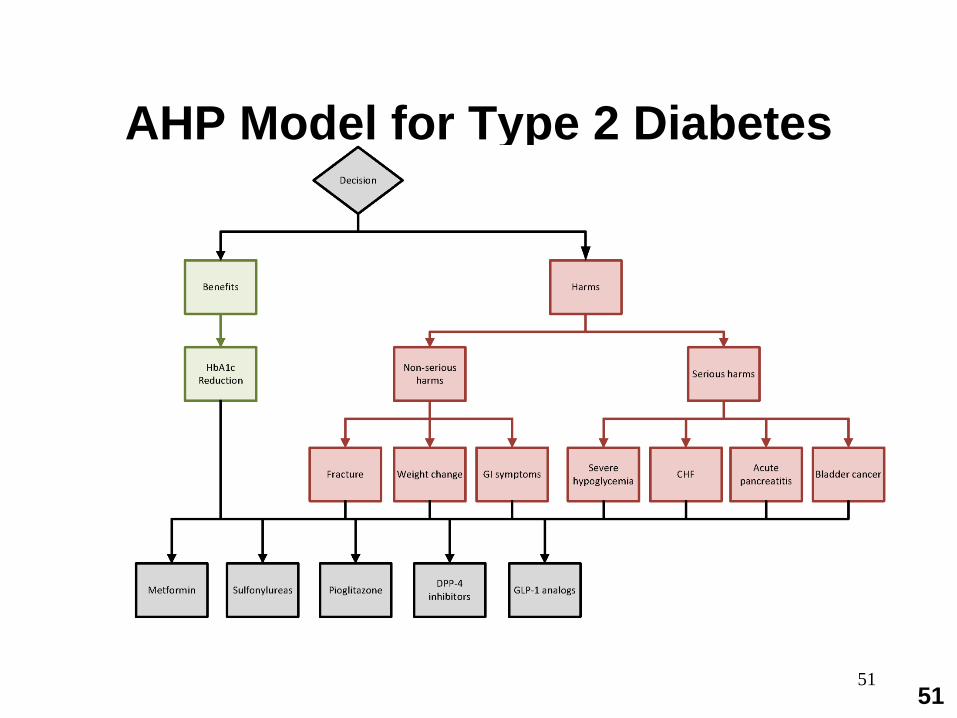
Step 1. Decision Context
•
Goals, alternatives, criterion by which alternatives are judged to meet the goal
•
Stated goal: Best (safe and effective) treatment for type 2 diabetes
•
Comparators: Product A vs B (standard)•
Criteria: Maximize benefits via glucose reduction and minimize adverse effects (hypoglycemia, CV effects, fractures, lactic acidosis)
•
Refined after stakeholder input
50
51
AHP Model for Type 2 Diabetes
51
52
Step 2. Data Inputs : Assembling & Organizing Outcomes in an Evidence
Matrix
•
Determine the most reliable source of evidence on each outcomes
•
Regulatory context may require critical attention to data sources- Evidentiary standards of the harm? Single clinical trial, meta-analysis of trials, observational studies, Adverse Event Reports
52Singh S, et al Drug safety assessment in clinical trials: methodological challenges &opportunities. Trials 2012 ;13(1):138
53
Step 3. Comparison among alternative criteria using AHP pairwise comparisons
•
Comparisons among criterion : AHP Pairwise comparisons conducted to determine the priorities of the criteria relative to decision goal.
•
Baseline analysis assume all criteria equally important
•
Pair wise comparisons are conducted among the alternative drugs with regard to fulfilling each criterion
53
54
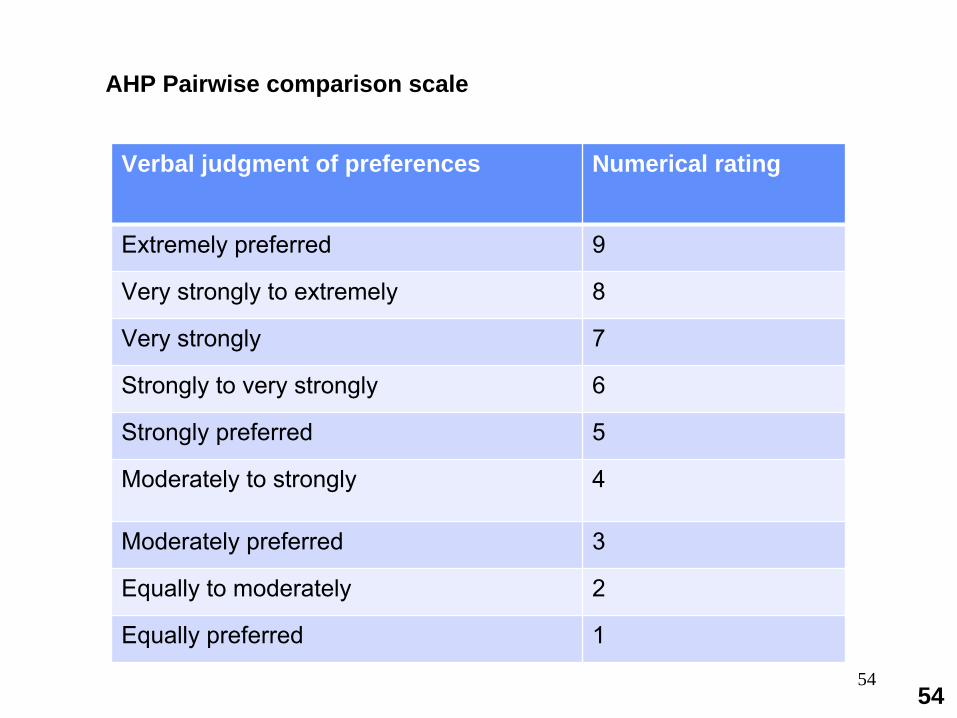
Verbal judgment of preferences Numerical rating
Extremely preferred 9
Very strongly to extremely 8
Very strongly 7
Strongly to very strongly 6
Strongly preferred 5
Moderately to strongly 4
Moderately preferred 3
Equally to moderately 2
Equally preferred 1
AHP Pairwise comparison scale
54
55
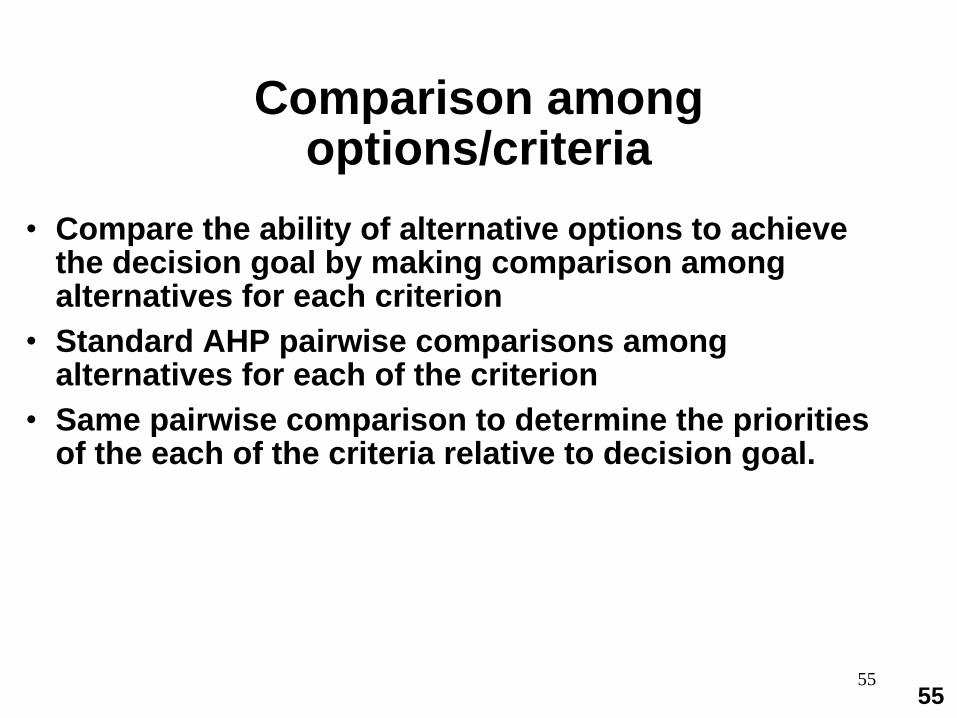
Comparison among options/criteria
•
Compare the ability of alternative options to achieve the decision goal by making comparison among alternatives for each criterion
•
Standard AHP pairwise comparisons among alternatives for each of the criterion
•
Same pairwise comparison to determine the priorities of the each of the criteria relative to decision goal.
55

56
Combining judgments to evaluate how alternatives meet goal
•
Standard AHP process weighting to combine results of judgment made in Step 3 to determine relative ability of drugs to meet stated goal
•
After all the comparisons are made they are combined to create a normalized, ratio scale that summarizes the results of the direct and indirect comparisons made among the decision elements
•
Relative differences > 1.1 considered significant
56

5757

5858

59
Sensitivity analysis•
Explore impact of different judgments on relative importance of criteria varying priorities from 0 (no importance) to 1 (most important).
•
Input on relative importance from various stakeholders.
•
Conduct additional sensitivity analysis to determine impact on decision goals
•
Vary probability inputs•
Vary preferences
–
Input on relative importance (priorities) from various stakeholders
59
60
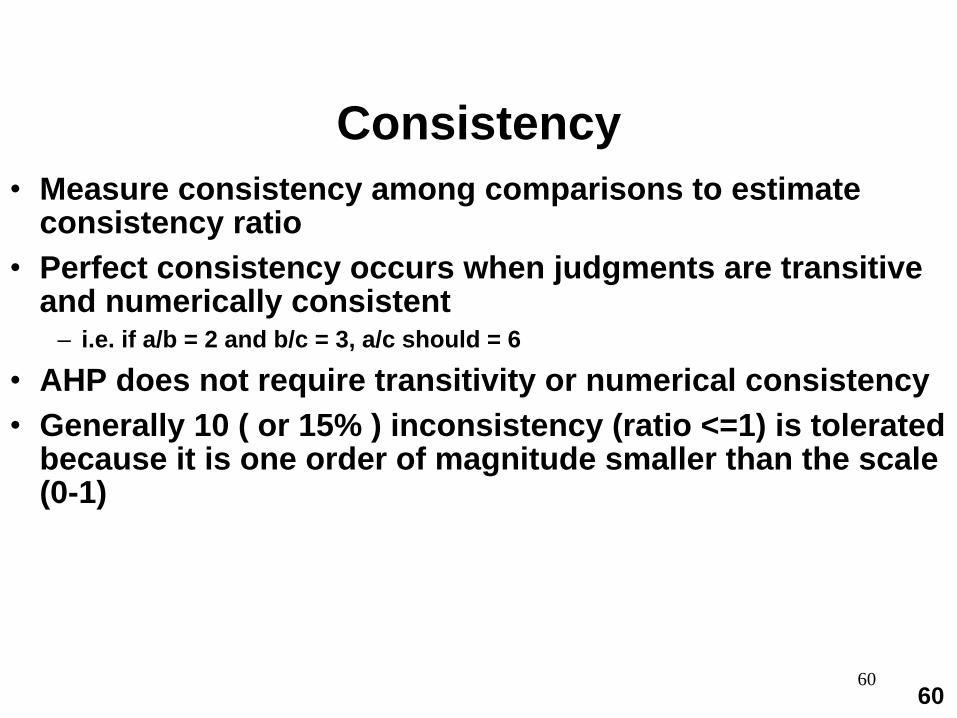
Consistency •
Measure consistency among comparisons to estimate consistency ratio
•
Perfect consistency occurs when judgments are transitive and numerically consistent
–
i.e. if a/b = 2 and b/c = 3, a/c should = 6
•
AHP does not require transitivity or numerical consistency•
Generally 10 ( or 15% ) inconsistency (ratio <=1) is tolerated because it is one order of magnitude smaller than the scale (0-1)
60
61
Validation
•
AHP has been extensively validated•
AHP is a method of measurement
•
If the underlying assumptions met and it is technically AHP is considered industry standard
61Whitaker R. Validation examples of the Analytic Hierarchy Process and Analytic Network Process. Math Comput Model. 2007.46:840-59
62
Advantages of AHP
•
Helps to improve judgement•
Low cognitive stress
•
Hierarchial structure•
Flexible, easy to apply
•
Possible to use us a group consensus building tool in small groups
63
Limitations of AHP
•
Task sometimes seen as less realistic•
Some assumptions, such as those of independence may be unrealistic in certain scenarios

64
Facilitating preference-concordant decisions by patients
R. Scott Braithwaite, MD, MS, FACPPresident, Society for Medical Decision
MakingChief, Division of Comparative
Effectiveness and Decision SciencesProfessor of Medicine and Population
HealthNew York University School of Medicine

65
Disclaimer
•
Not an expert on preference elicitation though many in SMDM are
–
Methods concierge service
•
Will focus on gathering and presenting information to facilitate patient-centered decision making
–Preference-concordance

66
First steps towards preference- concordance
•
What do patients expect of FDA? –
“Safety” is context-dependent –
May be easy place to hide but hard place for patient decision making–
Does risk aversion of FDA match risk aversion of consumers?»
Societal versus individual preference?
•
Establish explicit systematic quantitative criteria for harm/benefit assessment
–
Risk tolerance may vary depending on presence of alternatives and seriousness of untreated risk
67
Does FDA try hard enough to pick up “harm” signal?
•
Add generic QOL measure (e.g. EQ 5-D) to the more typical disease-specific measures
–
May pick up “harm” signal otherwise undetected
•
Be explicit about whether studies have power sufficient to pick up amount of harm that would offset hypothesized benefit
•
Are comparators the next best alternative?

68
Does one size fit all?•
Preference-concordant decisions may require different messaging for different harm/benefit
•
Should FDA have different “labels” reflecting–
Magnitude of potential treatment harm?–
Size of harm/benefit ratio–
Certainty of harm/benefit ratio
»Statistical uncertainty (insufficient power to detect harms sufficient to offset benefits),
»Evidence uncertainty (study design limitations or uncertainty regarding effect of comparator)
»Uncharacterized heterogeneity of treatment effect
69
What different “labels” could look like: one vision•
“Safe”
•
“Benefits proven to exceed risks for most patients”
•
“Benefits proven to exceed risks for some patients”
•
“Benefits likely to exceed risks for most patients”
•
“Benefits likely to exceed risks for some patients”– +/- “harms may be severe”–May complement drug “fact box”
70
FDA as “learning institution”
•
Important to test whether information from FDA facilitates patient-centered and preference-concordant decisions
•
Should FDA routinely conduct research using standard instruments for decision quality?
–
Decision satisfaction, –
Decision regret–
Decision conflict–
Knowledge
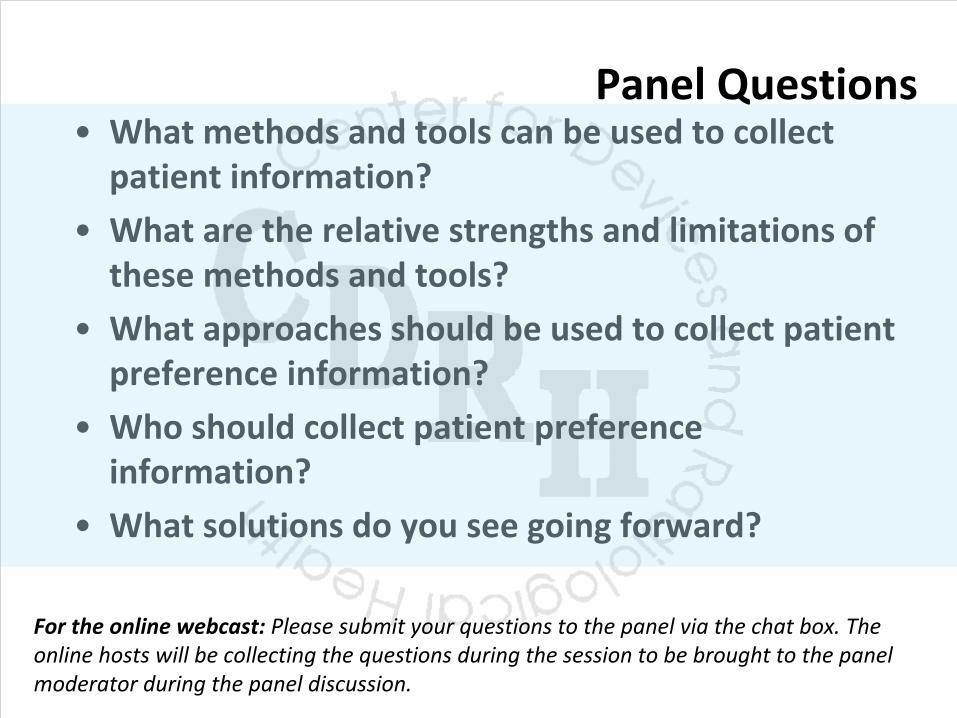
Panel Questions•
What methods and tools can be used to collect
patient information?•
What are the relative strengths and limitations of
these methods and tools? •
What approaches should be used to collect patient
preference information?•
Who should collect patient preference
information?•
What solutions do you see going forward?
For the online webcast: Please submit your questions to the panel via the chat box. The
online hosts will be collecting the questions during the session
to be brought to the panel
moderator during the panel discussion.