state of rajasthan agriculture 2011-12
TRANSCRIPT

1
AAEERRCC RREEPPOORRTT 114455
State of Rajasthan Agriculture
2011-12
Mrutyunjay Swain
S. S. Kalamkar
Manishkant Ojha
Agro-Economic Research Centre For the states of Rajasthan and Gujarat
(Sponsored by the Ministry of Agriculture, Govt. of India)
Sardar Patel University Vallabh Vidyanagar, Dist. Anand, Gujarat
December 2012

i
AAEERRCC RREEPPOORRTT 114455
State of Rajasthan Agriculture
2011-12
Mrutyunjay Swain S. S. Kalamkar
Manishkant Ojha
Report submitted to the Ministry of Agriculture, Government of India,
New Delhi
Agro-Economic Research Centre For the states of Rajasthan and Gujarat
(Sponsored by the Ministry of Agriculture, Govt. of India)
Sardar Patel University Vallabh Vidyanagar, Dist. Anand, Gujarat
December 2012

ii
AERC Report No. 145 © Agro-Economic Research Centre, Vallabh Vidyanagar 388120, Dist. Anand, Gujarat, India.
Prepared by
Mrutyunjay Swain (Research Officer) S. S. Kalamkar (Professor and Director) Manishkant Ojha (Research Associate)
Published by The Director Agro-Economic Research Centre For the states of Gujarat and Rajasthan (Sponsored by Ministry of Agriculture, Govt. of India) H.M. Patel Institute of Rural Development, Opp. Nanadalaya Temple, Post Box No. 24, Sardar Patel University, Vallabh Vidyanagar 388120, Dist. Anand, Gujarat. Ph. No. +91-2692-230106, 230799; Mobile- 09822437451; 7383554616 Fax- +91-2692-233106 Email: [email protected]; [email protected]
Published in December 2012

iii
Foreword
Rajasthan, the largest state of India, is endowed with diverse soil and weather
conditions comprising of several agro-climatic situations that helps the state to adopt a diversified cropping pattern. The state is India’s largest producer of mustard, pearl millet (bajra), and three spices (coriander, cumin, and fenugreek), cluster beans, isabgol and it is the second largest producer of maize. The state has a substantial area under vegetable crops. It is also having the second largest herd of livestock amongst Indian states contributing about 10 percent of the country’s milk and 30 percent of mutton production. The diversified cropping pattern and the presence of livestock as a major livelihood source has helped the state in managing the wide range of risks associated with dryland agriculture. However, the state faces many challenges that are to be addressed systematically so as to facilitate a sustainable development of the sector. In order to understand the prevailing impediments and challenges to agricultural growth in various states, the Ministry of Agriculture, Government of India proposed to carry out state specific report focusing on agriculture scenario which were assigned to various AERCs/ units located at different states in India. The Agro-Economic Research Centre, Vallabh Vidyanagar was entrusted to prepare report on agriculture scenario in the states of Rajasthan and Gujarat. The framework of the report was given by the Ministry.
This report presents the state of agriculture in Rajasthan by using secondary
data collected from various published sources. The present study evaluates the performance of agriculture in the State of Rajasthan in the recent years and also presents what could be the future options, given our objectives of accelerated growth, inclusiveness and reduction of poverty. I am thankful to Dr Mrutyunjay Swain and his research team for putting in a lot of efforts to complete this excellent piece of work.
I also thank the Ministry of Agriculture, Government of India for the unstinted
cooperation and support. It is hoped that this study will be useful to agricultural scientists, economists, non-governmental organizations, policy makers and planners in understanding the present state of agriculture sector in Rajasthan.
Agro-Economic Research Centre For the states of Rajasthan and Gujarat (Sponsored by Ministry of Agriculture, Govt. of India)
Sardar Patel University, Vallabh Vidyanagar 388120, Dist. Anand, Gujarat, India.
S.S. Kalamkar Director
iv
Acknowledgements
The study on “State of Rajasthan Agriculture 2011-12” has been carried out at the Agro-Economic Research Centre, S.P. University, Vallabh Vidyanagar, as suggested and sponsored by the Ministry of Agriculture, Government of India, New Delhi.
I am extremely thankful to our Director Dr. S. S. Kalamkar for providing administrative and intellectual support for undertaking this study. I thank our Honorary Advisor Dr. Mahesh T. Pathak and Deputy Director Dr. R. A. Dutta for their constructive suggestions.
I express my sincere gratitude to Ministry of Agriculture, Government of India and State Government Departments for providing latest statistical information for inclusion in this document. I am grateful to B.S. Bhandari, Advisor, Ministry of Agriculture, Govt. of India and Mrs. A. Sebastian, Deputy Economic Advisor, Ministry of Agriculture, Govt. of India for their encouragement and cooperation at every stage of the study.
I thank my study team at our Centre for putting their best efforts for the study. I
am thankful to all administrative staff and other support staff for providing excellent support during the study. I thank all other agencies/ individuals who have provided directly or indirectly the valuable help and guidance for preparing this report. Agro-Economic Research Centre For the states of Rajasthan and Gujarat (Sponsored by Ministry of Agriculture, Govt. of India)
Sardar Patel University Vallabh Vidyanagar 388120 Dist. Anand, Gujarat, India
Mrutyunjay Swain Project Leader

v
Contents
Foreword iii
Acknowledgements vi
List of Tables vi
List of Figures and Maps vii
List of Abbreviations viii
Section I
Introduction
01
Section II Rajasthan Agriculture: Performance and Challenges 04
Section III Natural Resource Management 16
Section IV Farm Inputs and Management 22
Section V Agricultural Research, Education and Extension 28
Section VI Animal Husbandry, Dairying and Fisheries 29
Section VII Post Harvest Management and Value Addition 30
Section VIII Conclusions 31
References 33
vi
List of Tables
Table No. Title Page
1 Composition of Population in Rajasthan (2001) 3
2 Sectoral Composition of Net State Domestic Product(NSDP) at constant (2004-05)price
4
3 Compound Growth Rate (%) in Crop Area, Production and Yield in Rajasthan
7
4 Growth in Area, Yield and Production in Rajasthan, 1991-2010
8
5 Food grains Production in Rajasthan and India 8
6 Compound Annual Growth Rate of Area, Production and Yield of major crops in Rajasthan
12
7 Change in Yearly Average Prices of Agricultural Commodities
14
8 Warehousing Capacity and No. of Godowns 15
9 Salient Features of Agro-Climate Zones of Rajasthan 16
10 Land Utilisation Pattern in Rajasthan 17
11 Land Holding Pattern in Rajasthan 18
12 Ceiling Limits on Land Holdings 19
13 Rainfall Pattern in Rajasthan 20
14 Consumption of Fertilizers in Rajasthan 24
15 Irrigated Area in Rajasthan during 2007-08 to 2009-10 25
16 Source wise Agricultural Credit Disbursement in 2011-12 27
17 Performance of National Agricultural Insurance Scheme 28
18 Performance of Weather Based Crop Insurance Scheme 28
19 Performance of Dairy Development Sector in Rajasthan 30

vii
List of Figures and Maps
Sr. No. Title Page
1 Sectoral Composition of NSDP in Rajasthan (2007-08 and 2011-12)
6
2 Growth of Agricultural Area, Yield and Production (1991-2010)
7
3 Change in Cropping Pattern in Rajasthan (1990-91 & 2010-11)
10
4 Requirement and Distribution of Certified /Quality Seeds 23
5 Seed Replacement Rate (%) 23
6 Change in Gross Irrigated Area by Sources (1990-91 & 2009-10)
26
Map 1 Crop Distribution in Rajasthan 9

viii
List of Abbreviations
APMC - Agricultural Produce Marketing Committee
ATC - Advance Technology Centre
BCM - Billion Cubic Metres
CAGR - Compound Annual Growth rate
CAZRI - Central Arid Zone Research Institute
DES - Directorate of Economics and Statistics
DMIC - Delhi Mumbai Industrial Corridor (DMIC)
FYP - Five Year Plan
GCA - Gross Cropped Area
GCF - Gross Fixed Capital Formation
GDP - Gross Domestic Product
GSDP - Gross State Domestic Product
GOI - Government of India
GoR - Government of Rajasthan
Ha/ha - Hectare
KVK - Krishi Vigyan Kendra
MSP - Minimum Support Price
MGNREGA - Mahatma Gandhi National Rural Employment Guarantee Act
NABARD - National Bank for Agriculture and Rural Development
NAIS - National Agricultural Insurance Scheme
NCA - Net Cropped Area
NFSM - National Food Security Mission
NHM - National Horticulture Mission
NSDP - Net State Domestic Product
NSSO - National Sample Survey Organization
RSWC - Rajasthan State Warehousing Corporation
SAU - State Agriculture Universities
SPS - Sanitation and Phyto-Sanitation

1
State of Rajasthan Agriculture
1.0 Introduction
Rajasthan is the largest state of India constituting 10.4 per cent of total geographical
area and 5.67 per cent of total population of India (GoI, 2011). The state is divided
into 7 divisions, 33 districts, which are further subdivided into 244 tehsils, 249
panchayat sammitees and 9,168 gram panchayats. Physio-graphically, the state can
be divided into 4 major regions, namely (i) the western desert with barren hills, rocky
plains and sandy plains; (ii) the Aravalli hills running south-west to north-east starting
from Gujarat and ending in Delhi; (iii) the eastern plains with rich alluvial soils; and (iv)
the south-eastern plateau. Mahi, Chambal and Banas are the three major rivers of the
state. The state enjoys a strategic geographical position wherein it is situated
between Northern and Western growth hubs in the country and 40 per cent of Delhi
Mumbai Industrial Corridor (DMIC) runs through it. The state has well identified 10
agro-climatic zones. The state is endowed with diverse soil and weather conditions
comprising of several agro-climatic situations, warm humid in south-eastern parts to
dry cool in western parts of the state. About 65 per cent population (i.e. about 56.5
million) of the state is dependent on agriculture and allied activities for their livelihood.
The three major canal irrigations, other than the vast area under arid and dry lands
offer great help for agricultural development of the state. Agriculture in Rajasthan is
primarily rainfed covering country‟s 13.27 per cent of available land. The diversity in
climatic conditions of the state creates potentiality to develop certain belts of
horticultural crops. The arid part of the state which receives not more than annual
rainfall of 25 cm thrives on agriculture that is done with irrigation systems and
painstaking efforts of the poor farmers of Rajasthan. As a major portion of the state is
parched, the risk and instability in agricultural production and productivity are quite
high.
As it noted by the researchers that there exists a large variation in food grains
production across states and very high risk is involved in food grains production in the
states of Rajasthan, Maharashtra, Tamil Nadu, Odisha, Madhya Pradesh and Gujarat
(Chand and Raju, 2009). Reducing instability in agricultural production has been a
major policy concern over the years since the stability and growth in agriculture are
vital for providing food and nutrition security to burgeoning population. The decent
2
agricultural growth is a pre-requisite for inclusive growth, reduction of poverty levels,
development of the rural economy and enhancing of farm incomes and to achieve
much cherished double digit GDP growth in the country. The growth with
inclusiveness can be achieved only when agriculture growth accelerates and is also
widely shared amongst people and regions of the country. All these factors point to
just one thing that agriculture has to be kept at the centre of any reform agenda or
planning process. In this context, this study evaluates the performance of agriculture
in the state of Rajasthan in the recent years and also presents what could be the
future options, given our objectives of accelerated growth, inclusiveness and
reduction of poverty.
1.1 Population: Urban, Rural, Cultivators, Agricultural Labour
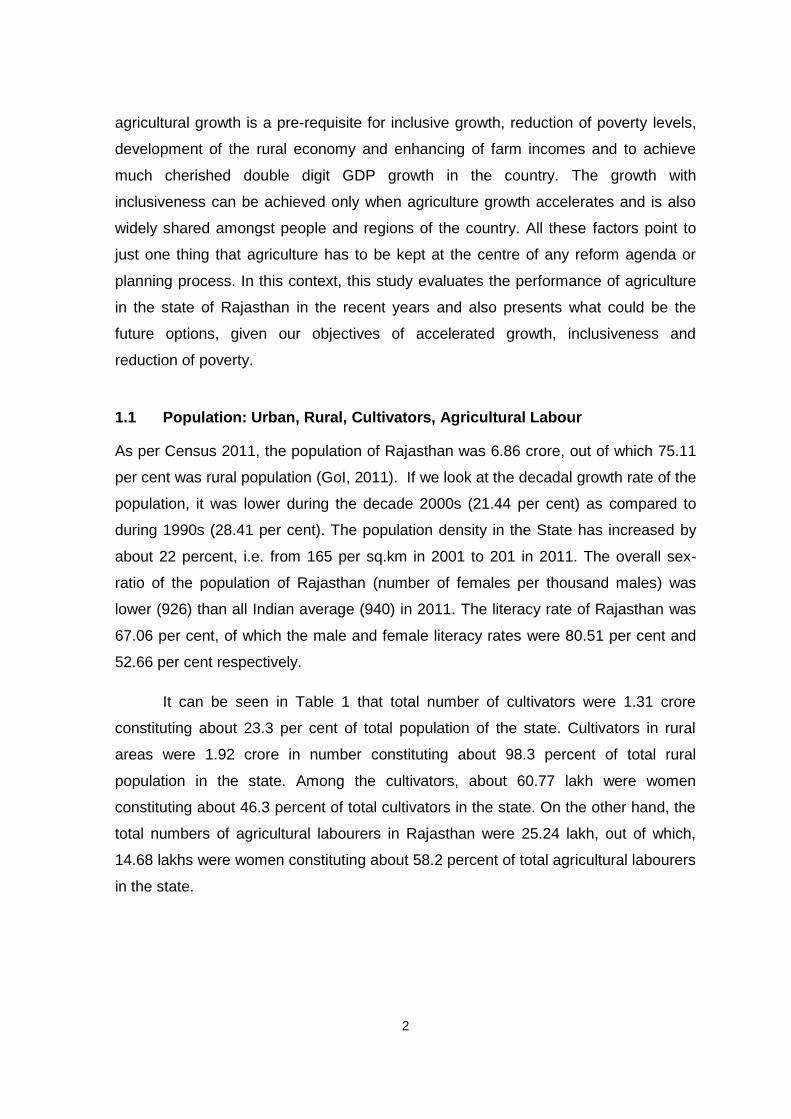
As per Census 2011, the population of Rajasthan was 6.86 crore, out of which 75.11
per cent was rural population (GoI, 2011). If we look at the decadal growth rate of the
population, it was lower during the decade 2000s (21.44 per cent) as compared to
during 1990s (28.41 per cent). The population density in the State has increased by
about 22 percent, i.e. from 165 per sq.km in 2001 to 201 in 2011. The overall sex-
ratio of the population of Rajasthan (number of females per thousand males) was
lower (926) than all Indian average (940) in 2011. The literacy rate of Rajasthan was
67.06 per cent, of which the male and female literacy rates were 80.51 per cent and
52.66 per cent respectively.
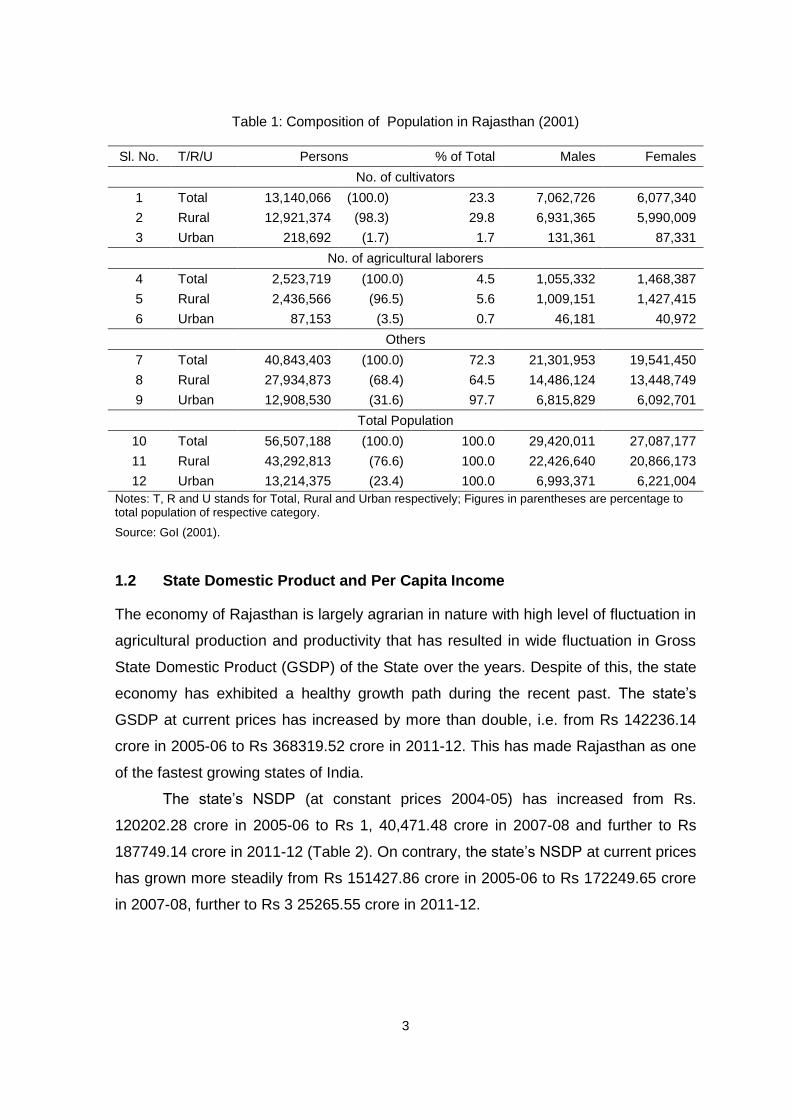
It can be seen in Table 1 that total number of cultivators were 1.31 crore
constituting about 23.3 per cent of total population of the state. Cultivators in rural
areas were 1.92 crore in number constituting about 98.3 percent of total rural
population in the state. Among the cultivators, about 60.77 lakh were women
constituting about 46.3 percent of total cultivators in the state. On the other hand, the
total numbers of agricultural labourers in Rajasthan were 25.24 lakh, out of which,
14.68 lakhs were women constituting about 58.2 percent of total agricultural labourers
in the state.
3
Table 1: Composition of Population in Rajasthan (2001)
Sl. No. T/R/U Persons % of Total Males Females
No. of cultivators
1 Total 13,140,066 (100.0) 23.3 7,062,726 6,077,340
2 Rural 12,921,374 (98.3) 29.8 6,931,365 5,990,009
3 Urban 218,692 (1.7) 1.7 131,361 87,331
No. of agricultural laborers
4 Total 2,523,719 (100.0) 4.5 1,055,332 1,468,387
5 Rural 2,436,566 (96.5) 5.6 1,009,151 1,427,415
6 Urban 87,153 (3.5) 0.7 46,181 40,972
Others
7 Total 40,843,403 (100.0) 72.3 21,301,953 19,541,450
8 Rural 27,934,873 (68.4) 64.5 14,486,124 13,448,749
9 Urban 12,908,530 (31.6) 97.7 6,815,829 6,092,701
Total Population
10 Total 56,507,188 (100.0) 100.0 29,420,011 27,087,177
11 Rural 43,292,813 (76.6) 100.0 22,426,640 20,866,173
12 Urban 13,214,375 (23.4) 100.0 6,993,371 6,221,004
Notes: T, R and U stands for Total, Rural and Urban respectively; Figures in parentheses are percentage to total population of respective category.
Source: GoI (2001).
1.2 State Domestic Product and Per Capita Income
The economy of Rajasthan is largely agrarian in nature with high level of fluctuation in
agricultural production and productivity that has resulted in wide fluctuation in Gross
State Domestic Product (GSDP) of the State over the years. Despite of this, the state
economy has exhibited a healthy growth path during the recent past. The state‟s
GSDP at current prices has increased by more than double, i.e. from Rs 142236.14
crore in 2005-06 to Rs 368319.52 crore in 2011-12. This has made Rajasthan as one
of the fastest growing states of India.
The state‟s NSDP (at constant prices 2004-05) has increased from Rs.
120202.28 crore in 2005-06 to Rs 1, 40,471.48 crore in 2007-08 and further to Rs
187749.14 crore in 2011-12 (Table 2). On contrary, the state‟s NSDP at current prices
has grown more steadily from Rs 151427.86 crore in 2005-06 to Rs 172249.65 crore
in 2007-08, further to Rs 3 25265.55 crore in 2011-12.
4
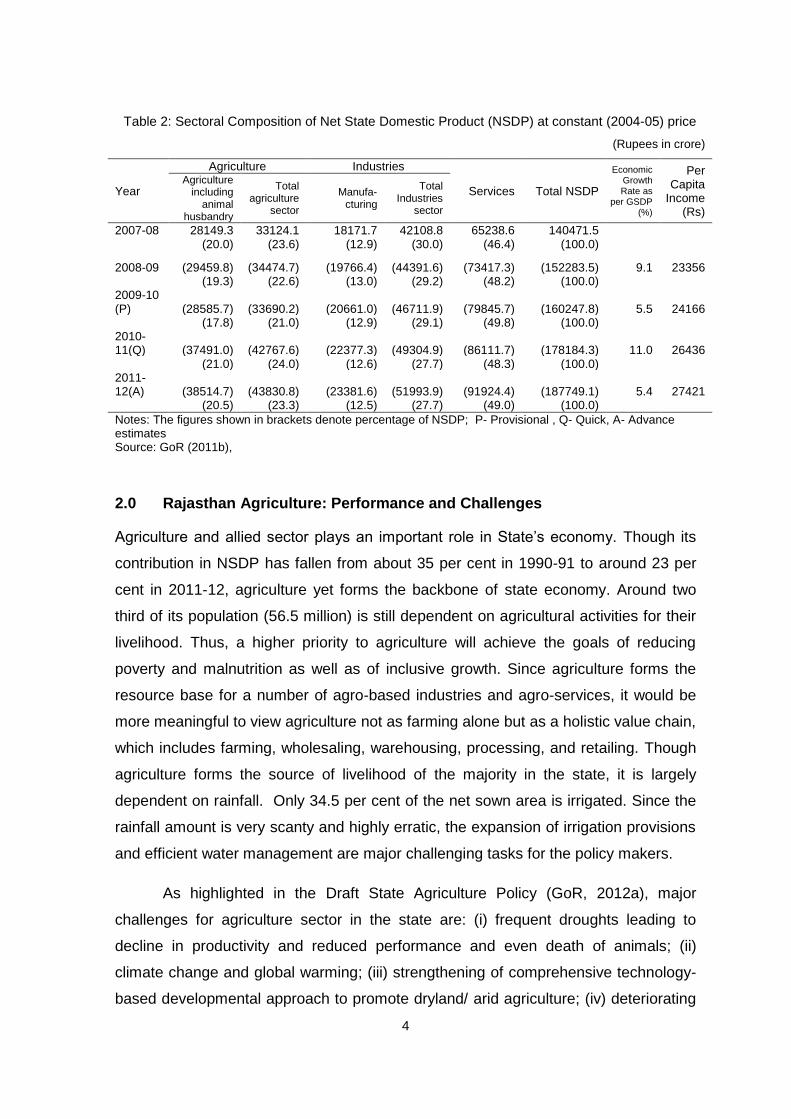
Table 2: Sectoral Composition of Net State Domestic Product (NSDP) at constant (2004-05) price
(Rupees in crore)
Year
Agriculture Industries
Services Total NSDP
Economic Growth Rate as
per GSDP (%)
Per Capita
Income (Rs)
Agriculture including
animal husbandry
Total agriculture
sector
Manufa-cturing
Total Industries
sector
2007-08 28149.3 33124.1 18171.7 42108.8 65238.6 140471.5
(20.0) (23.6) (12.9) (30.0) (46.4) (100.0)
2008-09 (29459.8) (34474.7) (19766.4) (44391.6) (73417.3) (152283.5) 9.1 23356
(19.3) (22.6) (13.0) (29.2) (48.2) (100.0)
2009-10 (P) (28585.7) (33690.2) (20661.0) (46711.9) (79845.7) (160247.8) 5.5 24166
(17.8) (21.0) (12.9) (29.1) (49.8) (100.0)
2010-11(Q) (37491.0) (42767.6) (22377.3) (49304.9) (86111.7) (178184.3) 11.0 26436
(21.0) (24.0) (12.6) (27.7) (48.3) (100.0)
2011-12(A) (38514.7) (43830.8) (23381.6) (51993.9) (91924.4) (187749.1) 5.4 27421 (20.5) (23.3) (12.5) (27.7) (49.0) (100.0)
Notes: The figures shown in brackets denote percentage of NSDP; P- Provisional , Q- Quick, A- Advance estimates Source: GoR (2011b),
2.0 Rajasthan Agriculture: Performance and Challenges
Agriculture and allied sector plays an important role in State‟s economy. Though its
contribution in NSDP has fallen from about 35 per cent in 1990-91 to around 23 per
cent in 2011-12, agriculture yet forms the backbone of state economy. Around two
third of its population (56.5 million) is still dependent on agricultural activities for their
livelihood. Thus, a higher priority to agriculture will achieve the goals of reducing
poverty and malnutrition as well as of inclusive growth. Since agriculture forms the
resource base for a number of agro-based industries and agro-services, it would be
more meaningful to view agriculture not as farming alone but as a holistic value chain,
which includes farming, wholesaling, warehousing, processing, and retailing. Though
agriculture forms the source of livelihood of the majority in the state, it is largely
dependent on rainfall. Only 34.5 per cent of the net sown area is irrigated. Since the
rainfall amount is very scanty and highly erratic, the expansion of irrigation provisions
and efficient water management are major challenging tasks for the policy makers.
As highlighted in the Draft State Agriculture Policy (GoR, 2012a), major
challenges for agriculture sector in the state are: (i) frequent droughts leading to
decline in productivity and reduced performance and even death of animals; (ii)
climate change and global warming; (iii) strengthening of comprehensive technology-
based developmental approach to promote dryland/ arid agriculture; (iv) deteriorating

5
soil health including imbalanced use of fertilizers, micronutrient deficiency, lack of
organic matter content, inadequate soil microbial flora and fauna etc.; (v) low
productivity, unfavorable prices and practically very little value addition, distress
sales, rising cost of cultivation; (vi) lack of efforts for stabilization of sand dunes and
for greening the desert through agro-forestry programmes; (vii) missing mechanisms
of export promotion, adherence to sanitation and phyto-sanitation (SPS) standards
and measures for minimizing the export rejections; (viii) lack of integrated farming
approach; (ix) lack of up-scaling of farm-validated modern technologies and
agricultural Innovations; (x) gender mainstreaming in agriculture; and (xi) proper
institutional mechanisms and organizational and management (O&M) reforms for
overcoming the felt constraints coming in way of the farm prosperity in the state.
2.1 Structure and Structural Transformation of Rajasthan Agriculture
Rajasthan‟s economy has undergone considerable transformation in the recent past
in terms of growing manufacturing and service sectors, with the reducing share of
agriculture (including livestock) in the state‟s NSDP. As discussed earlier, the
services sector contributes around 49.0 per cent in NSDP (at constant 2004-05
prices) followed by the industry and agriculture sectors with 27.7 per cent and 23.4
per cent share respectively (Table 2). Over the last five years (i.e. during 2007-08 to
2011-12), the share of agriculture, industry and services sectors to the NSDP has
changed from 23.6 per cent, 30.0 per cent, and 46.4 per cent in 2007-08 to 23.4 per
cent, 27.7 per cent and 49.0 per cent in 2011-12, respectively. Thus, there have been
no significant changes in relative share of the agriculture sector in total NSDP during
last five years, while contribution of service sector is constantly increasing. This
indicates a shift from the traditional agrarian economy towards a service dominated
one. More importantly, the decrease in agriculture‟s contribution to NSDP has not
been accompanied by a matching reduction in the share of agriculture in total
employment. About 5.4 million households continue to be engaged in farming, of
which roughly half are small or marginal farmers. Increasing agricultural productivity
(water, land, labour) is critical for the future of the agriculture sector in Rajasthan.
Given the size of the agriculture sector, improved agriculture productivity is also one
key element for a further structural transformation of the overall economy of the state
(GoR, 2012b).

6
Though the relative share of agriculture and allied sectors has not changed
significantly (Table 2) during 2007-08 to 2011-12, in absolute term, the NSDP from
agriculture and allied sector has significantly grown during last five years. NSDP from
agriculture at current prices has been more than doubled during above mentioned
period (from Rs 45609 crore in 2007-08 to Rs 91957.9 crore in 2011-12).
Interestingly, the share of agriculture and allied sectors in NSDP in the State has
increased from 26.5 per cent in 2007-08 to 28.3 per cent in 2011-12.
The structural changes in Rajasthan agriculture have been in favour of more
growing of oilseeds, pulses and horticultural crops. Rajasthan is the India‟s largest
producer of mustard, pearl millet (bajra), and three spices (coriander, cumin, and
fenugreek), cluster beans, isabgol and second largest producer of maize. The
reliance on livestock has also increased because of risky rainfed agriculture.
Rajasthan has the second largest herd of livestock amongst Indian states,
contributing about 10 percent of the country‟s milk and 30 percent of mutton
production (GoR, 2012b). Agriculture and livestock production take place in major
parts of Rajasthan often in extreme agro-climatic conditions. In most of the part of
rainfed areas of the state, only one crop can be grown during the year. Therefore,
farmers need to make agriculture practices more resilient in the light of ever harsher
and changing agro-ecological conditions.
Figure 1: Sectoral Composition of NSDP in Rajasthan (2007-08 and 2011-12)
45609.3, 26.5%
50054.4, 29.1%
76585.9, 44.5%
Sectoral Composition of NSDP at Current Price (Rs Crores) , 2007-08
Agriculture and allied Industry Service
91957.9, 28.3%
86845.4, 26.7%
146462.3, 45.0%
Sectoral Composition of NSDP at Current Price (Rs Crores) , 2011-12
Agriculture and allied Industry Service

7
2.2 Growth Performance of Rajasthan Agriculture
2.2.1 Overall Growth in Agriculture
The growth performance of the agriculture in Rajasthan during last two decades has
been fluctuating (Table 3). The compound annual growth rate of gross cropped area,
total agricultural production and yield has exhibited wide fluctuations during the plan
periods. There has been very dismal growth in crop area, yield and production during
annual plan 1990-91 and 8th Five Year Plan (FYP). However, thereafter, significant
growth has been recorded in area, yield and production, particularly during 10th Five
Year Plan and 11th Five Year Plan in Rajasthan. The rate of growth in gross cropped
area, total agricultural production and yield during 10th Five Year Plan has
dramatically increased at 12.98 per cent, 20.43 per cent and 6.60 per cent per
annum, respectively. The extent of fluctuation in agricultural production is also quite
evident from Figure 2.
Table 3: Compound Growth Rate (%) in Crop Area, Production and Yield in Rajasthan
Plan Period Area Production Yield
Annual Plan (1991-1992) -6.64 -20.42 -5.76
8th FY Plan (1992-1997) 0.65 4.11 3.44
9th FY Plan (1997-2002) -1.76 -0.83 0.94
10th FY Plan (2002-2007) 12.98 20.43 6.60
11th FY Plan (2007-2012) 3.27 12.92 9.34 Source: Computed from GoR (2009).
Figure 2: Growth in Agricultural Area, Yield and Production in Rajasthan (1991-2010)
200
400
600
800
1000
1200
1400
5000
10000
15000
20000
25000
30000
35000
1990-9
1
1991-9
2
1992-9
3
1993-9
4
1994-9
5
1995-9
6
1996-9
7
1997-9
8
1998-9
9
1999-2
000
2000-0
1
2001-0
2
2002-0
3
2003-0
4
2004-0
5
2005-0
6
2006-0
7
2007-0
8
2008-0
9
2009-1
0
2010-1
1
Gross cropped area (000 ha) Production(000 MT)
yield(Kg/Ha)
GC
A in 0
00 H
a, P
roductio
n in 0
00
MT
Yie
ld in K
g/H
a

8
The agricultural production has decreased from 160.38 lakh tons in 1990-91 to
138.09 lakh ton in 2000-01 (Table 4). Also, yield level has declined from 748 kg/ha in
1990-91 to 718 kg/ha in 2000-01. However, after 2000-01, the growth in area,
production and yield has been steady. The growth in production and yield has been
quite impressive from 2000-01 to 2010-11. The agricultural production and yield has
increased from 138.1 lakh ton and 718 kg/ha in 2000-01 to 336.1 lakh ton and 1374
kg/ha in 2010-11 respectively.
Table 4: Growth in Area, Yield and Production in Rajasthan, 1991-2010
Years Gross cropped area (000 ha)
Production (000 MT)
Yield (Kg/Ha)
1990-91 21429 16038 748
1995-96 19673 14996 762
2000-01 19230 13809 718
2005-06 21699 18763 865
2006-07 21534 21694 1007
2007-08 22208 23344 1051
2008-09 22771 24694 1084
2009-10 21745 18515 851
2010-11 24459 33607 1374 Source: GoR (2009).
If we consider the case of food grains production alone, it can be seen from
Table 5 that the growth in food grains production is quite impressive in Rajasthan
than at national level. The food grains production in Rajasthan has increased by
about 117 percent during two decades period, i.e. from 10.9 million tons in 1990-91 to
23.6 million tons in 2010-11. The share of the State food grains production in national
basket has increased by 3.6 percent points, i.e. from 6.2 per cent in 1990-91 to 9.8
per cent in 2010-2011.
Table 5:Foodgrain Production in Rajasthan and India
(Million tons)
Year Rajasthan India Rajasthan‟s share in India (%)
1990-91 10.9 176.4 6.2
2000-01 10.0 196.8 5.1
2006-07 14.9 217.3 6.9
2007-08 16.1 230.8 7.0
2008-09 16.7 234.4 7.1
2009-10 12.4 218.1 5.7
2010-11 23.6 241.6 9.8
Source: GoI (2012a).

9
2.2.2 Crop Specific Growth in Rajasthan
The major crops grown in different parts of Rajasthan are bajra, wheat, jowar, maize,
cotton, rapeseed and mustard, groundnut and horticultural crops (Map 1). As per the
cropping pattern in the state, the crop groups such as total cereals, oilseeds, pulses
and fodder crops account for about 42 per cent, 21 per cent, 18 per cent and 15 per
cent of GCA respectively during the year 2010-11(Figure 3). Among the cereals, bajra
(50.5%), wheat (27.9%), maize (10.5%) and jowar (6.7%) are the major crops; while
rapeseed and mustard (45.4%), taramira (21.7%), soyabean (14.0%), sesamum
(10.0%) and groundnut (6.3%) are the major oilseeds grown in the state. Among total
pulses, gram, moth and moong are the major crops, accounts for about 37.5 per cent,
33.5 per cent and 22.1 per cent respectively during 2010-11. It is evident from Figures
4 that the share of total cereals has declined drastically by 10 percent points (from 52
per cent in 1990-91 to 42.0 per cent in 2010-11); while the share of oilseeds has
increased by 6 percent points (from 15 per cent in 1990-91 to 21 per cent in 2010-
11). Thus, it can be assumed that there is shift in area from cereals to oilseeds.
Map 1: Crop Distribution in Rajasthan
Source: www.mapsofindia.com
10
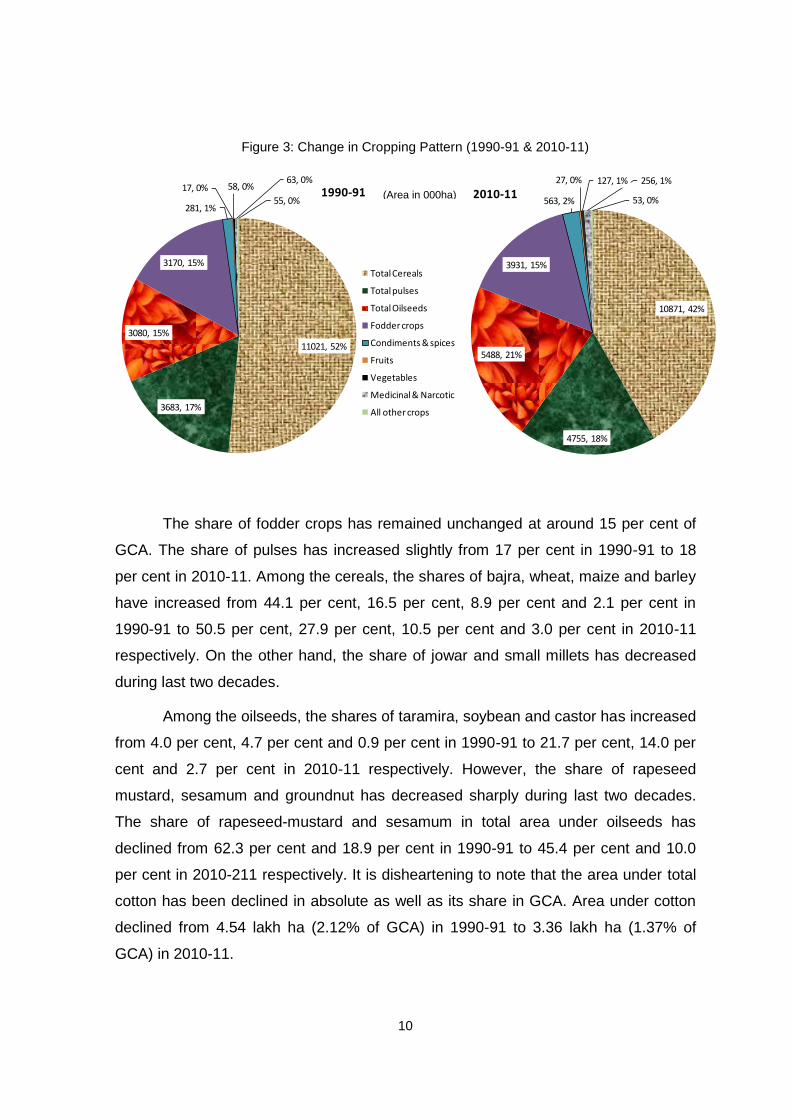
The share of fodder crops has remained unchanged at around 15 per cent of
GCA. The share of pulses has increased slightly from 17 per cent in 1990-91 to 18
per cent in 2010-11. Among the cereals, the shares of bajra, wheat, maize and barley
have increased from 44.1 per cent, 16.5 per cent, 8.9 per cent and 2.1 per cent in
1990-91 to 50.5 per cent, 27.9 per cent, 10.5 per cent and 3.0 per cent in 2010-11
respectively. On the other hand, the share of jowar and small millets has decreased
during last two decades.
Among the oilseeds, the shares of taramira, soybean and castor has increased
from 4.0 per cent, 4.7 per cent and 0.9 per cent in 1990-91 to 21.7 per cent, 14.0 per
cent and 2.7 per cent in 2010-11 respectively. However, the share of rapeseed
mustard, sesamum and groundnut has decreased sharply during last two decades.
The share of rapeseed-mustard and sesamum in total area under oilseeds has
declined from 62.3 per cent and 18.9 per cent in 1990-91 to 45.4 per cent and 10.0
per cent in 2010-211 respectively. It is disheartening to note that the area under total
cotton has been declined in absolute as well as its share in GCA. Area under cotton
declined from 4.54 lakh ha (2.12% of GCA) in 1990-91 to 3.36 lakh ha (1.37% of
GCA) in 2010-11.
Figure 3: Change in Cropping Pattern (1990-91 & 2010-11)
11021, 52%
3683, 17%
3080, 15%
3170, 15%
281, 1%
17, 0% 58, 0%63, 0%
55, 0%1990-91
Total Cereals
Total pulses
Total Oilseeds
Fodder crops
Condiments & spices
Fruits
Vegetables
Medicinal & Narcotic
All other crops
10871, 42%
4755, 18%
5488, 21%
3931, 15%
563, 2%
27, 0% 127, 1% 256, 1%
53, 0%2010-11(Area in 000ha)

11
Table 6 present the plan-wise growth in area, production and yield of major
crops in Rajasthan. It can be seen from the table that growth in area, production and
productivity of major crops was quite impressive during the 10th and 11
th Five Year
Plans. As expected, significant growth in production of major crops was due to high
rate of growth in yield of major crops. It can be also seen that area under food grains
in the state has declined at the rate of 1.87 per cent per annum during the 9th FYP.
However, same has suddenly positively jumped and increased at the rate of 10.22
per cent and 4.63 per cent during the 10th and 11
th FYPs respectively. Similarly, the
area under oilseeds has increased significantly by 2.72 per cent per annum during 9th
FYP, about 16.61 per cent per annum during 10th FYP and 10.96 per cent during 11
th
FYP.
Though the area under cotton has declined at the rate of 3.10 percent per
annum during 11th FYP, the production and yield of cotton has increased at very high
rate, i.e. 80.15 per cent and 85.9 per cent respectively during the corresponding
period. In the case of sugarcane, the plan period wise growth performance has been
very poor. The area, production and productivity of sugarcane have declined during
11th FYP at the rate of 19.1 per cent, 14.8 per cent and 5.3 percent per annum,
respectively. The production and yield of fruits and vegetables in the state has
exhibited a sharp increase during 10th FYP. Though the rate of growth in area under
medicinal and narcotic plants has increased by 0.68 per cent per annum during 9th
FYP, 6.4 per cent per annum during 10th FYP, the production and productivity of
these crops have exhibited negative trends. However, during 11th FYP period, the
growth in area, production and yield of medicinal and narcotics has been remarkable.

12
Time Period Bajra Maize Wheat Total
Cereals
Kharif
Pulses
Rabi
Pulses
Total
pulses
Total
Foodgrains
Kharif
Oilseeds
Rabi
Oilseeds
Total
Oilseeds
Cotton Sugarcane Condiments
& spices
Fruits Vegetables Medicinal
&
Narcotics
All Crops
Annual Plan 1991-92 -5.31 -3.51 -1.92 -23.26 -11.27 -37.11 -23.14 -10.80 13.91 16.49 15.66 4.35 36.81 3.42 -4.60 5.25 -7.31 -6.64
8th Five Year Plan(1992-97) -1.49 -0.70 2.39 -0.82 2.81 1.48 2.24 0.03 4.65 3.30 3.69 8.25 2.33 3.85 1.65 8.16 14.57 0.65
9th Five year Plan(1997-02) 2.19 1.22 -3.88 0.07 2.78 -18.46 -6.44 -1.87 2.72 -13.46 -8.45 -5.68 -20.95 10.45 3.97 5.98 0.68 -1.76
10th Five year Plan(2002-07) 11.17 1.21 9.25 8.69 12.67 22.58 15.49 10.22 8.99 20.62 16.61 -2.43 2.20 -8.01 5.56 7.07 6.40 12.98
11th Five year Plan (2007-11) 2.42 2.69 5.41 3.61 3.85 13.27 7.12 4.63 6.00 13.78 10.96 -3.10 -19.08 -0.72 1.56 -0.78 19.26 5.10
Annual Plan 1991-92 -56.99 -41.13 3.94 -23.34 -69.18 -32.81 -46.66 -27.01 -24.07 28.37 15.07 -7.97 13.10 -27.83 -64.06 0.87 -40.59 -20.42
8th Five Year Plan(1992-97) -5.42 0.47 7.14 2.30 2.91 8.24 6.06 2.80 4.51 10.05 8.56 7.62 3.39 5.22 15.00 11.65 -0.76 4.11
9th Five year Plan(1997-02) 11.07 4.88 -1.18 2.48 0.51 -20.96 -14.19 -0.06 1.84 -3.02 -1.32 -24.57 -21.85 10.27 -12.61 12.66 -7.78 -0.83
10th Five year Plan(2002-07) 47.95 6.46 12.29 17.52 48.52 25.78 32.20 18.64 32.92 30.34 31.00 31.16 10.51 0.88 67.74 27.29 -16.09 20.43
11th Five year Plan (2007-11) 12.83 1.53 13.52 11.80 19.07 39.92 27.98 13.57 6.16 22.76 16.02 80.15 -14.76 8.12 -18.51 -3.82 26.82 13.43
Annual Plan 1991-92 -54.58 -38.99 5.98 -0.11 -65.26 6.83 -30.61 -18.17 -33.35 10.21 -0.51 -11.81 -17.33 -30.21 -62.33 -4.17 -35.91 -5.76
8th Five Year Plan(1992-97) -3.99 1.17 4.63 3.15 0.09 6.66 3.73 2.78 -0.14 6.53 4.69 -0.58 1.04 1.32 13.14 3.23 -13.38 3.44
9th Five year Plan(1997-02) 8.69 3.61 2.80 2.40 -2.20 -3.06 -8.29 1.84 -0.86 12.06 7.79 -20.03 -1.14 -0.16 -15.95 6.31 -8.40 0.94
10th Five year Plan(2002-07) 33.09 5.19 2.79 8.12 31.82 2.61 14.47 7.64 21.95 8.06 12.34 34.42 8.13 9.66 58.91 18.88 -21.14 6.60
11th Five year Plan (2007-11) 10.16 -1.13 7.69 7.91 14.66 23.52 19.48 8.55 0.15 7.90 4.56 85.92 5.33 8.90 -19.76 -3.06 6.34 7.93
Table 6: Compound Annual Growth Rate in Area, Production and Yield (%) of major crops in Rajasthan
Area
Production
Yield
Source: GoR (2009)
13
2.3 Drivers of Growth in Agriculture
Agricultural growth in any region can occur because of (i) growth in crop output; (ii)
diversification of agriculture towards high valued crops and livestock products and (iii)
increase in value of the given output (Bhalla and Singh, 2009). Examining these three
aspects of agricultural growth in Rajasthan reveals that the overall growth in area,
yield and production of major crops in the state is quite impressive in recent past. The
share of oilseeds, pulses and horticultural crops in GCA has increased substantially
during the last two decades which proves that the process of diversification of
agriculture towards high valued crops is in right direction, while there is a need of
increasing the pace of diversification towards high valued cash crops in the state.
National Food Security Mission (NFSM) and the National Horticulture Mission (NHM)
have also emerged as the path breaking interventions which have helped in
agricultural diversification towards cash crops in Rajasthan (Swain et al, 2011; Dutta
and Kapadia, 2011). The growth in livestock in the state is also remarkable
(discussed in separate section). So far as the increase in value of the agricultural
output is concerned, it is noteworthy that the prices of agricultural commodities have
increased successively over the years in the state (Table 7) resulting in the rise in the
value of output. However, the majority of farmers don‟t get remunerative prices
because of constraints in marketing channels and infrastructures resulting in lower
value of their output. Farmers are unable to get Minimum Support Price (MSP)
because of monopolistic behaviour of the informal buyers/ traders who purchase the
agriculture production at the lower as compare to prevailing market price (GoR,
2012b).
The one of the key drivers of agricultural growth is the Gross Fixed Capital
Formation (GFCF) in agriculture as a percentage to agri-GDP. The GFCF in
agriculture & allied sector as percentage of agri-GDP has more than doubled during
last decade at all India level (GoI, 2012a). However, the same has declined from 9.7
per cent in 2005-06 to 6.0 per cent in 2010-11 in Rajasthan. The GFCF in agriculture
& allied sector as percentage of total GFCF has also declined from 10.8 per cent in
2005 to 6.2 per cent in Rajasthan (GoR, 2012c). Purohit and Reddy (1999) found that
the gross capital formation in agriculture in the state depicted the declining trend
during 1990s also.

14
It is worth mentioning here that the marginal returns evident in terms of poverty
alleviation or accelerating agricultural growth is much lower from input subsidies than
from investments in rural roads or agri-R&D or irrigation (Shenggen et al., 2008).
Thus, agricultural subsidies should be targeted more towards poor farmers and public
investment in agriculture should be accelerated for sustained long-term agricultural
growth. This would help in expansion of irrigation facilities which is very critical for
agricultural growth in Rajasthan, particularly keeping in view the fact that major part of
cultivable area (65.5%) is rainfed and the annual average rainfall in the State is very
scanty (57.35 cm) and erratic in nature.
2.4 Marketing and Warehouse Facilities
As discussed in the preceding section, adequate return on farmers‟ produce is one of
the driving forces for better agricultural growth. Better marketing channels and
warehouse facilities are essential for ensuring adequate returns on agricultural output
of farmers. However, it was found that the existing marketing and warehouse facilities
in the state are inadequate to meet the demands of the farmers. It may be noted from
Table 8 that only 440 godowns with warehousing capacity of 8.43 lakh tons are in
operation in Rajasthan. This implies that only 3 godowns with capacity of 6414 tons
are available for 1 lakh cultivators in the state. In contrary, if we look at the market
arrivals of crop output in Agricultural Produce Marketing Committee (APMCs)/market
yards in Rajasthan, it was found that the total market arrival in the state has been
more than doubled during the span of nine years period, i.e. increased from 689.3
lakh quintals in 2002-03 to 1444.9 lakh quintals in 2011-12. Thus, there is a need of
further expansion of network of warehouses in the state.
Table 7: Change in Yearly Average Prices of Agricultural Commodities
(Rs. per quintal)
Commodity
Average Price Change (%)
1990-91 2000-01 2008-09 1990-2000 2000-2008
Wheat 299 603 1062 101.7 76.1
Gram 281 466 867 65.8 86.1
Barley 658 1592 2116 141.9 32.9
Bajra 472 1214 NA 157.2 NA
Jowar 236 580 854 145.8 47.2
Maize 231 406 753 75.8 85.5
Mustard 237 493 800 108.0 62.3
Tarameera 949 1133 2349 19.4 107.3
Groundnut 1076 1318 2812 22.5 113.4
Til/ Sesamum 773 1075 2454 39.1 128.3
Source: Directorate of Agriculture Marketing , Government of Rajasthan, Jaipur.

15
In order to provide better marketing facilities and adequate returns on farmers
produce, the Directorate of Agriculture Marketing (DAM) has mandate to implement
'Mandi Regulation and Management' effectively. The Rajasthan State Warehousing
Corporation (RSWC), which is involved in creating godowns and warehouses in the
state (for scientific storage of agricultural produces, seeds, manures, fertilizers,
agricultural implements and other notified commodities of the farmers, co-operative
societies, traders, government and other institutions) is operating 90 warehouses in
31 districts of the State with total storage capacity of 7.88 lakh tons (as on December,
2011) and its utilization of the storage capacity is 92 per cent.
Table 8: Warehousing Capacity and No. of Godowns (as on 30th June , 2012)
Sl. No.
Particulars of Godowns No. of
Godowns Warehousing
Capacity (in M.Ts.)
Utilization Warehousing Capacity
(M.Ts.) (%)
1 Own constructed(RSWC) 413 787240 855398 109
2 Other Than Own Constructed
(a) Hired From KUMS/PWD/ GOVT/Corpn.
18 17000 16874 99
(b) Private 9 38890 39568 102
3 Total (a+b) 440 843130 911840 108
Source: Department of Agriculture, Government of Rajasthan, Jaipur.
2.5 Emerging Demand-Supply Imbalances
With change in taste and preference of consumers and higher expenditure elasticity
for fruits & vegetables and livestock as compared to cereals, there is an increasing
pressure on the prices of such high value perishable commodities. It is observed that
the per capita monthly consumption of cereals has declined from 14.80 kg in 1983-84
to 12.11 kg in 2004-05 and further to 11.35 kg in 2009-10 in the rural areas of India.
In the urban areas as well, it has declined from 11.30 kg in 1983-84 to 9.94 kg in
2004-05 and to 9.37 kg in 2009-10 (GoI, 2012a). Similar pattern has been observed
in Rajasthan where the per capita monthly consumption of total cereals has declined
from 14.9 kg in 1993-94 to 12.7 kg in 2004-05; whereas the per capita monthly
consumption of fruits and vegetables has increased from 1.1 kg and 2.5 kg in 1993-
94 to 2.2 kg and 4.0 kg in 2004-05 respectively (NSSO, 1993; 2004). However, the
agricultural production basket in the state is not fully aligned to the emerging demand
patterns.

16
3.0 Natural Resource Management
Land, water resources, soil and biodiversity which are the natural resources for
agriculture are under considerable strain. The demand for meeting food and water for
a growing population from shrinking natural resource base has shifted the focus to
enhance agricultural production in sustainable manner.
3.1 Agro-Climate and Soils
The arid zone of Rajasthan spread over 12 districts occupied about 61 per cent of
total geographical area of the State. The semi-arid and humid regions account for
about 16 per cent and 15 per cent of the total area, while sub-humid region
constitutes about 8 per cent of total landmass. Rajasthan has varying topographic
features though a major part of the state is dominated by parched and dry region. The
extensive topography includes rocky terrain, rolling sand dunes, wetlands, barren tracts
or land filled with thorny scrubs, river-drained plains, plateaus, ravines and wooded
regions. The distinctive features of 10 Agro-Climatic Zones are presented in Table 9.
Zone Area Total Area
(million
ha)
District
Covered
Average
Rainfall
(mm)
Soils
Max. Min. Kharif Rabi
IA Arid
w estern
plain
4.74 Barmer & part
of Jodhpur
200-370 40 8 Pearlmillet
Mothbean
Sesame
Wheat,
Mustard,
Cumin
Desert soils and sand
dunes aeolian soil,
coarse sand in texture
some places
calcareous
IB Irrigated
north
w estern
plain
2.1 Sriganganaga
r,
Hanumangarh
100-350 42 4.7 Cotton,
Clusterbean
Wheat,
Mustard,
Gram
Alluvial deposites
calcareous, high
soluble salts &
exchangeable sodium
IC Hyper arid
partial
irrigated
zone
7.7 Bikaner,
Jaisalmer,
Churu
100-350 48 3 Pearlmillet
Mothbean
Clusterbean
Wheat,
Mustard,
Gram
Desert soils and sand
dunes aeolian soil,
loamycoarse in
texture & calcareous
IIA Internal
drainage
dry zone
3.69 Nagaur, Sikar,
Jhunjhunu,
Part of Churu
300-500 39.7 5.3 Pearlmillet
Clusterbean
Pulses
Mustard,
Gram
Sandy loam, sallow
depth red soils in
depressions
IIB Transitional
plain of Luni
basin
3 Jalore, Pali,
Part of Sirohi,
Jodhpur
300-500 38 4.9 Pearlmillet
Clusterbean
sesame
Wheat,
Mustard
Red desert soils in
Jodhopur, Jalore & Pali
sierzems in Pali,Sirohi
IIIA Semi arid
eastern
plains
2.96 Jaipur, Ajmer,
Dausa, Tonk
500-700 40.6 8.3 Pearlmillet
Clusterbean
Sorghum
Wheat,
Mustard,
Gram
Sierozens, eastern
part alluvial, w est
north w est lithosols,
foot hills, brow n soils
IIIB Flood prone
eastern
plain
2.77 Alw ar,
Dholpur,
Bharatpur,
Karoli,
S.Madhopur
500-700 40 8.2 Pearlmillet
Clusterbean
Groundnut
Wheat,
Barley,
Mustard,
Gram
Alluvial prone to w ater
logging, nature of
recently alluvial
calcareous has been
observed
IVA Sub-humid
southern
plains
3.36 Bhilw ara,
Sirohi,
Udaipur,
Chittorgarh
500-900 38.6 8.1 Maize,
Pulses,
Sorghum
Wheat,
Gram
Soil are lithosolsat foot
hills & alluvials in
plains
IVB Humid
sothern
plains
1.72 Dungarpur,
Udaipur,
Bansw ara,
Chittorgarh
500-1100 39 7.2 Maize,
Paddy
Sorghum
Blackgram
Wheat,
Gram
Predominantly reddish
medium texture, w ell
drained calcareous,
shallow on hills, deep
soils in valleys
V Humid south
eastern
plain
2.7 Kota,
Jhalaw ar,
Bundi, Baran
650-1000 42.6 10.6 Sorghum
Soyabean
Wheat,
Mustard
Black of alluvial origin,
clay loam,
groundw ater salinity
Table 9. Salient Features of Agro-Climatic Zones of Rajasthan
Temperature Major Crops
Source : w w w .krishi.rajasthan.gov.in

17
The average rainfall in the state varied from 100 mm to 1100 mm across
various zones. Temperature also varied widely from as low as 3 o C to as high as 48
o
C across the zones. Five distinct specifications of soils viz., Aridiosols, alfisols,
entisols, inceptisols and vertisols are found in the state.
3.2 Land Use Pattern and Cropping Intensity
Rajasthan with its huge geographical area of 342.7 lakh hectares is the largest state
of India (Table 10). About 57 per cent of state‟s geographical area consists of desert
which accounts for 61 per cent of the desert of the country. The forest area has
hovered around 8 per cent of total reporting area while the net area sown has been
largely fluctuating in the state over the years, which has declined during recent past,
i.e. from 175.5 lakh hectares in 2008-09 to 169.7 lakh hectares in 2009-10.
Year
Total Reported Area 342.5 (100.0) 342.6 (100.0) 342.7 (100.0) 342.7 (100.0) 342.7 (100.0)
Forest 23.5 (6.9) 26.1 (7.6) 27.3 (8.0) 27.3 (8.0) 27.4 (8.0)
Area under Non-Agricultural
uses14.9 (4.4) 17.4 (5.1) 18.5 (5.4) 19.7 (5.7) 19.8 (5.8)
Barren & Un-Culturable land 27.9 (8.1) 25.7 (7.5) 24.2 (7.1) 23.0 (6.7) 22.9 (6.7)
Permanent Pastures and
other Grazing Land19.1 (5.6) 17.1 (5.0) 17.0 (5.0) 17.0 (5.0) 17.0 (5.0)
Land under Misc.-Tree Crops
& Grooves 0.2 (0.1) 0.1 (0.0) 0.2 (0.0) 0.2 (0.1) 0.2 (0.1)
Culturable Waste Land 55.7 (16.3) 49.1 (14.3) 45.7 (13.3) 43.4 (12.7) 44.7 (13.1)
Fallow Land Other than
Current Fellows19.3 (5.6) 24.4 (7.1) 21.7 (6.3) 21.1 (6.1) 20.5 (6.0)
Current Fellows 18.1 (5.3) 24.2 (7.0) 17.2 (5.0) 15.7 (4.6) 20.6 (6.0)
Net Area Sown 163.8 (47.8) 158.6 (46.3) 171.0 (49.9) 175.5 (51.2) 169.7 (49.5)
Aera Sown More than once 30.0 (8.8) 33.7 (9.8) 51.1 (14.9) 52.2 (15.2) 47.7 (13.9)
Total Cropped Area 193.8 (56.6) 192.3 (56.1) 222.1 (64.8) 227.7 (66.4) 217.4 (63.5)
Net Irrigated area* NA NA 64.4 (37.7) 62.5 (35.6) 58.5 (34.5)
Gross Irrigated Area** NA NA 80.9 (36.4) 79.1 (34.7) 73.1 (33.6)
Cropping Intensity (%) 118.3 121.2 129.9 129.7 128.1
Source : GoR (2011c)
Table 10: Land Use Pattern in Rajasthan
(Area in lakh hectares)
1990-91 2000-01 2007-08 2008-09 2009-10
Notes: Figures in parentheses are percentages of total reported area.
* Figures in parentheses are percentages of NSA and **Figures in parentheses are percentages of GCA.
However, the gross cropped area has increased by about 7 percent points (to
reporting area) in 2009-10 over 1990-91. The increase in GCA was due to significant
increase in area sown more than once. The cropping intensity has also considerably

18
increased over the years. It has increased from 121.2 per cent in 2000-01 to 129.9
per cent in 2007-08 and thereafter declined to 128.1 per cent in 2009-10. It may be
also worth to note here is that gross irrigated area has declined from 80.9 lakh
hectares in 2007-08 to 73.1 lakh hectares in 2009-10. On the other hand, land put to
non-agricultural uses has successively increased from 14.9 lakh hectares in 1990-91
to 19.8 lakh hectares in 2009-10.
3.3 Operational Land Holdings and Land Ceiling Limit
Though several factors are attributed for lowering of agricultural productivity in some
parts of the state, many consider skewed distribution of agricultural land, small size of
operational holding, high incidence of share tenancy and rural poverty as the major
impediments to agricultural growth. The size-wise distribution of operational holdings
and area operated (Table 11) shows that during the year 2005-06, the majority of
farm operators belonged to marginal and small land holding categories (cultivating
less than 2 hectares of land). They constituted about 55 per cent of total number of
operational holdings, but operated only 14 per cent of total operational area. On the
other hand, the large farmers (operating land area more than 10 hectares)
constituting only 6.9 per cent of total holdings occupied a substantial proportion (i.e.,
36.6%) of total operational area. Thus, the distribution of land area has been much
skewed in favour of large farmers. The average size of operational holdings in the
State was 3.38 hectares during 2005-06. The average size of land holdings in the
case of large farmers and medium farmers is 17.88 hectares and 6.16 hectares
respectively, while that in the case of marginal and small farmers is just 0.49 hectares
and 1.43 hectares respectively in Rajasthan.
Table 11:Land Holding Pattern in Rajasthan (2005-06)
Sl. No.
Size Class Total Holdings Average Size of Holdings
(ha) Number Area (Ha)
1 Marginal (0-1 ha.) 2073099 (33.5) 1016368 (4.9) 0.49
2 Small (1-2 ha.) 1321126 (21.4) 1895062 (9.1) 1.43
3 Semi medium (2-4 ha.) 1260369 (20.4) 3569694 (17.0) 2.83
4 Medium (4-10 ha.) 1103263 (17.8) 6796010 (32.5) 6.16
5 Large (>10 ha) 428625 (6.9) 7661858 (36.6) 17.88
6 All Size Group 6186482 (100.0) 20938992 (100.0) 3.38
Note: Figures in parentheses are percentages of total.
Source: GoR (2011c)

19
The distribution of land holdings and average size of operational holdings in
the state clearly indicate that there is disparity and inequality. Large number of
cultivators owing relatively less land, while big land owners which are small in number
owning larger acreage of land. It leads to disparities in the incomes in the rural areas.
In view of this, attempt was made in the past to distribute the excess land through
land reform. The first Five-Year Plan categorically emphasizes that there should be
an absolute limit to the size of land which any individual may hold. As stated in Table
12, the actual land ceilings in Rajasthan have been earmarked keeping in view the
suggested national guidelines of 1972. However, the higher limits of suggested
national guidelines have been picked up in Rajasthan for irrigated lands. But for the
dry lands that is much larger in size in Rajasthan compared to other states, the ceiling
limits have been stretched from 21.85 hectares to 70.82 hectares.
Table 12. Ceiling Limits on Land Holdings
(in Hectares)
Irrigated with two crops
Irrigated with one crop
Dry land
Suggested in National Guidelines of 1972 4.05 to 7.28 10.93 21.85
Actual Ceilings in Rajasthan 7.28 10.93 21.85 to 70.82
Source: www.indiaagronet.com
3.4 Water Resources
The state represents 10.4 per cent of the total land mass with 5.5 per cent population
and 18.7 per cent of livestock of the country, but it has only 1.2 per cent of total
surface water available in the country. The state is divided into 14 river basins. Except
in canal command area in the north, surface water potential is very low in the central,
western and southern parts of the state (CAZRI, 2009). Total surface water
availability in the State is 21.71 Billion Cubic Metres (BCM), out of which 16.05 BCM
is economically utilizable. The state has so far harnessed 72 per cent of economically
utilizable portion (GoR, 2010b). The rivers of the state are rain-fed and there is no
perennial river except Chambal. Out of total 142 desert blocks of the country, 85
blocks are in the state, which aggravates the level of water crisis in the state. Further,
water scarcity in the state constrains the development of agriculture, inhibits
improvements in sanitation and health, and causes special hardship to women who
have to travel long distances to fetch water.

20
The availability of ground water resources in the state is also at quite alarming
stage. The situation has been worsened in the last two decades. The level of ground
water exploitation, which was just 35 per cent in 1984, has reached a level of 138
per cent in 2008. Out of 237 blocks in the state, only 30 blocks are in safe category,
140 blocks have been placed under overexploited‟ category and 50 blocks under
„critical‟ category (GoR, 2010b). This scenario envisages an urgent need to replenish
the ground water resources.
3.5 Weather and Climate
As mentioned earlier, the state has a tropical desert climate. The arid and semi-arid
areas constitute about two-third of total geographical area of the state. The analysis
on two major climatic factors, viz., rainfall and temperature has been made in this
section. The analysis on rainfall pattern in Rajasthan reveals that the average rainfall
in the state is 57.4 cm (Table 13), compared to the all-India average of 110 cm. The
period of monsoon is very short ranging around 60 to 75 days. On an average, its
onset is late and withdrawal is early as compared to other states and one or two dry
spells is a common phenomenon.
Table 13: Rainfall Pattern in Rajasthan
Year Normal
Rainfall (cm)
June to September
October to January
February to May
June to May
(total)
% Deviation from Annual
Normal
1990-91 57.51 69.93 0.98 1.82 72.73 20.9
(96.2) (1.3) (2.5) (100.0)
2000-01 57.51 35.15 0.3 4.9 40.35 -42.5
(87.1) (0.7) (12.1) (100.0)
2005-06 57.51 53.12 0.24 3.42 56.95 -1.0
2006-07 57.51 62.5 0.68 5.62 68.8 16.4
2007-08 57.51 47.82 0.14 3.43 51.38 -11.9
2008-09 57.51 53.44 1.09 0.99 55.52 -3.6
2009-10 57.35 38.5 4.67 0.49 43.66 -31.4
(88.2) (10.7) (1.1) (100.0)
CV (%) 24.0 137.6 65.7 21.6
Notes: The figures in parentheses are the percentages of total; CV stands for Coefficient of Variation.
Source: www.krishi.rajasthan.gov.in

21
Rainfall in large parts of Rajasthan is not only inadequate but also varies
sharply from year to year. Consequently, droughts are perceived as a normal and
cyclical occurrence. It may be noted that the deviation of annual rainfall from long-
term normal varied greatly up to (-) 42.5 per cent. The coefficient of variation of
annual rainfall during monsoon period is about 24 per cent in Rajasthan. The percent
of the total rainfall received during monsoon season varied from 87.1 per cent to 96.2
per cent of total rainfall.
The analysis on variation in annual rainfall across different regions reveals that
it is most erratic in the western region with frequent dry spells, punctuated
occasionally by heavy downpour in some years associated with the passing low
pressure systems over the region (Rathore, 2004). As stated in Table 9, Bikaner,
Jaisalmer, Churu, Hanumangarh and Sri Ganganagar districts in arid western plain
and north-western plain receive annual rainfall varying from 10 cm to 30 cm. On the
other hand, the districts in humid south-eastern plain such as Dungarpur, Udaipur,
Banswara and Chittorgarh receive the annual rainfall in the range of 65 cm to 100 cm.
As far as the pattern of temperature is concerned, it can be seen from the
Table 9 that temperature in the state varies widely from as low as 3°C to as high as
48°C across the agro-climatic zones. The temperature keeps rising progressively
from March through April, May and June. West of Rajasthan and the eastern side of
Aravalli Range, in the region of Bikaner, Phalodi, Jaisalmer and Barmer, the
maximum daily temperature hovers around 40°C to 45°C. Sometimes, it even
reaches as high a 49°C during the summer months. Night temperature during
summer fall considerably around 20°C to 29°C. As noted by Pant and Hingane
(1988), a gradual decreasing trend in the mean annual temperature for the region of
northwest India including Rajasthan has been observed. After Jammu and Kashmir,
Rajasthan is the second state where maximum number of cold waves has occurred
(De, et al., 2005).
3.6 Disaster and Calamity Management
In Rajasthan, there have been 48 drought years of varied intensity during last century
(i.e. from 1901 to 2002), which means that the chance of occurrence of a
meteorological drought in the state is 47 per cent (Rathore, 2004). The state has the
maximum probability of occurrence of droughts in India (Singh et al., 2010). A
22
detailed analysis has revealed that during the past 9 years period, none of the
districts in the state were affected by drought. The number of severe and very severe
drought years is larger in the western and southern part of Rajasthan, even though
the southern region receives high average rainfall (GoR, 2011). Many places in
Rajasthan have witnessed flash floods due to heavy rainfall events. Floods in July
1981 in Jaipur, Tonk, Nagaur and in 2006 over Barmer are few examples. All these
floods have resulted in unprecedented loss of lives and property (GoR, 2011).
Keeping in view the increase in the frequency and intensity of disasters such as
droughts, floods, frost etc. in the recent years, the Draft State Agriculture Policy (GoR,
2012a) has proposes to make the information and communication systems more
effective and reliable, to put in place the needed climate services and to strengthen
the contingency planning and resources availability.
4.0 Farm Inputs and Management
In addition to harsh agro-climatic conditions, limited access to inputs (land, irrigation
water, seeds and fertilizers), technology, farm credit and markets has limited the
growth of agriculture development in Rajasthan. The limited access to inputs and
unstable climatic conditions have resulted in a predominance of low productivity, risk-
minimizing and subsistence-oriented farming systems (often integrating crop and
livestock production) capable of resilience (within limits) against droughts as well as
able to produce a marketable surplus in years of good monsoon rainfalls (GoR,
2012b). Thus, there is need to strengthen the input delivery system in the state.
4.1 Seeds and Fertilizer
Seed is considered to be a catalyst of change in agriculture. The Green Revolution in
India during the late sixties and seventies bears witness to this truth. And lately,
during the decade of 2000s, Bt cotton seeds and hybrid maize seeds have shown
spectacular results (GoI, 2012a). However, the availability of quality/certified seeds
has been limited in various part of Rajasthan. It can be seen from the Figure 4 that
there has been significant shortfall in availability of quality/certified seeds in Rajasthan
during 2011-12. The shortfall of seed to total requirement during kharif and rabi
season was 12.6 per cent and 31.8 per cent respectively. Thus, unavailability of seed
in time and adequate quantity has the potential negative effects on agricultural output.
However, the seed replacement rate (SRR) has improved during the recent past. The

23
SRR of jowar, bajra, groundnut, soyabean has increased by 104.7 per cent, 27.3 per
cent, 46.0 per cent and 64.8 per cent respectively from 2008-09 to 2011-12. The SRR
of some major crops during 2011-12 has been presented in Figure 5.
58.8
18.4
51.7
8.6
23.9
16.020.9
38.7
5.3
23.7
6.7
30.0
42.2
98.0
9.6
23.4
34.0 33.3
11.4
85.9
29.7
0.0
20.0
40.0
60.0
80.0
100.0
120.0
Baj
ara
Jow
ar
Mai
ze
Pad
dy
Mo
on
g
Ura
d
Arh
ar
Co
wp
ea
Mo
th
Sesa
mu
m
Gro
un
dn
ut
Soyb
ean
Cas
tor
Co
tto
n
Gu
ar
Kh
arif
Ave
rage
Wh
eat
Bar
ley
Gra
m
Mu
star
d
Rab
i Ave
rage
Figure 5: Seed Replacement Rate (%) in Rajasthan (2011-12)
Figure 4: Requirement and Distribution of Certified /Quality Seeds
0
500000
1000000
1500000
2000000
2500000
Requirment Achivement Requirment Achivement
2010-11 2011-12
Kharif Average Rabi Average Total
Seed (
qtls)

24
Table 14 :Consumption of Fertilizers in Rajasthan
(Qty. in M. Tonnes)
N/P/K 2007-08 2008-09 2009-10 2010-11 2011-12
(Estimated)
% Change in 2010-11 over 2007-
08
% Change in 2011-12 over 2007-
08
N 705335 709533 721962 870392 924730 23.40 31.11
P 260464 319022 316184 413303 409226 58.68 57.11
K 20912 23470 34748 34950 44832 67.13 114.38
Total 986711 1052025 1072894 1318645 1378788 33.64 39.74
NPK Use in kg/ha of GCA
44.43 46.20 49.34 NA 56.77 NA 22.87
Notes : N - Nitrogenous, P - Phosphetic, K – Potasic; NA- not available
Source: Directorate of Agriculture, Krishi Bhavan, Government of Rajasthan, Jaipur.
4.2 Farm Mechanization
There is a strong correlation between the farm mechanization and agricultural
productivity. The states with greater availability of farm power show higher
productivity as compared to the others (GoI, 2012a). Among various types of farm
machinery, tractors, power tillers and diesel engines and electric motors are the major
ones. India is the largest manufacturer of tractors in the world, accounting for about
one-third of the global production. The pace of farm mechanization has been
satisfactory during last couple of decades. The share of agricultural workers and
draught animals in total labour force have come down from 63.5 per cent in 1971-72
to 13.67 per cent in 2009-10; whereas that of tractors, power tillers, diesel engines
and electric motors has gone up from 36.51 percent to 86.33 per cent during the
same period at all India level (Singh et al., 2011).
The sale of tractors and power tillers in India has increased significantly from
296.1 thousands and 22.3 thousands in 2005-06 to 545.1 thousands and 55
thousands in 2010-11 respectively. Out of the total sale of tractors, Madhya Pradesh
and Rajasthan accounts for 21 per cent. The electric power consumption is also one
of the major aspects of the farm mechanization. Compared to the 20.98 per cent of
total power consumption used in agriculture at all India level during 2009-10,
Rajasthan consumes about 39.42 per cent of its total electricity in agriculture alone
(GoI, 2012b).

25
As suggested in State Agriculture Policy (GoR, 2012a), seed-cum-fertilizer
drill, zero till drill, lazer levelers and various farm implements and tools need to be
popularized along with bullock drawn implements for small and marginal farmers.
Seed dressers, sprayers, weeding implements, and other drudgery reduction
implements are to be popularized. Custom hiring system is to be promoted and
popularized using the concept of Agri-Clinics
4.3 Irrigation
Irrigation is also the important input in crop production. Out of the total gross cropped
area in the state during 2009-10 (217.4 lakh ha), about 33.6 percent area was
irrigated. The net irrigated area was about 58.5 lakh hectares constituting about 34.5
per cent of net sown area in 2009-10 (Table 15). The cropping intensity and irrigation
intensity in the state has gradually declined. The irrigation intensity has declined from
125.5 per cent in 2007-08 to 124.9 per cent in 2009-10. It can be seen from Figure 6
that irrigation from canal and open wells has drastically declined from 38 per cent and
49 per cent in 1990-91 to 29 per cent and 27 per cent respectively. On the other
hand, the gross irrigated area under tube wells has sharply increased from 9 per cent
in 1990-91 to 43 per cent in 2009-10. Thus, the pressure on groundwater exploitation
has considerably increased in Rajasthan.
Table 15: Irrigated Area in Rajasthan during 2007-08 to 2009-10 (Area in '000 ha)
Sl.No. Year
Gross irrigated
area (GIA)
Net irrigated
area (NIA)
Gross cropped
area (GCA)
Net sown area
(NSA)
GIA as % to GCA
NIA as % to NSA
Cropping intensity
(%)
Irrigation intensity
(%)
1 2007-08 8088.46 6444.06 22208.29 17095.67 36.42 37.69 129.91 125.52
2 2008-09 7909.93 6245.05 22771.26 17551.41 34.74 35.58 129.74 126.66
3 2009-10 7308.77 5849.91 21744.88 16974.49 33.61 34.46 128.10 124.94
Source: Agriculture Statistics of Rajasthan 2007 to 2009-10, Directorate of Economics and Statistics, GoR, Jaipur.
Ground water level is available only at a depth of 30m to 61m. Rajasthan
farmers depend on different sources of irrigation that include tube wells, wells and
tanks. The Punjab Rivers in the north, the Narmada River in the south and the Agra
Canals from Haryana and Uttar Pradesh provide water to the dry land of Rajasthan.
Northwestern Rajasthan is irrigated by the Indira Gandhi Canal.

26
4.4 Labour and Agricultural Wages
The total working population in Rajasthan has increased by 70.8 per cent in 2001
over 1991, i.e. increased from 139.2 lakh in 1991 to 237.7 lakh in 2001(GoI, 2001).
Total number of cultivators has increased from 81.8 lakh in 1991 to 131.4 lakh in
2001. However, the share of total cultivators in total workforce has declined from 58.8
per cent in 1991 to 55.3 per cent in 2001. On the other hand, the share of agricultural
labourers and other labourers in total workforce has increased from 10.0 per cent and
31.2 per cent in 1991 to 10.6 per cent and 34.1 per cent in 2001 respectively. It is
worth mentioning that the share of total female workers has sharply increased by 232
per cent, i.e. increased from 27.33 lakh in 1991 to 90.7 lakh in 2001. The share of
female cultivators has increased by 220.7 per cent (increased from 18.95 lakh in 1991
to 60.77 lakh in 2001). The share of female agricultural labourers in total labourers
has increased by 195.0 per cent from 4.98 lakh in 1991 to 14.69 lakh in 2001.
As far as agricultural wages are concerned, the minimum agricultural wages
for all operations was Rs 100/- in 2010 that has increased to Rs 135/- with effect from
January 2011. However, the actual labour rates vary from Rs 175/- to Rs 225/- per
man days in different districts of the state. Especially after implementation of
Mahatma Gandhi National Rural Employment Guarantee Act (MNREGA) in 2006, the
availability of farm labourers has been reduced considerably (Swain and Sharma,
2011), mainly at the time of intercultural operations and harvesting of the crops.
Figure 6: Change in Gross Irrigated Area by Sources (1990-91 & 2009-10)
Tubewells9%
Open wells49%
Canals38%
Tanks4%
Others0% 1990-91
Tubewells Open wells Canals Tanks Others
Tubewells43%
Open wells27%
Canals29%
Tanks0%
Others1%2009-10
Tubewells Open wells Canals Tanks Others

27
4.5 Credit and Insurance
Credit availability and agricultural insurances are important drivers of growth in
agriculture. However, the formal credit is readily available to elite class people such
as large and wealthy farmers who are trusted by the institutional lenders because of
their greater repayment capacity. On the other hand, the access of poor marginal and
small farmers to institutional credit is quite limited (Swain, 2001; Swain and Swain,
2007). If we look at the disbursement of institutional credit in rural Rajasthan (Table
16), it is evident that only about 54.4 per cent of targeted amount of agricultural loans
has been disbursed during 2011-12. The analysis on the composition of agricultural
loans by sources reveals that about 49.1 per cent of total agricultural loans and about
44.1 per cent of total crop loans were disbursed by commercial banks. The
cooperative banks disbursed about 30.3 per cent of total loans as agricultural loans.
Table 16: Source wise Agricultural Credit Disbursement in Rajasthan during 2011-12
( Rs in Crore)
Type of Loans
Target/ Achievement
Commercial Bank
Regional Rural Banks
Cooperative Bank
Others Total
Crop Loan
Target 10612 4288 7807 9 22716
Achievement 5785 2871 4450 0 13106
(54.5) (67.0) (57.0) (0.0) (57.7)
Term Loan
Target 4642 809 1221 24 6696
Achievement 2071 429 406 0 2906
(44.6) (53.0) (33.3) (0.0) (43.4)
Total Agriculture loan
Target 15254 5097 9028 33 29412
Achievement 7856 3300 4856 0 16012
(51.5) (64.7) (53.8) (0.0) (54.4)
Note : Figures in parentheses are the percentages of targeted loan amount Source: Directorate of Agriculture, Government of Rajasthan, Jaipur.
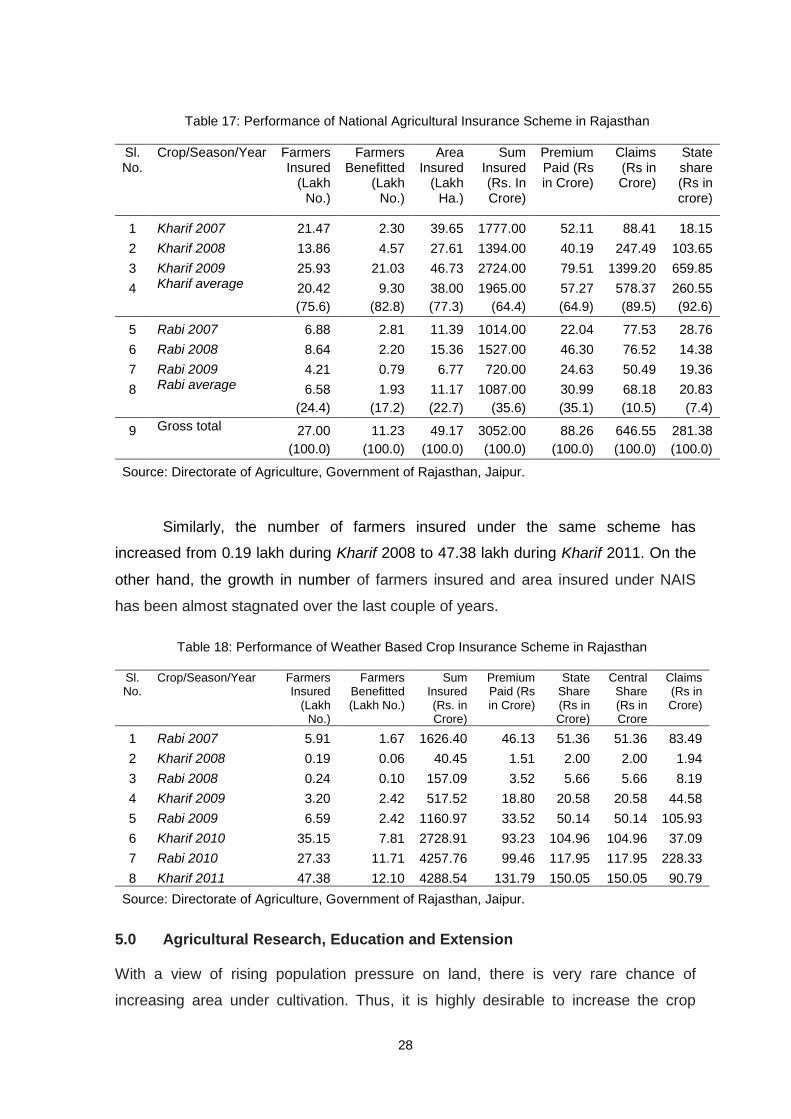
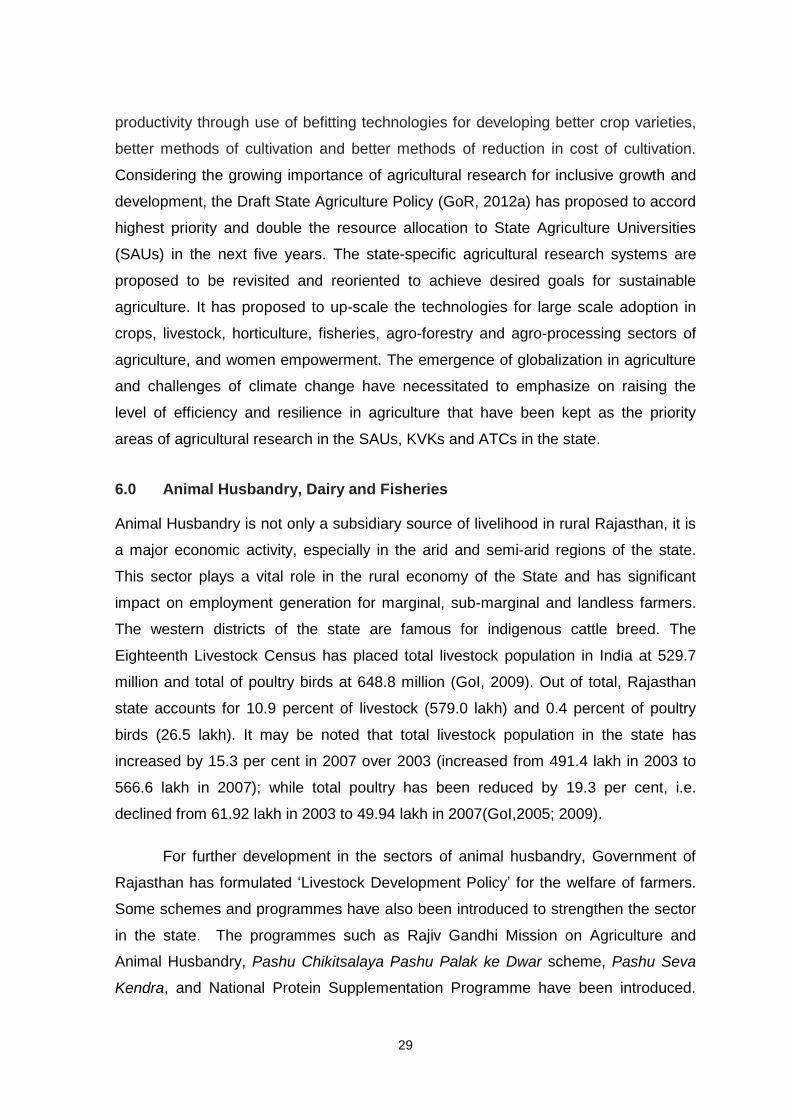
As far as the status of agricultural insurance and weather based crop
insurance is concerned, it may be noted from Table 17 and Table 18 that
performance of weather based crop insurance has been much better than that of
National Agricultural Insurance Scheme (NAIS). The number of farmers insured under
the weather based crop insurance has increased from 1.67 lakh during Rabi 2007 to
27.33 lakh during Rabi 2011.
28
Table 17: Performance of National Agricultural Insurance Scheme in Rajasthan
Sl. No.
Crop/Season/Year Farmers Insured
(Lakh No.)
Farmers Benefitted
(Lakh No.)
Area Insured
(Lakh Ha.)
Sum Insured (Rs. In Crore)
Premium Paid (Rs in Crore)
Claims (Rs in Crore)
State share (Rs in crore)
1 Kharif 2007 21.47 2.30 39.65 1777.00 52.11 88.41 18.15
2 Kharif 2008 13.86 4.57 27.61 1394.00 40.19 247.49 103.65
3 Kharif 2009 25.93 21.03 46.73 2724.00 79.51 1399.20 659.85
4 Kharif average 20.42 9.30 38.00 1965.00 57.27 578.37 260.55
(75.6) (82.8) (77.3) (64.4) (64.9) (89.5) (92.6)
5 Rabi 2007 6.88 2.81 11.39 1014.00 22.04 77.53 28.76
6 Rabi 2008 8.64 2.20 15.36 1527.00 46.30 76.52 14.38
7 Rabi 2009 4.21 0.79 6.77 720.00 24.63 50.49 19.36
8 Rabi average 6.58 1.93 11.17 1087.00 30.99 68.18 20.83
(24.4) (17.2) (22.7) (35.6) (35.1) (10.5) (7.4)
9 Gross total 27.00 11.23 49.17 3052.00 88.26 646.55 281.38
(100.0) (100.0) (100.0) (100.0) (100.0) (100.0) (100.0)
Source: Directorate of Agriculture, Government of Rajasthan, Jaipur.
Similarly, the number of farmers insured under the same scheme has
increased from 0.19 lakh during Kharif 2008 to 47.38 lakh during Kharif 2011. On the
other hand, the growth in number of farmers insured and area insured under NAIS
has been almost stagnated over the last couple of years.
Table 18: Performance of Weather Based Crop Insurance Scheme in Rajasthan
Sl. No.
Crop/Season/Year Farmers Insured
(Lakh No.)
Farmers Benefitted (Lakh No.)
Sum Insured (Rs. in Crore)
Premium Paid (Rs in Crore)
State Share (Rs in Crore)
Central Share (Rs in Crore
Claims (Rs in Crore)
1 Rabi 2007 5.91 1.67 1626.40 46.13 51.36 51.36 83.49
2 Kharif 2008 0.19 0.06 40.45 1.51 2.00 2.00 1.94
3 Rabi 2008 0.24 0.10 157.09 3.52 5.66 5.66 8.19
4 Kharif 2009 3.20 2.42 517.52 18.80 20.58 20.58 44.58
5 Rabi 2009 6.59 2.42 1160.97 33.52 50.14 50.14 105.93
6 Kharif 2010 35.15 7.81 2728.91 93.23 104.96 104.96 37.09
7 Rabi 2010 27.33 11.71 4257.76 99.46 117.95 117.95 228.33
8 Kharif 2011 47.38 12.10 4288.54 131.79 150.05 150.05 90.79
Source: Directorate of Agriculture, Government of Rajasthan, Jaipur.
5.0 Agricultural Research, Education and Extension
With a view of rising population pressure on land, there is very rare chance of
increasing area under cultivation. Thus, it is highly desirable to increase the crop
29
productivity through use of befitting technologies for developing better crop varieties,
better methods of cultivation and better methods of reduction in cost of cultivation.
Considering the growing importance of agricultural research for inclusive growth and
development, the Draft State Agriculture Policy (GoR, 2012a) has proposed to accord
highest priority and double the resource allocation to State Agriculture Universities
(SAUs) in the next five years. The state-specific agricultural research systems are
proposed to be revisited and reoriented to achieve desired goals for sustainable
agriculture. It has proposed to up-scale the technologies for large scale adoption in
crops, livestock, horticulture, fisheries, agro-forestry and agro-processing sectors of
agriculture, and women empowerment. The emergence of globalization in agriculture
and challenges of climate change have necessitated to emphasize on raising the
level of efficiency and resilience in agriculture that have been kept as the priority
areas of agricultural research in the SAUs, KVKs and ATCs in the state.
6.0 Animal Husbandry, Dairy and Fisheries
Animal Husbandry is not only a subsidiary source of livelihood in rural Rajasthan, it is
a major economic activity, especially in the arid and semi-arid regions of the state.
This sector plays a vital role in the rural economy of the State and has significant
impact on employment generation for marginal, sub-marginal and landless farmers.
The western districts of the state are famous for indigenous cattle breed. The
Eighteenth Livestock Census has placed total livestock population in India at 529.7
million and total of poultry birds at 648.8 million (GoI, 2009). Out of total, Rajasthan
state accounts for 10.9 percent of livestock (579.0 lakh) and 0.4 percent of poultry
birds (26.5 lakh). It may be noted that total livestock population in the state has
increased by 15.3 per cent in 2007 over 2003 (increased from 491.4 lakh in 2003 to
566.6 lakh in 2007); while total poultry has been reduced by 19.3 per cent, i.e.
declined from 61.92 lakh in 2003 to 49.94 lakh in 2007(GoI,2005; 2009).
For further development in the sectors of animal husbandry, Government of
Rajasthan has formulated „Livestock Development Policy‟ for the welfare of farmers.
Some schemes and programmes have also been introduced to strengthen the sector
in the state. The programmes such as Rajiv Gandhi Mission on Agriculture and
Animal Husbandry, Pashu Chikitsalaya Pashu Palak ke Dwar scheme, Pashu Seva
Kendra, and National Protein Supplementation Programme have been introduced.

30
Animal treatment camps have also been organized regularly in gram panchayaths
where Government Veterinary Institution is not available (GoR, 2012c). Under the
“Pashu Seva Kendra” scheme, the State Government has sanctioned 1,290 Pashu
Seva Kendra across various districts of the state.
The Dairy Development Programme in Rajasthan has been implemented
through Cooperative Societies. Under this programme, up to December, 2011, 12,478
Primary Dairy Cooperative Societies have been affiliated with 21 District Milk
Producers Cooperative Unions spread over in 33 districts of the state (GoR, 2012c).
It can be noted from Table 19 that about 4,322 lakh litres of milk have been marketed
during 2011-12 (till December).
As per the Economic Review Report 2011-12, there is about 4.23 lakh
hectares of water area for fishing (excluding rivers & canals in 0.87 lakh hectares) in
the form of major, medium reservoirs (3.29 lakh hectares), small tanks & ponds (0.94
lakh hectares) in the state. During the year 2011-12 (till December), about 11,500
metric tons of fish and 438.68 million fish seeds were produced against the target
30,000 metric tons fish and 400 million fish seed respectively(GoR, 2012c).
7.0 Post Harvest Management and Value Addition
Agriculture has become demand driven rather than supply driven. It is essential to
produce and process agricultural commodities keeping in view the changing pattern
of taste and preferences. Though increase in agricultural production and productivity
is the priority of the agriculture sector today, improved post-harvest handling and
Table 19 : Performance of Dairy Development Sector in Rajasthan
Activity Unit Target Achievement
2011-12 2011-12 (Upto Dec., 2011)
Milk Procurement Lakh Kg. 7,790 4,118 (52.9)
Milk Marketing Lakh Lt. 6,168 4,322 (70.1)
Cattle Feed Sale 000' MT 263 133 (50.6)
Revived Societies Number 588 488 (83.0)
New Societies Number 898 141 (15.7)
Artificial and Natural Insemination 000' Number 453 467 (103.1)
Note: Figures in parentheses are the percentage of target achieved. Source: GoR (2011b).

31
processing is essential to ensure high-quality products and further value addition.
Value of agricultural output can be increased considerably by following improved
methods of post harvest practices.
Employment generation, reduction of postharvest losses and enhancing of
household food security are some of the reasons why small holder farmers process
their horticultural crops. Horticultural crops for which post-harvest handling and
processing is essentially required are grown in an area of about 10 lakh hectares
with an annual production of about 14 lakh metric tons in Rajasthan. Horticulture
production in Rajasthan during last 10 years has increased at the rate of 5.8 per cent
per annum. State is a leading producer of seed spices like coriander, cumin, and
fenugreek and has a substantial area under vegetable crops. To facilitate proper
handling, packaging and storage of seeds it is essential to equip the units with
modern facilities like cleaning and grading facilities, drying platforms, threshing floors,
shades etc. For developing such facilities and infrastructures, there is provision of 100
per cent assistance for the public sector (Rajasthan State Seed Corporation, State
Agriculture Universities etc.) and the credit linked back ended subsidy limited to 25
per cent of cost assistance to the private sector. The policy for Agro-processing and
Agri-business (GoR, 2010c) has also proposed many incentives including electricity
duty concession, stamp duty concession, incentives for new employment creation etc.
to the eligible agro-processing enterprises.
8.0 Conclusions
The present study evaluates the performance of agriculture in the state of Rajasthan
in the recent years and also presents what could be the future options, given our
objectives of accelerated growth, inclusiveness and reduction of poverty. The growth
performance of agriculture in the state has been satisfactory during last five years
during which agricultural NSDP at current prices has been more than doubled.
However, there are many challenges to be addressed systematically so as to
accelerate the agricultural growth in the state.
Some of the major challenges for agriculture sector in Rajasthan include the
expansion of irrigation provisions and efficient water management, low productivity,
unfavorable prices and practically very little value addition, distress sales, rising cost
of cultivation, increasing agricultural exports, greening the desert through agro-

32
forestry programmes, up-scaling of farm-validated modern technologies and
agricultural Innovations, and proper institutional mechanisms and organizational and
management (O&M) reforms for overcoming the felt constraints coming in way of the
farm prosperity in the state.
Though challenges are many, there are also significant opportunities which are
to be harnessed for further agricultural growth in Rajasthan. Diversification into higher
value, less water consuming horticulture, floriculture, spice and medicinal plant
production across a variety of agro-ecological zones; livestock development focusing
on improved animal health, nutrition, and access to markets; rolling out of tested on-
farm water management technologies and agronomic practices; conducive policy
framework and proper coordination and convergence of a range of public investment
programs funded by the Government of India and Government of Rajasthan are
necessary to facilitate a holistic agricultural development in the state. The experience
in establishing and managing public private sector partnerships in agriculture (e.g. in
the seed sector) can be expanded towards a broader application.
There is a need to increase crop production, productivity and income through
improved seed management and cultivation practices, including better INM and IPM.
Supply constrains of farm inputs are to be eased and input prices are to be properly
monitored so as to facilitate adequate supply of required farm inputs at reasonable
prices. The improvement in water use efficiency is urgently required for irrigation
expansion and for reducing the excess pressure on ground water. More priority
should be given to rain water harvesting and effective water management through
promotion of micro-irrigation methods, while efforts should also be made to bring
more area under canal irrigation through expansion of irrigation network from
neighbouring states. Especially after implementation of MNREGA in 2006, the
availability of farm labourers has been reduced considerably mainly at the time of
intercultural operations and harvesting of the crops. Therefore, the process of
streamlining the convergence of MNREGA with other programmes like Rashtriya
Krishi Vikas Yojana, National Horticulture Mission, and National Agricultural
Development Programme etc., may be stepped up, so that the problem of
unavailability of labour and infrastructure could be eased. Market-led advisory
services and establishment of producer companies may result in higher incomes and
greater access of farmers to markets and financial institutions.

33
References
Bhalla, G. S. and Gurmail Singh (2009) „Economic Liberalization and Indian
Agriculture: A State-wise Analysis‟, Economic and Political Weekly, Vol. 46, No. 52, pp-34-44, December 26.
CAZRI (2009), „Surface and Groundwater Resources of Arid Zone of India: Assessment and Management‟, in Trends in Arid Zone Research in India (Eds) Goyal, R K, Angchok, D, Stobdan, T, Singh, S B and Kumar, H., Central Arid Zone Research Institute, Jodhpur.
Chand, Ramesh and S.S. Raju (2009), „Instability in Indian Agriculture during Different Phases of Technology and Policy’, Indian Journal of Agricultural Economics, Vol.64, No 2, April-June, pp.283-288.
De, U. S., R. K. Dube, and G. S. Prakasa Rao ( 2005), „Extreme Weather Events over India in the last 100 years‟, Journal of Indian Geophysical Union, Vol. 9, No.3, pp.173–187.
Dutta, R.A. and K. Kapadia, (2011), Possibilities and Constraints in Increasing Pulses Production in Rajasthan and Impacts of National Food Security Mission on Pulses, Research Report No. 140, Agro-Economic Research Centre, S.P. University, V.V. Nagar.
GoI (2001), Provisional Population Totals, Office of the Registrar General and Census Commissioner, Government of India, New Delhi.
GoI (2005), Livestock, Poultry, Agricultural Machinery Implements and Fishery Statistics, 2007, Summary Report, Ministry of Agriculture, Government of India, New Delhi.
GoI (2009), Livestock, Poultry, Agricultural Machinery Implements and Fishery Statistics, 2007, Summary Report, Ministry of Agriculture, Government of India, New Delhi.
GoI (2011), Provisional Population Totals, Office of the Registrar General and Census Commissioner, Government of India, New Delhi.
GoI (2012a), State of Indian Agriculture 2011-12, Department of Agriculture and Cooperation, Ministry of Agriculture, Government of India.
GoI (2012b), Economic Survey 2011-12, Department of Finance, Government of India.
GoR (2008), Rajasthan Agricultural Statistics at a Glance for Year 2007-08, Commissionrate of Agriculture, Government of Rajasthan, Jaipur.
GoR (2009), 50 years Agricultural Statistics of Rajasthan, 1956-57 to 2005-06, Directorate of Economics and Statistics, Government of Rajasthan, Jaipur.

34
GoR (2010a), Rajasthan Agricultural Statistics at a Glance for Year 2007-08, Commissionrate of Agriculture, Government of Rajasthan, Jaipur
GoR (2010b), The State Water Policy, Department of Water Resources, Government of Rajasthan.
GoR (2010c), The Policy for Agro-processing and Agri-business, Rajasthan State Agricultural Marketing Board, Government of Rajasthan.
GoR (2011), Rajasthan State Action Plan on Climate Change, Government of Rajasthan.
GoR (2012a), Draft State Agriculture Policy, Government of Rajasthan, Jaipur.
GoR, (2012b), Rajasthan Agriculture Competitiveness Project, Department of Agriculture, Government of Rajasthan, January.
GoR (2012c), Economic Review 2011-12, Directorate of Economics and Statistics, Government of Rajasthan, Jaipur.
GoR (2012d), Statistical Abstract of Rajasthan 2011, Directorate of Economics and Statistics, Government of Rajasthan, Jaipur.
NSSO (1993), National Sample Survey (NSS), 50th Round, 1993-94, National Sample Survey Office, New Delhi.
NSSO (2004), National Sample Survey (NSS), 61st Round, 2004-05, National Sample Survey Office, New Delhi
Pant, G. B. and L. S. Hingane (1988), „Climatic Changes in and around the Rajasthan desert during the 20th century‟, Journal of Climatology, Vol. 8, pp. 291- 301.
Purohit, B.C. and V.R. Reddy (1999), Capital Formation in Indian Agriculture, Occasional Paper No. 8, National Bank for Agriculture and Rural Development, Mumbai
Rathore, M. S. (2004), State Level Analysis of Drought Policies and Impacts in Rajasthan, India. Working paper 93, Drought series paper no. 6, International Water Management Institute
Rathore, M. S. (2005), Groundwater Exploration and Augmentation efforts in Rajasthan - A Review, Institute of Development Studies, Jaipur
Shenggen F, A. Gulati and S. Thorat (2008), Investment, Subsidies and Pro-poor Growth in Rural India, Agricultural Economics, Vol. 39, pp-163-170.
Singh, S.P., R.S. Singh and S. Singh (2011), Sale Trend of Tractors and Farm Power Availability in India, Agricultural Engineering Today, Vol.35, No.2, April-June, pp-31-44.
Swain, M. (2001), Rural Indebtedness and Usurious Interest Rates in Eastern India: Some Micro Evidence, Journal of Social and Economic Development, Vol.3, No.1, pp-122-43.

35
Swain, M. and M. Swain (2007), „Rural Credit Market Imperfections in Drought Prone Bolangir District of Odisha: Some Critical Issues and Policy Options‟, Artha Vijnana, Vol. 49, No. 3 & 4, Sept.- Dec., pp.223-254.
Swain, M., R. H. Patel, and M. Ojha (2011), Impacts of National Horticulture Mission Scheme in Rajasthan, Research Report No. 142, Agro-Economic Research Centre, S.P. University, V.V. Nagar.
Swain, M. and S. Sharma (2011), Impact of NREGA on Wage Rates, Food Security and Rural-Urban Migration in Rajasthan, Research Report No. 139, Agro-Economic Research Centre, S.P. University, V.V. Nagar.
Websites visited:
www.indiaagronet.com, Accessed on 20th September 2012
www.krishi.rajasthan.gov.in; Accessed on 15th September 2012.
-----*****-----

Agro-Economic Research Centre For the states of Rajasthan and Gujarat
(Sponsored by Ministry of Agriculture, Govt. of India) H.M. Patel Institute of Rural Development, Opp. Nanadalaya Temple, Post Box No. 24,
Sardar Patel University
Vallabh Vidyanagar 388120, Dist. Anand, Gujarat
Ph. No. +91-2692-230106, 230799; Fax- +91-2692-233106 Email: [email protected]; [email protected]