state of our roads 2015 - transport services
TRANSCRIPT
State of our Roads 2015
Department of State Growth

STATE OF OUR ROADS 2015 2
ContentsIntroduction ........................................................................................................................ 3Inventory ..............................................................................................................................4
Tasmanian State Road Hierarchy ........................................................................................................... 4
The State Road Asset ...................................................................................................................................5
Traffic ...................................................................................................................................... 6All Vehicles ..........................................................................................................................................................6
Heavy Vehicles ..................................................................................................................................................8
Asset Age ...........................................................................................................................10Road Pavement ..............................................................................................................................................10
Road Seal ...........................................................................................................................................................11
Bridges .................................................................................................................................................................12
Sealed Roads ....................................................................................................................14Roughness ..........................................................................................................................................................14
Rutting..................................................................................................................................................................16
Surface Cracking ............................................................................................................................................18
Finance ................................................................................................................................ 20Valuation of State Roads .......................................................................................................................... 20
Network Financial Sustainability ...........................................................................................................21

STATE OF OUR ROADS 2015 3
This report isn’t intended to provide a description of the strategic and practical approach to the management of the State road network or how State Roads uses data in its decision making processes.
Information relating to the strategic approach for development and maintenance of the network can be found in the following documents:
» State Road Infrastructure Service Policy
» Tasmanian Road Safety Strategy 2007-2016
» Tasmanian State Road Hierarchy
» State Road Infrastructure Asset Management Policy.
State Roads Division Strategic DirectionThe State Roads Division of the Department of State Growth is responsible for managing the State road network on behalf of the Minister for Infrastructure.
State Roads is committed to providing efficient road infrastructure and a level of service for our customers and visitors that:
» are as safe as reasonably possible
» support economic growth through responsible investment
» enhance the travelling experience for road users.
IntroductionThe State of our Roads 2015 report provides a summary of the data and trends relating to the condition, use and performance of the State road network at 1 July 2015.
STATE OF OUR ROADS 2015 4
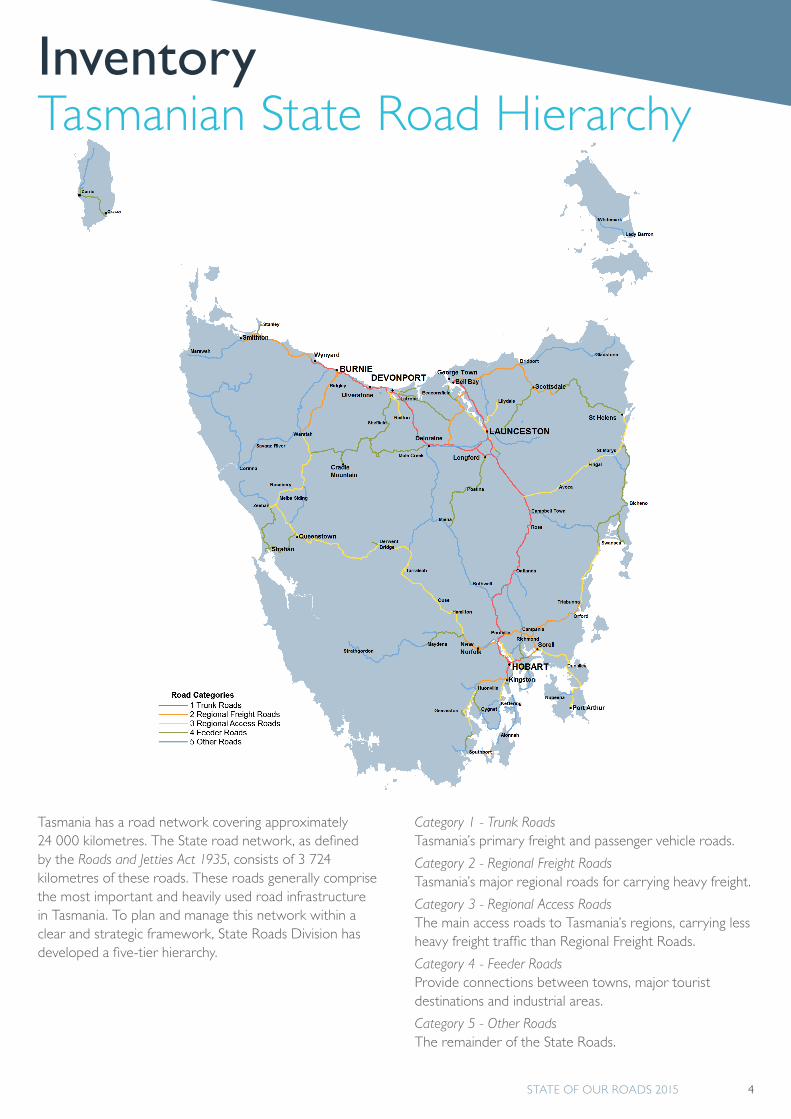
Category 1 - Trunk RoadsTasmania’s primary freight and passenger vehicle roads.
Category 2 - Regional Freight RoadsTasmania’s major regional roads for carrying heavy freight.
Category 3 - Regional Access Roads The main access roads to Tasmania’s regions, carrying less heavy freight traffic than Regional Freight Roads.
Category 4 - Feeder RoadsProvide connections between towns, major tourist destinations and industrial areas.
Category 5 - Other RoadsThe remainder of the State Roads.
Tasmania has a road network covering approximately 24 000 kilometres. The State road network, as defined by the Roads and Jetties Act 1935, consists of 3 724 kilometres of these roads. These roads generally comprise the most important and heavily used road infrastructure in Tasmania. To plan and manage this network within a clear and strategic framework, State Roads Division has developed a five-tier hierarchy.
InventoryTasmanian State Road Hierarchy

STATE OF OUR ROADS 2015 5
The State Road AssetRoad Category
Road Length (km)
Road Area (km2)
Number of Structures
Sealed Unsealed Total Total Major Culverts Bridges Other Total
1 449 0 449 6.734 167 167 35 369
2 428 0 428 3.973 76 49 7 132
3 726 0 726 6.334 130 162 8 300
4 853 0 853 6.628 90 120 1 211
5 1 081 187 1 268 9.570 124 115 2 241
Total 3 537 187 3 724 33.240 587 613 53 1 253
Road Length is the distance in one direction (i.e. not considering dual carriageways or ramps).
Of the 3 724 kilometres of road length, 645 kilometres are located in urban areas and 3 079 kilometres are located in rural areas.
Since 1 July 2015, State Roads has taken over the management of three roads from councils:
» Waterhouse Developmental Road, acquired from Dorset Council
» Mt William Developmental Road, acquired from Dorset Council
» Macquarie Heads Developmental Road, acquired from West Coast Council.
In this period, State Roads has also transferred the management of two roads to Dorset council:
» Gladstone Main Road
» Ringarooma Main Road.
These roads have been acquired due to their future strategic use in growing the state’s economy, primarily through tourism.
These roads are included in the maps as part of this document, however no condition or financial information has been provided on these roads as part of this report.
STATE OF OUR ROADS 2015 5
STATE OF OUR ROADS 2015 6
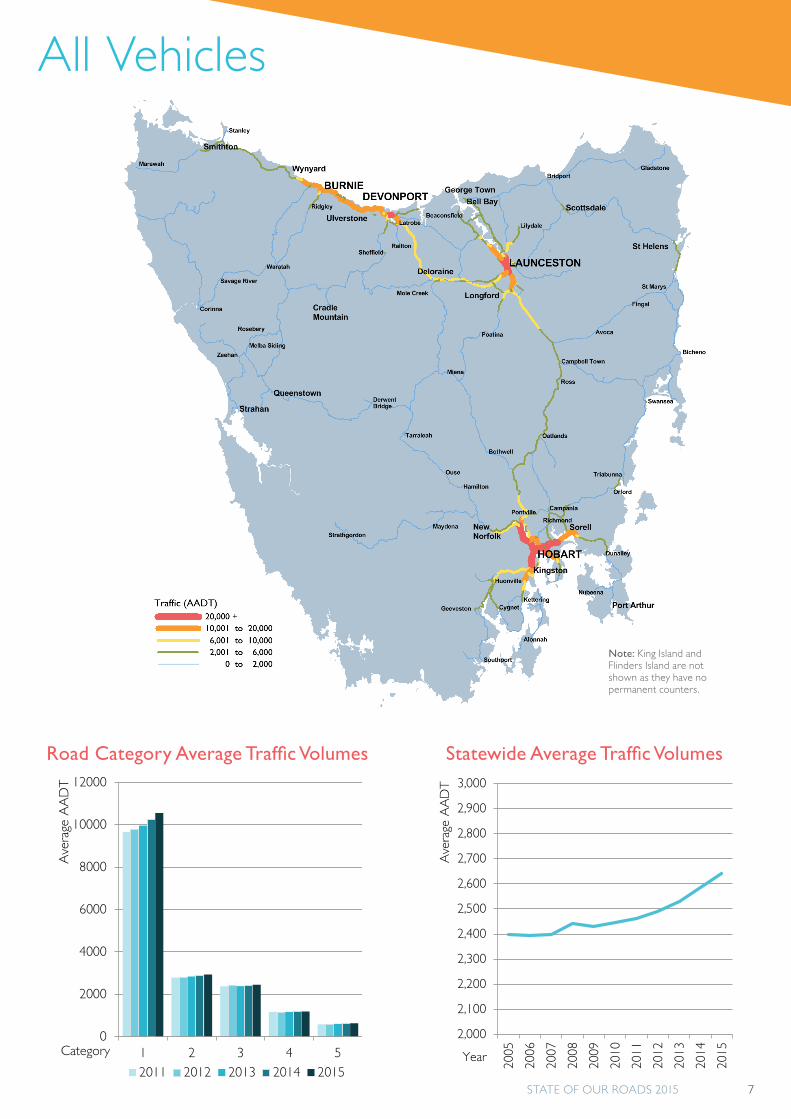
Trends » Between 2005 and 2015 the overall use of State Roads, measured by AADT, has increased by 10% at a compound annual growth rate of 0.9%.
» Between 2011 and 2015, the highest growth was on Category 1 roads while the other categories have shown small fluctuations from year to year.
» Urban areas have tended to show a growth increase while rural areas were generally showing a decrease in growth.
» Between 2005 and 2015, State Roads with large increases in AADT include:
» Midland Highway, near South Launceston (increase of 33% or about 6 000 AADT)
» Tasman Highway near Cambridge Park (increase of 33% or about 5 000 AADT)
» Tasman Bridge (increase of 5% or about 3 000 AADT)
» Bass Highway over Victoria Bridge in Devonport (increase of 8% or about 1 500 AADT).
2015 » In 2015, AADT was greatest on Category 1 roads with the least use being on Category 5 roads.
» The State roads with the highest recorded levels of use in 2015 were:
» Tasman Highway (reaching a maximum of about 65 000 AADT over the Tasman Bridge)
» Brooker Highway (52 000 AADT between Risdon Road and the Domain Highway)
» Southern Outlet Highway (34 000 AADT between Kingston and Mt Nelson)
» East Tamar Highway (30 000 AADT at the Charles St Bridge).
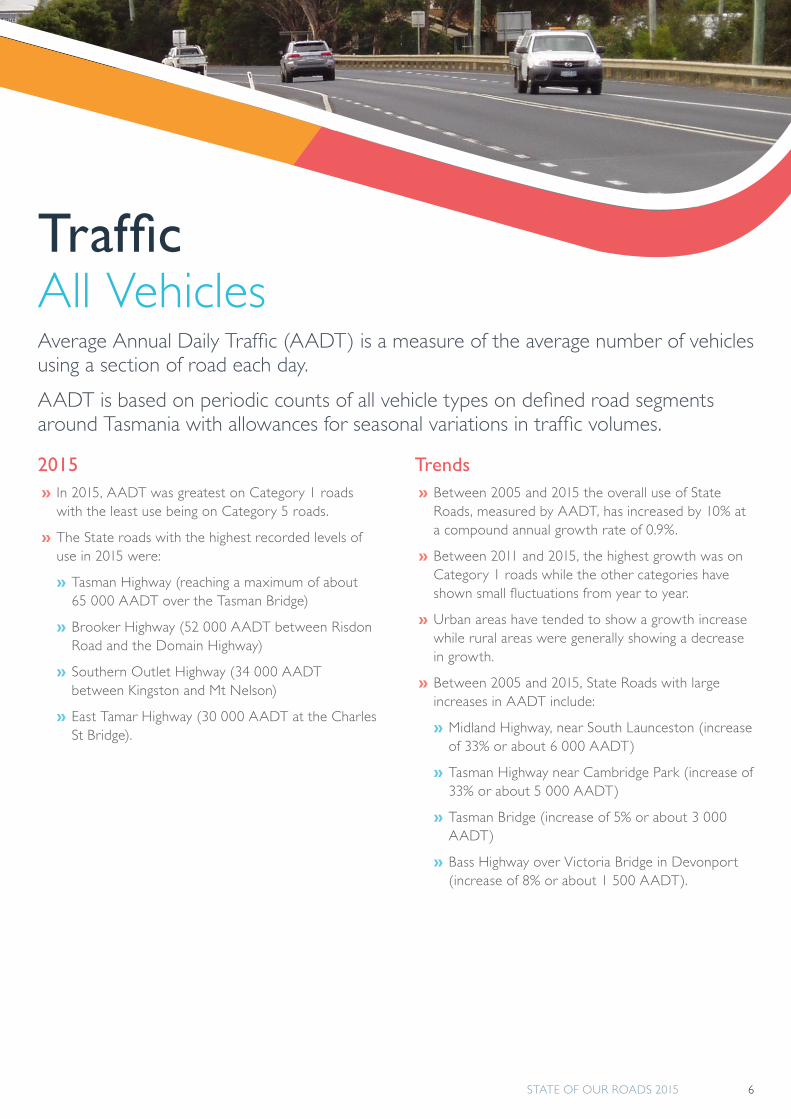
TrafficAll VehiclesAverage Annual Daily Traffic (AADT) is a measure of the average number of vehicles using a section of road each day.
AADT is based on periodic counts of all vehicle types on defined road segments around Tasmania with allowances for seasonal variations in traffic volumes.
STATE OF OUR ROADS 2015 7
Road Category Average Traffic Volumes
All Vehicles
0
2000
4000
6000
8000
10000
12000
1 2 3 4 5
Ave
rage
AA
DT
Category
2011 2012 2013 2014 2015
2,000
2,100
2,200
2,300
2,400
2,500
2,600
2,700
2,800
2,900
3,000
2005
2006
2007
2008
2009
2010
2011
2012
2013
2014
2015
Ave
rage
AA
DT
Year
Statewide Average Traffic Volumes
Note: King Island and Flinders Island are not shown as they have no permanent counters.

STATE OF OUR ROADS 2015 8
» rail decreasing its market share of heavy freight
» changes in agricultural production, in particular increases in milk and salmon production
» rationalisation of regional landfill at Copping in the south and Dulverton in the north-west
» increasing demand for deliveries by heavy vehicles, particularly in urban areas.
» Between 2005 and 2015, increases in AADTT were primarily on the National Land Transport Network (Bass, Midland, East Tamar Highways and Tasman Highway from Hobart to Hobart Airport) and around Hobart, while most of the roads recording decreases were in rural areas.
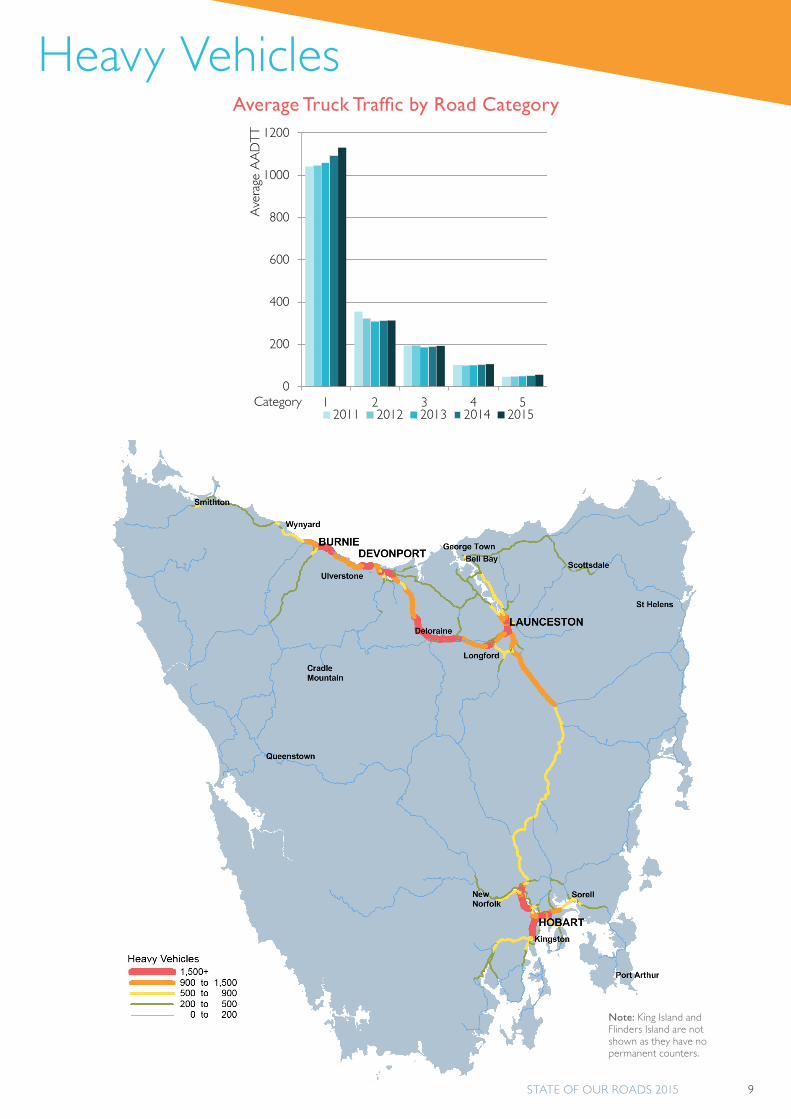
2015 » In 2015, Category 1 roads have had the highest rate of heavy vehicle use (average AADTT of 1 131).
» This decreased across the categories with Category 5 roads having the lowest rate of heavy vehicle use (average AADTT of 56).
Trends » Between 2005 and 2015 the average heavy vehicle use of the State Roads, measured by AADTT, grew by 12% at a compound annual growth rate of 1.1%.
» The average heavy vehicle use of the State Roads, has occurred predominantly on Category 1 roads, with Category 2-5 roads experiencing no growth or declining growth since 2011.
» Some of the factors causing the change in heavy vehicle numbers which have had local and state-wide impacts are:
» decrease in woodchip exports
» decrease in seaport throughput since the peak of 2004-05
» transfer of container handling from Bell Bay to Burnie
Heavy VehiclesVehicles are defined as heavy vehicles when the wheel base has a length greater than 3.2m between the axles or has more than two axles. Cars towing trailers are excluded.
The Average Annual Average Daily Truck Traffic (AADTT) is a measure of the average number of heavy vehicles using a section of road each day. It does not indicate the carrying capacity of trucks or the amount of freight carried over roads.
The AADTT is based on periodic counts on defined road segments around Tasmania with allowances for seasonal variations in traffic volumes.
STATE OF OUR ROADS 2015 8
STATE OF OUR ROADS 2015 9
Heavy VehiclesAverage Truck Traffic by Road Category
0
200
400
600
800
1000
1200
1 2 3 4 5
Ave
rage
AA
DT
T
Category2011 2012 2013 2014 2015
Note: King Island and Flinders Island are not shown as they have no permanent counters.
STATE OF OUR ROADS 2015 10
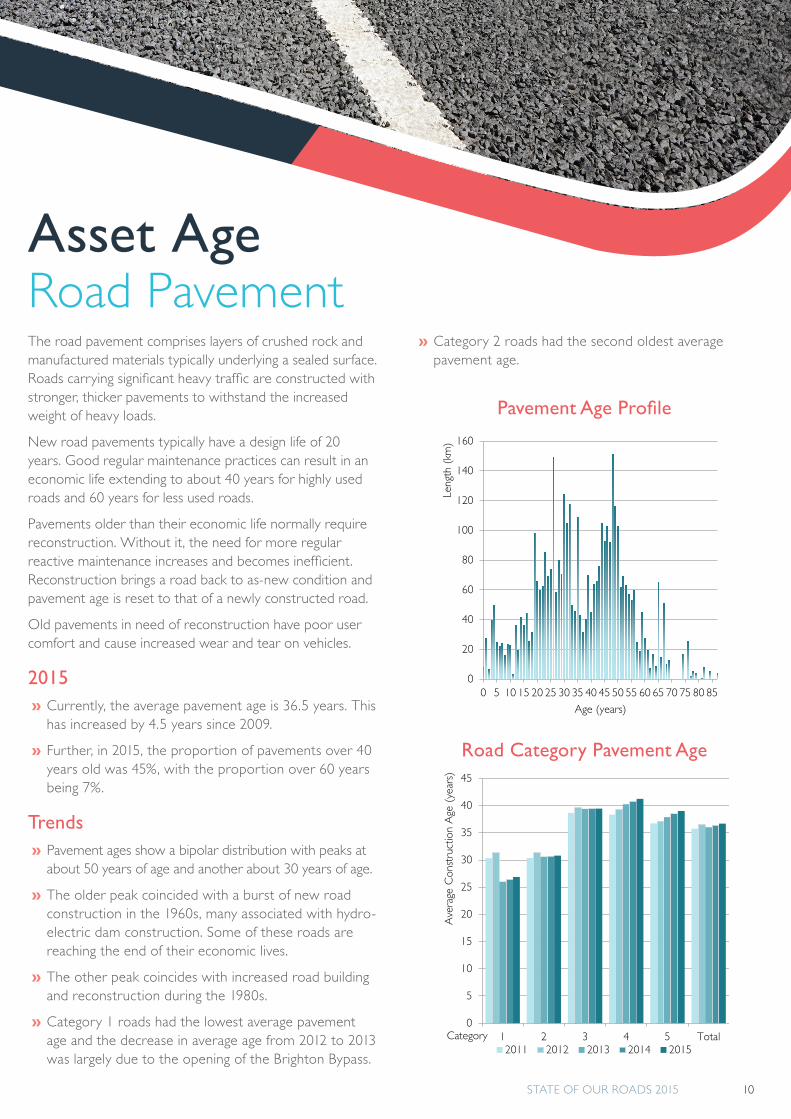
The road pavement comprises layers of crushed rock and manufactured materials typically underlying a sealed surface. Roads carrying significant heavy traffic are constructed with stronger, thicker pavements to withstand the increased weight of heavy loads.
New road pavements typically have a design life of 20 years. Good regular maintenance practices can result in an economic life extending to about 40 years for highly used roads and 60 years for less used roads.
Pavements older than their economic life normally require reconstruction. Without it, the need for more regular reactive maintenance increases and becomes inefficient. Reconstruction brings a road back to as-new condition and pavement age is reset to that of a newly constructed road.
Old pavements in need of reconstruction have poor user comfort and cause increased wear and tear on vehicles.
2015 » Currently, the average pavement age is 36.5 years. This has increased by 4.5 years since 2009.
» Further, in 2015, the proportion of pavements over 40 years old was 45%, with the proportion over 60 years being 7%.
Trends » Pavement ages show a bipolar distribution with peaks at about 50 years of age and another about 30 years of age.
» The older peak coincided with a burst of new road construction in the 1960s, many associated with hydro-electric dam construction. Some of these roads are reaching the end of their economic lives.
» The other peak coincides with increased road building and reconstruction during the 1980s.
» Category 1 roads had the lowest average pavement age and the decrease in average age from 2012 to 2013 was largely due to the opening of the Brighton Bypass.
Asset AgeRoad Pavement
» Category 2 roads had the second oldest average pavement age.
0
5
10
15
20
25
30
35
40
45
1 2 3 4 5 Total
Ave
rage
Con
stru
ctio
n A
ge (
year
s)
Category2011 2012 2013 2014 2015
0
20
40
60
80
100
120
140
160
0 5 10 15 20 25 30 35 40 45 50 55 60 65 70 75 80 85
Leng
th (
km)
Age (years)
Pavement Age Profile
Road Category Pavement Age

STATE OF OUR ROADS 2015 11
The road seal is the bituminous surface over the pavement. It provides a waterproof layer over the pavement and a skid-resistant surface.
Seal age indicates the time span in years since the last resurfacing. While varying seal types have different life spans, the overall average is about 15 years. Seals on roads with significant heavy traffic will deteriorate faster than less trafficked roads.
2015 » The current average seal age on the State Road Network is 10 years.
» 26% of the network has a seal age of 15 years or more.
» 10% of the network has a seal age of 20 years or more.
Trend » Since 2011, the average seal age of Category 1 roads has reduced from 10.7 years old to 7.7 years old this category now has the lowest average seal age.
» Category 2 roads had tended to have the second lowest average seal age.
» Category 5 roads, those that usually have the lowest level of use, have tended to have the oldest average seal age.
Road Seal
STATE OF OUR ROADS 2015 11
0
2
4
6
8
10
12
14
1 2 3 4 5 TotalA
vera
ge S
eal A
ge (
year
s)Category
2011 2012 2013 2014 2015
Road Category Seal Age
Seal Age Profile
0
50
100
150
200
250
300
0 5 10 15 20 25 30
leng
th (
km)
Age (years)
STATE OF OUR ROADS 2015 12
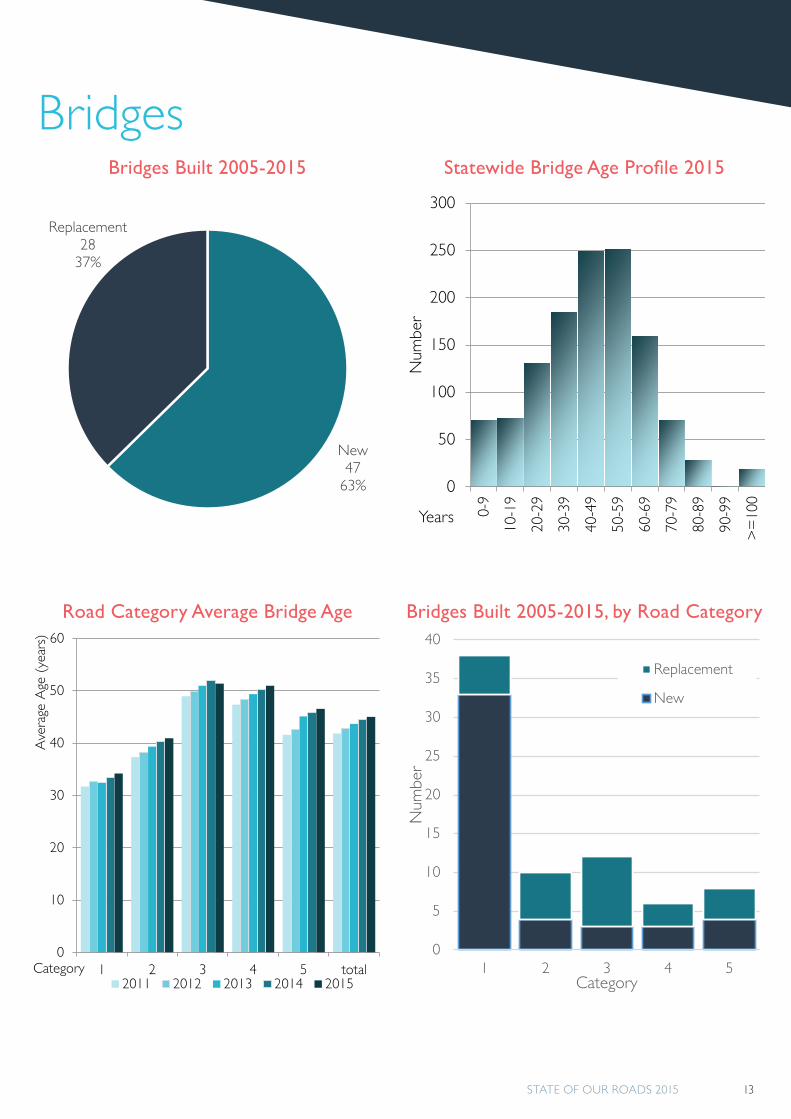
Bridges are critical pieces of the State Road Network because weight limits on bridges decrease road transport productivity. Closures can have major impacts, especially when there are few alternative routes. When bridges reach the end of their useful lives they can be particularly costly to replace.
There are 14 bridges which were built before 1900 which are managed as historic bridges.
2015 » There are currently around 1 200 bridges and major culverts on the State roads network.
» The average useful life of these structures is between 70-100 years.
» These structures tend to be replaced to increase their level of functionality (i.e. making them wider and safer for all motorists, and allowing heavier or more productive vehicles on our State road network).
BridgesTrend
» In recent years the number of bridges over 70 years of age is increasing by about three per year.
» Bridges older than 70 years of age are more likely to be replaced as they no longer meet their required level of functionality.
» In the next 10 years, about 160 existing bridges (13% of all bridges) will become 70 years of age or older.
» Based on these figures, 12 to 15 structures are likely to require replacement per year.
» Strengthening and maintenance work is undertaken on bridges to increase their useful life and to maintain functionality.
» In the last 10 years, 75 bridges have been built on the State road network. Of these 29 were replacing existing bridges with 46 being on new sections of road.
STATE OF OUR ROADS 2015 12
STATE OF OUR ROADS 2015 13
Bridges
0
10
20
30
40
50
60
1 2 3 4 5 total
Ave
rage
Age
(ye
ars)
Category2011 2012 2013 2014 2015
Bridges Built 2005-2015
Road Category Average Bridge Age
Statewide Bridge Age Profile 2015
Bridges Built 2005-2015, by Road Category
0
50
100
150
200
250
300
0-9
10-1
9
20-2
9
30-3
9
40-4
9
50-5
9
60-6
9
70-7
9
80-8
9
90-9
9
>=
100
Num
ber
Years
New47
63%
Replacement28
37%
0
5
10
15
20
25
30
35
40
1 2 3 4 5
Num
ber
Category
Replacement
New
STATE OF OUR ROADS 2015 14
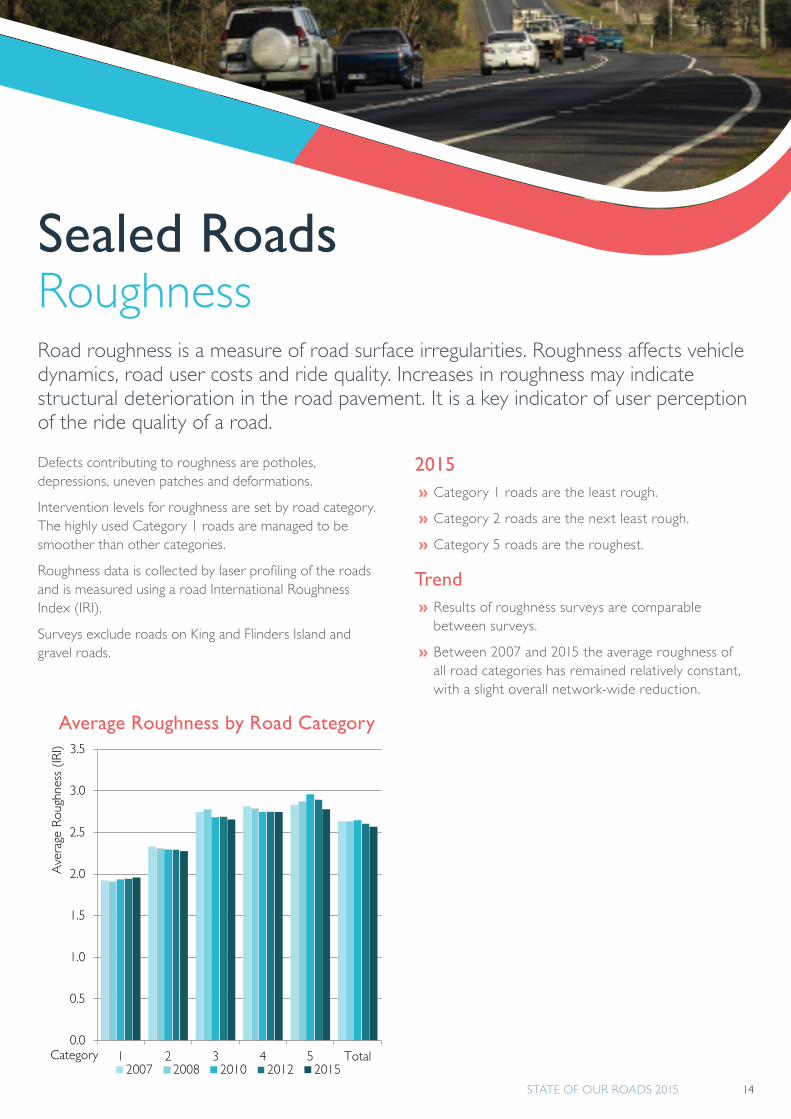
Road roughness is a measure of road surface irregularities. Roughness affects vehicle dynamics, road user costs and ride quality. Increases in roughness may indicate structural deterioration in the road pavement. It is a key indicator of user perception of the ride quality of a road.
Sealed RoadsRoughness
Defects contributing to roughness are potholes, depressions, uneven patches and deformations.
Intervention levels for roughness are set by road category. The highly used Category 1 roads are managed to be smoother than other categories.
Roughness data is collected by laser profiling of the roads and is measured using a road International Roughness Index (IRI).
Surveys exclude roads on King and Flinders Island and gravel roads.
2015 » Category 1 roads are the least rough.
» Category 2 roads are the next least rough.
» Category 5 roads are the roughest.
Trend » Results of roughness surveys are comparable between surveys.
» Between 2007 and 2015 the average roughness of all road categories has remained relatively constant, with a slight overall network-wide reduction.
Average Roughness by Road Category
0.0
0.5
1.0
1.5
2.0
2.5
3.0
3.5
1 2 3 4 5 Total
Ave
rage
Rou
ghne
ss (
IRI)
Category2007 2008 2010 2012 2015
STATE OF OUR ROADS 2015 15
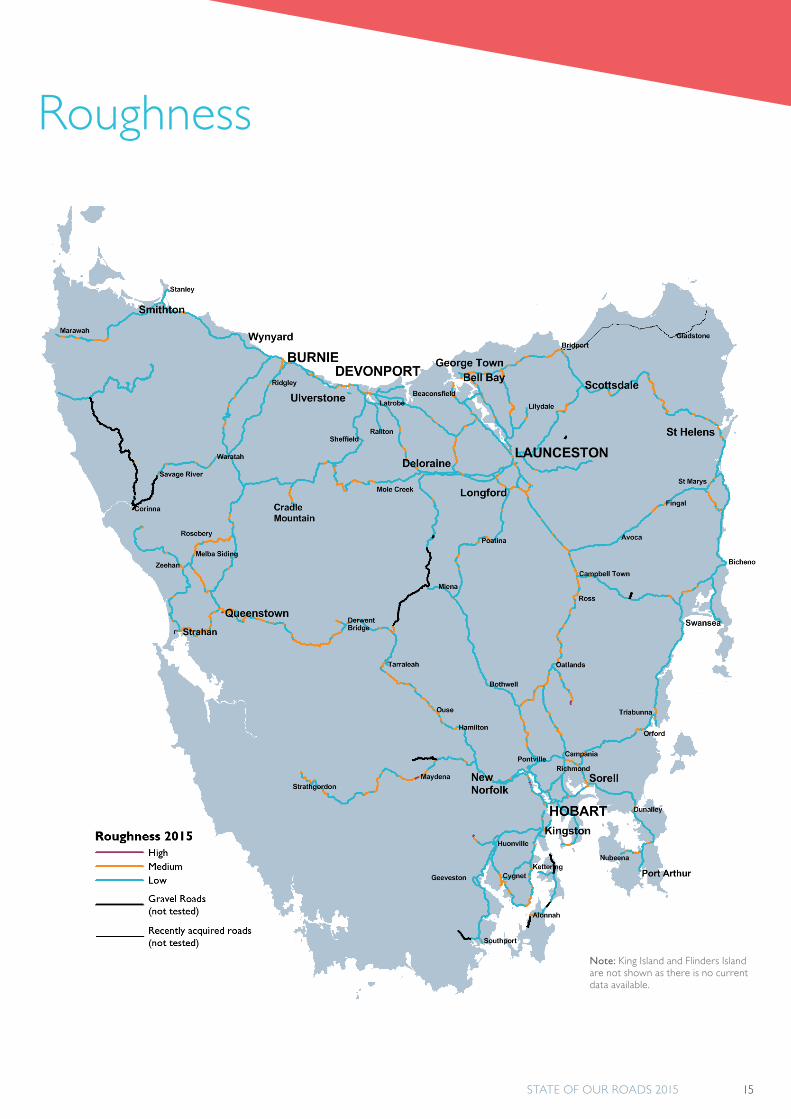
Roughness
Note: King Island and Flinders Island are not shown as there is no current data available.
STATE OF OUR ROADS 2015 16
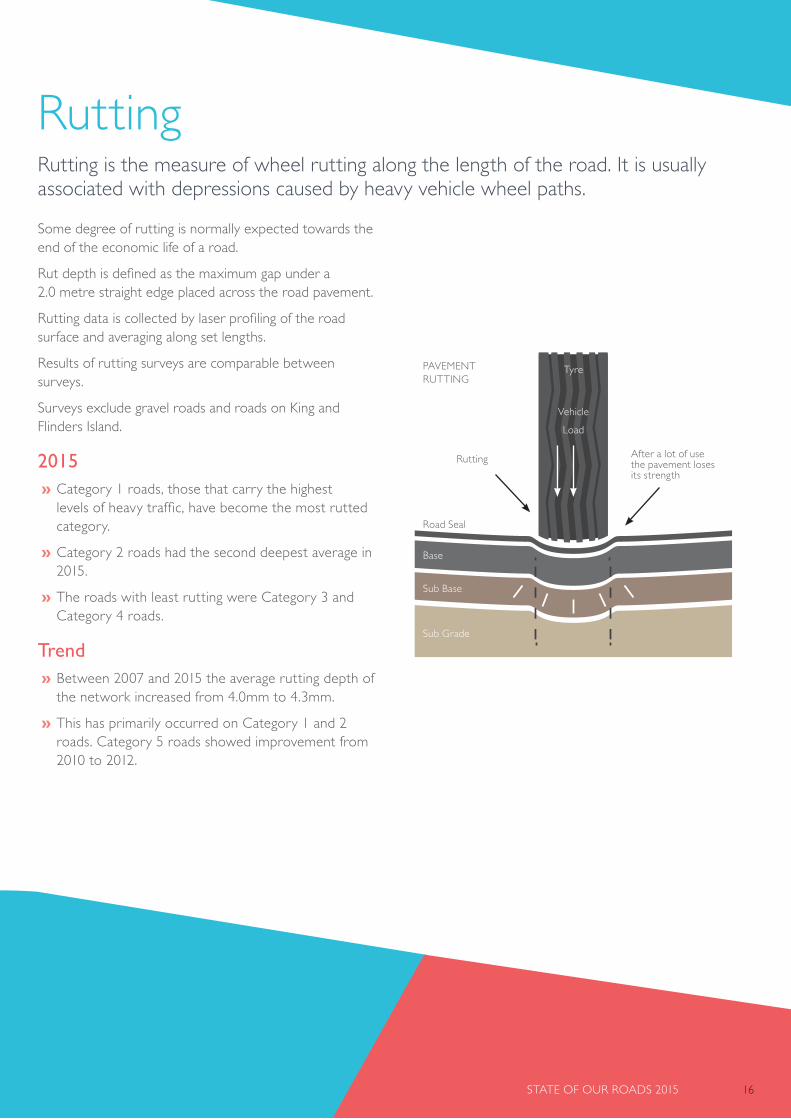
Some degree of rutting is normally expected towards the end of the economic life of a road.
Rut depth is defined as the maximum gap under a 2.0 metre straight edge placed across the road pavement.
Rutting data is collected by laser profiling of the road surface and averaging along set lengths.
Results of rutting surveys are comparable between surveys.
Surveys exclude gravel roads and roads on King and Flinders Island.
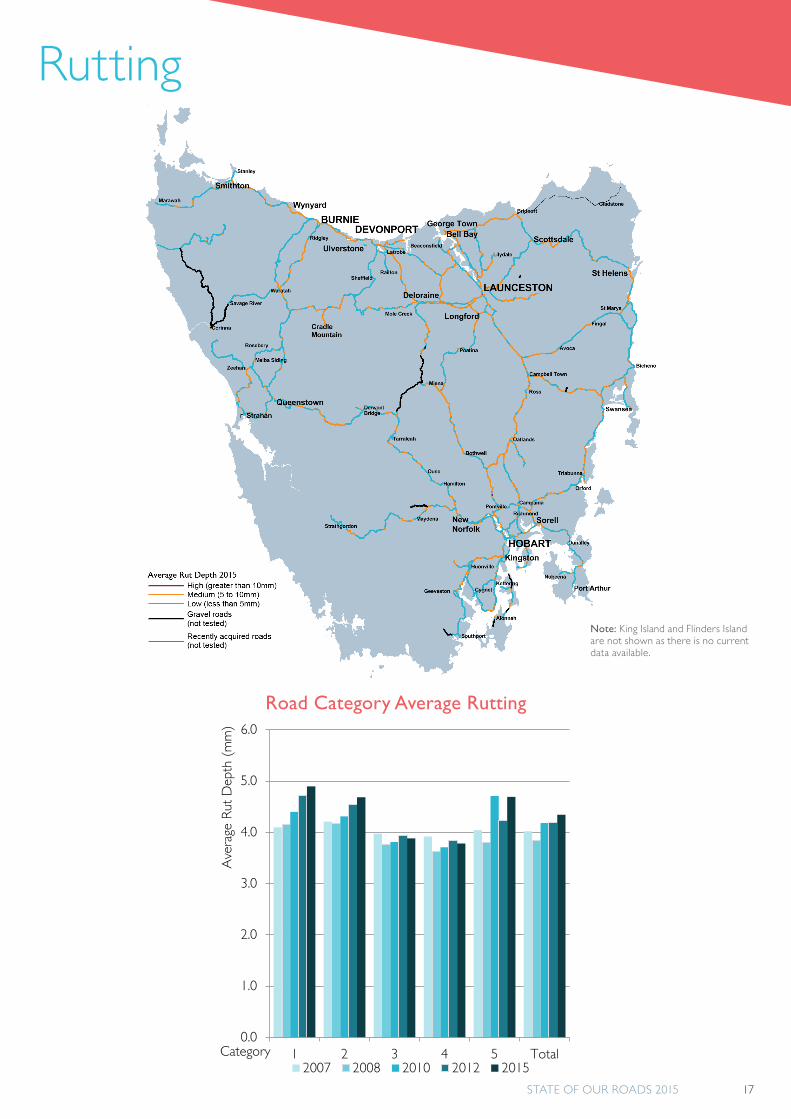
2015 » Category 1 roads, those that carry the highest levels of heavy traffic, have become the most rutted category.
» Category 2 roads had the second deepest average in 2015.
» The roads with least rutting were Category 3 and Category 4 roads.
Trend » Between 2007 and 2015 the average rutting depth of the network increased from 4.0mm to 4.3mm.
» This has primarily occurred on Category 1 and 2 roads. Category 5 roads showed improvement from 2010 to 2012.
RuttingRutting is the measure of wheel rutting along the length of the road. It is usually associated with depressions caused by heavy vehicle wheel paths.
PAVEMENT RUTTING
Rutting After a lot of use the pavement loses its strength
Tyre
Vehicle
Load
Road Seal
Base
Sub Base
Sub Grade
STATE OF OUR ROADS 2015 16
STATE OF OUR ROADS 2015 17
Rutting
Road Category Average Rutting
0.0
1.0
2.0
3.0
4.0
5.0
6.0
1 2 3 4 5 Total
Ave
rage
Rut
Dep
th (
mm
)
Category2007 2008 2010 2012 2015
Note: King Island and Flinders Island are not shown as there is no current data available.
STATE OF OUR ROADS 2015 18
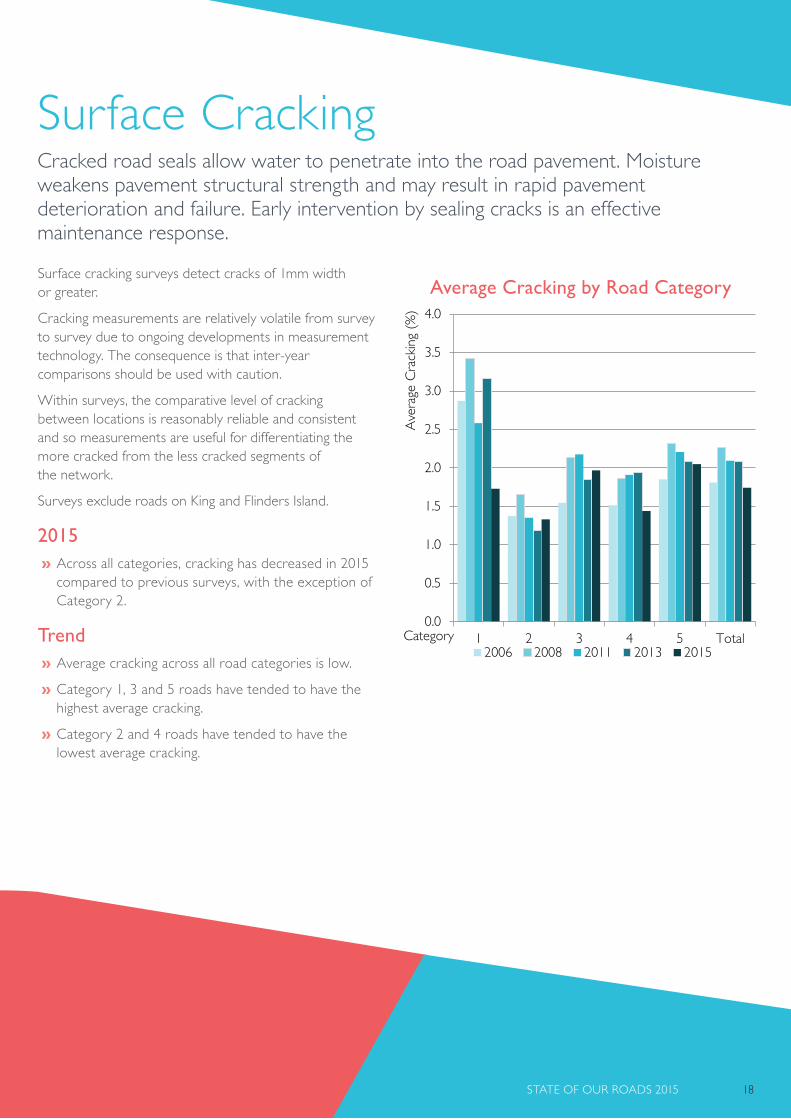
Surface cracking surveys detect cracks of 1mm width or greater.
Cracking measurements are relatively volatile from survey to survey due to ongoing developments in measurement technology. The consequence is that inter-year comparisons should be used with caution.
Within surveys, the comparative level of cracking between locations is reasonably reliable and consistent and so measurements are useful for differentiating the more cracked from the less cracked segments of the network.
Surveys exclude roads on King and Flinders Island.
2015 » Across all categories, cracking has decreased in 2015 compared to previous surveys, with the exception of Category 2.
Trend » Average cracking across all road categories is low.
» Category 1, 3 and 5 roads have tended to have the highest average cracking.
» Category 2 and 4 roads have tended to have the lowest average cracking.
Cracked road seals allow water to penetrate into the road pavement. Moisture weakens pavement structural strength and may result in rapid pavement deterioration and failure. Early intervention by sealing cracks is an effective maintenance response.
Surface Cracking
0.0
0.5
1.0
1.5
2.0
2.5
3.0
3.5
4.0
1 2 3 4 5 Total
Ave
rage
Cra
ckin
g (%
)
Category2006 2008 2011 2013 2015
Average Cracking by Road Category
STATE OF OUR ROADS 2015 18

STATE OF OUR ROADS 2015 19
Surface Cracking
Note: King Island and Flinders Island are not shown as there is no current data available.

STATE OF OUR ROADS 2015 20
The Department of State Growth values the State roads in terms of the value of its roads, bridges, structures and land under roads and in the road corridors.
State Road Asset Valuation 30 June 2015
Item Replacement Value ($million) Depreciated Value ($million)
Road Replacement Value $4 992 $2 664
Bridges and Structures Replacement Value $1 772 $1 211
Land Value $160 $160
Net Valuation $6 924 $4 035
FinanceValuation of State Roads
The valuation does not include electronic and intelligent transport systems and non-road infrastructure in the road corridor such as power and telecommunication lines, gas and water supply pipes and rail infrastructure.
Replacement value represents the cost it would take to construct the network, as new, with the same attributes and in the same location as the existing network.
Over time, vehicles and the environment wear out roads and bridges. In financial terms, the decrease in value is measured by a straight line depreciation, using the construction date as well as the estimated useful life of the asset.
The depreciated value therefore represents the replacement value less the depreciation.
Main Features » The replacement value of the State road network is a little less than $7 billion.
» The depreciated value is a little over $4 billion.
» The land value represents 9 730 hectares under roads and within road corridors.
» The depreciated value for 30 June 2015 represents 23% of the Tasmanian Government’s total assets of just over $17.8 billion.
STATE OF OUR ROADS 2015 21
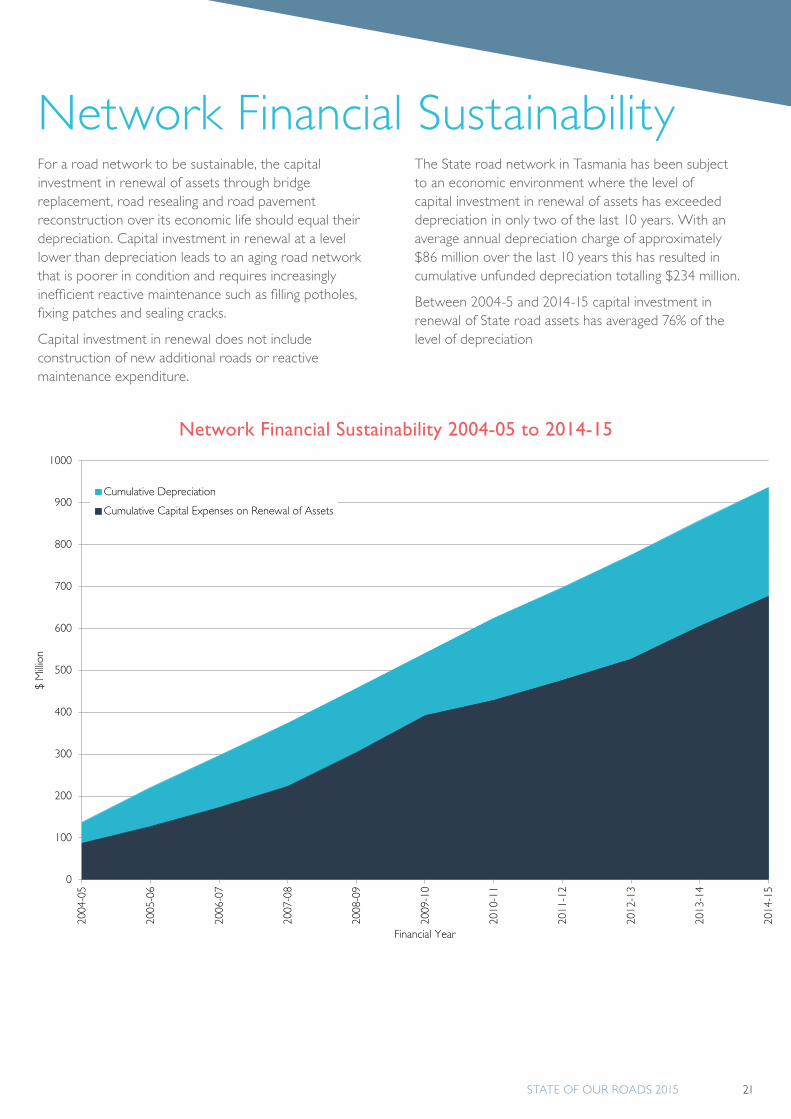
The State road network in Tasmania has been subject to an economic environment where the level of capital investment in renewal of assets has exceeded depreciation in only two of the last 10 years. With an average annual depreciation charge of approximately $86 million over the last 10 years this has resulted in cumulative unfunded depreciation totalling $234 million.
Between 2004-5 and 2014-15 capital investment in renewal of State road assets has averaged 76% of the level of depreciation
For a road network to be sustainable, the capital investment in renewal of assets through bridge replacement, road resealing and road pavement reconstruction over its economic life should equal their depreciation. Capital investment in renewal at a level lower than depreciation leads to an aging road network that is poorer in condition and requires increasingly inefficient reactive maintenance such as filling potholes, fixing patches and sealing cracks.
Capital investment in renewal does not include construction of new additional roads or reactive maintenance expenditure.
Network Financial Sustainability
0
100
200
300
400
500
600
700
800
900
1000
2004
-05
2005
-06
2006
-07
2007
-08
2008
-09
2009
-10
2010
-11
2011
-12
2012
-13
2013
-14
2014
-15
$ M
illion
Financial Year
Cumulative Depreciation
Cumulative Capital Expenses on Renewal of Assets
Network Financial Sustainability 2004-05 to 2014-15

STATE OF OUR ROADS 2015 22
For further information, contact the Department of State Growth
Phone: 1800 753 878 Email: [email protected] Web: www.transport.tas.gov.au
Contact