state of industry 20i7 report - nepra.org.pk of industry reports/state of industry... · 5.2...
TRANSCRIPT
STATE OF INDUSTRYREPORT 20
I7
NATIONAL ELECTRIC POWERREGULATORY AUTHORITY


i
CONTENTS
FOREWORD 011 EXECUTIVE SUMMARY 05
1.1 Installed Power Generation Capacity 051.2 Power Balances 05
1.2.1 NTDC System 051.2.2 K-Electric Limited System 06
1.3 Issues of Power Generation Additions 071.3.1 Capacity and Energy Mix 071.3.2 Impact of Capacity Additions 09
1.4 National Electricity Policy and Plan 111.5 Performance of Generation Sector 11
1.5.1 Public Sector (GENCOs and Hydel) 111.5.2 Private Sector (Independent Power Producers) 13
1.6 Transmission System 131.6.1 Outages on NTDC Transmission Lines (500 kV and 220 kV) 13
1.7 Overloading in DISCOs’ System 141.7.1 Loading Position of Power Transformers 141.7.2 Loading Position of 11 kV Feeders 141.7.3 Loading Position of Distribution Transformers 151.7.4 Province-wise Loading Positions 15
1.8 Transmission and Distribution Losses of DISCOs 161.9 Recovery Position of DISCOs 17
1.9.1 Recovery Position of Main Categories of Consumers 171.10 Performance of K-Electric Limited 18
1.10.1 Loading Position of Power Transformers, 11 kV Feeders and Distribution Transformers 19
1.10.2 Recovery Position of K-Electric Limited 191.11 The Regulation of Generation, Transmission and Distribution of Electric Power
(Amendment) Act, 2018 20
1.11.1 Major Amendments 201.11.2 Challenges 20
1.12 Energy, Environment and Sustainable Development 211.13 Comprehensive Reduction and Elimination of Polychlorinated Biphenyls 211.14 Rationalization of Generation Tariff Parameters 221.15 Review of Rate of Return 231.16 Industry – Academia Collaboration 231.17 Conclusions 231.18 Recommendations 24
2 PERFORMANCE OF GENERATION SECTOR 292.1 General 292.2 Installed Capacity and Electricity Generation 292.3 Hydropower 30
2.3.1 Power Purchase Agreements/Energy Purchase Agreements 302.3.2 Competitive Bidding of Hydropower Projects 30

ii
2.3.3 Performance Monitoring of Hydropower Projects 302.3.4 Implementations of Authority’s Direction 31
2.4 Overview of Public Sector GENCOs 312.4.1 Jamshoro Power Company Limited 312.4.2 Central Power Generation Company Limited 312.4.3 Northern Power Generation Company Limited 322.4.4 Lakhra Power Generation Company Limited 32
2.5 Independent Power Producers 322.6 Nuclear (CHASNUPP-I, II & III and KANUPP) 322.7 Renewables 33
2.7.1 Wind 332.7.2 Solar 332.7.3 Bagasse 332.7.4 Bagasse/Coal 33
2.8 K-Electric Limited 332.9 Electricity Purchases from SPPs/CPPs/N-CPPs 332.10 Future Capacity Mix 352.11 Performance of Generation Facilities 35
2.11.1 Availability of GENCOs’ Power Plants 352.11.2 Performance of Generation Facilities under NEPRA Performance Standards
(Generation) Rules, 200937
2.11.3 Performance of Independent Power Producers 392.11.4 Performance of K-Electric Limited 49
3 PERFORMANCE OF TRANSMISSION SECTOR 533.1 General 533.2 Power Balances of NTDC System 533.3 Loading Position of NTDC’s 500 kV and 220 kV Grid Stations 543.4 Constraints in NTDC System 57
3.4.1 Current Status of Interconnection Arrangements 573.4.2 Project-wise Cost Over-run 573.4.3 Commitment Charges 58
3.5 NTDC Power Evacuation Projects 593.6 Investment Plans of NTDC 603.7 Outages on Transmission Lines of NTDC (500 kV and 220 kV) 643.8 Power Balances of K-Electric Limited Transmission System 643.9 Loading Position of Power Transformers in K-Electric Limited System 643.10 K-Electric Limited Transmission Outage Statistics 663.11 NEPRA Performance Standards (Transmission) Rules, 2005 66
3.11.1 National Transmission and Despatch Company Limited 673.11.2 K-Electric Limited 67
4 PERFORMANCE OF DISTRIBUTION SECTOR 754.1 General 754.2 Circular Debt 754.3 T&D Losses 75
4.3.1 Transmission and Distribution Losses Overall Perspective 754.3.2 T&D Losses (Actual) of DISCOs for FY 2015-16 and FY 2016-17 764.3.3 T&D Losses Requested by DISCOs and Allowed by NEPRA (2015-16) 764.3.4 Re-Determination of T&D Loss Targets 77
4.4 Recovery Position of DISCOs 804.4.1 Recovery Position of Main Categories of Consumers 81
4.5 Receivables of DISCOs 81
iii
4.6 Overloading in DISCOs System 834.6.1 Loading Position of Power Transformers 834.6.2 Loading Position of 11 kV Feeders 834.6.3 Loading Position of Distribution Transformers 844.6.4 Province-wise Loading Positions 84
4.7 Fuel Price Adjustment of DISCOs 854.8 Status of Digitized Mapping of Distribution Network of DISCOs and K-Electric Limited 85
4.9 Loading Position of Power Transformers, 11 kV Feeders and Distribution Transformers in K-Electric Limited System 85
4.10 Recovery Position of K-Electric Limited 864.11 T&D Losses under Multi-Year Tariff Regime 864.12 Investment Details of Distribution Sector 864.13 Performance under NEPRA Standards 87
4.13.1 DISCOs’ Performance under NEPRA Standards 874.13.2 Performance of K-Electric Limited under NEPRA Standards 93
5 MONITORING OF THE SECTOR 975.1 General 975.2 Performance Evaluation Reports of GENCOs (2012, 2013 and 2014) 98
5.2.1 Auxiliary Consumption 985.2.2 Standby Mode 98
5.3 Performance Evaluation Report of GENCOs (2014-15 and 2015-16) 985.3.1 Auxiliary Consumption 985.3.2 Standby Mode 995.3.3 Planned and Unplanned Outages 99
5.4 Performance of K-Electric Limited 995.5 Monitoring of Transmission Sector 100
5.5.1 Performance Standards (Transmission) Rules, 2005 1005.5.2 Initiation of Legal Action against NTDC for Extending Completion Dates of
Projects 100
5.6 Monitoring of Distribution Sector 1005.6.1 Data Analysis and Reporting 1005.6.2 Monitoring of Performance Standards (Distribution) Rules, 2005 1015.6.3 Monitoring of PESCO 1025.6.4 Key Findings by Monitoring Teams about PESCO 1055.6.5 Monitoring of K-Electric Limited 106
5.7 Review of Reliability Standards of DISCOs and Linkage with Investments 1075.8 Initiation of Legal Proceedings against Distribution Licensees 107
5.8.1 Legal Proceeding against the Licensees for the Violations of the NEPRA Act, Rules and Regulations and the Applicable Documents 107
5.8.2 Inability of PESCO to Remove System Constraints of Transmission and Distribution Network 107
5.8.3 Un-Announced and Prolonged Hours of Load-Shedding by HESCO 1085.8.4 Un-Announced and Prolonged Hours of Load-Shedding by K-Electric Limited 108
6 INITIATIVES BY NEPRA 1116.1 Rationalization of Generation Tariff Parameters 1116.2 Review of Rate of Return 1116.3 Energy, Environment and Sustainable Development 1116.4 Comprehensive Reduction and Elimination of Polychlorinated Biphenyls 1126.5 Formats for Submission of Information for Generation Company 1136.6 Industry – Academia Collaboration 1136.7 Coal Pricing – Hiring of Consultant 1136.8 Wind Power Generation 114
6.8.1 Competitive Bidding Tariff 114
iv
6.8.2 Competitive Bidding Tariff Review Motion for Wind Power Projects 1156.9 Solar PV Power Generation 115
6.9.1 Competitive Bidding Tariff 1156.9.2 Competitive Bidding Tariff Review Motion for Solar PV Power Projects 115
6.10 Tariff for Bagasse-Based Power Projects 1156.10.1 Bagasse Upfront Tariff, 2013 1156.10.2 Bagasse Upfront Tariff, 2017 116
7 INITIATIVES BY STAKEHOLDERS 117
7.1 The Regulation of Generation, Transmission and Distribution of Electric Power (Amendment) Act, 2018 119
7.1.1 NEPRA Structural and Operational Reforms 1197.1.2 ConflictofInterest 1207.1.3 National Electricity Policy and Plan 1207.1.4 Market Reforms 1207.1.5 Tariff Determination 1217.1.6 Appellate Tribunal 1217.1.7 OfficesofComplaints 1237.1.8 Expansion of Regulatory Powers 123
7.2 Progress on Grid Code Review Panel 1237.3 Progress on Distribution Code Review Panel 1237.4 PPIB Role, Planned Activities, Progress and Achievements 1247.5 AEDB efforts in Supporting Renewable Energy Projects 1267.6 PEDO efforts in Supporting Hydel and Renewable Energy Projects 1267.7 Functions of the PPDB Board 1308 MISCELLANEOUS 133
8.1 Summary of Activities during 2016-17 1338.1.1 Promulgation of New Rules/Regulations/Guidelines 1338.1.2 Amendments in NEPRA Rules/Regulations/Guidelines/Codes 1338.1.3 Advisories issued by NEPRA to the Government of Pakistan 134
8.2 Consumer Affairs 1348.2.1 StatusofConsumerComplaints(2016-17)(HeadOffice) 1348.2.2 StatusofConsumerComplaints(2016-17)(RegionalOffices) 1348.2.3 Major Activities/Developments 135
8.3 DISCOs’ Board of Directors Meetings 1358.3.1 Attendance of Members and Main Agenda Items of PESCO 1358.3.2 Attendance of Members and Main Agenda Items of IESCO 1368.3.3 Attendance of Members and Main Agenda Items of GEPCO 1378.3.4 Attendance of Members and Main Agenda Items of FESCO 1388.3.5 Attendance of Members and Main Agenda Items of MEPCO 1398.3.6 Attendance of Members and Main Agenda Items of HESCO 1398.3.7 Attendance of Members and Main Agenda Items of SEPCO 140
8.4 K-Electric’s Board of Director (BODs) MeetingSTATISTICAL DATA ABOUT ENERGY AND ELECTRICITY SECTOR
9 ENERGY SECTOR OVERVIEW 1439.1 General 1439.2 Oil Reserves 1439.3 Gas Reserves 1439.4 Coal Reserves 1439.5 Primary Energy Supplies 1439.6 Final Energy Consumption 1459.7 Fuel Consumption in Power Sector 14610 ELECTRICITY SECTOR OVERVIEW 149
10.1 Installed Capacity 149
v
10.2 Electricity Generation 15410.3 Cost of Generation, Fuel Cost and Fuel Consumption 16110.4 AuxiliaryConsumptionandOtherFactors,HeatRateandPlantEfficiency 16710.5 Load Pattern and Peak Load Hours 17810.6 Energy Sales and Consumer-Wise Electricity Consumption 17910.7 Pattern of Electricity Consumption 18210.8 Surplus/DeficitinDemandandSupplyduringPeakHours 18311 ELECTRICITY GENERATION 187
11.1 General 18711.2 Thermal Power Generation 18711.3 Thermal Power Generation and Fuel Consumption 18711.4 Hydel Power Generation 18811.5 Nuclear Power Generation 19011.6 Renewable Energy Generation (Wind, Solar and Bagasse) 19011.7 Investment Plan for Power Generation Projects 19111.8 Economic Load Despatch System 19711.9 Licenses Granted 19912 ELECTRICITY TRANSMISSION 211
12.1 General 21112.2 Transmission Lines and Grid Stations with NTDC 21112.3 Transmission Losses 21212.4 Utilization of Transmission Lines and Power Transformers 21212.5 Transmission Lines Tripping in PEPCO System 21212.6 Loading Position of NTDC’s 500 kV and 220 kV Grid Stations 21312.7 Investment Plan - NTDC System 21612.8 Transmission Lines and Grid Stations with K-Electric 21812.9 Transmission Lines Tripping in K-Electric System 21913 ELECTRICITY DISTRIBUTION 223
13.1 General 22313.2 Role of Distribution Companies 22413.3 Distribution System Performance 23514 ELECTRICITY TARIFF 251
14.1 General 25114.2 Tariff Setting 25114.3 Tariff Standards 251
List of Tables 281Acronyms and Abbreviations 284Source of Information 287

vi
1
FOREWORD
ThegenerationsectorofPakistanhaswitnessedamajortransformationoverthelastfiveyears(2013-2018), by moving towards a reliable supply system through large base-load power plants using indigenousand importedcoaland throughhighlyefficientgas-basedplants.Anumberof large hydropower plants have also achieved completion, whereas till date around 1,500 MW of solar and wind power plants, have also been inducted to encourage clean energy. Furnace Oil-based power generation plants which remained face of Pakistan power sector for over three decades, have been planned to be phased out over next few years and it is expected that the share of furnace oil-based energy will decline from around 30% to a negligible level in the overall mix in the coming years.
The challenges however, are immense, the addition of generation facilities have put added pressure for a strong transmission and distribution infrastructure to make the delivery of electricity to end-consumers possible. Over the years, the regulator has been stressing the need for strong and robust networks for a reliable power supply, however it is the concerted and urgent efforts of National Transmission and Despatch Company Limited (NTDC) and Distribution Companies (DISCOs) which can ensure sustainable reliable power supply to end-consumers.
Taking a holistic view of the transmission and distribution sectors, it is noted that (39%)1 transformers at 500/220 kV level were loaded above 80% of their rated capacity on June, 2017. At 220/132 kV level, (55%)2 transformers are overloaded. In distribution sector, at the end of June 2017, about 37% of high capacity transformers (power transformers) were over-loaded (above 80% of their capacity). Similarly 29% of the 11 kV feeders, used for bulk transmission of electricity at distribution level, were found over-loaded, whereas more than 12% of the distribution transformers are loaded above 80% of their capacity. It is also noted that on an overall basis, the overloading of equipment has slightly improved over the last year i.e. 2015-16 when the supply of electricity was constrained. With more supply available now, the system is expected to also meet the suppressed demand, which was not connected to the network earlier. Therefore a routine historical pace of improvement and refurbishment in network would not ensure provision of a reliable electricity supply to consumers.
The DISCOs on one hand, would have to strive to strengthen their network for providing reliable electricity supply, whereas on the other, they would be pressed to increase their energy sales, so that overall impact of increased capacity payments, due to additional generation capacity is neutralized, through increased energy sold, and the consumer-end tariff remains at affordable level.
Over the years the transmission and distribution losses could not be curtailed by the DISCOs and having taken divergent and contradictory positions about losses, almost all the DISCOs have now proposed new and higher loss levels than earlier requested. It is a matter of concern that DISCOs could not take such measures to bring improvement in this critical area. Ministry of Energy (Power Division) is also required to assign due priority to this major impediment in sustainability of the powersectorinPakistan.Itmaybenotedthatalleffortstobringefficiencyinthesectorwouldbedefeated if the DISCOs do not improve their Transmission and Distribution (T&D) loss position.
The Regulator has noted inconsistent positions of the Ministry of Energy (Power Division), especially 1 13 out of 33 2 79 out of 143
2
in respect of introduction of renewable energy based generation facilities including wind, solar and small hydropower plants. For fuel diversity and reducing dependence on imported fuels, the Ministry of Energy is required to be consistent for achieving overall objectives outlined in policies of the Federal Government.
Recently approved Amendment Act, 2018 has brought major changes in the existing regulatory regime. The distribution function has been separated into wire and sale businesses. In addition concepts of “trader” and “supplier” have been introduced which are entirely new for all the stakeholders. The Federal Government has also enhanced its role in policy and rule making for the regulator. The Amendment Act, 2018 provides for a major shift from the existing regime and it is observed that extensive discussions and consultations among stakeholders are required to identify gaps and resolve issues for making smooth transition to the new regime.
It is also noted that a number of entities with very specific roles have been defined in theAmendment Act. It appears that these entities are not well prepared to take over their assigned roles as human resource readiness, software and hardware availability and other skills essential for such roles are not available. It is urged to initiate dialogue at all levels to make regulatory regime through Amendment Act a success.
STATE OF INDUSTRY REPORT 2017
EXECUTIVE SUMMARY


5
EXECUTIVE SUMMARY
Over the past few years the policy makers in Pakistan have recognized it and made concerted effortsfordevelopmentinthepowersectoringeneralandgenerationsectorinparticular.Sufficientgeneration capacity has already been added in the system resulting in considerable improvement in load-shedding position all over the country. As per records, further generation capacity at different stages of implementation, will also be added over the next three years, (leading to a capacity surplus scenario in view of the available demand forecasts). Evacuation of power from thesefacilitieshasputextraburdenontransmissionanddistributionsectors.Infrastructuredeficitandabsenceofperformanceimprovementinthesesectorsmayhampertheeconomicbenefitsforeseen due to huge investment in the generation facilities.
1.1 INSTALLED POWER GENERATION CAPACITYInstalled power generation capacity of Pakistan as of 30th June, 2017 stands at 28,399 MW of which 26,186 MW is connected with NTDC system whereas 2,213 MW is connected with K-Electric Limited (KEL) system. Since 2013 till date, more than 7,000 MW has been added to the generation facilities connected to NTDC system. Based on recent information by NTDC, and analysis by NEPRA, generation capacity additions in NTDC system over a period up to the FY 2024-25 are as shown inthefollowingtable.Itmaybenotedthatthefinalinstalledcapacityofmorethan62,000MWmay not be achieved as some of the power projects including hydro-based projects indicated to beinductedfrom2022to2025requireextensivetechnicalandfinancialprerequisitestocomplete.
NTDC System (MW)
TechnologyInstalled
Capacity as of June 30,
2017
ADDITIONS
2017-18 2018-19 2019-20 2020-21 2021-22 2022-23 2023-24 2024-25 Total*
Oil 6,785 0 0 0 0 0 0 0 0 0Coal 810 1,980 1,320 823 3,300 2,610 1,320 0 0 11,353
Gas/RLNG 8,868 2,508 830 420 0 0 0 0 0 3,758Wind 785 149 299 0 1,224 0 0 0 0 1,672Solar 400 12 600 600 0 0 0 0 0 1,212
Bagasse 280 77 583 144 0 0 0 0 0 804Hydro 7,116 2,709 41 201 177 824 3,080 4,325 2,203 13,560
Nuclear 1,142 340 0 0 1,100 1,100 0 0 1,100 3,640Year-wise Addition --- 7,775 3,673 2,188 5,801 4,534 4,400 4,325 3,303 35,999
Total Cap. after Additions
26,186 33,961 37,634 39,822 45,623 50,157 54,557 58,882 62,185 62,185
* Technology-wise Installed Capacity Additions from FY 2017-18 till FY 2024-25Note: Import not shown of 1,000 MW CASA in year 2021-22 and 96 MW existing from Iran.Source: NTDC
1.2 POWER BALANCES
1.2.1 NTDC System:The generation capability of generation facilities connected with NTDC system will be less than the installed capacity as shown in the above table due to various factors like auxiliary consumption, impact of site reference conditions and seasonality effects on the renewables and large hydropower plants. The generation capability is effectively the capacity for meeting the electricity demand in
01
6
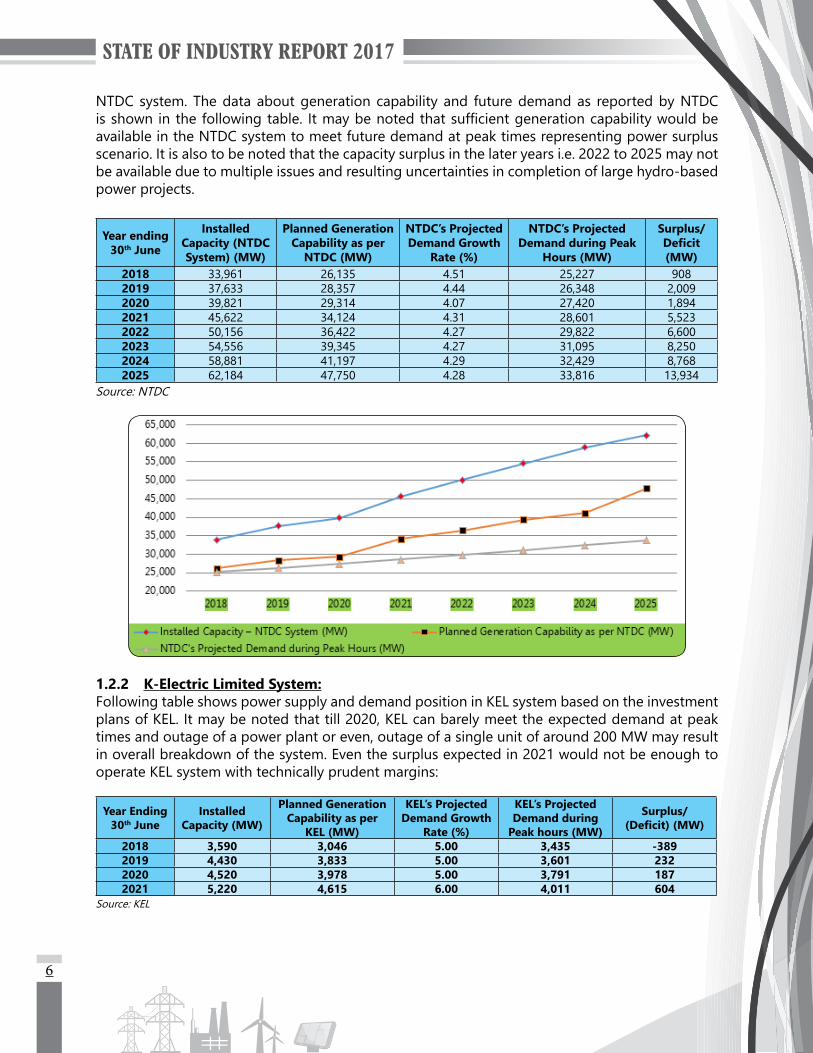
NTDC system. The data about generation capability and future demand as reported by NTDC isshowninthefollowingtable. Itmaybenotedthatsufficientgenerationcapabilitywouldbeavailable in the NTDC system to meet future demand at peak times representing power surplus scenario. It is also to be noted that the capacity surplus in the later years i.e. 2022 to 2025 may not be available due to multiple issues and resulting uncertainties in completion of large hydro-based power projects.
Year ending 30th June
Installed Capacity (NTDC System) (MW)
Planned Generation Capability as per
NTDC (MW)
NTDC’s Projected Demand Growth
Rate (%)
NTDC’s Projected Demand during Peak
Hours (MW)
Surplus/Deficit (MW)
2018 33,961 26,135 4.51 25,227 9082019 37,633 28,357 4.44 26,348 2,0092020 39,821 29,314 4.07 27,420 1,8942021 45,622 34,124 4.31 28,601 5,5232022 50,156 36,422 4.27 29,822 6,6002023 54,556 39,345 4.27 31,095 8,2502024 58,881 41,197 4.29 32,429 8,7682025 62,184 47,750 4.28 33,816 13,934
Source: NTDC
1.2.2 K-Electric Limited System:Following table shows power supply and demand position in KEL system based on the investment plans of KEL. It may be noted that till 2020, KEL can barely meet the expected demand at peak times and outage of a power plant or even, outage of a single unit of around 200 MW may result in overall breakdown of the system. Even the surplus expected in 2021 would not be enough to operate KEL system with technically prudent margins:
Year Ending30th June
InstalledCapacity (MW)
Planned Generation Capability as per
KEL (MW)
KEL’s Projected Demand Growth
Rate (%)
KEL’s Projected Demand during
Peak hours (MW)
Surplus/ (Deficit) (MW)
2018 3,590 3,046 5.00 3,435 -3892019 4,430 3,833 5.00 3,601 2322020 4,520 3,978 5.00 3,791 1872021 5,220 4,615 6.00 4,011 604
Source: KEL
7
1.3 ISSUES OF POWER GENERATION ADDITIONS
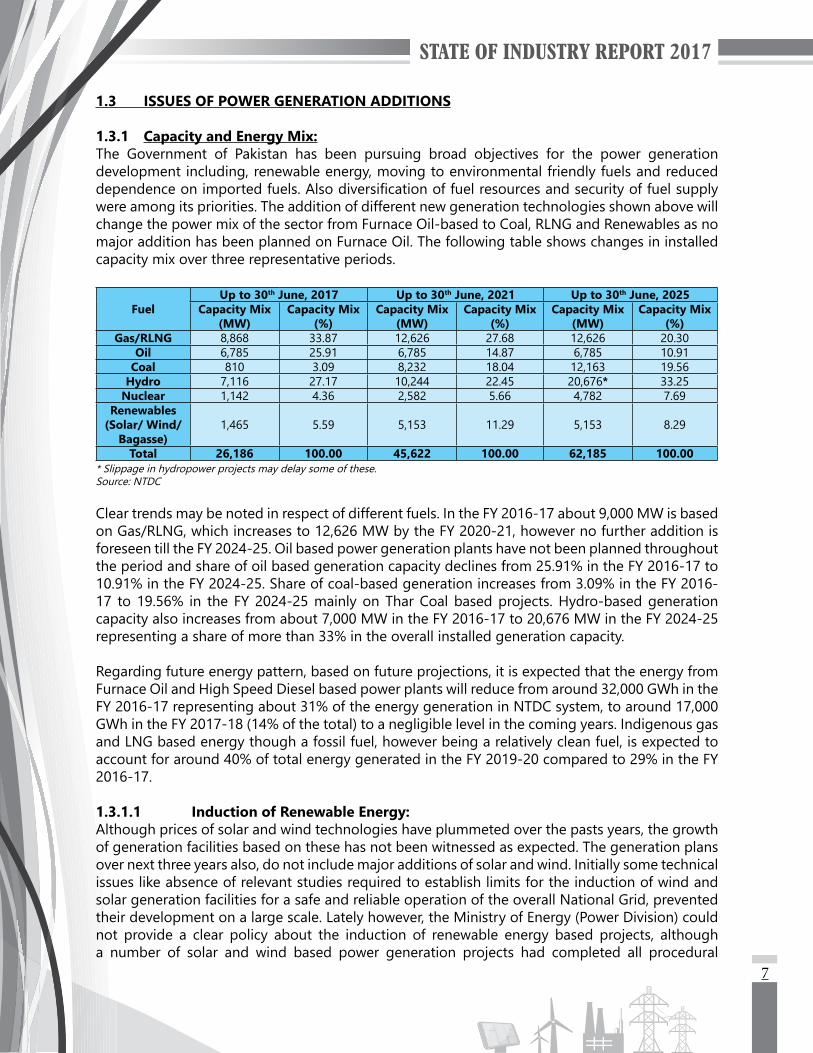
1.3.1 Capacity and Energy Mix:The Government of Pakistan has been pursuing broad objectives for the power generation development including, renewable energy, moving to environmental friendly fuels and reduced dependenceonimportedfuels.Alsodiversificationoffuelresourcesandsecurityoffuelsupplywere among its priorities. The addition of different new generation technologies shown above will change the power mix of the sector from Furnace Oil-based to Coal, RLNG and Renewables as no major addition has been planned on Furnace Oil. The following table shows changes in installed capacity mix over three representative periods.
FuelUp to 30th June, 2017 Up to 30th June, 2021 Up to 30th June, 2025
Capacity Mix (MW)
Capacity Mix (%)
Capacity Mix (MW)
Capacity Mix (%)
Capacity Mix (MW)
Capacity Mix (%)
Gas/RLNG 8,868 33.87 12,626 27.68 12,626 20.30Oil 6,785 25.91 6,785 14.87 6,785 10.91
Coal 810 3.09 8,232 18.04 12,163 19.56Hydro 7,116 27.17 10,244 22.45 20,676* 33.25
Nuclear 1,142 4.36 2,582 5.66 4,782 7.69Renewables
(Solar/ Wind/Bagasse)
1,465 5.59 5,153 11.29 5,153 8.29
Total 26,186 100.00 45,622 100.00 62,185 100.00* Slippage in hydropower projects may delay some of these.Source: NTDC
Clear trends may be noted in respect of different fuels. In the FY 2016-17 about 9,000 MW is based on Gas/RLNG, which increases to 12,626 MW by the FY 2020-21, however no further addition is foreseen till the FY 2024-25. Oil based power generation plants have not been planned throughout the period and share of oil based generation capacity declines from 25.91% in the FY 2016-17 to 10.91% in the FY 2024-25. Share of coal-based generation increases from 3.09% in the FY 2016-17 to 19.56% in the FY 2024-25 mainly on Thar Coal based projects. Hydro-based generation capacity also increases from about 7,000 MW in the FY 2016-17 to 20,676 MW in the FY 2024-25 representing a share of more than 33% in the overall installed generation capacity.
Regarding future energy pattern, based on future projections, it is expected that the energy from Furnace Oil and High Speed Diesel based power plants will reduce from around 32,000 GWh in the FY 2016-17 representing about 31% of the energy generation in NTDC system, to around 17,000 GWh in the FY 2017-18 (14% of the total) to a negligible level in the coming years. Indigenous gas and LNG based energy though a fossil fuel, however being a relatively clean fuel, is expected to account for around 40% of total energy generated in the FY 2019-20 compared to 29% in the FY 2016-17.
1.3.1.1 Induction of Renewable Energy:Although prices of solar and wind technologies have plummeted over the pasts years, the growth of generation facilities based on these has not been witnessed as expected. The generation plans over next three years also, do not include major additions of solar and wind. Initially some technical issues like absence of relevant studies required to establish limits for the induction of wind and solar generation facilities for a safe and reliable operation of the overall National Grid, prevented their development on a large scale. Lately however, the Ministry of Energy (Power Division) could not provide a clear policy about the induction of renewable energy based projects, although a number of solar and wind based power generation projects had completed all procedural

8
requirements for implementation.
Similarly small hydropower plants which also represent a renewable energy based source, could not be built as the Ministry of Energy (Power Division) did not provide a clear policy about their induction. Barring a number of issues like continuity of power supply throughout the year in case of small hydropower generation plants and intermittent nature of power supply in case of wind and solar, the advantages of these technologies make them the priority source of power generation in the long term scenario of any country in the world. These not only provide clean energy but help in fuel security while reducing dependence on imported fuels. Small hydropower plants may appear toberelativelyexpensivethansolarandwindatthisstage,howevertheireconomicandfinancialbenefitsarefargreateriftheirextremelylongoperationallifeisconsideredintheanalysis.
In order to encourage renewable energywhile also capturing the benefits of declining pricesof wind and solar, NEPRA announced a series of upfront tariff rounds, which allowed shorter processing times for the development of projects in addition to lower tariffs, consistent with the international trends. To have more attractive tariffs for the sector, lately, NEPRA has recommended to follow competitive bidding regime, which has been successfully used in different countries to have most competitive prices. In this respect, the role of Alternative Energy Development Board (AEDB) has become extremely important as being the relevant agency under the Ministry of Energy for the development of renewable energy projects. AEDB was required and it publically made a commitment to develop detailed documents including Request for Proposal (RFP) for facilitating competitive bidding for inducting renewable energy based projects. After a lapse of more than year and a half, however, AEDB has not been able to come up with these documents, thus creating anoveralluncertaintyinthesectorspecificallyforprospectiveinvestorsintherenewableenergy.The Ministry of Energy (Power Division) is therefore urged to take a clear and consistent policy about the induction of solar, wind and small hydropower projects. Accordingly, AEDB should initiate schedule for competitive bidding in solar and wind power projects at the earliest.
NEPRAhasnotifiedmultiple tariffsunder theNEPRAUp-frontTariff (ApprovalandProcedure)Regulations 2011, including upfront tariffs for Bagasse and Small Hydropower Generation Plants for providing an incentivized regime for clean power technologies. However, the CPPA-G as sole procurer of power on behalf of DISCOs, has in various cases refused to grant authorization for projects being implemented under tariffs and licences granted by the regulator. Moreover, the CPPA-G has continually acted in an ad-hoc and discriminatory manner towards various IPPs and other power projects. Ministry of Energy (Power Division) is therefore required to streamline internal functioning of CPPA-G on these matters.
1.3.1.2 Dynamics of Fuel:Fuel used for power generation plays a critical role as the availability of power generation facilities is directly linked to the fuel availability and its price in the international market. The exchange rate also impacts the overall price of fuel and ultimately the consumer-end tariff as fuel price is treated asapassthroughcomponentinfinaltariff.Inmediumterm,NationalPowerPolicy2013,focusedon reducing the basket price through cheaper fuels and addition of affordable and sustainable power generation to the grid. Reducing country’s reliance on imported oil has been another broad objective. For achieving these objectives, indigenous coal through Thar mining, imported coal, LNG based power plants, nuclear, solar and wind power are under implementation. It is expected that dependence on furnace oil will sharply come down. In order to reduce dependence on imported fuels, the Federal Government has decided to put a cap on the power generation plants based on imported coal. On similar lines, although LNG is a cleaner fuel, the Federal Government may look
9
into replacing it by construction of large and small hydropower projects through public-private partnership. A preliminary working shows that any slippage of 1 Rupee against US$ would add, roughly Rs. 4 billion annually, to the imported fuel bill for the planned generation facilities in near future.
1.3.2 Impact of Capacity Additions:From an overall perspective, addition of new power generation capacity to reduce and totally eliminate power shortages in the country makes economic sense, as the unserved energy impacts negatively to the economy of the country as a whole. At the same time however, one must be cognizantofdifferentissueswhichalsoneedtobeaddressedsimultaneously,tooptimizebenefitsof additional energy supply to the sector. It is noted that the Federal Government efforts to lower the overall consumer-end tariff may suffer if in addition to lowering fuel costs, the capacity cost is not kept at an affordable level.
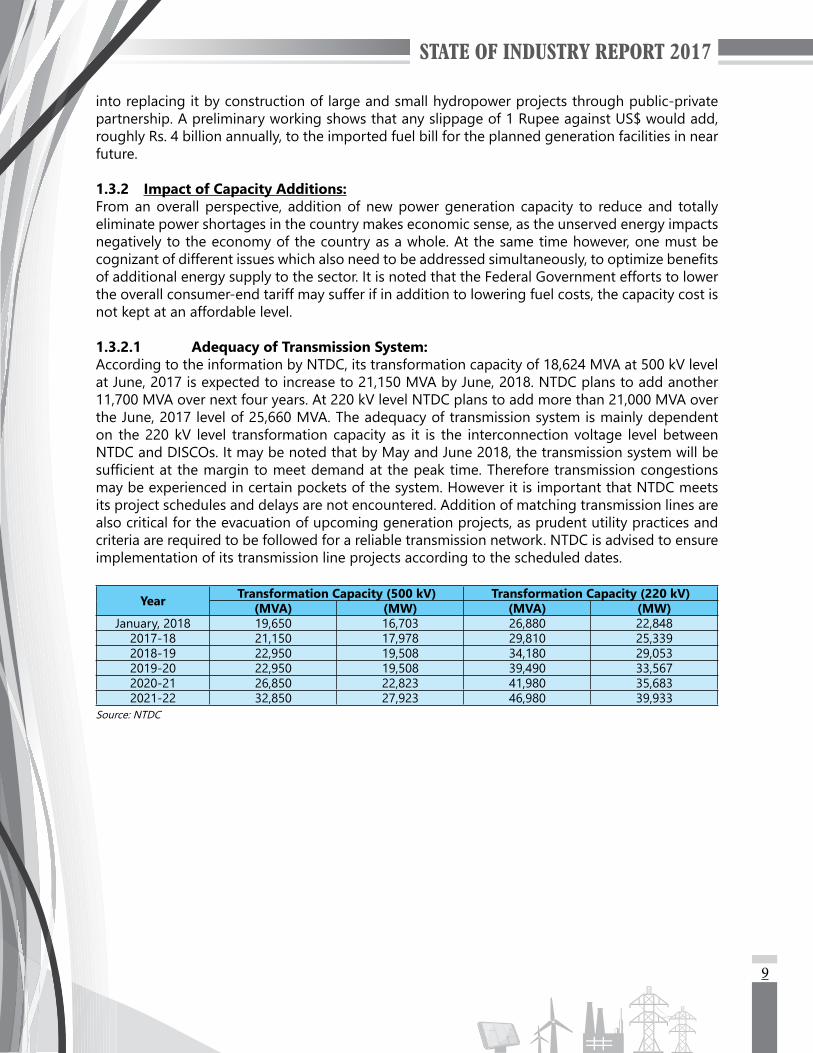
1.3.2.1 Adequacy of Transmission System:According to the information by NTDC, its transformation capacity of 18,624 MVA at 500 kV level at June, 2017 is expected to increase to 21,150 MVA by June, 2018. NTDC plans to add another 11,700 MVA over next four years. At 220 kV level NTDC plans to add more than 21,000 MVA over the June, 2017 level of 25,660 MVA. The adequacy of transmission system is mainly dependent on the 220 kV level transformation capacity as it is the interconnection voltage level between NTDC and DISCOs. It may be noted that by May and June 2018, the transmission system will be sufficientatthemargintomeetdemandatthepeaktime.Thereforetransmissioncongestionsmay be experienced in certain pockets of the system. However it is important that NTDC meets its project schedules and delays are not encountered. Addition of matching transmission lines are also critical for the evacuation of upcoming generation projects, as prudent utility practices and criteria are required to be followed for a reliable transmission network. NTDC is advised to ensure implementation of its transmission line projects according to the scheduled dates.
Year Transformation Capacity (500 kV) Transformation Capacity (220 kV)(MVA) (MW) (MVA) (MW)
January, 2018 19,650 16,703 26,880 22,8482017-18 21,150 17,978 29,810 25,3392018-19 22,950 19,508 34,180 29,0532019-20 22,950 19,508 39,490 33,5672020-21 26,850 22,823 41,980 35,6832021-22 32,850 27,923 46,980 39,933
Source: NTDC

10
The transformation capacity of NTDC system at 220 kV level is charted against the projected demand of NTDC system as shown here. The planned transformation capacity would be adequate over next four year forecast, to pass the demand of the system if the planned implementation schedules of different projects are met.
1.3.2.2 Capacity Payments:An analysis, only for the capacity payments corresponding to generation facilities in NTDC system, shows that such payments which were around Rs. 280 billion in the FY 2015-16 and reached more than Rs. 350 billion in the FY 2016-17, would be close to Rs. 490 billion in the FY 2017-18. A preliminary working in relation to the energy sold, after addition of new power generation plants, shows that capacity cost per unit of energy sold which was slightly higher than Rs. 3.4 in the FY 2015-16 would be around Rs. 4.1 in the FY 2016-17; an increase of Rs. 0.7/unit corresponding to a 6.2%growthinenergysoldintheFY2016-17overtheFY2015-16.ForthefirstsixmonthsoftheFY 2017-18, a growth in energy sold of more than 12.31% over the same period of the FY 2016-17 has been recorded. It is however noted that this growth rate would not be enough to keep the capacity cost component at the same level i.e. Rs. 4.1, as the expected cost components would be close to Rs. 5/unit. In order to keep the capacity cost component at the FY 2016-17 level, the energy sold would be required to increase by at least 30% from the FY 2017-18 to the FY 2018-19. Further analysis shows that in order to keep the capacity payment per unit of energy sold, at the level of the FY 2015-16, at least 57% increase in energy sold would be required in the FY 2018-19 over the FY 2017-18. It is understood that the suppressed demand would also be connected to the system as the electricity is made available, however, in all likelihood, an increase of more than 30% will not be achievable. Various factors including the presence of high loss feeders, in foreseeable future would not let the energy sold, to be increased beyond say 9% to 10% annually, over coming years. With such level of increases in energy sold, the capacity payment close to Rs. 5/unit of energy sold may be expected making the overall energy cost expensive, necessitating increased sustained efforts for cheaper fuels to keep overall tariff at affordable levels.
1.3.2.3 Need for Increasing Energy Sold:Since increasing the level of energy sold is the most critical parameter which can impact positively on the capacity cost per unit sold, therefore all possible means should be explored in this respect. It is noted that power is not supplied by DISCOs to consumers due to multiple reasons including constraints in the transmission and distribution systems, non-availability of generation due to fuel constraintsandotherunspecifiedfactors.InadditiontheMinistryofEnergy(PowerDivision)asa policy has decided not to supply electricity on high-loss feeders which add to the overall load being shed. It is therefore required to address these factors on war-footing for improvement in the system, so that, additional energy is made available through the same power generation capacity.

11
1.3.2.4 Need for Local Manufacturing for Power Sector Equipment:Pakistan as a country has become a consumer market, and it is also true for power sector machinery and equipment, all of which is invariably imported. Although recently there have been a number of very attractive low cost agreements for power equipment, specifically for RLNGbased projects, overall it has been noted to be a supplier’s choice. In order to lower the overall cost of power sector, it is imperative that plant and machinery in generation, transmission and distribution sectors is acquired at competitive prices, prevalent in the regional countries like India. Over the years, local manufacturing of power sector plant and machinery has remained as a low priority for the policy makers. It is however stressed that in order to have affordable consumer-end tariffs, local manufacturing of all major equipment used in power sector be undertaken. Steps in this respect be initiated forthwith.
1.4 NATIONAL ELECTRICITY POLICY AND PLANThe Federal Government has rightly decided to formulate an overall National Electricity Policy and National Electricity Plan for future development of electricity generation, transmission and distribution sectors. The National Electricity Policy would also provide road map for the market structure. The Authority considers that formulation of National Electricity Plans should be a regular activitybyrelevantagencies,astheplansshouldbeevolvingandreflecttechnologicalandfinancialchanges in the sector. The Authority also notes that National Electricity Plans should be adopted in letter and spirit as earlier such plans, though quite comprehensive, were never formed the basis of power sector development. Consequently roller coaster development of sector continued as occasional surpluses and long periods of electricity shortages were witnessed.
1.5 PERFORMANCE OF GENERATION SECTOR
1.5.1 Public Sector (GENCOs and Hydel):
1.5.1.1 Jamshoro Power Company Limited (GENCO-I):The energy generated by GENCO-I during the FY 2016-17 was 3,593 GWh, while, it was 3,828 GWhintheFY2015-16;adecreaseof235GWhor6.14%,overlastyear.NetefficiencyofGENCO-Iduring 2016-17 stood at 28.42% for TPS Jamshoro and 27.05% for GTPS Kotri. With a capacity utilization of 58.04% for TPS Jamshoro and 33.51% for GTPS Kotri due to forced outages and various maintenance issues, the overall performance of GENCO-I has not been satisfactory.
1.5.1.2 Central Power Generation Company Limited (GENCO-II):Total installed capacity of GENCO-II, up to 30th June, 2017 has been noted as 2,402 MW. No new generation plant was inducted during the year under review for GENCO-II. The energy generated by GENCO-II during the FY 2016-17 has been recorded at 8,079 GWh, while, it was 6,031 GWh during the FY 2015-16; an increase of 33.97%, compared with that of the last year. It is observed that various units of GENCO-II have remained off-bar for several years due to maintenance issues, forced outages, fuel constraints and rehabilitation activities etc. and are not being fully utilized. Withreducedannualefficiencyandreducedcapacityutilizationfactor,theoverallperformanceofGENCO-II has been unsatisfactory.
1.5.1.3 Northern Power Generation Company Limited (GENCO-III):Total installed capacity of GENCO-III, up to 30th June, 2017 has been noted as 2,293 MW. During the FY 2016-17, the installed capacity of GENCO-III remained same as compared with that of the year 2015-16. The energy generated by GENCO-III during the FY 2016-17 was 6,861 GWh, while
12
it was 6,273 GWh during the FY 2015-16 showing an increase of 588 GWh or 9.37%, compared withthelastyear.ItisobservedthattheoverallnetefficiencyofTPSMuzaffargarh,SPSFaisalabad,GTPS Faisalabad and Nandipur remained very low. Reportedly, due to various maintenance issues, forced outages and fuel constraints etc. resulting in annual capacity utilization of 48.21% for TPS Muzaffargarh, 14.52% for SPS Faisalabad, 12.27% for GTPS Faisalabad and 38.52% for Nandipur Power Plant, the overall performance of GENCO-III cannot be termed as satisfactory.
1.5.1.4 Lakhra Power Generation Company Limited (GENCO-IV):Total installed capacity of GENCO-IV, up to 30th June, 2017 has been noted as 150 MW. GENCO-IV had three units of 50 MW and during the FY 2016-17, generated 124 GWh as compared to 148 GWh produced during the FY 2015-16. It may be noted that, against the installed capacity of 150 MW, approximately, two third capacity of GENCO-IV is available for generation, which is also not being fully utilized due to forced outages etc. With utilization factor of 22.68% for the FY 2016-17, the overall performance of GENCO-IV has remained unsatisfactory.
AsawholeGENCOscontinuedtooperateatverylowefficienciesthantheirdesignvalues,mostlyon expensive furnace oil. It is also noted that these power plants are also not being operated according to prudent utility practices. GENCOs have low utilization factors and have also been operated in standby mode, where they incur costs without contributing energy to the National Grid, as they are ranked very low in the dispatch merit order. It is noted that during the FY 2016-17 about Rs. 39 billion has been paid to GENCOs on account of capacity payments, while around Rs. 156 billion were charged on account of energy payments. Ministry of Energy (Power Division) is thereforeurgedtophaseoutthesefacilitiesinviewoftheirinefficientanduneconomicroleinthesector. Due to their high operating costs, some of these plants may be totally closed down even if their capacity costs are continued to be paid, to minimize economic loss to the sector.
1.5.1.5 Hydropower:The installed capacity of WAPDA Hydropower remained at 6,902 MW in the years 2015, 2016 and 2017; however, the 31,091 GWh generated in the FY 2016-17, shows a decrease of 2,342 GWh from the last year. The decrease in energy production may be attributed to water availability and irrigation releases from large reservoir based power plants. Similarly, the Hydel IPPs also contributed 133 GWh less in the system during the FY 2016-17 with the same installed capacity as in the FY 2015-16. As for performance of major public sector hydropower plants including Tarbela,andMangla,thatiscomparablewithinternationalstandardsofefficiency,availabilityandauxiliary consumption levels. The hydropower energy production pattern over the year remained consistent with the historical trends.
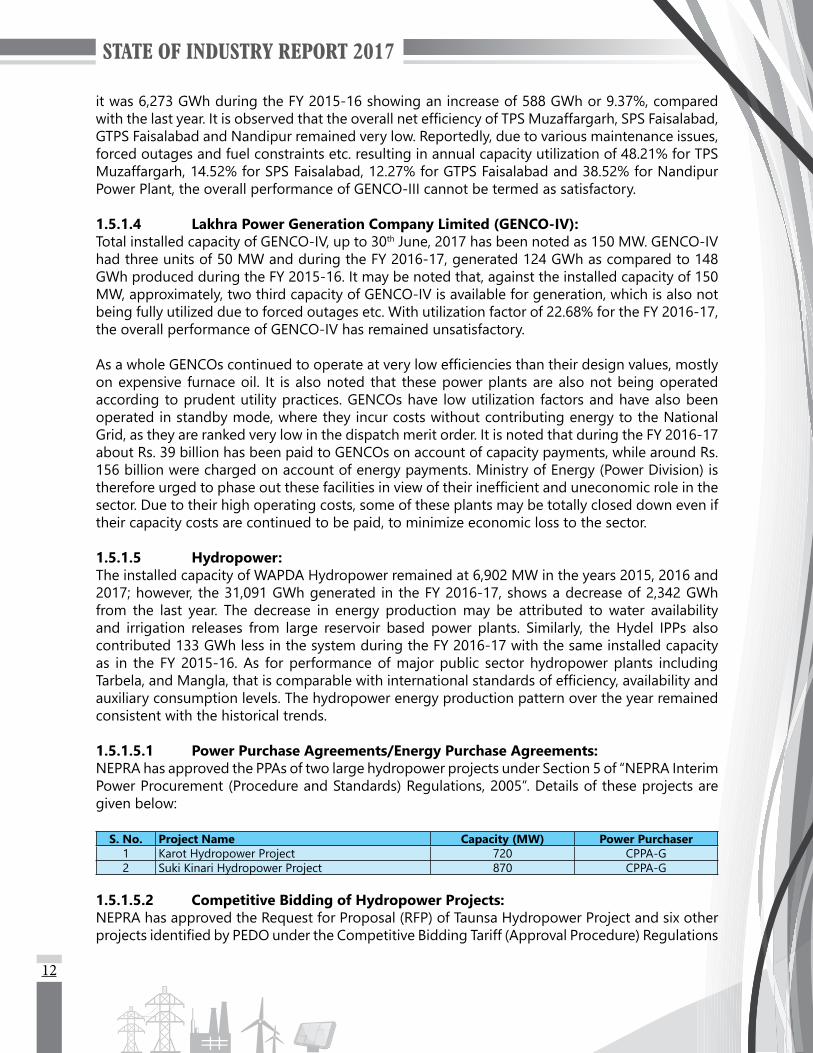
1.5.1.5.1 Power Purchase Agreements/Energy Purchase Agreements:NEPRA has approved the PPAs of two large hydropower projects under Section 5 of “NEPRA Interim Power Procurement (Procedure and Standards) Regulations, 2005”. Details of these projects are given below:
S. No. Project Name Capacity (MW) Power Purchaser1 Karot Hydropower Project 720 CPPA-G2 Suki Kinari Hydropower Project 870 CPPA-G
1.5.1.5.2 Competitive Bidding of Hydropower Projects:NEPRA has approved the Request for Proposal (RFP) of Taunsa Hydropower Project and six other projectsidentifiedbyPEDOundertheCompetitiveBiddingTariff(ApprovalProcedure)Regulations
13
(CBTR), 2014. Subsequently, the bidding under CBTR-2014 for Taunsa Hydropower Project was successfullycompletedandtheAuthorityhasaccordinglynotifiedthelowestsuccessfulbidder.ThiswasthefirstpowergenerationprojectwhosetariffhasbeendeterminedthroughCompetitiveBidding in Pakistan’s power sector.
1.5.1.5.3 Performance Monitoring of Hydropower Projects:The monitoring of different hydropower projects was carried out in the year 2017 to check their performance according to the terms and conditions set in Licence, PPA, Tariff Determination and other relevant rules and regulations.
NEPRA has noted the unsatisfactory performance of Malakand-III (81 MW), Jinnah (96 MW) and Khan Khwar (72 MW) Hydropower Plants. The sponsors and the power purchaser have been directed to improve the operation and maintenance of these plants.
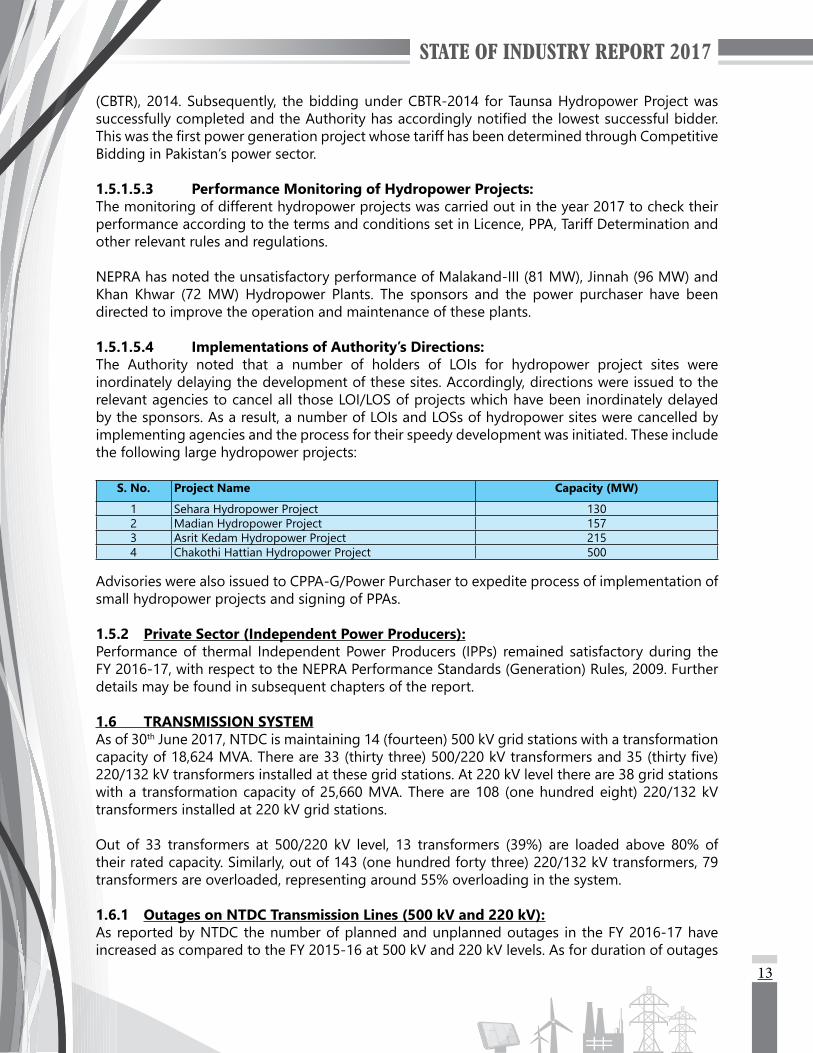
1.5.1.5.4 Implementations of Authority’s Directions:The Authority noted that a number of holders of LOIs for hydropower project sites were inordinately delaying the development of these sites. Accordingly, directions were issued to the relevant agencies to cancel all those LOI/LOS of projects which have been inordinately delayed by the sponsors. As a result, a number of LOIs and LOSs of hydropower sites were cancelled by implementing agencies and the process for their speedy development was initiated. These include the following large hydropower projects:
S. No. Project Name Capacity (MW)
1 Sehara Hydropower Project 1302 Madian Hydropower Project 1573 Asrit Kedam Hydropower Project 2154 Chakothi Hattian Hydropower Project 500
Advisories were also issued to CPPA-G/Power Purchaser to expedite process of implementation of small hydropower projects and signing of PPAs. 1.5.2 Private Sector (Independent Power Producers):Performance of thermal Independent Power Producers (IPPs) remained satisfactory during the FY 2016-17, with respect to the NEPRA Performance Standards (Generation) Rules, 2009. Further details may be found in subsequent chapters of the report.
1.6 TRANSMISSION SYSTEMAs of 30th June 2017, NTDC is maintaining 14 (fourteen) 500 kV grid stations with a transformation capacityof18,624MVA.Thereare33(thirtythree)500/220kVtransformersand35(thirtyfive)220/132 kV transformers installed at these grid stations. At 220 kV level there are 38 grid stations with a transformation capacity of 25,660 MVA. There are 108 (one hundred eight) 220/132 kV transformers installed at 220 kV grid stations.
Out of 33 transformers at 500/220 kV level, 13 transformers (39%) are loaded above 80% of their rated capacity. Similarly, out of 143 (one hundred forty three) 220/132 kV transformers, 79 transformers are overloaded, representing around 55% overloading in the system.
1.6.1 Outages on NTDC Transmission Lines (500 kV and 220 kV):As reported by NTDC the number of planned and unplanned outages in the FY 2016-17 have increased as compared to the FY 2015-16 at 500 kV and 220 kV levels. As for duration of outages
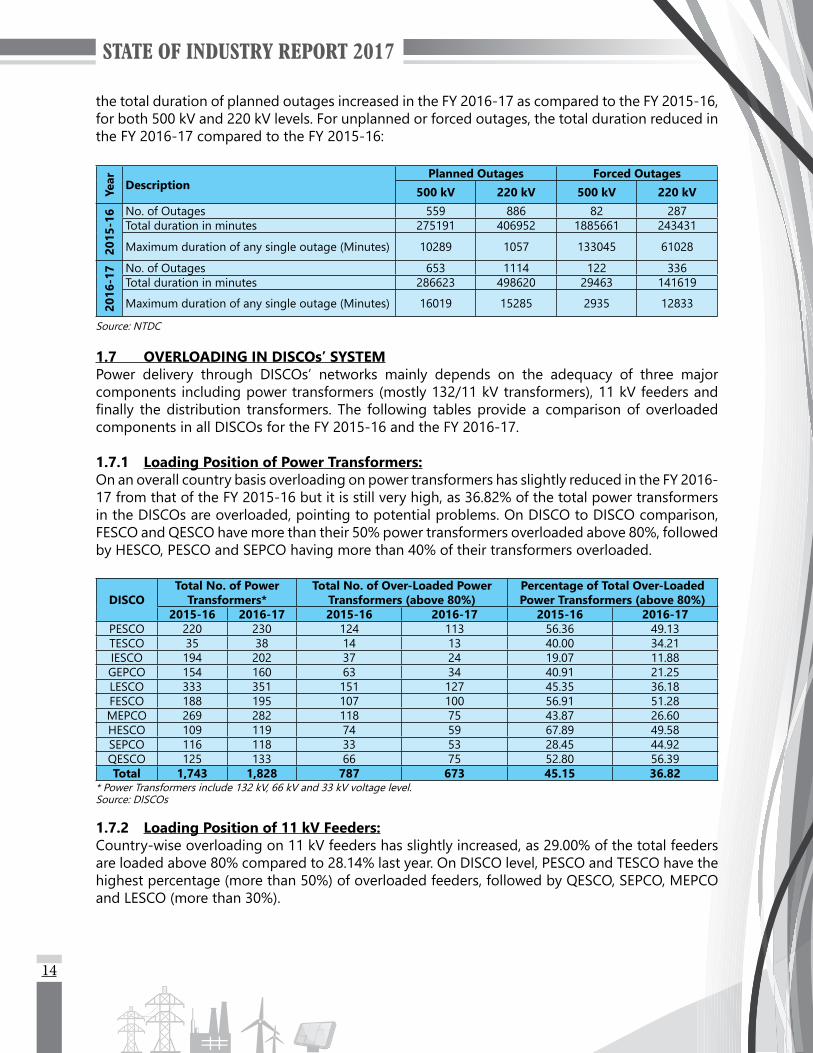
14
the total duration of planned outages increased in the FY 2016-17 as compared to the FY 2015-16, for both 500 kV and 220 kV levels. For unplanned or forced outages, the total duration reduced in the FY 2016-17 compared to the FY 2015-16:
Year Description
Planned Outages Forced Outages500 kV 220 kV 500 kV 220 kV
2015
-16 No. of Outages 559 886 82 287
Total duration in minutes 275191 406952 1885661 243431
Maximum duration of any single outage (Minutes) 10289 1057 133045 61028
2016
-17 No. of Outages 653 1114 122 336
Total duration in minutes 286623 498620 29463 141619
Maximum duration of any single outage (Minutes) 16019 15285 2935 12833
Source: NTDC
1.7 OVERLOADING IN DISCOs’ SYSTEMPower delivery through DISCOs’ networks mainly depends on the adequacy of three major components including power transformers (mostly 132/11 kV transformers), 11 kV feeders and finally thedistribution transformers. The following tablesprovidea comparisonofoverloadedcomponents in all DISCOs for the FY 2015-16 and the FY 2016-17.
1.7.1 Loading Position of Power Transformers:On an overall country basis overloading on power transformers has slightly reduced in the FY 2016-17 from that of the FY 2015-16 but it is still very high, as 36.82% of the total power transformers in the DISCOs are overloaded, pointing to potential problems. On DISCO to DISCO comparison, FESCO and QESCO have more than their 50% power transformers overloaded above 80%, followed by HESCO, PESCO and SEPCO having more than 40% of their transformers overloaded.
DISCOTotal No. of Power
Transformers*Total No. of Over-Loaded Power
Transformers (above 80%)Percentage of Total Over-Loaded Power Transformers (above 80%)
2015-16 2016-17 2015-16 2016-17 2015-16 2016-17PESCO 220 230 124 113 56.36 49.13TESCO 35 38 14 13 40.00 34.21IESCO 194 202 37 24 19.07 11.88GEPCO 154 160 63 34 40.91 21.25LESCO 333 351 151 127 45.35 36.18FESCO 188 195 107 100 56.91 51.28MEPCO 269 282 118 75 43.87 26.60HESCO 109 119 74 59 67.89 49.58SEPCO 116 118 33 53 28.45 44.92QESCO 125 133 66 75 52.80 56.39Total 1,743 1,828 787 673 45.15 36.82
* Power Transformers include 132 kV, 66 kV and 33 kV voltage level.Source: DISCOs
1.7.2 Loading Position of 11 kV Feeders:Country-wise overloading on 11 kV feeders has slightly increased, as 29.00% of the total feeders are loaded above 80% compared to 28.14% last year. On DISCO level, PESCO and TESCO have the highest percentage (more than 50%) of overloaded feeders, followed by QESCO, SEPCO, MEPCO and LESCO (more than 30%).

15
DISCOTotal No. of 11 kV
FeedersTotal No. of Over-Loaded
11 kV Feeders (above 80%)Percentage of Total Over-Loaded
11 kV Feeders (above 80%)2015-16 2016-17 2015-16 2016-17 2015-16 2016-17
PESCO 907 946 396 485 43.66 51.27TESCO 195 203 174 191 89.23 94.09IESCO 1,036 1,058 72 27 6.95 2.55GEPCO 779 805 167 88 21.44 10.93LESCO 1,580 1,650 350 548 22.15 33.21FESCO 936 998 189 159 20.19 15.93MEPCO 1,165 1,241 428 433 36.74 34.89HESCO 435 463 103 121 23.68 26.13SEPCO 453 462 179 167 39.51 36.15QESCO 613 628 221 233 36.05 37.10Total 8,099 8,454 2,279 2,452 28.14 29.00
Source: DISCOs
1.7.3 Loading Position of Distribution Transformers:Overloading of distribution transformers in case of LESCO at 30.13% is the highest among DISCOs, followed by PESCO and SEPCO.
DISCO
Total No. of Distribution Transformers
Total No. of Over-Loaded Distribution Transformers
(above 80%)
Percentage of TotalOver-Loaded Distribution Transformers (above 80%)
2015-16 2016-17 2015-16 2016-17 2015-16 2016-17PESCO 60,365 72,078 19,311 21,033 31.99 29.18TESCO 15,634 16,612 174 191 1.11 1.15IESCO 45,438 46,359 3,105 2,868 6.83 6.19GEPCO 60,080 61,661 1,548 1,475 2.58 2.39LESCO 97,048 100,718 41,952 30,350 43.23 30.13FESCO 97,761 100,276 3,285 1,843 3.36 1.84MEPCO 152,806 156,460 7,105 8,128 4.65 5.19HESCO 35,334 35,996 8,336 3,340 23.59 9.28SEPCO 35,029 35,875 6,443 7,424 18.39 20.69QESCO 53,646 55,770 8,743 8,873 16.30 15.91Total 653,141 681,805 100,002 85,525 15.31 12.54
Source: DISCOs
From above it is noted that although PESCO, SEPCO, TESCO and QESCO have generally been accepted as those DISCOs, which have consistently shown poor performance levels, what is more worrying however, is that according to the above statistics, the so called better performers like LESCO and MEPCO have a poor record for 11 kV overloaded feeders. LESCO has the worst record of overloading of distribution transformers. Similarly FESCO has very serious issues to tackle with the overloading of its power transformers. Considering the share of these DISCOs in the overall energy consumption, further delays in overcoming these issues will be disastrous for the power sector.
1.7.4 Province-wise Loading Positions:Province-wise statistics of overloading position (above 80%) for June, 2017 is shown in the following table:
Description Punjab Sindh Khyber Pakhtunkhwa Balochistan Total
No. of 132 kV Grid Stations (including consumer owned) 490 120 86 64 760
Total No. of Power Transformers* 1,190 237 268 133 1,828
16
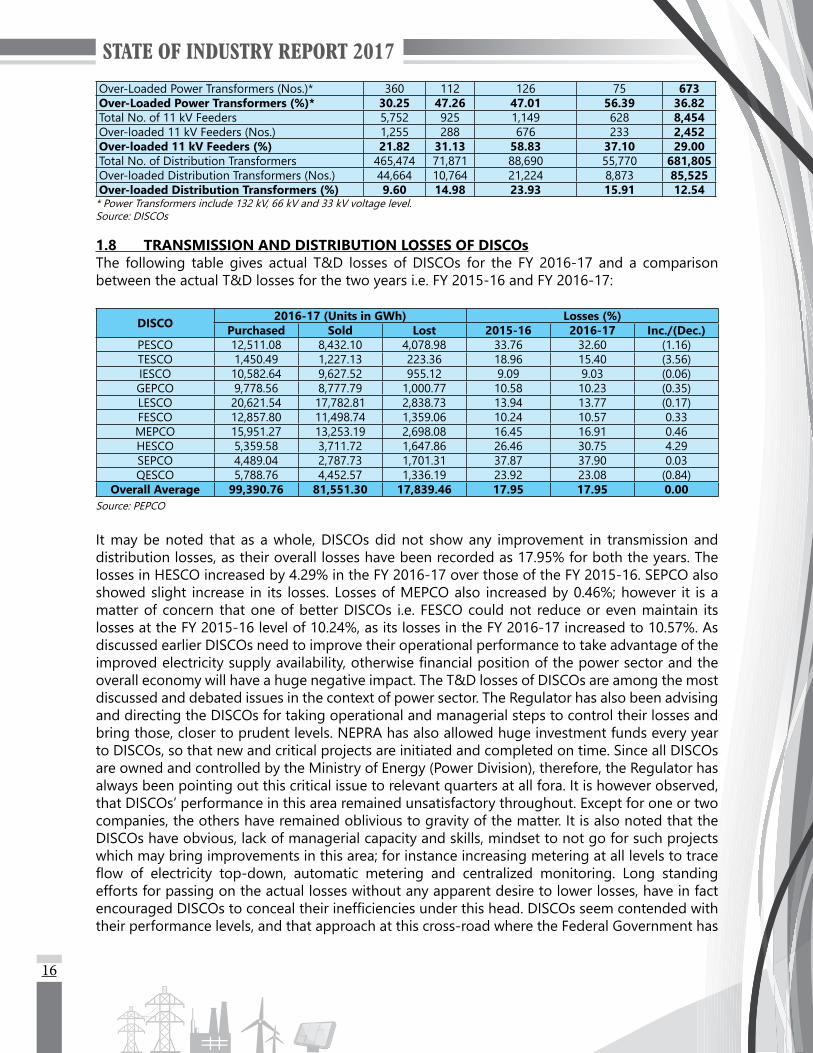
Over-Loaded Power Transformers (Nos.)* 360 112 126 75 673Over-Loaded Power Transformers (%)* 30.25 47.26 47.01 56.39 36.82Total No. of 11 kV Feeders 5,752 925 1,149 628 8,454Over-loaded 11 kV Feeders (Nos.) 1,255 288 676 233 2,452Over-loaded 11 kV Feeders (%) 21.82 31.13 58.83 37.10 29.00Total No. of Distribution Transformers 465,474 71,871 88,690 55,770 681,805Over-loaded Distribution Transformers (Nos.) 44,664 10,764 21,224 8,873 85,525Over-loaded Distribution Transformers (%) 9.60 14.98 23.93 15.91 12.54
* Power Transformers include 132 kV, 66 kV and 33 kV voltage level.Source: DISCOs
1.8 TRANSMISSION AND DISTRIBUTION LOSSES OF DISCOsThe following table gives actual T&D losses of DISCOs for the FY 2016-17 and a comparison between the actual T&D losses for the two years i.e. FY 2015-16 and FY 2016-17:
DISCO 2016-17 (Units in GWh) Losses (%)Purchased Sold Lost 2015-16 2016-17 Inc./(Dec.)
PESCO 12,511.08 8,432.10 4,078.98 33.76 32.60 (1.16)TESCO 1,450.49 1,227.13 223.36 18.96 15.40 (3.56)IESCO 10,582.64 9,627.52 955.12 9.09 9.03 (0.06)GEPCO 9,778.56 8,777.79 1,000.77 10.58 10.23 (0.35)LESCO 20,621.54 17,782.81 2,838.73 13.94 13.77 (0.17)FESCO 12,857.80 11,498.74 1,359.06 10.24 10.57 0.33MEPCO 15,951.27 13,253.19 2,698.08 16.45 16.91 0.46HESCO 5,359.58 3,711.72 1,647.86 26.46 30.75 4.29SEPCO 4,489.04 2,787.73 1,701.31 37.87 37.90 0.03QESCO 5,788.76 4,452.57 1,336.19 23.92 23.08 (0.84)
Overall Average 99,390.76 81,551.30 17,839.46 17.95 17.95 0.00Source: PEPCO
It may be noted that as a whole, DISCOs did not show any improvement in transmission and distribution losses, as their overall losses have been recorded as 17.95% for both the years. The losses in HESCO increased by 4.29% in the FY 2016-17 over those of the FY 2015-16. SEPCO also showed slight increase in its losses. Losses of MEPCO also increased by 0.46%; however it is a matter of concern that one of better DISCOs i.e. FESCO could not reduce or even maintain its losses at the FY 2015-16 level of 10.24%, as its losses in the FY 2016-17 increased to 10.57%. As discussed earlier DISCOs need to improve their operational performance to take advantage of the improvedelectricitysupplyavailability,otherwisefinancialpositionofthepowersectorandtheoverall economy will have a huge negative impact. The T&D losses of DISCOs are among the most discussed and debated issues in the context of power sector. The Regulator has also been advising and directing the DISCOs for taking operational and managerial steps to control their losses and bring those, closer to prudent levels. NEPRA has also allowed huge investment funds every year to DISCOs, so that new and critical projects are initiated and completed on time. Since all DISCOs are owned and controlled by the Ministry of Energy (Power Division), therefore, the Regulator has always been pointing out this critical issue to relevant quarters at all fora. It is however observed, that DISCOs’ performance in this area remained unsatisfactory throughout. Except for one or two companies, the others have remained oblivious to gravity of the matter. It is also noted that the DISCOs have obvious, lack of managerial capacity and skills, mindset to not go for such projects which may bring improvements in this area; for instance increasing metering at all levels to trace flow of electricity top-down, automatic metering and centralized monitoring. Long standingefforts for passing on the actual losses without any apparent desire to lower losses, have in fact encouragedDISCOstoconcealtheirinefficienciesunderthishead.DISCOsseemcontendedwiththeir performance levels, and that approach at this cross-road where the Federal Government has

17
inducted a large generation capacity to the system may drag the whole sector down if immediate steps to correct this position are not taken.
1.9 RECOVERY POSITION OF DISCOsThe following table shows a comparison of recovery ratios for all the DISCOs for the two years. It may be seen that apart from HESCO, PESCO and IESCO who improved upon their recovery position, none of the other DISCOs was able to improve its position over the previous year. LESCO managed to stay at the same level of good recovery ratio in the FY 2016-17, whereas FESCO, MEPCO and GEPCO could not match their performance of the last year as their recovery dropped by approximately 3% during the FY 2016-17. QESCO’s recovery position deteriorated drastically during the FY 2016-17 as only 43.55% of the amount billed was recovered. SEPCO though showed more than 100% recovery but in fact it is due to certain adjustment made with the Government of Sindhwhichhasinflatedthetruerecoveryfortheyear.
(%)
Year PESCO TESCO IESCO GEPCO LESCO FESCO MEPCO HESCO SEPCO QESCO OverallDISCO
2015-16 88.49 436.97* 91.14 99.41 99.20 100.06 99.99 72.09 55.18 71.62 94.482016-17 89.29 82.90 91.87 95.99 99.20 97.24 96.21 93.68 109.98 43.55 92.65
* Source payment received against billing of Private Domestic TESCO consumers for Rs. 18,955.61 million in 2015-16 from Federal Government.Source: DISCOs
1.9.1 Recovery Position of Main Categories of Consumers (%):To narrow down the areas of interest, following charts show performance of all the DISCOs in the four major categories of consumers. It may be noted that IESCO was able to maintain quite a consistent and satisfactory recovery ratios for all the consumer categories. GEPCO managed satisfactory ratios for domestic and commercial consumers however for industrial and agricultural consumers, it needs to improve its recovery to come closer to IESCO. LESCO needs to focus more on agricultural consumers for improving its recovery position for this category. FESCO also achieved quite satisfactory recovery ratios except for industrial consumers for which recovery position can be improved through better managerial efforts. Similarly, MEPCO also needs to address recovery issues with the industrial sector to improve its position. PESCO has shown an overall improvement in this area, however its recovery in domestic category is close to 84% which requires sustained efforts by the company management to target above 90% recovery in this category. It is observed that HESCO and SEPCO require hectic efforts to improve their recovery position in domestic sector. QESCO’s inferior performance is mainly due to poor recovery position of agricultural and domestic consumers.

18
1.10 PERFORMANCE OF K-ELECTRIC LIMITEDBy March 2018, KEL had installed capacity of 2,261 MW through its own power plants whereas IPPs and CPPs add another 442 MW to KEL system. In addition to 137 MW KANUPP power plant, NTDC is also providing 650 MW to KEL system. Due to aging and deterioration in generation facilities, KEL’s present capacity is reported as 1,973 MW. Since KEL is responsible for maintaining integrated systems of generation, transmission and distribution, therefore it is required to look for other sources to meet the supply and demand gap. Inability of KEL to effectively increase its generation capacity has made it dependent on external power sources, including the import from NTDC system. During the FY 2016-17 also, in addition to purchasing power from IPPs, KEL imported around 650 MW of power from NTDC on regular basis. Although the agreement between NTDC and KEL for power purchase has already expired, the power is still being supplied to meet the requirement of KEL consumers.
The energy generated during the FY 2016-17 through KEL own power plants is noted as 10,147 GWhwhichshowsadecreaseof176GWhascomparedtothepreviousyearfigure i.e.10,323GWh; a decrease of 1.7%.
During the year KEL continued to underutilize its own generation power plants and it was also noted to ignore merit order operation of its power plants. The Authority initiated relevant proceedings under its law to address the matter.
KEL reportedly faced gas supply issues which added to problems of the utility, as the KEL power plants during the FY 2016-17 used 55,016 MMCFT of gas, which is lower by 11,867 MMCFT as compared to its gas consumption during the FY 2015-16.
ItmaybenotedthatKELwasabletoimprovetheaverageefficiencyofitsgenerationfleetfrom30.4%in2009topresentlevelsof37%in2017.ThedesignthermalefficiencyofsomeunitsofBQPS-I on oil and gas were 37.5% and 36% respectively. Owing to lack of proper O&M practices, thecurrentaverageefficiencyofBQPS-Iishoveringaround33.64%whichalthoughisbetterthanGENCOs’similarplants,havingefficienciesintherangeof24%to32%butwhencomparedtotheefficiencyof38.60%asallowedtoprivatepowerplantsunder1994PowerPolicy,theefficiencyand availability levels of KEL are not satisfactory.
1.10.1 Loading Position of Power Transformers, 11 kV Feeders and Distribution Transformers:The following table provides overloading positions (above 80%) of overloaded components in KEL for the FY 2015-16 and the FY 2016-17:
Description 2015-16 2016-17Total No. of Over-Loaded Power Transformers (above 80%) 31 59Percentage of Total Over-Loaded Power Transformers (above 80%) 22.63 42.75Total No. of Over-Loaded 11 kV Feeders (above 80%) 104 91Percentage of Total Over-Loaded 11 kV Feeders (above 80%) 6.82 5.51Total No. of Over-Loaded Distribution Transformers (above 80%) 648 551Percentage of Total Over-Loaded Distribution Transformers (above 80%) 2.78 2.15
Source: KEL
It is noted that more than 40% power transformers of KEL are overloaded in the FY 2016-17, whereas in the FY 2015-16 approximately 22% transformers were noted to be operating above 80%

19
of their rated capacity. It may be concluded that KEL has not added enough power transformers in its network to maintain at least the same ratio of overloaded transformers as of last year, whereas it was required to maintain a system capable of providing a reliable supply at all times for consumers. KEL’s failure to add adequate number of power transformers was among the major reasons for frequent tripping and prolonged load shed hours during the FY 2016-17.
1.10.2 Recovery Position of K-Electric Limited:
KEL’s position is also not satisfactory although its’ recovery position has slightly improved than the last year. It is noted that the domestic consumers have a 51% share in total energy billed by KEL however; it could recover only 82% of the amount corresponding to that energy. Unless KEL takes effective measures in this category, it would be quite difficult to improve the overall financial health of the company. Being a private sector entity, NEPRA requires that innovative measures be taken by KEL to show its commitment for meeting the overall objectives of a prudent utility.
CategoryAmount of Billed Units
(Rs. in Million)Amount Realized and %age Recovery to Billed Amount
(Rs. in Million) (%)Domestic 98,081 80,477 82.05Commercial 42,156 39,786 94.38Industrial 58,224 60,479 103.87Agricultural 1,419 351 24.74Public Lighting 3,482 1,045 30.01Bulk Supply 8,418 8,532 101.35Others 170 172 101.18Total 211,950 190,842 90.04
Source: KEL1.11 THE REGULATION OF GENERATION, TRANSMISSION AND DISTRIBUTION OF
ELECTRIC POWER (AMENDMENT) ACT, 2018The Parliament has recently passed the Regulation of Generation, Transmission and Distribution of Electric Power (Amendment) Act, 2018 [Act No. XII of 2018]. The Amendment Act has restructured and evolved the energy sector in material respects and overhauled the role and responsibilities of NEPRA. The material changes to the law introduced vide the Amendment Act are as follows:
1.11.1 Major Amendments:The qualifying experience of the Chairman and members of the Authority have been reduced from 20 years to 12 years respectively, and the retirement ages of Members and the Chairman from 65 years to 60 years.
The concepts of the National Electricity Policy (formulated by the Federal Government and approved by the CCI) and National Electricity Plan (formulated by the Federal Government in consultation with Provincial Governments) have been introduced in the law. The Authority has to
20
exercise its mandate in accordance with both the Policy and Plan.
The law has further introduced frameworks for establishment and functioning of an Appellate Tribunal, under which all orders and determinations of the Authority shall be appealable.
The major focus of the Amendment Act has been to introduce various market-based frameworks in the energy sector, to create a competitive market regime. The law has introduced new entities, such as the Energy Supplier and Energy Trader, and revised the regulatory regime for existing entities, by introducing the new Market Operator and System Operator Licences. Traditional elements of the energy sector have also been reformed under this spirit, by the provision of a cessation mechanism for all Generation Licences and removal of exclusivity for Distribution Companies.
Flowing from the above, NEPRA’s role in the forthcoming energy sector has also been revised, with a major focus on the regulator’s enforcement powers. The Authority has been granted new enforcement powers of investigation, prohibition orders, issuance of directions and indemnity. In addition, the function of NEPRA as a regulation-making body has also been bolstered, with numerous subject matters falling within the purview of regulations to be exclusively prescribed by the Authority.
With a focus on betterment of end-consumer service, a new consumer complaints officeframeworkhasbeenintroducedinthelaw,underwhichofficesareenvisionedtobeestablishedata district level for overseeing complaints relating to overbilling, metering, theft etc. Concurrently, new penal provisions and offences have been introduced in statute, including the punishment of imprisonment.
1.11.2 Challenges: The abovediscussed reforms represent a significantdeparture from the traditional regulatoryframework under which NEPRA has been functioning for the preceding 20 years. As such, the Authority shall be facing innumerable challenges in effectuating the reforms introduced vide the Amendment Act.
Themost significant revision toNEPRA’s regulatorypurviewunder theAmendmentAct is theintroduction of the National Electricity Policy and Plan, and the Appellate Tribunal. Previously, all functions of the Authority were executed in an independent, impartial and unfettered manner. Now all functions are subject and subservient to both the Policy and Plan, and are directly appealable before the Appellate Tribunal. These frameworks curtail the autonomy of the regulator in material respects. As such, the regulator has to undertake the challenging task of reevaluating and realigning its regulatory functions in accordance with the new legal regime.
TheestablishmentoftheAppellateTribunalanddistrict-levelconsumercomplaintofficespresentfurther challenges for the Authority. The Appellate Tribunal is to be manned by 3 Members with diverse experiences and expertise, and provided in the law. However, it will be challenging for the Tribunal to adjudicate on complex matters that the Authority, with its 100 professionals holding immeasurable cumulative expertise in the sector, itself executes. Moreover, the Tribunal represents an additional layer in the dispensation of justice in an already exhaustive appellate framework. Inaddition,theestablishmentofmorethana100officesforcomplaintsineachdistrictposesamonumental logistical and human resource challenge for the Authority.
21
Various avant-garde concepts have been introduced in the amended law without necessary elaboration. For instance, noparameters for theNational Electricity Plan havebeen specified,the functions/role of the Electricity Trader Licensee have not been provided and the statutory provisions do not explicitly provide for treatment of consumer-end tariffs under the new law. There are also various inconsistencies found in the law, for instance the introduction of uniform tariffs(conflictswithprovisionsrelatingtocompetition)andsavingsunderprecedinglaw(conflictbetween provisions of existing saved licences and statutory provisions). These concerns lay significantchallengesbeforetheAuthorityintheexerciseofitsfunctionsgoingforward.
1.12 ENERGY, ENVIRONMENT AND SUSTAINABLE DEVELOPMENTCognizant of its responsibilities towards protection of environment of the country, in view of planned induction of large coal power plants, NEPRA organized a seminar about Energy, Environment and Sustainable Development. The seminar was attended by representatives from various organizations. The main aim and objectives of the said seminar were as follows:
(a) Awareness about environment among the stakeholders in Pakistan’s power sector; especially after the expected changes in the current energy mix.
(b) Adequacy of existing laws on environment protection and the role of relevant bodies.(c) NEPRA’s role. (d) Way forward.
During the seminar, representatives of Provincial Environmental Protection Agencies (EPAs), discussed about procedural aspects of their departments and showed keen commitment and needforcontinuousmonitoringofupcomingcoalfiredpowerplants.
NEPRA being the regulator of the power sector regularly interacts with relevant EPAs about compliance of their relevant acts. Moreover, NEPRA also obtains compliance reports from the project companies as required under generation licence.
1.13 COMPREHENSIVE REDUCTION AND ELIMINATION OF POLYCHLORINATED BIPHENYLS (PCBs)
Another project to protect environment is in shape of NEPRA’s support to Ministry of Climate Change (MOCC). The objective of MOCC project is to reduce risks for the human health and the environment by avoiding the release of Persistent Organic Pollutants (POPs) in the environment andpreventinghumanexposuretothese.POPscanbedefinedinanumberofwaysincludingthefollowing:
(a) Chemicals with high toxicity originated through anthropogenic activities.(b) Organic chemicals containing carbon and hydrogen are characterized by adverse
effects on life.(c) Bio-accumulation, persistence and long range transport pose a threat to humans
and the environment.(d) POPs are widely used as pesticides and/or industrial chemicals.
The project has been arranged in four components:
(a) Development and Implementation of a Regulatory Policy and Enforcement System to reduce POPs releases.
(b) Capacity building of local communities and public and private sector stakeholders
22
to reduce exposure to and releases of POPs.(c) Collection, Transport and Disposal of PCBs and POPs Pesticides.(d) Monitoring and Evaluation.
NEPRAhasbeencoordinatingwiththepowersectorentitiesandMOCC,essentiallyforidentificationof PCBs, present in power equipment.
1.14 RATIONALIZATION OF GENERATION TARIFF PARAMETERSAs part of its regulatory process, NEPRA has reviewed various tariff components for necessary changes needed therein. This aims to ensure that the power sector tariffs approved and awarded areconsistentand reflectiveofprevailingeconomicandfinancial circumstances that implicatepower generation tariffs approved by NEPRA. After a comprehensive review and discussion with various stakeholders, the Authority has decided to revise certain benchmarks and ceilings to be allowed for tariff components of generation projects. In this respect, the Authority would like to seek input of all stakeholders on these recommendationsbeforethesearefinalizedforapplicationintariffs.FollowingheadshavebeenidentifiedforreviewbytheAuthority:
(a) Banking Spread(b) Debt and Equity Ratios(c) IDC and ROEDC(d) Financing Fee(e) Insurance(f) Withholding Tax on dividends(g) Availability
The Authority in principle continues to move towards promoting the competitive mode in generationtariffs.However,forthespecificprojectstobeconsideredundercostplusregimeandfor certain parameters to be used in upfront tariffs, these benchmarks will be used accordingly.1.15 REVIEW OF RATE OF RETURNNEPRA has decided to review the returns offered in the power sector and prepared a concept paper for determination of the rates of return for the power companies which provided a basis for determining Internal Rate of Return (IRR) for various technologies, value chain of power sector i.e. generation, transmission and distribution and tariff regimes (cost plus, upfront). The basic objectiveisthattheIRRnowneedstobeeffectivelyreflectiveofspecificriskandreturnmatrixand its adjustment for a particular technology. The document was uploaded on NEPRA website for comments from the stakeholders.
1.16 INDUSTRY – ACADEMIA COLLABORATIONNational University of Sciences and Technology (NUST) is working closely with NEPRA on a research proposal namely “Modeling and Simulation of Pakistan’s Electric Power Sector to develop a Road Map for Transition from the Current Single Buyer Model to a Competitive Whole Sale Power Market”.
23
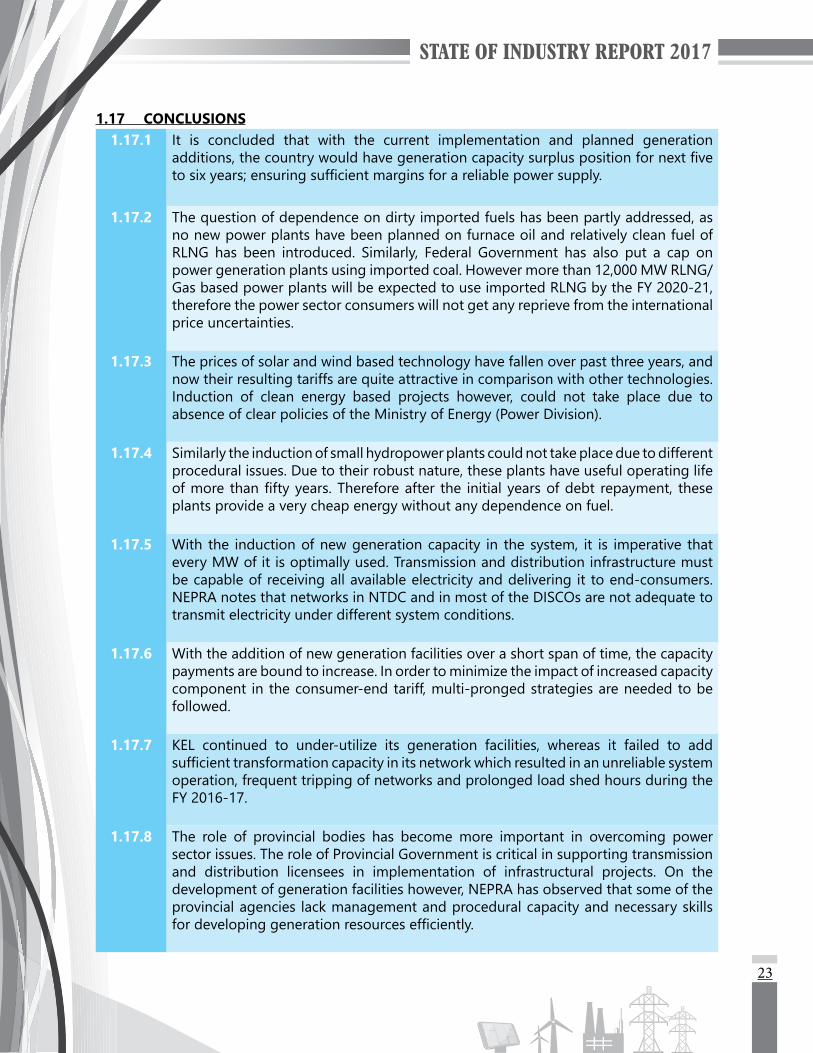
1.17 CONCLUSIONS1.17.1 It is concluded that with the current implementation and planned generation
additions,thecountrywouldhavegenerationcapacitysurpluspositionfornextfivetosixyears;ensuringsufficientmarginsforareliablepowersupply.
1.17.2 The question of dependence on dirty imported fuels has been partly addressed, as no new power plants have been planned on furnace oil and relatively clean fuel of RLNG has been introduced. Similarly, Federal Government has also put a cap on power generation plants using imported coal. However more than 12,000 MW RLNG/Gas based power plants will be expected to use imported RLNG by the FY 2020-21, therefore the power sector consumers will not get any reprieve from the international price uncertainties.
1.17.3 The prices of solar and wind based technology have fallen over past three years, and now their resulting tariffs are quite attractive in comparison with other technologies. Induction of clean energy based projects however, could not take place due to absence of clear policies of the Ministry of Energy (Power Division).
1.17.4 Similarly the induction of small hydropower plants could not take place due to different procedural issues. Due to their robust nature, these plants have useful operating life ofmore thanfiftyyears.Thereforeafter the initialyearsofdebt repayment, theseplants provide a very cheap energy without any dependence on fuel.
1.17.5 With the induction of new generation capacity in the system, it is imperative that every MW of it is optimally used. Transmission and distribution infrastructure must be capable of receiving all available electricity and delivering it to end-consumers. NEPRA notes that networks in NTDC and in most of the DISCOs are not adequate to transmit electricity under different system conditions.
1.17.6 With the addition of new generation facilities over a short span of time, the capacity payments are bound to increase. In order to minimize the impact of increased capacity component in the consumer-end tariff, multi-pronged strategies are needed to be followed.
1.17.7 KEL continued to under-utilize its generation facilities, whereas it failed to add sufficienttransformationcapacityinitsnetworkwhichresultedinanunreliablesystemoperation, frequent tripping of networks and prolonged load shed hours during the FY 2016-17.
1.17.8 The role of provincial bodies has become more important in overcoming power sector issues. The role of Provincial Government is critical in supporting transmission and distribution licensees in implementation of infrastructural projects. On the development of generation facilities however, NEPRA has observed that some of the provincial agencies lack management and procedural capacity and necessary skills fordevelopinggenerationresourcesefficiently.

24
1.17.9 NEPRA has introduced Net-Metering regime since 2016. 108 consumers for 2,346 kW have been noted to participate in it upto June, 2017. Consumers and other stakeholders have been showing a lot of interest by proposing improvements in this regime.
1.17.10 Federal Government has recently approved Amendment Act, 2018 which provides for a complete shift in the existing regulatory regime. The distribution business has now been bifurcated into separate wire and sale businesses. At the same time concepts of “trader” and “supplier” have been introduced which in a way set the direction of a future market model. It is felt that by including framework for a future market in the Act, an inflexible approach has been adopted instead of conducting detaileddeliberation for recommending a solution.
1.18 RECOMMENDATIONS1.18.1 For continued reliability in the system, long term plans would be required to be
developed taking into consideration clear policies and supply and demand position.
1.18.2 In order to reduce dependence on imported fuel, new explorations and induction of indigenous gas should be encouraged.
1.18.3 Since solar and wind provide environmentally clean energy, without using fuel, therefore the Ministry of Energy (Power Division) is urged to resolve policy level ambiguities and technical issues for promotion of these technologies.
1.18.4 For long-term sustainability of the sector, small hydropower plants must be encouraged.
1.18.5 Ministry of Energy (Power Division) being owner of NTDC and DISCOs, is required to take extra ordinary steps for ensuring availability of strong transmission and distribution infrastructure to provide a reliable electricity supply.
1.18.6 Increase energy sold by reduction in T&D losses in DISCOs. DISCOs’ management mustfocusonspecifichighlossfeedersandsetcleartargetsforlossreduction.
1.18.7 DISCOsmustadoptallmeasures,whichhelp intrackingelectricityflowfromhighvoltage grids to end-consumers. Automatic metering systems, remote metering devices and centralized monitoring systems are to be installed immediately.
1.18.8 Recovery ratios in DISCOs need to be 100%. DISCOs having lower recovery ratios must take immediate measures to close the gap.
1.18.9 For improved management, large DISCOs may be considered for bifurcation.
25
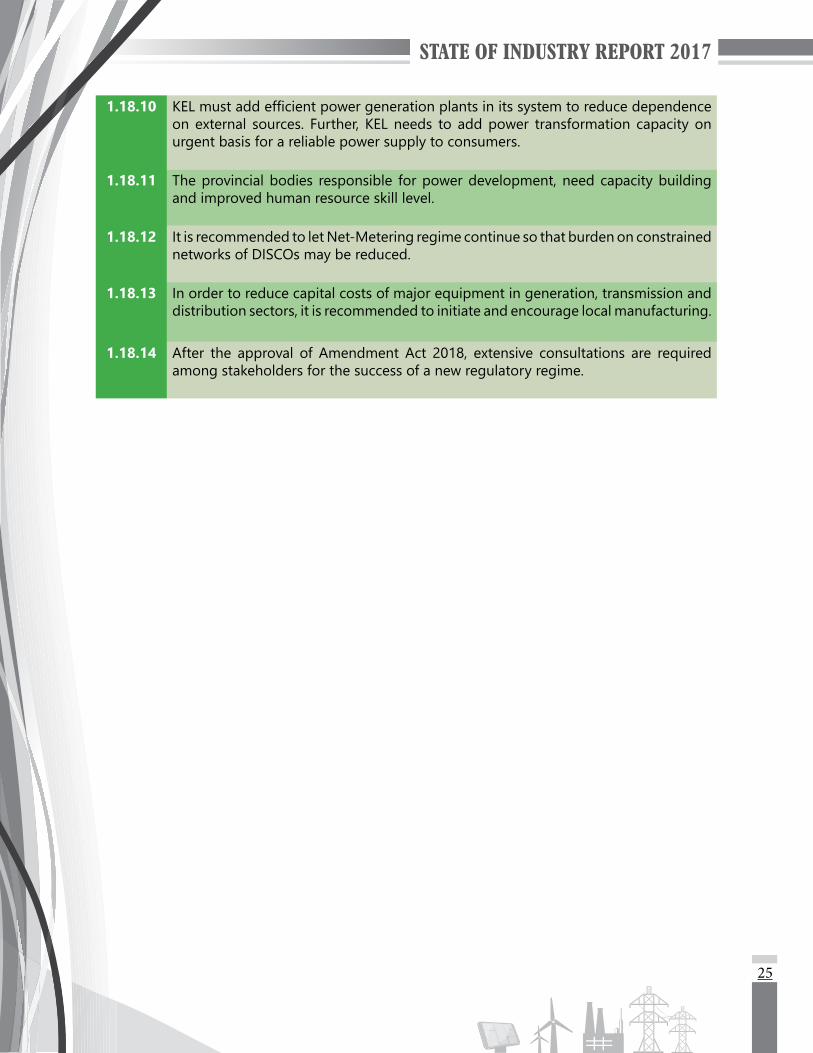
1.18.10 KELmustaddefficientpowergenerationplantsinitssystemtoreducedependenceon external sources. Further, KEL needs to add power transformation capacity on urgent basis for a reliable power supply to consumers.
1.18.11 The provincial bodies responsible for power development, need capacity building and improved human resource skill level.
1.18.12 It is recommended to let Net-Metering regime continue so that burden on constrained networks of DISCOs may be reduced.
1.18.13 In order to reduce capital costs of major equipment in generation, transmission and distribution sectors, it is recommended to initiate and encourage local manufacturing.
1.18.14 After the approval of Amendment Act 2018, extensive consultations are required among stakeholders for the success of a new regulatory regime.


STATE OF INDUSTRY REPORT 2017
PERFORMANCE OF GENERATION SECTOR


29
PERFORMANCE OF GENERATION SECTOR
2.1 GENERALThe total installed generation capacity of Pakistan as on 30th June, 2017 stands at 28,399 MW, against 25,421 MW on 30th June, 2016, recording an increase of 2,978 MW or 11.71% over the last year. The power plants connected with NTDC and KEL’s system generated 120,621 GWh during the FY 2016-17 as compared to 114,093 GWh units produced during the FY 2015-16. During the FY 2016-17, the major additions to the system are thermal, nuclear and renewable based power projects.
2.2 INSTALLED CAPACITY AND ELECTRICITY GENERATIONThe following tables give additional details of source-wise installed capacity and electricity generation by different power plants connected with NTDC and KEL system along with a comparison of last two years:
Source-wise Installed Capacity by Type (MW)
As on 30th June 2016 2017Variation
Capacity %HYDELWAPDA Hydel 6,902 6,902 - -IPPs Hydel 214 214 - -THERMALGENCOs with PEPCO 5,897 5,897 - -KEL Own 1,874 1,874 - -
IPPs Connected with PEPCO 8,643 10,566 1,923 22.25Connected with KEL 252 252 - -
CPPs/SPPs connected with KEL 35 87 52 148.57NUCLEARCHASNUPP (I, II and III) 615 1,005 390* 63.41KANUPP 137 137 - -RENEWABLE ENERGY (WIND, SOLAR AND BAGASSE)RE Power Plants connected with PEPCO 852 1,465 613 71.94
Total Installed Capacity of the Country 25,421 28,399 2,978 11.71* Trued up the net capacities indicated earlier to Name Plate Capacities.Source: NTDC/KEL
Source-wise Electricity Generation by Type (GWh)
As on 30th June 2015-16 2016-17 VariationEnergy %
HYDELWAPDA Hydel 33,433 31,091 (2,342) (07.00)IPPs Hydel 1,121 988 (133) (11.86)THERMALGENCOs with PEPCO 16,392 18,710 2,318 14.14KEL Own 10,323 10,147 (176) (1.70)
IPPsConnected with PEPCO 45,146 47,972 2,826 6.26Connected with KEL 1,421 1,531 110 7.74
CPPs/SPPs connected with PEPCO 251 271 20 7.97CPPs/SPPs connected with KEL 139 187 48 34.53
As on 30th June 2015-16 2016-17Variation
Energy %NUCLEAR
02

30
CHASNUPP (I, II and III) 3,854 5,868 2,014 52.26KANUPP 362 410 48 13.26IMPORTImport from Iran 463 496 33 7.13RENEWABLE ENERGY (WIND, SOLAR AND BAGASSE)RE Power Plants connected with PEPCO 1,187 2,950 1,763 148.53Total Electricity Generation of the Country 114,093 120,621 6,528 5.72
Source: NTDC/KEL
2.3 HYDROPOWERIt may be noted that while the installed capacity of WAPDA Hydropower remained at 6,902 MW in the years 2015, 2016 and 2017, the 31,091 GWh generated in the FY 2016-17 shows a decrease of 2,342 GWh from the last year. Similarly, the Hydel IPPs also contributed 133 GWh less in the system during the FY 2016-17 with the same installed capacity as in the FY 2015-16. The hydropower energy production pattern over the year remained consistent with the historical trends. The availability and overall performance of major hydropower plants including Tarbela and Mangla has also remained satisfactory during the FY 2016-17.
2.3.1 Power Purchase Agreements/Energy Purchase Agreements:NEPRA has approved the PPAs of two large hydropower projects under Section 5 of “NEPRA Interim Power Procurement (Procedure and Standards) Regulations, 2005”. Details of these projects are given below:
S. No. Project Name Capacity (MW) Power Purchaser1 Karot Hydropower Project 720 CPPA-G2 Suki Kinari Hydropower Project 870 CPPA-G
2.3.2 Competitive Bidding of Hydropower Projects:NEPRA has approved the Request for Proposal (RFP) of Taunsa Hydropower Project and six other projectsidentifiedbyPEDOundertheCompetitiveBiddingTariff(ApprovalProcedure)Regulations(CBTR), 2014. Subsequently, the bidding under CBTR-2014 for Taunsa Hydropower Project was successfullycompletedandtheAuthorityhasaccordinglynotifiedthelowestsuccessfulbidder.ThiswasthefirstpowergenerationprojectwhosetariffhasbeendeterminedthroughCompetitiveBidding in Pakistan’s power sector.
2.3.3 Performance Monitoring of Hydropower Projects:The monitoring of different hydropower projects was carried out in the year 2017 to check their performance according to the terms and conditions set in Licence, PPA, Tariff Determination and other relevant rules and regulations.
NEPRA has noted the unsatisfactory performance of Malakand-III (81 MW), Jinnah (96 MW) and Khan Khwar (72 MW) Hydropower Plants. The sponsors and the power purchaser have been directed to improve the operation and maintenance of these plants.
2.3.4 Implementations of Authority’s Directions:The Authority noted that a number of holders of LOIs for hydropower project sites were inordinately delaying the development of these sites. Accordingly, directions were issued to the relevant agencies to cancel all those LOI/LOS of projects which have been inordinately delayed
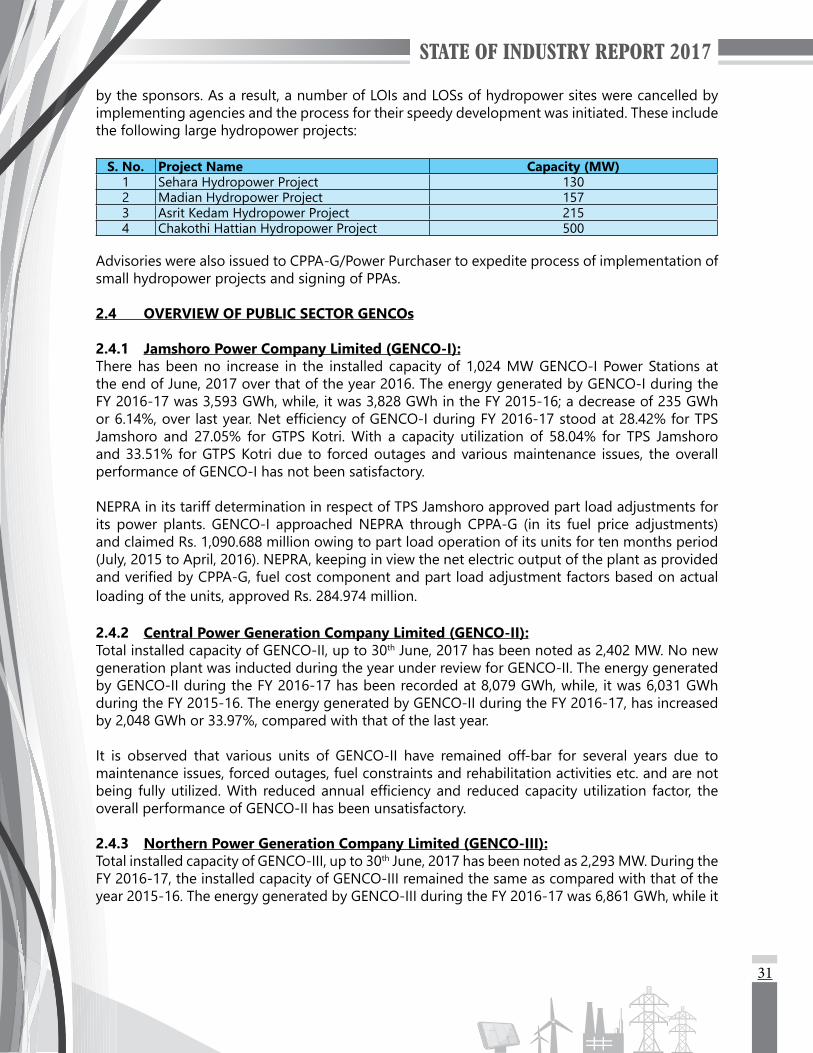
31
by the sponsors. As a result, a number of LOIs and LOSs of hydropower sites were cancelled by implementing agencies and the process for their speedy development was initiated. These include the following large hydropower projects:
S. No. Project Name Capacity (MW)1 Sehara Hydropower Project 1302 Madian Hydropower Project 1573 Asrit Kedam Hydropower Project 2154 Chakothi Hattian Hydropower Project 500
Advisories were also issued to CPPA-G/Power Purchaser to expedite process of implementation of small hydropower projects and signing of PPAs.
2.4 OVERVIEW OF PUBLIC SECTOR GENCOs
2.4.1 Jamshoro Power Company Limited (GENCO-I):There has been no increase in the installed capacity of 1,024 MW GENCO-I Power Stations at the end of June, 2017 over that of the year 2016. The energy generated by GENCO-I during the FY 2016-17 was 3,593 GWh, while, it was 3,828 GWh in the FY 2015-16; a decrease of 235 GWh or6.14%,overlastyear.NetefficiencyofGENCO-IduringFY2016-17stoodat28.42%forTPSJamshoro and 27.05% for GTPS Kotri. With a capacity utilization of 58.04% for TPS Jamshoro and 33.51% for GTPS Kotri due to forced outages and various maintenance issues, the overall performance of GENCO-I has not been satisfactory.
NEPRA in its tariff determination in respect of TPS Jamshoro approved part load adjustments for its power plants. GENCO-I approached NEPRA through CPPA-G (in its fuel price adjustments) and claimed Rs. 1,090.688 million owing to part load operation of its units for ten months period (July, 2015 to April, 2016). NEPRA, keeping in view the net electric output of the plant as provided andverifiedbyCPPA-G,fuelcostcomponentandpartloadadjustmentfactorsbasedonactualloading of the units, approved Rs. 284.974 million.
2.4.2 Central Power Generation Company Limited (GENCO-II):Total installed capacity of GENCO-II, up to 30th June, 2017 has been noted as 2,402 MW. No new generation plant was inducted during the year under review for GENCO-II. The energy generated by GENCO-II during the FY 2016-17 has been recorded at 8,079 GWh, while, it was 6,031 GWh during the FY 2015-16. The energy generated by GENCO-II during the FY 2016-17, has increased by 2,048 GWh or 33.97%, compared with that of the last year.
It is observed that various units of GENCO-II have remained off-bar for several years due to maintenance issues, forced outages, fuel constraints and rehabilitation activities etc. and are not being fullyutilized.With reducedannualefficiencyand reducedcapacityutilization factor, theoverall performance of GENCO-II has been unsatisfactory.
2.4.3 Northern Power Generation Company Limited (GENCO-III):Total installed capacity of GENCO-III, up to 30th June, 2017 has been noted as 2,293 MW. During the FY 2016-17, the installed capacity of GENCO-III remained the same as compared with that of the year 2015-16. The energy generated by GENCO-III during the FY 2016-17 was 6,861 GWh, while it

32
was 6,273 GWh during the FY 2015-16 showing an increase of 588 GWh or 9.37%, compared with the last year.
ItisobservedthattheoverallnetefficienciesofTPSMuzaffargarh,SPSFaisalabad,GTPSFaisalabadand Nandipur remained very low. Due to various maintenance issues, forced outages and fuel constraints etc. considerably low annual capacity utilization of 48.21% for TPS Muzaffargarh, 14.52% for SPS Faisalabad, 12.27% for GTPS Faisalabad and 38.52% for Nandipur Power Plants have been reported. The overall performance of GENCO-III has been unsatisfactory.
2.4.4 Lakhra Power Generation Company Limited (GENCO-IV):Total installed capacity of GENCO-IV, up to 30th June, 2017 has been noted as 150 MW. GENCO-IV had three units of 50 MW and during the FY 2016-17 generated 124 GWh as compared to 148 GWh produced during the FY 2015-16.
It may be noted that, against the installed capacity of 150 MW, approximately, two third capacity of GENCO-IV is available for generation, which is also not being fully utilized due to forced outages etc. With utilization factor of 22.68% for the FY 2016-17 the overall performance of GENCO-IV has remained unsatisfactory.
2.5 INDEPENDENT POWER PRODUCERS (IPPs)Total installed capacities of thermal IPPs connected with NTDC system at the end of June, 2017 are noted as 10,566 MW; 1,923 MW higher as compared to the FY 2015-16. The enhancement in capacityhasbeenrecordedowingtoinductionofcoalfiredSahiwalPowerPlantandRLNGfiredBhikki and Haveli Bahadur Shah Power Plant. The energy generated by thermal IPPs connected with NTDC system during the year 2016-17 is noted as 47,972 GWh, against 45,146 GWh during the year 2015-16.
It is also noted that due to disputes with NTDC/WAPDA, two IPPs namely Japan Power Generation and Southern Electric Power Company are not contributing power to the grid and if these issues are properly addressed, approximately 270 MW will be added to the close proximity of load centre, to help reduce the demand and supply gap of the system.
2.6 NUCLEAR (CHASNUPP-I, II & III AND KANUPP)During the year 2016-17, owing to addition of CHASNUPP-III, total installed and dependable capacity of Nuclear Power Plants connected with NTDC’s system, are noted as 1,142 MW, higher by 390 MW (340 MW has been actually added in the system, whereas 50 MW is added on account ofcorrectionsmade topreviousyearnumberswhich reflectednetcapacities, insteadofnameplate capacities) than the year 2015-16. The energy generated by Nuclear Power Plants during the year 2016-17 stands at 6,278 GWh which is an increase by 2,062 GWh over the energy during the year 2015-16. The overall performance of Nuclear Power Plants connected with NTDC’s system has remained satisfactory during the year 2016-17 as no major outage is noted.2.7 RENEWABLES
2.7.1 Wind:During the FY 2016-17, 479 MW of wind power has been added to the NTDC’s system, for a total wind based power of about 785 MW in the system. The energy generated by wind based power

33
plants during the FY 2016-17 has been noted as 1,387 GWh.
2.7.2 Solar:During the FY 2016-17, no new solar energy project has been added to NTDC’s network. The total energy through solar has been recorded at 635 GWh for an increase of 410 GWh over the energy generated through solar during the FY 2015-16.
2.7.3 Bagasse:During the FY 2016-17, there is an increase of about 15 MW in the installed generation capacity of bagasse based power plants for a total of about 161 MW in the NTDC’s system. The energy generated by bagasse based power plants during the FY 2016-17 has been noted as 785 GWh.
2.7.4 Bagasse/Coal:During the FY 2016-17, a bagasse/coal firedproject namely Fatima Energy Limited started itsoperations having capacity of 119 MW. The project generated 143 GWh during the FY 2016-17.
2.8 K-ELECTRIC LIMITEDTheinstalledcapacityofKEL’sowngenerationfleetat30th June, 2017 has been noted as 1,874 MW, same as at 30th June, 2016. Since KEL is responsible for maintaining integrated systems of generation, transmission and distribution, therefore KEL is required to look for other sources to meet the supply and demand gap. Inability of KEL to effectively increase its generation capacity has made it dependent on external power sources, including the import from NTDC system. During the FY 2016-17, in addition to purchasing power from IPPs including PASMIC, Anoud Power, International Steel Limited, Tapal Energy, Gul Ahmed, KANUPP, International Industries Limited and FPCL Power, KEL also imported around 650 MW of power from NTDC on regular basis.
KEL generated 10,147 GWh during the FY 2016-17 which shows a decrease of 176 GWh from the last year. Owing to reduction in own generation, KEL imported 17,352 GWh which shows an increase of 48 GWh from the last year. It is noted while reviewing operational trend of KEL’s own power plants that KEL consumed more furnace oil and less gas for electricity production during the FY 2016-17 as compared to last year. With higher auxiliary consumption and reduced capacity utilization factor over the last year, the overall performance of KEL own power plants cannot be termed as satisfactory.
KEL also provided its investment plan for the period from the FY 2016-17 till the FY 2020-21 for new capacity additions along with estimated cost and expected commissioning years as reported in the next sections.
2.9 ELECTRICITY PURCHASES FROM SPPs/CPPs/N-CPPsDuring the FY 2016-17, the surplus installed capacity available with Sugar Mills, Textile Mills and Chemical units etc. was utilized by different DISCOs through bilateral contracts. The detail is shown in the following table:
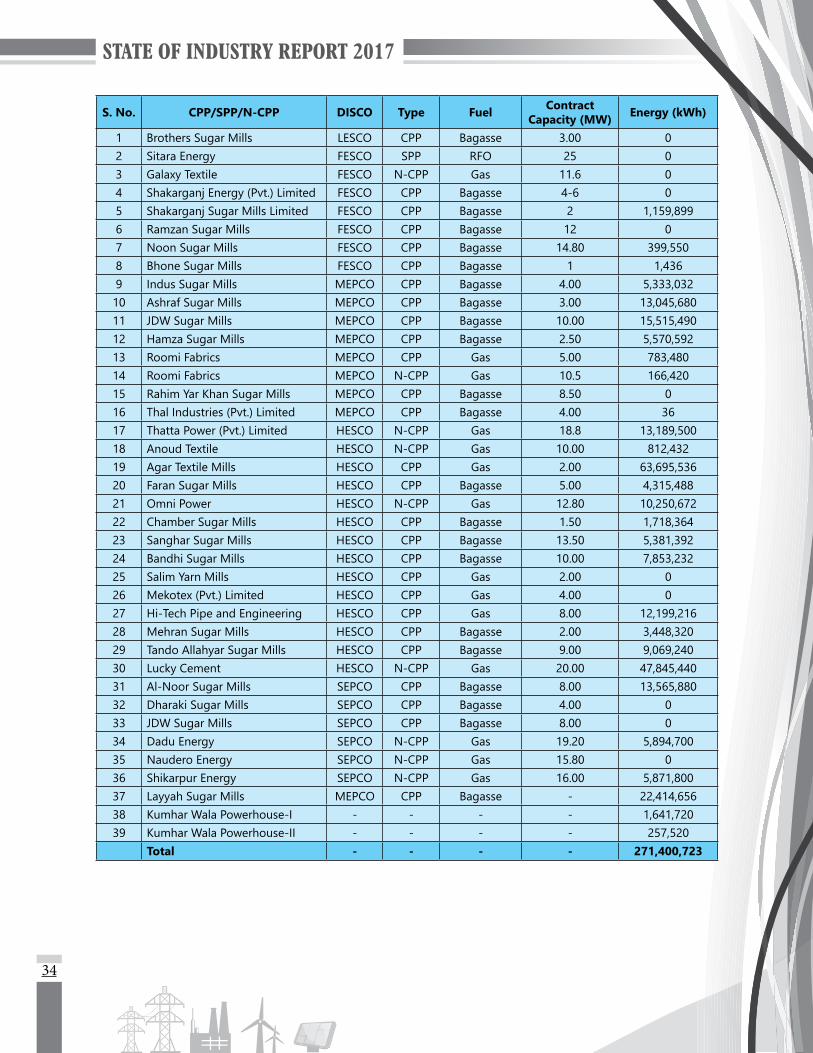
34
S. No. CPP/SPP/N-CPP DISCO Type Fuel Contract Capacity (MW) Energy (kWh)
1 Brothers Sugar Mills LESCO CPP Bagasse 3.00 02 Sitara Energy FESCO SPP RFO 25 03 Galaxy Textile FESCO N-CPP Gas 11.6 04 Shakarganj Energy (Pvt.) Limited FESCO CPP Bagasse 4-6 05 Shakarganj Sugar Mills Limited FESCO CPP Bagasse 2 1,159,8996 Ramzan Sugar Mills FESCO CPP Bagasse 12 07 Noon Sugar Mills FESCO CPP Bagasse 14.80 399,5508 Bhone Sugar Mills FESCO CPP Bagasse 1 1,4369 Indus Sugar Mills MEPCO CPP Bagasse 4.00 5,333,03210 Ashraf Sugar Mills MEPCO CPP Bagasse 3.00 13,045,68011 JDW Sugar Mills MEPCO CPP Bagasse 10.00 15,515,49012 Hamza Sugar Mills MEPCO CPP Bagasse 2.50 5,570,59213 Roomi Fabrics MEPCO CPP Gas 5.00 783,48014 Roomi Fabrics MEPCO N-CPP Gas 10.5 166,42015 Rahim Yar Khan Sugar Mills MEPCO CPP Bagasse 8.50 016 Thal Industries (Pvt.) Limited MEPCO CPP Bagasse 4.00 3617 Thatta Power (Pvt.) Limited HESCO N-CPP Gas 18.8 13,189,50018 Anoud Textile HESCO N-CPP Gas 10.00 812,43219 Agar Textile Mills HESCO CPP Gas 2.00 63,695,53620 Faran Sugar Mills HESCO CPP Bagasse 5.00 4,315,48821 Omni Power HESCO N-CPP Gas 12.80 10,250,67222 Chamber Sugar Mills HESCO CPP Bagasse 1.50 1,718,36423 Sanghar Sugar Mills HESCO CPP Bagasse 13.50 5,381,39224 Bandhi Sugar Mills HESCO CPP Bagasse 10.00 7,853,23225 Salim Yarn Mills HESCO CPP Gas 2.00 026 Mekotex (Pvt.) Limited HESCO CPP Gas 4.00 027 Hi-Tech Pipe and Engineering HESCO CPP Gas 8.00 12,199,21628 Mehran Sugar Mills HESCO CPP Bagasse 2.00 3,448,32029 Tando Allahyar Sugar Mills HESCO CPP Bagasse 9.00 9,069,24030 Lucky Cement HESCO N-CPP Gas 20.00 47,845,44031 Al-Noor Sugar Mills SEPCO CPP Bagasse 8.00 13,565,88032 Dharaki Sugar Mills SEPCO CPP Bagasse 4.00 033 JDW Sugar Mills SEPCO CPP Bagasse 8.00 034 Dadu Energy SEPCO N-CPP Gas 19.20 5,894,70035 Naudero Energy SEPCO N-CPP Gas 15.80 036 Shikarpur Energy SEPCO N-CPP Gas 16.00 5,871,80037 Layyah Sugar Mills MEPCO CPP Bagasse - 22,414,65638 Kumhar Wala Powerhouse-I - - - - 1,641,72039 Kumhar Wala Powerhouse-II - - - - 257,520
Total - - - - 271,400,723
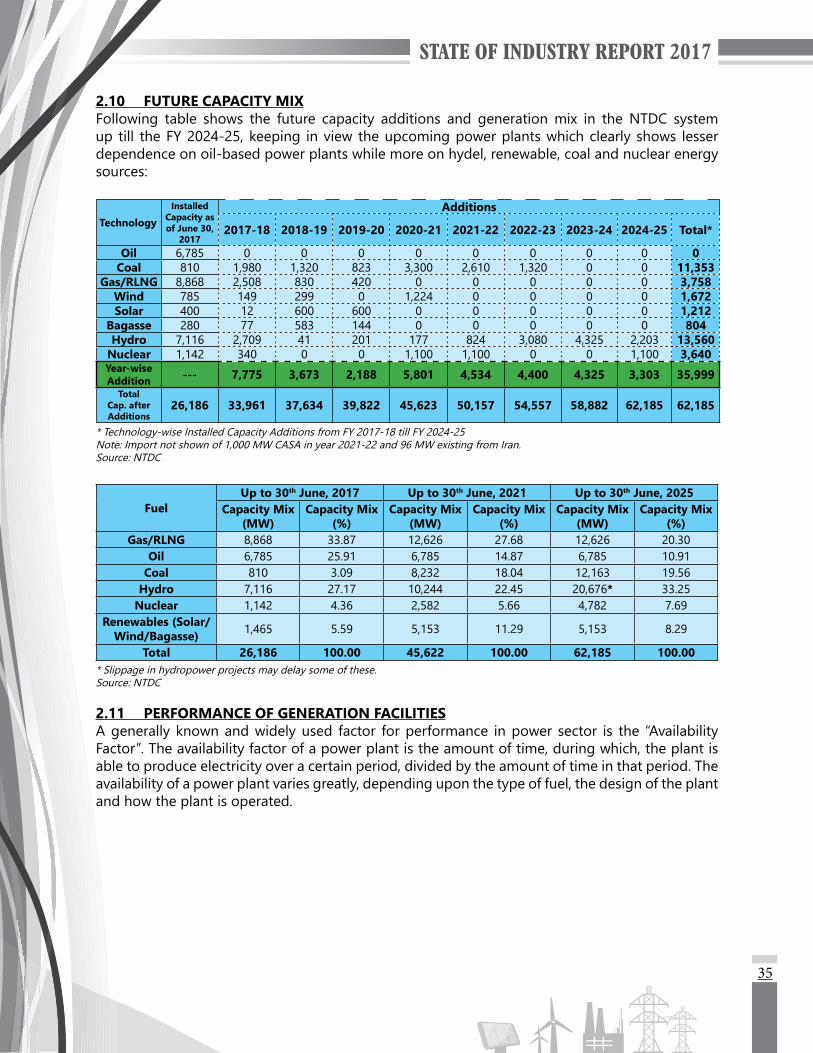
35
2.10 FUTURE CAPACITY MIXFollowing table shows the future capacity additions and generation mix in the NTDC system up till the FY 2024-25, keeping in view the upcoming power plants which clearly shows lesser dependence on oil-based power plants while more on hydel, renewable, coal and nuclear energy sources:
TechnologyInstalled
Capacity as of June 30,
2017
Additions
2017-18 2018-19 2019-20 2020-21 2021-22 2022-23 2023-24 2024-25 Total*
Oil 6,785 0 0 0 0 0 0 0 0 0Coal 810 1,980 1,320 823 3,300 2,610 1,320 0 0 11,353
Gas/RLNG 8,868 2,508 830 420 0 0 0 0 0 3,758Wind 785 149 299 0 1,224 0 0 0 0 1,672Solar 400 12 600 600 0 0 0 0 0 1,212
Bagasse 280 77 583 144 0 0 0 0 0 804Hydro 7,116 2,709 41 201 177 824 3,080 4,325 2,203 13,560
Nuclear 1,142 340 0 0 1,100 1,100 0 0 1,100 3,640Year-wise Addition --- 7,775 3,673 2,188 5,801 4,534 4,400 4,325 3,303 35,999
Total Cap. after Additions
26,186 33,961 37,634 39,822 45,623 50,157 54,557 58,882 62,185 62,185
* Technology-wise Installed Capacity Additions from FY 2017-18 till FY 2024-25Note: Import not shown of 1,000 MW CASA in year 2021-22 and 96 MW existing from Iran.Source: NTDC
FuelUp to 30th June, 2017 Up to 30th June, 2021 Up to 30th June, 2025
Capacity Mix (MW)
Capacity Mix (%)
Capacity Mix (MW)
Capacity Mix (%)
Capacity Mix (MW)
Capacity Mix (%)
Gas/RLNG 8,868 33.87 12,626 27.68 12,626 20.30Oil 6,785 25.91 6,785 14.87 6,785 10.91
Coal 810 3.09 8,232 18.04 12,163 19.56Hydro 7,116 27.17 10,244 22.45 20,676* 33.25
Nuclear 1,142 4.36 2,582 5.66 4,782 7.69Renewables (Solar/
Wind/Bagasse) 1,465 5.59 5,153 11.29 5,153 8.29
Total 26,186 100.00 45,622 100.00 62,185 100.00* Slippage in hydropower projects may delay some of these.Source: NTDC
2.11 PERFORMANCE OF GENERATION FACILITIESA generally known and widely used factor for performance in power sector is the “Availability Factor”. The availability factor of a power plant is the amount of time, during which, the plant is able to produce electricity over a certain period, divided by the amount of time in that period. The availability of a power plant varies greatly, depending upon the type of fuel, the design of the plant and how the plant is operated.
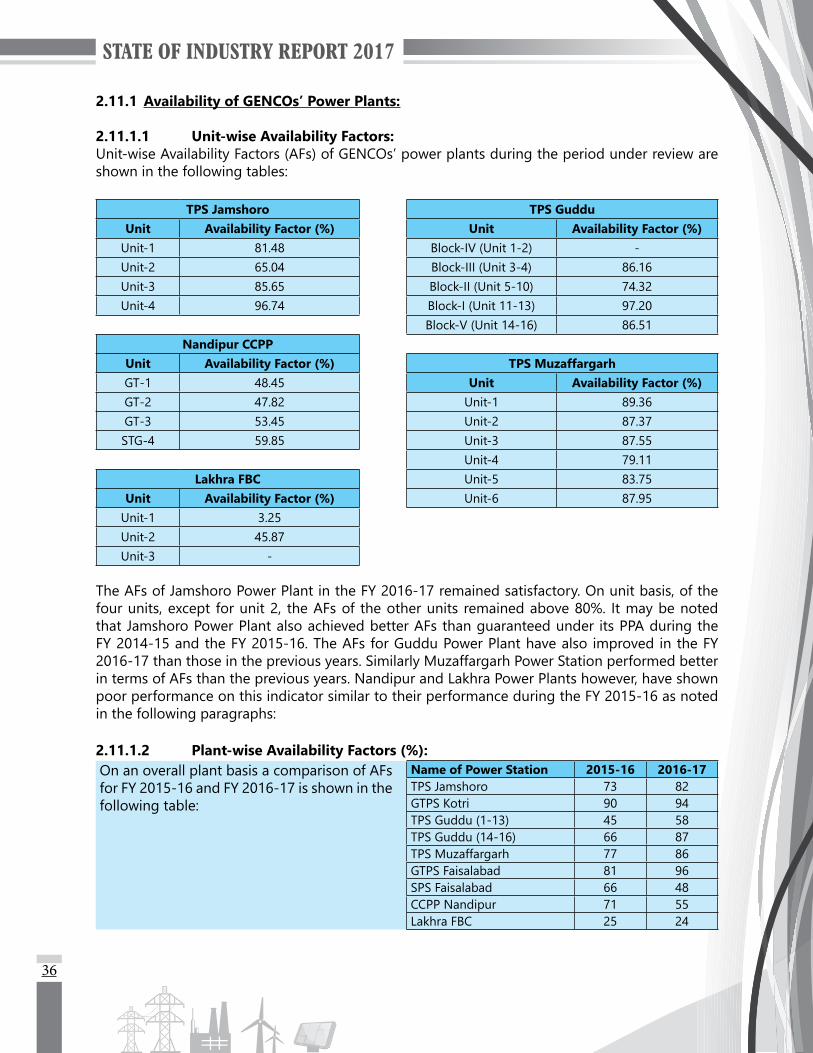
36
2.11.1 Availability of GENCOs’ Power Plants:
2.11.1.1 Unit-wise Availability Factors:Unit-wise Availability Factors (AFs) of GENCOs’ power plants during the period under review are shown in the following tables:
TPS Jamshoro TPS GudduUnit Availability Factor (%) Unit Availability Factor (%)
Unit-1 81.48 Block-IV (Unit 1-2) -Unit-2 65.04 Block-III (Unit 3-4) 86.16Unit-3 85.65 Block-II (Unit 5-10) 74.32Unit-4 96.74 Block-I (Unit 11-13) 97.20
Block-V (Unit 14-16) 86.51Nandipur CCPP
Unit Availability Factor (%) TPS MuzaffargarhGT-1 48.45 Unit Availability Factor (%)GT-2 47.82 Unit-1 89.36GT-3 53.45 Unit-2 87.37STG-4 59.85 Unit-3 87.55
Unit-4 79.11Lakhra FBC Unit-5 83.75
Unit Availability Factor (%) Unit-6 87.95Unit-1 3.25Unit-2 45.87Unit-3 -
The AFs of Jamshoro Power Plant in the FY 2016-17 remained satisfactory. On unit basis, of the four units, except for unit 2, the AFs of the other units remained above 80%. It may be noted that Jamshoro Power Plant also achieved better AFs than guaranteed under its PPA during the FY 2014-15 and the FY 2015-16. The AFs for Guddu Power Plant have also improved in the FY 2016-17 than those in the previous years. Similarly Muzaffargarh Power Station performed better in terms of AFs than the previous years. Nandipur and Lakhra Power Plants however, have shown poor performance on this indicator similar to their performance during the FY 2015-16 as noted in the following paragraphs:
2.11.1.2 Plant-wise Availability Factors (%):On an overall plant basis a comparison of AFs for FY 2015-16 and FY 2016-17 is shown in the following table:
Name of Power Station 2015-16 2016-17TPS Jamshoro 73 82GTPS Kotri 90 94TPS Guddu (1-13) 45 58TPS Guddu (14-16) 66 87TPS Muzaffargarh 77 86GTPS Faisalabad 81 96SPS Faisalabad 66 48CCPP Nandipur 71 55Lakhra FBC 25 24

37
It is pertinent to mention here that although, the AFs of GTPS Kotri, GTPS Faisalabad and SPS Faisalabad seem within the acceptable range, but most of the time, these power stations remained on standby mode due to which their potential was not utilized.
2.11.2 Performance of Generation Facilities under NEPRA Performance Standards (Generation) Rules, 2009:
NEPRA Performance Standards (Generation) Rules 2009, specify a number of Key Performance Indicators (KPIs) which relate plant operational parameters to gauge performance of generation licensees, who are required under the rules to submit their performance reports to NEPRA. Of these,themajoronesaredefinedhereunder:
ThefirstsuchparameterisNet Capacity Factor (NCF) which works out the actual energy produced by a unit/machine during a particular period compared to its full potential for power generation during that period. Net Output Factor (NOF) is the second indicator which measures the actual energy over the time when the units/machines were actually synchronized with the system. Energy Availability Factor (EAF) calculates the amount of time in which a unit/machine practically remained available less any equivalent planned/unplanned de-rated hours, for generation of power at full net capacity. Another parameter which is commonly used in NTDC system is the “Standby Mode”, which is the period when machine is available for generation but not actively utilized either due to fuel constraints or less demand, on the instruction of System Operator or otherwise. It is to be noted that a collective analysis of these KPI would help in deciding about the performance of power plants.
The following sections provide data about these KPIs for power plants controlled by GENCOs:
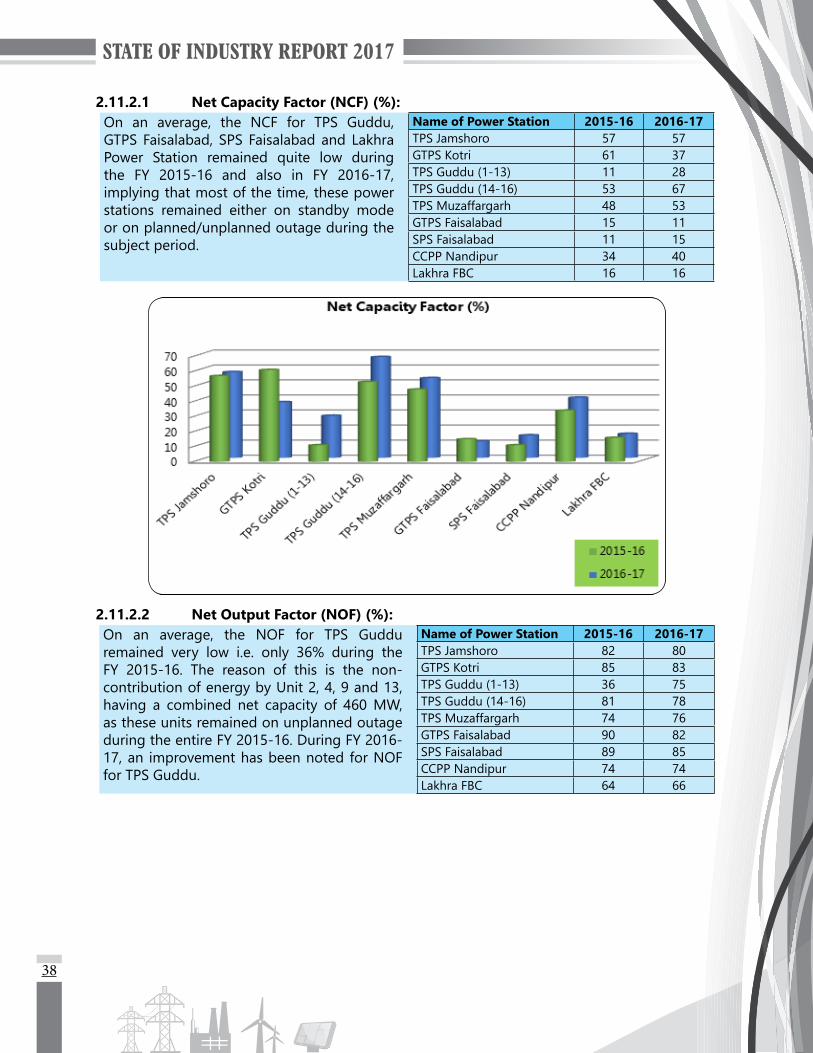
38
2.11.2.1 Net Capacity Factor (NCF) (%):On an average, the NCF for TPS Guddu, GTPS Faisalabad, SPS Faisalabad and Lakhra Power Station remained quite low during the FY 2015-16 and also in FY 2016-17, implying that most of the time, these power stations remained either on standby mode or on planned/unplanned outage during the subject period.
Name of Power Station 2015-16 2016-17TPS Jamshoro 57 57GTPS Kotri 61 37TPS Guddu (1-13) 11 28TPS Guddu (14-16) 53 67TPS Muzaffargarh 48 53GTPS Faisalabad 15 11SPS Faisalabad 11 15CCPP Nandipur 34 40Lakhra FBC 16 16
2.11.2.2 Net Output Factor (NOF) (%):On an average, the NOF for TPS Guddu remained very low i.e. only 36% during the FY 2015-16. The reason of this is the non-contribution of energy by Unit 2, 4, 9 and 13, having a combined net capacity of 460 MW, as these units remained on unplanned outage during the entire FY 2015-16. During FY 2016-17, an improvement has been noted for NOF for TPS Guddu.
Name of Power Station 2015-16 2016-17TPS Jamshoro 82 80GTPS Kotri 85 83TPS Guddu (1-13) 36 75TPS Guddu (14-16) 81 78TPS Muzaffargarh 74 76GTPS Faisalabad 90 82SPS Faisalabad 89 85CCPP Nandipur 74 74Lakhra FBC 64 66
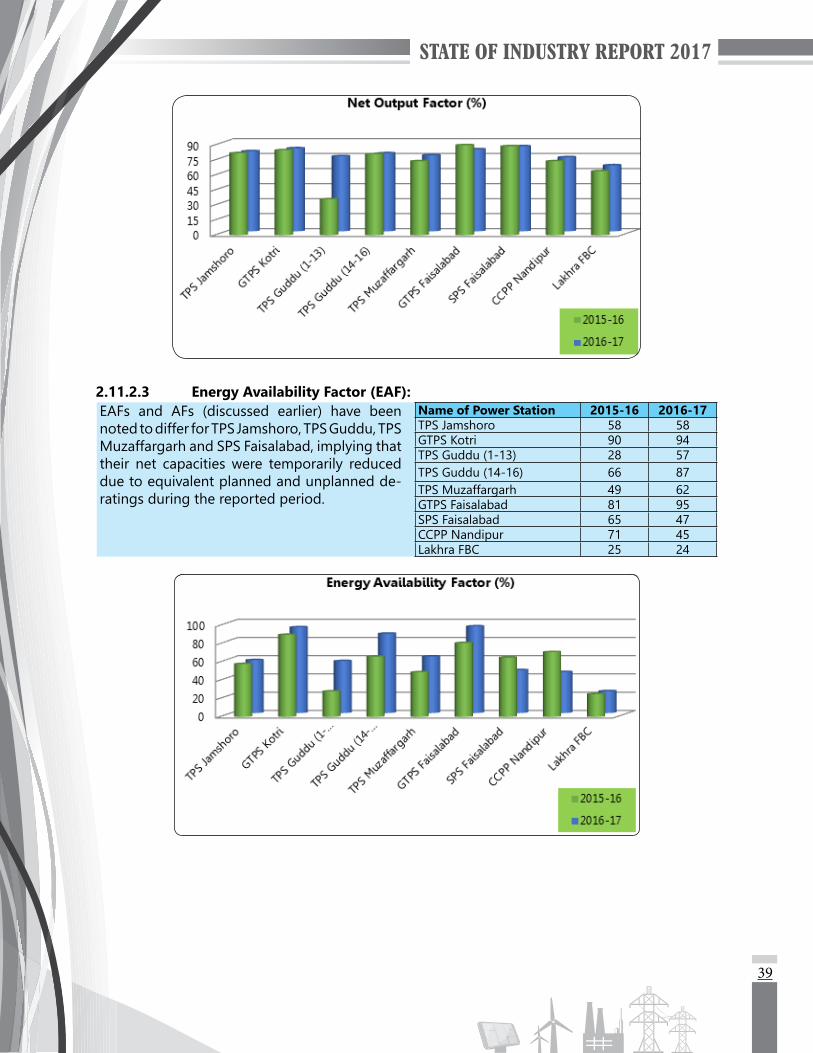
39
2.11.2.3 Energy Availability Factor (EAF):EAFs and AFs (discussed earlier) have been noted to differ for TPS Jamshoro, TPS Guddu, TPS Muzaffargarh and SPS Faisalabad, implying that their net capacities were temporarily reduced due to equivalent planned and unplanned de-ratings during the reported period.
Name of Power Station 2015-16 2016-17TPS Jamshoro 58 58GTPS Kotri 90 94TPS Guddu (1-13) 28 57TPS Guddu (14-16) 66 87TPS Muzaffargarh 49 62GTPS Faisalabad 81 95SPS Faisalabad 65 47CCPP Nandipur 71 45Lakhra FBC 25 24

40
2.11.3 Performance of Independent Power Producers:Like public sector GENCOs, IPPs also submit quarterly reports in respect of performance of their plants. The performance analysis of following ten (10) IPPs is shown in the following sections for FY 2015-16 and FY 2016-17:
i) Kot Addu Power Company Limited ii) Hub Power Company Limitediii) Hub Power Company Limited (Narowal) iv) Lal Pir Power (Pvt.) Limitedv) Pak Gen Power (Pvt.) Limited vi) Halmore Power Generation Company (Pvt.) Limitedvii) Rousch (Pakistan) Power Limited viii) TNB Liberty Power Limitedix) Uch Power Limited x) Uch-II Power Limited
Kot Addu Power Company Limited (KAPCO)(05 Modules – 2*315+2*290+1*390=1,600)
It may be seen that all the KPIs in respect of Kot Addu Power Company Limited have either remained at acceptable levels or have shown improvement in the FY 2016-17 over the last year.

41
Hub Power Company Limited (HUBCO)(04 Units – 4*323=1,292)
HubPowerCompanyLimitedhasfouroilfiredunits. It isnotedthattheperformanceofUnits1 and 2 generally deteriorated in the FY 2016-17, over that of in the FY 2015-16. Unit 3 has shown improvement in the FY 2016-17 for three parameters whereas for NOF its performance has declined. For Unit 3 it implies that unit could not be synchronized due to “standby mode” or due to some other reasons. The same may be concluded for Unit 4.
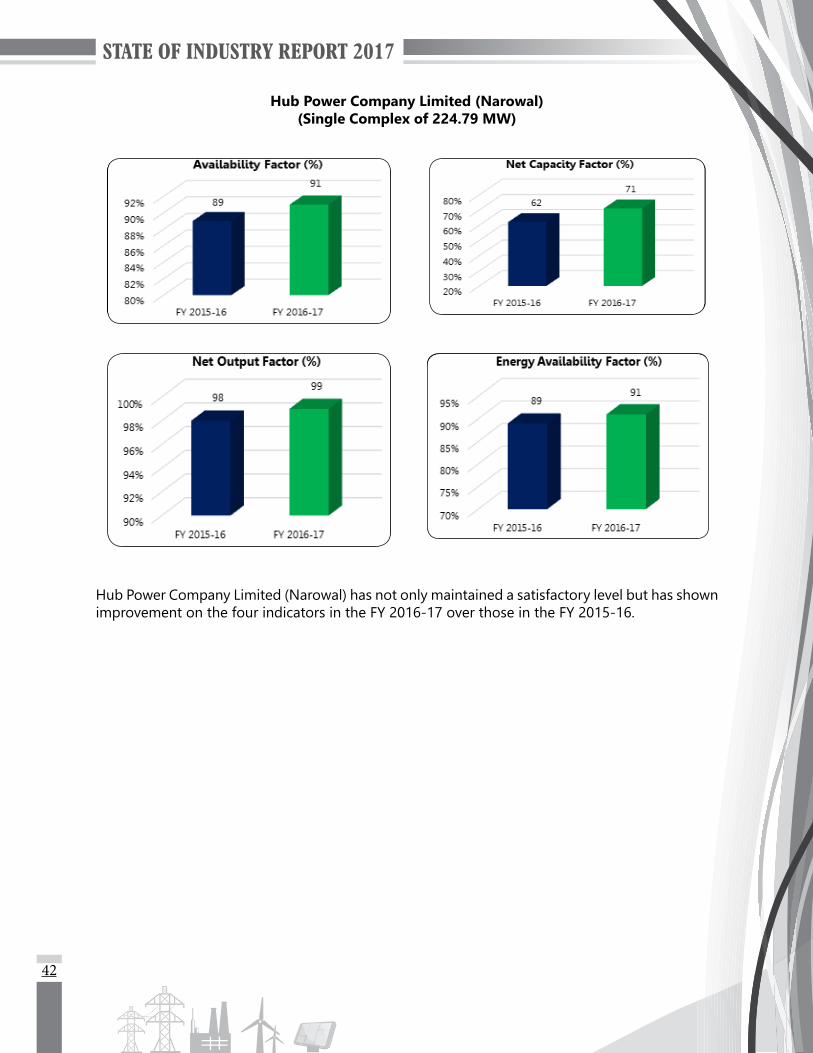
42
Hub Power Company Limited (Narowal)(Single Complex of 224.79 MW)
Hub Power Company Limited (Narowal) has not only maintained a satisfactory level but has shown improvement on the four indicators in the FY 2016-17 over those in the FY 2015-16.

43
Lal Pir Power (Pvt.) Limited(Single Complex of 362 MW)
Lal Pir Power (Pvt.) Limited has improved its Availability related indicators whereas it has shown reduction in energy actually generated. It may not be attributed to as an inferior performance as the units were available but could not be dispatched.

44
Pak Gen Power (Pvt.) Limited(Single Complex of 365 MW)
Pak Gen Power (Pvt.) Limited has shown improvement in the three main indicators, whereas for NOF it maintained about the same indicator as that of the FY 2015-16.
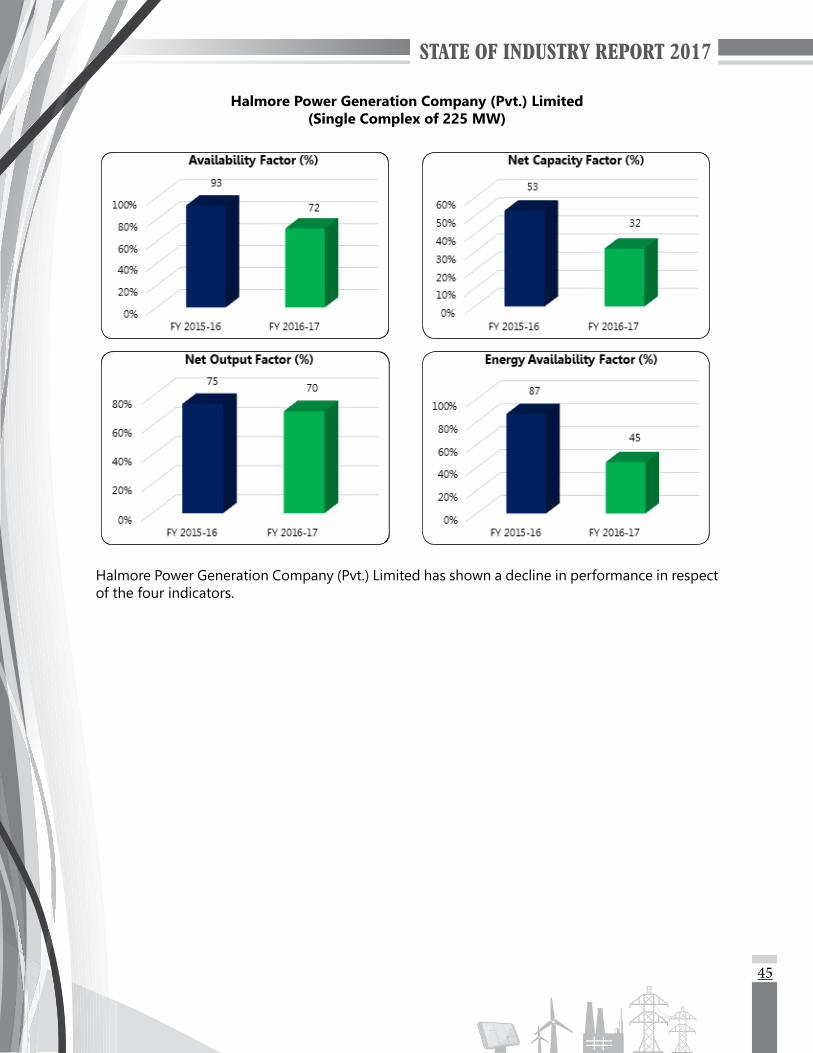
45
Halmore Power Generation Company (Pvt.) Limited(Single Complex of 225 MW)
Halmore Power Generation Company (Pvt.) Limited has shown a decline in performance in respect of the four indicators.
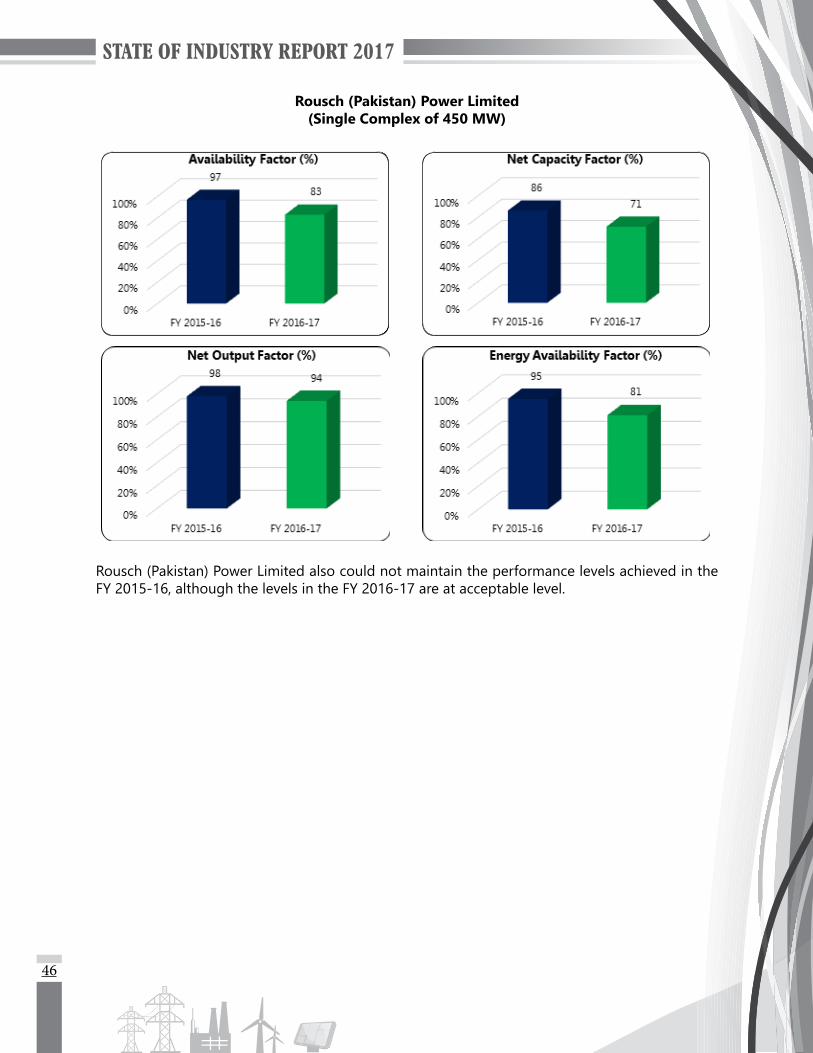
46
Rousch (Pakistan) Power Limited(Single Complex of 450 MW)
Rousch (Pakistan) Power Limited also could not maintain the performance levels achieved in the FY 2015-16, although the levels in the FY 2016-17 are at acceptable level.
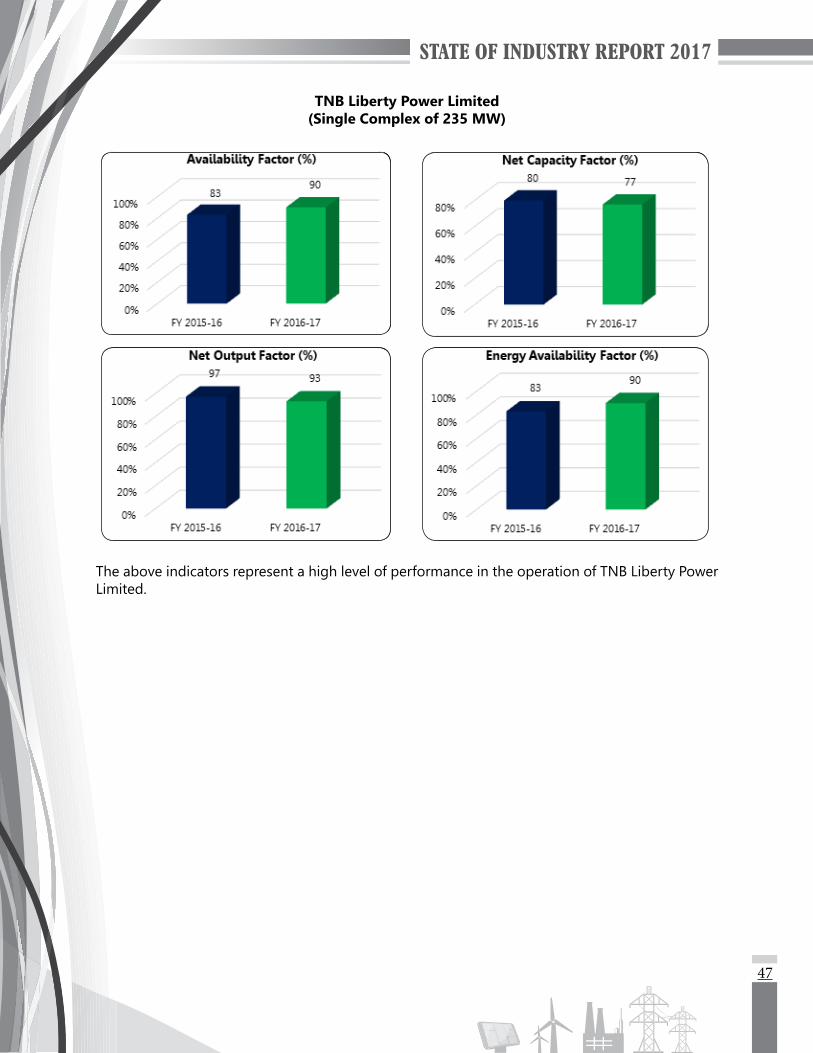
47
TNB Liberty Power Limited(Single Complex of 235 MW)
The above indicators represent a high level of performance in the operation of TNB Liberty Power Limited.

48
Uch Power Limited(Single Complex of 586.2 MW)
Uch Power Limited maintained high levels of performance during both the years, as its availability and capacity factors show that the plant’s capacity has been utilized at optimum levels.
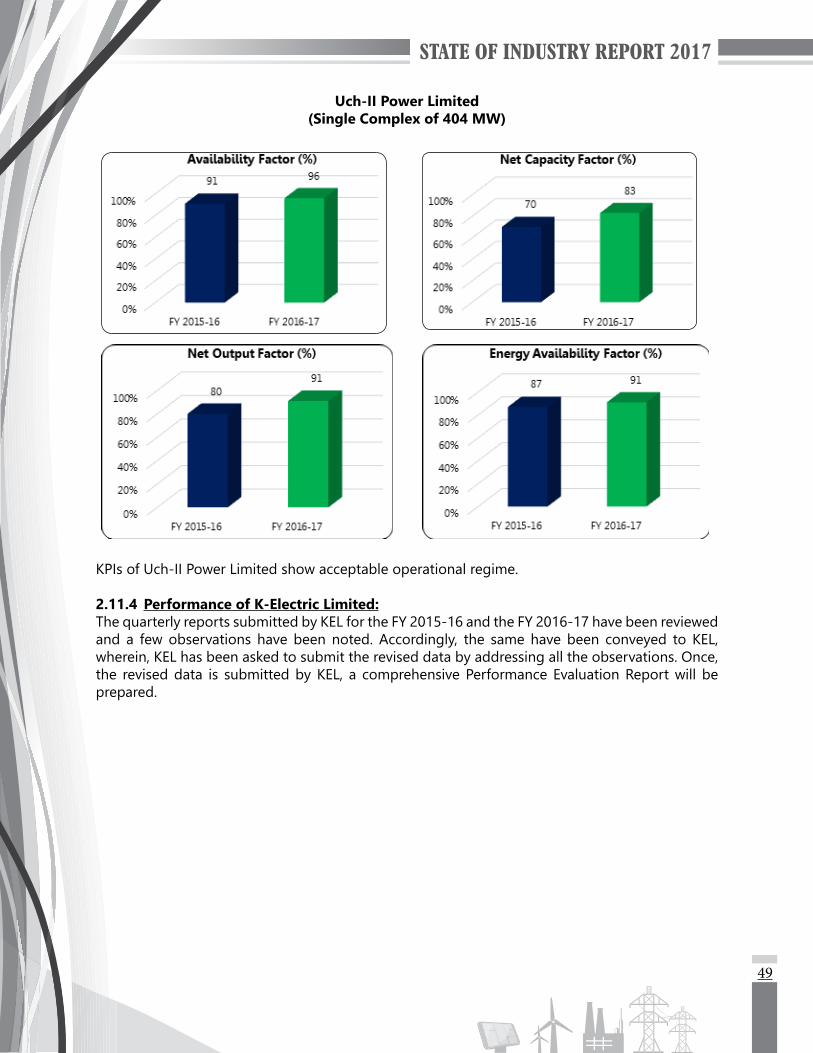
49
Uch-II Power Limited(Single Complex of 404 MW)
KPIs of Uch-II Power Limited show acceptable operational regime.
2.11.4 Performance of K-Electric Limited:The quarterly reports submitted by KEL for the FY 2015-16 and the FY 2016-17 have been reviewed and a few observations have been noted. Accordingly, the same have been conveyed to KEL, wherein, KEL has been asked to submit the revised data by addressing all the observations. Once, the revised data is submitted by KEL, a comprehensive Performance Evaluation Report will be prepared.


STATE OF INDUSTRY REPORT 2017
PERFORMANCE OF TRANSMISSION SECTOR


53
PERFORMANCE OF TRANSMISSION SECTOR
3.1 GENERALThe transmission line network of NTDC includes 5,197 km long transmission lines operating at 500 kV level and 9,814 km long 220 kV lines. As of 30th June 2017, NTDC is maintaining 14 (fourteen) 500 kV grid stations with a transformation capacity of 18,624 MVA. There are 33 (thirty three)500/220kVtransformersand35(thirtyfive)220/132kVtransformersinstalledatthesegridstations. At 220 kV level there are 38 grid stations with a transformation capacity of 25,660 MVA. There are 108 (one hundred eight) 220/132 kV transformers installed at 220 kV grid stations.
In addition to transmission lines of NTDC, a 37 km long 132 kV D/C transmission line has been energized in 2016 by Fatima Transmission Company Limited. A 95 km long 132 kV D/C transmission line of Sindh Transmission and Dispatch Company Limited (STDC) has also been completed and is currently under testing phase. The construction activities on 878 km long HVDC bi-pole transmission line operating at ±660 kV have been initiated.
3.2 POWER BALANCES OF NTDC SYSTEMThe following table provides peak time demand of NTDC system, year-wise capacity additions up totheyear2025andsurplus/deficitstatistics.Itmaybenotedthatasupplysurplusscenarioisexpected in the year 2018:
Surplus/Deficit in Demand and Supply during NTDC’s System Peak HourYear
ending 30th June
Installed Capacity (NTDC System) (MW)
Planned Generation Capability as per
NTDC (MW)
NTDC’s Projected Demand Growth
Rate (%)
NTDC’s Projected Demand during Peak
Hours (MW)
Surplus/Deficit (MW)
2018 33,961 26,135 4.51 25,227 9082019 37,633 28,357 4.44 26,348 2,0092020 39,821 29,314 4.07 27,420 1,8942021 45,622 34,124 4.31 28,601 5,5232022 50,156 36,422 4.27 29,822 6,6002023 54,556 39,345 4.27 31,095 8,2502024 58,881 41,197 4.29 32,429 8,7682025 62,184 47,750 4.28 33,816 13,934
Source: NTDC
03
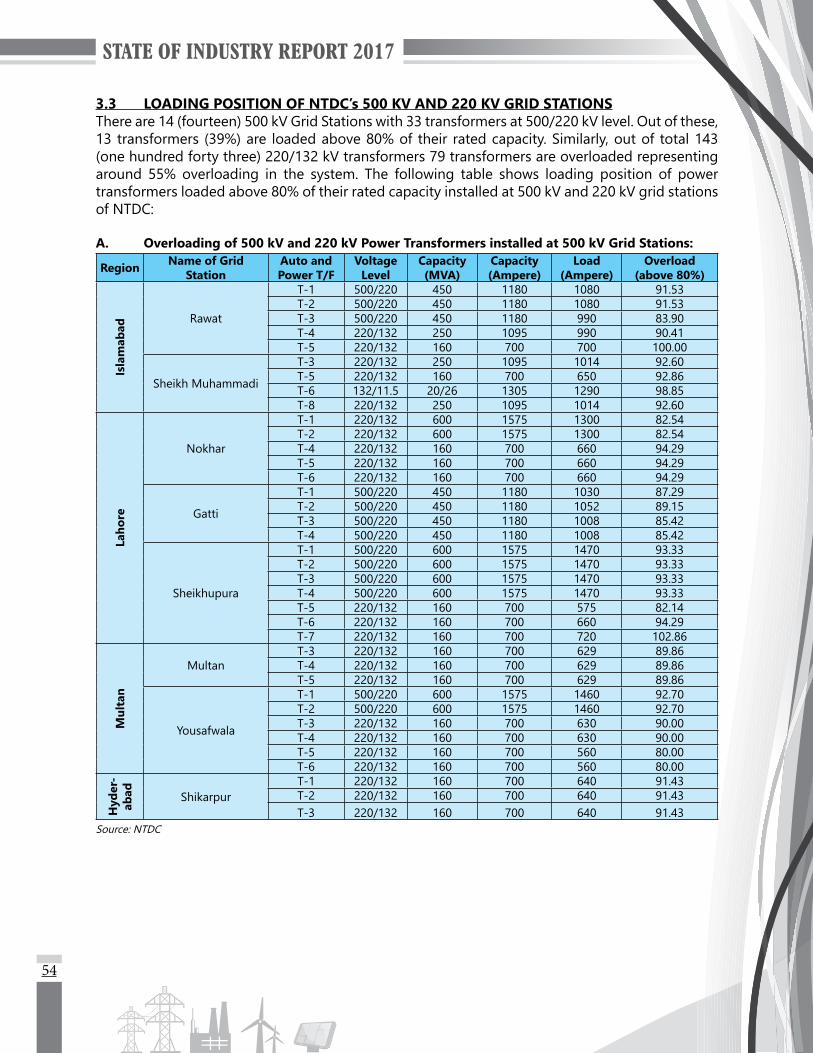
54
3.3 LOADING POSITION OF NTDC’s 500 KV AND 220 KV GRID STATIONSThere are 14 (fourteen) 500 kV Grid Stations with 33 transformers at 500/220 kV level. Out of these, 13 transformers (39%) are loaded above 80% of their rated capacity. Similarly, out of total 143 (one hundred forty three) 220/132 kV transformers 79 transformers are overloaded representing around 55% overloading in the system. The following table shows loading position of power transformers loaded above 80% of their rated capacity installed at 500 kV and 220 kV grid stations of NTDC:
A. Overloading of 500 kV and 220 kV Power Transformers installed at 500 kV Grid Stations:
Region Name of GridStation
Auto and Power T/F
Voltage Level
Capacity (MVA)
Capacity (Ampere)
Load (Ampere)
Overload (above 80%)
Isla
mab
ad
Rawat
T-1 500/220 450 1180 1080 91.53T-2 500/220 450 1180 1080 91.53T-3 500/220 450 1180 990 83.90T-4 220/132 250 1095 990 90.41T-5 220/132 160 700 700 100.00
Sheikh Muhammadi
T-3 220/132 250 1095 1014 92.60T-5 220/132 160 700 650 92.86T-6 132/11.5 20/26 1305 1290 98.85T-8 220/132 250 1095 1014 92.60
Laho
re
Nokhar
T-1 220/132 600 1575 1300 82.54T-2 220/132 600 1575 1300 82.54T-4 220/132 160 700 660 94.29T-5 220/132 160 700 660 94.29T-6 220/132 160 700 660 94.29
Gatti
T-1 500/220 450 1180 1030 87.29T-2 500/220 450 1180 1052 89.15T-3 500/220 450 1180 1008 85.42T-4 500/220 450 1180 1008 85.42
Sheikhupura
T-1 500/220 600 1575 1470 93.33T-2 500/220 600 1575 1470 93.33T-3 500/220 600 1575 1470 93.33T-4 500/220 600 1575 1470 93.33T-5 220/132 160 700 575 82.14T-6 220/132 160 700 660 94.29T-7 220/132 160 700 720 102.86
Mul
tan
MultanT-3 220/132 160 700 629 89.86T-4 220/132 160 700 629 89.86T-5 220/132 160 700 629 89.86
Yousafwala
T-1 500/220 600 1575 1460 92.70T-2 500/220 600 1575 1460 92.70T-3 220/132 160 700 630 90.00T-4 220/132 160 700 630 90.00T-5 220/132 160 700 560 80.00T-6 220/132 160 700 560 80.00
Hyd
er-
abad Shikarpur
T-1 220/132 160 700 640 91.43T-2 220/132 160 700 640 91.43T-3 220/132 160 700 640 91.43
Source: NTDC

55
B. Overloading of 220 kV and 132 kV Power Transformers installed at 220 kV Grid Stations:
Region Name of Grid Station
Auto and Power T/F
Voltage Level
Capacity (MVA)
Capacity (Ampere)
Load (Ampere)
Overload (above 80%)
Islamabad
Burhan
T-1 220/132 250 1095 910 83.11T-2 220/132 250 1095 910 83.11T-3 220/132 250 1095 910 83.11T-4 220/132 160 700 680 97.14
Bannu
T-1 220/132 160 700 660 94.29T-2 220/132 160 700 660 94.29T-3 132/11.5 20/26 1305 1300 99.62T-4 132/11.5 40 2008 1790 89.14T-5 220/132 160 700 640 91.43
Daud Khail T-1 220/132 160 700 575 82.14T-2 220/132 160 700 575 82.14
Mardan
T-1 220/132 250 1095 1030 94.06T-2 220/132 250 1095 1030 94.06T-3 220/132 250 1095 1030 94.06T-4 220/132 40 2008 1740 86.65T-5 132/11.5 40 2008 1935 96.36
Sang Jani
T-1 220/132 160 700 650 92.86T-2 220/132 160 700 650 92.86T-3 220/132 160 700 670 95.71T-4 132/11.5 10/13 653 765 117.15T-5 132/11.5 10/13 653 565 86.52
Shahi Bagh T-5 132/11.5 10/13 653 562 86.06
UniversityT-1 220/132 250 1095 910 83.11T-4 220/132 20/26 1305 1200 91.95T-5 220/132 20/26 1305 1236 94.71
Multan
Chishtian T-1 220/132 160 700 573 81.86T-2 220/132 160 700 573 81.86
Okara T-1 220/132 250 1095 900 82.19Muzzafar
GarhT-1 220/132 160 700 600 85.71T-2 220/132 160 700 600 85.71
BahawalpurT-2 220/132 250 1095 960 87.67T-3 220/132 250 1095 960 87.67T-4 132/11.5 20/26 1305 1265 96.93
VehariT-1 220/132 160 700 635 90.71T-2 220/132 160 700 635 90.71T-3 220/132 160 700 660 94.29
Kasswal T-1 220/132 160 700 565 80.71T-2 220/132 160 700 565 80.71
Hyderabad
Hala Road
T-1 220/132 160 700 590 84.29T-2 220/132 160 700 605 86.43T-3 220/132 160 700 600 85.71T-5 132/11.5 20/26 1305 1110 85.06
QuettaIndustrial T-5 132/11.5 40 2008 1690 84.16
Sibbi T-3 132/11.5 20/26 1305 1250 95.79T-4 132/11.5 20/26 1305 1140 87.36
TM Khan Rd T-4 132/11.5 10/13 635 600 91.88

56
Region Name of Grid Station
Auto and Power T/F
Voltage Level
Capacity (MVA)
Capacity (Ampere)
Load (Ampere)
Overload (above 80%)
Lahore
NKLP LHR
T-1 220/132 250 1095 1115 101.83T-2 220/132 250 1095 1090 99.54T-3 220/132 250 1095 1090 99.54T-4 132/11.5 20/26 1305 1230 94.25T-5 132/11.5 40 2008 1650 82.17
Ravi LHR T-4 132/11.5 40 2008 1940 96.61T-5 132/11.5 20/26 1305 1180 90.42
Sialkot T-4 132/11.5 10/13 653 590 90.35Kala Shah Kaku T-5 132/11.5 20/26 1305 1110 85.06
Bund Road
T-1 220/132 250 1095 880 80.37T-2 220/132 250 1095 880 80.37T-3 220/132 250 1095 880 80.37T-4 132/11.5 250 1095 880 80.37T-5 132/11.5 40 2008 1930 96.12T-6 132/11.5 20/26 1305 1230 94.25
Ghakkar
T-2 220/132 160 700 570 81.43T-3 220/132 160 700 560 80.00T-4 132/11.5 160 700 650 92.86T-5 132/11.5 20/26 1305 1200 91.95T-6 132/11.5 20/26 1305 1210 92.72
WAPDA Town
T-1 220/132 160 700 602 86.00T-2 220/132 160 700 602 86.00T-3 220/132 160 700 602 86.00T-4 132/11.5 20/26 1305 1350 103.45T-5 132/11.5 40 2008 1995 99.35T-6 132/11.5 40 2008 1929 96.07
GZR T-1 220/132 250 1095 1050 95.89
Jaranwala
T-1 220/132 160 700 660 94.29T-2 220/132 160 700 660 94.29T-3 220/132 160 700 645 92.14T-4 132/11.5 160 700 675 96.43T-6 132/11.5 20/26 1305 1278 97.93
Ludewala
T-1 220/132 160 700 720 102.86T-2 220/132 160 700 720 102.86T-3 220/132 250 1095 1090 99.54T-4 132/11.5 10/13 353 382 108.22
Sammundri Road
T-2 220/132 160 700 660 94.29T-3 220/132 160 700 730 104.29T-4 132/11.5 10/13 653 620 94.95
TT Sing T-1 220/132 250 1095 900 82.19T-3 220/132 160 700 700 100.00
Source: NTDC
57
3.4 CONSTRAINTS IN NTDC SYSTEMDuring the reporting period, the progress reports of ongoing power evacuation projects and development projects, submitted by NTDC, have been reviewed and it is noted that NTDC could not complete a number of projects as per their scheduled dates, therefore completion dates of said projects were extended. Failure to complete projects, results not only in cost over-runs but also forces uneconomic power dispersal. For instance NTDC failed to construct interconnection facilities for 404 MW Uch-II Power Plant and 747 MW Guddu Power Plant, which could not be operated at available capacity. In response to explanations called by the Authority, NTDC admitted about delays in its planned projects. NTDC also reported the following constraints which hindered progress on certain projects:
3.4.1 Current Status of Interconnection Arrangements:The power evacuation curtailment and current status of interconnection arrangements are given below:
3.4.1.1 Uch-II Power Plant:The plant was commissioned on 04-04-2014. The existing interconnection arrangement is capable for100%powerevacuation;howeverN-1contingencyconditionwillbefulfilleduponcompletionof 220 kV Uch-Sibbi transmission line project. Therefore in case of any fault on the nearby system components, thepower fromoneof themostefficientpowerplantswouldnotbedispatchedoptimally.
3.4.1.2 FWEL-I and II in Gharo Cluster:The FWEL-I and II plants were commissioned on 11-04-2015 and 10-12-2014 respectively. Power evacuationfromtheseprojectshastobecurtailedduetooverloadingandinsufficientcapacityof132 kV HESCO connected network.
3.4.1.3 FFCEL in Jhimpir Cluster:The plant was commissioned on 16-05-2013. The power was required to be curtailed because of overloadingandinsufficientcapacityof132kV,HESCOnetwork.However,withthecommissioningof 220 kV Jhimpir grid station and 220 kV Jhimpir-TM Khan transmission line, on 25-08-2017, the issue has been resolved.
3.4.2 Project-wise Cost Over-run:Delays in completion of transmission projects not only affect the operational performance of the system, these may also lead to cost over runs which are then required to be passed on to the consumers. Details of cost incurred on some of the projects which required extension of time over their scheduled completion dates are presented in the following table. It may be noted that NTDC paid approximately Rs. 5 billion on account of cost over-runs for some of these projects. It may also benotedthatcertainprojectsspecificallyinKhyberPakhtunkhwaareboundtobedelayedinviewof their physical progress and the scheduled completion dates. Naturally their delayed completion would not support the Federal Government objectives to provide adequate supply of electricity and increased energy sold which is critical to bring overall tariff lower for end-consumers.

58
S. No. Name of Project
PC-I Cost (Million
Rs.)
Actual Amount Incurred
(Million Rs.)Physical Progress
Date of Completion/ Expected Date of
Completion1 220 kV Chishtian G/S 2,633.00 3,151.00[1] 100% 24-10-20162 220 kV Gujrat G/S 1,966.00 1,380.898 100% 27-04-20173 500 kV Rahim Yar Khan G/S 4,936.00 6,069.617 97% 31-10-2017[2]
4 Dispersal arrangement for 969 MW Neelum-Jhelum Hydropower Project
21,668.00 7,891.663 500 kV NJ-Domali D/C T/L (Phase-I): 93%
October, 2017
--- 500 kV Domali-G/wala D/C T/L (Phase-2): 12%
18-02-2019
5 Dispersal arrangement for 1320 MW Port Qasim Power Project
14,163.00 1,911.74 500 kV Bin Qasim PP-Matiari D/C T/L:(Phase-I): 90%[3]
October, 2017
6 Jhimpir and Gharo Wind Clusters 12,572.00 7,769.00 220 kV GIS Gharo G/S[4] --220 kV Jhimpir G/S: 100% Energized
on 11-08-2017220 kV Jhimpir-TM Khan
Road T/L: 100%Energized
on 25-08-2017220 kV Jhimpir-Gharo T/L:
74%December, 2017
7 220 kV Dera Murad Jamali G/S 880.00 879.545 88.68% 31-12-20178 Dispersal arrangement for 404
MW Uch-II Power Limited2,330.00 2,225.05 85.5% 31-03-2018
9 500 kV New Lahore G/S 12,664.00 14,918.50 79% 30-11-201710 220 kV Mansehra G/S 905.00 1,174.032 74% 31-03-201811 220 kV Ghazi Rd Lahore G/S 2,591.00 3,366.09 50% 31-03-201812 220 kV Chakdara G/S 3,230.00 1,765.504 30% 31-03-201813 220 kV DI Khan G/S 3,744.00 1,059.24 26% 31-03-201814 Dispersal arrangement for 1200
MW Thar Coal Power Project20,053.00 3,994.00 500 kV Thar-Matiari T/L
(Lot-I): 69%, (Lot-II): 63%30-06-2018
15 Dispersal arrangement for 747 MW Guddu New Power Plant
7,873.02 3,061.70 500 kV T/L Guddu-Muzza-fargarh: 40%
30-06-2018Lot-I[5]
16 220 kV Nowshera G/S 1,875.00 454.707 16% 30-06-2018Notes: [1] The contracts for 220 kV Chishtian G/S and T/L were awarded at the cost of Rs. 2,599 million approximately.
In addition Rs. 329 Million and Rs. 223 Million incurred on overheads and civil works and provisional sums respectively.
[2] 500 kV RYK G/S is almost complete but the G/S will be commissioned upon completion of 500 kV T/L in/out arrangement. The delay occurred due to law and order situation in the area and non-performance by T/L Contractor M/s GAM-ARAK, Iran due to which the initial contract for construction of 500 kV T/L was terminated on 09-03-2015 and, after re-bidding, the work was awarded on 06-05-2016. Now, the line activities are as per schedule.
[3] For phase-II of the Port Qasim T/L project, the contractors have mobilized at site since August, 2017.[4] The220kVGISGharoprojectisunderdiscussionwithKfWforthefinancingofproject.[5] The Lot-I of 500 kV Guddu-Muzzafargarh T/L was awarded on 26-12-2016, whereas Lots-II and III are under re-
bidding and Lot-IV is under negotiation and will be awarded during this week. The material for whole project has been procured and is in hand. The existing interconnection arrangement is capable for 100% power evacuation,howevertheaboveT/LisrequiredtofulfilltheN-Icontingencycondition.
Source: NTDC
3.4.3 Commitment Charges:In addition to implementation cost over-runs due to delays and extension in time, soft cost also balloon up in shape of commitment charges to be paid to lenders. NTDC was required to pay around Rs. 5 billion as additional commitment charges on the following projects. Therefore the benefitsofotherwisesoftloansarewastedduetolackofmanagementskillsandpoorgovernance.Commitment charges paid by NTDC on foreign loans during last three years are shown hereunder:
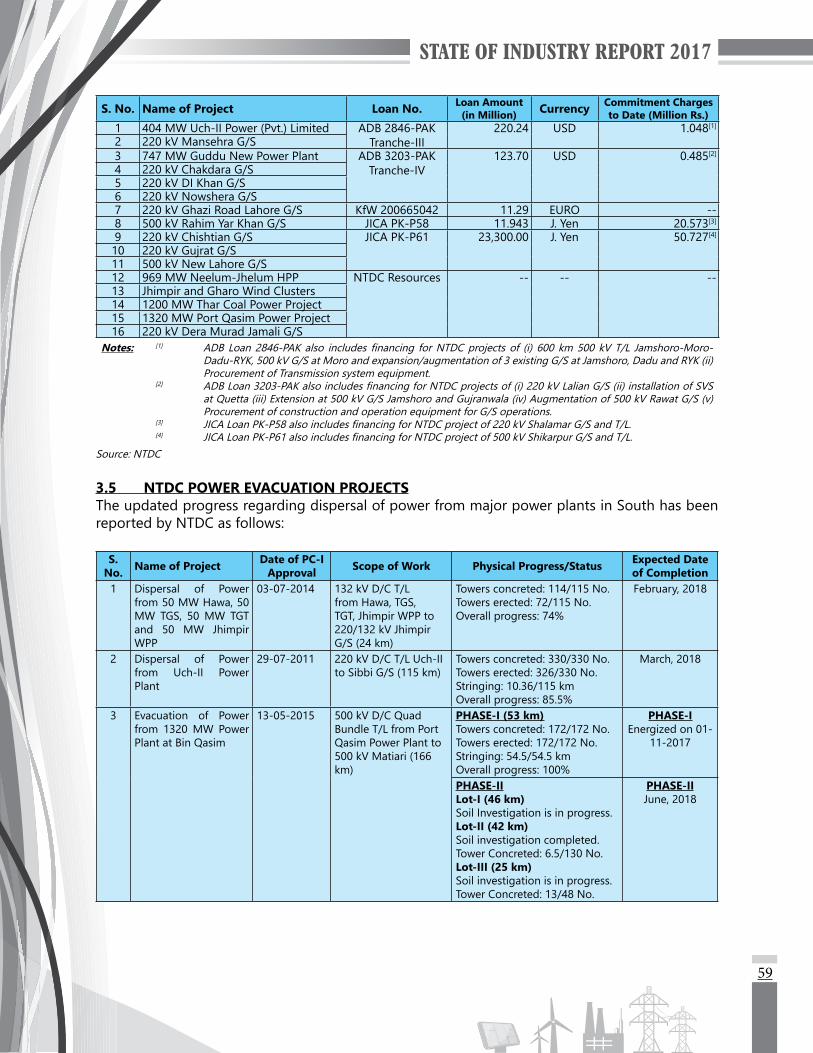
59
S. No. Name of Project Loan No. Loan Amount (in Million) Currency Commitment Charges
to Date (Million Rs.)1 404 MW Uch-II Power (Pvt.) Limited ADB 2846-PAK
Tranche-III220.24 USD 1.048[1]
2 220 kV Mansehra G/S3 747 MW Guddu New Power Plant ADB 3203-PAK
Tranche-IV123.70 USD 0.485[2]
4 220 kV Chakdara G/S5 220 kV DI Khan G/S6 220 kV Nowshera G/S7 220 kV Ghazi Road Lahore G/S KfW 200665042 11.29 EURO --8 500 kV Rahim Yar Khan G/S JICA PK-P58 11.943 J. Yen 20.573[3]
9 220 kV Chishtian G/S JICA PK-P61 23,300.00 J. Yen 50.727[4]
10 220 kV Gujrat G/S11 500 kV New Lahore G/S12 969 MW Neelum-Jhelum HPP NTDC Resources -- -- --13 Jhimpir and Gharo Wind Clusters14 1200 MW Thar Coal Power Project15 1320 MW Port Qasim Power Project16 220 kV Dera Murad Jamali G/S
Notes: [1] ADB Loan2846-PAKalso includesfinancing forNTDCprojectsof (i) 600 km500 kVT/L Jamshoro-Moro-Dadu-RYK, 500 kV G/S at Moro and expansion/augmentation of 3 existing G/S at Jamshoro, Dadu and RYK (ii) Procurement of Transmission system equipment.
[2] ADBLoan3203-PAKalsoincludesfinancingforNTDCprojectsof(i)220kVLalianG/S(ii)installationofSVSat Quetta (iii) Extension at 500 kV G/S Jamshoro and Gujranwala (iv) Augmentation of 500 kV Rawat G/S (v) Procurement of construction and operation equipment for G/S operations.
[3] JICALoanPK-P58alsoincludesfinancingforNTDCprojectof220kVShalamarG/SandT/L.[4] JICALoanPK-P61alsoincludesfinancingforNTDCprojectof500kVShikarpurG/SandT/L.
Source: NTDC
3.5 NTDC POWER EVACUATION PROJECTSThe updated progress regarding dispersal of power from major power plants in South has been reported by NTDC as follows:
S. No. Name of Project Date of PC-I
Approval Scope of Work Physical Progress/Status Expected Date of Completion
1 Dispersal of Power from 50 MW Hawa, 50 MW TGS, 50 MW TGT and 50 MW Jhimpir WPP
03-07-2014 132 kV D/C T/L from Hawa, TGS, TGT, Jhimpir WPP to 220/132 kV Jhimpir G/S (24 km)
Towers concreted: 114/115 No.Towers erected: 72/115 No.Overall progress: 74%
February, 2018
2 Dispersal of Power from Uch-II Power Plant
29-07-2011 220 kV D/C T/L Uch-II to Sibbi G/S (115 km)
Towers concreted: 330/330 No.Towers erected: 326/330 No.Stringing: 10.36/115 kmOverall progress: 85.5%
March, 2018
3 Evacuation of Power from 1320 MW Power Plant at Bin Qasim
13-05-2015 500 kV D/C Quad Bundle T/L from Port Qasim Power Plant to 500 kV Matiari (166 km)
PHASE-I (53 km)Towers concreted: 172/172 No.Towers erected: 172/172 No.Stringing: 54.5/54.5 kmOverall progress: 100%
PHASE-IEnergized on 01-
11-2017
PHASE-IILot-I (46 km)Soil Investigation is in progress.Lot-II (42 km)Soil investigation completed.Tower Concreted: 6.5/130 No.Lot-III (25 km)Soil investigation is in progress.Tower Concreted: 13/48 No.
PHASE-IIJune, 2018

60
S. No. Name of Project Date of PC-I
Approval Scope of Work Physical Progress/Status Expected Date of Completion
4 Dispersal of Power from Thar Coal based 1200 MW Power Plant
16-08-2012 500 kV D/C Quad Bundle T/L from Thar to Matiari (245 km)
Lot-I (110 km)Tower concreted: 337/345 No.Towers erected: 122/345 No.Stringing: 2.72/110 kmOverall progress: 73.7%Lot-II (135 km)Towers concreted: 351/389 No.Towers erected: 159/389 No.Overall progress: 69%
June, 2018
5 Dispersal of Power from 747 MW Guddu Power Plant
29-07-2011 500 kV S/C Guddu-Muzzafargarh T/L (266 km)
Lot-I (75 km)Soil investigation completed.Tower staking and excavation in progress.
Lot-IJune, 2018
Lot-II (72 km)Re-bidding process initiated.Lot-III (69 km)Re-bidding process initiated.Lot-IV (50 km)Case for award of Contract in process.
Lot-II, III and IVJune, 2019
Source: NTDC
3.6 INVESTMENT PLANS OF NTDCThe following table provides project wise information about the actual investment that NTDC made during the FY 2015-16:
S. No. Name of the Projects
Actual Expenditure 2015-16 (Rs. Million)Local Foreign Total
On Going Projects:1 Up-gradation of NPCC Islamabad 35.2 - 35.22 New 220 kV G/S at Khuzdar/220 kV Dadu-Khuzdar D/C T/L 135.34 - 135.34
3 220 kV G/S at Ghazi Road, Lahore with 220 kV D/C T/L 132 kV Expansion System 281.12 3.34 284.46
4 220 kV G/S at Kasswal with 132 kV Expansion System 176.6 - 176.65 Provision of Secured Metering System at CDPs 0.76 - 0.76
6Power Transmission Enhancement Project (Tranche-I) 19 Sub projects or 500/220 kV sub Stations and T/L Loan (2289 and 2290)
0.95 0.95
7 220 kV T/L from Chashma to Ludewala for Interconnection of CHASNUPP-II 40.36 - 40.36
8
4Nos.newProjectstobefinancedbyJBIC(i)500kVRYKG/Sand T/L (ii) 220 kV Chishtian T/L (iii) 220 kV Gujrat G/S and 220 kV T/L (iv) 220 kV Shalamar G/S and 220 kV T/L (4 Projects - JBIC Loan PK-P58)
1,083.63 262.15 1,345.78
9Power Transmission Enhancement Project (Tranche-II) (SET) 10 Sub projects (i) 9 Sub Projects of 500 kV and 220 kV S/S and T/L
901.57 206 1,107.56
10 220/132 kV Dera Murad Jamali Sub Station 503.95 - 503.95
11 Transmission for Dispersal power from Neelum-Jhelum Hydropower Project 4,384.74 - 4,384.74
12 3rd 500 kV Jamshoro-Moro-RYK Single Circuit T/L 2,725.38 4,605.56 7,330.94

61
S. No. Name of the Projects
Actual Expenditure 2015-16 (Rs. Million)Local Foreign Total
13 Import of 100 MW Power from Iran (with 220 kV G/S Gwadar and allied T/L form Iran to Gwadar funded by Iran (EDBI-Iran) 8.54 - 8.54
14Addition of 500/200 kV Sub Station T/L for Strengthening the existing NTDC system (i) 500 kV Lahore New (ii) 500 kV Shikarpur (iii) 220 kV DI Khan (JICA PK-61)
2,797.35 3,832.16 6,629.50
15 Transmission Interconnection for Dispersal of Power from Uch-II 23.75 360.36 384.11
16 220 kV G/S Mansehra 11.6 - 11.6
17 Construction of 500 kV T/L for Dispersal of Power form 747 MW from Guddu 46.36 677.77 724.13
Sub-Total 13,156.23 9,948.28 23,104.52New Projects:
18 Interconnection-Thar Coal Based 1200 MW 167.58 - 167.5819 500 kV Faisalabad New (2x750) 3.38 - 3.3820 Interconnection of Chashma Nuclear (C-3 and C-4) 420.67 - 420.67
21 Evacuation of Power from Wind Power Projects at Jhimpir and Gharo Wind Cluster 3,010.79 - 3,010.79
22 Augmentation of 500/220 kV and 220/132 kV Transformer in NTDC System New 79.96 - 79.96
23 Quaid-e-Azam Solar Park at Lal Suhanra Phase-II Evacuation of 600 MW Solar Power 726.46 - 726.46
24Construction of +600 kV HVDC Transmission Line from Matiari to Lahore (Land Acquisition for Converter Station and Grounding Station-Both ends) (CPEC)
514.72 - 514.72
25 Evacuation of Power from 147 MW Patrind HPP 1.1 - 1.126 Evacuation of Power from 2160 MW Dasu HPP Stage-I 18.95 173.68 192.63 Sub-Total 4,943.60 173.68 5,117.29
Grand Total 18,099.83 10,121.95 28,221.78Note: Expenditure under Local component are inclusive of Interest during Construction.Source: NTDC
NTDC was also allowed an investment of Rs. 7,747.80 million to be spent on the construction of following grid stations during the FY 2016-17 with the challenge to complete these projects within the given timelines:
S. No. Name of Project
PSDP Estimates for 2016-17 (Rs. Million)Local Foreign Total
1 220 kV G/S Mansehra and Allied T/Ls 192.00 285.70 477.702 220 kV G/S Nowshera and Allied T/Ls 863.10 767.00 1,630.103 220 kV G/S Chakdara and Allied T/Ls 567.00 2,067.00 2,634.004 220 kV G/S DI Khan and Allied T/Ls 1,130.00 1,866.00 2,996.005 220 kV G/S Kohat and Allied T/Ls 10.00 0.00 10.00
Total 2,762.10 4,985.70 7,747.80Source: NTDC
NEPRA considering the importance of investment requirements of NTDC regarding interconnection arrangements for evacuation of power from various power plants, also allowed NTDC an additional investment of Rs. 27,921 million for the following projects during the reporting period i.e. FY 2016-17:
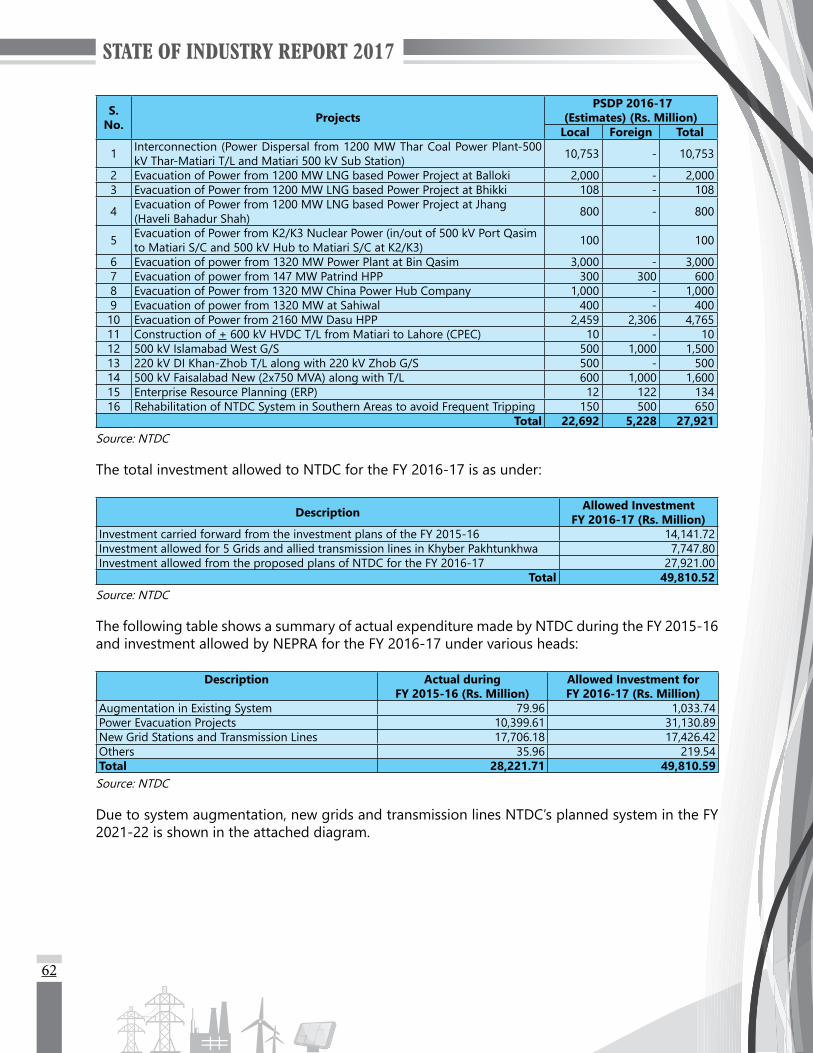
62
S. No. Projects
PSDP 2016-17(Estimates) (Rs. Million)
Local Foreign Total
1 Interconnection (Power Dispersal from 1200 MW Thar Coal Power Plant-500 kV Thar-Matiari T/L and Matiari 500 kV Sub Station) 10,753 - 10,753
2 Evacuation of Power from 1200 MW LNG based Power Project at Balloki 2,000 - 2,000 3 Evacuation of Power from 1200 MW LNG based Power Project at Bhikki 108 - 108
4 Evacuation of Power from 1200 MW LNG based Power Project at Jhang (Haveli Bahadur Shah) 800 - 800
5 Evacuation of Power from K2/K3 Nuclear Power (in/out of 500 kV Port Qasim to Matiari S/C and 500 kV Hub to Matiari S/C at K2/K3) 100 100
6 Evacuation of power from 1320 MW Power Plant at Bin Qasim 3,000 - 3,000 7 Evacuation of power from 147 MW Patrind HPP 300 300 600 8 Evacuation of Power from 1320 MW China Power Hub Company 1,000 - 1,000 9 Evacuation of power from 1320 MW at Sahiwal 400 - 400 10 Evacuation of Power from 2160 MW Dasu HPP 2,459 2,306 4,76511 Construction of + 600 kV HVDC T/L from Matiari to Lahore (CPEC) 10 - 1012 500 kV Islamabad West G/S 500 1,000 1,50013 220 kV DI Khan-Zhob T/L along with 220 kV Zhob G/S 500 - 50014 500 kV Faisalabad New (2x750 MVA) along with T/L 600 1,000 1,60015 Enterprise Resource Planning (ERP) 12 122 13416 Rehabilitation of NTDC System in Southern Areas to avoid Frequent Tripping 150 500 650
Total 22,692 5,228 27,921Source: NTDC
The total investment allowed to NTDC for the FY 2016-17 is as under:
Description Allowed InvestmentFY 2016-17 (Rs. Million)
Investment carried forward from the investment plans of the FY 2015-16 14,141.72Investment allowed for 5 Grids and allied transmission lines in Khyber Pakhtunkhwa 7,747.80Investment allowed from the proposed plans of NTDC for the FY 2016-17 27,921.00
Total 49,810.52Source: NTDC
The following table shows a summary of actual expenditure made by NTDC during the FY 2015-16 and investment allowed by NEPRA for the FY 2016-17 under various heads:
Description Actual during FY 2015-16 (Rs. Million)
Allowed Investment forFY 2016-17 (Rs. Million)
Augmentation in Existing System 79.96 1,033.74 Power Evacuation Projects 10,399.61 31,130.89 New Grid Stations and Transmission Lines 17,706.18 17,426.42 Others 35.96 219.54 Total 28,221.71 49,810.59 Source: NTDC
Due to system augmentation, new grids and transmission lines NTDC’s planned system in the FY 2021-22 is shown in the attached diagram.
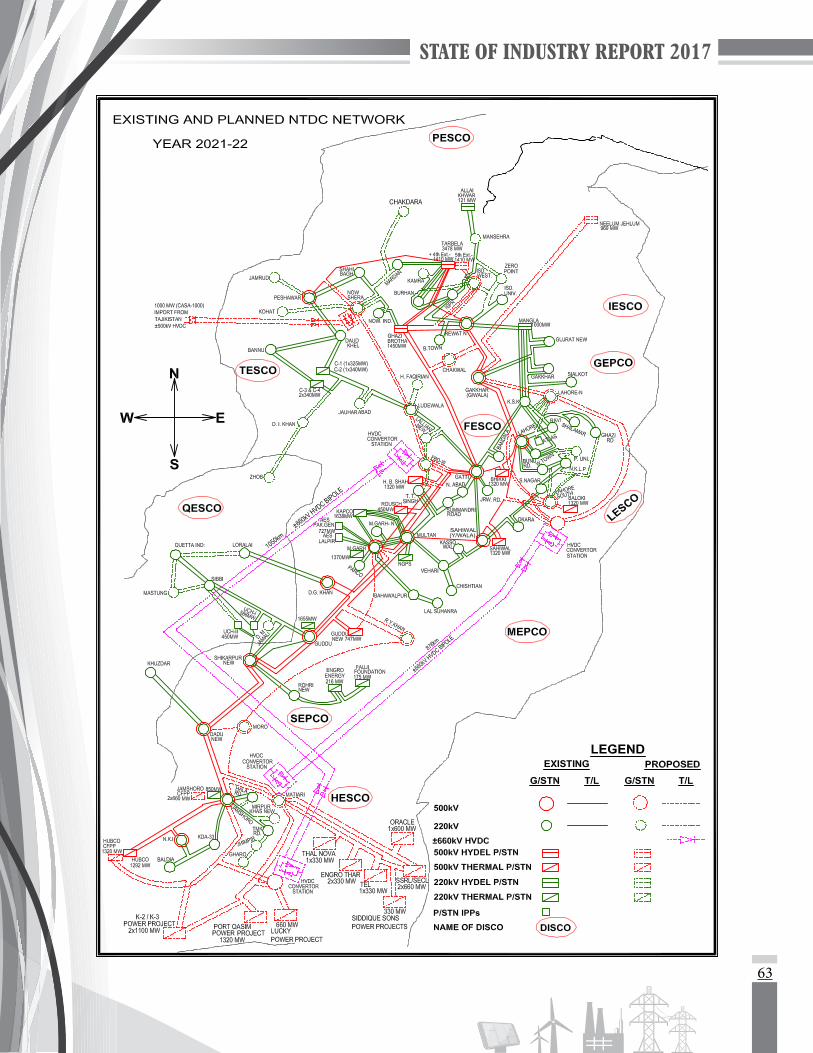
63
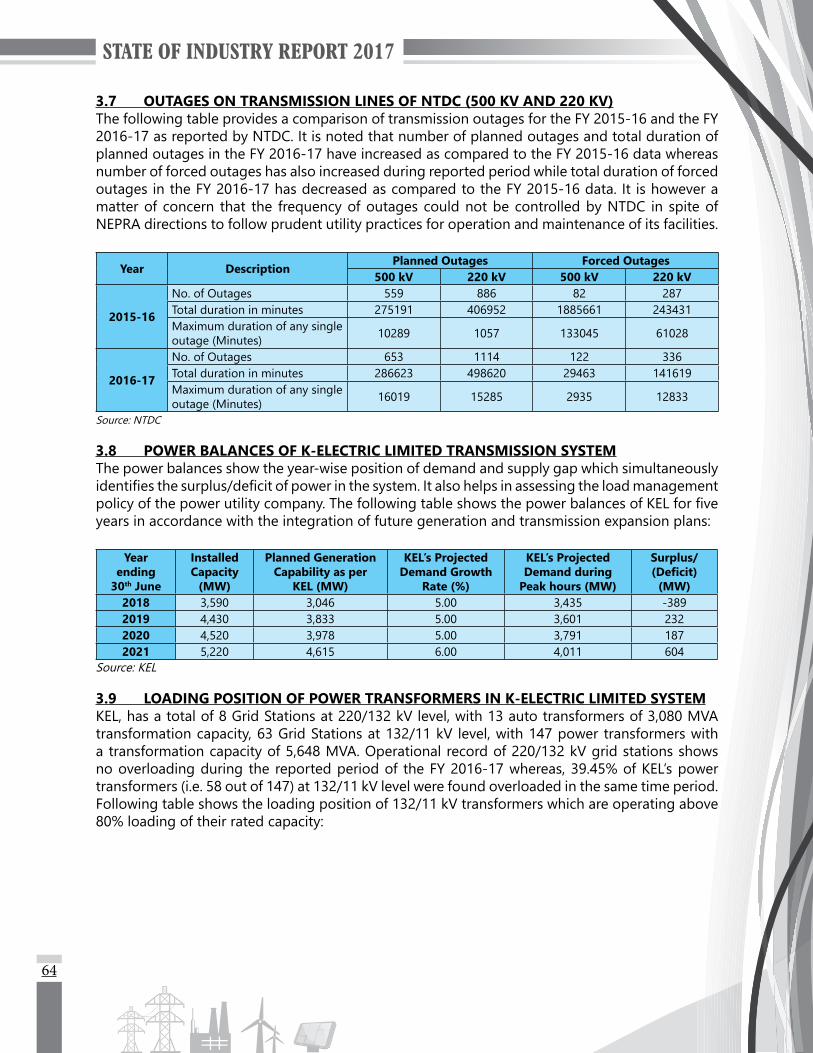
64
3.7 OUTAGES ON TRANSMISSION LINES OF NTDC (500 KV AND 220 KV)The following table provides a comparison of transmission outages for the FY 2015-16 and the FY 2016-17 as reported by NTDC. It is noted that number of planned outages and total duration of planned outages in the FY 2016-17 have increased as compared to the FY 2015-16 data whereas number of forced outages has also increased during reported period while total duration of forced outages in the FY 2016-17 has decreased as compared to the FY 2015-16 data. It is however a matter of concern that the frequency of outages could not be controlled by NTDC in spite of NEPRA directions to follow prudent utility practices for operation and maintenance of its facilities.
Year DescriptionPlanned Outages Forced Outages
500 kV 220 kV 500 kV 220 kV
2015-16
No. of Outages 559 886 82 287Total duration in minutes 275191 406952 1885661 243431Maximum duration of any single outage (Minutes) 10289 1057 133045 61028
2016-17
No. of Outages 653 1114 122 336Total duration in minutes 286623 498620 29463 141619Maximum duration of any single outage (Minutes) 16019 15285 2935 12833
Source: NTDC
3.8 POWER BALANCES OF K-ELECTRIC LIMITED TRANSMISSION SYSTEMThe power balances show the year-wise position of demand and supply gap which simultaneously identifiesthesurplus/deficitofpowerinthesystem.Italsohelpsinassessingtheloadmanagementpolicyofthepowerutilitycompany.ThefollowingtableshowsthepowerbalancesofKELforfiveyears in accordance with the integration of future generation and transmission expansion plans:
Yearending
30th June
InstalledCapacity
(MW)
Planned Generation Capability as per
KEL (MW)
KEL’s Projected Demand Growth
Rate (%)
KEL’s Projected Demand during
Peak hours (MW)
Surplus/ (Deficit)
(MW)2018 3,590 3,046 5.00 3,435 -3892019 4,430 3,833 5.00 3,601 2322020 4,520 3,978 5.00 3,791 1872021 5,220 4,615 6.00 4,011 604
Source: KEL
3.9 LOADING POSITION OF POWER TRANSFORMERS IN K-ELECTRIC LIMITED SYSTEMKEL, has a total of 8 Grid Stations at 220/132 kV level, with 13 auto transformers of 3,080 MVA transformation capacity, 63 Grid Stations at 132/11 kV level, with 147 power transformers with a transformation capacity of 5,648 MVA. Operational record of 220/132 kV grid stations shows no overloading during the reported period of the FY 2016-17 whereas, 39.45% of KEL’s power transformers (i.e. 58 out of 147) at 132/11 kV level were found overloaded in the same time period. Following table shows the loading position of 132/11 kV transformers which are operating above 80% loading of their rated capacity:
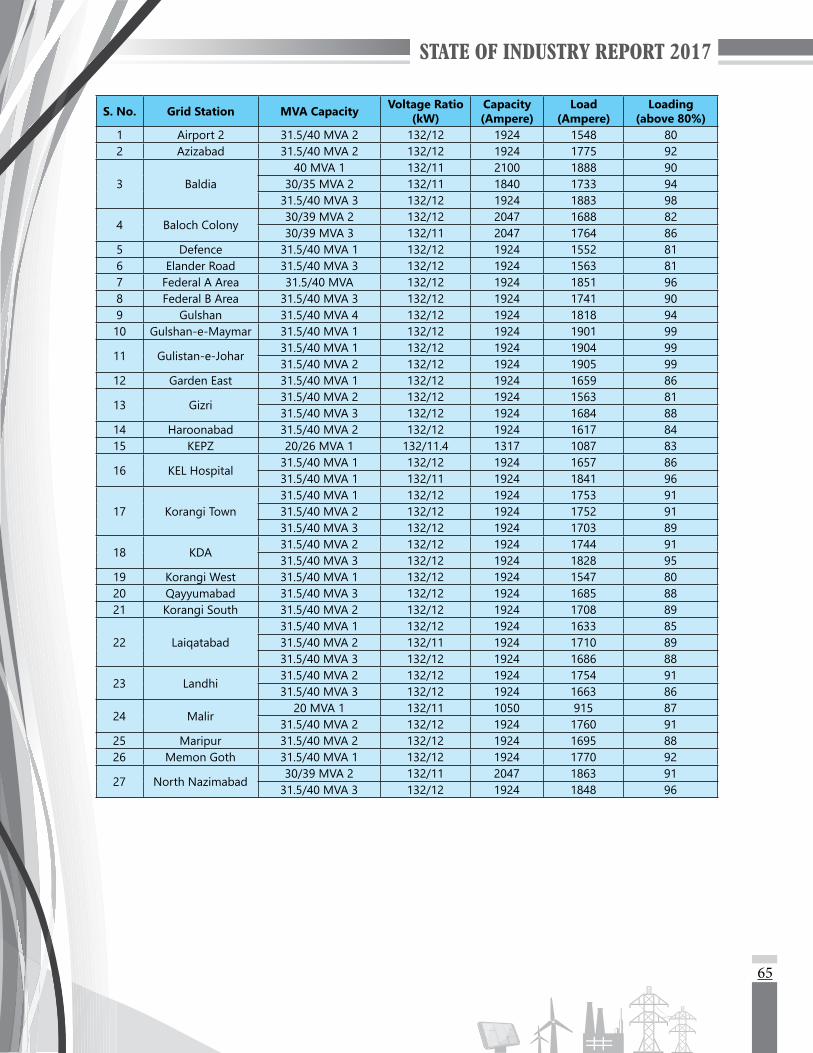
65
S. No. Grid Station MVA Capacity Voltage Ratio (kW)
Capacity (Ampere)
Load (Ampere)
Loading(above 80%)
1 Airport 2 31.5/40 MVA 2 132/12 1924 1548 802 Azizabad 31.5/40 MVA 2 132/12 1924 1775 92
3 Baldia40 MVA 1 132/11 2100 1888 90
30/35 MVA 2 132/11 1840 1733 9431.5/40 MVA 3 132/12 1924 1883 98
4 Baloch Colony30/39 MVA 2 132/12 2047 1688 8230/39 MVA 3 132/11 2047 1764 86
5 Defence 31.5/40 MVA 1 132/12 1924 1552 816 Elander Road 31.5/40 MVA 3 132/12 1924 1563 817 Federal A Area 31.5/40 MVA 132/12 1924 1851 968 Federal B Area 31.5/40 MVA 3 132/12 1924 1741 909 Gulshan 31.5/40 MVA 4 132/12 1924 1818 9410 Gulshan-e-Maymar 31.5/40 MVA 1 132/12 1924 1901 99
11 Gulistan-e-Johar31.5/40 MVA 1 132/12 1924 1904 9931.5/40 MVA 2 132/12 1924 1905 99
12 Garden East 31.5/40 MVA 1 132/12 1924 1659 86
13 Gizri31.5/40 MVA 2 132/12 1924 1563 8131.5/40 MVA 3 132/12 1924 1684 88
14 Haroonabad 31.5/40 MVA 2 132/12 1924 1617 8415 KEPZ 20/26 MVA 1 132/11.4 1317 1087 83
16 KEL Hospital31.5/40 MVA 1 132/12 1924 1657 8631.5/40 MVA 1 132/11 1924 1841 96
17 Korangi Town31.5/40 MVA 1 132/12 1924 1753 9131.5/40 MVA 2 132/12 1924 1752 9131.5/40 MVA 3 132/12 1924 1703 89
18 KDA31.5/40 MVA 2 132/12 1924 1744 9131.5/40 MVA 3 132/12 1924 1828 95
19 Korangi West 31.5/40 MVA 1 132/12 1924 1547 8020 Qayyumabad 31.5/40 MVA 3 132/12 1924 1685 8821 Korangi South 31.5/40 MVA 2 132/12 1924 1708 89
22 Laiqatabad31.5/40 MVA 1 132/12 1924 1633 8531.5/40 MVA 2 132/11 1924 1710 8931.5/40 MVA 3 132/12 1924 1686 88
23 Landhi31.5/40 MVA 2 132/12 1924 1754 9131.5/40 MVA 3 132/12 1924 1663 86
24 Malir20 MVA 1 132/11 1050 915 87
31.5/40 MVA 2 132/12 1924 1760 9125 Maripur 31.5/40 MVA 2 132/12 1924 1695 8826 Memon Goth 31.5/40 MVA 1 132/12 1924 1770 92
27 North Nazimabad30/39 MVA 2 132/11 2047 1863 91
31.5/40 MVA 3 132/12 1924 1848 96
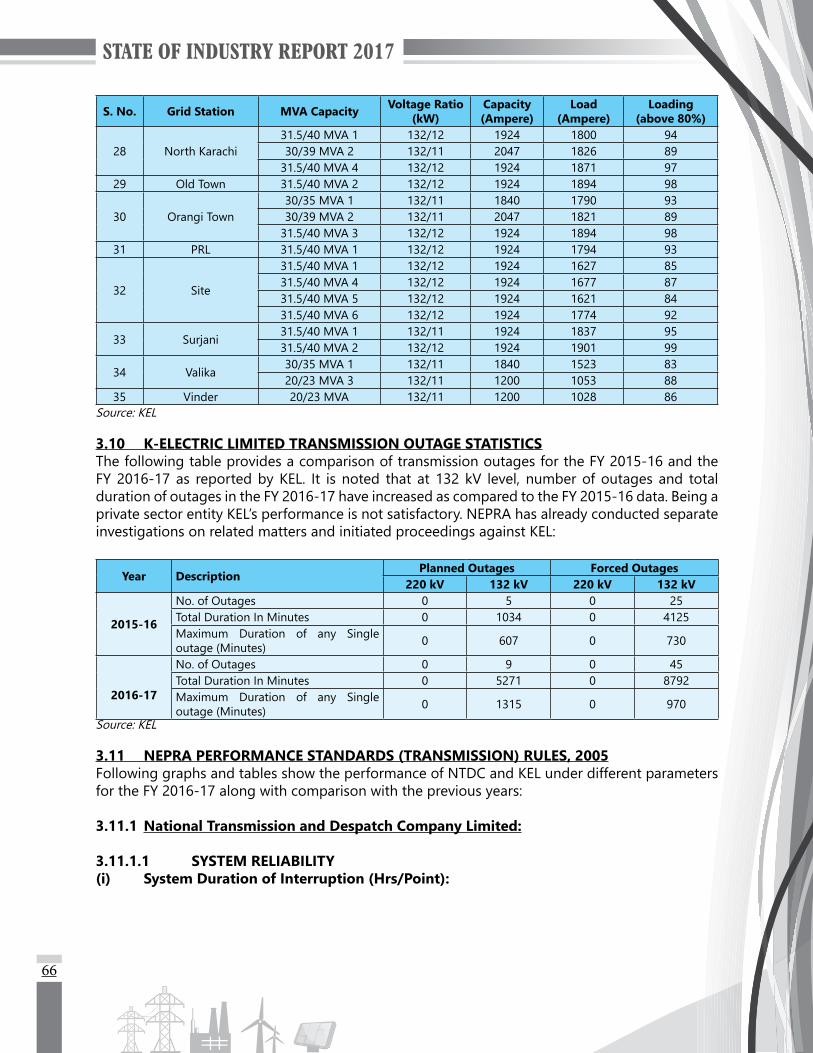
66
S. No. Grid Station MVA Capacity Voltage Ratio (kW)
Capacity (Ampere)
Load (Ampere)
Loading(above 80%)
28 North Karachi31.5/40 MVA 1 132/12 1924 1800 9430/39 MVA 2 132/11 2047 1826 89
31.5/40 MVA 4 132/12 1924 1871 9729 Old Town 31.5/40 MVA 2 132/12 1924 1894 98
30 Orangi Town30/35 MVA 1 132/11 1840 1790 9330/39 MVA 2 132/11 2047 1821 89
31.5/40 MVA 3 132/12 1924 1894 9831 PRL 31.5/40 MVA 1 132/12 1924 1794 93
32 Site
31.5/40 MVA 1 132/12 1924 1627 8531.5/40 MVA 4 132/12 1924 1677 8731.5/40 MVA 5 132/12 1924 1621 8431.5/40 MVA 6 132/12 1924 1774 92
33 Surjani31.5/40 MVA 1 132/11 1924 1837 9531.5/40 MVA 2 132/12 1924 1901 99
34 Valika30/35 MVA 1 132/11 1840 1523 8320/23 MVA 3 132/11 1200 1053 88
35 Vinder 20/23 MVA 132/11 1200 1028 86Source: KEL
3.10 K-ELECTRIC LIMITED TRANSMISSION OUTAGE STATISTICSThe following table provides a comparison of transmission outages for the FY 2015-16 and the FY 2016-17 as reported by KEL. It is noted that at 132 kV level, number of outages and total duration of outages in the FY 2016-17 have increased as compared to the FY 2015-16 data. Being a private sector entity KEL’s performance is not satisfactory. NEPRA has already conducted separate investigations on related matters and initiated proceedings against KEL:
Year DescriptionPlanned Outages Forced Outages
220 kV 132 kV 220 kV 132 kV
2015-16
No. of Outages 0 5 0 25Total Duration In Minutes 0 1034 0 4125Maximum Duration of any Single outage (Minutes) 0 607 0 730
2016-17
No. of Outages 0 9 0 45Total Duration In Minutes 0 5271 0 8792Maximum Duration of any Single outage (Minutes) 0 1315 0 970
Source: KEL
3.11 NEPRA PERFORMANCE STANDARDS (TRANSMISSION) RULES, 2005Following graphs and tables show the performance of NTDC and KEL under different parameters for the FY 2016-17 along with comparison with the previous years:
3.11.1 National Transmission and Despatch Company Limited:
3.11.1.1 SYSTEM RELIABILITY(i) System Duration of Interruption (Hrs/Point):

67
This KPI shows the average duration of outage an interconnection point observes during a year and it remained 1.08 hrs in the FY 2016-17 as shown in the following figure. This indicates a2.35 times (134.8%) increase in average outage duration per interconnection point as compared to the preceding year.
(ii) System Frequency of Interruption (Nos./Circuit):It indicates the average number of outages on a circuit during a year. During 2016-17 it remained 0.35 as shown in the following figure thatindicates 1.84 times (84.2%) increase in average number of outages per circuit as compared to the preceding year.
3.11.1.2 SYSTEM SECURITY(i) Energy Not Served (ENS) (MkWh):This KPI shows the estimates of the total ENS contributed by loss of supply incidents during the year. An improvement of 47.6% may be noted as compared to the previous year.
(ii) Loss of Supply Incidents, Average ENS per Incident and Average Duration per Incident:
Year Loss of SupplyIncidents (Nos.)
Average ENS per Incident (MWh)
Average Durationper Incident (Hrs)
2014-15 125 4264 1.22015-16 87 1644 2.42016-17 126 595 4
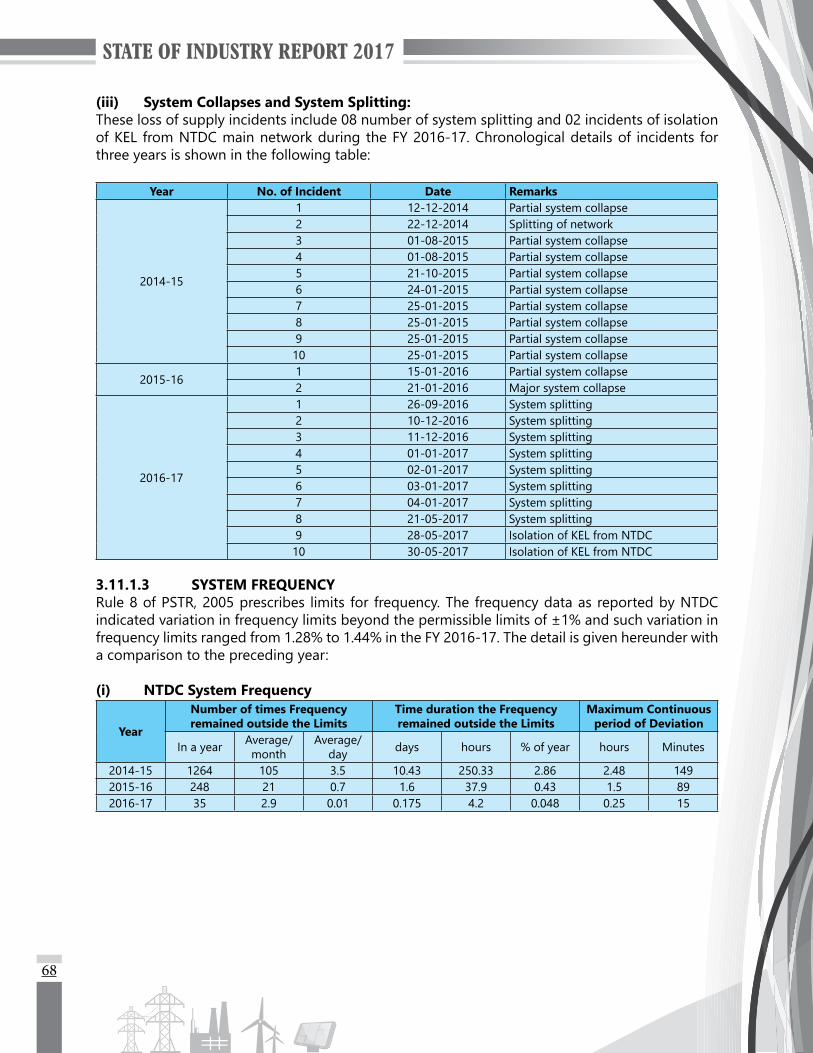
68
(iii) System Collapses and System Splitting:These loss of supply incidents include 08 number of system splitting and 02 incidents of isolation of KEL from NTDC main network during the FY 2016-17. Chronological details of incidents for three years is shown in the following table:
Year No. of Incident Date Remarks
2014-15
1 12-12-2014 Partial system collapse2 22-12-2014 Splitting of network3 01-08-2015 Partial system collapse4 01-08-2015 Partial system collapse5 21-10-2015 Partial system collapse6 24-01-2015 Partial system collapse7 25-01-2015 Partial system collapse8 25-01-2015 Partial system collapse9 25-01-2015 Partial system collapse10 25-01-2015 Partial system collapse
2015-161 15-01-2016 Partial system collapse2 21-01-2016 Major system collapse
2016-17
1 26-09-2016 System splitting2 10-12-2016 System splitting3 11-12-2016 System splitting4 01-01-2017 System splitting5 02-01-2017 System splitting6 03-01-2017 System splitting7 04-01-2017 System splitting8 21-05-2017 System splitting9 28-05-2017 Isolation of KEL from NTDC10 30-05-2017 Isolation of KEL from NTDC
3.11.1.3 SYSTEM FREQUENCYRule 8 of PSTR, 2005 prescribes limits for frequency. The frequency data as reported by NTDC indicated variation in frequency limits beyond the permissible limits of ±1% and such variation in frequency limits ranged from 1.28% to 1.44% in the FY 2016-17. The detail is given hereunder with a comparison to the preceding year:
(i) NTDC System Frequency
Year
Number of times Frequency remained outside the Limits
Time duration the Frequency remained outside the Limits
Maximum Continuous period of Deviation
In a year Average/month
Average/day days hours % of year hours Minutes
2014-15 1264 105 3.5 10.43 250.33 2.86 2.48 1492015-16 248 21 0.7 1.6 37.9 0.43 1.5 892016-17 35 2.9 0.01 0.175 4.2 0.048 0.25 15

69
(ii) NTDC Monthly Highest System Frequency (Hertz)Month 2012-13 2013-14 2014-15 2015-16 2016-17
July 50.48 50.20 50.71 50.75 NILAugust 50.52 50.31 50.68 50.69 50.72
September 50.56 50.22 50.55 50.69 50.60October 50.45 50.35 50.69 50.53 NIL
November 50.40 50.30 50.62 50.62 NILDecember 50.40 50.28 58.63 50.71 50.63
January 50.21 50.70 54.69 51.47 50.68February 50.10 50.63 49.49 NIL 50.65
March 50.34 50.63 50.65 50.64 50.61April 50.30 50.68 50.66 NIL 50.63May 50.26 50.60 50.69 NIL 50.65June 50.23 50.57 50.68 49.49* 50.64
* cannot be validated
(iii) NTDC Monthly Lowest System Frequency (Hertz)Month 2012-13 2013-14 2014-15 2015-16 2016-17
July 48.76 49.05 48.74 49.07 NILAugust 48.80 49.15 48.91 49.15 49.36
September 48.72 49.35 48.93 49.19 50.51*October 48.80 49.50 48.99 49.21 NIL
November 48.72 49.31 48.83 49.22 NILDecember 48.72 49.15 45.00 49.32 49.44
January 49.10 48.67 45.00 45.00 49.37February 48.66 48.87 49.06 NIL 50.53*
March 49.40 48.92 49.11 50.52 50.51*April 49.32 48.89 49.02 NIL 49.32May 49.48 49.20 49.20 NIL 50.52*June 49.20 49.19 50.51 49.35 50.51*
* cannot be validated

70
3.11.2 K-Electric Limited:
3.11.2.1 SYSTEM RELIABILITY(i) System Duration of Interruption (Hrs/Point):This KPI shows the average duration of outage an interconnection point faces during a year and it remained 1.01 hrs in the FY 2016-17 as shown in the figure. This indicates a 31%decrease in average outage duration per interconnection point as compared to preceding year.
(ii) System Frequency of Interruption (Nos./Circuit):It indicates the average number of outages at a circuit during a year. As showninthefigure,itremained0.3inthe FY 2016-17. (6.3% decrease with respect to preceding year).
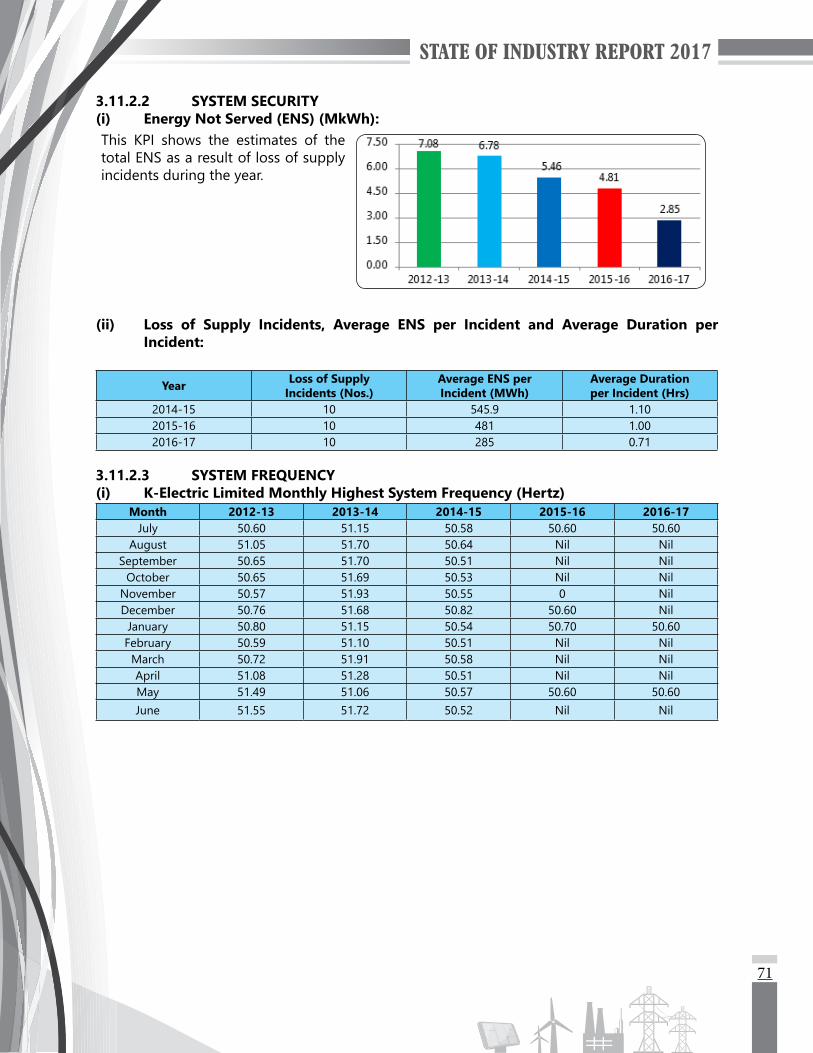
71
3.11.2.2 SYSTEM SECURITY(i) Energy Not Served (ENS) (MkWh):This KPI shows the estimates of the total ENS as a result of loss of supply incidents during the year.
(ii) Loss of Supply Incidents, Average ENS per Incident and Average Duration per Incident:
Year Loss of SupplyIncidents (Nos.)
Average ENS perIncident (MWh)
Average Durationper Incident (Hrs)
2014-15 10 545.9 1.102015-16 10 481 1.002016-17 10 285 0.71
3.11.2.3 SYSTEM FREQUENCY(i) K-Electric Limited Monthly Highest System Frequency (Hertz)
Month 2012-13 2013-14 2014-15 2015-16 2016-17July 50.60 51.15 50.58 50.60 50.60
August 51.05 51.70 50.64 Nil NilSeptember 50.65 51.70 50.51 Nil Nil
October 50.65 51.69 50.53 Nil NilNovember 50.57 51.93 50.55 0 NilDecember 50.76 51.68 50.82 50.60 Nil
January 50.80 51.15 50.54 50.70 50.60February 50.59 51.10 50.51 Nil Nil
March 50.72 51.91 50.58 Nil NilApril 51.08 51.28 50.51 Nil NilMay 51.49 51.06 50.57 50.60 50.60June 51.55 51.72 50.52 Nil Nil

72
(ii) K-Electric Limited Monthly Lowest System Frequency (Hertz)Month 2012-13 2013-14 2014-15 2015-16 2016-17
July 48.56 48.61 48.97 49.40 NilAugust 48.60 48.68 49.10 49.40 Nil
September 48.59 48.73 49.13 49.40 NilOctober 48.60 48.80 49.18 49.40 Nil
November 48.60 48.74 48.94 Nil NilDecember 48.59 48.76 49.15 Nil Nil
January 48.50 48.61 49.07 49.40 NilFebruary 47.12 48.80 49.39 Nil Nil
March 48.80 48.59 49.26 Nil NilApril 48.74 48.63 49.26 Nil 49.30May 48.63 48.66 49.29 Nil NilJune 48.62 48.80 49.32 49.40 Nil

STATE OF INDUSTRY REPORT 2017
PERFORMANCE OF DISTRIBUTION SECTOR

75
PERFORMANCE OF DISTRIBUTION SECTOR
4.1 GENERALThe un-bundling of WAPDA through power sector reforms resulted in creation of ten (10) DISCOs owned by the Federal Government. Currently assets of 132 kV Transmission Networks and 11 kV and below Distribution Networks are allocated to DISCOs, which include 25,068 km of 132 kV Transmission Lines, 760 (seven hundred sixty) 132 kV Grid Stations which consist of 1,828 Power Transformers having transformation capacity of 45,324 MVA, 8,454 11 kV Feeders, 323,961 km of 11 kV Lines, 681,805 Distribution Transformers having transformation capacity of 43,295 MVA and 232,042 km of LT Lines.
In addition to above, KEL is a vertically integrated company also having a distribution licence granted by NEPRA. KEL is responsible for 338 km of 220 kV Transmission Lines, 8 (eight) 220 kV Grid Stations with transformation capacity of 3,080 MVA, 766 km of 132 kV Transmission Lines, 63 (sixty three) 132 kV Grid Stations having transformation capacity of 5,648 MVA, 1,653 11 kV Feeders, 9,363 Km of 11 kV Lines, 25,667 Distribution Transformers having 7,230 MVA and 19,962 km of LT Lines.
4.2 CIRCULAR DEBTCircular debt is a major issue confronting power sector. One of the contributors of circular debt is the high transmission and distribution losses in DISCOs viz-a-viz the Authority’s allowed targets. HereitispertinenttomentionthatnotifiedaverageT&DlossestargetfortheFY2016-17was15.27%, at national level excluding KEL, whereas DISCOs reported actual T&D losses for the same period remained around 17.9%. This gap of around 2.6% between the actual T&D losses and the Authority’s allowed level of T&D losses has resulted in an annual gap of over Rs. 31 billion during the FY 2016-17 (including the impact of monthly FCA).
Adding further to circular debt, is the low recovery ratio of DISCOs. The Authority maintains a recovery target of 100% while setting the consumer-end tariff for DISCOs, however, the actual reported recovery ratio of DISCOs, for the FY 2016-17 remained at around 92%. The impact of lesser recoveries viz-a-viz the billed amount including (SOP, Excise Duty, Income Tax, GST, FAS, Additional Surcharge, LPS etc.), has resulted in an annual shortfall of around Rs. 81 billion.
4.3 T&D LOSSES
4.3.1 Transmission and Distribution Losses Overall Perspective:The T&D losses of DISCOs are among the most discussed and debated issues in the context of power sector. The Regulator has also been advising and directing the DISCOs for taking operational and managerial steps to control their losses and bring those closer to prudent levels. NEPRA has also allowed huge investment funds every year to DISCOs, so that new and critical projects are initiated and completed on time. Since all DISCOs are owned and controlled by the Ministry of Energy (Power Division), therefore, the Regulator has always been pointing out this critical issue to relevant quarters at all fora. It is however observed, that DISCOs’ performance in this area remained unsatisfactory throughout as may be seen from the following chart from the FY 2012-13 to the FY 2016-17. Except for one or two companies, the others have remained oblivious to gravity of the matter.
04
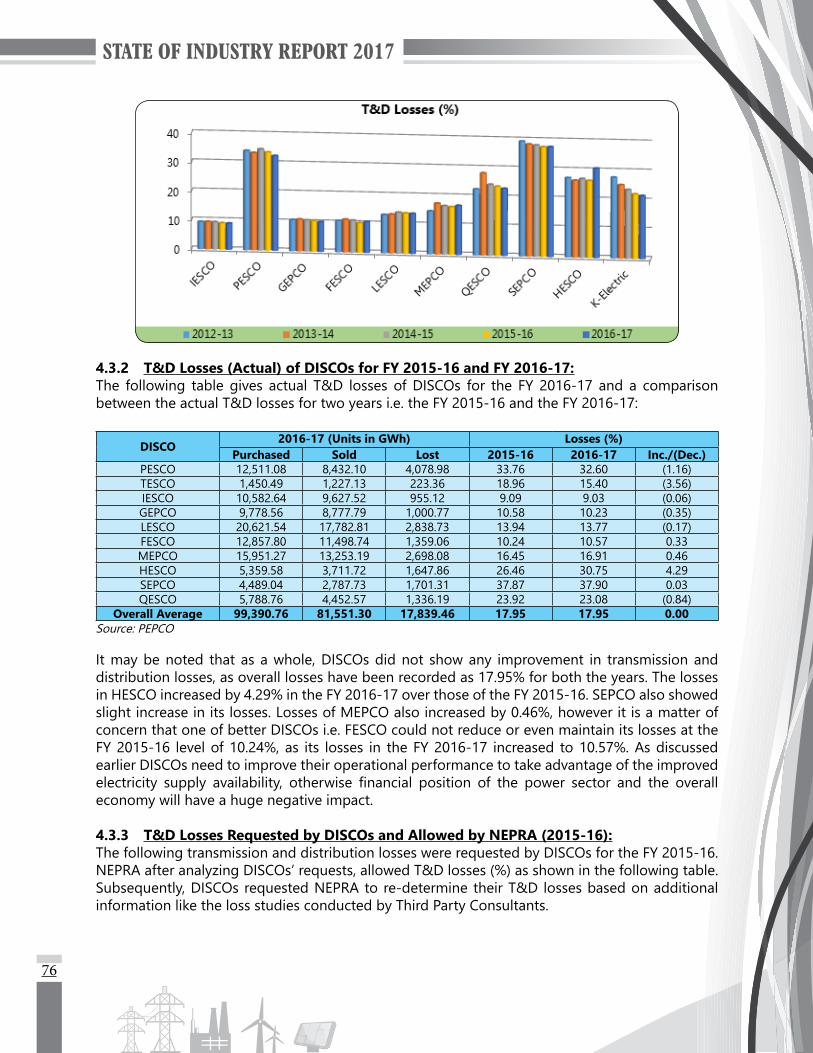
76
4.3.2 T&D Losses (Actual) of DISCOs for FY 2015-16 and FY 2016-17:The following table gives actual T&D losses of DISCOs for the FY 2016-17 and a comparison between the actual T&D losses for two years i.e. the FY 2015-16 and the FY 2016-17:
DISCO2016-17 (Units in GWh) Losses (%)
Purchased Sold Lost 2015-16 2016-17 Inc./(Dec.)PESCO 12,511.08 8,432.10 4,078.98 33.76 32.60 (1.16)TESCO 1,450.49 1,227.13 223.36 18.96 15.40 (3.56)IESCO 10,582.64 9,627.52 955.12 9.09 9.03 (0.06)GEPCO 9,778.56 8,777.79 1,000.77 10.58 10.23 (0.35)LESCO 20,621.54 17,782.81 2,838.73 13.94 13.77 (0.17)FESCO 12,857.80 11,498.74 1,359.06 10.24 10.57 0.33MEPCO 15,951.27 13,253.19 2,698.08 16.45 16.91 0.46HESCO 5,359.58 3,711.72 1,647.86 26.46 30.75 4.29SEPCO 4,489.04 2,787.73 1,701.31 37.87 37.90 0.03QESCO 5,788.76 4,452.57 1,336.19 23.92 23.08 (0.84)
Overall Average 99,390.76 81,551.30 17,839.46 17.95 17.95 0.00Source: PEPCO
It may be noted that as a whole, DISCOs did not show any improvement in transmission and distribution losses, as overall losses have been recorded as 17.95% for both the years. The losses in HESCO increased by 4.29% in the FY 2016-17 over those of the FY 2015-16. SEPCO also showed slight increase in its losses. Losses of MEPCO also increased by 0.46%, however it is a matter of concern that one of better DISCOs i.e. FESCO could not reduce or even maintain its losses at the FY 2015-16 level of 10.24%, as its losses in the FY 2016-17 increased to 10.57%. As discussed earlier DISCOs need to improve their operational performance to take advantage of the improved electricity supply availability, otherwise financial position of the power sector and the overalleconomy will have a huge negative impact.
4.3.3 T&D Losses Requested by DISCOs and Allowed by NEPRA (2015-16):The following transmission and distribution losses were requested by DISCOs for the FY 2015-16. NEPRA after analyzing DISCOs’ requests, allowed T&D losses (%) as shown in the following table. Subsequently, DISCOs requested NEPRA to re-determine their T&D losses based on additional information like the loss studies conducted by Third Party Consultants.
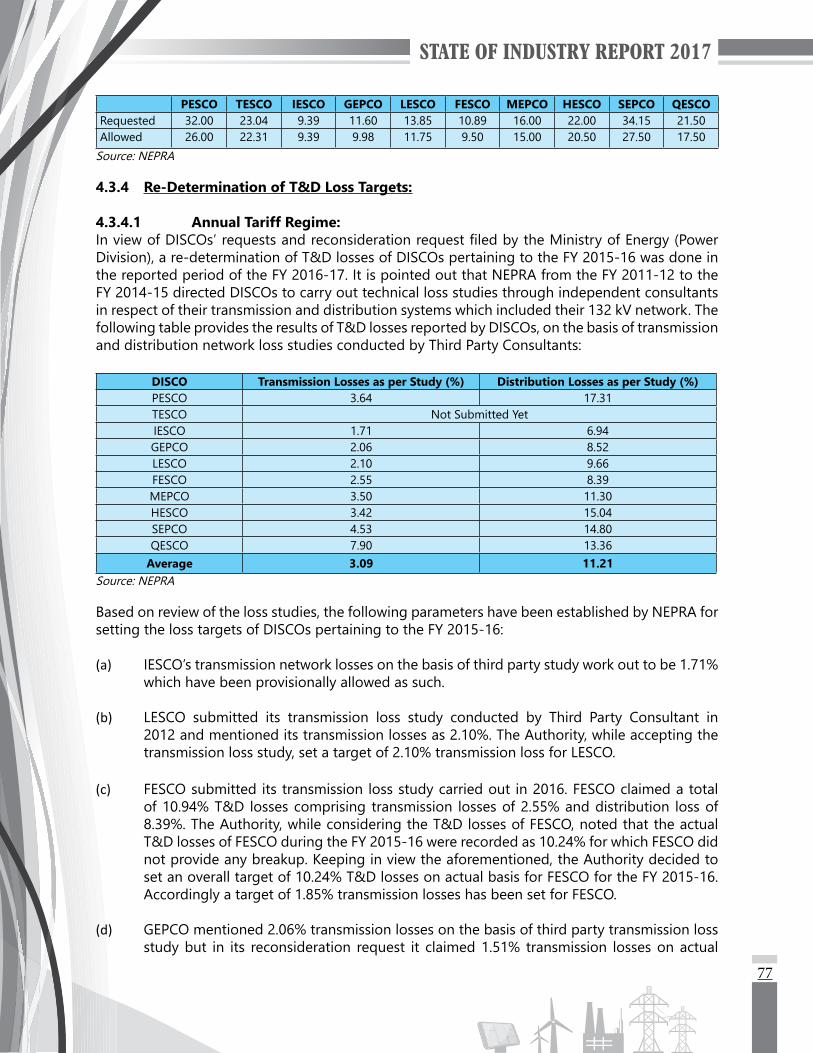
77
PESCO TESCO IESCO GEPCO LESCO FESCO MEPCO HESCO SEPCO QESCORequested 32.00 23.04 9.39 11.60 13.85 10.89 16.00 22.00 34.15 21.50Allowed 26.00 22.31 9.39 9.98 11.75 9.50 15.00 20.50 27.50 17.50
Source: NEPRA
4.3.4 Re-Determination of T&D Loss Targets:
4.3.4.1 Annual Tariff Regime:InviewofDISCOs’requestsandreconsiderationrequestfiledbytheMinistryofEnergy(PowerDivision), a re-determination of T&D losses of DISCOs pertaining to the FY 2015-16 was done in the reported period of the FY 2016-17. It is pointed out that NEPRA from the FY 2011-12 to the FY 2014-15 directed DISCOs to carry out technical loss studies through independent consultants in respect of their transmission and distribution systems which included their 132 kV network. The following table provides the results of T&D losses reported by DISCOs, on the basis of transmission and distribution network loss studies conducted by Third Party Consultants:
DISCO Transmission Losses as per Study (%) Distribution Losses as per Study (%)PESCO 3.64 17.31TESCO Not Submitted YetIESCO 1.71 6.94GEPCO 2.06 8.52LESCO 2.10 9.66FESCO 2.55 8.39MEPCO 3.50 11.30HESCO 3.42 15.04SEPCO 4.53 14.80QESCO 7.90 13.36
Average 3.09 11.21Source: NEPRA
Based on review of the loss studies, the following parameters have been established by NEPRA for setting the loss targets of DISCOs pertaining to the FY 2015-16:
(a) IESCO’s transmission network losses on the basis of third party study work out to be 1.71% which have been provisionally allowed as such.
(b) LESCO submitted its transmission loss study conducted by Third Party Consultant in 2012 and mentioned its transmission losses as 2.10%. The Authority, while accepting the transmission loss study, set a target of 2.10% transmission loss for LESCO.
(c) FESCO submitted its transmission loss study carried out in 2016. FESCO claimed a total of 10.94% T&D losses comprising transmission losses of 2.55% and distribution loss of 8.39%. The Authority, while considering the T&D losses of FESCO, noted that the actual T&D losses of FESCO during the FY 2015-16 were recorded as 10.24% for which FESCO did not provide any breakup. Keeping in view the aforementioned, the Authority decided to set an overall target of 10.24% T&D losses on actual basis for FESCO for the FY 2015-16. Accordingly a target of 1.85% transmission losses has been set for FESCO.
(d) GEPCO mentioned 2.06% transmission losses on the basis of third party transmission loss study but in its reconsideration request it claimed 1.51% transmission losses on actual

78
basis. The Authority notes that the requested transmission losses of 1.51% on actual basis are lower than the results of third party study therefore the Authority allows 1.51% transmission losses for GEPCO.
(e) MEPCO, HESCO and SEPCO claimed transmission losses of 3.50%, 3.42% and 4.53% respectively in their reconsideration requests. The Authority while reviewing the requested transmission losses noted that MEPCO, HESCO and SEPCO did not submit their third party transmission loss studies. The Authority, in the absence of third party transmission loss studies, maintained its earlier assessment of transmission losses and allowed 3.13% for MEPCO, 2.05% for HESCO and 1.95% for SEPCO.
(f) PESCO submitted its transmission loss study in 2016 and requested 3.64% transmission losses. The Authority accepted the results of the said study and allowed the same margin of 3.64% transmission losses to PESCO on provisional basis.
(g) For QESCO and TESCO, not being part of reconsideration request by Government of Pakistan, the Authority allowed its already assessed transmission losses of 4.00% and 1.03% respectively.
(h) ItwasnotedthatallDISCOsexceptMEPCO,havefinalizedtheirthirdpartystudiesduringthe FY 2015-16, and analyzed more than 85% of their HT feeders. It was noted that MEPCO had carried out technical loss studies in 2012, however the Authority did not accept the report due to quality issues. The Authority therefore set loss targets for MEPCO based on its own assessment of MEPCO system. For the present reconsideration request, since no new study was carried out by MEPCO, therefore the Authority’s set loss target has been maintained.
(i) It is noted that the third party studies in respect of transmission (132 kV) networks have been carried out by IESCO, FESCO and PESCO during the FY 2015-16, whereas LESCO and GEPCO studies were completed in 2012 (on relatively old data). MEPCO, HESCO and SEPCOhavenotfinalizedtheirtransmissionlossstudiesyet.Followingaconsistentpolicyas for distribution loss studies, all the studies by DISCOs for their transmission networks have been accepted on provisional basis.
(j) It is also observed that some of the DISCOs have achieved lower actual losses than calculated through the third party studies. For such a scenario the actual losses have been considered by NEPRA, instead of their losses through studies.
Based on the forgoing, the Authority allowed the following provisional T&D loss targets for DISCOs for the FY 2015-16:
DISCO Transmission Losses (%)
Distribution Losses (%)
Margin for Law and Order (%)
TotalLosses (%)
PESCO** 3.64 17.31 11.00 31.95TESCO** 1.03 12.47 6.50 20.00IESCO* 1.71 6.94 - 8.65
GEPCO** 1.51 8.52 - 10.03
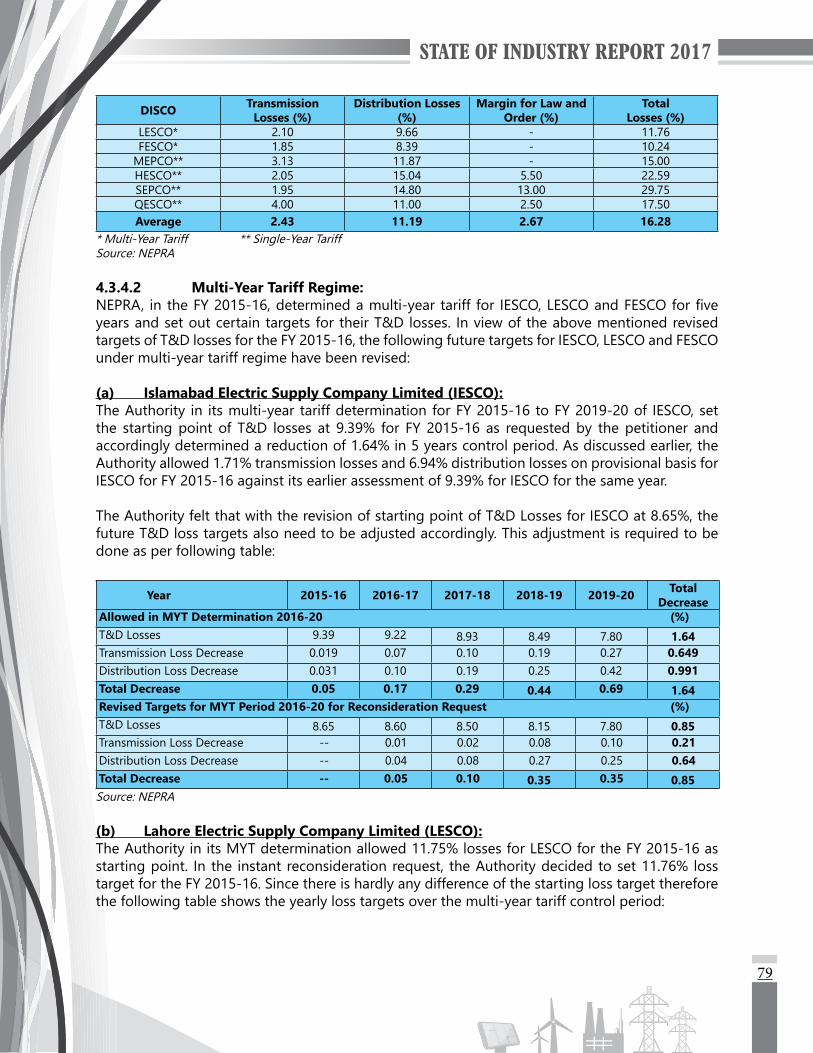
79
DISCO Transmission Losses (%)
Distribution Losses (%)
Margin for Law and Order (%)
TotalLosses (%)
LESCO* 2.10 9.66 - 11.76FESCO* 1.85 8.39 - 10.24
MEPCO** 3.13 11.87 - 15.00HESCO** 2.05 15.04 5.50 22.59SEPCO** 1.95 14.80 13.00 29.75QESCO** 4.00 11.00 2.50 17.50Average 2.43 11.19 2.67 16.28
* Multi-Year Tariff ** Single-Year TariffSource: NEPRA
4.3.4.2 Multi-Year Tariff Regime:NEPRA, in the FY 2015-16,determinedamulti-yeartariff for IESCO,LESCOandFESCOforfiveyears and set out certain targets for their T&D losses. In view of the above mentioned revised targets of T&D losses for the FY 2015-16, the following future targets for IESCO, LESCO and FESCO under multi-year tariff regime have been revised:
(a) Islamabad Electric Supply Company Limited (IESCO):The Authority in its multi-year tariff determination for FY 2015-16 to FY 2019-20 of IESCO, set the starting point of T&D losses at 9.39% for FY 2015-16 as requested by the petitioner and accordingly determined a reduction of 1.64% in 5 years control period. As discussed earlier, the Authority allowed 1.71% transmission losses and 6.94% distribution losses on provisional basis for IESCO for FY 2015-16 against its earlier assessment of 9.39% for IESCO for the same year.
The Authority felt that with the revision of starting point of T&D Losses for IESCO at 8.65%, the future T&D loss targets also need to be adjusted accordingly. This adjustment is required to be done as per following table:
Year 2015-16 2016-17 2017-18 2018-19 2019-20 TotalDecrease
Allowed in MYT Determination 2016-20 (%)T&D Losses 9.39 9.22 8.93 8.49 7.80 1.64Transmission Loss Decrease 0.019 0.07 0.10 0.19 0.27 0.649Distribution Loss Decrease 0.031 0.10 0.19 0.25 0.42 0.991Total Decrease 0.05 0.17 0.29 0.44 0.69 1.64Revised Targets for MYT Period 2016-20 for Reconsideration Request (%)T&D Losses 8.65 8.60 8.50 8.15 7.80 0.85Transmission Loss Decrease -- 0.01 0.02 0.08 0.10 0.21Distribution Loss Decrease -- 0.04 0.08 0.27 0.25 0.64Total Decrease -- 0.05 0.10 0.35 0.35 0.85Source: NEPRA
(b) Lahore Electric Supply Company Limited (LESCO):The Authority in its MYT determination allowed 11.75% losses for LESCO for the FY 2015-16 as starting point. In the instant reconsideration request, the Authority decided to set 11.76% loss target for the FY 2015-16. Since there is hardly any difference of the starting loss target therefore the following table shows the yearly loss targets over the multi-year tariff control period:

80
Year 2015-16 2016-17 2017-18 2018-19 2019-20 TotalDecrease
Allowed in MYT Determination 2016-20 (%)T&D Losses 11.75 10.88 10.03 9.08 8.00 3.75Transmission Loss Decrease -- 0.12 0.06 0.08 0.09 0.35Distribution Loss Decrease -- 0.75 0.79 0.87 0.99 3.40Total Decrease -- 0.87 0.85 0.95 1.08 3.75Revised Targets for MYT Period 2016-20 for Reconsideration Request (%)T&D Losses 11.76 10.88 10.03 9.08 8.00 3.76Transmission Loss Decrease -- 0.05 0.08 0.10 0.12 0.35Distribution Loss Decrease -- 0.83 0.77 0.85 0.96 3.41Total Decrease -- 0.88 0.85 0.95 1.08 3.76
Source: NEPRA
(c) Faisalabad Electric Supply Company Limited (FESCO):The Authority determined 9.50% losses as starting point for FESCO in its multi-year tariff determination and assessed a reduction of 1.40% over 5 years control period. The Authority noted that FESCO’s actual losses were 10.24% for the FY 2015-16; less than the results of the third party loss studies i.e. 10.94%. The following table shows the yearly reductions in T&D losses of FESCO:
Year 2015-16 2016-17 2017-18 2018-19 2019-20 TotalDecrease
Allowed in MYT Determination 2016-20 (%)T&D Losses 9.50 9.36 9.02 8.60 8.10 1.40Transmission Loss Decrease -- 0.04 0.04 0.15 0.05 0.28Distribution Loss Decrease -- 0.10 0.30 0.27 0.45 1.12Total Decrease -- 0.14 0.34 0.42 0.50 1.40Revised Targets for MYT Period 2016-20 for Reconsideration Request (%)T&D Losses 10.24 10.10 9.76 9.34 8.84 1.40Transmission Loss Decrease -- 0.04 0.04 0.10 0.10 0.28Distribution Loss Decrease -- 0.10 0.30 0.32 0.40 1.12Total Decrease -- 0.14 0.34 0.42 0.50 1.40
Source: NEPRA
4.4 RECOVERY POSITION OF DISCOsThe following table shows a comparison of recovery ratios for all the DISCOs for the two years. It may be seen that apart from HESCO, PESCO and IESCO who improved upon their recovery position, none of the other DISCOs was able to improve its position over the previous year. LESCO managed to stay at the same level of good recovery ratio in the FY 2016-17, whereas FESCO, MEPCO and GEPCO could not match their performance of the last year as their recovery dropped by approximately 3% during the FY 2016-17. QESCO’s recovery position deteriorated drastically during the FY 2016-17 as only 43.55% of the amount billed was recovered. SEPCO though showed more than 100% recovery but in fact it is due to certain adjustment made with the Government of Sindhwhichhasinflatedthetruerecoveryfortheyear.
(%)
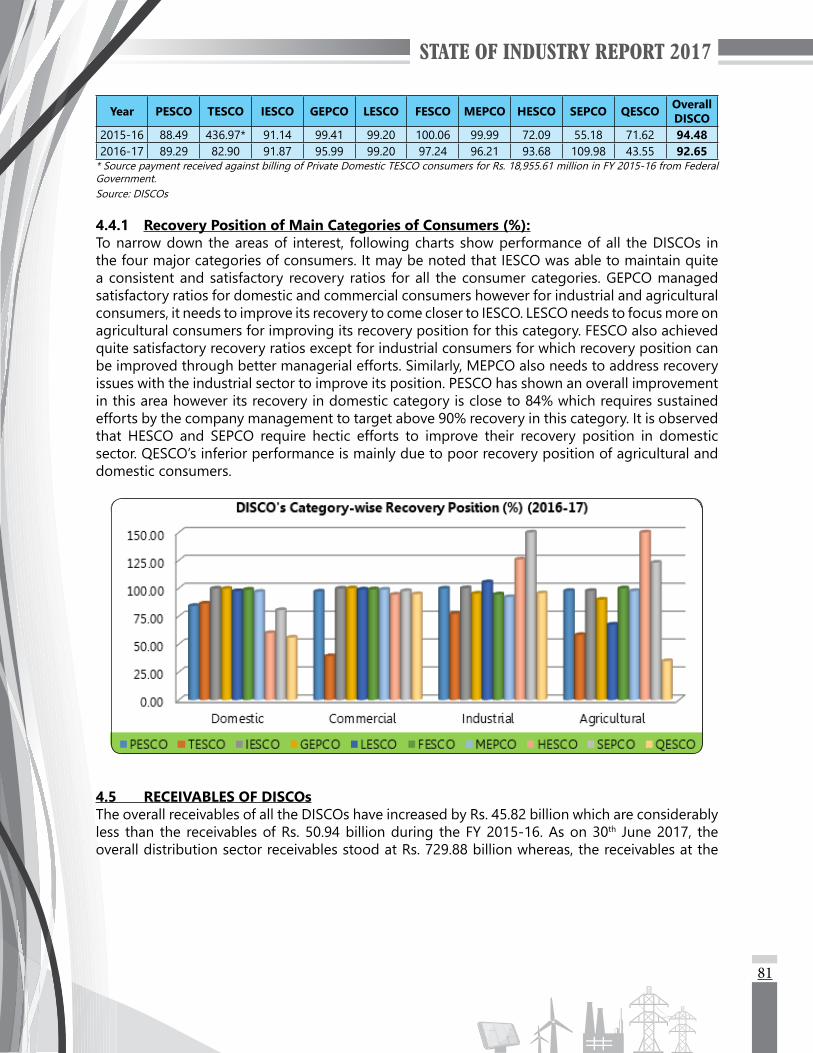
81
Year PESCO TESCO IESCO GEPCO LESCO FESCO MEPCO HESCO SEPCO QESCO OverallDISCO
2015-16 88.49 436.97* 91.14 99.41 99.20 100.06 99.99 72.09 55.18 71.62 94.482016-17 89.29 82.90 91.87 95.99 99.20 97.24 96.21 93.68 109.98 43.55 92.65
* Source payment received against billing of Private Domestic TESCO consumers for Rs. 18,955.61 million in FY 2015-16 from Federal Government.Source: DISCOs
4.4.1 Recovery Position of Main Categories of Consumers (%):To narrow down the areas of interest, following charts show performance of all the DISCOs in the four major categories of consumers. It may be noted that IESCO was able to maintain quite a consistent and satisfactory recovery ratios for all the consumer categories. GEPCO managed satisfactory ratios for domestic and commercial consumers however for industrial and agricultural consumers, it needs to improve its recovery to come closer to IESCO. LESCO needs to focus more on agricultural consumers for improving its recovery position for this category. FESCO also achieved quite satisfactory recovery ratios except for industrial consumers for which recovery position can be improved through better managerial efforts. Similarly, MEPCO also needs to address recovery issues with the industrial sector to improve its position. PESCO has shown an overall improvement in this area however its recovery in domestic category is close to 84% which requires sustained efforts by the company management to target above 90% recovery in this category. It is observed that HESCO and SEPCO require hectic efforts to improve their recovery position in domestic sector. QESCO’s inferior performance is mainly due to poor recovery position of agricultural and domestic consumers.
4.5 RECEIVABLES OF DISCOsThe overall receivables of all the DISCOs have increased by Rs. 45.82 billion which are considerably less than the receivables of Rs. 50.94 billion during the FY 2015-16. As on 30th June 2017, the overall distribution sector receivables stood at Rs. 729.88 billion whereas, the receivables at the

82
startofthisfinancialyearwereRs.684.06billion.Followingisadetailedbreak-upofreceivablesfor the FY 2016-17:
Break-up of Receivables of DISCOs Financial Year ended June, 2017 (Rs. in Billion)
S.No. Category
Receivables (FY ended
June, 2016)
July, 2016to June, 2017
Receivables(FY ended
June, 2017)Billing Collection1 FEDERAL GOVERNMENTa) Federal Governments Departments 0.02 12.75 12.46 0.59b) Local Bodies under Federal Govt. 1.04 4.40 4.79 0.73c) Autonomous Bodies under Fed. Govt. 1.66 6.51 6.34 1.84d) Defence -0.10 16.09 15.79 0.19e) W&P 1.38 1.34 1.15 1.55
Total (Federal Government) 4.00 41.08 40.53 4.882 AJ&K GOVERNMENTi) GoP Share 0.40 0.00 0.00 0.40ii) DISCOs Share 0.00 0.00 0.00 0.00iii) AJ&K Share 65.07 19.43 4.15 80.35
Total (AJ&K) 65.47 19.43 4.15 80.753 PROVINCIAL GOVT. DEPARTMENTS/AGENCIESa) Punjab 1.84 21.12 21.51 1.63b) Khyber Pakhtunkhwa 19.41 6.08 5.60 19.65c) Sindh 73.44 13.04 36.37 1.35d) Balochistan 4.94 5.02 3.20 6.75
Total (Provi. Govt. Deptts./Agencies) 99.62 45.35 66.68 29.39TOTAL (1 TO 3) 169.62 105.87 111.36 115.02
4 FATA (DOMESTIC CONSUMERS) 20.60 11.55 9.97 22.185 AGRICULTURAL TUBE WELLS IN BALOCHISTANi) GoP Share 11.75 7.22 1.68 17.29ii) GOB Share 13.61 10.83 12.32 12.11iii) GST Subsidy Agri. Tube well Balochistan 0.12 0.00 0.00 0.12iv) Consumers Share @ Rs. 4,000/- 127.22 29.81 1.23 155.79
Total (Agri. Tube wells in Balochistan) 152.69 47.85 15.23 185.306 PRIVATE (Including 4+5) 468.71 905.68 819.60 554.797 IPPS 0.03 1.79 1.57 0.018 K-ELECTRIC LIMITED 46.24 44.83 30.99 60.07
GRAND TOTAL (3+6+7+8) 684.06 1058.16 963.51 729.88Source: PEPCO
During the reporting year, receivables for the Federal Government have increased by Rs. 0.88 billionascomparedtopreviousfinancialyear.AdrasticdecreaseisnotedinthereceivablesagainstGoS i.e. Rs. 73.44 billion in the FY 2015-16 to Rs. 1.35 billion in the FY 2016-17. It is noted that certain portion of receivables against GoS for the period from the year 2010 to the year 2016 were waivedoffbytheBoardofDirectors,followingameetingwithofficialsofGoS.ThereceivablesofProvincialGovernmentsofKhyberPakhtunkhwaandBalochistanhaveincreasedinthisfinancialyear whereas the receivables for Provincial Government of Punjab have slightly decreased. In addition, FATA receivables from domestic consumers have increased from Rs. 20.60 billion in the FY 2015-16 to Rs. 22.18 billion in the FY 2016-17. The receivables for KEL in the FY 2016-17 have increased by Rs. 13.83 billion, whereas, during the FY 2015-16 the receivables increased by Rs. 2.27 billion.4.6 OVERLOADING IN DISCOs SYSTEMPower delivery through DISCOs’ networks mainly depends on the adequacy of three major components including power transformers (mostly 132/11 kV transformers), 11 kV feeders and
83
finally thedistribution transformers. The following tablesprovidea comparisonofoverloadedcomponents in all DISCOs for the FY 2015-16 and the FY 2016-17.
4.6.1 Loading Position of Power Transformers:On an overall country basis overloading on power transformers has slightly reduced in the FY 2016-17 from that of the FY 2015-16 but it is still very high as 36.82% of the total power transformers in the DISCOs are overloaded pointing to potential problems. On DISCO to DISCO comparison, FESCO and QESCO have more than their 50% power transformers overloaded above 80%, followed by HESCO, PESCO and SEPCO having more than 40% of their transformers overloaded.
DISCOTotal No. of Power
Transformers*Total No. of Over-Loaded Power
Transformers (above 80%)Percentage of Total Over-Loaded Power Transformers (above 80%)
2015-16 2016-17 2015-16 2016-17 2015-16 2016-17PESCO 220 230 124 113 56.36 49.13TESCO 35 38 14 13 40.00 34.21IESCO 194 202 37 24 19.07 11.88GEPCO 154 160 63 34 40.91 21.25LESCO 333 351 151 127 45.35 36.18FESCO 188 195 107 100 56.91 51.28MEPCO 269 282 118 75 43.87 26.60HESCO 109 119 74 59 67.89 49.58SEPCO 116 118 33 53 28.45 44.92QESCO 125 133 66 75 52.80 56.39Total 1,743 1,828 787 673 45.15 36.82
* Power Transformers include 132 kV, 66 kV and 33 kV voltage level.Source: DISCOs
4.6.2 Loading Position of 11 kV Feeders:Country-wise overloading on 11 kV feeders has slightly increased, as 29.00% of the total feeders are loaded above 80% compared to 28.14% last year. On DISCO level, PESCO and TESCO have the highest percentage (more than 50%) of overloaded feeders, followed by QESCO, SEPCO, MEPCO and LESCO (more than 30%).
DISCOTotal No. of 11 kV
FeedersTotal No. of Over-Loaded
11 kV Feeders (above 80%)Percentage of Total Over-Loaded 11
kV Feeders (above 80%)2015-16 2016-17 2015-16 2016-17 2015-16 2016-17
PESCO 907 946 396 485 43.66 51.27TESCO 195 203 174 191 89.23 94.09IESCO 1,036 1,058 72 27 6.95 2.55GEPCO 779 805 167 88 21.44 10.93LESCO 1,580 1,650 350 548 22.15 33.21FESCO 936 998 189 159 20.19 15.93MEPCO 1,165 1,241 428 433 36.74 34.89HESCO 435 463 103 121 23.68 26.13SEPCO 453 462 179 167 39.51 36.15QESCO 613 628 221 233 36.05 37.10Total 8,099 8,454 2,279 2,452 28.14 29.00
Source: DISCOs
84
4.6.3 Loading Position of Distribution Transformers:Overloading of distribution transformers in case of LESCO at 30.13% is the highest among DISCOs, followed by PESCO and SEPCO.
DISCO
Total No. of Distribution Transformers
Total No. of Over-Loaded Distribution Transformers
(above 80%)
Percentage of TotalOver-Loaded Distribution Transformers (above 80%)
2015-16 2016-17 2015-16 2016-17 2015-16 2016-17PESCO 60,365 72,078 19,311 21,033 31.99 29.18TESCO 15,634 16,612 174 191 1.11 1.15IESCO 45,438 46,359 3,105 2,868 6.83 6.19GEPCO 60,080 61,661 1,548 1,475 2.58 2.39LESCO 97,048 100,718 41,952 30,350 43.23 30.13FESCO 97,761 100,276 3,285 1,843 3.36 1.84MEPCO 152,806 156,460 7,105 8,128 4.65 5.19HESCO 35,334 35,996 8,336 3,340 23.59 9.28SEPCO 35,029 35,875 6,443 7,424 18.39 20.69QESCO 53,646 55,770 8,743 8,873 16.30 15.91Total 653,141 681,805 100,002 85,525 15.31 12.54
Source: DISCOs
From above it is noted that although PESCO, SEPCO, TESCO and QESCO have generally been accepted as those DISCOs, which have consistently shown poor performance levels, what is more worrying however, is that according to the above statistics, the so called better performers like LESCO and MEPCO have a poor record for 11 kV overloaded feeders. LESCO has the worst record of overloading of distribution transformers. Similarly FESCO has very serious issues to tackle with the overloading of its power transformers. Considering the share of these DISCOs in the overall energy consumption, further delays in overcoming these issues will be disastrous for the power sector.
4.6.4 Province-wise Loading Positions:Province-wise statistics of overloading position (above 80%) for June, 2017 is shown in the following table:
Description Punjab Sindh Khyber Pakhtunkhwa Balochistan Total
No. of 132 kV Grid Stations (including consumer owned) 490 120 86 64 760
Total No. of Power Transformers* 1,190 237 268 133 1,828Over-Loaded Power Transformers (Nos.)* 360 112 126 75 673Over-Loaded Power Transformers (%)* 30.25 47.26 47.01 56.39 36.82Total No. of 11 kV Feeders 5,752 925 1,149 628 8,454Over-loaded 11 kV Feeders (Nos.) 1,255 288 676 233 2,452Over-loaded 11 kV Feeders (%) 21.82 31.13 58.83 37.10 29.00Total No. of Distribution Transformers 465,474 71,871 88,690 55,770 681,805Over-loaded Distribution Transformers (Nos.) 44,664 10,764 21,224 8,873 85,525Over-loaded Distribution Transformers (%) 9.60 14.98 23.93 15.91 12.54
* Power Transformers include 132 kV, 66 kV and 33 kV voltage level.
Source: DISCOs

85
4.7 FUEL PRICE ADJUSTMENT OF DISCOsNEPRA as per its mandate protects the electricity consumers, by passing on any applicable relief on monthly basis on account of actual fuel costs adjustments. The following table shows a month-wise per unit relief, passed on to the consumers for the FY 2016-17:
(Rs./kWh)Jul Aug Sep Oct Nov Dec Jan Feb Mar Apr May Jun
(2.49) (2.56) (2.77) (2.61) (3.61) (2.22) (3.31) (2.15) (2.15) (1.96) (1.75) (2.24)Source: NEPRA
4.8 STATUS OF DIGITIZED MAPPING OF DISTRIBUTION NETWORK OF DISCOs AND K-ELECTRIC LIMITED
The following table describes the updated status of digitized mapping of distribution network (11 kV feeders) of all DISCOs including KEL as per requirement of Article 3 of Distribution Licence.
DISCO Total Completed Remaining Progress (%)PESCO 924 457 458 49.57IESCO 1,020 268 559 26.27GEPCO 794 704 90 88.66LESCO 1,636 1,222 414 74.69FESCO 942 873 69 92.68MEPCO 1,207 1,009 198 83.60HESCO 461 305 156 66.16SEPCO 445 211 234 47.42QESCO 602 77 525 12.79
KEL 1,608 1,583 25 98.45Source: DISCOs/KEL
4.9 LOADING POSITION OF POWER TRANSFORMERS, 11 KV FEEDERS AND DISTRIBUTION TRANSFORMERS IN K-ELECTRIC LIMITED SYSTEM
The following table provides overloading positions of overloaded components in KEL for the FY 2015-16 and the FY 2016-17:
Description 2015-16 2016-17Total No. of Over-Loaded Power Transformers (above 80%) 31 59Percentage of Total Over-Loaded Power Transformers (above 80%) 22.63 42.75Total No. of Over-Loaded 11 kV Feeders (above 80%) 104 91Percentage of Total Over-Loaded 11 kV Feeders (above 80%) 6.82 5.51Total No. of Over-Loaded Distribution Transformers (above 80%) 648 551Percentage of Total Over-Loaded Distribution Transformers (above 80%) 2.78 2.15
Source: KEL
It is noted that more than 40% power transformers of KEL are overloaded in the FY 2016-17, whereas in the FY 2015-16 approximately 22% transformers were noted to be operating above 80% of their rated capacity. It may be concluded that KEL has not added enough power transformers in its network to maintain at least the same ratio of overloaded transformers as of last year, whereas it was required to a system capable of providing a reliable supply at all times for consumers. KEL’s failure to add adequate number of power transformers was among the major reasons for frequent tripping and prolonged load shed hours during the FY 2016-17.
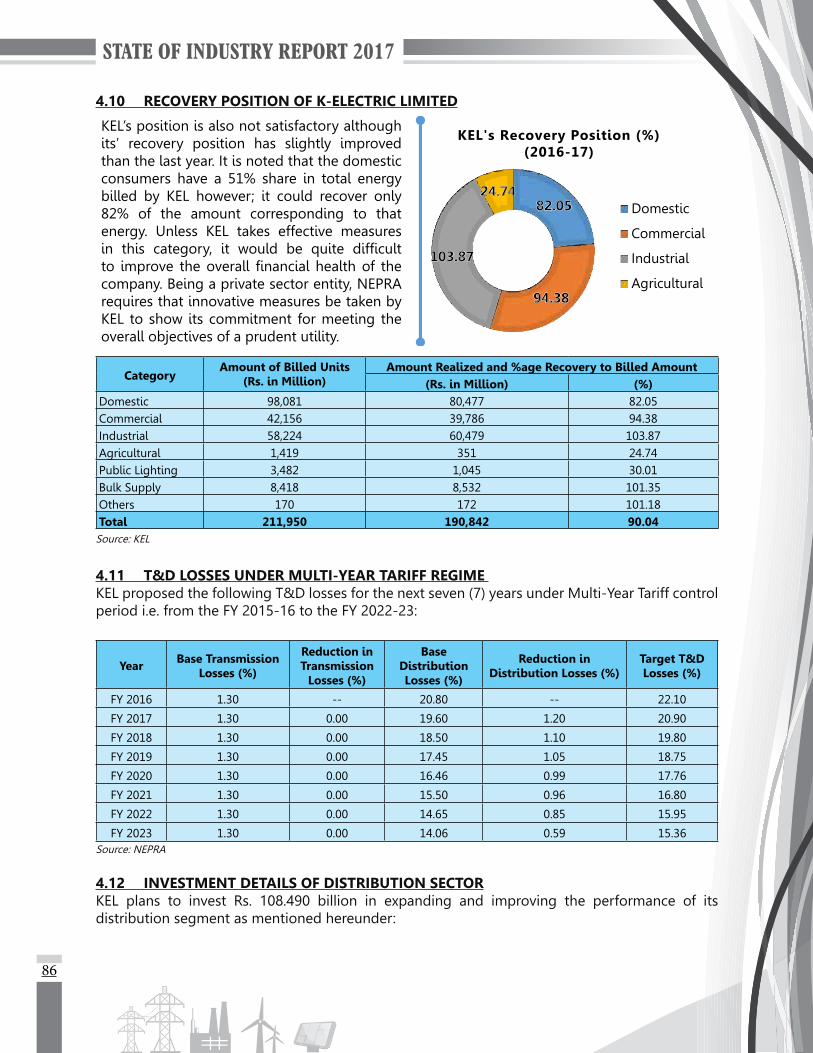
86
4.10 RECOVERY POSITION OF K-ELECTRIC LIMITED
KEL’s position is also not satisfactory although its’ recovery position has slightly improved than the last year. It is noted that the domestic consumers have a 51% share in total energy billed by KEL however; it could recover only 82% of the amount corresponding to that energy. Unless KEL takes effective measures in this category, it would be quite difficult to improve the overall financial health of the company. Being a private sector entity, NEPRA requires that innovative measures be taken by KEL to show its commitment for meeting the overall objectives of a prudent utility.
CategoryAmount of Billed Units
(Rs. in Million)Amount Realized and %age Recovery to Billed Amount
(Rs. in Million) (%)Domestic 98,081 80,477 82.05Commercial 42,156 39,786 94.38Industrial 58,224 60,479 103.87Agricultural 1,419 351 24.74Public Lighting 3,482 1,045 30.01Bulk Supply 8,418 8,532 101.35Others 170 172 101.18Total 211,950 190,842 90.04
Source: KEL
4.11 T&D LOSSES UNDER MULTI-YEAR TARIFF REGIME KEL proposed the following T&D losses for the next seven (7) years under Multi-Year Tariff control period i.e. from the FY 2015-16 to the FY 2022-23:
YearBase Transmission
Losses (%)
Reduction in Transmission
Losses (%)
Base Distribution Losses (%)
Reduction inDistribution Losses (%)
Target T&D Losses (%)
FY 2016 1.30 -- 20.80 -- 22.10
FY 2017 1.30 0.00 19.60 1.20 20.90
FY 2018 1.30 0.00 18.50 1.10 19.80
FY 2019 1.30 0.00 17.45 1.05 18.75
FY 2020 1.30 0.00 16.46 0.99 17.76
FY 2021 1.30 0.00 15.50 0.96 16.80
FY 2022 1.30 0.00 14.65 0.85 15.95
FY 2023 1.30 0.00 14.06 0.59 15.36Source: NEPRA
4.12 INVESTMENT DETAILS OF DISTRIBUTION SECTORKEL plans to invest Rs. 108.490 billion in expanding and improving the performance of its distribution segment as mentioned hereunder:

87
Distribution Capex Plan
LossReduction Growth Preventive and
Corrective MaintenanceSmart
NetworkTotal
(Rs. Million)2017 2,432 3,103 1,607 564 7,7072018 2,486 3,189 1,558 554 7,7872019 2,677 3,265 1,565 637 8,1442020 2,791 4,029 1,596 677 9,0942021 3,393 5,137 1,785 1,050 11,3662022 4,055 5,029 1,973 1,820 12,8772023 4,128 4,400 1,933 2,033 12,4942024 3,653 5,008 1,800 2,128 12,5892025 3,765 5,195 1,854 2,244 13,0572026 3,880 5,275 1,909 2,312 13,376Total 33,259 43,631 17,581 14,019 108,490
Source: KEL
NEPRA allowed the following investments (Million Rs.) for KEL’s distribution networks for Multi-Year Tariff control period from the FY 2016-17 to the FY 2022-23:
Year Loss Reduction Growth Maintenance Smart Network Grand Total2016-17 2,432 3,103 1,607 564 7,7062017-18 2,486 3,189 1,558 554 7,7872018-19 2,677 3,265 1,565 637 8,1442019-20 2,791 4,029 1,596 677 9,0932020-21 3,93 5,137 1,785 1,050 11,3652021-22 4,055 5,029 1,973 1,820 12,8772022-23 4,128 4,400 1,933 2,033 12,494
Total 21,962 28,152 12,017 7,335 69,466Source: NEPRA
In addition to above, KEL also proposed investment of Rs. 600 million each year i.e. Rs. 4,200 million for the seven (7) year control period as “Other Capital Expenditure”, which includes the investments pertainingtoITinfrastructure,hardware,civilworks,furniture,fixturesandequipment’sasdetailedhereunder:
Description 2016-17 2017-18 2018-19 2019-20 2020-21 2021-22 2022-23 Grand Total
IT infrastructure, Hardware and Others 172 172 172 172 172 172 172 1,204
Civil Works, Furniture, Fixture and Equipment 428 428 428 428 428 428 428 2,996
Total 600 600 600 600 600 600 600 4,200
Source: KEL
4.13 PERFORMANCE UNDER NEPRA STANDARDS
4.13.1 DISCOs’ Performance under NEPRA Standards:Following tables and graphs show the performance of DISCOs under different parameters for the FY 2016-17 along with comparison of last four years:System Average Interruption Frequency Index (SAIFI-No.):

88
DISCO 2012-13 2013-14 2014-15 2015-16 2016-17PESCO 341.57 316.45 315.40 261.65 160.60IESCO 0.62 0.05 0.036 0.03 0.029GEPCO 27.14 10.53 10.41 35.44 3.26LESCO 50.57 78.04 52.49 45.79 37.44FESCO 56.80 35.40 46.54 32.41 39.99MEPCO 149.68 201.53 177.61 203.00 235.00HESCO 730.38 229.93 202.33 184.00 188.40SEPCO 4,177.68 251.48 227.96 216.71 601.37QESCO 153.82 144.95 112.58 107.00 96.92
Source: DISCOs
System Average Interruption Duration Index (SAIDI-Minutes):DISCO 2012-13 2013-14 2014-15 2015-16 2016-17PESCO 29,570.37 27,946.60 27,934.98 24,927.12 14,643.00IESCO 34.80 1.66 0.10 0.82 0.79GEPCO 263.22 13.14 13.20 59.49 55.03LESCO 4,615.74 4,759.61 3,010.29 2,926.29 5,595.63FESCO 1,250.66 1,137.02 2,682.58 1,714.00 1,532.04MEPCO 12,813.89 17,704.58 15,677.65 17,592.00 20,411.32HESCO 21,204.64 16,678.66 10,642.74 12,623.00 12,799.12SEPCO 4,799.92 2,442.73 2,141.36 1,879.37 5,666.01QESCO 12,634.96 11,868.07 7,506.81 7,290.00 8,310.40
Source: DISCOs
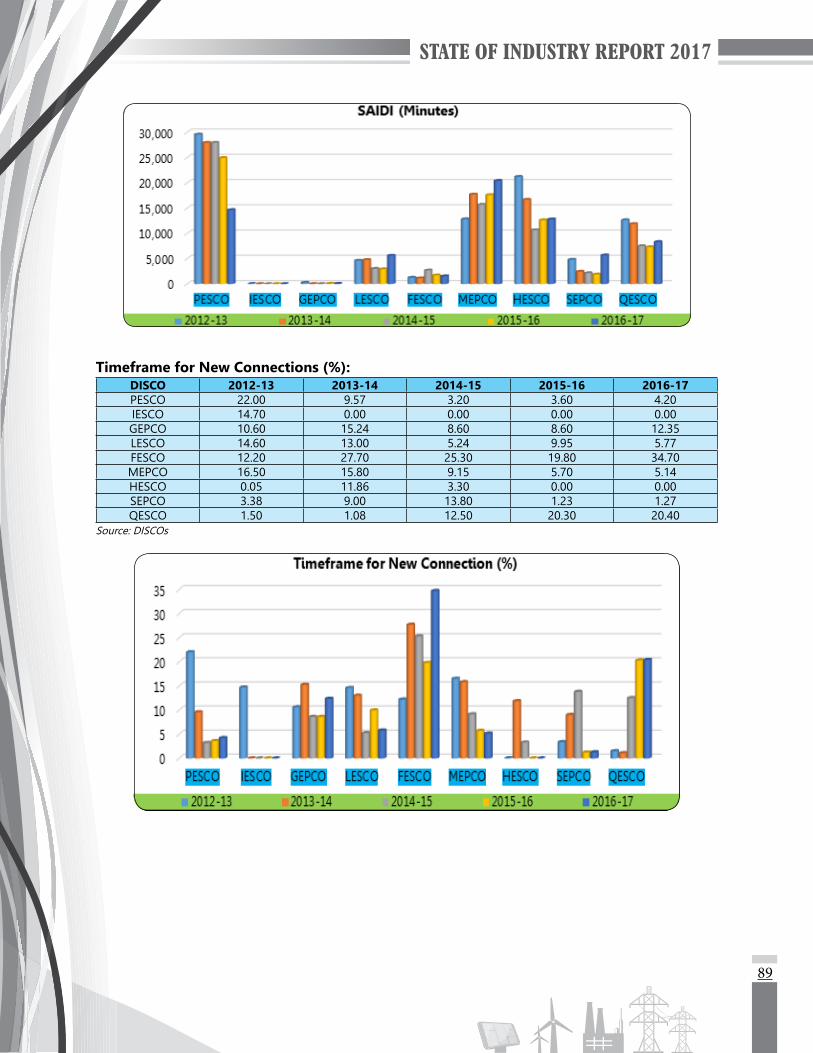
89
Timeframe for New Connections (%):DISCO 2012-13 2013-14 2014-15 2015-16 2016-17PESCO 22.00 9.57 3.20 3.60 4.20IESCO 14.70 0.00 0.00 0.00 0.00GEPCO 10.60 15.24 8.60 8.60 12.35LESCO 14.60 13.00 5.24 9.95 5.77FESCO 12.20 27.70 25.30 19.80 34.70MEPCO 16.50 15.80 9.15 5.70 5.14HESCO 0.05 11.86 3.30 0.00 0.00SEPCO 3.38 9.00 13.80 1.23 1.27QESCO 1.50 1.08 12.50 20.30 20.40
Source: DISCOs

90
Average Daily Load-Shedding (Hrs.):DISCO 2012-13 2013-14 2014-15 2015-16 2016-17PESCO 4.80 4.80 2.50 2.30 3.20IESCO 5.60 5.00 4.00 3.43 3.33GEPCO 3.20 3.20 4.00 4.00 3.25LESCO 0.66 3.50 2.33 1.67 2.00FESCO 7.80 7.25 4.33 3.50 3.23MEPCO 9.00 10.00 4.25 3.20 3.35HESCO 7.30 3.75 4.00 3.33 4.50SEPCO 2.00 2.00 1.00 1.00 2.25QESCO 11.13 10.50 3.40 2.83 3.88
Source: DISCOs
Nominal Voltage (Number of consumers who made complaint about voltage):DISCO 2012-13 2013-14 2014-15 2015-16 2016-17PESCO 37,932 43,787 37,704 38,635 19,564IESCO 6,124 6,457 5,710 6,508 6,890GEPCO 3,048 3,325 3,744 3,906 5,071LESCO 8,922 25,504 8,363 17,631 10,887FESCO 6,089 9,169 9,223 10,488 4,127MEPCO 0 0 0 0 0HESCO 1,496 1,743 681 186 201SEPCO 0 0 0 0 1,033QESCO 3,897 4,022 144 4,273 4,355
Source: DISCOs

91
Consumer Service Complaints (No.):DISCO 2012-13 2013-14 2014-15 2015-16 2016-17PESCO 116,718 104,812 102,859 103,983 441,951IESCO 63,712 66,739 62,167 63,831 46,587GEPCO 532,925 1,123,731 841,178 826,226 824,816LESCO 558,090 1,163,927 227,596 1,548,464 1,245,699FESCO 236,850 248,241 392,399 353,019 496,176MEPCO 103,454 93,198 91,373 73,296 74,869HESCO 8,613 45,794 5,696 56,602 61,925SEPCO 8,813 12,051 8,857 8,516 9,085QESCO 65,640 50,811 41,952 5,198 52,211Total 1,711,571 3,418,814 2,231,563 3,520,196 5,928,587
Source: DISCOs

92
Safety (No. of Fatal Accidents for both Employees and Public):DISCO 2012-13 2013-14 2014-15 2015-16 2016-17PESCO 25 20 29 23 20IESCO 10 12 15 19 15GEPCO 10 12 15 12 16LESCO 14 35 24 24 29FESCO 26 29 29 15 15MEPCO 12 17 34 20 10HESCO 07 14 22 24 03SEPCO 03 45 34 17 20QESCO 07 02 20 5 11Total 123 192 226 172 147
Source: DISCOs
Fault Rate (Faults/km):DISCO 2012-13 2013-14 2014-15 2015-16 2016-17PESCO 0.88 0.88 0.78 0.93 0.86IESCO 4.25 4.65 2.62 7.20 1.41GEPCO 21.59 21.58 3.12 2.97 3.04LESCO 2.28 50.60 7.79 10.48 2.99FESCO 2.13 2.20 1.78 1.99 1.64MEPCO 2.11 2.81 2.72 3.35 4.06HESCO 1.40 1.92 0.78 0.89 1.696SEPCO 5.90 2.10 2.004 1.58 3.12QESCO 0.70 0.835 0.59 0.53 0.49
Source: DISCOs

93
4.13.2 Performance of K-Electric Limited under NEPRA Standards:Following table and graphs show the performance of KEL under different parameters for the FY 2016-17 along with comparison of last four years:
Description 2012-13 2013-14 2014-15 2015-16 2016-17System Average
Interruption Frequency Index (SAIFI-No.)
31.27 24.71 22.21 20.52 19.60
System Average Interruption Duration Index (SAIDI-Minutes)
1,790.43 1,495.25 1,330.30 1,210.00 1,142.50
Timeframe for New Connections (%) 40.70 13.20 4.80 1.90 8.00
Average Daily Load-Shedding (Hrs.) 2.40 2.30 1.10 1.33 2.50
Nominal Voltage* 15,498 19,408 258 253 293
Consumer Service Complaints (No.) 16,756 509,510 457,486 481,061 2,675,268
Safety** 09 05 04 13 08
Fault Rate (Faults/km) 1.95 1.96 1.55 1.39 0.95* Number of Consumers who made Complaint about Voltage.** Number of Fatal Accidents for both Employees and Public.Source: KEL
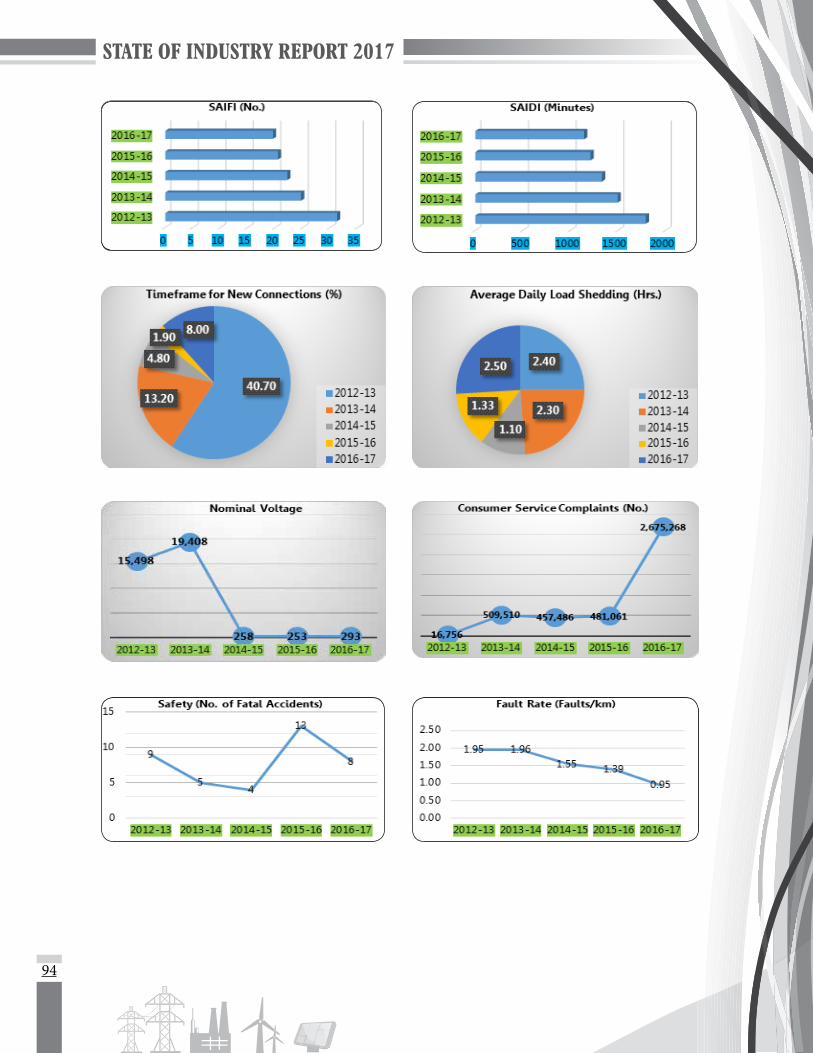
94

STATE OF INDUSTRY REPORT 2017
MONITORING OF THE SECTOR


97
MONITORING OF THE SECTOR
5.1 GENERALIn the following sections, details about monitoring and enforcement by NEPRA of its licensees and their compliance with the relevant rules and regulations, terms and conditions of the licence and otherapplicabledocumentsarepresented.Keyfindingsincludethefollowing:
(a) Generation data of power plants (Hydel, Thermal and IPPs etc.) provided by (NPCC and KEL was analyzed on daily basis and daily reports were prepared about Demand and Supply position of NTDC and KEL Systems. Furthermore, instructions/letters were also issued to the management of various power plants, for remedial measures and compliance with the directions of the Authority contained in the Generation licences of GENCOs, IPPs, WAPDA Hydel and KEL was ensured. In this respect various formats were developed for converting the data received from different formations for effective review and analysis.
(b) Based on the performance analysis of public sector power plants and keeping in view the new generation capacity addition by the year 2018, CEO of GENCO Holding Company Limited (GHCL) was directed to prepare a detailed plan of phasing out old/un-economical and un-serviceable generating units, which have completed their useful lives. Further actions are being considered by NEPRA under its relevant rules and regulations.
(c) The analysis of energy produced through public sector GENCOs and evacuation of power showed underutilization of power plants. Concerns of the Authority in this respect were conveyed through various letters and directions to NTDC/NPCC about less generation and under-utilization of various power plants as well as delayed developmental works by NTDC. NTDC was directed for submission of detailed reports regarding under-utilization of various power plants and steps taken by it to mitigate the irritants causing non-operation of plants at maximum capacity.
(d) Explanations were issued to public sector GENCOs about their excessive auxiliary power consumption and underutilization/reduction in net capacity of their generation facilities, poor maintenance of generation plants and equipment thereby violating the provisions of the Act and applicable documents etc.
(e) NEPRA also issued Explanation under NEPRA (Fines) Rules, 2002 to NTDC for non-implementation of Authority’s directives regarding optimal generation dispatch as well as maximumcapacityutilizationofefficientpowergenerationplants.
(f) Various advisories were also sent to Ministry of Energy (Power Division), to ensure operation of economically higher ranked generation power plants at their maximum capacities and allocation of gas to power plants according to Economic Merit Order for effective utilization of the available generating sources. The Ministry of Energy (Power Division) was also advised to get the developmental works completed on war-footing basis for removal ofpowerdispersal issuesandtoavoidongoingfinancial losstothenationalexchequerdue to underutilization of such power generation facilities.
(g) Continuous monitoring and communication resulted in better sense of responsibility on the part of Generating Companies. The replies submitted by NTDC/GENCOs in response to NEPRA letters of explanation are being analyzed for further proceedings.
05
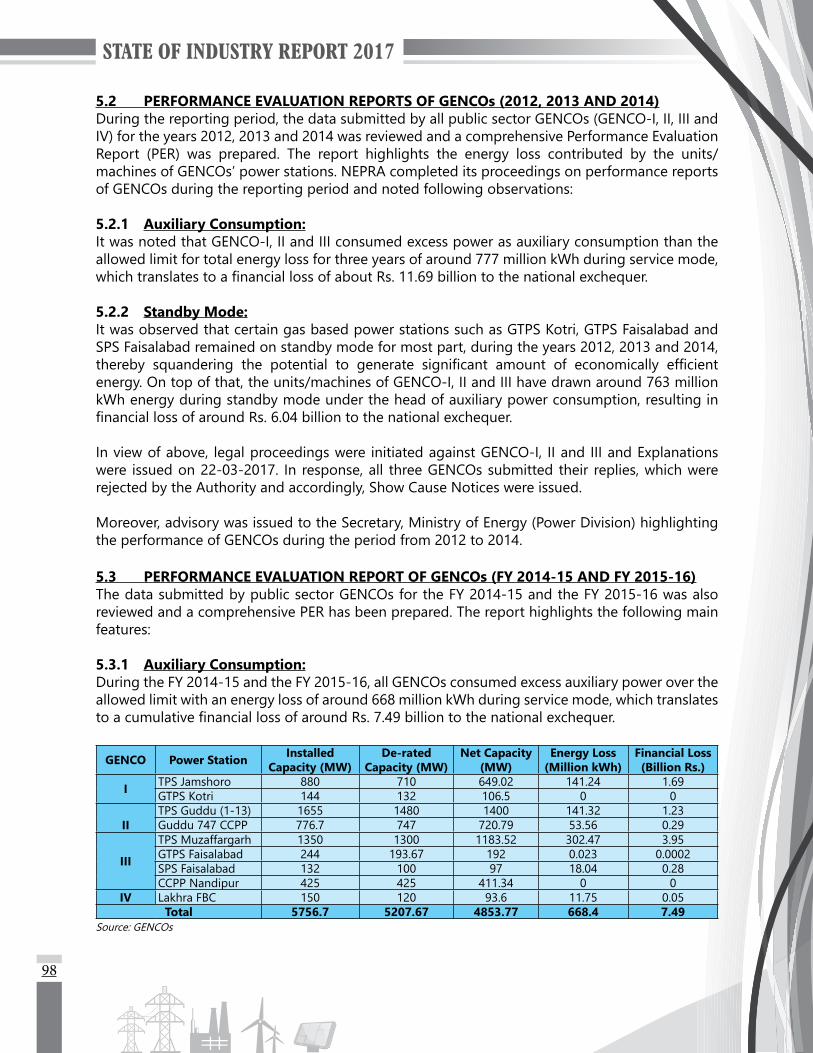
98
5.2 PERFORMANCE EVALUATION REPORTS OF GENCOs (2012, 2013 AND 2014)During the reporting period, the data submitted by all public sector GENCOs (GENCO-I, II, III and IV) for the years 2012, 2013 and 2014 was reviewed and a comprehensive Performance Evaluation Report (PER) was prepared. The report highlights the energy loss contributed by the units/ machines of GENCOs’ power stations. NEPRA completed its proceedings on performance reports of GENCOs during the reporting period and noted following observations:
5.2.1 Auxiliary Consumption:It was noted that GENCO-I, II and III consumed excess power as auxiliary consumption than the allowed limit for total energy loss for three years of around 777 million kWh during service mode, whichtranslatestoafinanciallossofaboutRs.11.69billiontothenationalexchequer. 5.2.2 Standby Mode:It was observed that certain gas based power stations such as GTPS Kotri, GTPS Faisalabad and SPS Faisalabad remained on standby mode for most part, during the years 2012, 2013 and 2014, thereby squandering the potential to generate significant amount of economically efficientenergy. On top of that, the units/machines of GENCO-I, II and III have drawn around 763 million kWh energy during standby mode under the head of auxiliary power consumption, resulting in financiallossofaroundRs.6.04billiontothenationalexchequer.
In view of above, legal proceedings were initiated against GENCO-I, II and III and Explanations were issued on 22-03-2017. In response, all three GENCOs submitted their replies, which were rejected by the Authority and accordingly, Show Cause Notices were issued.
Moreover, advisory was issued to the Secretary, Ministry of Energy (Power Division) highlighting the performance of GENCOs during the period from 2012 to 2014.
5.3 PERFORMANCE EVALUATION REPORT OF GENCOs (FY 2014-15 AND FY 2015-16)The data submitted by public sector GENCOs for the FY 2014-15 and the FY 2015-16 was also reviewed and a comprehensive PER has been prepared. The report highlights the following main features:
5.3.1 Auxiliary Consumption:During the FY 2014-15 and the FY 2015-16, all GENCOs consumed excess auxiliary power over the allowed limit with an energy loss of around 668 million kWh during service mode, which translates toacumulativefinanciallossofaroundRs.7.49billiontothenationalexchequer.
GENCO Power Station InstalledCapacity (MW)
De-ratedCapacity (MW)
Net Capacity (MW)
Energy Loss (Million kWh)
Financial Loss(Billion Rs.)
I TPS Jamshoro 880 710 649.02 141.24 1.69GTPS Kotri 144 132 106.5 0 0
IITPS Guddu (1-13) 1655 1480 1400 141.32 1.23Guddu 747 CCPP 776.7 747 720.79 53.56 0.29
III
TPS Muzaffargarh 1350 1300 1183.52 302.47 3.95GTPS Faisalabad 244 193.67 192 0.023 0.0002SPS Faisalabad 132 100 97 18.04 0.28CCPP Nandipur 425 425 411.34 0 0
IV Lakhra FBC 150 120 93.6 11.75 0.05Total 5756.7 5207.67 4853.77 668.4 7.49
Source: GENCOs
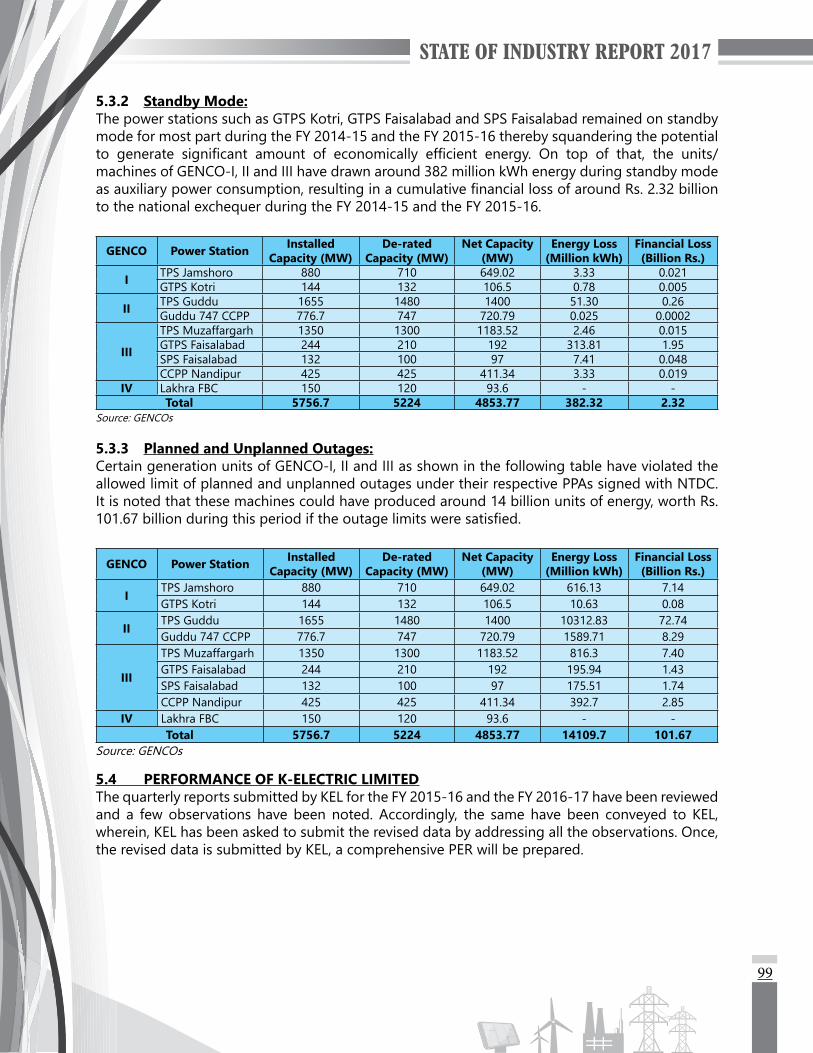
99
5.3.2 Standby Mode:The power stations such as GTPS Kotri, GTPS Faisalabad and SPS Faisalabad remained on standby mode for most part during the FY 2014-15 and the FY 2015-16 thereby squandering the potential to generate significant amount of economically efficient energy. On top of that, the units/machines of GENCO-I, II and III have drawn around 382 million kWh energy during standby mode asauxiliarypowerconsumption,resultinginacumulativefinanciallossofaroundRs.2.32billionto the national exchequer during the FY 2014-15 and the FY 2015-16.
GENCO Power Station InstalledCapacity (MW)
De-ratedCapacity (MW)
Net Capacity (MW)
Energy Loss (Million kWh)
Financial Loss(Billion Rs.)
I TPS Jamshoro 880 710 649.02 3.33 0.021GTPS Kotri 144 132 106.5 0.78 0.005
II TPS Guddu 1655 1480 1400 51.30 0.26Guddu 747 CCPP 776.7 747 720.79 0.025 0.0002
III
TPS Muzaffargarh 1350 1300 1183.52 2.46 0.015GTPS Faisalabad 244 210 192 313.81 1.95SPS Faisalabad 132 100 97 7.41 0.048CCPP Nandipur 425 425 411.34 3.33 0.019
IV Lakhra FBC 150 120 93.6 - -Total 5756.7 5224 4853.77 382.32 2.32
Source: GENCOs
5.3.3 Planned and Unplanned Outages:Certain generation units of GENCO-I, II and III as shown in the following table have violated the allowed limit of planned and unplanned outages under their respective PPAs signed with NTDC. It is noted that these machines could have produced around 14 billion units of energy, worth Rs. 101.67billionduringthisperiodiftheoutagelimitsweresatisfied.
GENCO Power Station InstalledCapacity (MW)
De-ratedCapacity (MW)
Net Capacity (MW)
Energy Loss (Million kWh)
Financial Loss(Billion Rs.)
ITPS Jamshoro 880 710 649.02 616.13 7.14GTPS Kotri 144 132 106.5 10.63 0.08
IITPS Guddu 1655 1480 1400 10312.83 72.74Guddu 747 CCPP 776.7 747 720.79 1589.71 8.29
III
TPS Muzaffargarh 1350 1300 1183.52 816.3 7.40GTPS Faisalabad 244 210 192 195.94 1.43SPS Faisalabad 132 100 97 175.51 1.74CCPP Nandipur 425 425 411.34 392.7 2.85
IV Lakhra FBC 150 120 93.6 - -Total 5756.7 5224 4853.77 14109.7 101.67
Source: GENCOs
5.4 PERFORMANCE OF K-ELECTRIC LIMITEDThe quarterly reports submitted by KEL for the FY 2015-16 and the FY 2016-17 have been reviewed and a few observations have been noted. Accordingly, the same have been conveyed to KEL, wherein, KEL has been asked to submit the revised data by addressing all the observations. Once, the revised data is submitted by KEL, a comprehensive PER will be prepared.
100
5.5 MONITORING OF TRANSMISSION SECTOR
5.5.1 NEPRA Performance Standards (Transmission) Rules (PSTR), 2005:
5.5.1.1 Performance of NTDC for the FY 2015-16:The results of analysis of the APRs for the FY 2014-15 and the FY 2015-16 have already been includedinStateofIndustry2016.Duringthereportingperiod,NTDCfiledareviewbeforetheAuthoritytowaiveoffthefineofRs.5million,whichwasimposedonNTDCduetonon-complianceof PSTR based on the data submitted by NTDC during its APR for the FY 2013-14. However, after detaileddeliberationstheAuthorityrejectedthereviewfiledbyNTDCanddecidedtoupholditsearlierdecisionofimpositionoffine.
5.5.2 Initiation of Legal Action against NTDC for Extending Completion Dates of Projects:Power projects are backbone to the national economy. The Authority observed abnormal delays in NTDC’s power evacuation projects and development works, therefore the Authority decided to initiate legal action against NTDC under NEPRA (Fines) Rules, 2002 for non-compliance of direction of the Authority. In this respect, an Explanation under NEPRA (Fines) Rules, 2002 was served to NTDC. Subsequently, a Show Cause Notice dated 05-05-2017 was also issued to NTDC. NTDC submitted the response of Show Cause Notice and requested for personal hearing. The legal proceeding is in process.
5.6 MONITORING OF DISTRIBUTION SECTOR
5.6.1 Data Analysis and Reporting:Monitoring activities were carried out to improve performance of licensees with the purpose to protect consumers’ rights, ensure good governance and strong management in DISCOs by collecting information/data in respect of the following:
(a) Daily data of DISCOs, regarding energy dispatched against their allocated quota.(b) Digitized Plotting of distribution network of DISCOs (as per article of Distribution
Licence).(c) Transmission and distribution losses of DISCOs.(d) Loading position of distribution transformers and feeders.(e) Compliance of directions of the Authority issued to DISCOs in tariff determinations.(f) Compliance with provisions of licence.
Based on the information, important in-house reports regarding performance of licensees were prepared as follows:
(a) Evaluation of Time of Use (ToU) Meters.(b) Report on Distribution system Constraints (PESCO, SEPCO and HESCO).(c) Compliance report on the directions of the Authority issued in the tariff determination
of DISCOs for FY 2013-14, FY 2014-15 and FY 2015-16.(d) Compliance status of DISCOs regarding digitization of their distribution network
(as per Article 3.3 of Distribution Licence of DISCOs).
Major observations and discrepancies noted during the analysis of data were conveyed to the management of DISCOs along with proposed measures to enhance their performance.
101
5.6.2 Monitoring of NEPRA Performance Standards (Distribution) Rules, 2005:In order to verify the data related to interruptions, durations of interruptions, provision of new connection, complaint handling mechanism, number of faults, and safety submitted by DISCOs through their APRs and also to verify the media reports regarding unannounced load-shedding and un-due delay in restoration of power supply NEPRA decided to carry out technical audit the monitoring of DISCOs. Accordingly, monitoring/performance audit of FESCO, LESCO, GEPCO, HESCO and SEPCO has been carried out.
5.6.2.1 Observations:Following main observations were noted by NEPRA teams during visits of above noted DISCOs:
(a) Load-shedding was being carried out from 8 to 12 hours for some feeders in different areas of Punjab DISCOs and 12 to 16 hours for some feeders in different areas of Sindh DISCOs. Accordingly, it was observed that the DISCOs are not following the order of load- shedding as provided in PSDR, 2005.
(b) Data related to tripping of visited grid stations does not correlate with the automated tripping data recorded at PDC while the two also differ from the data submitted by these DISCOs in their Annual Performance Reports.
(c) Damaged transformers on average are repaired after one week in urban and two weeks in rural areas of Punjab DISCOs, whereas, time taken by Sindh DISCOs for repairing of damaged transformers was noted around two weeks in urban areas and around one month in rural areas.
(d) Voltage levels of incoming and outgoing feeders were not found within permissible limits as prescribed in Performance Standards and applicable Codes.
(e) With regard to maintenance of grid stations, no regular maintenance of power transformers, breakers, isolators and other essential equipment is being carried out.
(f) As per data provided, more than 40% of power transformers were overloaded.
(g) No proper procedure for handling complaints is being followed at customer service centers/complaint centers. Even, staff was found unaware about complaint handling mechanism and its recording in complaint registers.
(h) The data regarding number of complaints as submitted by DISCOs in their APRs does not match with the actual noted in Complaint Registers.
(i) Safety requirements were not being followed. Tilted poles, transformers without d-fuses resulting in leakage of current, improper earthing, increased number of fatal accidents of employees and general public and non-adherence of safety work procedures were noted.
(j) Excessive/Overbilling was observed in form of detections charged upon some of the consumerswithoutanyjustification.
(k) Under-utilization of investment funds despite poor network conditions, was observed.

102
5.6.2.2 Actions Taken/Fines Imposed:In view of above, the DISCOs were found to be in violation of PSDR, Distribution Code and other applicable documents. NEPRA, therefore, took appropriate actions. After due legal process, Fines of Rs. 5 million, 4 million and 4 million have been imposed on HESCO, LESCO and GEPCO. Meanwhile for FESCO, the Authority has rejected FESCO’s Explanation and a Show Cause Notice has been issued to it. Whereas, regarding SEPCO all due legal process has been completed and decision would be made.
5.6.3 Monitoring of PESCO:NEPRA team visited PESCO from 13-18 June, 2017 to verify the media reports and complaint of Energy and Power Department, Government of Khyber Pakhtunkhwa regarding long power cuts and long delays in restoration of power in different areas of PESCO. In addition, the team was also tasked to monitor the following:
(a) Availability of 13.5% PESCO’s share in country’s daily generation,(b) Load-shedding in different areas of PESCO,(c) Frequency of tripping of transmission and distribution networks,(d) Implementation of investment plans,(e) Measures to improve customer satisfaction,(f) Safety measures being taken by PESCO to save the employees and public,(g) Transmission/Distribution System constraints.
TochecktheoperationalperformanceofPESCOinviewofabovefactors,theteamcarriedoutfieldvisitsofgridstations,officesatsub-divisionanddivisionlevel,complaintcentersandfieldareasfor inspection of HT/LT distribution system. In this regard, following information was collected from PESCO:
(a) Total share, demand, allocated quota and load drawn,(b) Approved load-shedding policy/schedule,(c) Transmission/Distribution System constraints,(d) Detail of power transformers and their loading position,(e) Detail of 132 kV transmission lines and their loading position,(f) Detail of 11 kV feeders and their loading position,(g) Detail of distribution transformers along with their loading
position, supply chain/procurement plan and stock status,(h) Investment plans and its utilization,(i) Verificationofcomplainthandlingmechanism,(j) Details of overbilling/detections incurred,(k) Ripe Connections,(l) Progress on ToU meters,(m) Customers’ feedback during public surveys.
Accordingly, following key observations relating to the operational performance of PESCO were made:
5.6.3.1 Total Share, Demand, Allocated quota and Load drawn:PESCOhasadefinedshareof13.5%ofthetotalgeneration,however:
(a) The quota allocated to PESCO has remained less than its share of 13.5%.
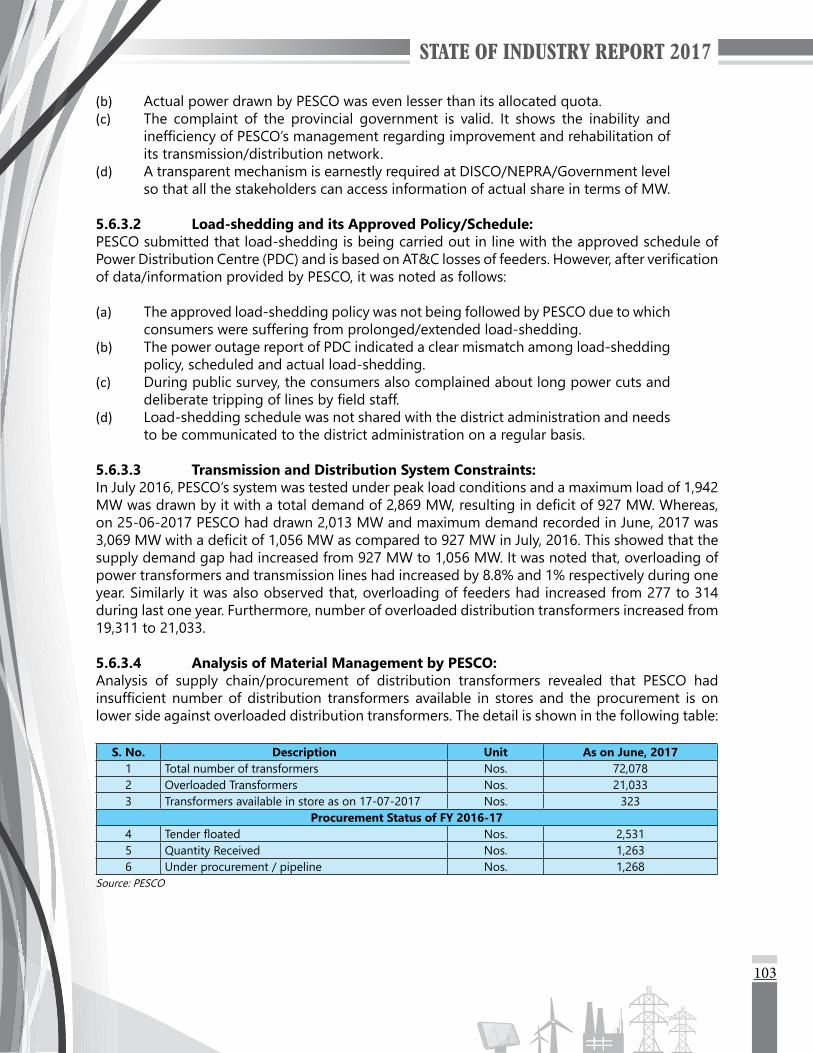
103
(b) Actual power drawn by PESCO was even lesser than its allocated quota.(c) The complaint of the provincial government is valid. It shows the inability and
inefficiencyofPESCO’smanagementregardingimprovementandrehabilitationofits transmission/distribution network.
(d) A transparent mechanism is earnestly required at DISCO/NEPRA/Government level so that all the stakeholders can access information of actual share in terms of MW.
5.6.3.2 Load-shedding and its Approved Policy/Schedule:PESCO submitted that load-shedding is being carried out in line with the approved schedule of PowerDistributionCentre(PDC)andisbasedonAT&Clossesoffeeders.However,afterverificationof data/information provided by PESCO, it was noted as follows:
(a) The approved load-shedding policy was not being followed by PESCO due to which consumers were suffering from prolonged/extended load-shedding.
(b) The power outage report of PDC indicated a clear mismatch among load-shedding policy, scheduled and actual load-shedding.
(c) During public survey, the consumers also complained about long power cuts and deliberatetrippingoflinesbyfieldstaff.
(d) Load-shedding schedule was not shared with the district administration and needs to be communicated to the district administration on a regular basis.
5.6.3.3 Transmission and Distribution System Constraints:In July 2016, PESCO’s system was tested under peak load conditions and a maximum load of 1,942 MWwasdrawnbyitwithatotaldemandof2,869MW,resultingindeficitof927MW.Whereas,on 25-06-2017 PESCO had drawn 2,013 MW and maximum demand recorded in June, 2017 was 3,069MWwithadeficitof1,056MWascomparedto927MWinJuly,2016.Thisshowedthatthesupply demand gap had increased from 927 MW to 1,056 MW. It was noted that, overloading of power transformers and transmission lines had increased by 8.8% and 1% respectively during one year. Similarly it was also observed that, overloading of feeders had increased from 277 to 314 during last one year. Furthermore, number of overloaded distribution transformers increased from 19,311 to 21,033.
5.6.3.4 Analysis of Material Management by PESCO:Analysis of supply chain/procurement of distribution transformers revealed that PESCO had insufficientnumberofdistribution transformers available in stores and theprocurement isonlower side against overloaded distribution transformers. The detail is shown in the following table:
S. No. Description Unit As on June, 20171 Total number of transformers Nos. 72,0782 Overloaded Transformers Nos. 21,0333 Transformers available in store as on 17-07-2017 Nos. 323
Procurement Status of FY 2016-174 Tenderfloated Nos. 2,5315 Quantity Received Nos. 1,2636 Under procurement / pipeline Nos. 1,268
Source: PESCO
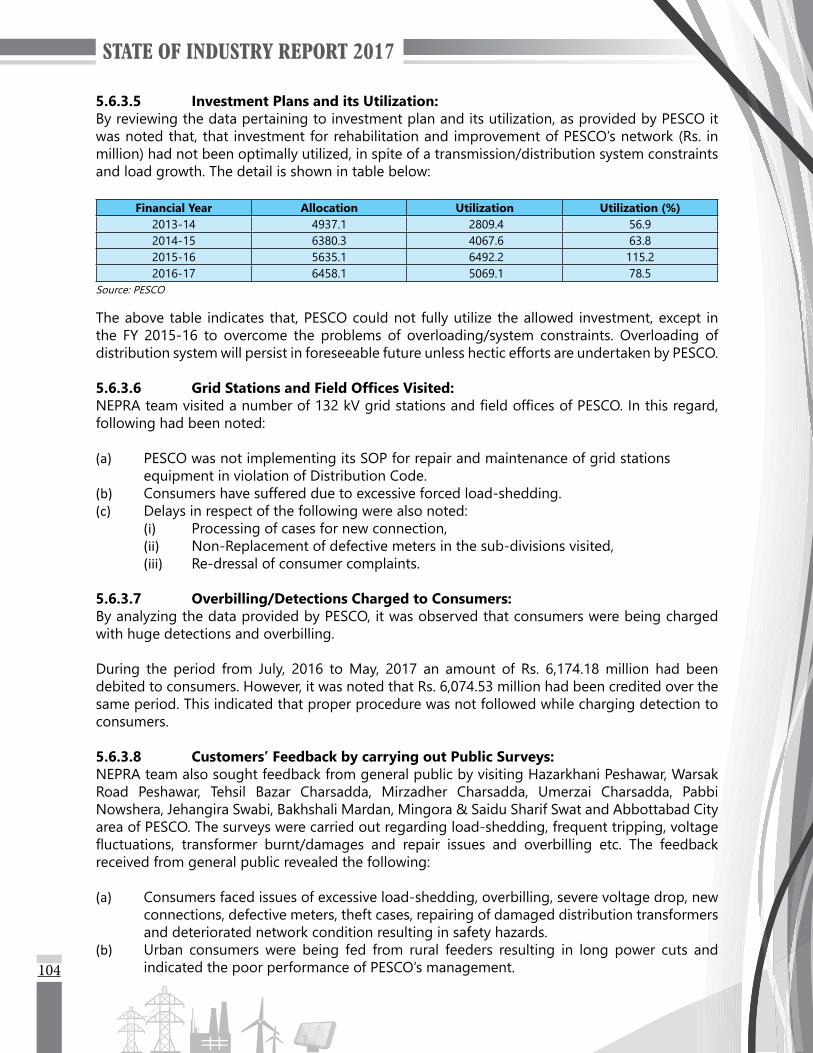
104
5.6.3.5 Investment Plans and its Utilization:By reviewing the data pertaining to investment plan and its utilization, as provided by PESCO it was noted that, that investment for rehabilitation and improvement of PESCO’s network (Rs. in million) had not been optimally utilized, in spite of a transmission/distribution system constraints and load growth. The detail is shown in table below:
Financial Year Allocation Utilization Utilization (%)2013-14 4937.1 2809.4 56.9 2014-15 6380.3 4067.6 63.8 2015-16 5635.1 6492.2 115.2 2016-17 6458.1 5069.1 78.5
Source: PESCO
The above table indicates that, PESCO could not fully utilize the allowed investment, except in the FY 2015-16 to overcome the problems of overloading/system constraints. Overloading of distribution system will persist in foreseeable future unless hectic efforts are undertaken by PESCO.
5.6.3.6 Grid Stations and Field Offices Visited:NEPRAteamvisitedanumberof132kVgridstationsandfieldofficesofPESCO.Inthisregard,following had been noted:
(a) PESCO was not implementing its SOP for repair and maintenance of grid stations equipment in violation of Distribution Code.
(b) Consumers have suffered due to excessive forced load-shedding.(c) Delays in respect of the following were also noted:
(i) Processing of cases for new connection,(ii) Non-Replacement of defective meters in the sub-divisions visited,(iii) Re-dressal of consumer complaints.
5.6.3.7 Overbilling/Detections Charged to Consumers:By analyzing the data provided by PESCO, it was observed that consumers were being charged with huge detections and overbilling.
During the period from July, 2016 to May, 2017 an amount of Rs. 6,174.18 million had been debited to consumers. However, it was noted that Rs. 6,074.53 million had been credited over the same period. This indicated that proper procedure was not followed while charging detection to consumers.
5.6.3.8 Customers’ Feedback by carrying out Public Surveys:NEPRA team also sought feedback from general public by visiting Hazarkhani Peshawar, Warsak Road Peshawar, Tehsil Bazar Charsadda, Mirzadher Charsadda, Umerzai Charsadda, Pabbi Nowshera, Jehangira Swabi, Bakhshali Mardan, Mingora & Saidu Sharif Swat and Abbottabad City area of PESCO. The surveys were carried out regarding load-shedding, frequent tripping, voltage fluctuations, transformer burnt/damages and repair issues and overbilling etc. The feedbackreceived from general public revealed the following:
(a) Consumers faced issues of excessive load-shedding, overbilling, severe voltage drop, new connections, defective meters, theft cases, repairing of damaged distribution transformers and deteriorated network condition resulting in safety hazards.
(b) Urban consumers were being fed from rural feeders resulting in long power cuts and indicated the poor performance of PESCO’s management.

105
5.6.4 Key Findings by Monitoring Teams about PESCO:PESCO failed to draw and utilize an average power of 333 MW ranging from a minimum of 172 MW to a maximum of 484 MW against its allocated quota in the FY 2016-17, inspite of available capacity in its system. Data of demand, allocation and load drawn is given hereunder:
Demand (MW) Allocation (MW) Load Drawn (MW) Less Drawn (MW)
Average Maximum Average Average Maximum Average2112 3069 1574 1242 2013 333
Source: PESCO
(a) The approved load-shedding policy was not followed before Ramadan and during Ramadan by PESCO. The power outage report of PDC revealed a clear mismatch among load-shedding policy, scheduled and actual load-shedding. PESCO violated of approved policy and Rule 4 (f) of PSDR which requires that a DISCO shall have plans and schedules to shed up to 30% of its connected load at any time keeping in view the priority order mentioned therein in a non-discriminatory manner so as not to excessively burden a particular class of consumers.
(b) PESCO failed to take remedial measures for removal of transmission/distribution system constraints on the required level of priority, as the network condition further deteriorated. More than 47% power transformers, 15.6% of transmission lines, 33.4% feeders and 29.2% distribution transformers were overloaded, prima facie, in violation of Distribution Code generally and particularly item 3.3 (b), 3.6 and 7 of Distribution Planning Code (DPC), item 2.2 of Distribution Design Code (DDC) and item 1.1(a), 1.1.2, 1.1.2.1 (b) and 1.1.5(b) of System Performance Reliability (SPR) and Consumer Service Requirements of Distribution Code.
(c) Analysis of supply chain/procurement of distribution transformers revealed that PESCO had insufficientnumberofdistributiontransformersavailableinstoresandtheprocurementis on lower side against overloaded distribution transformers. The detail is shown in the following table:
S. No. Description Unit As on June, 20171 Total number of transformers Nos. 72,0782 Overloaded Transformers Nos. 21,0333 Transformers available in store as on 17-07-2017 Nos. 323
Procurement Status of FY 2016-174 Tenderfloated Nos. 2,5315 Quantity Received Nos. 1,2636 Under procurement / pipeline Nos. 1,268
Source: PESCO
(d) Repair and maintenance of grid stations equipment was not being carried out properly thereby affecting its useful life and leading to damages and overloading.
(e) Nocheckonattendanceof theofficials, delay inprocessingofnewconnections, non-replacement of defective meters, delay by line staff while attending consumer’s complaints and unsatisfactory general cleaning were noted.
(f) Weak networks were observed to be the main cause of fatal accidents.(g) Inability of PESCO to optimally utilize the investment for rehabilitation of its network
indicated that system constraints will persist, and further deteriorate with load growth. It was noted that PESCO has no capability to improve its system and provide relief to its

106
consumers already suffering from long hours of load-shedding.(h) During the period July, 2016 to May, 2017 an amount of Rs. 6,174.18 million had been
debited to consumers. However, Rs. 6,074.53 million were credited over the same period implying that proper procedure was not followed while charging detection to consumers.
(i) The data provided by PESCO revealed that 18,224 ripe connections were pending (approximately on an average of 100 ripe connections per sub-division) for the month of May, 2017 in violation of Rule 4 (c) of PSDR, 2005.
(j) Consumers faced excessive load-shedding, overbilling, severe voltage drop, delays in new connections, defective meters, theft cases, delays in repairing of damaged distribution transformers and deteriorated network condition resulting in safety hazards as reported during public surveys.
(k) Urban consumers were fed from rural feeders, consequently affecting urban consumers with long power cuts.
Explanation on above issues was been issued to PESCO under NEPRA (Fines) Rules, 2002 for non-compliance of PSDR, 2005, Distribution Code and other applicable documents.
5.6.5 Monitoring of K-Electric Limited:
5.6.5.1 Visit during Ramadan (June, 2017) to verify load-shedding in Sehr and Iftar:NEPRA team visited KEL to check the load-shedding schedule during Sehr and Iftar timings, to verify the investments made by KEL vis-à-vis impact analysis and to monitor the performance improvement as compared to previous year. Following major observations were noted by NEPRA team during visit of KEL:
(a) Un-scheduled load-shedding in high and very high loss areas of Karachi due to weak distribution network was observed.
(b) Condition of some of the grid stations was found unsatisfactory despite NEPRA instructions conveyed to KEL during last year.
(c) KEL did not show impact analysis against investments made by it.
Accordingly, legal proceedings were initiated against KEL for carrying out load-shedding in a discriminatory manner thereby, violating PSDR, 2005.
5.6.5.2 Power breakdown on 28-06-2017 and onwards:According to the media reports, large area of Karachi remained without electricity due to tripping of almost 700 feeders during rainy weather on 28-06-2017 and onwards, which resulted in long power supply outage ranging from 24 to 48 hours in almost 50% of Karachi. Furthermore, fatal accidents to public were also reported due to electrocution. The Authority took serious note of performance of KEL and directed it to immediately provide a detailed report on feeder tripping and electrocution incidents which occurred during above mentioned spell of rain along with preventive and corrective steps taken by KEL. In response KEL submitted that 584 feeders were tripped rather than 700 as there was heavy rain. However, KEL did not provide the duration of tripping of 584 feeders against the media report of 24 to 48 hours. Further, KEL submitted that only 3 public fatalities were reported against 22 as reported in media on different dates of rain spell. The Authority considered the submissions of KEL and found them unsatisfactory and decided to initiate legal proceedings.
107
5.6.5.3 Monitoring of power breakdown occurred on 21 & 22-08-2017 and onwards:Large power breakdowns due to rainy weather on 21 and 22-08-2017 resulted in tripping of more than 400 feeders. Accordingly, KEL was directed to immediately provide a report in this regard.
5.7 REVIEW OF RELIABILITY STANDARDS OF DISCOs AND LINKAGE WITH INVESTMENTSOn the repeated requests of DISCOs, a process regarding review of reliability standards i.e. SAIFI and SAIDI was initiated by NEPRA. Based on the feedback of stakeholders and proposals of consultants based on international best practices, NEPRA set new targets of SAIFI and SAIDI for the FY 2015-16 and the FY 2016-17 separately for each DISCO which is a 5% and 10% reduction overmeanvaluesoflastfiveyearsofSAIFIandSAIDI,respectivelyrepeatedbytheDISCOs.
In addition to above, a working was also carried out to link the performance of DISCOs with the actual investments incurred by them. It was analyzed that how much reduction of outages was achieved by DISCOs and KEL after incurring the amounts under investments and repair and maintenance heads. During analysis it was observed that reliability power supply of some of the DISCOs have declined despite making large investments. It was concluded that sub-optimal utilization of funds and absence of correct data are the main reasons for such deteriorating performance. NEPRA would continue interacting with DISCOs in this respect.
5.8 INITIATION OF LEGAL PROCEEDINGS AGAINST DISTRIBUTION LICENSEES
5.8.1 Legal Proceeding against the Licensees for the Violations of the NEPRA Act, Rules and Regulations and the Applicable Documents:
NEPRA initiated following legal proceedings against the licensees regarding non-compliance of the directions of the Authority:
(a) Legal proceeding under NEPRA (Fines) Rules, 2002 against DISCOs for non-compliance of the directions of the Authority regarding digitization of distribution network under licence Article 3.3.
(b) Legal proceeding under NEPRA (Fines) Rules, 2002 against Bahria Town (Pvt.) Limited regarding non-compliance of the Authority’s directions to adjust the excess charged amount to the consumers.
5.8.2 Inability of PESCO to Remove System Constraints of Transmission and Distribution Network:
NEPRA regularly monitors the demand and power drawl capacity of DISCOs on daily basis. It was observed that PESCO regularly draws less power as compared to allocated quota. Therefore, PESCO vide letters dated 10-06-2016, 21-07-2016 and 02-02-2017 was directed to take measures for up gradation/rehabilitation of its transmission and distribution network so that maximum load/power may be drawn and relief be provided to consumers who suffer due to prolonged hours of load-shedding.
As per Distribution Code 2005, DISCOs are bound to timely plan and upgrade/improve distribution network and they shall develop procedures and guidelines for overcoming operational constraints. PESCO failed to comply with directions of the Authority as well as provisions of Distribution Code 2005, in respect of system improvement, therefore an Explanation letter dated 10-04-2017 was issued to PESCO. Subsequently, Show Cause Notice dated 26-05-2017 was also issued to PESCO. The legal proceedings are under process.
108
5.8.3 Un-Announced and Prolonged Hours of Load-Shedding by HESCO:The HESCO system experienced frequent breakdowns and extended load-shedding, which have been reported during the month of May, 2017. The media also reported that the prolonged hours of load-shedding continued in HESCO during the holy month of Ramadan, 2017. The Authority took notice of the events and sent a team on 04-06-2017 to monitor and verify load-shedding situation in HESCO.
The NEPRA team visited different areas of Hyderabad, conducted survey of consumers and inspectedrecordatPDC.Theteamnotedthatcontrarytothestatedclaimsbytheofficials,theconsumers are being subjected to prolonged un-scheduled electricity outages of more than sixteen (16) hours in a number of areas.
Basedonthefindingsadetailedreportwasfiledbytheteam,wherein,thefindingpertainingtolonger power cuts other than scheduled load-shedding was prominent on which the Authority while showing serious concerns, decided to initiate legal proceedings. Accordingly, an Explanation was issued to HESCO for non-compliance of PSDR, 2005.
5.8.4 Un-Announced and Prolonged Hours of Load-Shedding by K-Electric Limited:The KEL system experienced frequent breakdowns and extended load-shedding, which have been reported during the month of May, 2017. The media also reported that the prolonged hours of load-shedding continued in Karachi during the holy month of Ramadan, 2017. The Authority took notice of the events in KEL and sent letters to KEL for reports in the matter. Further, High Court of Sindh at Karachi in its decision dated 29-05-2017 in CP-D-3891/2016 directed NEPRA as follows:
(a) The NEPRA Authorities, being regulator of the KEL, are directed to make sure that the instructions issued by it vide order dated 25-03-2016 are being complied with by the KEL Authorities in its letter and spirit.
(b) Needless to state that in case of non-compliance by the KEL Authorities, the NEPRA Authorities would be at liberty to take appropriate action in accordance with law against the KEL Authorities.
In compliance of the aforesaid decision of the High Court of Sindh and considering the complaints of general public and media reports, the Authority decided to verify the implementation status of directions of the Authority. NEPRA team visited different areas of KEL, conducted survey of consumers and inspected record and log books of 132 kV Grid Stations.
Basedonthevisitadetailedreportwassubmittedbytheteam,wherein,thefindingpertainingto longer power cuts other than scheduled load-shedding was prominent on which the Authority while showing serious concerns, decided to initiate legal proceedings. Accordingly, an Explanation letter dated 23-06-2017 was issued to KEL under NEPRA (Fines) Rules, 2002 for non-compliance of PSDR, 2005 and non-compliance of directions of the Authority. The legal proceeding is currently ongoing.

STATE OF INDUSTRY REPORT 2017
INITIATIVES BY NEPRA

111
INITIATIVES BY NEPRA
Following sections provide details of initiatives by NEPRA pursuant to functions under the NEPRA Act:
6.1 RATIONALIZATION OF GENERATION TARIFF PARAMETERSAs part of its regulatory process, NEPRA carries out reviews of various factors which form the basis of tariff determinations. The aim is to ensure that the power sector tariffs are consistent and reflectiveofprevailingeconomicandfinancialconditionsofthecountryingeneralandthesectorin particular so that the tariff allowed to generation companies would not burden end-consumer with imprudent costs.
After a comprehensive review and discussion with various stakeholders, the Authority has decided to revise certain benchmarks and ceilings to be allowed for tariff components of generation projects. In this respect, the Authority would seek input of all stakeholders on these recommendations beforethesearefinalizedforapplicationintariffs.Followingfactorsareunderconsiderationbythe Authority:
(a) Banking Spread(b) Debt and Equity ratios(c) IDC and ROEDC(d) Financing Fee(e) Insurance(f) Withholding Tax on dividends(g) Availability
The Authority in principle continues to move towards promoting the competitive mode in generation tariffs. However, these benchmarks will be used for the projects to be considered under cost plus and upfront tariff regime.
6.2 REVIEW OF RATE OF RETURNNEPRA has decided to review the returns offered in the power sector and prepared a concept paper for determination of the rate of returns for the power companies which provided a basis for determining the IRR for various technologies, value chain of power sector i.e. generation, transmission and distribution and tariff regimes (cost plus, upfront). The basic objective is that the IRRnowneedstobeeffectivelydepictedagainstspecificriskandreturnmatrixanditsadjustmentfor a particular technology. The document was uploaded on NEPRA website for comments from the stakeholders.
6.3 ENERGY, ENVIRONMENT AND SUSTAINABLE DEVELOPMENTNEPRA being the regulator of the power sector regularly interacts with relevant Environmental Protection Agencies (EPAs) about compliance of their relevant acts by licensees and monitoring carried out by EPAs in this respect. NEPRA also obtains compliance reports as required under generation licence from the project companies.
TohavefurtherinsightintotheworkingofEPAsandtheirmonitoringactivitiesspecificallyinthepower sector, NEPRA organized a seminar on Energy, Environment and Sustainable Development
06
112
on 30-08-2016. The seminar was attended by participants from various organizations. The main objectives of the seminar were as follows:
(a) Awareness about environment among the stakeholders in Pakistan’s power sector; especially after the expected changes in the current energy mix.
(b) Adequacy of existing Laws on environment protection and the role of relevant bodies.
(c) NEPRA’s Role.(d) Way Forward.
The representatives of Provincial Environmental Protection Agencies discussed about their procedural aspects for monitoring of environment and demonstrated a strong commitment and continuousmonitoringbythem,especiallyforupcomingcoalfiredpowerplants.
6.4 COMPREHENSIVE REDUCTION AND ELIMINATION OF POLYCHLORINATED BIPHENYLS (PCBs)
The objective of this project of Ministry of Climate Change (MOCC) is to reduce risk for the human health and the environment by avoiding the release of Persistent Organic Pollutants (POPs) in theenvironmentandpreventingexposuretothese.POPScanbedefinedinanumberofwaysincluding the following:
(a) Chemicals with high toxicity originated through anthropogenic activities,(b) Organic chemicals containing carbon and hydrogen are characterized by
adverse effects on life, (c) Bio-accumulation, persistence and long range transport pose a threat to
humans and environment,(d) POPs are widely used as pesticides and/or industrial chemicals.
The project has been arranged in four components:
(a) Development and implementation of a Regulatory, Policy and enforcement system to reduce POPs releases,
(b) Capacity building of local communities and public and private sector stakeholders to reduce exposure to and releases of POPs,
(c) Collection, Transport and Disposal of PCBs and POPs Pesticides,(d) Monitoring and Evaluation.
NEPRAwas involvedon thePOPsProjectwhenapresentationwasgivenbyofficials fromtheMOCCon16-08-2016totheAuthorityinpresenceofofficialsfromDISCOs,GENCOs,IPPsandNTDC. Based on the outcome of the meeting the proformas for the development of inventory and data collection on presence of PCBs in Pakistan’s power sector were issued to 255 stakeholders. In response, two licensees including WAPDA Hydel’s Mangla Power Station and KEL reported the POPs contaminated oil in their transformers. Whereas, the other licensees/stakeholders responded in respect of presence of POPs contaminated oil as “Nil”.
The POPs project team has informed that the contaminated oil collected from transformers of Mangla Power Station and KEL has been transported to Bestway Cement Plant located in Kallar Kahar as per international and global codes including SOPs (Standard Operating Procedures) of handling, transportation, storage and disposal of POPs under the supervision/guidance
113
of International Consultant. It is further apprised that the special containers having unique composition have been used for transportation purposes.
Furthermore, keeping in view the economical and feasible option the aforesaid contaminated oil owing to presence of POPs is then burned in rotary kiln of Bestway Cement Plant during cement manufacturing process.
As per the POPs project team, the cement so manufactured during the burning of POPs contains negligible residues of POPs i.e. PPM (parts per million) which are well within limits as prescribed in National Environment Quality (NEQ) Standards and World Health Organization (WHO) Standards. Collection of additional samples of oil will be undertaken in the coming months.
6.5 FORMATS FOR SUBMISSION OF INFORMATION FOR GENERATION COMPANYIn order to streamline the submission of requisite information by power generation companies in linewithalreadyspecifiedformatsinrespectofDISCOs,theAuthorityisinaprocessofpreparingthestandardizedformatsforallthepowergenerationtechnologies.Asafirststep,keepinginviewthe comments of the stakeholders including AKLA and Bismillah Energy the formats for steam turbine based power plants operating on coal, nuclear fuel, RFO, biomass, bagasse and solid wastehavebeenpreparedwhichwillbenotifiedinnearfuture.Theformatsinrespectofothertechnologies are under preparation.
6.6 INDUSTRY – ACADEMIA COLLABORATIONNational University of Sciences and Technology (NUST) is working closely with NEPRA on a research proposal namely “Modeling and Simulation of Pakistan’s Electric Power Sector to develop a road map for transition from the current single buyer model to a competitive whole sale power market”.
6.7 COAL PRICING – HIRING OF CONSULTANTThe need to hire a consultant for coal price adjustment emanates from the fact that there is no regulatorymechanism forcoalpricingand importverificationprocessunlikeoil,gasandLNGprices, which are determined by the OGRA. NEPRA has initiated hiring of a Consultant in view of the fact that at least three 1,320 MW each of coal projects based on imported coal are currently under construction to achieve commercial operation within two years.
Also, some bagasse based co-generation power plants were also importing coal as alternative fuel when bagasse would be unavailable.
The coal market is developing in Pakistan and is expected to increase manifold from current level of about 5 million tons to more than 15 million tons per annum. As a result, there will be an enormous amount of workload on a periodic basis for revision in fuel cost component of these powerplants.NEPRAhasnowell-definedmechanism for coalpricing and import verification.Therefore, the consultant to be appointed would be required to prepare a manual for periodic fuel price adjustment to verify the coal price of each cargo delivered to these power plants. The Consultant will also be responsible for the following:
(a) To carry out detailed review of the pricing mechanism as determined by NEPRA, and prepare themechanismtofixdifferentparameters likeoriginanddateofcoalcargoesand shipments through relevant documents including invoices, letters of credit and bill of lading etc.
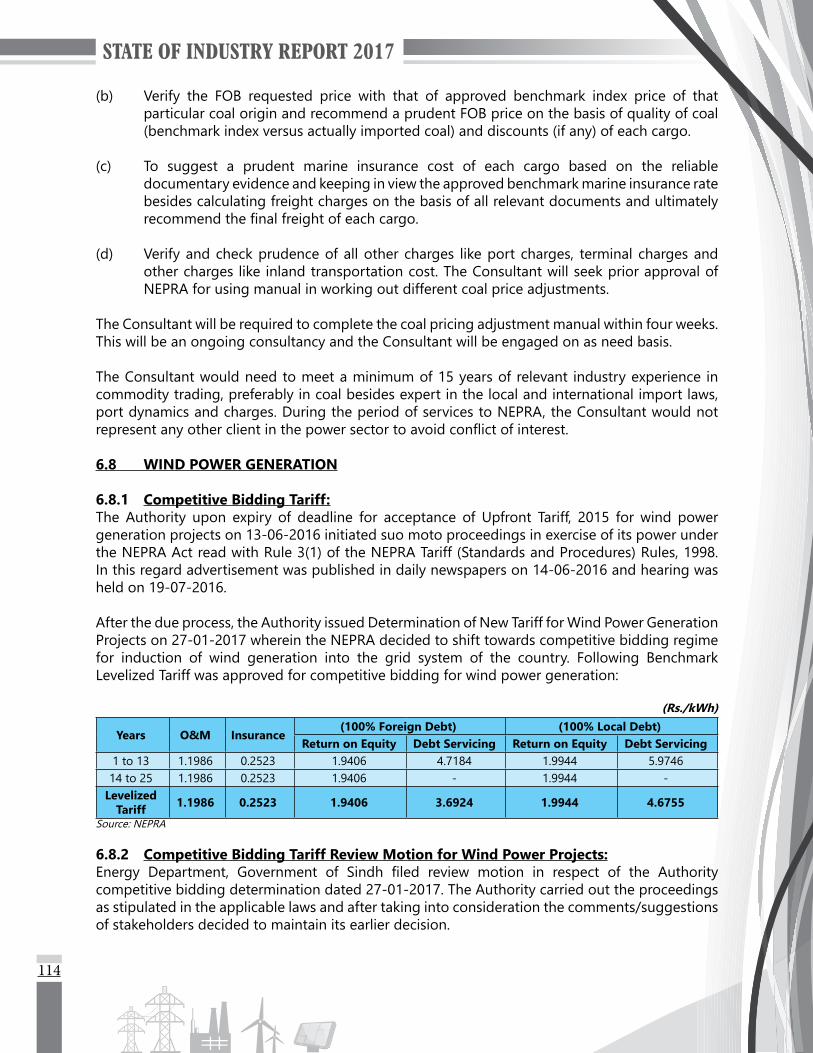
114
(b) Verify the FOB requested price with that of approved benchmark index price of that particular coal origin and recommend a prudent FOB price on the basis of quality of coal (benchmark index versus actually imported coal) and discounts (if any) of each cargo.
(c) To suggest a prudent marine insurance cost of each cargo based on the reliable documentary evidence and keeping in view the approved benchmark marine insurance rate besides calculating freight charges on the basis of all relevant documents and ultimately recommendthefinalfreightofeachcargo.
(d) Verify and check prudence of all other charges like port charges, terminal charges and other charges like inland transportation cost. The Consultant will seek prior approval of NEPRA for using manual in working out different coal price adjustments.
The Consultant will be required to complete the coal pricing adjustment manual within four weeks. This will be an ongoing consultancy and the Consultant will be engaged on as need basis.
The Consultant would need to meet a minimum of 15 years of relevant industry experience in commodity trading, preferably in coal besides expert in the local and international import laws, port dynamics and charges. During the period of services to NEPRA, the Consultant would not representanyotherclientinthepowersectortoavoidconflictofinterest.
6.8 WIND POWER GENERATION
6.8.1 Competitive Bidding Tariff:The Authority upon expiry of deadline for acceptance of Upfront Tariff, 2015 for wind power generation projects on 13-06-2016 initiated suo moto proceedings in exercise of its power under the NEPRA Act read with Rule 3(1) of the NEPRA Tariff (Standards and Procedures) Rules, 1998. In this regard advertisement was published in daily newspapers on 14-06-2016 and hearing was held on 19-07-2016.
After the due process, the Authority issued Determination of New Tariff for Wind Power Generation Projects on 27-01-2017 wherein the NEPRA decided to shift towards competitive bidding regime for induction of wind generation into the grid system of the country. Following Benchmark Levelized Tariff was approved for competitive bidding for wind power generation:
(Rs./kWh)
Years O&M Insurance(100% Foreign Debt) (100% Local Debt)
Return on Equity Debt Servicing Return on Equity Debt Servicing1 to 13 1.1986 0.2523 1.9406 4.7184 1.9944 5.974614 to 25 1.1986 0.2523 1.9406 - 1.9944 -
Levelized Tariff 1.1986 0.2523 1.9406 3.6924 1.9944 4.6755
Source: NEPRA
6.8.2 Competitive Bidding Tariff Review Motion for Wind Power Projects:Energy Department, Government of Sindh filed review motion in respect of the Authoritycompetitive bidding determination dated 27-01-2017. The Authority carried out the proceedings as stipulated in the applicable laws and after taking into consideration the comments/suggestions of stakeholders decided to maintain its earlier decision.
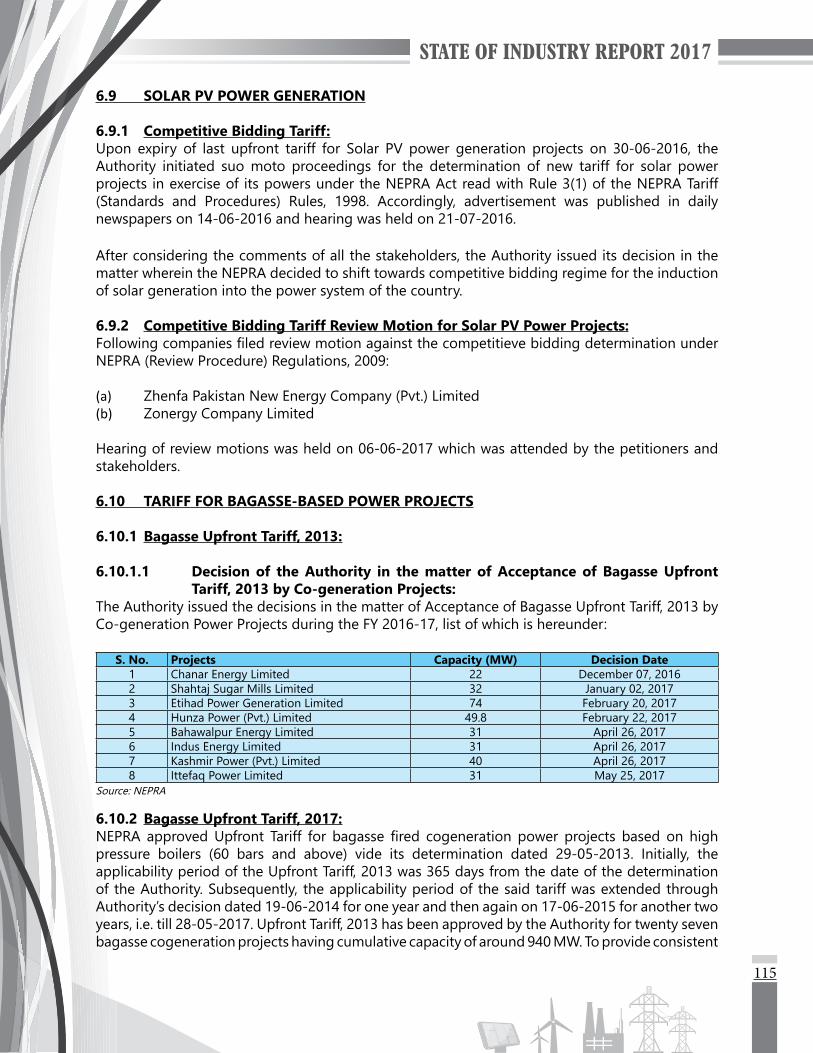
115
6.9 SOLAR PV POWER GENERATION
6.9.1 Competitive Bidding Tariff:Upon expiry of last upfront tariff for Solar PV power generation projects on 30-06-2016, the Authority initiated suo moto proceedings for the determination of new tariff for solar power projects in exercise of its powers under the NEPRA Act read with Rule 3(1) of the NEPRA Tariff (Standards and Procedures) Rules, 1998. Accordingly, advertisement was published in daily newspapers on 14-06-2016 and hearing was held on 21-07-2016.
After considering the comments of all the stakeholders, the Authority issued its decision in the matter wherein the NEPRA decided to shift towards competitive bidding regime for the induction of solar generation into the power system of the country.
6.9.2 Competitive Bidding Tariff Review Motion for Solar PV Power Projects:FollowingcompaniesfiledreviewmotionagainstthecompetitievebiddingdeterminationunderNEPRA (Review Procedure) Regulations, 2009:
(a) Zhenfa Pakistan New Energy Company (Pvt.) Limited(b) Zonergy Company Limited
Hearing of review motions was held on 06-06-2017 which was attended by the petitioners and stakeholders.
6.10 TARIFF FOR BAGASSE-BASED POWER PROJECTS
6.10.1 Bagasse Upfront Tariff, 2013:
6.10.1.1 Decision of the Authority in the matter of Acceptance of Bagasse Upfront Tariff, 2013 by Co-generation Projects:
The Authority issued the decisions in the matter of Acceptance of Bagasse Upfront Tariff, 2013 by Co-generation Power Projects during the FY 2016-17, list of which is hereunder:
S. No. Projects Capacity (MW) Decision Date1 Chanar Energy Limited 22 December 07, 20162 Shahtaj Sugar Mills Limited 32 January 02, 20173 Etihad Power Generation Limited 74 February 20, 20174 Hunza Power (Pvt.) Limited 49.8 February 22, 20175 Bahawalpur Energy Limited 31 April 26, 20176 Indus Energy Limited 31 April 26, 20177 Kashmir Power (Pvt.) Limited 40 April 26, 20178 Ittefaq Power Limited 31 May 25, 2017
Source: NEPRA
6.10.2 Bagasse Upfront Tariff, 2017:NEPRA approvedUpfront Tariff for bagasse fired cogeneration power projects based on highpressure boilers (60 bars and above) vide its determination dated 29-05-2013. Initially, the applicability period of the Upfront Tariff, 2013 was 365 days from the date of the determination of the Authority. Subsequently, the applicability period of the said tariff was extended through Authority’s decision dated 19-06-2014 for one year and then again on 17-06-2015 for another two years, i.e. till 28-05-2017. Upfront Tariff, 2013 has been approved by the Authority for twenty seven bagasse cogeneration projects having cumulative capacity of around 940 MW. To provide consistent
116
tariff regime for the development of bagasse cogeneration power, the Authority in exercise of its powers under its framework decided to initiate suo moto proceedings for determination of new upfront tariff. Accordingly a draft tariff proposal was developed on the basis of data and information available with the Authority. In line with the tariff setting process envisaged in NEPRA Up-front Tariff (Approval and Procedure) Regulations, 2011 and with a view to arrive at a just and informed decision, the Authority decided to hold a hearing. Notice of public hearing and salient features of the draft upfront tariff proposal were published in the national newspapers on 18-03-2017invitingfilingofinterventionrequestsandcomments.
In this regard the hearing was held on 06-04-2017, the case remained under process during the reporting period.
STATE OF INDUSTRY REPORT 2017
INITIATIVES BY STAKEHOLDER


119
INITIATIVES BY STAKEHOLDERS
7.1 THE REGULATION OF GENERATION, TRANSMISSION AND DISTRIBUTION OF ELECTRIC POWER (AMENDMENT) ACT, 2018
NEPRA was established through the Regulation of Generation, Transmission and Distribution of Electric Power Act, 1997 as an independent regulator, in pursuance of the 1992 “Strategic Plan for Privatization of the Power Sector” under which the entire energy sector was reformed through sector unbundling and corporatisation and privatisation of utilities. The core objective of the said 1992 plan was to pave the way for private sector participation under the oversight of an independent regulator. Under the 1997 Act, NEPRA has 5 core functions, namely licensing, tariff determination, prescribing rules and regulations, monitoring and enforcement of regulated entities, settlement of disputes among licensee and safeguarding consumer interests.
Parliament has recently passed the Regulation of Generation, Transmission and Distribution of Electric Power (Amendment) Act, 2018 [Act No. XII of 2018]. The Amendment Act has restructured and evolved the energy sector in material respects and overhauled the role and responsibilities of NEPRA. The material changes to the law introduced vide the Amendment Act are as follows:
7.1.1 NEPRA Structural and Operational Reforms:The Amended Act, 2018 has revised the eligibility criteria for appointment of the Chairman and Members of the Authority, along with appropriate revisions to provisions relating to terms and conditions of employment and remuneration.
EXISTING LAW AMENDMENT
Chairman to have 20 years of professional experience Chairman to have 12 years of professional experience
Members to have 15 years of professional experience Members to have 12 years of professional experience
Age of retirement of Chairman/Members is 65 years Age of retirement of Chairman/Members is 60 years** Savings of term provided to incumbent members of the Authority
The Amendment Act has further revised the role of enacting sub-ordinate legislation, by relegating various subject matters to the Authority for prescription of Regulations. Furthermore, the Federal Government has now been granted the power to unilaterally draft and notify rules as deemed appropriate, and all Rules shall be enacted with prior consultation with the Provinces.
Rules RegulationsFederal Government shall notify Rules on its own motion or on recommendation of the Authority in consultation with Authority and Provinces
NEPRA can make Regulations without seeking approval of the Federal Government
SubjectsNominations for Members of the Authority and Appellate Tribunal AppointmentofofficersandstaffofNEPRA
Manner of appeal before the Appellate Tribunal Form and manner of licence applications
Publication of rates and charges for electricity consumption Procedure for metering billing and collection of charges
Submission of Reports to CCI and Federal Government Application Fees
Inquiry into Licensees Procedure for resolving disputes
Minimum HR, Technical and Solvency requirements Manner and procedure of Show Cause Notices
Eligibility criteria for licencees Power Acquisition Requests
07
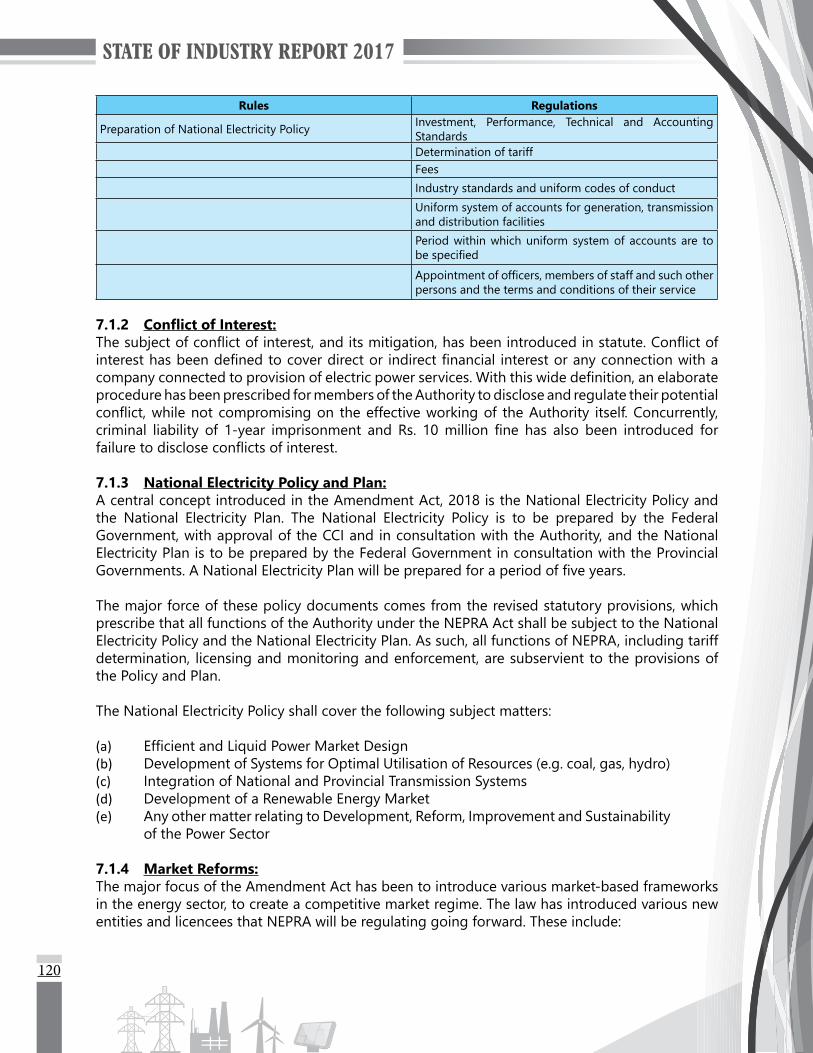
120
Rules Regulations
Preparation of National Electricity Policy Investment, Performance, Technical and Accounting StandardsDetermination of tariffFeesIndustry standards and uniform codes of conduct Uniform system of accounts for generation, transmission and distribution facilities Period within which uniform system of accounts are to bespecified
Appointmentofofficers,membersofstaffandsuchotherpersons and the terms and conditions of their service
7.1.2 Conflict of Interest:Thesubjectofconflictofinterest,anditsmitigation,hasbeenintroducedinstatute.Conflictofinteresthasbeendefinedtocoverdirector indirectfinancial interestoranyconnectionwithacompanyconnectedtoprovisionofelectricpowerservices.Withthiswidedefinition,anelaborateprocedure has been prescribed for members of the Authority to disclose and regulate their potential conflict,whilenotcompromisingon theeffectiveworkingof theAuthority itself.Concurrently,criminal liability of 1-year imprisonment and Rs. 10million fine has also been introduced forfailuretodiscloseconflictsofinterest.
7.1.3 National Electricity Policy and Plan:A central concept introduced in the Amendment Act, 2018 is the National Electricity Policy and the National Electricity Plan. The National Electricity Policy is to be prepared by the Federal Government, with approval of the CCI and in consultation with the Authority, and the National Electricity Plan is to be prepared by the Federal Government in consultation with the Provincial Governments.ANationalElectricityPlanwillbepreparedforaperiodoffiveyears.
The major force of these policy documents comes from the revised statutory provisions, which prescribe that all functions of the Authority under the NEPRA Act shall be subject to the National Electricity Policy and the National Electricity Plan. As such, all functions of NEPRA, including tariff determination, licensing and monitoring and enforcement, are subservient to the provisions of the Policy and Plan.
The National Electricity Policy shall cover the following subject matters:
(a) EfficientandLiquidPowerMarketDesign(b) Development of Systems for Optimal Utilisation of Resources (e.g. coal, gas, hydro)(c) Integration of National and Provincial Transmission Systems(d) Development of a Renewable Energy Market(e) Any other matter relating to Development, Reform, Improvement and Sustainability
of the Power Sector
7.1.4 Market Reforms:The major focus of the Amendment Act has been to introduce various market-based frameworks in the energy sector, to create a competitive market regime. The law has introduced various new entities and licencees that NEPRA will be regulating going forward. These include:

121
(a) The Market Operator (b) The System Operator(c) The Provincial Grid Company(d) The Electricity Supplier(e) The Electricity Trader(f) Registered Persons under the NEPRA Act(g) Removed exclusivity of Distribution Companies(h) Gradual cessation of Generation Licence requirement (over 5 years)(i) Moratorium of 5 years on provisions relating to market reform (except for Supplier and
Trader)(j) All DISCOs will be deemed to be suppliers for a period of 5 years
In addition to the above, the Distribution Licence under previous regime has now been bifurcated, with “Distribution” Licencees being restricted to the wire business and “Supplier” Licencees undertaking sale of electric power. Furthermore, the service territory exclusivity previously enjoyed by Distribution Licencees has also been removed by the legislature.
There are certain areas where transition from the existing regime to the scheme under the Amended Act would present more challenges and clarity. These areas among others include, market design and architecture, readiness of market entities, capacity building of regulatory authority, future of CPPA-G and market entrants and market design responsibility of NEPRA.
7.1.5 Tariff Determination:In comparison to the NEPRA Act, 1997 the Amended Act, 2018 provides a number of guidelines for NEPRA for tariff determinations. NEPRA’s powers to determine tariffs have been restricted in a way under the Amended Act. It is provided that NEPRA is to be guided by National Electricity Policy and National Electricity Plan and Guidelines of Federal Government for making tariff determination. Under the Act the Authority will be required to determine Uniform Tariff or Distribution Licensees, wholly owned and controlled by a common shareholders on the basis of consolidated accounts. It is noted that under the existing regime, NEPRA was required to follow Tariff Standards through separate Rules. These standards have now been prescribed in Act as noted hereunder:
(a) Allow licensees to recover all costs prudently incurred(b) Provide depreciation charge and rate of return based on investments of comparable
risk(c) Provide rate of return to promote continued investment(d) Providemechanism for rewardingandpenalising licensees forefficiency incost
and quality of service(e) ReflectMarginalCostprinciples(f) Preference for competition(g) Maybesetbelowlevelofcostiftariffsfinanciallyfeasible(h) Reflectfullcostofservice(i) Comprehensible, explicit and free of misinterpretation
7.1.6 Appellate Tribunal:The Amendment Act, 2018 has introduced the Appellate Tribunal framework into law. Going forward, all orders and determinations of the Authority shall be subject to appeal before the Tribunal. The Tribunal shall comprise of 3 Members with diverse backgrounds and expertise.
122
Members of the Appellate Tribunal are to be appointed on rotation by Federal Government on nomination of Provinces. Appointment of Chairman will be for 4 years and Members for 3 years. The Chairman and the members will be appointed for a single term. There will be one Member Electricity and one Member Finance. The retirement age of the Members will be 65 years.
The Decisions are to be taken by simple majority. Appellate Tribunal will hear appeal against decisionoftheAuthority,SingleMemberorTribunal.TheAppealisrequiredtobefiledwithin30days. If deemed necessary the Tribunal will conduct further inquiry and provide opportunity of hearing. In case of disagreement with Authority on matter of tariff, Tribunal will remand matter back to Authority with relevant guidelines which shall be duly considered by the Authority and the Authority is required to review its decision within 1 month. Decisions of the Tribunal are appealable before High Court.
Appeal Mechanism under the NEPRA (Amendment) Act, 2018
123
7.1.7 Offices of Complaints:TheNEPRAActnowcontains a framework for establishingdistrict levelComplaintOffices forhandling complaints relating to overbilling, non-compliance of instructions respecting metering and collection of approved charges, disconnection in case of non-payment of charges, electric power theft and use of energy for purposes other than for which it was supplied. Application for filingcomplaintsshallbespecifiedbyAuthority.UnderthecomplaintsystemtheAuthoritymayimposepenaltiesof3yearsimprisonmentand10MillionPKRfine.TheofficersofDISCOinvolvedwill also be punishable.
7.1.8 Expansion of Regulatory Powers:Flowing from the above, NEPRA’s role in the forthcoming energy sector has also been revised, with a major focus on the regulator’s enforcement powers. The Authority has been granted new enforcement powers of investigation, prohibition orders, issuance of directions and indemnity.
7.2 PROGRESS ON GRID CODE REVIEW PANELPursuant to Section 35 of NEPRA Act and Article 16 of the NTDC licence, the NTDC is required to ensure that there is in force at all times a Grid Code. In this reference, the Authority has already approved the Grid Code Addendum No. 1 for Grid Integration of Wind Power Plants and Grid Code Addendum No. 2 for Grid Integration of Solar Power Plants. Regarding penetration of Renewable Energy resources into the National Grid a study was carried out by M/s GOPA – International Energy Consultants and based on the recommendations of consultants the amendment to the aforesaid addendums was initiated in order to maintain the system security and stability at the required level.
Inthisregard,GridCodeReviewPanel(GCRP)metondifferentdatestofinalizetheREshareontothe National Grid and amendments in the existing provisions. Accordingly, GCRP decided that a total of 1,000 MW solar and 1,756 MW of wind power can be accommodated in the year 2016-17 and revised the Grid Code Addendum No. 1 for wind power plants and submitted it to the Authority for approval. The Authority approved the Grid Code Addendum No. 1 (Revision-1) for Grid Integration of Wind Power Plants in August, 2017. The same has been circulated to all the concerned stakeholders and uploaded on NEPRA web as well. NTDC has also been directed to submit its Indicative Generation Expansion Plan for the year 2017-18 and submit the Wind Power Plants addition for the next three years along with total installed capacities of the respective years.
Regarding revision in Grid Code Addendum No. 2 for solar power plants NTDC has been communicated to expedite the process and submit it to the Authority for approval.
7.3 PROGRESS ON DISTRIBUTION CODE REVIEW PANELAccording to Distribution Code, all NEPRA Distribution Licensees must comply with Distribution Code at all times. In this regard, the Distribution Code Review Panel (DCRP) was established in October, 2014. DCRP met on different dates to deliberate on the issues of distribution companies pertaining to interconnection issues of Generators and conerns of up-coming small Solar, Wind and consumers involved in Net-Metering (Distributed Generation) to implement the Authority approved, NEPRA (Alternative and Renewable Energy) Distributed Generation and Net-Metering Regulations, 2015. Accordingly, the panel decided that:
(a) Singlephaseinvertermeetingthespecificationsshallbeacceptedfor5kWsolarDistributed Generator,
(b) Process applications for net metering upto 10 kW without any study,

124
(c) Each DISCO shall establish net-metering facilitation cell,(d) Each DISCO should install a solar power plant of appropriate size in its Headquarter
to set an example and provide necessary training to its professionals.
The DISCO-wise detail of net-metering implementation in respect of licences issued to them and capacity addition up to June, 2017 is as under:
S. No. DISCO No. of Licences Capacity Added (kW)1 Peshawar Electric Supply Company Limited - -2 Tribal Area Electric Supply Company Limited - -3 Islamabad Electric Supply Company Limited 51 1,037.964 Gujranwala Electric Power Company Limited 3 11.005 Lahore Electric Supply Company Limited 36 468.206 Faisalabad Electric Supply Company Limited 2 305.007 Multan Electric Power Company Limited 10 470.578 Hyderabad Electric Supply Company Limited - -9 Sukkur Electric Power Company Limited - -10 Quetta Electric Supply Company Limited - -11 Bahria Town (Pvt.) Limited 6 52.9512 K-Electric Limited - -
Total 108 2,345.68Source: NEPRA
7.4 PPIB ROLE, PLANNED ACTIVITIES, PROGRESS AND ACHIEVEMENTS Private Power and Infrastructure Board (PPIB) is a “One Window” facilitator for investors in power sector on behalf of the Government of Pakistan. Appreciating the IPPs model for implementation of projects and bringing transparency and efficiency in the implementation and operation ofprivate sector projects, role of PPIB has been expanded by allowing it to facilitate public sector projects in IPP mode. Currently PPIB is implementing thirty two multiple fuel (Hydro, coal and RLNG) based projects of 20,686 MW power generation capacity. Out of these, 16 projects of 6,430 MW cumulative capacity are hydro based projects, 12 projects of 9,373 MW are based on coal while 4 projects of 4,883 MW are based on RLNG. In addition, PPIB is working on enhancing transmission network capacities, and currently implementing + 660 kV HVDC Matiari-Lahore Transmission Line Project with the collaboration of private sector under “Policy Framework for Private Sector Transmission Line Projects, 2015” (Transmission Line Policy). These projects are at different stages of development, some are in testing and commissioning phase, some are under construction,whileothersareunderfinancialclosingandpre-financialclosingstages.
PPIB is also facilitating the provinces and investors in development of small hydropower projects under tripartite Letter of Support (LOS) regime. In this regard, PPIB has recently signed facility agreements with the Government of Punjab and Government of Khyber Pakhtunkhwa while the said agreement will soon be signed with the Government of AJ&K. This initiative will attract and encourage potential investors in developing small to medium size hydropower projects which will enhance power generation capacity and reduce burden on the National Grid.
PPIBisafrontrunnerinstitutioninimplementationofflagshipCPECinitiativebyprocessingmajorchunk of power generation and transmission projects under CPEC framework. Form current portfolio, nine coal based power projects of 8,220 MW, three hydropower projects of 2,714 MW and a Matiari-Lahore Transmission Line Project worth billions of US$ are being processed by PPIB under CPEC.
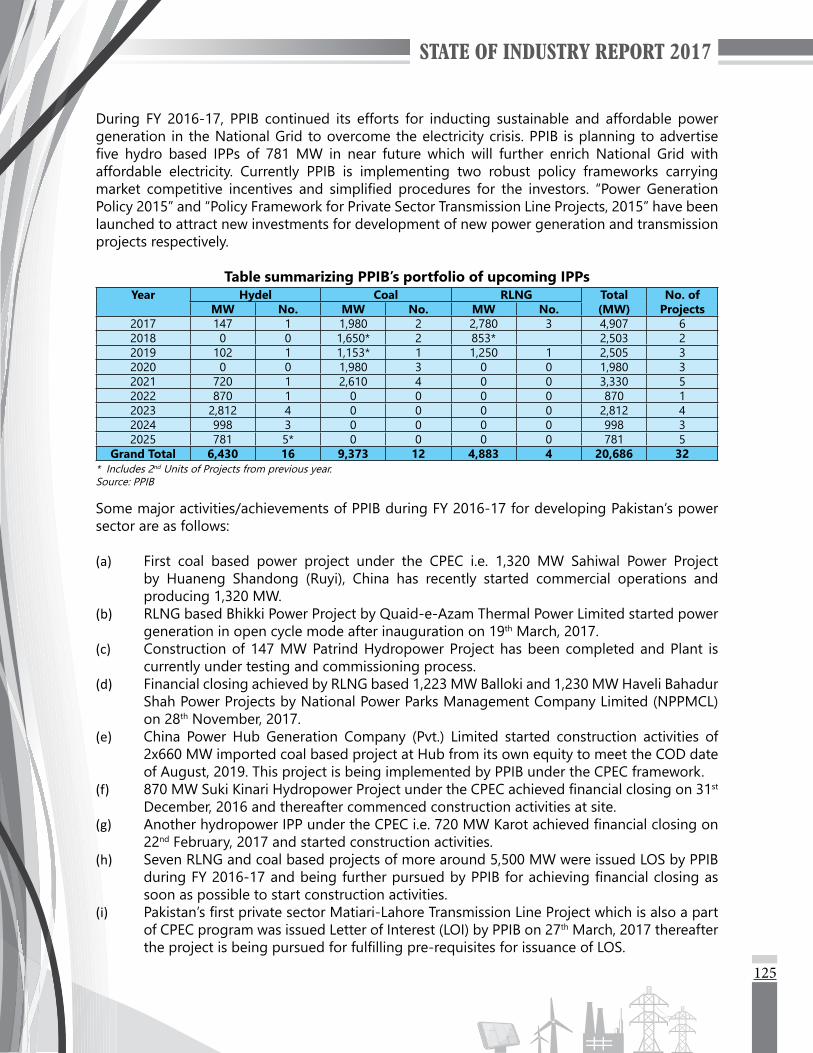
125
During FY 2016-17, PPIB continued its efforts for inducting sustainable and affordable power generation in the National Grid to overcome the electricity crisis. PPIB is planning to advertise five hydro based IPPs of 781MW in near future which will further enrichNational Grid withaffordable electricity. Currently PPIB is implementing two robust policy frameworks carrying market competitive incentives and simplified procedures for the investors. “PowerGenerationPolicy 2015” and “Policy Framework for Private Sector Transmission Line Projects, 2015” have been launched to attract new investments for development of new power generation and transmission projects respectively.
Table summarizing PPIB’s portfolio of upcoming IPPsYear Hydel Coal RLNG Total
(MW)No. of
ProjectsMW No. MW No. MW No.2017 147 1 1,980 2 2,780 3 4,907 62018 0 0 1,650* 2 853* 2,503 22019 102 1 1,153* 1 1,250 1 2,505 32020 0 0 1,980 3 0 0 1,980 32021 720 1 2,610 4 0 0 3,330 52022 870 1 0 0 0 0 870 12023 2,812 4 0 0 0 0 2,812 42024 998 3 0 0 0 0 998 32025 781 5* 0 0 0 0 781 5
Grand Total 6,430 16 9,373 12 4,883 4 20,686 32* Includes 2nd Units of Projects from previous year.Source: PPIB
Some major activities/achievements of PPIB during FY 2016-17 for developing Pakistan’s power sector are as follows:
(a) First coal based power project under the CPEC i.e. 1,320 MW Sahiwal Power Project by Huaneng Shandong (Ruyi), China has recently started commercial operations and producing 1,320 MW.
(b) RLNG based Bhikki Power Project by Quaid-e-Azam Thermal Power Limited started power generation in open cycle mode after inauguration on 19th March, 2017.
(c) Construction of 147 MW Patrind Hydropower Project has been completed and Plant is currently under testing and commissioning process.
(d) Financial closing achieved by RLNG based 1,223 MW Balloki and 1,230 MW Haveli Bahadur Shah Power Projects by National Power Parks Management Company Limited (NPPMCL) on 28th November, 2017.
(e) China Power Hub Generation Company (Pvt.) Limited started construction activities of 2x660 MW imported coal based project at Hub from its own equity to meet the COD date of August, 2019. This project is being implemented by PPIB under the CPEC framework.
(f) 870MWSukiKinariHydropowerProjectundertheCPECachievedfinancialclosingon31st December, 2016 and thereafter commenced construction activities at site.
(g) AnotherhydropowerIPPundertheCPECi.e.720MWKarotachievedfinancialclosingon22nd February, 2017 and started construction activities.
(h) Seven RLNG and coal based projects of more around 5,500 MW were issued LOS by PPIB duringFY2016-17andbeingfurtherpursuedbyPPIBforachievingfinancialclosingassoon as possible to start construction activities.
(i) Pakistan’sfirstprivatesectorMatiari-LahoreTransmissionLineProjectwhichisalsoapartof CPEC program was issued Letter of Interest (LOI) by PPIB on 27th March, 2017 thereafter theprojectisbeingpursuedforfulfillingpre-requisitesforissuanceofLOS.
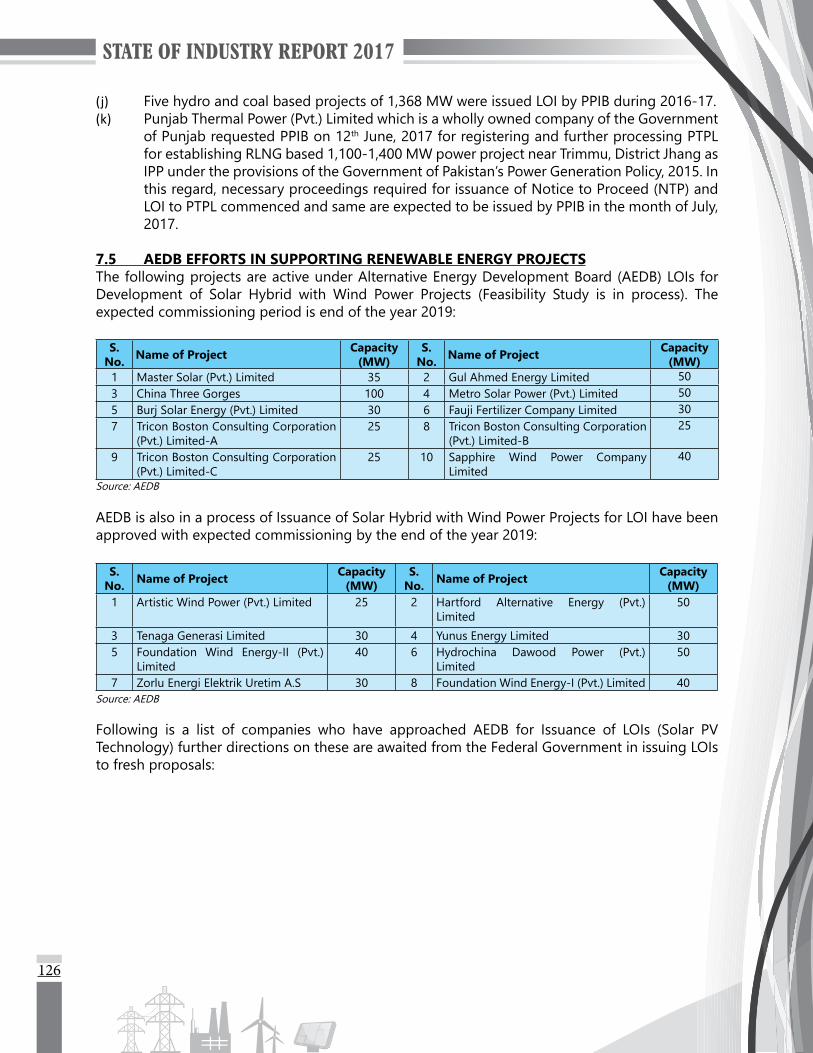
126
(j) Five hydro and coal based projects of 1,368 MW were issued LOI by PPIB during 2016-17.(k) Punjab Thermal Power (Pvt.) Limited which is a wholly owned company of the Government
of Punjab requested PPIB on 12th June, 2017 for registering and further processing PTPL for establishing RLNG based 1,100-1,400 MW power project near Trimmu, District Jhang as IPP under the provisions of the Government of Pakistan’s Power Generation Policy, 2015. In this regard, necessary proceedings required for issuance of Notice to Proceed (NTP) and LOI to PTPL commenced and same are expected to be issued by PPIB in the month of July, 2017.
7.5 AEDB EFFORTS IN SUPPORTING RENEWABLE ENERGY PROJECTSThe following projects are active under Alternative Energy Development Board (AEDB) LOIs for Development of Solar Hybrid with Wind Power Projects (Feasibility Study is in process). The expected commissioning period is end of the year 2019:
S. No. Name of Project Capacity
(MW)S.
No. Name of Project Capacity (MW)
1 Master Solar (Pvt.) Limited 35 2 Gul Ahmed Energy Limited 503 China Three Gorges 100 4 Metro Solar Power (Pvt.) Limited 505 Burj Solar Energy (Pvt.) Limited 30 6 Fauji Fertilizer Company Limited 307 Tricon Boston Consulting Corporation
(Pvt.) Limited-A25 8 Tricon Boston Consulting Corporation
(Pvt.) Limited-B25
9 Tricon Boston Consulting Corporation (Pvt.) Limited-C
25 10 Sapphire Wind Power Company Limited
40
Source: AEDB
AEDB is also in a process of Issuance of Solar Hybrid with Wind Power Projects for LOI have been approved with expected commissioning by the end of the year 2019:
S. No. Name of Project Capacity
(MW)S.
No. Name of Project Capacity (MW)
1 Artistic Wind Power (Pvt.) Limited 25 2 Hartford Alternative Energy (Pvt.) Limited
50
3 Tenaga Generasi Limited 30 4 Yunus Energy Limited 305 Foundation Wind Energy-II (Pvt.)
Limited40 6 Hydrochina Dawood Power (Pvt.)
Limited50
7 Zorlu Energi Elektrik Uretim A.S 30 8 Foundation Wind Energy-I (Pvt.) Limited 40Source: AEDB
Following is a list of companies who have approached AEDB for Issuance of LOIs (Solar PV Technology) further directions on these are awaited from the Federal Government in issuing LOIs to fresh proposals:

127
S. No. Name of Project Capacity
(MW)S.
No. Name of Project Capacity (MW)
1 KSJ International 200 2 Burj Capital Dubai 503 RT Power (Pvt.) Limited 12 4 MST Power (Pvt.) Limited 65 Liberty Solar Energy Limited 50 6 Ravi Renewable Energy (Pvt.) Limited 207 Gran Solar 20 8 Fotowatio Renewable Venture 509 Conergy 50 10 China Han Power 5011 Associated Technologies 50 12 MI Solar (Pvt.) Limited 10013 Uch-II Power (Pvt.) Limited 10
Source: AEDB
Following companies are expected to approach AEDB for Issuance of LOIs (Directions are awaited from Federal Government in issuing LOIs to fresh proposals):
S. No. Name of Project Capacity
(MW)S.
No. Name of Project Capacity (MW)
1 CTG South Asia Investment Limited 100 2 RAI Energy International 503 Solar Capital Renewable Energy 100 4 CTG Eagle 2 505 HydroChina Dawood Power (Pvt.) Limited 50 6 Novatex Limited 207 Sky Power Global 50 8 CTG 2nd Solar Power Project 3 509 CTG 2nd Solar Power Project 4 50 10 CTG 2nd Solar Power Project 1 5011 CTG 2nd Solar Power Project 2 50 12 Eni Pakistan Limited 5013 NSED Sindh Generation One 50 14 NSED Sindh Generation Two 5015 NSED Sindh Generation Three 50 16 NSED Sindh Generation Four 5017 China Han Power 50 18 SECI Energia-I 5919 SECI Energia-II 59 20 Din Group 5021 Nishat Group and Associates 20 22 Adenium Energy Capital 20023 Renetron Energy (Pvt.) Limited-I 10 24 Renetron Energy (Pvt.) Limited-II 1025 Philadelphia Solar 50 26 Transtech Pakistan-I 5027 S2 Power Limited 5 28 Solar Capital Renewable Energy-I 10029 Buksh Power Unit-II (Pvt.) Limited 10 30 Buksh Power Unit-II (Pvt.) Limited 1031 Nizam Power Way (Pvt.) Limited-I 50 32 Nizam Power Way (Pvt.) Limited-II 5033 Nizam Power Way (Pvt.) Limited-III 20 34 Nizam Power Way (Pvt.) Limited-IV 2035 MIS Solar (Pvt.) Limited 100 36 Nizam Power Way (Pvt.) Limited-V 1037 Nizam Power Way (Pvt.) Limited-VI 10 38 Nizam Power Way (Pvt.) Limited-VII 2039 Dawood Lawrencepur Limited 15 40 United Energy Group Renewable 5041 United Energy Group Renewable 50 42 Gran Solar 2043 Progressive Renewable Energy 20 44 Scatec ASA-I 5045 Scatec ASA-II 50 46 Green Pak Energy 1547 K2 SPV (Pvt.) Limited 50 48 Al Javal JV TTG 5049 Transtech Pakistan-II 100 50 Solar Capital Renewable Energy-II 100
Source: AEDB
7.6 PEDO EFFORTS IN SUPPORTING HYDEL AND RENEWABLE ENERGY PROJECTSCurrently Pakhtunkhwa Energy Development Organization (PEDO) is processing 2,000 MW capacity of Hydel and Solar Projects. Following is a list of 6 solicited sites having 518 MW capacity under development:

128
S. No. Name of Project Capacity (MW) S. No. Name of Project Capacity (MW)1 Naran HPP Mansehra 188 2 Shigo Kas HPP, Dir Lower 102
3 Arkari Gol, Chitral 99 4 Bata Kundi, Mansehra 96
5 Ghorband Khwar, Shangla 21 6 Nandihar Khwar, Batagram 12Source: PEDO
Details of progress in the relevant areas is noted here:
(a) 70 Registrations received,(b) 56 SOQ’s submitted,(c) 32SOQ’sPre-Qualifiedwhere,(d) 27 RFP’s purchased for bidding,(e) Pre-Bid Conference was held on 6th January, 2017,(f) Networking Dinner event was held on 9th January, 2017,(g) Proposal Submission and Bidding deadline 25th April, 2017.
Time Line of Processing:Activity Time DatesIssuanceofRFPtoPre-QualifiedBidders - 7 November, 2016Pre-Bid Meeting(s) from Issuance of RFP 2 Months 6 January, 2017Bid Submission Deadline/Receipt of Bids from RFP Issuance 6 Months 25 April, 2017Opening of Technical Bids (Envelope-I) Same Day 25 April, 2017Clarification/EvaluationofTechnicalBids 45 Days 10 May, 2017NotificationofTechnicallyResponsiveBidders 7 days 20 May, 2017Opening of Financial Bids (Envelope-II) of Technically Bidders 30 Days 20 June, 2017Evaluation of Financial Bids (Envelope-II) 30 Days 20 July, 2017Bid Evaluation Report Approval by PEDO Board 15 Days 5 August, 2017ApprovalofEvaluationReportandRanking/NotificationofSuccessfulBidder(rankedfirst)byNEPRA
15 Days 20 August, 2017
Submission of application by Successful Bidder (ranked first) forapproval of Tariff to NEPRA. The first ranked Bidder, will apply forGeneration Licence in accordance with the applicable rules and regulations of NEPRA.
15 Days 5 September, 2017
Approval of Tariff and Intimation to Federal Government by NEPRA for notificationinpursuanceofSection31(4)ofNEPRAAct
15 Days 20 September, 2017
NotificationofTariffinOfficialGazette 15 Days 5 October, 2017Letter of Award to the Successful Bidder 15 Days 20 October, 2017Submission of Performance Guarantee @US$ 5,000/MW and Processing Fee (FA) by the Successful Bidder, FS Cost, Project Comp, Gen. LicenceIssuance of LOS by PEDO and PPIB to the Successful Bidder 30 Days 20 November, 2017Project Agreements, Financial Close (from issuance of LOS) 18 Months June, 2019Commercial Operation Date DependsonProjectConfiguration

129
Under-Development Semi-Raw Sites: S. No. Name of Project Capacity (MW) Status
1 Gandigar HPP, Dir 3.21 Request for extension received from sponsor in period of LOI
2 Mastuj River HPP, Chitral 48.62 Feasibility Study approved by POE
3 Balkani HPP, Shangla 7.75 Feasibility Study approved by POE
4 Sharmai HPP, Dir 150 Awarded and LOI issued Source: PEDO
Raw Sites:330 Raw Sites having 918 MW Capacity
Category Total Projects
Capacity >=1 MW
Capacity< 1 MW
Capacity (kW)
Operational Projects 9 1 8 3,601FS Approved in NEPRA/PPIB/Environment etc. 8 7 1 65,156FS Approved/In Process and Under Construction (captive) Projects 7 2 5 5,815FS Submitted and in Process of Approval 79 1 78 5,257LOIs with in Validity Period (12 months from issuance or extended after expiry)
12 8 4 46,895
Registrations Issued under KPK Hydropower Policy 2016 45 16 29 335,765Registrations under Power Policy 2006 56 14 42 380,467Expired LOIs 45 1 44 3,149Cancelled Projects 17 2 15 17,964NOCs Issued and BG not submitted 28 1 27 3,252Applications Received 24 12 12 51,025Total 330 65 265 918,346
Source: PEDO
New Sites Advertised:Registrations are in progress for the following newly advertised 7 semi-raw sites of 87.00 MW capacity:
S. No. Name of Project Capacity (MW) S. No. Name of Project Capacity
(MW)1 Nilada Katha HPP, Mansehra 2.47 2 Bhimbal Katha HPP, Mansehra 7.863 Chowkel Khwar HPP, Swat 12.00 4 Ayun Gol HPP, Chitral 15.175 Baram Gol HPP, Chitral 24.93 6 Kedam Khwar HPP, Swat 17.147 Saif-ul-Malook Katha HPP, Mansehra 7.43
Source: PEDO
Solar Projects:Total 8 projects are under process of total capacity of 353.5 MW.5 Projects in Feasibility Study Stage.LOIs has been issued against 5 solar projects of total 203.5 MW capacity.

130
S. No. Location Capacity (MW) Status of LOI
1 Kolachi, D.I. Khan 50 LOI issued on 22nd September, 2016
2 Kolachi, D.I. Khan 50 LOI Issued to Target Energy
3 Paharpur, D.I. Khan 3.5 LOI issued on 21st July, 2016
4 District Nowshehra 50 LOI issued on 28th December, 2015
5 Lachi, Kohat 50 LOI Issued on 12th May, 2016
Source: PEDO
7.7 FUNCTIONS OF THE PPDB BOARDPunjab Power Development Board (PPDB) has been established as “One Window” facilitator to promote and encourage private sector participation. The Board shall:
(a) Facilitate the private investors on behalf of the Government in matters relating to the setting up of power projects in accordance with the policy of the Government;
(b) Implement the policy of the Government relating to power generation and coordinate with variousdepartmentsandagenciesoftheGovernmentinthefieldofpowergeneration;
(c) Negotiate and finalize, with the prospective private investors in the power sector, theimplementation plans, feasibility studies and operational plans;
(d) Receive fees and charges from private investors in processing of their applications for power projects and shall deposit and disburse the fees or charges;
(e) Correspond with the local or international agencies in the performance of its functions under this Act;
(f) Issuenoobjectioncertificate,permissionorlicenceforuseofcanalorriverwaterorlandof the Government for power generation;
(g) Explore potential sites for hydel and coal power generation and develop non-conventional sources of energy including solar, wind, biomass, biogas and solid waste;
(h) Examine energy policies of the Federal Government and advise the Government on effect of the policies of the Federal Government;
(i) Co-ordinate with the Federal Government or any authority or agency of the Federal Government for installation of power houses, grid stations and transmission lines according to needs of the Province;
(j) Encourage and ensure exploitation of indigenous resources for development of thermal or hydel power projects in the Province;
(k) Encourage the local and foreign entities to form joint ventures for participation in the development of the power projects;
(l) Advise the Government on bulk power supply from the National Grid for transmission and distribution within the Province, levy of tax on consumption of electricity, laying of transmission lines and determination of power tariff for distribution of electricity within the Province;
(m) Acquire, where necessary, land for power projects; and(n) Perform such other functions as may be prescribed to promote power generation in the
Province.

STATE OF INDUSTRY REPORT 2017
MISCELLANEOUS


133
MISCELLANEOUS
8.1 SUMMARY OF ACTIVITIES DURING 2016-17The following sections provide summary of various activities by NEPRA during 2016-17 and also includes brief information on the Board of Directors Meetings for different DISCOs.
8.1.1 Promulgation of New Rule(s)/Regulation(s)/Guideline(s):S.
No.Name of Rule/
Regulation/Guideline Notified Vide Salient Features
1
NEPRA Guidelines to Lay Down the Methodology and Process for Determination of Revenue Requirement and Use of System Charges (UOSC) for Transmission Licensee
SRO 241(I)/2017 dated 06-04-2017
The guidelines provides transparent methodology for the determination of transmission revenues and UOSC that is predictable and certain in its operation and for the licensees to know in advance and prepare tariff petitions with adequate information.
2NEPRA Competitive Bidding Tariff (Approval Procedure) Regulations, 2017
SRO 306(I)/2017 dated 02-05-2017
These regulations lay down the procedure for approval of tariff arrived at through a competitive bidding process.
3
NEPRA (Selection of Engineering Procurement and Construction Contractor by Independent Power Procedures) Guidelines, 2017
SRO 350(I)/2017 dated 17-05-2017
These guidelines provide transparency for selection of EPC Contractor by IPPs for whole or part of the power project, through tendering processes.
4 NEPRA (Import of Power) Regulations, 2017
SRO 549(I)/2017 dated 22-06-2017
These regulations lay down the procedure for import of electric power, whereby a Distribution Company or Market Operator desirous of entering into a PPA with a Seller in accordance with Rates approved by the Authority.
Source: NEPRA
8.1.2 Amendments in NEPRA Rule(s)/Regulation(s)/Guideline(s)/Code(s):S.
No.Name of Rule/
Regulation/Guideline Notified Vide Salient Features
1
Amendment in NEPRA Service Regulations, 2003
SRO 1019(I)/2016 dated 31-10-2016
Amendment in Regulation 2, 14, 115, Appendix-1, Appendix-2 and Appendix-2A.
2 SRO 144(I)/2017 dated 10-03-2017
Insertion of New Regulation 18(A).
3 SRO 253(I)/2017 dated 10-04-2017
Amendment in Appendix-1.
4 Amendment in NEPRA Licensing (ApplicationandModificationProcedure) Regulations, 1999
SRO 25(I)/2017 dated 18-01-2017
Amendment in Regulation 3.
5 SRO 303(I)/2017 dated 02-05-2017
Amendment in Regulation 3.
6 Amendment in NEPRA Up-front Tariff (Approval and Procedure) Regulations, 2011
SRO 240(I)/2017 dated 06-04-2017
Amendment in Regulation 1.
7SRO 548(I)/2017
dated 22-06-2017Amendment in Regulation 1 and insertion of new Regulation 11.
Source: NEPRA
08
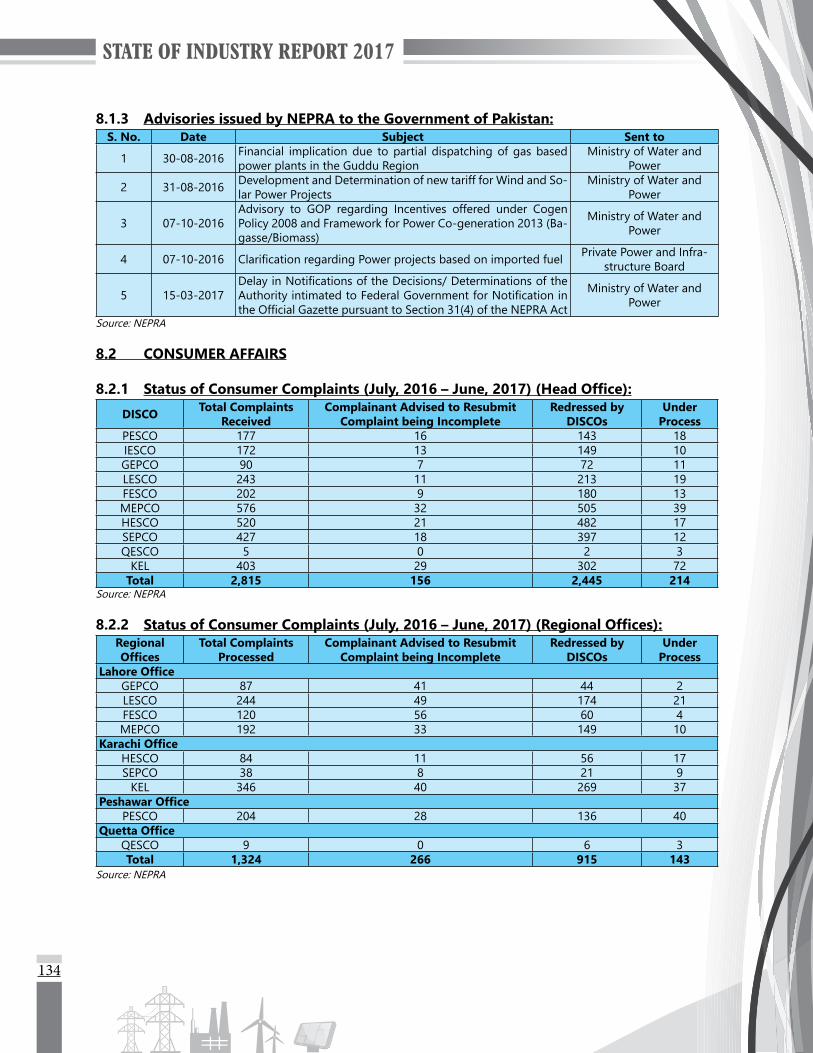
134
8.1.3 Advisories issued by NEPRA to the Government of Pakistan:S. No. Date Subject Sent to
1 30-08-2016 Financial implication due to partial dispatching of gas based power plants in the Guddu Region
Ministry of Water and Power
2 31-08-2016 Development and Determination of new tariff for Wind and So-lar Power Projects
Ministry of Water and Power
3 07-10-2016Advisory to GOP regarding Incentives offered under Cogen Policy 2008 and Framework for Power Co-generation 2013 (Ba-gasse/Biomass)
Ministry of Water and Power
4 07-10-2016 ClarificationregardingPowerprojectsbasedonimportedfuel Private Power and Infra-structure Board
5 15-03-2017DelayinNotificationsoftheDecisions/DeterminationsoftheAuthorityintimatedtoFederalGovernmentforNotificationintheOfficialGazettepursuanttoSection31(4)oftheNEPRAAct
Ministry of Water and Power
Source: NEPRA
8.2 CONSUMER AFFAIRS
8.2.1 Status of Consumer Complaints (July, 2016 – June, 2017) (Head Office):
DISCO Total Complaints Received
Complainant Advised to Resubmit Complaint being Incomplete
Redressed by DISCOs
Under Process
PESCO 177 16 143 18IESCO 172 13 149 10GEPCO 90 7 72 11LESCO 243 11 213 19FESCO 202 9 180 13MEPCO 576 32 505 39HESCO 520 21 482 17SEPCO 427 18 397 12QESCO 5 0 2 3
KEL 403 29 302 72Total 2,815 156 2,445 214
Source: NEPRA
8.2.2 Status of Consumer Complaints (July, 2016 – June, 2017) (Regional Offices):Regional Offices
Total Complaints Processed
Complainant Advised to Resubmit Complaint being Incomplete
Redressed by DISCOs
Under Process
Lahore OfficeGEPCO 87 41 44 2LESCO 244 49 174 21FESCO 120 56 60 4MEPCO 192 33 149 10
Karachi OfficeHESCO 84 11 56 17SEPCO 38 8 21 9
KEL 346 40 269 37Peshawar Office
PESCO 204 28 136 40Quetta Office
QESCO 9 0 6 3Total 1,324 266 915 143
Source: NEPRA
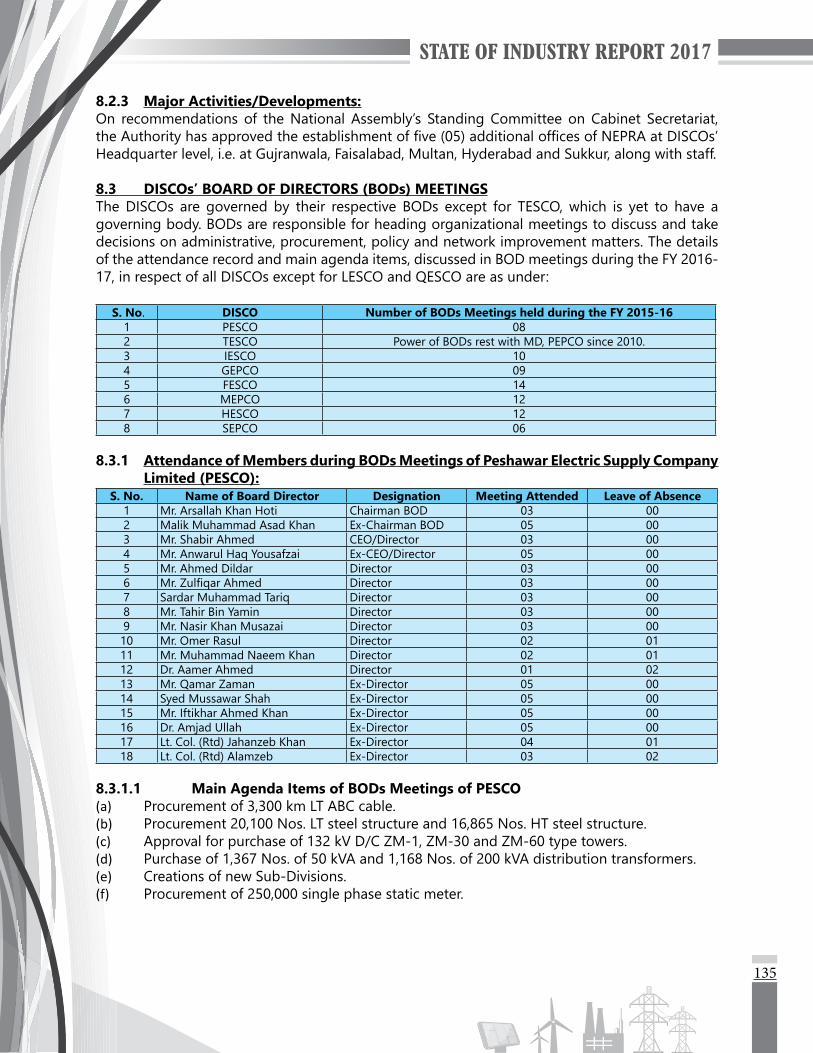
135
8.2.3 Major Activities/Developments:On recommendations of the National Assembly’s Standing Committee on Cabinet Secretariat, theAuthorityhasapprovedtheestablishmentoffive(05)additionalofficesofNEPRAatDISCOs’Headquarter level, i.e. at Gujranwala, Faisalabad, Multan, Hyderabad and Sukkur, along with staff.
8.3 DISCOs’ BOARD OF DIRECTORS (BODs) MEETINGSThe DISCOs are governed by their respective BODs except for TESCO, which is yet to have a governing body. BODs are responsible for heading organizational meetings to discuss and take decisions on administrative, procurement, policy and network improvement matters. The details of the attendance record and main agenda items, discussed in BOD meetings during the FY 2016-17, in respect of all DISCOs except for LESCO and QESCO are as under:
S. No. DISCO Number of BODs Meetings held during the FY 2015-161 PESCO 082 TESCO Power of BODs rest with MD, PEPCO since 2010.3 IESCO 104 GEPCO 095 FESCO 146 MEPCO 127 HESCO 128 SEPCO 06
8.3.1 Attendance of Members during BODs Meetings of Peshawar Electric Supply Company Limited (PESCO):
S. No. Name of Board Director Designation Meeting Attended Leave of Absence1 Mr. Arsallah Khan Hoti Chairman BOD 03 002 Malik Muhammad Asad Khan Ex-Chairman BOD 05 003 Mr. Shabir Ahmed CEO/Director 03 004 Mr. Anwarul Haq Yousafzai Ex-CEO/Director 05 005 Mr. Ahmed Dildar Director 03 006 Mr.ZulfiqarAhmed Director 03 007 Sardar Muhammad Tariq Director 03 008 Mr. Tahir Bin Yamin Director 03 009 Mr. Nasir Khan Musazai Director 03 0010 Mr. Omer Rasul Director 02 0111 Mr. Muhammad Naeem Khan Director 02 0112 Dr. Aamer Ahmed Director 01 0213 Mr. Qamar Zaman Ex-Director 05 0014 Syed Mussawar Shah Ex-Director 05 0015 Mr. Iftikhar Ahmed Khan Ex-Director 05 0016 Dr. Amjad Ullah Ex-Director 05 0017 Lt. Col. (Rtd) Jahanzeb Khan Ex-Director 04 0118 Lt. Col. (Rtd) Alamzeb Ex-Director 03 02
8.3.1.1 Main Agenda Items of BODs Meetings of PESCO(a) Procurement of 3,300 km LT ABC cable.(b) Procurement 20,100 Nos. LT steel structure and 16,865 Nos. HT steel structure.(c) Approval for purchase of 132 kV D/C ZM-1, ZM-30 and ZM-60 type towers.(d) Purchase of 1,367 Nos. of 50 kVA and 1,168 Nos. of 200 kVA distribution transformers.(e) Creations of new Sub-Divisions.(f) Procurement of 250,000 single phase static meter.

136
(g) Procurement of 602 km ACSR Osprey conductor.(h) Purchase of SF-6 circuit breakers, bus isolators, lightning arrestors, incoming panels and
relays.
8.3.2 Attendance of Members during BODs Meetings of Islamabad Electric Supply Company Limited (IESCO):
S. No. Name of Board Director Designation Meeting Attended Leave of Absence1 Mr. Mohammad Nadeem Khan Chairman BOD 09 002 Mr. Ghiasuddin Ahmed Ex-Chairman BOD 01 003 Mr. Basit Zaman Ahmed CEO/Director 03 004 Dr. Rana Abdul Jabbar Khan Ex-CEO/Director 07 005 Mr. Noor Ahmed Ex-Director 01 006 Ms. Samar Ihsan Ex-Director 00 017 Mr. Tariq Sadiq Ex-Director 01 008 Syed Hyder Sarfraz Abedi Ex-Director 00 019 Syed Aly Murtaza Ex-Director 01 0010 Mr. Naeem Iqbal Director 10 0011 Mr. Hassan Nasir Jamy Director 09 0012 Mr. Muhammad Iqbal Ratyal Director 09 0013 Mr. Ghazanfar Abbas Jilani Director 05 0414 Mr. Raheel Ijaz Director 08 0115 Mian Ayyaz Afzal Director 07 0216 Prof. Dr. Niaz Ahmed Akhtar Director 08 0117 Miss Ayla Majid Director 04 0518 Mr. Azmat Mahmud Director 08 01
8.3.2.1 Main Agenda Items of BODs Meetings of IESCO(a) Allocation of Budget for Load Data Improvement Project (LDIP)(b) Creation of Sub-Divisions through bifurcation of Bhara Kahu, Tarlai and Tarnol Sub-Division(c) Tender for purchase of 200 km, 11 kV Cable 240 mm2 (500 MCM) 1/Core, and procurement
of AAC Ant, ACSR Osprey, Conductor(d) Tender for purchase of 25 kVA, 50 kVA 100 kVA, 200 kVA, 400 kVA Distribution Transformers(e) Tender for purchase of HT Steel Structures 34.8’, HT Spun Pole 36’, LT Steel Structures 30.8’
LT Spun Poles 31’ and Procurement of 11 kV steel cross arms, 11 kV Dropout cutout(f) Approval of PC-I for 7th STG Project for the period 2016-17 to 2020-21(g) Procurement of single phase/3 phase static meter(h) Approval for Variation Order No. 2 (Transmission Line Mangla Powerhouse to Rajjar) signed
with M/s Pinggao-Potential (JV) under ADB funding – Tranche-II(i) Administrative approval of the main estimates of 5 Nos. proposed 132 kV Transmission
Lines emanating from under construction 500 kV Grid Station Chakwal under PSDP Budget for 7th STG amounting to Rs. 1,000 million.
( j) Approval of updated PC-I for DOP Project and ELR Project prepared by IESCO for the period 2015-16 to 2021-22
(k) Purchase of power from 3.2 MW Rehra and 3 MW Qadirabad Hydel Powerhouse located near 132 kV Bagh Grid Station owned by Power Development Organization, AJK
(l) Construction of control house building, electrical equipment foundations, transformer way, switchyard fence, cable trenches, boundary wall etc. at 132 kV Grid Station G-9, Islamabad
(m) Procurement of Steel Tubular Poles type SPA, SPD, SPG and allied accessories (Lot-XI) and Steel Towers type ZM-1, ZM-30 and ZM-60, Beam, Column, Earth Mast, Earthing Plate Forms and 11 kV Structure (Lot-XIV)
(n) Procurement of Rail Conductor, Grounding Conductor 95 mm sq., Aluminum Conductor 60 mm sq. and Earth Wire 7/0.116 (9 mm) (Lot-XII)
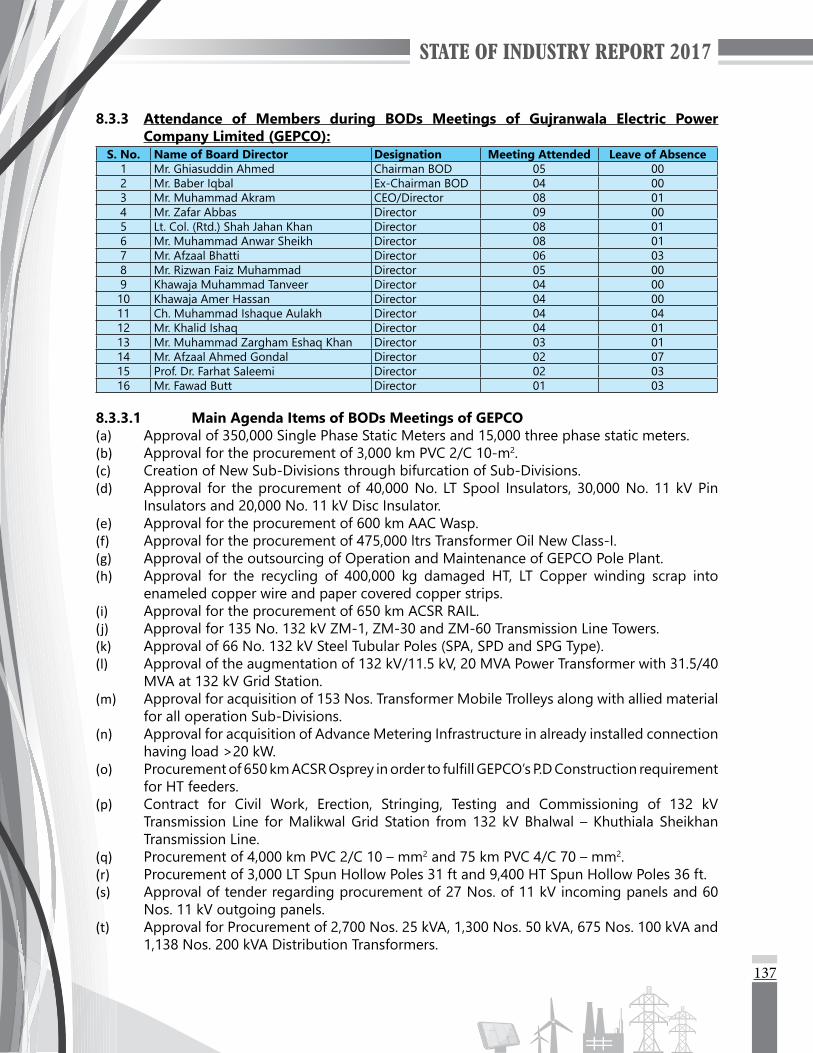
137
8.3.3 Attendance of Members during BODs Meetings of Gujranwala Electric Power Company Limited (GEPCO):
S. No. Name of Board Director Designation Meeting Attended Leave of Absence1 Mr. Ghiasuddin Ahmed Chairman BOD 05 002 Mr. Baber Iqbal Ex-Chairman BOD 04 003 Mr. Muhammad Akram CEO/Director 08 014 Mr. Zafar Abbas Director 09 005 Lt. Col. (Rtd.) Shah Jahan Khan Director 08 016 Mr. Muhammad Anwar Sheikh Director 08 017 Mr. Afzaal Bhatti Director 06 038 Mr. Rizwan Faiz Muhammad Director 05 009 Khawaja Muhammad Tanveer Director 04 0010 Khawaja Amer Hassan Director 04 0011 Ch. Muhammad Ishaque Aulakh Director 04 0412 Mr. Khalid Ishaq Director 04 0113 Mr. Muhammad Zargham Eshaq Khan Director 03 0114 Mr. Afzaal Ahmed Gondal Director 02 0715 Prof. Dr. Farhat Saleemi Director 02 0316 Mr. Fawad Butt Director 01 03
8.3.3.1 Main Agenda Items of BODs Meetings of GEPCO(a) Approval of 350,000 Single Phase Static Meters and 15,000 three phase static meters.(b) Approval for the procurement of 3,000 km PVC 2/C 10-m2.(c) Creation of New Sub-Divisions through bifurcation of Sub-Divisions. (d) Approval for the procurement of 40,000 No. LT Spool Insulators, 30,000 No. 11 kV Pin
Insulators and 20,000 No. 11 kV Disc Insulator.(e) Approval for the procurement of 600 km AAC Wasp.(f) Approval for the procurement of 475,000 ltrs Transformer Oil New Class-I.(g) Approval of the outsourcing of Operation and Maintenance of GEPCO Pole Plant.(h) Approval for the recycling of 400,000 kg damaged HT, LT Copper winding scrap into
enameled copper wire and paper covered copper strips.(i) Approval for the procurement of 650 km ACSR RAIL. (j) Approval for 135 No. 132 kV ZM-1, ZM-30 and ZM-60 Transmission Line Towers.(k) Approval of 66 No. 132 kV Steel Tubular Poles (SPA, SPD and SPG Type).(l) Approval of the augmentation of 132 kV/11.5 kV, 20 MVA Power Transformer with 31.5/40
MVA at 132 kV Grid Station.(m) Approval for acquisition of 153 Nos. Transformer Mobile Trolleys along with allied material
for all operation Sub-Divisions.(n) Approval for acquisition of Advance Metering Infrastructure in already installed connection
having load >20 kW.(o) Procurementof650kmACSROspreyinordertofulfillGEPCO’sP.DConstructionrequirement
for HT feeders.(p) Contract for Civil Work, Erection, Stringing, Testing and Commissioning of 132 kV
Transmission Line for Malikwal Grid Station from 132 kV Bhalwal – Khuthiala Sheikhan Transmission Line.
(q) Procurement of 4,000 km PVC 2/C 10 – mm2 and 75 km PVC 4/C 70 – mm2.(r) Procurement of 3,000 LT Spun Hollow Poles 31 ft and 9,400 HT Spun Hollow Poles 36 ft.(s) Approval of tender regarding procurement of 27 Nos. of 11 kV incoming panels and 60
Nos. 11 kV outgoing panels.(t) Approval for Procurement of 2,700 Nos. 25 kVA, 1,300 Nos. 50 kVA, 675 Nos. 100 kVA and
1,138 Nos. 200 kVA Distribution Transformers.
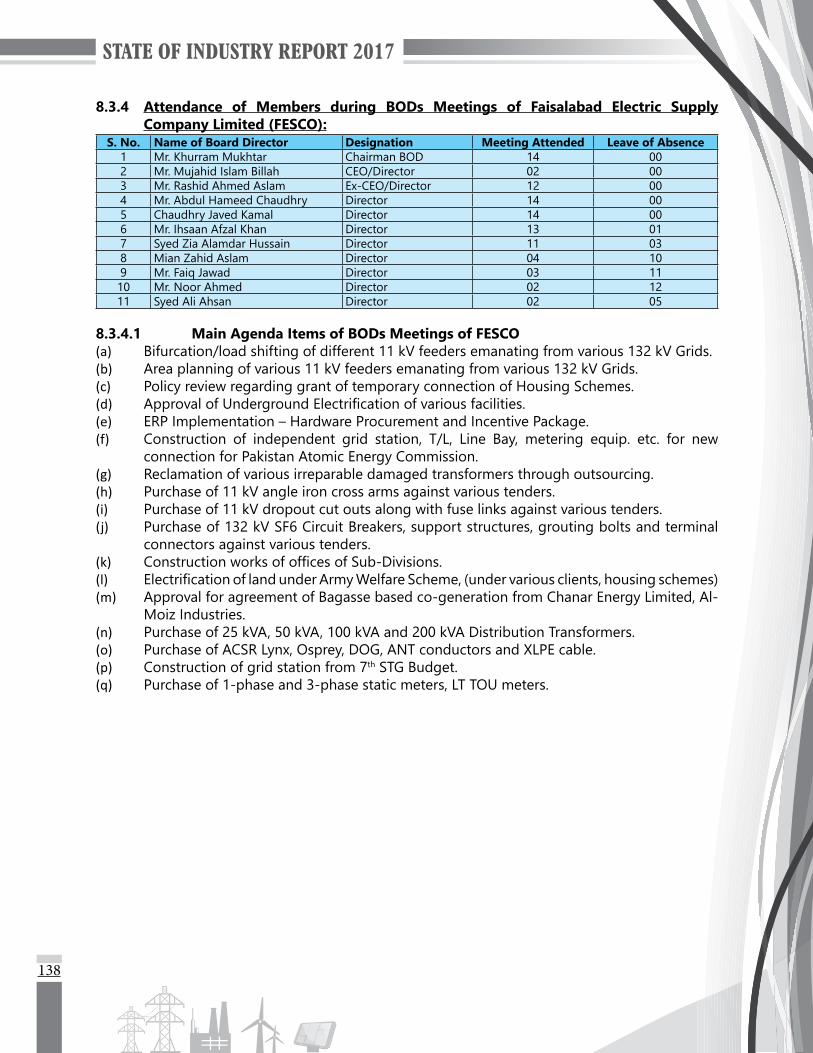
138
8.3.4 Attendance of Members during BODs Meetings of Faisalabad Electric Supply Company Limited (FESCO):
S. No. Name of Board Director Designation Meeting Attended Leave of Absence1 Mr. Khurram Mukhtar Chairman BOD 14 002 Mr. Mujahid Islam Billah CEO/Director 02 003 Mr. Rashid Ahmed Aslam Ex-CEO/Director 12 004 Mr. Abdul Hameed Chaudhry Director 14 005 Chaudhry Javed Kamal Director 14 006 Mr. Ihsaan Afzal Khan Director 13 017 Syed Zia Alamdar Hussain Director 11 038 Mian Zahid Aslam Director 04 109 Mr. Faiq Jawad Director 03 1110 Mr. Noor Ahmed Director 02 1211 Syed Ali Ahsan Director 02 05
8.3.4.1 Main Agenda Items of BODs Meetings of FESCO(a) Bifurcation/load shifting of different 11 kV feeders emanating from various 132 kV Grids.(b) Area planning of various 11 kV feeders emanating from various 132 kV Grids.(c) Policy review regarding grant of temporary connection of Housing Schemes.(d) ApprovalofUndergroundElectrificationofvariousfacilities.(e) ERP Implementation – Hardware Procurement and Incentive Package.(f) Construction of independent grid station, T/L, Line Bay, metering equip. etc. for new
connection for Pakistan Atomic Energy Commission.(g) Reclamation of various irreparable damaged transformers through outsourcing.(h) Purchase of 11 kV angle iron cross arms against various tenders.(i) Purchase of 11 kV dropout cut outs along with fuse links against various tenders.(j) Purchase of 132 kV SF6 Circuit Breakers, support structures, grouting bolts and terminal
connectors against various tenders.(k) ConstructionworksofofficesofSub-Divisions.(l) ElectrificationoflandunderArmyWelfareScheme,(undervariousclients,housingschemes)(m) Approval for agreement of Bagasse based co-generation from Chanar Energy Limited, Al-
Moiz Industries.(n) Purchase of 25 kVA, 50 kVA, 100 kVA and 200 kVA Distribution Transformers.(o) Purchase of ACSR Lynx, Osprey, DOG, ANT conductors and XLPE cable.(p) Construction of grid station from 7th STG Budget.(q) Purchase of 1-phase and 3-phase static meters, LT TOU meters.
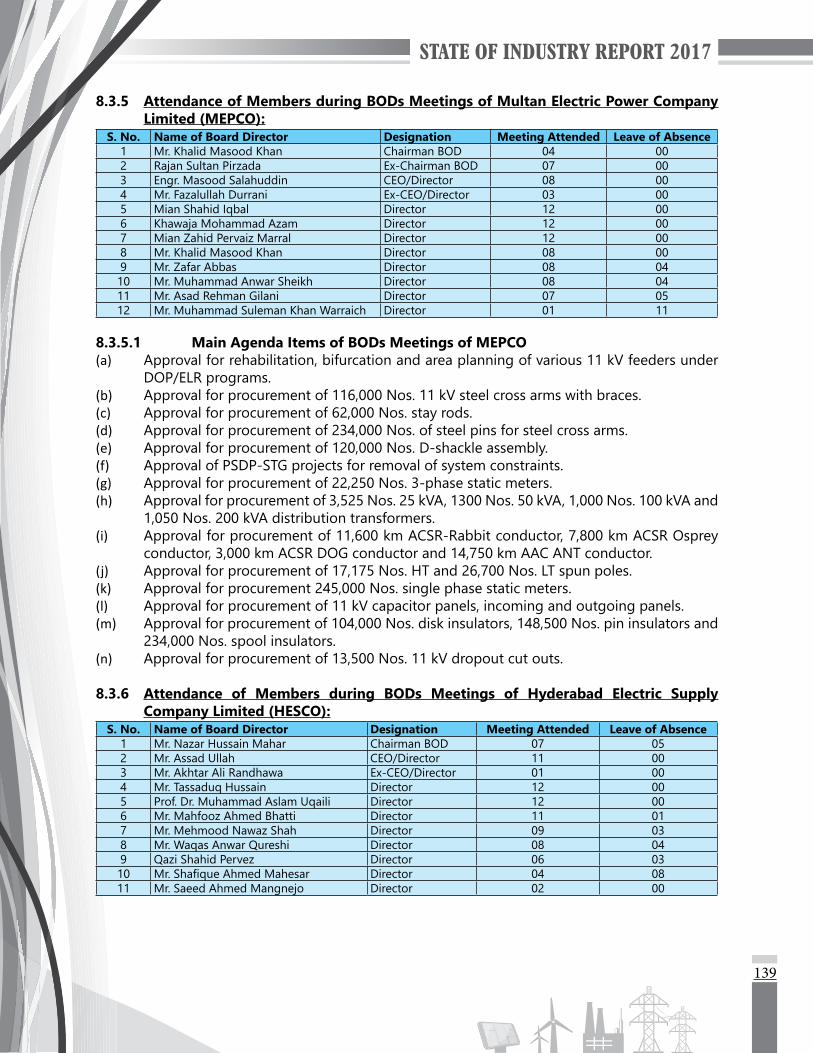
139
8.3.5 Attendance of Members during BODs Meetings of Multan Electric Power Company Limited (MEPCO):
S. No. Name of Board Director Designation Meeting Attended Leave of Absence1 Mr. Khalid Masood Khan Chairman BOD 04 002 Rajan Sultan Pirzada Ex-Chairman BOD 07 003 Engr. Masood Salahuddin CEO/Director 08 004 Mr. Fazalullah Durrani Ex-CEO/Director 03 005 Mian Shahid Iqbal Director 12 006 Khawaja Mohammad Azam Director 12 007 Mian Zahid Pervaiz Marral Director 12 008 Mr. Khalid Masood Khan Director 08 009 Mr. Zafar Abbas Director 08 0410 Mr. Muhammad Anwar Sheikh Director 08 0411 Mr. Asad Rehman Gilani Director 07 0512 Mr. Muhammad Suleman Khan Warraich Director 01 11
8.3.5.1 Main Agenda Items of BODs Meetings of MEPCO(a) Approval for rehabilitation, bifurcation and area planning of various 11 kV feeders under
DOP/ELR programs.(b) Approval for procurement of 116,000 Nos. 11 kV steel cross arms with braces.(c) Approval for procurement of 62,000 Nos. stay rods.(d) Approval for procurement of 234,000 Nos. of steel pins for steel cross arms.(e) Approval for procurement of 120,000 Nos. D-shackle assembly.(f) Approval of PSDP-STG projects for removal of system constraints.(g) Approval for procurement of 22,250 Nos. 3-phase static meters.(h) Approval for procurement of 3,525 Nos. 25 kVA, 1300 Nos. 50 kVA, 1,000 Nos. 100 kVA and
1,050 Nos. 200 kVA distribution transformers.(i) Approval for procurement of 11,600 km ACSR-Rabbit conductor, 7,800 km ACSR Osprey
conductor, 3,000 km ACSR DOG conductor and 14,750 km AAC ANT conductor.(j) Approval for procurement of 17,175 Nos. HT and 26,700 Nos. LT spun poles.(k) Approval for procurement 245,000 Nos. single phase static meters.(l) Approval for procurement of 11 kV capacitor panels, incoming and outgoing panels.(m) Approval for procurement of 104,000 Nos. disk insulators, 148,500 Nos. pin insulators and
234,000 Nos. spool insulators.(n) Approval for procurement of 13,500 Nos. 11 kV dropout cut outs.
8.3.6 Attendance of Members during BODs Meetings of Hyderabad Electric Supply Company Limited (HESCO):
S. No. Name of Board Director Designation Meeting Attended Leave of Absence1 Mr. Nazar Hussain Mahar Chairman BOD 07 052 Mr. Assad Ullah CEO/Director 11 003 Mr. Akhtar Ali Randhawa Ex-CEO/Director 01 004 Mr. Tassaduq Hussain Director 12 005 Prof. Dr. Muhammad Aslam Uqaili Director 12 006 Mr. Mahfooz Ahmed Bhatti Director 11 01 7 Mr. Mehmood Nawaz Shah Director 09 038 Mr. Waqas Anwar Qureshi Director 08 049 Qazi Shahid Pervez Director 06 0310 Mr.ShafiqueAhmedMahesar Director 04 0811 Mr. Saeed Ahmed Mangnejo Director 02 00
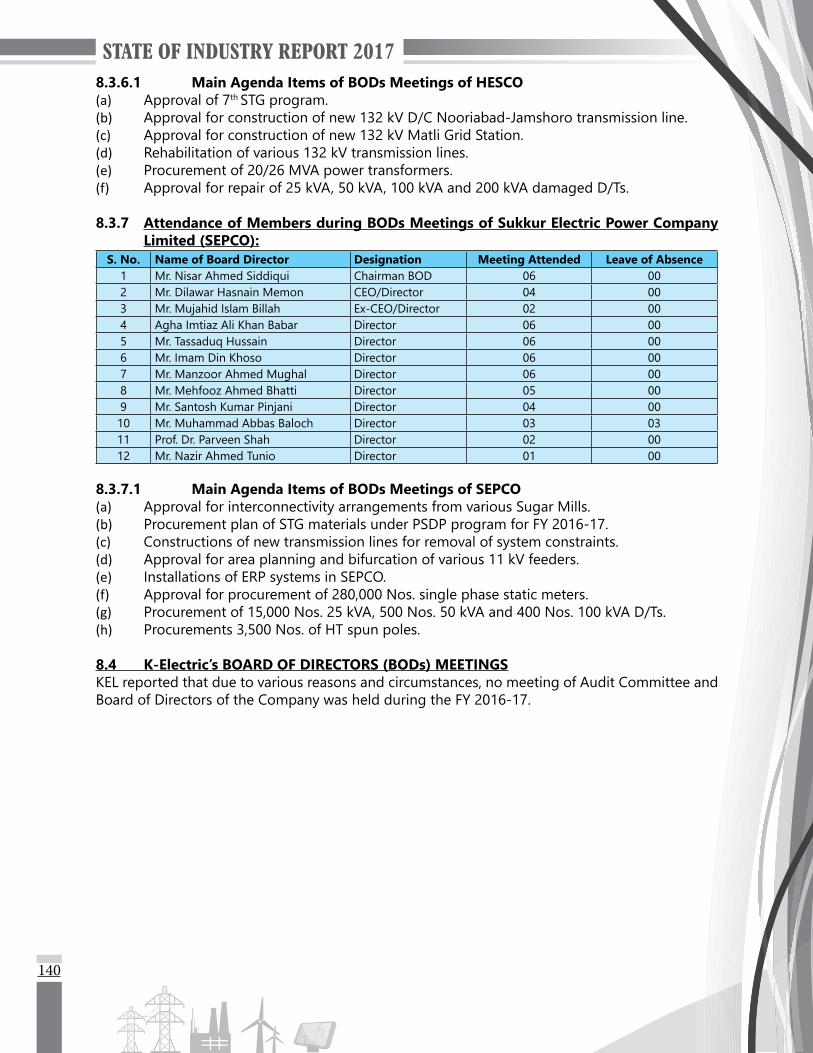
140
8.3.6.1 Main Agenda Items of BODs Meetings of HESCO(a) Approval of 7th STG program.(b) Approval for construction of new 132 kV D/C Nooriabad-Jamshoro transmission line.(c) Approval for construction of new 132 kV Matli Grid Station.(d) Rehabilitation of various 132 kV transmission lines.(e) Procurement of 20/26 MVA power transformers.(f) Approval for repair of 25 kVA, 50 kVA, 100 kVA and 200 kVA damaged D/Ts.
8.3.7 Attendance of Members during BODs Meetings of Sukkur Electric Power Company Limited (SEPCO):
S. No. Name of Board Director Designation Meeting Attended Leave of Absence1 Mr. Nisar Ahmed Siddiqui Chairman BOD 06 002 Mr. Dilawar Hasnain Memon CEO/Director 04 003 Mr. Mujahid Islam Billah Ex-CEO/Director 02 004 Agha Imtiaz Ali Khan Babar Director 06 005 Mr. Tassaduq Hussain Director 06 006 Mr. Imam Din Khoso Director 06 007 Mr. Manzoor Ahmed Mughal Director 06 008 Mr. Mehfooz Ahmed Bhatti Director 05 009 Mr. Santosh Kumar Pinjani Director 04 0010 Mr. Muhammad Abbas Baloch Director 03 0311 Prof. Dr. Parveen Shah Director 02 0012 Mr. Nazir Ahmed Tunio Director 01 00
8.3.7.1 Main Agenda Items of BODs Meetings of SEPCO(a) Approval for interconnectivity arrangements from various Sugar Mills. (b) Procurement plan of STG materials under PSDP program for FY 2016-17.(c) Constructions of new transmission lines for removal of system constraints.(d) Approval for area planning and bifurcation of various 11 kV feeders.(e) Installations of ERP systems in SEPCO.(f) Approval for procurement of 280,000 Nos. single phase static meters.(g) Procurement of 15,000 Nos. 25 kVA, 500 Nos. 50 kVA and 400 Nos. 100 kVA D/Ts.(h) Procurements 3,500 Nos. of HT spun poles.
8.4 K-Electric’s BOARD OF DIRECTORS (BODs) MEETINGSKEL reported that due to various reasons and circumstances, no meeting of Audit Committee and Board of Directors of the Company was held during the FY 2016-17.
STATE OF INDUSTRY REPORT 2017
ENERGY SECTOR OVERVIEW


143
ENERGY SECTOR OVERVIEW
9.1 GENERALPrimary commercial energy supplies in Pakistan comprises of oil, natural gas, coal, hydro and nuclear electricity. The primary energy supplies of the country during fiscal year 2015-16 increased by 5.27% and reached 73.97 MTOE as compared to 70.26 MTOE during the same period last year. The overall contribution of gas in primary energy supplies of the country, during 2015-16, was the highest with 30.46 MTOE (41.18%) followed by the Oil 25.28 MTOE (34.18%), Hydro Electricity 8.27 MTOE (11.18%), Coal 5.07 MTOE (6.85%), Nuclear Electricity 1.10 MTOE (1.49%), LPG 0.91 MTOE (1.23%), Imported Electricity 0.11 MTOE (0.15%), LNG Imported 2.40 MTOE (3.25%) and Renewable Energy 0.37 MTOE (0.50%).
9.2 OIL RESERVESThe balance recoverable reserves of crude oil of the country as on 30th June, 2016 were 350.632 million barrels while the production during fiscal year 2015-16 was recorded as 31.65 million barrels. The total oil refining capacity of the country as on 30th June, 2016 was 18.79 million tonnes per year while the total crude oil processed in the refineries of the country was 12.13 million tonnes. The total import of the crude oil of the country during 2015-16 was 8.68 million tonnes with cost amounting to US$ 2753.72 million while during 2014-15 the total import of crude oil was 8.33 million tonnes with total cost of US$ 4581.14 million. The consumption of petroleum products (Furnace Oil, Light Diesel Oil, High Speed Diesel and Motor Spirit) within the power sector was recorded as 7.765 million tonnes during 2015-16 while during 2014-15 it was recorded as 8.995 million tonnes.
9.3 GAS RESERVESThe balance recoverable reserves of natural gas of the country as on 30th June, 2016 were 19.16 trillion cft. while the production during fiscal year 2015-16 was recorded as 1481551 million cft. The consumption of natural gas in power sector during 2015-16 was recorded as 440593 million cft. while during 2014-15 it was recorded as 371562 million cft. The total network for distribution of natural gas in Pakistan as on 30th June, 2016 was 158307 km. The total number of natural gas consumers in Pakistan, as on 30th June, 2016 was 8017333 of which the share of domestic, commercial and industrial consumers were (7929305), (77400) and (10628), respectively.
9.4 COAL RESERVESThe estimated total coal reserves of the country as on 30th June, 2016 were about 186 billion tonnes while production of coal during 2015-16 was recorded as 4.14 million tonnes. The total coal imported during 2015-16 was 4.88 million tonnes, with cost amounting to Rs. 47415 million. The total coal consumption in power sector during 2015-16 was 204432 tonnes as compared to 151180 tonnes, same period previous year. The electricity generated through coal during fiscal years 2014-15 and 2015-16 was 102 GWh and 148 GWh respectively.
9.5 PRIMARY ENERGY SUPPLIESThe main primary energy production of the country consists of oil, gas, coal, nuclear electricity net generation (converted to Btu using the nuclear plants heat rate); and conventional hydroelectricity net generation (converted to Btu using the fossil-fueled plants heat rate). The primary commercial energy supplies by source from 2011-12 to 2015-16 is given in table 1:
09
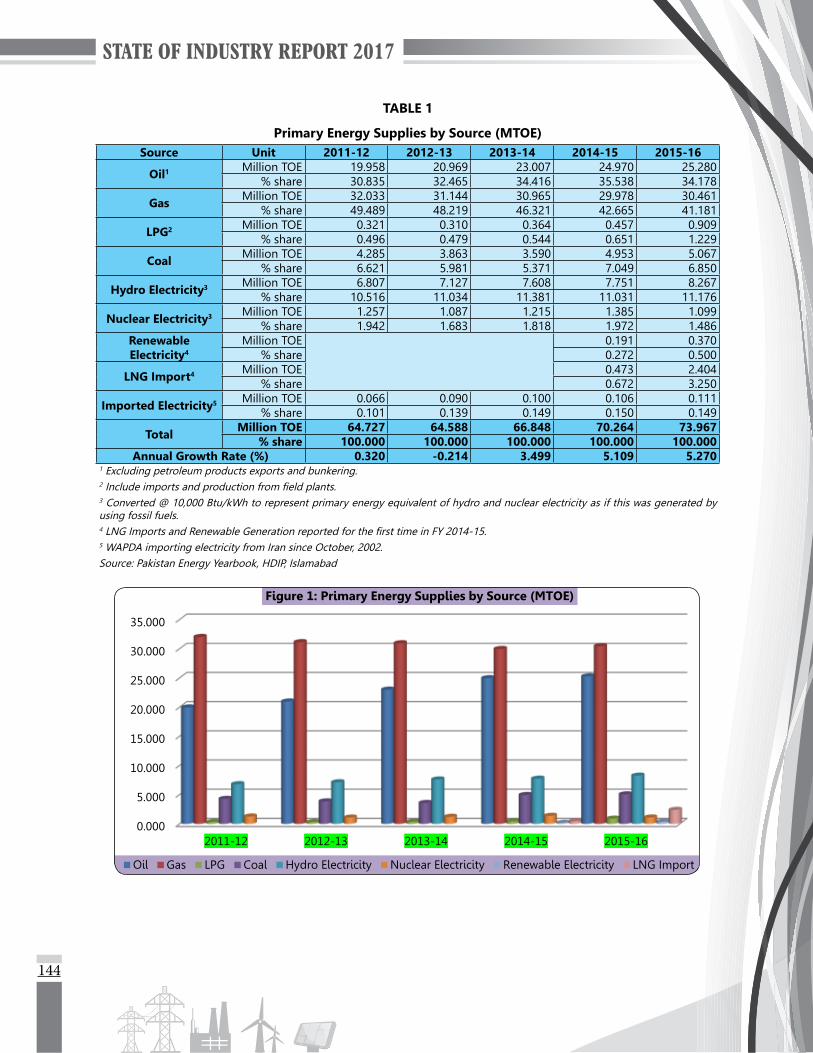
144
TABLE 1
Primary Energy Supplies by Source (MTOE)Source Unit 2011-12 2012-13 2013-14 2014-15 2015-16
Oil1 Million TOE 19.958 20.969 23.007 24.970 25.280% share 30.835 32.465 34.416 35.538 34.178
Gas Million TOE 32.033 31.144 30.965 29.978 30.461% share 49.489 48.219 46.321 42.665 41.181
LPG2 Million TOE 0.321 0.310 0.364 0.457 0.909% share 0.496 0.479 0.544 0.651 1.229
Coal Million TOE 4.285 3.863 3.590 4.953 5.067% share 6.621 5.981 5.371 7.049 6.850
Hydro Electricity3 Million TOE 6.807 7.127 7.608 7.751 8.267% share 10.516 11.034 11.381 11.031 11.176
Nuclear Electricity3 Million TOE 1.257 1.087 1.215 1.385 1.099% share 1.942 1.683 1.818 1.972 1.486
Renewable Electricity4
Million TOE 0.191 0.370% share 0.272 0.500
LNG Import4 Million TOE 0.473 2.404% share 0.672 3.250
Imported Electricity5 Million TOE 0.066 0.090 0.100 0.106 0.111% share 0.101 0.139 0.149 0.150 0.149
Total Million TOE 64.727 64.588 66.848 70.264 73.967% share 100.000 100.000 100.000 100.000 100.000
Annual Growth Rate (%) 0.320 -0.214 3.499 5.109 5.2701 Excluding petroleum products exports and bunkering.2 Include imports and production from field plants.3 Converted @ 10,000 Btu/kWh to represent primary energy equivalent of hydro and nuclear electricity as if this was generated by using fossil fuels.4 LNG Imports and Renewable Generation reported for the first time in FY 2014-15.5 WAPDA importing electricity from Iran since October, 2002.Source: Pakistan Energy Yearbook, HDIP, Islamabad
0.000
5.000
10.000
15.000
20.000
25.000
30.000
35.000
2011-12 2012-13 2013-14 2014-15 2015-16
Figure 1: Primary Energy Supplies by Source (MTOE)
Oil Gas LPG Coal Hydro Electricity Nuclear Electricity Renewable Electricity LNG Import
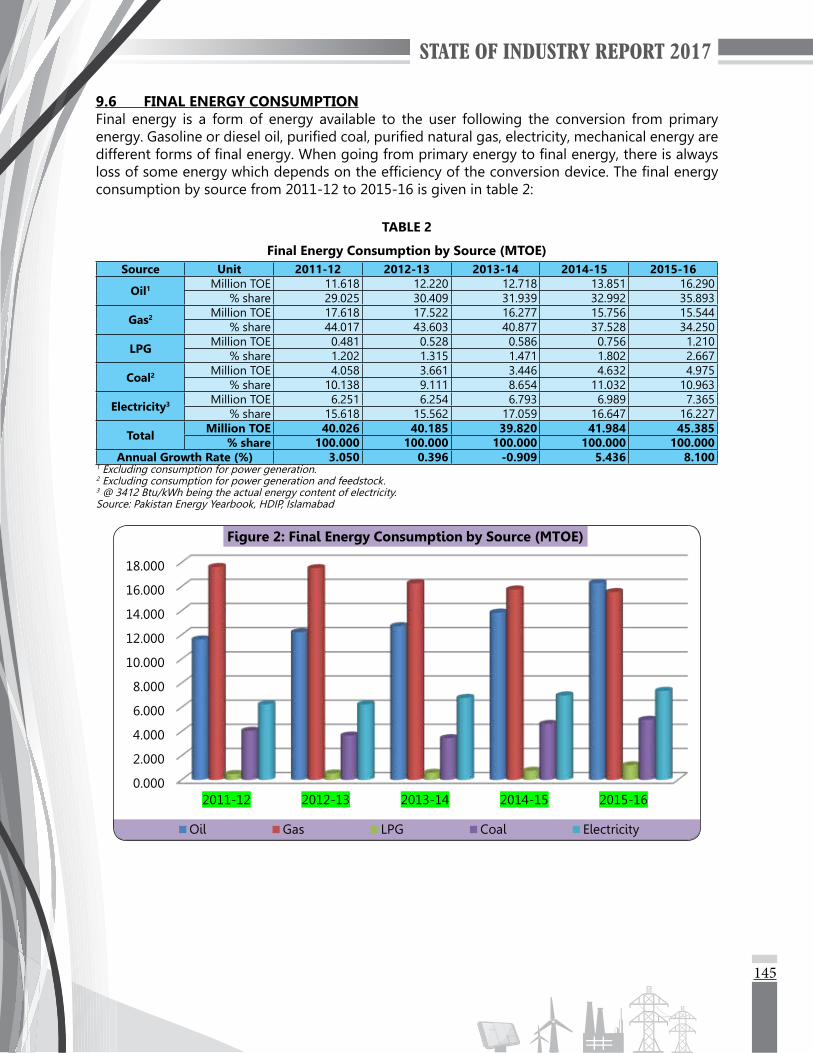
145
9.6 FINAL ENERGY CONSUMPTIONFinal energy is a form of energy available to the user following the conversion from primary energy. Gasoline or diesel oil, purified coal, purified natural gas, electricity, mechanical energy are different forms of final energy. When going from primary energy to final energy, there is always loss of some energy which depends on the efficiency of the conversion device. The final energy consumption by source from 2011-12 to 2015-16 is given in table 2:
TABLE 2
Final Energy Consumption by Source (MTOE)Source Unit 2011-12 2012-13 2013-14 2014-15 2015-16
Oil1 Million TOE 11.618 12.220 12.718 13.851 16.290% share 29.025 30.409 31.939 32.992 35.893
Gas2 Million TOE 17.618 17.522 16.277 15.756 15.544% share 44.017 43.603 40.877 37.528 34.250
LPG Million TOE 0.481 0.528 0.586 0.756 1.210% share 1.202 1.315 1.471 1.802 2.667
Coal2 Million TOE 4.058 3.661 3.446 4.632 4.975% share 10.138 9.111 8.654 11.032 10.963
Electricity3 Million TOE 6.251 6.254 6.793 6.989 7.365% share 15.618 15.562 17.059 16.647 16.227
Total Million TOE 40.026 40.185 39.820 41.984 45.385% share 100.000 100.000 100.000 100.000 100.000
Annual Growth Rate (%) 3.050 0.396 -0.909 5.436 8.1001 Excluding consumption for power generation.2 Excluding consumption for power generation and feedstock.3 @ 3412 Btu/kWh being the actual energy content of electricity.Source: Pakistan Energy Yearbook, HDIP, Islamabad
0.000
2.000
4.000
6.000
8.000
10.000
12.000
14.000
16.000
18.000
2011-12 2012-13 2013-14 2014-15 2015-16
Figure 2: Final Energy Consumption by Source (MTOE)
Oil Gas LPG Coal Electricity

146
9.7 FUEL CONSUMPTION IN POWER SECTORThe share of installed capacity of thermal power plants using oil, natural gas and coal to the total installed capacity in the country, during 2016-17, was about 63.40% while the electricity produced by the thermal power plants, during 2015-16, to the total electricity generated in the country during same period was about 64.57%. The statistics of different fuel used and their percentage share to the total fuel used for thermal electricity generation of the country from 2011-12 to 2015-16 are given in table 3 as follows:
TABLE 3
Fuel Consumption for Thermal Power Generation (TOE)Source Unit 2011-12 2012-13 2013-14 2014-15 2015-16
Gas TOE 6,732,876 7,084,177 6,602,422 6,847,894 8,577,146% share 47.45 48.28 42.69 43.57 52.78
Furnace Oil TOE 7,206,839 7,342,755 8,486,744 8,234,479 7,288,400% share 50.79 50.04 54.87 52.40 44.85
Diesel Oil TOE 203,072 218,584 304,994 565,953 294,755% share 1.43 1.49 1.97 3.60 1.81
Coal TOE 46,800 28,204 71,902 67,638 91,463% share 0.33 0.19 0.46 0.43 0.56
Total TOE 14,189,587 14,673,720 15,466,062 15,715,964 16,251,764% share 100.00 100.00 100.00 100.00 100.00
Annual Growth Rate (%) -1.94 3.41 5.40 1.62 3.41Source: Pakistan Energy Yearbook, HDIP, Islamabad
0.00
10.00
20.00
30.00
40.00
50.00
60.00
2011-12 2012-13 2013-14 2014-15 2015-16
Figure 3: Fuel Consumption for Thermal Power Generation (%)
Gas Furnace Oil Diesel Oil Coal
STATE OF INDUSTRY REPORT 2017
ELECTRICITY SECTOR OVERVIEW


149
ELECTRICITY SECTOR OVERVIEW
10.1 INSTALLED CAPACITYThe total nominal power generation capacity of Pakistan as on 30th June, 2017 was 28,399 MW; of which 18,676 MW (65.76%) was thermal, 7,116 MW (25.06%) was hydroelectric, 1,142 MW (4.02%) was nuclear and 1,465 MW (5.16%) was renewable energy (wind, solar and bagasse). The following tables (table 4 to 6) explain the total installed capacity of Pakistan from July, 2013 to June, 2017:
TABLE 4Installed Capacity by Type (MW)
As on 30th June 2013 2014 2015 2016 2017HYDELWAPDA Hydel 6,733 6,902 6,902 6,902 6,902IPPs Hydel 214 214 214 214 214Sub-Total 6,947 7,116 7,116 7,116 7,116 % Share (Hydel Installed Capacity) 29.28 30.02 28.51 27.99 25.06THERMALGENCOs with PEPCO 4,785 4,590 5,762 5,897 5,897KEL Own 2,359 1,951 1,874 1,874 1,874
IPPs Connected with PEPCO 8,342 8,700 8,696 8,643 10,566Connected with KEL 252 252 252 252 252
CPPs/SPPs connected with KEL 203 200 35 35 87Sub-Total 15,941 15,693 16,619 16,701 18,676% Share (Thermal Installed Capacity) 67.19 66.21 66.58 65.70 65.76NUCLEARCHASNUPP (I, II & III) 650 650 650 615 1005KANUPP 137 137 137 137 137Sub-Total 787 787 787 752 1,142 % Share (Nuclear Installed Capacity) 3.32 3.32 3.15 2.96 4.02RENEWABLE ENERGY (WIND, SOLAR AND BAGASSE)RE Power Plants connected with PEPCO 50 106 439 852 1,465Sub-Total 50 106 439 852 1,465 % Share (RE Installed Capacity) 0.21 0.45 1.76 3.35 5.16Total Installed Capacity of the Country 23,725 23,702 24,961 25,421 28,399
Source: NTDC/KEL
0.00
10.00
20.00
30.00
40.00
50.00
60.00
70.00
2013 2014 2015 2016 2017
Figure 4: Share of Installed Generation Capacity by Type (%)
% Share (Hydel Installed Capacity) % Share (Thermal Installed Capacity)
% Share (Nuclear Installed Capacity) % Share (RE Installed Capacity)
10

150
TABLE 5Plant-wise Installed Capacity (MW) as on 30th June
Power Station Plant Location Type of Power Station 2013 2014 2015 2016 2017
A1: Hydel (WAPDA)Major Hydropower UnitsTarbela Tarbela, KPK Reservoir 3,478 3,478 3,478 3,478 3,478Ghazi Barotha Ghazi Barotha, Punjab Run of River 1,450 1,450 1,450 1,450 1,450Mangla Mangla, AJ&K Reservoir 1,000 1,000 1,000 1,000 1,000Warsak Warsak, KPK Reservoir 243 243 243 243 243Chashma Chashma, Punjab Run of River 184 184 184 184 184Khan Khwar Shangla, KPK Reservoir 72 72 72 72 72Allai Khwar Battagram, KPK Reservoir 121 121 121 121 121Jinnah Hydel Mianwali, Punjab Run of River 96 96 96 96 96Duber Khwar Kohistan, KPK Reservoir 0 130 130 130 130Small Hydropower UnitsDargai Dargai, KPK Run of Canal 20 20 20 20 20Rasul Rasul, Punjab Run of Canal 22 22 22 22 22Shadiwal Shadiwal, Punjab Run of Canal 14 14 14 14 14Chichoki Mallian Chichoki Mallian, Punjab Run of Canal 13 13 13 13 13Nandipur Nandipur, Punjab Run of Canal 14 14 14 14 14Kurram Garhi Kurram Garhi, KPK Run of Canal 4 4 4 4 4Renala Renala, Punjab Run of Canal 1 1 1 1 1Chitral Chitral, KPK Run of Canal 1 1 1 1 1Gomal Zam South Waziristan Agency, KPK Reservoir 0 17 17 17 17Malakand/Jabban Malakand, KPK Run of River 0 22 22 22 22Others 0 0 0 0 0Total Hydel (WAPDA) 6,733 6,902 6,902 6,902 6,902
A2: Hydel (IPPs)Jagran (AJ&K) Jagran, AJ&K Hydro 30 30 30 30 30Malakand-III (PEDO) Malakand, KPK Hydro 81 81 81 81 81Pehur (PEDO) Swabi, KPK Hydro 18 18 18 18 18Laraib Energy Jhelum River, AJ&K Hydro 84 84 84 84 84Garam Chashma Chitral, KPK Hydro 1 1 1 1 1Total Hydel (IPPs) 214 214 214 214 214Total Hydel (A1+A2) 6,947 7,116 7,116 7,116 7,116
B1: Thermal (GENCOs in PEPCO system)TPS Jamshoro Jamshoro, Sindh STs 850 850 880 880 880GTPS Kotri Kotri, Sindh GTs+CCPP 174 174 144 144 144TPS Guddu (Units 1-4) Guddu, Sindh STs 640 640 640 640 640TPS Guddu (Units 5-13) Guddu, Sindh GTs+CCPPs 1,015 1,015 1,015 1,015 1,015TPS Guddu (Units 14-16) Guddu, Sindh GTs+ST+CCPPs 0 0 747 747 747TPS Quetta Quetta, Balochistan GT 35 35 35 28 28TPS Muzaffargarh Muzaffargarh, Punjab STs 1,350 1,350 1,350 1,350 1,350SPS Faisalabad Faisalabad, Punjab STs 132 132 132 132 132GTPS Faisalabad Faisalabad, Punjab GTs+CCPPs 244 244 244 244 244NGPS Multan Multan, Punjab STs 195 0 0 0 0Nandipur Gujranwala, Punjab GTs+CCPPs 0 0 425 567 567FBC Lakhra Lakhra, Sindh STs 150 150 150 150 150Total Thermal (GENCOs in PEPCO system) 4,785 4,590 5,762 5,897 5,897
B2: Thermal (IPPs connected with PEPCO system)Lal Pir Power Mehmood Kot, Punjab ST 362 362 362 362 362Pak Gen. Power Mehmood Kot, Punjab ST 365 365 365 365 365Altern Energy Fateh Jang, Punjab GEs 31 31 31 31 31
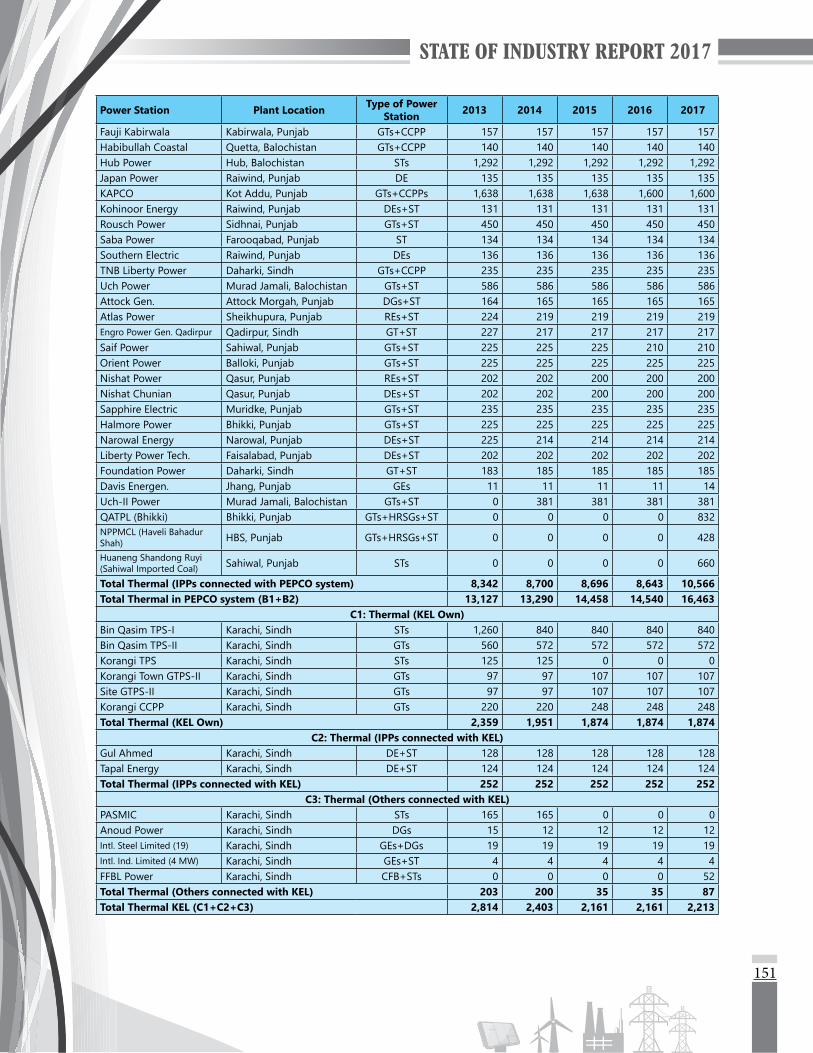
151
Power Station Plant Location Type of Power Station 2013 2014 2015 2016 2017
Fauji Kabirwala Kabirwala, Punjab GTs+CCPP 157 157 157 157 157Habibullah Coastal Quetta, Balochistan GTs+CCPP 140 140 140 140 140Hub Power Hub, Balochistan STs 1,292 1,292 1,292 1,292 1,292Japan Power Raiwind, Punjab DE 135 135 135 135 135KAPCO Kot Addu, Punjab GTs+CCPPs 1,638 1,638 1,638 1,600 1,600Kohinoor Energy Raiwind, Punjab DEs+ST 131 131 131 131 131Rousch Power Sidhnai, Punjab GTs+ST 450 450 450 450 450Saba Power Farooqabad, Punjab ST 134 134 134 134 134Southern Electric Raiwind, Punjab DEs 136 136 136 136 136TNB Liberty Power Daharki, Sindh GTs+CCPP 235 235 235 235 235Uch Power Murad Jamali, Balochistan GTs+ST 586 586 586 586 586Attock Gen. Attock Morgah, Punjab DGs+ST 164 165 165 165 165Atlas Power Sheikhupura, Punjab REs+ST 224 219 219 219 219Engro Power Gen. Qadirpur Qadirpur, Sindh GT+ST 227 217 217 217 217Saif Power Sahiwal, Punjab GTs+ST 225 225 225 210 210Orient Power Balloki, Punjab GTs+ST 225 225 225 225 225Nishat Power Qasur, Punjab REs+ST 202 202 200 200 200Nishat Chunian Qasur, Punjab DEs+ST 202 202 200 200 200Sapphire Electric Muridke, Punjab GTs+ST 235 235 235 235 235Halmore Power Bhikki, Punjab GTs+ST 225 225 225 225 225Narowal Energy Narowal, Punjab DEs+ST 225 214 214 214 214Liberty Power Tech. Faisalabad, Punjab DEs+ST 202 202 202 202 202Foundation Power Daharki, Sindh GT+ST 183 185 185 185 185Davis Energen. Jhang, Punjab GEs 11 11 11 11 14Uch-II Power Murad Jamali, Balochistan GTs+ST 0 381 381 381 381QATPL (Bhikki) Bhikki, Punjab GTs+HRSGs+ST 0 0 0 0 832NPPMCL (Haveli Bahadur Shah) HBS, Punjab GTs+HRSGs+ST 0 0 0 0 428
Huaneng Shandong Ruyi (Sahiwal Imported Coal) Sahiwal, Punjab STs 0 0 0 0 660
Total Thermal (IPPs connected with PEPCO system) 8,342 8,700 8,696 8,643 10,566Total Thermal in PEPCO system (B1+B2) 13,127 13,290 14,458 14,540 16,463
C1: Thermal (KEL Own)Bin Qasim TPS-I Karachi, Sindh STs 1,260 840 840 840 840Bin Qasim TPS-II Karachi, Sindh GTs 560 572 572 572 572Korangi TPS Karachi, Sindh STs 125 125 0 0 0Korangi Town GTPS-II Karachi, Sindh GTs 97 97 107 107 107Site GTPS-II Karachi, Sindh GTs 97 97 107 107 107Korangi CCPP Karachi, Sindh GTs 220 220 248 248 248Total Thermal (KEL Own) 2,359 1,951 1,874 1,874 1,874
C2: Thermal (IPPs connected with KEL)Gul Ahmed Karachi, Sindh DE+ST 128 128 128 128 128Tapal Energy Karachi, Sindh DE+ST 124 124 124 124 124Total Thermal (IPPs connected with KEL) 252 252 252 252 252
C3: Thermal (Others connected with KEL)PASMIC Karachi, Sindh STs 165 165 0 0 0Anoud Power Karachi, Sindh DGs 15 12 12 12 12Intl. Steel Limited (19) Karachi, Sindh GEs+DGs 19 19 19 19 19Intl. Ind. Limited (4 MW) Karachi, Sindh GEs+ST 4 4 4 4 4FFBL Power Karachi, Sindh CFB+STs 0 0 0 0 52Total Thermal (Others connected with KEL) 203 200 35 35 87Total Thermal KEL (C1+C2+C3) 2,814 2,403 2,161 2,161 2,213
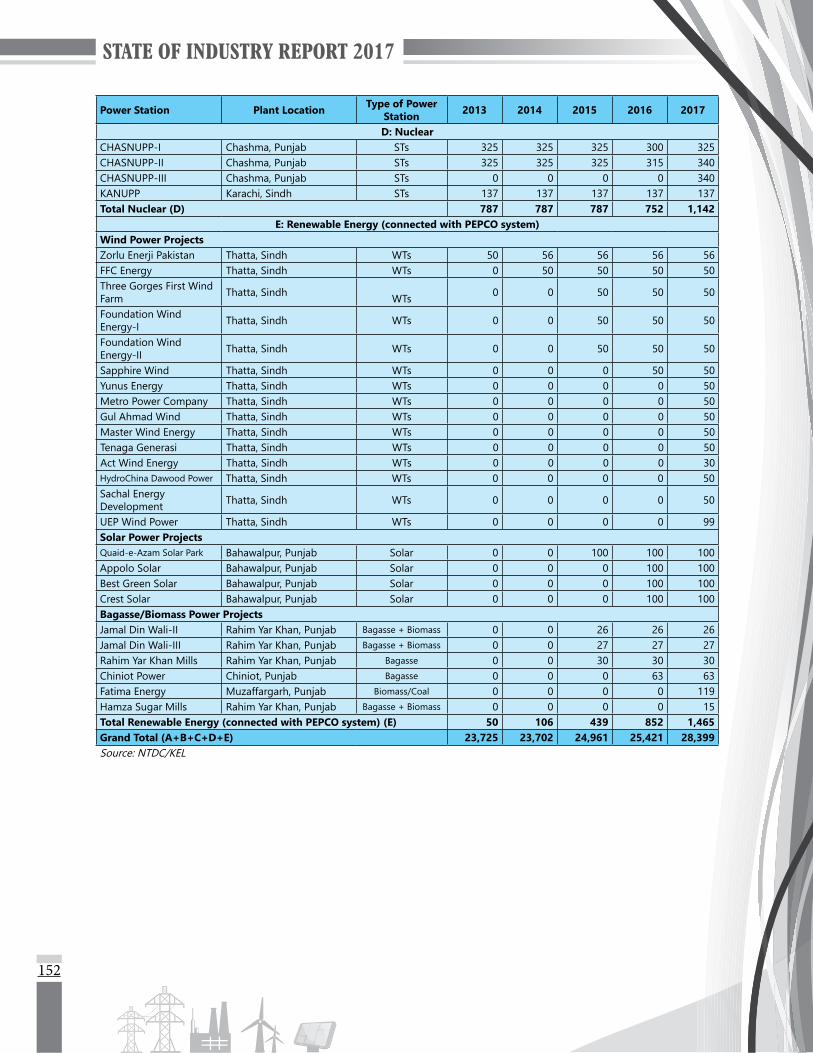
152
Power Station Plant Location Type of Power Station 2013 2014 2015 2016 2017
D: NuclearCHASNUPP-I Chashma, Punjab STs 325 325 325 300 325CHASNUPP-II Chashma, Punjab STs 325 325 325 315 340CHASNUPP-III Chashma, Punjab STs 0 0 0 0 340KANUPP Karachi, Sindh STs 137 137 137 137 137Total Nuclear (D) 787 787 787 752 1,142
E: Renewable Energy (connected with PEPCO system)Wind Power ProjectsZorlu Enerji Pakistan Thatta, Sindh WTs 50 56 56 56 56FFC Energy Thatta, Sindh WTs 0 50 50 50 50Three Gorges First Wind Farm Thatta, Sindh WTs 0 0 50 50 50
Foundation Wind Energy-I Thatta, Sindh WTs 0 0 50 50 50
Foundation Wind Energy-II Thatta, Sindh WTs 0 0 50 50 50
Sapphire Wind Thatta, Sindh WTs 0 0 0 50 50Yunus Energy Thatta, Sindh WTs 0 0 0 0 50Metro Power Company Thatta, Sindh WTs 0 0 0 0 50Gul Ahmad Wind Thatta, Sindh WTs 0 0 0 0 50Master Wind Energy Thatta, Sindh WTs 0 0 0 0 50Tenaga Generasi Thatta, Sindh WTs 0 0 0 0 50Act Wind Energy Thatta, Sindh WTs 0 0 0 0 30HydroChina Dawood Power Thatta, Sindh WTs 0 0 0 0 50Sachal Energy Development Thatta, Sindh WTs 0 0 0 0 50
UEP Wind Power Thatta, Sindh WTs 0 0 0 0 99Solar Power ProjectsQuaid-e-Azam Solar Park Bahawalpur, Punjab Solar 0 0 100 100 100Appolo Solar Bahawalpur, Punjab Solar 0 0 0 100 100Best Green Solar Bahawalpur, Punjab Solar 0 0 0 100 100Crest Solar Bahawalpur, Punjab Solar 0 0 0 100 100Bagasse/Biomass Power ProjectsJamal Din Wali-II Rahim Yar Khan, Punjab Bagasse + Biomass 0 0 26 26 26Jamal Din Wali-III Rahim Yar Khan, Punjab Bagasse + Biomass 0 0 27 27 27Rahim Yar Khan Mills Rahim Yar Khan, Punjab Bagasse 0 0 30 30 30Chiniot Power Chiniot, Punjab Bagasse 0 0 0 63 63Fatima Energy Muzaffargarh, Punjab Biomass/Coal 0 0 0 0 119Hamza Sugar Mills Rahim Yar Khan, Punjab Bagasse + Biomass 0 0 0 0 15Total Renewable Energy (connected with PEPCO system) (E) 50 106 439 852 1,465Grand Total (A+B+C+D+E) 23,725 23,702 24,961 25,421 28,399Source: NTDC/KEL
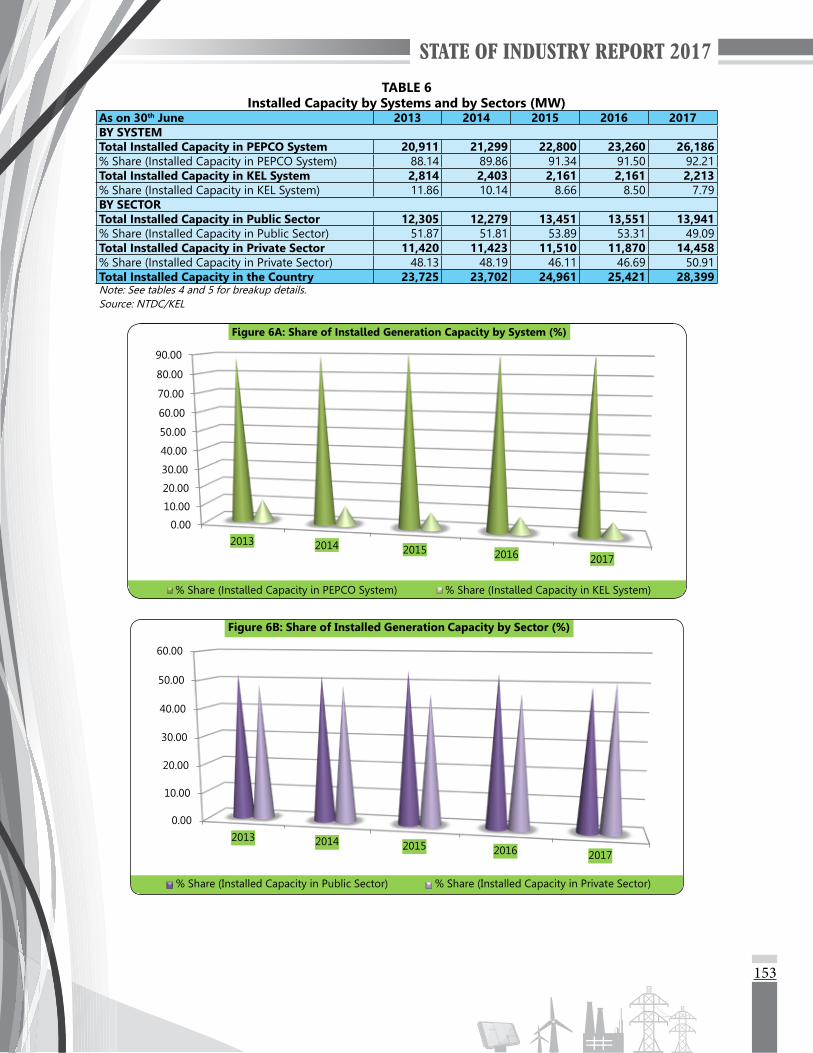
153
TABLE 6Installed Capacity by Systems and by Sectors (MW)
As on 30th June 2013 2014 2015 2016 2017BY SYSTEMTotal Installed Capacity in PEPCO System 20,911 21,299 22,800 23,260 26,186% Share (Installed Capacity in PEPCO System) 88.14 89.86 91.34 91.50 92.21Total Installed Capacity in KEL System 2,814 2,403 2,161 2,161 2,213% Share (Installed Capacity in KEL System) 11.86 10.14 8.66 8.50 7.79BY SECTORTotal Installed Capacity in Public Sector 12,305 12,279 13,451 13,551 13,941% Share (Installed Capacity in Public Sector) 51.87 51.81 53.89 53.31 49.09Total Installed Capacity in Private Sector 11,420 11,423 11,510 11,870 14,458% Share (Installed Capacity in Private Sector) 48.13 48.19 46.11 46.69 50.91Total Installed Capacity in the Country 23,725 23,702 24,961 25,421 28,399Note: See tables 4 and 5 for breakup details.Source: NTDC/KEL
0.00
10.00
20.00
30.00
40.00
50.00
60.00
70.00
80.00
90.00
2013 2014 2015 2016 2017
Figure 6A: Share of Installed Generation Capacity by System (%)
% Share (Installed Capacity in PEPCO System) % Share (Installed Capacity in KEL System)
0.00
10.00
20.00
30.00
40.00
50.00
60.00
2013 2014 2015 2016 2017
Figure 6B: Share of Installed Generation Capacity by Sector (%)
% Share (Installed Capacity in Public Sector) % Share (Installed Capacity in Private Sector)

154
10.2 ELECTRICITY GENERATIONThe total electricity generation of Pakistan as on 30th June, 2017 was 120,621 GWh; of which 78,818 GWh (65.34%) was thermal, 32,079 GWh (26.60%) was hydroelectric, 6,278 GWh (5.20%) was nuclear, 2,950 GWh (2.45%) was renewable energy (wind, solar and bagasse) and 496 GWh (0.41) was import from Iran. The following tables (table 7 to 11) explain the total electricity generation of Pakistan from 2012-13 to 2016-17:
TABLE 7Electricity Generation by Type (GWh)
As on 30th June 2012-13 2013-14 2014-15 2015-16 2016-17HYDELWAPDA Hydel 29,327 31,204 31,525 33,433 31,091IPPs Hydel 706 1,035 1,069 1,121 988Sub-Total 30,033 32,239 32,594 34,554 32,079 % Share (Hydel Electricity Generation) 30.44 30.50 29.93 30.29 26.60THERMALGENCOs with PEPCO 12,872 13,016 13,300 16,392 18,710KEL Own 8,567 8,709 9,319 10,323 10,147 IPPs Connected with PEPCO 40,062 43,692 44,369 45,146 47,972
Connected with KEL 1,116 1,380 1,525 1,421 1,531CPPs/SPPs connected with PEPCO 1,280 1,108 1,015 251 271CPPs/SPPs connected with KEL 137 168 191 139 187Sub-Total 64,034 68,073 69,719 73,672 78,818% Share (Thermal Electricity Generation) 64.91 64.40 64.01 64.57 65.34NUCLEARCHASNUPP (I, II & III) 3,640 4,402 4,996 3,854 5,868KANUPP 541 293 353 362 410Sub-Total 4,181 4,695 5,349 4,216 6,278 % Share (Nuclear Electricity Generation) 4.24 4.44 4.91 3.70 5.20IMPORTImport from Iran 375 419 443 463 496Sub-Total 375 419 443 463 496% Share (Imported Electricity Generation) 0.38 0.40 0.41 0.41 0.41RENEWABLE ENERGY (WIND, SOLAR AND BAGASSE)RE Power Plants connected with PEPCO 32 272 811 1,187 2,950 Sub-Total 32 272 811 1,187 2,950 % Share (RE Electricity Generation) 0.03 0.26 0.74 1.04 2.45Total Electricity Generation of the Country 98,655 105,698 108,916 114,093 120,621 Source: NTDC/KEL
0.00
10.00
20.00
30.00
40.00
50.00
60.00
70.00
2012-13 2013-14 2014-15 2015-16 2016-17
Figure 7: Share of Electricity Generation by Type (%)
% Share (Hydel Electricity Generation) % Share (Thermal Electricity Generation)% Share (Nuclear Electricity Generation) % Share (Imported Electricity Generation)% Share (RE Electricity Generation)
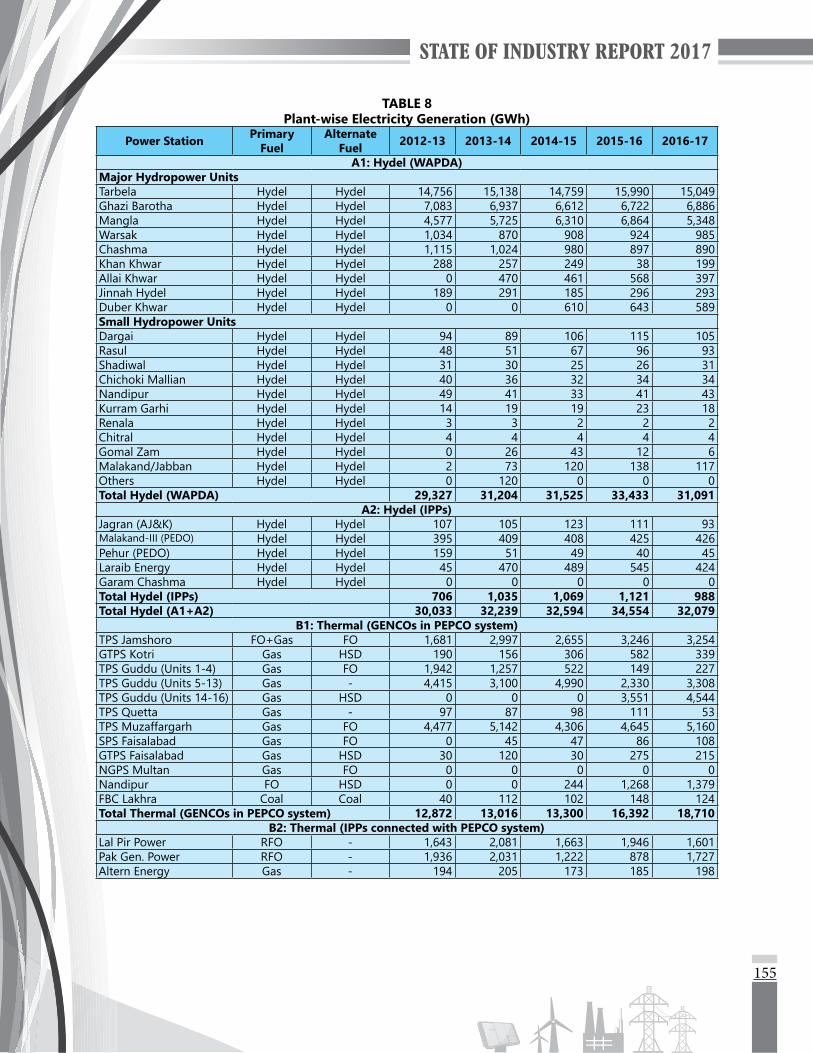
155
TABLE 8Plant-wise Electricity Generation (GWh)
Power Station Primary Fuel
Alternate Fuel 2012-13 2013-14 2014-15 2015-16 2016-17
A1: Hydel (WAPDA)Major Hydropower UnitsTarbela Hydel Hydel 14,756 15,138 14,759 15,990 15,049Ghazi Barotha Hydel Hydel 7,083 6,937 6,612 6,722 6,886Mangla Hydel Hydel 4,577 5,725 6,310 6,864 5,348Warsak Hydel Hydel 1,034 870 908 924 985Chashma Hydel Hydel 1,115 1,024 980 897 890Khan Khwar Hydel Hydel 288 257 249 38 199Allai Khwar Hydel Hydel 0 470 461 568 397Jinnah Hydel Hydel Hydel 189 291 185 296 293Duber Khwar Hydel Hydel 0 0 610 643 589Small Hydropower UnitsDargai Hydel Hydel 94 89 106 115 105Rasul Hydel Hydel 48 51 67 96 93Shadiwal Hydel Hydel 31 30 25 26 31Chichoki Mallian Hydel Hydel 40 36 32 34 34Nandipur Hydel Hydel 49 41 33 41 43Kurram Garhi Hydel Hydel 14 19 19 23 18Renala Hydel Hydel 3 3 2 2 2Chitral Hydel Hydel 4 4 4 4 4Gomal Zam Hydel Hydel 0 26 43 12 6Malakand/Jabban Hydel Hydel 2 73 120 138 117Others Hydel Hydel 0 120 0 0 0Total Hydel (WAPDA) 29,327 31,204 31,525 33,433 31,091
A2: Hydel (IPPs)Jagran (AJ&K) Hydel Hydel 107 105 123 111 93Malakand-III (PEDO) Hydel Hydel 395 409 408 425 426Pehur (PEDO) Hydel Hydel 159 51 49 40 45Laraib Energy Hydel Hydel 45 470 489 545 424Garam Chashma Hydel Hydel 0 0 0 0 0Total Hydel (IPPs) 706 1,035 1,069 1,121 988Total Hydel (A1+A2) 30,033 32,239 32,594 34,554 32,079
B1: Thermal (GENCOs in PEPCO system)TPS Jamshoro FO+Gas FO 1,681 2,997 2,655 3,246 3,254GTPS Kotri Gas HSD 190 156 306 582 339TPS Guddu (Units 1-4) Gas FO 1,942 1,257 522 149 227TPS Guddu (Units 5-13) Gas - 4,415 3,100 4,990 2,330 3,308TPS Guddu (Units 14-16) Gas HSD 0 0 0 3,551 4,544TPS Quetta Gas - 97 87 98 111 53TPS Muzaffargarh Gas FO 4,477 5,142 4,306 4,645 5,160SPS Faisalabad Gas FO 0 45 47 86 108GTPS Faisalabad Gas HSD 30 120 30 275 215NGPS Multan Gas FO 0 0 0 0 0Nandipur FO HSD 0 0 244 1,268 1,379FBC Lakhra Coal Coal 40 112 102 148 124Total Thermal (GENCOs in PEPCO system) 12,872 13,016 13,300 16,392 18,710
B2: Thermal (IPPs connected with PEPCO system)Lal Pir Power RFO - 1,643 2,081 1,663 1,946 1,601Pak Gen. Power RFO - 1,936 2,031 1,222 878 1,727Altern Energy Gas - 194 205 173 185 198
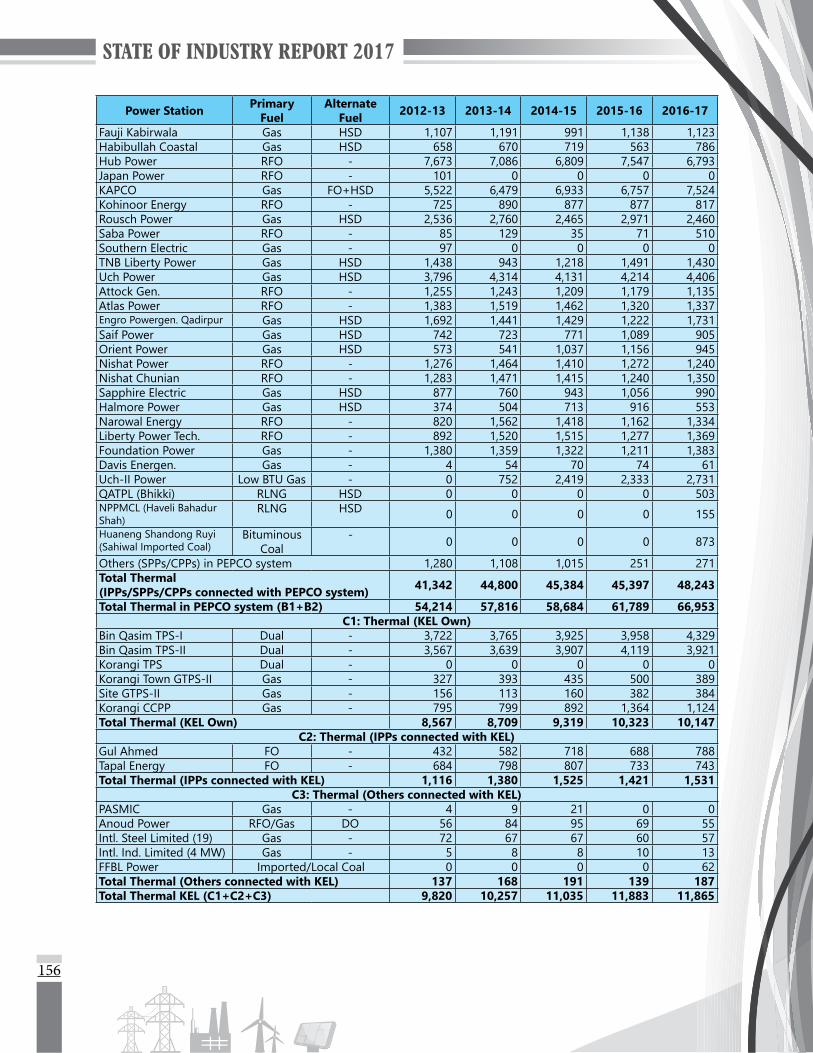
156
Power Station Primary Fuel
Alternate Fuel 2012-13 2013-14 2014-15 2015-16 2016-17
Fauji Kabirwala Gas HSD 1,107 1,191 991 1,138 1,123Habibullah Coastal Gas HSD 658 670 719 563 786Hub Power RFO - 7,673 7,086 6,809 7,547 6,793Japan Power RFO - 101 0 0 0 0KAPCO Gas FO+HSD 5,522 6,479 6,933 6,757 7,524Kohinoor Energy RFO - 725 890 877 877 817Rousch Power Gas HSD 2,536 2,760 2,465 2,971 2,460Saba Power RFO - 85 129 35 71 510Southern Electric Gas - 97 0 0 0 0TNB Liberty Power Gas HSD 1,438 943 1,218 1,491 1,430Uch Power Gas HSD 3,796 4,314 4,131 4,214 4,406Attock Gen. RFO - 1,255 1,243 1,209 1,179 1,135Atlas Power RFO - 1,383 1,519 1,462 1,320 1,337Engro Powergen. Qadirpur Gas HSD 1,692 1,441 1,429 1,222 1,731Saif Power Gas HSD 742 723 771 1,089 905Orient Power Gas HSD 573 541 1,037 1,156 945Nishat Power RFO - 1,276 1,464 1,410 1,272 1,240Nishat Chunian RFO - 1,283 1,471 1,415 1,240 1,350Sapphire Electric Gas HSD 877 760 943 1,056 990Halmore Power Gas HSD 374 504 713 916 553Narowal Energy RFO - 820 1,562 1,418 1,162 1,334Liberty Power Tech. RFO - 892 1,520 1,515 1,277 1,369Foundation Power Gas - 1,380 1,359 1,322 1,211 1,383Davis Energen. Gas - 4 54 70 74 61Uch-II Power Low BTU Gas - 0 752 2,419 2,333 2,731QATPL (Bhikki) RLNG HSD 0 0 0 0 503NPPMCL (Haveli Bahadur Shah)
RLNG HSD 0 0 0 0 155
Huaneng Shandong Ruyi (Sahiwal Imported Coal)
Bituminous Coal
- 0 0 0 0 873
Others (SPPs/CPPs) in PEPCO system 1,280 1,108 1,015 251 271Total Thermal (IPPs/SPPs/CPPs connected with PEPCO system) 41,342 44,800 45,384 45,397 48,243
Total Thermal in PEPCO system (B1+B2) 54,214 57,816 58,684 61,789 66,953C1: Thermal (KEL Own)
Bin Qasim TPS-I Dual - 3,722 3,765 3,925 3,958 4,329Bin Qasim TPS-II Dual - 3,567 3,639 3,907 4,119 3,921Korangi TPS Dual - 0 0 0 0 0Korangi Town GTPS-II Gas - 327 393 435 500 389Site GTPS-II Gas - 156 113 160 382 384Korangi CCPP Gas - 795 799 892 1,364 1,124Total Thermal (KEL Own) 8,567 8,709 9,319 10,323 10,147
C2: Thermal (IPPs connected with KEL)Gul Ahmed FO - 432 582 718 688 788Tapal Energy FO - 684 798 807 733 743Total Thermal (IPPs connected with KEL) 1,116 1,380 1,525 1,421 1,531
C3: Thermal (Others connected with KEL)PASMIC Gas - 4 9 21 0 0Anoud Power RFO/Gas DO 56 84 95 69 55Intl. Steel Limited (19) Gas - 72 67 67 60 57Intl. Ind. Limited (4 MW) Gas - 5 8 8 10 13FFBL Power Imported/Local Coal 0 0 0 0 62Total Thermal (Others connected with KEL) 137 168 191 139 187Total Thermal KEL (C1+C2+C3) 9,820 10,257 11,035 11,883 11,865
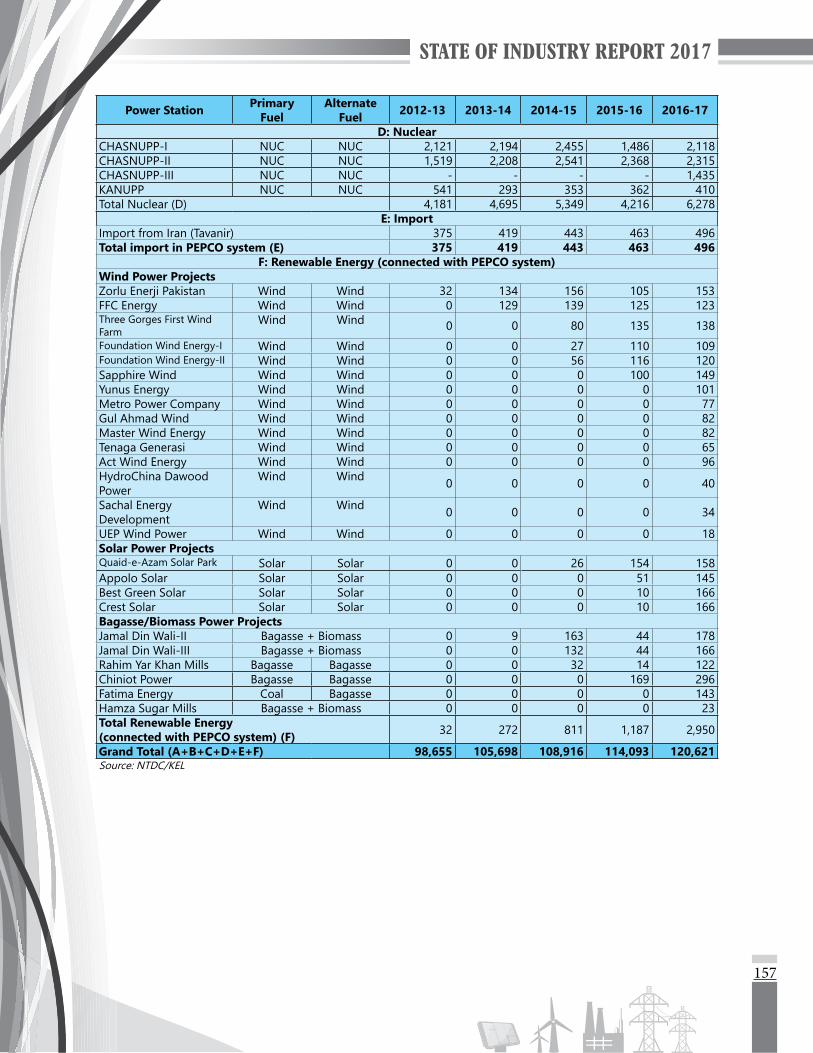
157
Power Station Primary Fuel
Alternate Fuel 2012-13 2013-14 2014-15 2015-16 2016-17
D: NuclearCHASNUPP-I NUC NUC 2,121 2,194 2,455 1,486 2,118 CHASNUPP-II NUC NUC 1,519 2,208 2,541 2,368 2,315 CHASNUPP-III NUC NUC - - - - 1,435 KANUPP NUC NUC 541 293 353 362 410Total Nuclear (D) 4,181 4,695 5,349 4,216 6,278
E: ImportImport from Iran (Tavanir) 375 419 443 463 496Total import in PEPCO system (E) 375 419 443 463 496
F: Renewable Energy (connected with PEPCO system)Wind Power ProjectsZorlu Enerji Pakistan Wind Wind 32 134 156 105 153FFC Energy Wind Wind 0 129 139 125 123Three Gorges First Wind Farm
Wind Wind 0 0 80 135 138
Foundation Wind Energy-I Wind Wind 0 0 27 110 109Foundation Wind Energy-II Wind Wind 0 0 56 116 120Sapphire Wind Wind Wind 0 0 0 100 149Yunus Energy Wind Wind 0 0 0 0 101Metro Power Company Wind Wind 0 0 0 0 77Gul Ahmad Wind Wind Wind 0 0 0 0 82Master Wind Energy Wind Wind 0 0 0 0 82Tenaga Generasi Wind Wind 0 0 0 0 65Act Wind Energy Wind Wind 0 0 0 0 96HydroChina Dawood Power
Wind Wind 0 0 0 0 40
Sachal EnergyDevelopment
Wind Wind 0 0 0 0 34
UEP Wind Power Wind Wind 0 0 0 0 18Solar Power ProjectsQuaid-e-Azam Solar Park Solar Solar 0 0 26 154 158Appolo Solar Solar Solar 0 0 0 51 145Best Green Solar Solar Solar 0 0 0 10 166Crest Solar Solar Solar 0 0 0 10 166Bagasse/Biomass Power ProjectsJamal Din Wali-II Bagasse + Biomass 0 9 163 44 178Jamal Din Wali-III Bagasse + Biomass 0 0 132 44 166Rahim Yar Khan Mills Bagasse Bagasse 0 0 32 14 122Chiniot Power Bagasse Bagasse 0 0 0 169 296Fatima Energy Coal Bagasse 0 0 0 0 143Hamza Sugar Mills Bagasse + Biomass 0 0 0 0 23Total Renewable Energy (connected with PEPCO system) (F) 32 272 811 1,187 2,950
Grand Total (A+B+C+D+E+F) 98,655 105,698 108,916 114,093 120,621Source: NTDC/KEL
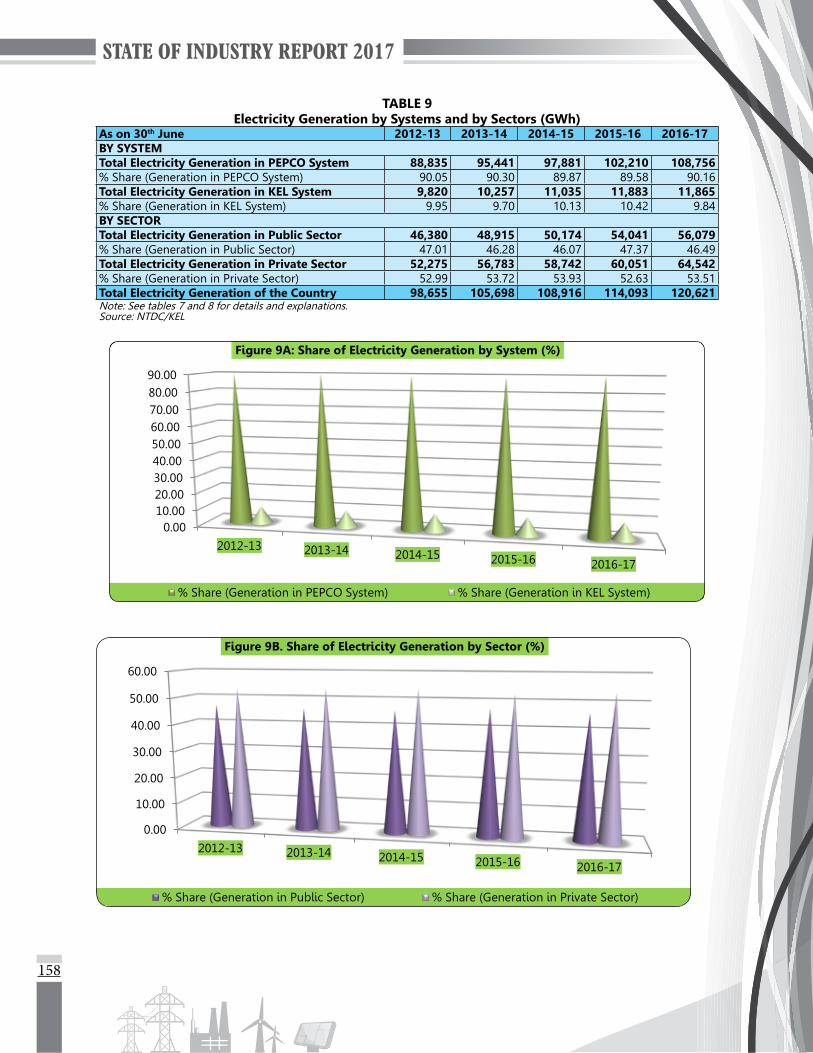
158
TABLE 9Electricity Generation by Systems and by Sectors (GWh)
As on 30th June 2012-13 2013-14 2014-15 2015-16 2016-17BY SYSTEMTotal Electricity Generation in PEPCO System 88,835 95,441 97,881 102,210 108,756% Share (Generation in PEPCO System) 90.05 90.30 89.87 89.58 90.16Total Electricity Generation in KEL System 9,820 10,257 11,035 11,883 11,865% Share (Generation in KEL System) 9.95 9.70 10.13 10.42 9.84BY SECTORTotal Electricity Generation in Public Sector 46,380 48,915 50,174 54,041 56,079% Share (Generation in Public Sector) 47.01 46.28 46.07 47.37 46.49Total Electricity Generation in Private Sector 52,275 56,783 58,742 60,051 64,542% Share (Generation in Private Sector) 52.99 53.72 53.93 52.63 53.51Total Electricity Generation of the Country 98,655 105,698 108,916 114,093 120,621Note: See tables 7 and 8 for details and explanations.Source: NTDC/KEL
0.0010.0020.0030.0040.0050.0060.0070.0080.0090.00
2012-13 2013-14 2014-15 2015-16 2016-17
Figure 9A: Share of Electricity Generation by System (%)
% Share (Generation in PEPCO System) % Share (Generation in KEL System)
0.00
10.00
20.00
30.00
40.00
50.00
60.00
2012-13 2013-14 2014-15 2015-16 2016-17
Figure 9B. Share of Electricity Generation by Sector (%)
% Share (Generation in Public Sector) % Share (Generation in Private Sector)

159
TABLE 10Electricity Statistics of K-Electric Limited
1 Units Generated by KEL Own (GWh)
Name of Plant Year Units Generated
Auxiliary Consumption Units Sent OutGWh %
1.1 Bin Qasim Thermal Power Station-I (BQTPS-I)
2012-13 3722.00 341.00 9.16 3381.002013-14 3765.00 341.00 9.06 3424.002014-15 3925.00 360.00 9.17 3565.002015-16 3958.00 372.00 9.40 3586.002016-17 4329.00 412.00 9.52 3917.00
1.2 Bin Qasim Thermal Power Station-II (BQTPS-II)
2012-13 3567.00 239.00 6.70 3328.002013-14 3639.00 237.00 6.51 3402.002014-15 3907.00 251.00 6.42 3656.002015-16 4119.00 254.00 6.17 3865.002016-17 3921.00 243.00 6.20 3678.00
1.3 Korangi Town Gas Turbine Power Station-II (KTGTPS-II)
2012-13 327.00 9.00 2.75 318.002013-14 393.00 10.00 2.54 383.002014-15 435.00 11.00 2.53 424.002015-16 500.00 14.00 2.80 486.002016-17 389.00 14.00 3.60 375.00
1.4 Site Gas Turbine Power Station-II (SGTPS-II)
2012-13 156.00 8.00 5.13 148.002013-14 113.00 6.00 5.31 107.002014-15 160.00 8.00 5.00 152.002015-16 382.00 12.00 3.14 370.002016-17 384.00 13.00 3.39 371.00
1.5 Korangi Combined Cycle Power Plant 2012-13 795.00 66.00 8.30 729.002013-14 799.00 64.00 8.01 735.002014-15 892.00 74.00 8.30 818.002015-16 1364.00 108.00 7.92 1256.002016-17 1124.00 91.00 8.10 1033.00
1.6 Total Units Generated from K-EL’s Own Power Plants
2012-13 8567.00 663.00 7.74 7904.002013-14 8709.00 658.00 7.56 8051.002014-15 9319.00 704.00 7.55 8615.002015-16 10323.00 760.00 7.36 9563.002016-17 10147.00 773.00 7.62 9374.00
2 Units Purchased by KEL (GWh)2012-13 2013-14 2014-15 2015-16 2016-17
2.1 KANUPP 541.00 293.00 353.00 362.00 410.002.2 Gul Ahmed 432.00 582.00 718.00 688.00 788.002.3 Tapal Energy 684.00 798.00 807.00 733.00 743.002.4 NTDC 5463.00 5441.00 5427.00 5059.00 5077.002.5 PASMIC 4.00 9.00 21.00 0.00 0.002.6 Anoud Power 56.00 84.00 95.00 69.00 55.002.7 Intl. Steel Limited (19 MW) 72.00 67.00 67.00 60.00 57.002.8 Intl. Ind. Limited (4 MW) 5.00 8.00 8.00 10.00 13.002.9 FFBL Power 0.00 0.00 0.00 0.00 62.002.10 Total 7257.00 7282.00 7496.00 6981.00 7205.00
3 Total Units Purchased by KEL including Own Generation (GWh) 15824.00 15991.00 16815.00 17304.00 17352.00
4 Units Available for Distribution (GWh) 15161.00 15333.00 16111.00 16544.00 16579.00
5 Units Sold (GWh) 10942.00 11453.00 12294.00 12865.00 12981.006 T&D Losses (excluding
Auxiliary Consumption)GWh 4219.00 3880.00 3817.00 3679.00 3598.00
% 27.83 25.30 23.69 22.24 21.70
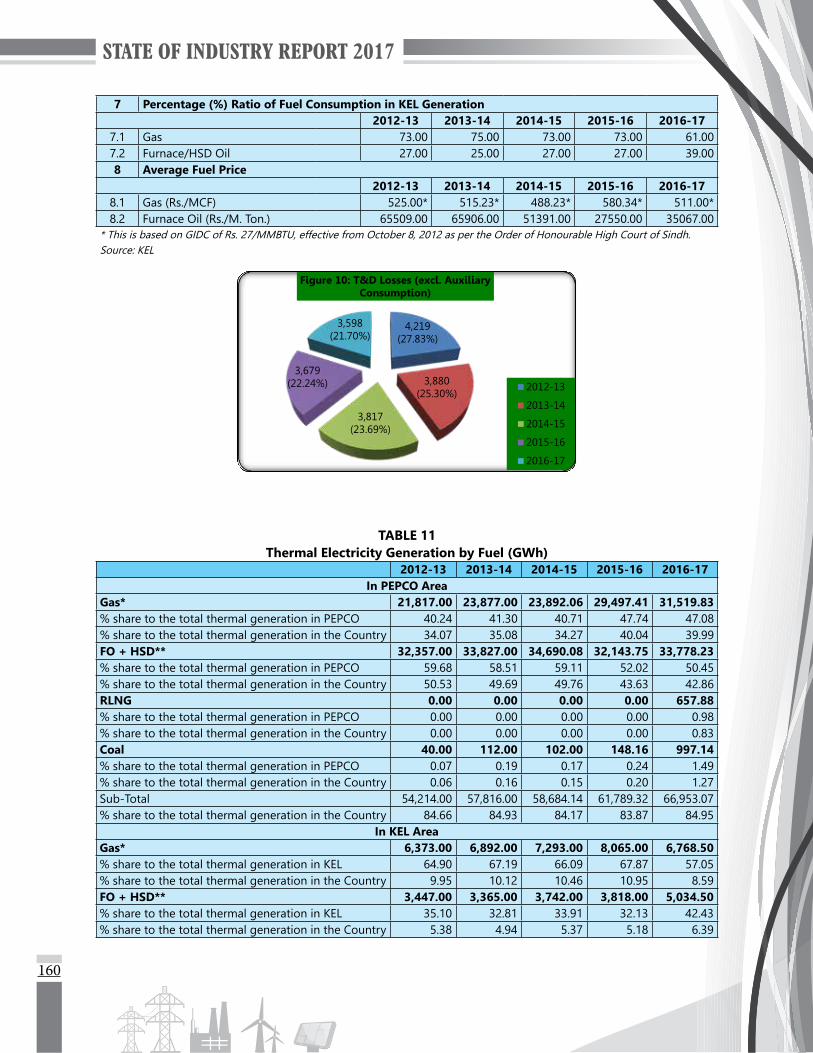
160
7 Percentage (%) Ratio of Fuel Consumption in KEL Generation2012-13 2013-14 2014-15 2015-16 2016-17
7.1 Gas 73.00 75.00 73.00 73.00 61.007.2 Furnace/HSD Oil 27.00 25.00 27.00 27.00 39.008 Average Fuel Price
2012-13 2013-14 2014-15 2015-16 2016-178.1 Gas (Rs./MCF) 525.00* 515.23* 488.23* 580.34* 511.00*8.2 Furnace Oil (Rs./M. Ton.) 65509.00 65906.00 51391.00 27550.00 35067.00
* This is based on GIDC of Rs. 27/MMBTU, effective from October 8, 2012 as per the Order of Honourable High Court of Sindh.Source: KEL
4,219(27.83%)
3,880(25.30%)
3,817(23.69%)
3,679(22.24%)
3,598(21.70%)
Figure 10: T&D Losses (excl. Auxiliary Consumption)
2012-13
2013-14
2014-15
2015-16
2016-17
TABLE 11Thermal Electricity Generation by Fuel (GWh)
2012-13 2013-14 2014-15 2015-16 2016-17In PEPCO Area
Gas* 21,817.00 23,877.00 23,892.06 29,497.41 31,519.83 % share to the total thermal generation in PEPCO 40.24 41.30 40.71 47.74 47.08 % share to the total thermal generation in the Country 34.07 35.08 34.27 40.04 39.99 FO + HSD** 32,357.00 33,827.00 34,690.08 32,143.75 33,778.23 % share to the total thermal generation in PEPCO 59.68 58.51 59.11 52.02 50.45 % share to the total thermal generation in the Country 50.53 49.69 49.76 43.63 42.86 RLNG 0.00 0.00 0.00 0.00 657.88 % share to the total thermal generation in PEPCO 0.00 0.00 0.00 0.00 0.98 % share to the total thermal generation in the Country 0.00 0.00 0.00 0.00 0.83 Coal 40.00 112.00 102.00 148.16 997.14 % share to the total thermal generation in PEPCO 0.07 0.19 0.17 0.24 1.49 % share to the total thermal generation in the Country 0.06 0.16 0.15 0.20 1.27 Sub-Total 54,214.00 57,816.00 58,684.14 61,789.32 66,953.07 % share to the total thermal generation in the Country 84.66 84.93 84.17 83.87 84.95
In KEL AreaGas* 6,373.00 6,892.00 7,293.00 8,065.00 6,768.50 % share to the total thermal generation in KEL 64.90 67.19 66.09 67.87 57.05 % share to the total thermal generation in the Country 9.95 10.12 10.46 10.95 8.59 FO + HSD** 3,447.00 3,365.00 3,742.00 3,818.00 5,034.50 % share to the total thermal generation in KEL 35.10 32.81 33.91 32.13 42.43 % share to the total thermal generation in the Country 5.38 4.94 5.37 5.18 6.39
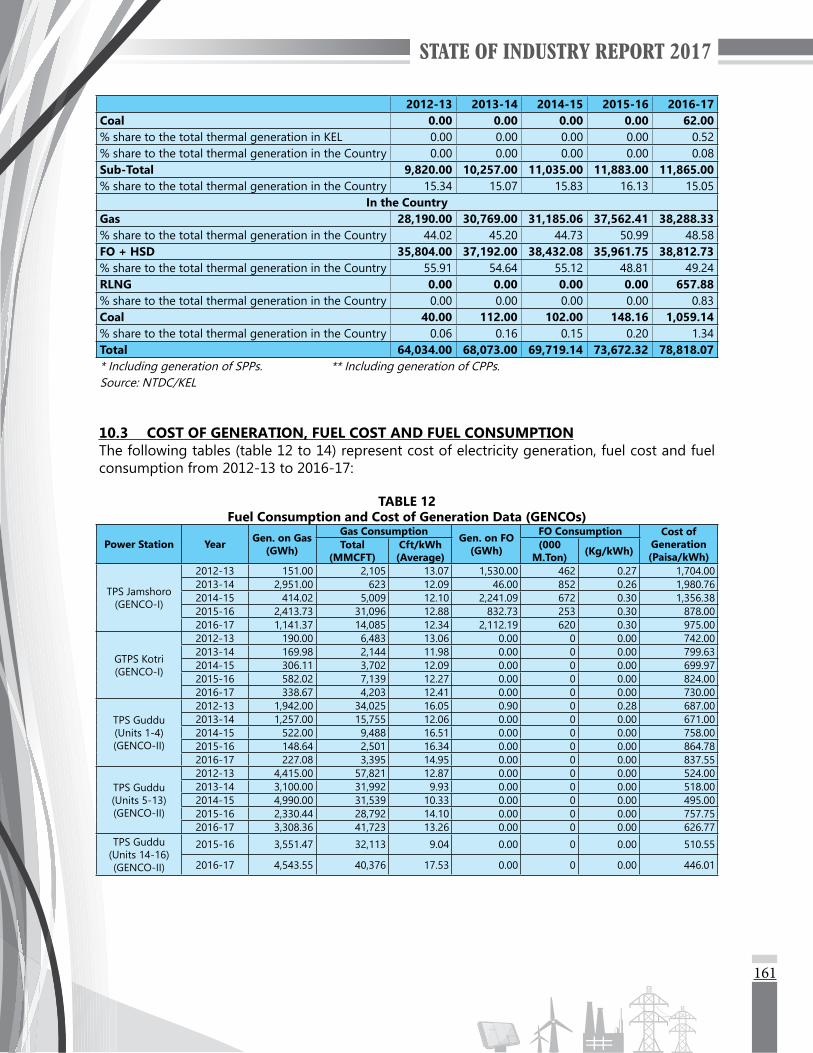
161
2012-13 2013-14 2014-15 2015-16 2016-17Coal 0.00 0.00 0.00 0.00 62.00 % share to the total thermal generation in KEL 0.00 0.00 0.00 0.00 0.52 % share to the total thermal generation in the Country 0.00 0.00 0.00 0.00 0.08 Sub-Total 9,820.00 10,257.00 11,035.00 11,883.00 11,865.00 % share to the total thermal generation in the Country 15.34 15.07 15.83 16.13 15.05
In the CountryGas 28,190.00 30,769.00 31,185.06 37,562.41 38,288.33 % share to the total thermal generation in the Country 44.02 45.20 44.73 50.99 48.58 FO + HSD 35,804.00 37,192.00 38,432.08 35,961.75 38,812.73 % share to the total thermal generation in the Country 55.91 54.64 55.12 48.81 49.24 RLNG 0.00 0.00 0.00 0.00 657.88 % share to the total thermal generation in the Country 0.00 0.00 0.00 0.00 0.83 Coal 40.00 112.00 102.00 148.16 1,059.14 % share to the total thermal generation in the Country 0.06 0.16 0.15 0.20 1.34 Total 64,034.00 68,073.00 69,719.14 73,672.32 78,818.07 * Including generation of SPPs. ** Including generation of CPPs.Source: NTDC/KEL
10.3 COST OF GENERATION, FUEL COST AND FUEL CONSUMPTIONThe following tables (table 12 to 14) represent cost of electricity generation, fuel cost and fuel consumption from 2012-13 to 2016-17:
TABLE 12Fuel Consumption and Cost of Generation Data (GENCOs)
Power Station Year Gen. on Gas (GWh)
Gas Consumption Gen. on FO (GWh)
FO Consumption Cost of Generation (Paisa/kWh)
Total (MMCFT)
Cft/kWh (Average)
(000 M.Ton) (Kg/kWh)
TPS Jamshoro (GENCO-I)
2012-13 151.00 2,105 13.07 1,530.00 462 0.27 1,704.00 2013-14 2,951.00 623 12.09 46.00 852 0.26 1,980.76 2014-15 414.02 5,009 12.10 2,241.09 672 0.30 1,356.38 2015-16 2,413.73 31,096 12.88 832.73 253 0.30 878.002016-17 1,141.37 14,085 12.34 2,112.19 620 0.30 975.00
GTPS Kotri (GENCO-I)
2012-13 190.00 6,483 13.06 0.00 0 0.00 742.00 2013-14 169.98 2,144 11.98 0.00 0 0.00 799.63 2014-15 306.11 3,702 12.09 0.00 0 0.00 699.972015-16 582.02 7,139 12.27 0.00 0 0.00 824.002016-17 338.67 4,203 12.41 0.00 0 0.00 730.00
TPS Guddu (Units 1-4) (GENCO-II)
2012-13 1,942.00 34,025 16.05 0.90 0 0.28 687.00 2013-14 1,257.00 15,755 12.06 0.00 0 0.00 671.00 2014-15 522.00 9,488 16.51 0.00 0 0.00 758.002015-16 148.64 2,501 16.34 0.00 0 0.00 864.782016-17 227.08 3,395 14.95 0.00 0 0.00 837.55
TPS Guddu (Units 5-13) (GENCO-II)
2012-13 4,415.00 57,821 12.87 0.00 0 0.00 524.002013-14 3,100.00 31,992 9.93 0.00 0 0.00 518.00 2014-15 4,990.00 31,539 10.33 0.00 0 0.00 495.002015-16 2,330.44 28,792 14.10 0.00 0 0.00 757.752016-17 3,308.36 41,723 13.26 0.00 0 0.00 626.77
TPS Guddu (Units 14-16) (GENCO-II)
2015-16 3,551.47 32,113 9.04 0.00 0 0.00 510.55
2016-17 4,543.55 40,376 17.53 0.00 0 0.00 446.01
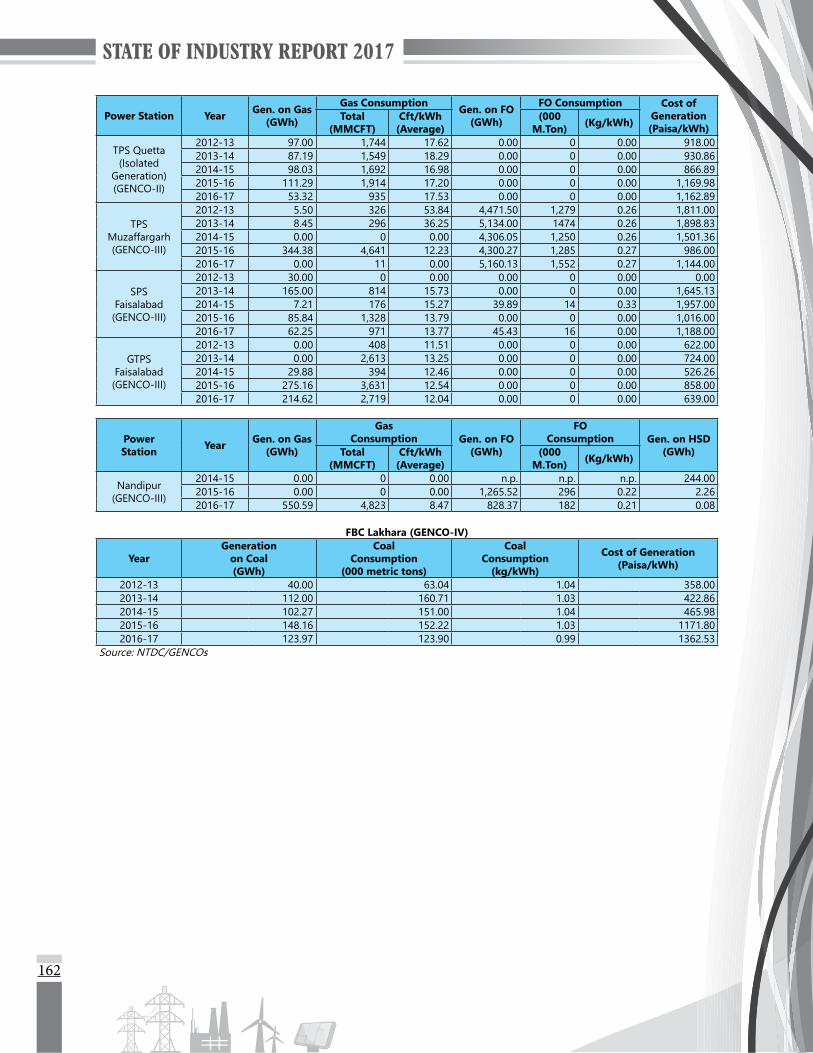
162
Power Station Year Gen. on Gas (GWh)
Gas Consumption Gen. on FO (GWh)
FO Consumption Cost of Generation (Paisa/kWh)
Total (MMCFT)
Cft/kWh (Average)
(000 M.Ton) (Kg/kWh)
TPS Quetta (Isolated
Generation) (GENCO-II)
2012-13 97.00 1,744 17.62 0.00 0 0.00 918.00 2013-14 87.19 1,549 18.29 0.00 0 0.00 930.86 2014-15 98.03 1,692 16.98 0.00 0 0.00 866.892015-16 111.29 1,914 17.20 0.00 0 0.00 1,169.98 2016-17 53.32 935 17.53 0.00 0 0.00 1,162.89
TPS Muzaffargarh (GENCO-III)
2012-13 5.50 326 53.84 4,471.50 1,279 0.26 1,811.00 2013-14 8.45 296 36.25 5,134.00 1474 0.26 1,898.83 2014-15 0.00 0 0.00 4,306.05 1,250 0.26 1,501.36 2015-16 344.38 4,641 12.23 4,300.27 1,285 0.27 986.00 2016-17 0.00 11 0.00 5,160.13 1,552 0.27 1,144.00
SPS Faisalabad (GENCO-III)
2012-13 30.00 0 0.00 0.00 0 0.00 0.002013-14 165.00 814 15.73 0.00 0 0.00 1,645.13 2014-15 7.21 176 15.27 39.89 14 0.33 1,957.00 2015-16 85.84 1,328 13.79 0.00 0 0.00 1,016.00 2016-17 62.25 971 13.77 45.43 16 0.00 1,188.00
GTPS Faisalabad (GENCO-III)
2012-13 0.00 408 11.51 0.00 0 0.00 622.00 2013-14 0.00 2,613 13.25 0.00 0 0.00 724.002014-15 29.88 394 12.46 0.00 0 0.00 526.262015-16 275.16 3,631 12.54 0.00 0 0.00 858.002016-17 214.62 2,719 12.04 0.00 0 0.00 639.00
Power Station Year Gen. on Gas
(GWh)
Gas Consumption Gen. on FO
(GWh)
FO Consumption Gen. on HSD
(GWh)Total (MMCFT)
Cft/kWh (Average)
(000 M.Ton) (Kg/kWh)
Nandipur (GENCO-III)
2014-15 0.00 0 0.00 n.p. n.p. n.p. 244.002015-16 0.00 0 0.00 1,265.52 296 0.22 2.262016-17 550.59 4,823 8.47 828.37 182 0.21 0.08
FBC Lakhara (GENCO-IV)
YearGeneration
on Coal (GWh)
Coal Consumption
(000 metric tons)
Coal Consumption
(kg/kWh)
Cost of Generation (Paisa/kWh)
2012-13 40.00 63.04 1.04 358.002013-14 112.00 160.71 1.03 422.862014-15 102.27 151.00 1.04 465.982015-16 148.16 152.22 1.03 1171.802016-17 123.97 123.90 0.99 1362.53
Source: NTDC/GENCOs
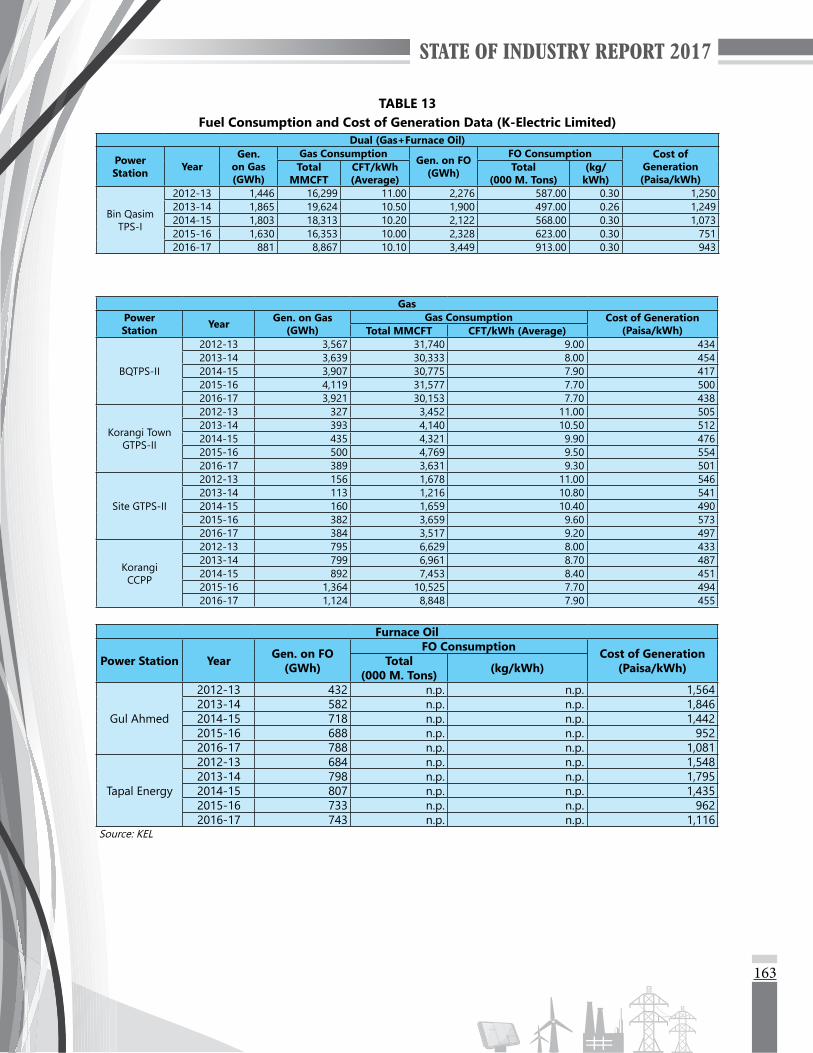
163
GasPower Station Year Gen. on Gas
(GWh)Gas Consumption Cost of Generation
(Paisa/kWh)Total MMCFT CFT/kWh (Average)
BQTPS-II
2012-13 3,567 31,740 9.00 434 2013-14 3,639 30,333 8.00 4542014-15 3,907 30,775 7.90 4172015-16 4,119 31,577 7.70 5002016-17 3,921 30,153 7.70 438
Korangi Town GTPS-II
2012-13 327 3,452 11.00 505 2013-14 393 4,140 10.50 5122014-15 435 4,321 9.90 476 2015-16 500 4,769 9.50 554 2016-17 389 3,631 9.30 501
Site GTPS-II
2012-13 156 1,678 11.00 546 2013-14 113 1,216 10.80 5412014-15 160 1,659 10.40 490 2015-16 382 3,659 9.60 573 2016-17 384 3,517 9.20 497
Korangi CCPP
2012-13 795 6,629 8.00 433 2013-14 799 6,961 8.70 4872014-15 892 7,453 8.40 4512015-16 1,364 10,525 7.70 4942016-17 1,124 8,848 7.90 455
Furnace Oil
Power Station Year Gen. on FO (GWh)
FO Consumption Cost of Generation (Paisa/kWh)Total
(000 M. Tons) (kg/kWh)
Gul Ahmed
2012-13 432 n.p. n.p. 1,564 2013-14 582 n.p. n.p. 1,846 2014-15 718 n.p. n.p. 1,442 2015-16 688 n.p. n.p. 952 2016-17 788 n.p. n.p. 1,081
Tapal Energy
2012-13 684 n.p. n.p. 1,548 2013-14 798 n.p. n.p. 1,795 2014-15 807 n.p. n.p. 1,435 2015-16 733 n.p. n.p. 962 2016-17 743 n.p. n.p. 1,116
Source: KEL
TABLE 13Fuel Consumption and Cost of Generation Data (K-Electric Limited)
Dual (Gas+Furnace Oil)
Power Station Year
Gen. on Gas (GWh)
Gas Consumption Gen. on FO (GWh)
FO Consumption Cost of Generation (Paisa/kWh)
Total MMCFT
CFT/kWh (Average)
Total (000 M. Tons)
(kg/kWh)
Bin Qasim TPS-I
2012-13 1,446 16,299 11.00 2,276 587.00 0.30 1,250 2013-14 1,865 19,624 10.50 1,900 497.00 0.26 1,249 2014-15 1,803 18,313 10.20 2,122 568.00 0.30 1,073 2015-16 1,630 16,353 10.00 2,328 623.00 0.30 751 2016-17 881 8,867 10.10 3,449 913.00 0.30 943

164
TABLE 14Fuel Consumption and Cost of Generation Data (IPPs)
Power Station Year
Furnace Oil Average Fuel Cost (Rs./kWh)
Overall Generation Cost (Rs./kWh)Units Generated (GWh) Quantity of FO used
(M. Tons)Steam Turbine-RFO
Lal Pir Power
2012-13 1,643.00 398303 16.46 19.032013-14 2,081.00 495584 16.66 18.882014-15 1,663.00 391215 12.00 14.322015-16 1,946.10 438429 6.79 8.872016-17 1,601.09 364365 8.42 10.98
Pak Gen. Power
2012-13 1,936.00 462041 16.36 18.642013-14 2,031.00 489366 16.81 19.312014-15 1,222.00 289599 14.53 17.062015-16 878.13 199260 5.75 10.172016-17 1,727.18 394612 8.33 10.72
Hub Power
2012-13 7,673.00 1801653 17.54 19.352013-14 7,086.00 1681641 16.73 18.862014-15 6,809.00 1609458 13.58 15.892015-16 7,546.99 1803394 7.06 9.062016-17 6,793.11 1635358 8.77 10.99
Saba Power
2012-13 91.00 21516 16.98 25.292013-14 129.00 33261 17.46 22.922014-15 35.00 8924 16.46 17.632015-16 70.59 17160 7.68 9.842016-17 510.46 123876 9.75 11.87
Engine - RFO
Japan Power
2012-13 101.00 23345 n.p. n.p.2013-14 - 0 0.00 0.002014-15 - 0 0.00 0.002015-16 - 0 0.00 0.002016-17 - 0 0.00 0.00
Southern Electric
2012-13 97.00 22750 15.19 17.222013-14 - 0 0.00 0.002014-15 - 0 0.00 0.002015-16 - 0 0.00 0.002016-17 - 0 0.00 0.00
Kohinoor Energy
2012-13 747.00 140857 13.09 15.862013-14 890.00 172037 15.65 16.992014-15 877.00 169390 12.05 13.362015-16 877.41 164435 7.23 8.542016-17 816.83 153150 n.p. n.p.
Attock Gen.
2012-13 1,255.00 n.p. 14.73 17.262013-14 1,243.00 225236 14.87 17.432014-15 1,209.00 222892 10.19 18.212015-16 1,179.30 216410 5.20 9.772016-17 1,135.41 209543 6.92 11.92
Atlas Power
2012-13 1,383.01 n.p. 14.90 17.992013-14 1,519.00 294601 13.57 16.382014-15 1,462.00 283960 15.92 19.212015-16 1,320.46 261809 n.p. n.p.2016-17 1,336.90 262555 n.p. n.p.
Nishat Power
2012-13 1,276.45 n.p. 15.80 18.912013-14 1,464.00 287997 14.17 16.802014-15 1,410.00 277312 11.07 13.642015-16 1,272.16 250240 6.52 6.522016-17 1,239.76 243866 7.55 7.55
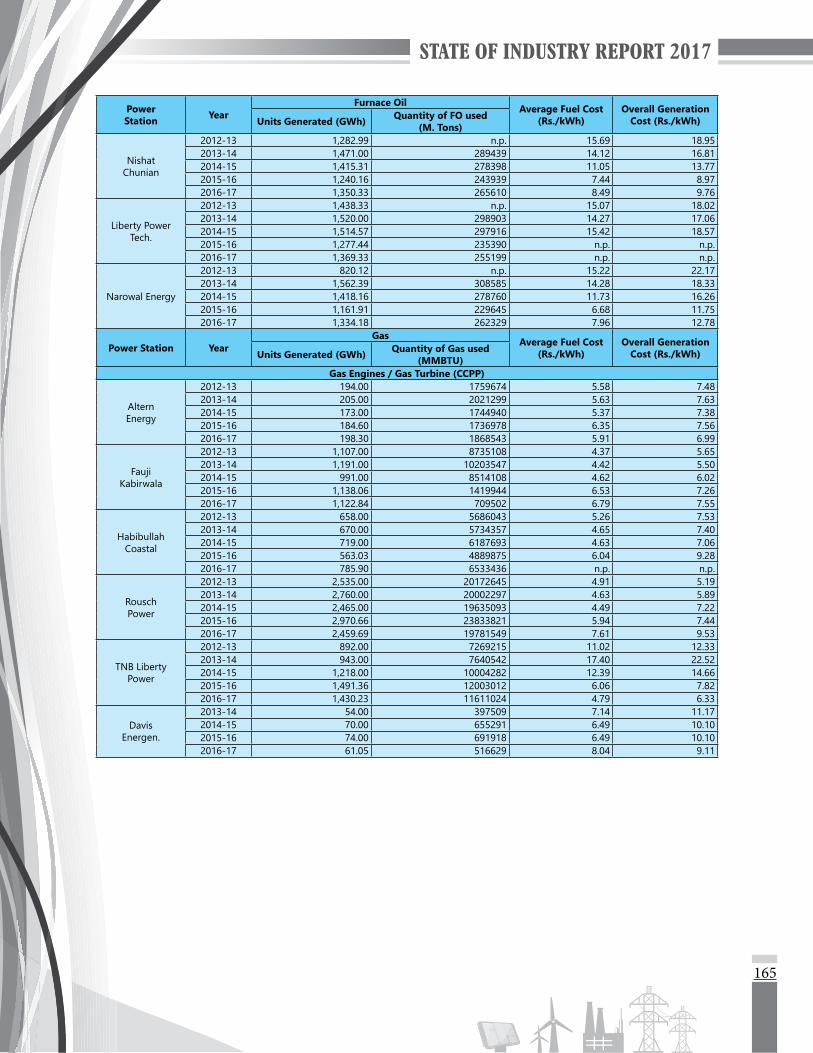
165
Power Station Year
Furnace Oil Average Fuel Cost (Rs./kWh)
Overall Generation Cost (Rs./kWh)Units Generated (GWh) Quantity of FO used
(M. Tons)
Nishat Chunian
2012-13 1,282.99 n.p. 15.69 18.952013-14 1,471.00 289439 14.12 16.812014-15 1,415.31 278398 11.05 13.772015-16 1,240.16 243939 7.44 8.972016-17 1,350.33 265610 8.49 9.76
Liberty Power Tech.
2012-13 1,438.33 n.p. 15.07 18.022013-14 1,520.00 298903 14.27 17.062014-15 1,514.57 297916 15.42 18.572015-16 1,277.44 235390 n.p. n.p.2016-17 1,369.33 255199 n.p. n.p.
Narowal Energy
2012-13 820.12 n.p. 15.22 22.172013-14 1,562.39 308585 14.28 18.332014-15 1,418.16 278760 11.73 16.262015-16 1,161.91 229645 6.68 11.752016-17 1,334.18 262329 7.96 12.78
Power Station YearGas Average Fuel Cost
(Rs./kWh)Overall Generation
Cost (Rs./kWh)Units Generated (GWh) Quantity of Gas used (MMBTU)
Gas Engines / Gas Turbine (CCPP)
Altern Energy
2012-13 194.00 1759674 5.58 7.482013-14 205.00 2021299 5.63 7.632014-15 173.00 1744940 5.37 7.382015-16 184.60 1736978 6.35 7.562016-17 198.30 1868543 5.91 6.99
Fauji Kabirwala
2012-13 1,107.00 8735108 4.37 5.652013-14 1,191.00 10203547 4.42 5.502014-15 991.00 8514108 4.62 6.022015-16 1,138.06 1419944 6.53 7.262016-17 1,122.84 709502 6.79 7.55
Habibullah Coastal
2012-13 658.00 5686043 5.26 7.532013-14 670.00 5734357 4.65 7.402014-15 719.00 6187693 4.63 7.062015-16 563.03 4889875 6.04 9.282016-17 785.90 6533436 n.p. n.p.
Rousch Power
2012-13 2,535.00 20172645 4.91 5.192013-14 2,760.00 20002297 4.63 5.892014-15 2,465.00 19635093 4.49 7.222015-16 2,970.66 23833821 5.94 7.442016-17 2,459.69 19781549 7.61 9.53
TNB Liberty Power
2012-13 892.00 7269215 11.02 12.332013-14 943.00 7640542 17.40 22.522014-15 1,218.00 10004282 12.39 14.662015-16 1,491.36 12003012 6.06 7.822016-17 1,430.23 11611024 4.79 6.33
Davis Energen.
2013-14 54.00 397509 7.14 11.172014-15 70.00 655291 6.49 10.102015-16 74.00 691918 6.49 10.102016-17 61.05 516629 8.04 9.11
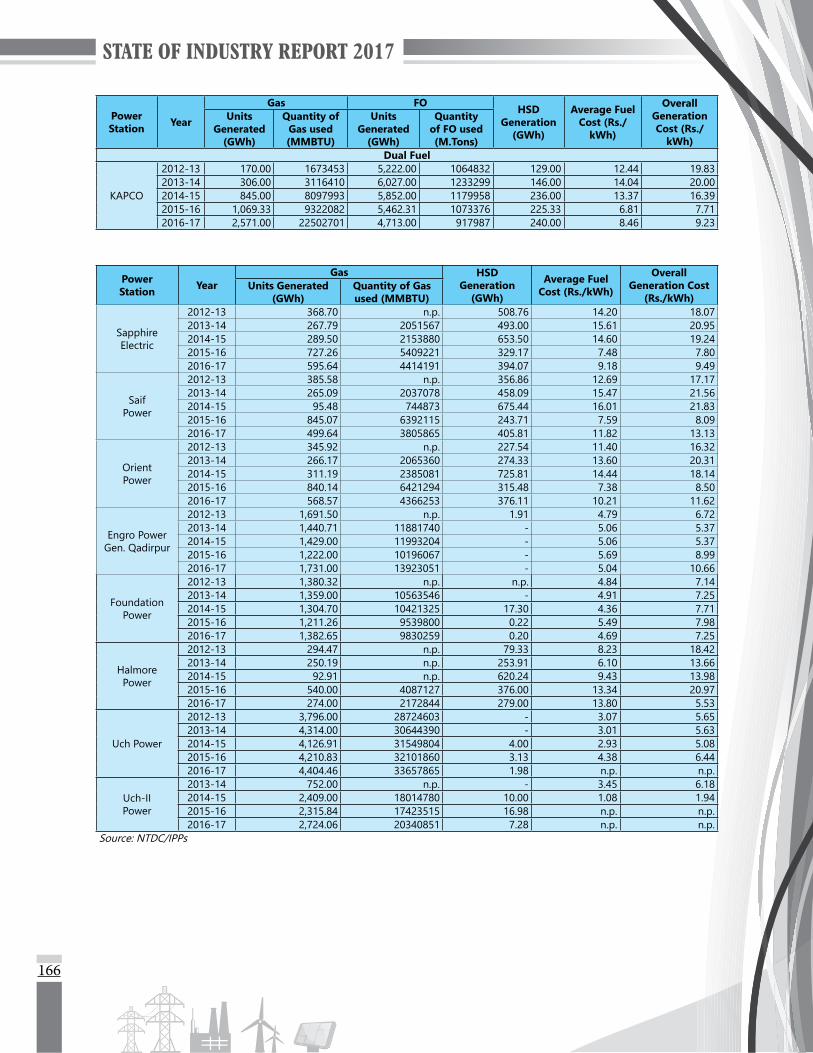
166
Power Station Year
Gas FO HSD Generation
(GWh)
Average Fuel Cost (Rs./
kWh)
Overall Generation Cost (Rs./
kWh)
Units Generated
(GWh)
Quantity of Gas used (MMBTU)
Units Generated
(GWh)
Quantity of FO used (M.Tons)
Dual Fuel
KAPCO
2012-13 170.00 1673453 5,222.00 1064832 129.00 12.44 19.832013-14 306.00 3116410 6,027.00 1233299 146.00 14.04 20.002014-15 845.00 8097993 5,852.00 1179958 236.00 13.37 16.392015-16 1,069.33 9322082 5,462.31 1073376 225.33 6.81 7.712016-17 2,571.00 22502701 4,713.00 917987 240.00 8.46 9.23
Power Station Year
Gas HSD Generation
(GWh)
Average Fuel Cost (Rs./kWh)
Overall Generation Cost
(Rs./kWh)Units Generated
(GWh)Quantity of Gas used (MMBTU)
Sapphire Electric
2012-13 368.70 n.p. 508.76 14.20 18.072013-14 267.79 2051567 493.00 15.61 20.952014-15 289.50 2153880 653.50 14.60 19.242015-16 727.26 5409221 329.17 7.48 7.802016-17 595.64 4414191 394.07 9.18 9.49
Saif Power
2012-13 385.58 n.p. 356.86 12.69 17.172013-14 265.09 2037078 458.09 15.47 21.562014-15 95.48 744873 675.44 16.01 21.832015-16 845.07 6392115 243.71 7.59 8.092016-17 499.64 3805865 405.81 11.82 13.13
Orient Power
2012-13 345.92 n.p. 227.54 11.40 16.322013-14 266.17 2065360 274.33 13.60 20.312014-15 311.19 2385081 725.81 14.44 18.142015-16 840.14 6421294 315.48 7.38 8.502016-17 568.57 4366253 376.11 10.21 11.62
Engro Power Gen. Qadirpur
2012-13 1,691.50 n.p. 1.91 4.79 6.722013-14 1,440.71 11881740 - 5.06 5.372014-15 1,429.00 11993204 - 5.06 5.372015-16 1,222.00 10196067 - 5.69 8.992016-17 1,731.00 13923051 - 5.04 10.66
Foundation Power
2012-13 1,380.32 n.p. n.p. 4.84 7.142013-14 1,359.00 10563546 - 4.91 7.252014-15 1,304.70 10421325 17.30 4.36 7.712015-16 1,211.26 9539800 0.22 5.49 7.982016-17 1,382.65 9830259 0.20 4.69 7.25
Halmore Power
2012-13 294.47 n.p. 79.33 8.23 18.422013-14 250.19 n.p. 253.91 6.10 13.662014-15 92.91 n.p. 620.24 9.43 13.982015-16 540.00 4087127 376.00 13.34 20.972016-17 274.00 2172844 279.00 13.80 5.53
Uch Power
2012-13 3,796.00 28724603 - 3.07 5.652013-14 4,314.00 30644390 - 3.01 5.632014-15 4,126.91 31549804 4.00 2.93 5.082015-16 4,210.83 32101860 3.13 4.38 6.442016-17 4,404.46 33657865 1.98 n.p. n.p.
Uch-II Power
2013-14 752.00 n.p. - 3.45 6.182014-15 2,409.00 18014780 10.00 1.08 1.942015-16 2,315.84 17423515 16.98 n.p. n.p.2016-17 2,724.06 20340851 7.28 n.p. n.p.
Source: NTDC/IPPs

167
10.4 AUXILIARY CONSUMPTION AND OTHER FACTORS, HEAT RATE AND PLANT EFFICIENCY
The following tables (table 15 to 21) show the auxiliary consumption and other factors such as maximum load, load factor, capacity factor, utilization factor and heat rate and plant efficiency data of power plants from 2012-13 to 2016-17:
TABLE 15Auxiliary Consumption and other Factors (Hydel Power Stations)
Power Station Year
Auxiliary Consumption
Maximum Load (MW)
Load Factor (%)
Capacity Factor (%)
Utilization Factor (%)(GWh) (%)
Tarbela
2012-13 18.02 0.12 3,674 45.95 105.64 48.54 2013-14 16.07 0.10 3,605 47.93 103.65 49.68 2014-15 15.94 0.11 3,605 46.89 103.65 48.61 2015-16 16.79 0.10 3,606 50.48 103.68 52.34 2016-17 16.16 0.11 3,539 48.41 101.75 49.40
Ghazi Barotha
2012-13 8.67 0.12 1,450 56.41 100.00 56.41 2013-14 9.61 0.11 1,450 55.02 100.00 55.02 2014-15 7.75 0.12 1,450 52.70 100.00 57.94 2015-16 9.92 0.15 1,450 52.77 100.00 58.25 2016-17 9.64 0.14 1,450 54.21 100.00 59.61
Mangla
2012-13 10.00 0.21 1,115 48.25 111.50 53.80 2013-14 10.08 0.17 1,115 59.95 111.50 66.84 2014-15 11.31 0.17 1,115 66.51 111.50 73.86 2015-16 11.81 0.26 1,115 52.77 111.50 78.15 2016-17 90.23 1.69 1,115 54.60 111.50 61.05
Warsak
2012-13 1.50 0.14 203 58.09 83.55 48.53 2013-14 1.58 0.16 201 52.89 82.73 43.77 2014-15 1.63 0.17 185 60.17 76.14 45.82 2015-16 1.65 0.18 205 51.33 84.37 43.31 2016-17 4.73 0.48 213 52.67 87.67 52.67
Chashma
2012-13 5.97 0.53 184 69.62 100.00 69.62 2013-14 6.05 0.58 184 63.75 100.00 63.76 2014-15 5.64 0.01 184 61.22 100.00 61.22 2015-16 6.33 0.70 174 58.70 58.69 55.50 2016-17 5.74 0.64 158 64.15 85.87 82.23
Khan Khwar
2012-13 1.35 - 72 41.24 41.24 41.24 2013-14 1.24 1.80 72 41.24 41.40 41.24 2014-15 4.40 1.99 72 40.11 40.11 40.11 2015-16 0.89 2.36 68 6.32 5.97 5.97 2016-17 4.01 2.01 72 31.47 31.56 31.56
Allai Khwar
2012-13 0.11 0.05 121 44.34 65.21 44.34 2013-14 0.84 0.18 121 44.45 90.95 44.45 2014-15 0.79 0.17 121 44.19 78.32 43.44 2015-16 0.80 0.14 121 53.33 53.33 53.33 2016-17 0.86 0.22 121 37.42 37.42 37.42
Jinnah
2012-13 1.99 0.99 60 38.63 24.02 24.02 2013-14 3.18 1.10 70 48.25 61.44 35.18 2014-15 2.91 1.50 45 47.95 47.29 22.67 2015-16 6.67 2.25 66 51.27 68.54 35.14 2016-17 2.88 0.98 63 52.89 34.71 34.71
Duber Khwar2013-14 0.19 0.07 130 65.55 59.71 64.77 2014-15 0.74 0.12 130 53.59 100.00 53.59 2015-16 0.73 0.11 130 57.36 100.00 57.36 2016-17 0.71 0.12 130 51.62 100.00 51.76
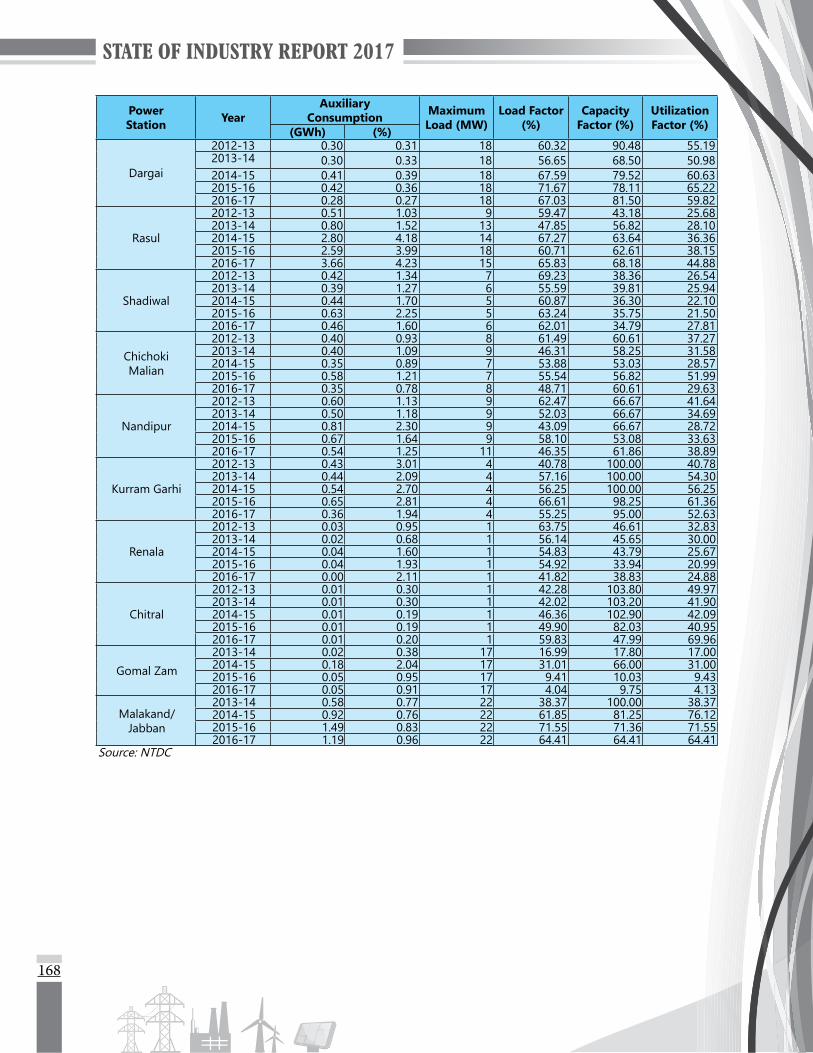
168
Power Station Year
Auxiliary Consumption Maximum
Load (MW)Load Factor
(%)Capacity
Factor (%)Utilization Factor (%)(GWh) (%)
Dargai
2012-13 0.30 0.31 18 60.32 90.48 55.19 2013-14 0.30 0.33 18 56.65 68.50 50.98 2014-15 0.41 0.39 18 67.59 79.52 60.63 2015-16 0.42 0.36 18 71.67 78.11 65.22 2016-17 0.28 0.27 18 67.03 81.50 59.82
Rasul
2012-13 0.51 1.03 9 59.47 43.18 25.68 2013-14 0.80 1.52 13 47.85 56.82 28.10 2014-15 2.80 4.18 14 67.27 63.64 36.36 2015-16 2.59 3.99 18 60.71 62.61 38.15 2016-17 3.66 4.23 15 65.83 68.18 44.88
Shadiwal
2012-13 0.42 1.34 7 69.23 38.36 26.54 2013-14 0.39 1.27 6 55.59 39.81 25.94 2014-15 0.44 1.70 5 60.87 36.30 22.10 2015-16 0.63 2.25 5 63.24 35.75 21.50 2016-17 0.46 1.60 6 62.01 34.79 27.81
Chichoki Malian
2012-13 0.40 0.93 8 61.49 60.61 37.27 2013-14 0.40 1.09 9 46.31 58.25 31.58 2014-15 0.35 0.89 7 53.88 53.03 28.57 2015-16 0.58 1.21 7 55.54 56.82 51.99 2016-17 0.35 0.78 8 48.71 60.61 29.63
Nandipur
2012-13 0.60 1.13 9 62.47 66.67 41.64 2013-14 0.50 1.18 9 52.03 66.67 34.69 2014-15 0.81 2.30 9 43.09 66.67 28.72 2015-16 0.67 1.64 9 58.10 53.08 33.63 2016-17 0.54 1.25 11 46.35 61.86 38.89
Kurram Garhi
2012-13 0.43 3.01 4 40.78 100.00 40.78 2013-14 0.44 2.09 4 57.16 100.00 54.30 2014-15 0.54 2.70 4 56.25 100.00 56.25 2015-16 0.65 2.81 4 66.61 98.25 61.36 2016-17 0.36 1.94 4 55.25 95.00 52.63
Renala
2012-13 0.03 0.95 1 63.75 46.61 32.83 2013-14 0.02 0.68 1 56.14 45.65 30.00 2014-15 0.04 1.60 1 54.83 43.79 25.67 2015-16 0.04 1.93 1 54.92 33.94 20.99 2016-17 0.00 2.11 1 41.82 38.83 24.88
Chitral
2012-13 0.01 0.30 1 42.28 103.80 49.97 2013-14 0.01 0.30 1 42.02 103.20 41.90 2014-15 0.01 0.19 1 46.36 102.90 42.09 2015-16 0.01 0.19 1 49.90 82.03 40.95 2016-17 0.01 0.20 1 59.83 47.99 69.96
Gomal Zam2013-14 0.02 0.38 17 16.99 17.80 17.00 2014-15 0.18 2.04 17 31.01 66.00 31.00 2015-16 0.05 0.95 17 9.41 10.03 9.43 2016-17 0.05 0.91 17 4.04 9.75 4.13
Malakand/ Jabban
2013-14 0.58 0.77 22 38.37 100.00 38.37 2014-15 0.92 0.76 22 61.85 81.25 76.12 2015-16 1.49 0.83 22 71.55 71.36 71.55 2016-17 1.19 0.96 22 64.41 64.41 64.41
Source: NTDC
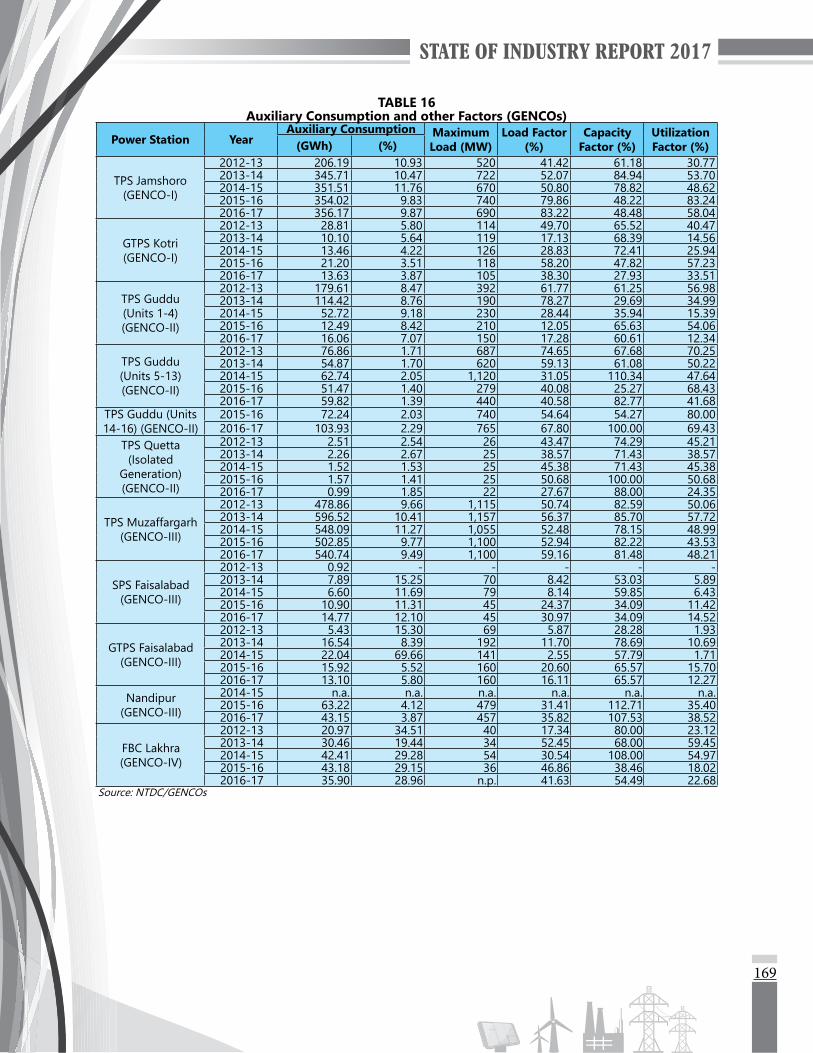
169
TABLE 16Auxiliary Consumption and other Factors (GENCOs)
Power Station YearAuxiliary Consumption Maximum
Load (MW)Load Factor
(%)Capacity
Factor (%)Utilization Factor (%)(GWh) (%)
TPS Jamshoro (GENCO-I)
2012-13 206.19 10.93 520 41.42 61.18 30.77 2013-14 345.71 10.47 722 52.07 84.94 53.70 2014-15 351.51 11.76 670 50.80 78.82 48.62 2015-16 354.02 9.83 740 79.86 48.22 83.24 2016-17 356.17 9.87 690 83.22 48.48 58.04
GTPS Kotri (GENCO-I)
2012-13 28.81 5.80 114 49.70 65.52 40.47 2013-14 10.10 5.64 119 17.13 68.39 14.56 2014-15 13.46 4.22 126 28.83 72.41 25.94 2015-16 21.20 3.51 118 58.20 47.82 57.23 2016-17 13.63 3.87 105 38.30 27.93 33.51
TPS Guddu (Units 1-4) (GENCO-II)
2012-13 179.61 8.47 392 61.77 61.25 56.98 2013-14 114.42 8.76 190 78.27 29.69 34.99 2014-15 52.72 9.18 230 28.44 35.94 15.39 2015-16 12.49 8.42 210 12.05 65.63 54.06 2016-17 16.06 7.07 150 17.28 60.61 12.34
TPS Guddu (Units 5-13) (GENCO-II)
2012-13 76.86 1.71 687 74.65 67.68 70.25 2013-14 54.87 1.70 620 59.13 61.08 50.22 2014-15 62.74 2.05 1,120 31.05 110.34 47.64 2015-16 51.47 1.40 279 40.08 25.27 68.43 2016-17 59.82 1.39 440 40.58 82.77 41.68
TPS Guddu (Units 14-16) (GENCO-II)
2015-16 72.24 2.03 740 54.64 54.27 80.00 2016-17 103.93 2.29 765 67.80 100.00 69.43
TPS Quetta (Isolated
Generation) (GENCO-II)
2012-13 2.51 2.54 26 43.47 74.29 45.21 2013-14 2.26 2.67 25 38.57 71.43 38.57 2014-15 1.52 1.53 25 45.38 71.43 45.38 2015-16 1.57 1.41 25 50.68 100.00 50.68 2016-17 0.99 1.85 22 27.67 88.00 24.35
TPS Muzaffargarh (GENCO-III)
2012-13 478.86 9.66 1,115 50.74 82.59 50.06 2013-14 596.52 10.41 1,157 56.37 85.70 57.72 2014-15 548.09 11.27 1,055 52.48 78.15 48.99 2015-16 502.85 9.77 1,100 52.94 82.22 43.53 2016-17 540.74 9.49 1,100 59.16 81.48 48.21
SPS Faisalabad (GENCO-III)
2012-13 0.92 - - - - - 2013-14 7.89 15.25 70 8.42 53.03 5.89 2014-15 6.60 11.69 79 8.14 59.85 6.43 2015-16 10.90 11.31 45 24.37 34.09 11.42 2016-17 14.77 12.10 45 30.97 34.09 14.52
GTPS Faisalabad (GENCO-III)
2012-13 5.43 15.30 69 5.87 28.28 1.93 2013-14 16.54 8.39 192 11.70 78.69 10.69 2014-15 22.04 69.66 141 2.55 57.79 1.71 2015-16 15.92 5.52 160 20.60 65.57 15.70 2016-17 13.10 5.80 160 16.11 65.57 12.27
Nandipur (GENCO-III)
2014-15 n.a. n.a. n.a. n.a. n.a. n.a. 2015-16 63.22 4.12 479 31.41 112.71 35.40 2016-17 43.15 3.87 457 35.82 107.53 38.52
FBC Lakhra (GENCO-IV)
2012-13 20.97 34.51 40 17.34 80.00 23.12 2013-14 30.46 19.44 34 52.45 68.00 59.45 2014-15 42.41 29.28 54 30.54 108.00 54.97 2015-16 43.18 29.15 36 46.86 38.46 18.02 2016-17 35.90 28.96 n.p. 41.63 54.49 22.68
Source: NTDC/GENCOs
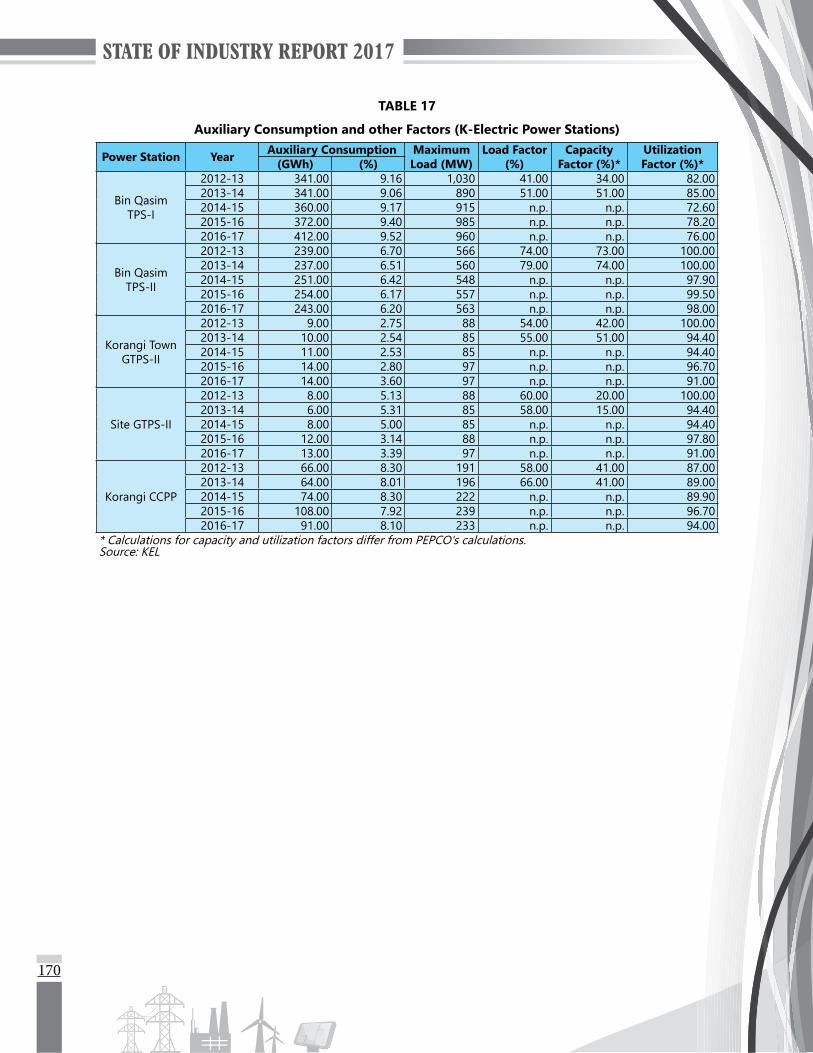
170
TABLE 17
Auxiliary Consumption and other Factors (K-Electric Power Stations)
Power Station Year Auxiliary Consumption Maximum Load (MW)
Load Factor (%)
Capacity Factor (%)*
Utilization Factor (%)*(GWh) (%)
Bin Qasim TPS-I
2012-13 341.00 9.16 1,030 41.00 34.00 82.00 2013-14 341.00 9.06 890 51.00 51.00 85.00 2014-15 360.00 9.17 915 n.p. n.p. 72.60 2015-16 372.00 9.40 985 n.p. n.p. 78.20 2016-17 412.00 9.52 960 n.p. n.p. 76.00
Bin Qasim TPS-II
2012-13 239.00 6.70 566 74.00 73.00 100.00 2013-14 237.00 6.51 560 79.00 74.00 100.00 2014-15 251.00 6.42 548 n.p. n.p. 97.90 2015-16 254.00 6.17 557 n.p. n.p. 99.50 2016-17 243.00 6.20 563 n.p. n.p. 98.00
Korangi Town GTPS-II
2012-13 9.00 2.75 88 54.00 42.00 100.00 2013-14 10.00 2.54 85 55.00 51.00 94.40 2014-15 11.00 2.53 85 n.p. n.p. 94.40 2015-16 14.00 2.80 97 n.p. n.p. 96.70 2016-17 14.00 3.60 97 n.p. n.p. 91.00
Site GTPS-II
2012-13 8.00 5.13 88 60.00 20.00 100.00 2013-14 6.00 5.31 85 58.00 15.00 94.40 2014-15 8.00 5.00 85 n.p. n.p. 94.40 2015-16 12.00 3.14 88 n.p. n.p. 97.80 2016-17 13.00 3.39 97 n.p. n.p. 91.00
Korangi CCPP
2012-13 66.00 8.30 191 58.00 41.00 87.00 2013-14 64.00 8.01 196 66.00 41.00 89.00 2014-15 74.00 8.30 222 n.p. n.p. 89.90 2015-16 108.00 7.92 239 n.p. n.p. 96.70 2016-17 91.00 8.10 233 n.p. n.p. 94.00
* Calculations for capacity and utilization factors differ from PEPCO's calculations.Source: KEL

171
TABLE 18Auxiliary Consumption and other Factors (IPPs)
Power Station YearAuxiliary Consumption Maximum
Load (MW)Load Factor
(%)Capacity
Factor (%)Utilization Factor (%)(GWh) (%)
Lal Pir Power
2012-13 115.27 6.55 350 82.64 53.60 53.60 2013-14 151.37 6.78 350 79.79 67.87 67.87 2014-15 123.67 6.92 350 75.66 65.11 65.11 2015-16 128.27 6.59 350 70.78 60.11 59.30 2016-17 107.17 6.69 350 63.27 49.40 n.p.
Pak Gen. Power
2012-13 130.94 5.96 350 84.17 63.14 63.14 2013-14 141.82 6.53 350 80.90 66.25 66.25 2014-15 95.12 7.22 350 75.14 59.87 59.87 2015-16 54.11 6.16 350 66.72 27.25 26.88 2016-17 111.56 6.46 350 63.92 53.43 n.p.
Altern Energy
2012-13 10.59 5.18 30 93.05 93.90 94.82 2013-14 10.94 5.06 30 94.50 96.10 94.94 2014-15 9.04 4.96 30 97.35 96.33 95.04 2015-16 9.58 5.19 30 94.80 96.40 94.81 2016-17 10.46 5.27 30 95.30 96.70 94.70
Fauji Kabirwala
2012-13 32.24 2.83 157 92.68 84.10 98.30 2013-14 36.03 3.16 157 94.87 89.85 94.99 2014-15 31.40 2.07 157 94.54 75.91 83.59 2015-16 30.41 2.67 157 95.60 84.70 88.72 2016-17 29.72 2.65 155 94.30 83.80 89.71
Habibullah Coastal
2012-13 n.p. 2.40 129 58.20 57.90 53.65 2013-14 15.66 2.32 128 70.56 59.56 76.98 2014-15 17.88 2.40 126 76.49 63.52 86.76 2015-16 14.41 2.56 124 65.49 63.34 76.00 2016-17 19.69 2.51 125 82.19 79.41 84.51
HUBCO
2012-13 481.64 5.90 1,200 73.00 82.00 89.00 2013-14 416.21 5.00 1,200 67.40 78.30 86.30 2014-15 398.00 5.84 1,200 65.00 76.00 83.00 2015-16 524.11 6.49 1,200 71.60 71.60 81.88 2016-17 484.77 6.66 1,200 64.45 64.45 81.81
Japan Power
2012-13 n.p. 1.50 107 10.80 10.70 8.54 Japan Power is still shut down mode since October 19, 2012.
KAPCO
2012-13 158.00 2.78 1,238 47.00 91.70 51.20 2013-14 185.00 2.78 1,444 55.10 80.20 68.70 2014-15 196.00 2.75 1,431 59.00 85.54 69.00 2015-16 174.00 2.60 1,521 56.00 81.90 68.20 2016-17 189.00 2.50 1,520 62.40 84.30 74.00
Kohinoor Energy
2012-13 22.00 2.97 124 92.84 66.71 71.09 2013-14 27.00 2.91 124 94.36 81.89 85.20 2014-15 26.35 2.92 124 93.80 80.73 84.80 2015-16 26.41 3.01 124 93.80 78.12 83.15 2016-17 24.68 3.02 124 92.60 72.93 78.10
Rousch Power
2012-13 46.60 1.80 452 72.83 73.45 98.31 2013-14 48.10 1.71 457 82.13 98.99 81.75 2014-15 44.88 1.78 450 72.04 91.70 78.90 2015-16 53.16 1.79 461 85.67 97.26 88.09 2016-17 46.93 1.91 451 83.75 88.86 94.25

172
Power Station YearAuxiliary Consumption Maximum
Load (MW)Load Factor
(%)Capacity
Factor (%)Utilization Factor (%)(GWh) (%)
Saba Power
2012-13 5.63 6.21 134 58.35 7.73 7.73 2013-14 9.05 6.53 134 46.40 11.76 11.76 2014-15 2.55 7.20 126 41.59 2.99 2.99 2015-16 4.52 6.41 126 61.54 5.99 5.99 2016-17 34.39 6.74 126 48.30 43.29 76.55
Southern Power
2012-13 n.p. 2.46 110 10.10 9.90 9.46 Southern Power is still shut down mode since October 19, 2012.
TNB Liberty Power
2012-13 18.78 2.04 207 55.84 48.75 86.31 2013-14 18.27 1.90 219 53.93 51.07 93.24 2014-15 24.83 2.00 216 67.44 65.91 91.76 2015-16 25.32 1.67 288 80.51 79.68 96.56 2016-17 25.15 1.72 224 79.48 76.76 93.32
Uch Power
2012-13 61.50 1.62 584 78.61 80.60 98.09 2013-14 67.73 1.57 591 89.37 90.99 99.09 2014-15 67.52 1.60 549 85.93 87.08 96.37 2015-16 69.10 1.61 548 87.50 88.38 93.95 2016-17 432.78 9.63 548 91.77 93.26 97.30
Attock Gen.
2012-13 29.48 2.29 157 98.42 92.30 100.37 2013-14 28.86 2.27 157 98.48 91.49 100.41 2014-15 27.88 2.31 157 98.00 89.00 100.00 2015-16 26.36 2.19 157 85.00 86.00 100.00 2016-17 31.98 2.74 158 82.00 86.00 100.00
Atlas Power
2012-13 46.45 2.48 214 73.67 73.82 77.71 2013-14 37.66 1.96 215 81.08 81.08 86.68 2014-15 52.16 3.57 215 78.02 78.02 82.99 2015-16 47.99 3.63 215 70.29 70.29 75.69 2016-17 51.06 3.82 214 71.36 71.36 77.76
Nishat Power
2012-13 33.44 2.55 195 83.66 72.76 83.66 2013-14 39.39 2.62 195 95.30 83.57 95.30 2014-15 38.88 2.68 195 90.13 80.47 90.13 2015-16 35.13 2.69 195 80.83 72.41 80.83 2016-17 35.75 2.79 195 80.51 70.76 80.51
Liberty Power Tech.
2012-13 n.p. n.p. 196 83.70 n.p. n.p. 2013-14 32.25 2.10 197 97.70 88.44 90.58 2014-15 32.07 2.07 196 97.80 88.15 90.27 2015-16 27.53 2.16 196 97.65 72.55 75.93 2016-17 29.60 2.16 196 98.64 77.97 80.80
Narowal Energy
2012-13 n.p. n.p. 214 43.80 n.p. n.p. 2013-14 30.25 1.94 217 83.41 83.41 96.13 2014-15 25.72 1.81 215 75.55 75.55 86.71 2015-16 23.75 2.04 215 61.77 61.77 70.81 2016-17 25.70 1.93 216 71.15 71.15 79.21
Nishat Chunian
2012-13 n.p. n.p. 196 74.80 n.p. n.p. 2013-14 27.50 2.37 196 95.66 85.80 88.70 2014-15 27.40 2.36 196 93.05 81.33 85.02 2015-16 31.53 2.54 196 93.67 70.49 73.84 2016-17 34.46 2.55 196 95.70 76.60 80.20
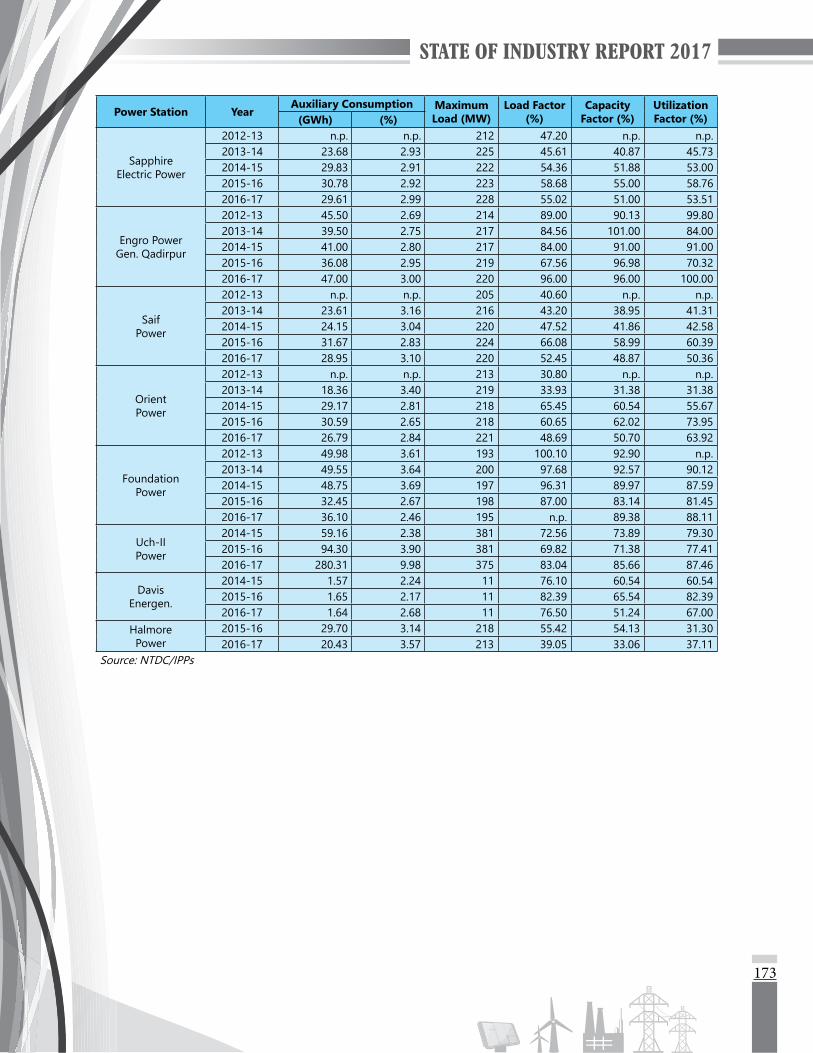
173
Power Station YearAuxiliary Consumption Maximum
Load (MW)Load Factor
(%)Capacity
Factor (%)Utilization Factor (%)(GWh) (%)
Sapphire Electric Power
2012-13 n.p. n.p. 212 47.20 n.p. n.p. 2013-14 23.68 2.93 225 45.61 40.87 45.73 2014-15 29.83 2.91 222 54.36 51.88 53.00 2015-16 30.78 2.92 223 58.68 55.00 58.76 2016-17 29.61 2.99 228 55.02 51.00 53.51
Engro Power Gen. Qadirpur
2012-13 45.50 2.69 214 89.00 90.13 99.80 2013-14 39.50 2.75 217 84.56 101.00 84.00 2014-15 41.00 2.80 217 84.00 91.00 91.00 2015-16 36.08 2.95 219 67.56 96.98 70.32 2016-17 47.00 3.00 220 96.00 96.00 100.00
Saif Power
2012-13 n.p. n.p. 205 40.60 n.p. n.p. 2013-14 23.61 3.16 216 43.20 38.95 41.31 2014-15 24.15 3.04 220 47.52 41.86 42.58 2015-16 31.67 2.83 224 66.08 58.99 60.39 2016-17 28.95 3.10 220 52.45 48.87 50.36
Orient Power
2012-13 n.p. n.p. 213 30.80 n.p. n.p. 2013-14 18.36 3.40 219 33.93 31.38 31.38 2014-15 29.17 2.81 218 65.45 60.54 55.67 2015-16 30.59 2.65 218 60.65 62.02 73.95 2016-17 26.79 2.84 221 48.69 50.70 63.92
Foundation Power
2012-13 49.98 3.61 193 100.10 92.90 n.p. 2013-14 49.55 3.64 200 97.68 92.57 90.12 2014-15 48.75 3.69 197 96.31 89.97 87.59 2015-16 32.45 2.67 198 87.00 83.14 81.45 2016-17 36.10 2.46 195 n.p. 89.38 88.11
Uch-II Power
2014-15 59.16 2.38 381 72.56 73.89 79.30 2015-16 94.30 3.90 381 69.82 71.38 77.41 2016-17 280.31 9.98 375 83.04 85.66 87.46
Davis Energen.
2014-15 1.57 2.24 11 76.10 60.54 60.54 2015-16 1.65 2.17 11 82.39 65.54 82.39 2016-17 1.64 2.68 11 76.50 51.24 67.00
Halmore Power
2015-16 29.70 3.14 218 55.42 54.13 31.30 2016-17 20.43 3.57 213 39.05 33.06 37.11
Source: NTDC/IPPs

174
TABLE 19Heat Rate and Plant Efficiency Data (GENCOs)
Power Station YearHeat Rate (Btu/kWh) Plant Efficiency (%)
On Gross Generation On Net Export to NTDC On Gross Generation On Net Export to
NTDC
TPS Jamshoro (GENCO-I)
2012-13 10,912.00 12,250.00 31.27 27.862013-14 10,534.00 11,580.00 32.00 29.002014-15 10,679.00 12,051.00 31.96 28.322015-16 11,352.00 12,590.00 30.07 27.122016-17 10,823.00 12,008.00 31.54 28.42
GTPS Kotri (GENCO-I)
2012-13 12,946.00 11,433.00 26.00 29.842013-14 10,993.00 n.p. 31.00 n.p.2014-15 11,520.00 12,023.00 29.63 28.392015-16 11,682.00 12,107.00 29.21 28.182016-17 12,124.00 12,612.00 28.14 27.05
TPS Guddu (Units 1-4) (GENCO-II)
2012-13 12,749.00 13,928.00 26.77 25.002013-14 12,387.00 n.p. 28.00 n.p. 2014-15 13,455.00 n.p. 25.36 n.p.2015-16 13,726.00 n.p. 24.86 n.p.2016-17 n.p. n.p. n.p. n.p.
TPS Guddu (Units 5-13) (GENCO-II)
2012-13 9,733.00 12,551.00 35.14 27.002013-14 9,939.00 12,648.00 34.00 27.002014-15 7,195.00 n.p. 47.43 n.p.2015-16 8,796.00 n.p. 38.80 n.p.2016-17 n.p. n.p. n.p. n.p.
TPS Guddu (Units 14-16) (GENCO-II)
2015-16 7,404.00 7,558.00 46.10 45.16 2016-17 6,848.00 7,008.00 49.84 48.70
TPS Quetta (Isolated Generation)
(GENCO-II)
2012-13 17,176.00 17,623.00 19.87 19.002013-14 17,747.00 n.p. 19.00 n.p. 2014-15 n.p. n.p. n.p. n.p.2015-16 16,571.00 16,808.00 20.60 20.312016-17 16,792.00 17,109.00 20.32 19.95
TPS Muzaffargarh (GENCO-III)
2012-13 10,475.00 11,513.00 32.81 29.642013-14 10,358.00 11,528.00 33.00 30.002014-15 10,467.00 13,723.00 32.61 24.872015-16 11,494.14 12,738.54 29.69 26.792016-17 10,378.41 11,465.99 32.88 29.76
SPS Faisalabad (GENCO-III)
2013-14 14,393.00 16,656.00 24.00 20.002014-15 13,137.00 n.p. 25.98 n.p.2015-16 12,751.04 14,377.28 26.77 23.742016-17 12,574.45 14,305.59 27.14 23.86
GTPS Faisalabad (GENCO-III)
2012-13 10,495.00 12,391.00 32.52 28.002013-14 12,113.00 n.p. 28.00 n.p.2014-15 11,431.00 n.p. 29.85 n.p.2015-16 11,588.03 12,264.72 29.45 28.002016-17 11,320.61 12,018.19 30.15 29.00
Nandipur (GENCO-III)
2015-16 9,106.00 9,498.00 37.48 35.932016-17 8,280.00 8,614.00 41.22 39.62
FBC Lakhra (GENCO-IV)
2012-13 14,573.00 21,810.00 24.21 15.822013-14 13,389.00 18,770.00 25.00 18.002014-15 13,537.00 19,202.00 25.21 17.772015-16 13,623.54 19,228.02 25.05 17.752016-17 13,219.06 18,609.02 25.82 18.34
Source: NTDC/GENCOs

175
TABLE 20Heat Rate and Plant Efficiency Data (IPPs)
Power Station Year
Heat Rate (Btu/kWh) Plant Efficiency (%)On Gross Generation On Net Export to NTDC On Gross Generation On Net Export to NTDCGas/FO HSD Gas/FO HSD Gas/FO HSD Gas/FO HSD
Lal Pir Power
2012-13 8,640.00 - 9,246.00 - 39.50 - 36.90 -2013-14 8,599.74 - 9,225.29 - 39.68 - 36.99 -2014-15 8,373.62 - 8,996.44 - 40.75 - 37.93 -2015-16 8,653.83 - 9,264.47 - 39.43 - 36.83 -2016-17 8,760.34 - 9,388.78 - 38.95 - 36.35 -
Pak Gen. Power
2012-13 8,532.00 - 9,109.00 - 40.00 - 37.50 -2013-14 8,578.00 - 9,176.00 - 39.78 - 37.18 -2014-15 8,391.67 - 9,044.83 - 40.66 - 37.72 -2015-16 8,694.26 - 9,265.19 - 39.25 - 36.83 -2016-17 8,794.96 - 9,402.24 - 38.80 - 36.29 -
Altern Energy
2013-14 9,322.95 - 9,826.75 - 36.60 - 34.73 -2014-15 9,570.00 - 10,069.00 - 35.70 - 33.90 -2015-16 9,407.00 - 9,921.70 - 36.27 - 34.39 -2016-17 9,422.80 - 9,947.30 - 36.20 - 34.30 -
Fauji Kabirwala
2012-13 7,455.81 - 7,670.88 - 45.76 - 44.80 -2013-14 7,480.00 - 7,706.00 - 45.62 - 44.28 -2014-15 7,458.00 - 7,728.00 - 45.57 - 44.15 -2015-16 7,533.61 - 7,763.67 - 45.29 - 43.95 -2016-17 7,613.45 - 7,820.44 - 44.82 - 43.63 -
Habibullah Coastal
2012-13 8,442.81 - 8,653.88 - 40.42 - 39.02 -2013-14 8,336.50 - 8,531.00 - 40.94 - 40.00 -2014-15 8,371.60 - 8,579.00 - 40.77 - 39.70 -2015-16 8,465.04 - 8,746.99 - 40.33 - 39.03 -2016-17 8,039.25 - 8,410.80 - 42.47 - 40.59 -
Hub Power
2012-13 8,325.39 - 8,963.88 - 41.01 - 38.06 -2013-14 n.p. - 8,968.15 - n.p. - 38.05 -2014-15 n.p. - 8,953.65 - n.p. - 38.00 -2015-16 8,462.62 - 9,118.46 - 40.32 - 37.42 -2016-17 8,466.82 - 9,053.14 - 40.30 - 37.69 -
KAPCO
2012-13 7,538.00 - 7,753.00 - 45.30 - 44.00 -2013-14 7,590.00 - 7,807.00 - 45.00 - 43.70 -2014-15 7,916.00 - 8,075.00 - 45.48 - 44.60 -2015-16 7,977.00 - 8,189.00 - 45.10 - 44.00 -2016-17 8,028.00 - 8,236.00 - 44.80 - 43.70 -
Kohinoor Energy
2013-14 7,228.08 - 7,444.67 - 47.21 - 45.83 -2014-15 7,753.80 - 7,986.80 - 44.01 - 42.72 -2015-16 7,745.98 - 7,986.85 - 44.05 - 42.72 -
Rousch Power
2012-13 7,812.00 - 7,953.00 - 48.51 - 47.66 -2013-14 7,012.00 - 7,393.00 - 48.69 - 47.84 -2014-15 7,027.00 - 7,153.00 - 48.59 - 47.73 -2015-16 7,100.91 - 7,227.99 - 48.10 - 47.25 -2016-17 7,109.65 - 7,245.30 - 48.04 - 47.14 -
Saba Power
2013-14 9,955.78 - 10,438.76 - 34.97 - 32.69 -2014-15 10,324.91 - 11,126.07 - 33.81 - 31.37 -2015-16 9,754.00 - 10,422.00 - 34.98 - 32.47 -2016-17 9,737.00 - 10,441.00 - 35.04 - 32.68 -
Halmore Power
2015-16 6,499.00 6,861.00 6,666.00 7,037.00 52.52 49.74 n.p. n.p.2016-17 6,499.00 6,861.00 6,666.00 7,037.00 52.52 49.74 n.p. n.p.
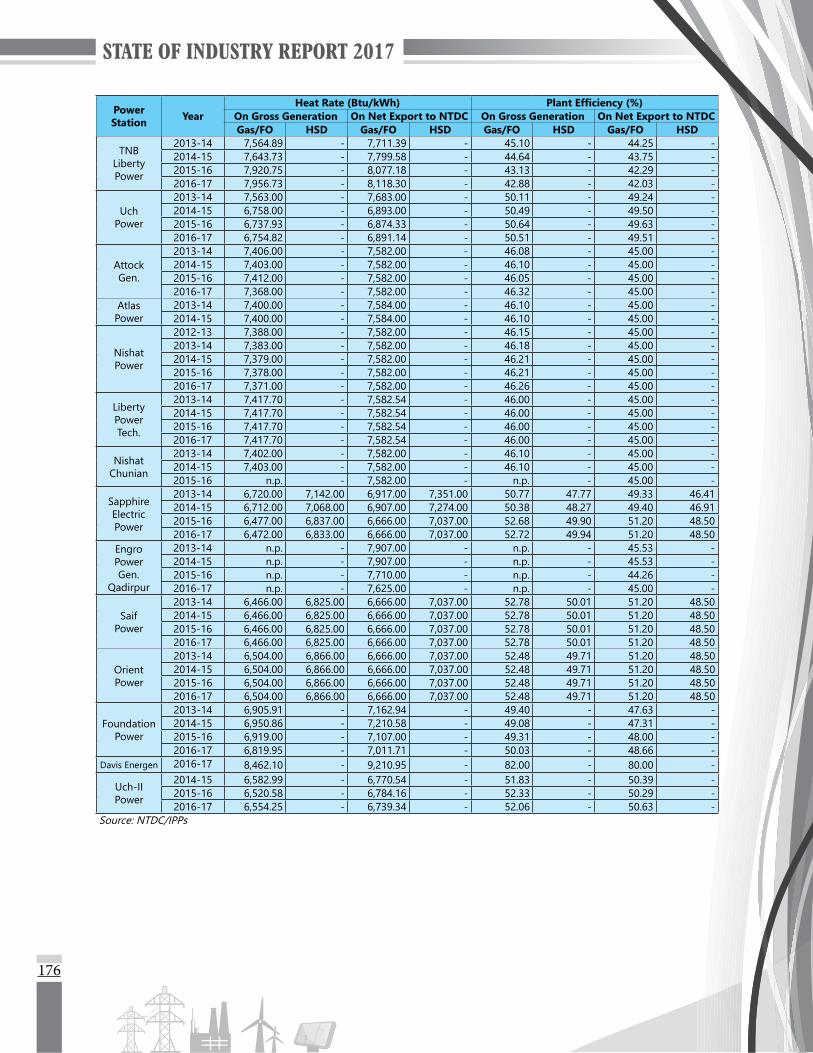
176
Power Station Year
Heat Rate (Btu/kWh) Plant Efficiency (%)On Gross Generation On Net Export to NTDC On Gross Generation On Net Export to NTDCGas/FO HSD Gas/FO HSD Gas/FO HSD Gas/FO HSD
TNB Liberty Power
2013-14 7,564.89 - 7,711.39 - 45.10 - 44.25 -2014-15 7,643.73 - 7,799.58 - 44.64 - 43.75 -2015-16 7,920.75 - 8,077.18 - 43.13 - 42.29 -2016-17 7,956.73 - 8,118.30 - 42.88 - 42.03 -
Uch Power
2013-14 7,563.00 - 7,683.00 - 50.11 - 49.24 -2014-15 6,758.00 - 6,893.00 - 50.49 - 49.50 -2015-16 6,737.93 - 6,874.33 - 50.64 - 49.63 -2016-17 6,754.82 - 6,891.14 - 50.51 - 49.51 -
Attock Gen.
2013-14 7,406.00 - 7,582.00 - 46.08 - 45.00 -2014-15 7,403.00 - 7,582.00 - 46.10 - 45.00 -2015-16 7,412.00 - 7,582.00 - 46.05 - 45.00 -2016-17 7,368.00 - 7,582.00 - 46.32 - 45.00 -
Atlas Power
2013-14 7,400.00 - 7,584.00 - 46.10 - 45.00 -2014-15 7,400.00 - 7,584.00 - 46.10 - 45.00 -
Nishat Power
2012-13 7,388.00 - 7,582.00 - 46.15 - 45.00 -2013-14 7,383.00 - 7,582.00 - 46.18 - 45.00 -2014-15 7,379.00 - 7,582.00 - 46.21 - 45.00 -2015-16 7,378.00 - 7,582.00 - 46.21 - 45.00 -2016-17 7,371.00 - 7,582.00 - 46.26 - 45.00 -
Liberty Power Tech.
2013-14 7,417.70 - 7,582.54 - 46.00 - 45.00 -2014-15 7,417.70 - 7,582.54 - 46.00 - 45.00 -2015-16 7,417.70 - 7,582.54 - 46.00 - 45.00 -2016-17 7,417.70 - 7,582.54 - 46.00 - 45.00 -
Nishat Chunian
2013-14 7,402.00 - 7,582.00 - 46.10 - 45.00 -2014-15 7,403.00 - 7,582.00 - 46.10 - 45.00 -2015-16 n.p. - 7,582.00 - n.p. - 45.00 -
Sapphire Electric Power
2013-14 6,720.00 7,142.00 6,917.00 7,351.00 50.77 47.77 49.33 46.412014-15 6,712.00 7,068.00 6,907.00 7,274.00 50.38 48.27 49.40 46.912015-16 6,477.00 6,837.00 6,666.00 7,037.00 52.68 49.90 51.20 48.502016-17 6,472.00 6,833.00 6,666.00 7,037.00 52.72 49.94 51.20 48.50
Engro Power Gen.
Qadirpur
2013-14 n.p. - 7,907.00 - n.p. - 45.53 -2014-15 n.p. - 7,907.00 - n.p. - 45.53 -2015-16 n.p. - 7,710.00 - n.p. - 44.26 -2016-17 n.p. - 7,625.00 - n.p. - 45.00 -
Saif Power
2013-14 6,466.00 6,825.00 6,666.00 7,037.00 52.78 50.01 51.20 48.502014-15 6,466.00 6,825.00 6,666.00 7,037.00 52.78 50.01 51.20 48.502015-16 6,466.00 6,825.00 6,666.00 7,037.00 52.78 50.01 51.20 48.502016-17 6,466.00 6,825.00 6,666.00 7,037.00 52.78 50.01 51.20 48.50
Orient Power
2013-14 6,504.00 6,866.00 6,666.00 7,037.00 52.48 49.71 51.20 48.502014-15 6,504.00 6,866.00 6,666.00 7,037.00 52.48 49.71 51.20 48.502015-16 6,504.00 6,866.00 6,666.00 7,037.00 52.48 49.71 51.20 48.502016-17 6,504.00 6,866.00 6,666.00 7,037.00 52.48 49.71 51.20 48.50
Foundation Power
2013-14 6,905.91 - 7,162.94 - 49.40 - 47.63 -2014-15 6,950.86 - 7,210.58 - 49.08 - 47.31 -2015-16 6,919.00 - 7,107.00 - 49.31 - 48.00 -2016-17 6,819.95 - 7,011.71 - 50.03 - 48.66 -
Davis Energen 2016-17 8,462.10 - 9,210.95 - 82.00 - 80.00 -
Uch-II Power
2014-15 6,582.99 - 6,770.54 - 51.83 - 50.39 -2015-16 6,520.58 - 6,784.16 - 52.33 - 50.29 -2016-17 6,554.25 - 6,739.34 - 52.06 - 50.63 -
Source: NTDC/IPPs

177
TABLE 21Main Electricity Statistics of the Country
2012-13 2013-14 2014-15 2015-16 2016-171: Maximum Energy Demand (MW)PEPCO Area* 22,883 23,425 23,419 23,267 24,290 KEL Area 2,778 2,929 3,056 3,195 3,270 Un-diversified Energy Demand of the Country** 21,605 23,505 24,022 26,394 n.p. Diversified Energy Demand of the Country 21,181 23,044 23,551 25,876 n.p. 2: Auxiliary Consumption and System Losses (in percentage)PEPCO AreaAuxiliary Consumption n.p. 2.70 2.70 n.p. n.p. Transmission Losses 3.05 2.82 2.63 2.57 2.31 Distribution Losses 18.59 18.83 18.99 18.14 17.95 KEL AreaAuxiliary Consumption (KEL Own) 7.74 7.56 7.55 7.36 7.62T&D Losses (excluding Auxiliary Consumption) 27.83 25.30 23.69 22.24 21.703: Average Sales Price (Rs./kWh)PEPCO Area 8.94 10.35 10.60 7.61 8.84KEL Area 11.02 12.15 12.08 16.05 16.064: Per Capita Electricity Consumption PEPCO systemPopulation (Million) 168.82 174.28 179.91 185.72 191.72Energy Sale (GWh) 70,447.04 76,493.93 77,636.48 81,489.76 86,628.24 Per capita electricity consumption (kWh) 418 445 446 457 n.p. Average Sale/ Consumer (kWh) 2,970.62 3,145.62 3,070.23 3,117.50 3,189.11 KEL systemPopulation (Million) 14.76 15.07 15.39 15.72 16.05Energy Sale (GWh) 10,942.00 11,454.00 12,293.00 12,864.00 12,981.00 Per capita electricity consumption (kWh) 547 487 523 547 n.p. Average Sale/ Consumer (kWh) 5,121.20 5,425.00 5,695.71 5,777.22 5,350.79 * Based on un-diversified power demand indicated by DISCOs in Table 52.** Using demand data of Table 27.Source: NTDC/DISCOs/KEL
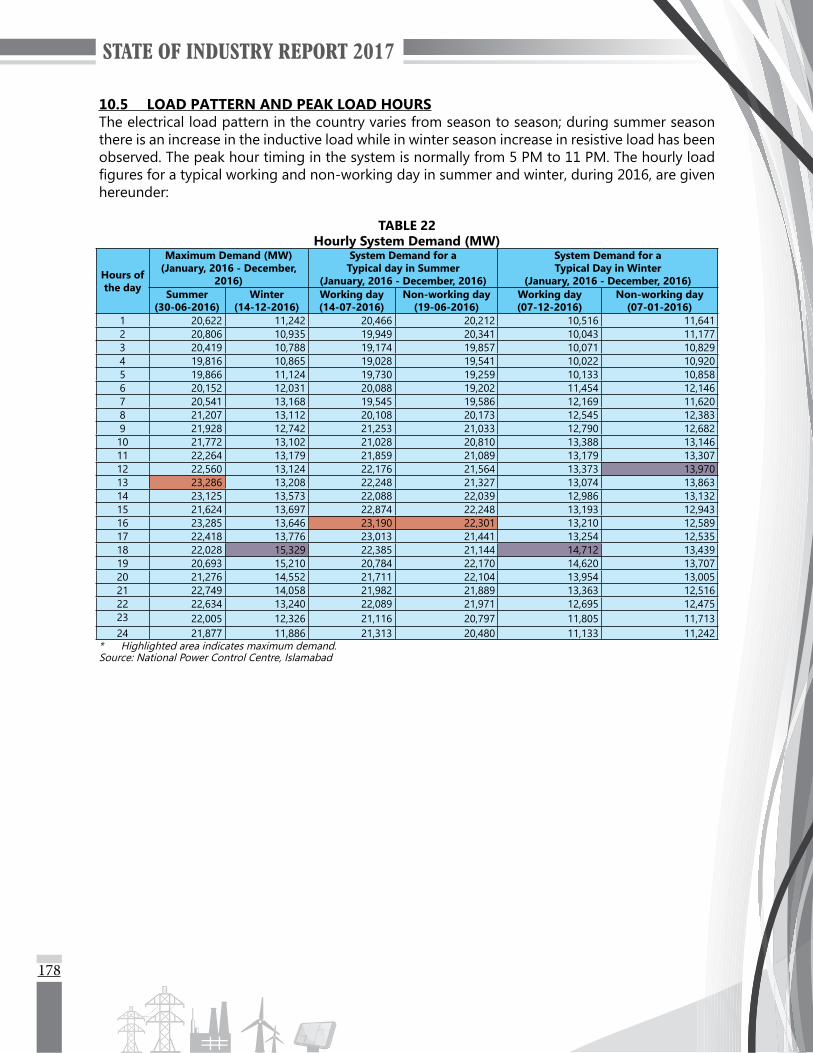
178
10.5 LOAD PATTERN AND PEAK LOAD HOURSThe electrical load pattern in the country varies from season to season; during summer season there is an increase in the inductive load while in winter season increase in resistive load has been observed. The peak hour timing in the system is normally from 5 PM to 11 PM. The hourly load figures for a typical working and non-working day in summer and winter, during 2016, are given hereunder:
TABLE 22Hourly System Demand (MW)
Hours of the day
Maximum Demand (MW) (January, 2016 - December,
2016)
System Demand for a Typical day in Summer
(January, 2016 - December, 2016)
System Demand for a Typical Day in Winter
(January, 2016 - December, 2016)Summer
(30-06-2016)Winter
(14-12-2016)Working day (14-07-2016)
Non-working day (19-06-2016)
Working day (07-12-2016)
Non-working day (07-01-2016)
1 20,622 11,242 20,466 20,212 10,516 11,641 2 20,806 10,935 19,949 20,341 10,043 11,177 3 20,419 10,788 19,174 19,857 10,071 10,829 4 19,816 10,865 19,028 19,541 10,022 10,920 5 19,866 11,124 19,730 19,259 10,133 10,858 6 20,152 12,031 20,088 19,202 11,454 12,146 7 20,541 13,168 19,545 19,586 12,169 11,620 8 21,207 13,112 20,108 20,173 12,545 12,383 9 21,928 12,742 21,253 21,033 12,790 12,682 10 21,772 13,102 21,028 20,810 13,388 13,146 11 22,264 13,179 21,859 21,089 13,179 13,307 12 22,560 13,124 22,176 21,564 13,373 13,970 13 23,286 13,208 22,248 21,327 13,074 13,863 14 23,125 13,573 22,088 22,039 12,986 13,132 15 21,624 13,697 22,874 22,248 13,193 12,943 16 23,285 13,646 23,190 22,301 13,210 12,589 17 22,418 13,776 23,013 21,441 13,254 12,535 18 22,028 15,329 22,385 21,144 14,712 13,439 19 20,693 15,210 20,784 22,170 14,620 13,707 20 21,276 14,552 21,711 22,104 13,954 13,005 21 22,749 14,058 21,982 21,889 13,363 12,516 22 22,634 13,240 22,089 21,971 12,695 12,475 23 22,005 12,326 21,116 20,797 11,805 11,713 24 21,877 11,886 21,313 20,480 11,133 11,242
* Highlighted area indicates maximum demand.Source: National Power Control Centre, Islamabad

179
-
2,000
4,000
6,000
8,000
10,000
12,000
14,000
16,000
18,000
20,000
22,000
24,000
1 2 3 4 5 6 7 8 9 10 11 12 13 14 15 16 17 18 19 20 21 22 23 24
HOURS OF THE DAY
Figure 22A. Maximum Demand (MW)
Summer(30-06-2016)
Winter(14-12-2016)
- 2,000 4,000 6,000 8,000
10,000 12,000 14,000 16,000 18,000 20,000 22,000 24,000 26,000
1 2 3 4 5 6 7 8 9 10 11 12 13 14 15 16 17 18 19 20 21 22 23 24
HOURS OF THE DAY
Figure 22B. System Demand for a Typical Dayin Summer and Winter (MW)
Working day(14-07-2016)
Non-working day(19-06-2016)
Working day(07-12-2016)
Non-working day(07-01-2016)
10.6 ENERGY SALES AND CONSUMER-WISE ELECTRICITY CONSUMPTIONThe following tables (table 23 to 24) show the energy sales and consumer-wise electricity consumption of the country from 2012-13 to 2016-17:

180
TABLE 23Category-wise Energy Sales in PEPCO and K-Electric System
2012-13 2013-14 2014-15 2015-16 2016-17PEPCO System
Domestic GWh 30,321.35 33,322.30 34,177.90 36,941.29 41,412.07Percentage share % 43.04 43.56 44.02 45.33 47.80Commercial GWh 4,433.71 4,792.50 4,837.89 5,411.43 6,114.64Percentage share % 6.29 6.27 6.23 6.64 7.06Industrial GWh 18,641.44 20,550.80 21,073.32 21,147.75 20,066.58Percentage share % 26.46 26.87 27.14 25.95 23.16Agricultural GWh 7,550.34 8,129.49 7,849.97 8,362.27 9,063.15Percentage share % 10.72 10.63 10.11 10.26 10.46Public Lighting GWh 387.09 389.90 391.31 294.64 298.29Percentage share % 0.55 0.51 0.50 0.36 0.34Bulk Supply GWh 3,622.95 3,836.55 3,846.07 3,138.90 3,445.81Percentage share % 5.14 5.02 4.95 3.85 3.98Others GWh 27.18 31.40 33.02 1,134.49 1,150.70Percentage share % 0.04 0.04 0.04 1.39 1.33Supplied to KEL GWh 5,463.00 5,441.00 5,427.00 5,059.00 5,077.00Percentage share % 7.75 7.11 6.99 6.21 5.86Total in PEPCO area GWh 70,447.04 76,493.93 77,636.48 81,489.76 86,628.24Percentage share % 86.56 86.98 86.33 86.37 86.97
KEL SystemDomestic GWh 5,083.00 5,489.00 6,150.00 6,596.00 6,643.00Percentage share % 46.45 47.92 50.03 51.27 51.17Commercial GWh 1,507.00 1,507.00 1,600.00 1,685.00 1,655.00Percentage share % 13.77 13.16 13.02 13.10 12.75Industrial GWh 3,445.00 3,568.00 3,844.00 3,830.00 3,885.00Percentage share % 31.48 31.15 31.27 29.77 29.93Agricultural GWh 149.00 160.00 166.00 163.00 159.00Percentage share % 1.36 1.40 1.35 1.27 1.22Public Lighting GWh 111.00 106.00 110.00 163.00 187.00Percentage share % 1.01 0.93 0.89 1.27 1.44Bulk Supply GWh 473.00 427.00 410.00 412.00 433.00Percentage share % 4.32 3.73 3.34 3.20 3.34Others GWh 174.00 197.00 13.00 15.00 19.00Percentage share % 1.59 1.72 0.11 0.12 0.15Total in KEL area GWh 10,942.00 11,454.00 12,293.00 12,864.00 12,981.00Percentage share % 13.44 13.02 13.67 13.63 13.03
CountryDomestic GWh 35,404.35 38,811.30 40,327.90 43,537.29 48,055.07Percentage share % 43.50 44.13 44.84 46.14 48.24Commercial GWh 5,940.71 6,299.50 6,437.89 7,096.43 7,769.64Percentage share % 7.30 7.16 7.16 7.52 7.80Industrial GWh 22,086.44 24,118.80 24,917.32 24,977.75 23,951.58Percentage share % 27.14 27.42 27.71 26.47 24.05Agricultural GWh 7,699.34 8,289.49 8,015.97 8,525.27 9,222.15Percentage share % 9.46 9.43 8.91 9.04 9.26Public Lighting GWh 498.09 495.90 501.31 457.64 485.29Percentage share % 0.61 0.56 0.56 0.49 0.49Bulk Supply GWh 4,095.95 4,263.55 4,256.07 3,550.90 3,878.81Percentage share % 5.03 4.85 4.73 3.76 3.89Others GWh 201.18 228.40 46.02 1,149.49 1,169.70Percentage share % 0.25 0.26 0.05 1.22 1.17Supplied to KEL by PEPCO GWh 5,463.00 5,441.00 5,427.00 5,059.00 5,077.00Percentage share % 6.71 6.19 6.03 5.36 5.10Total in the Country GWh 81,389.04 87,947.93 89,929.48 94,353.76 99,609.24Percentage share % 100.00 100.00 100.00 100.00 100.00Source: NTDC/DISCOs/KEL
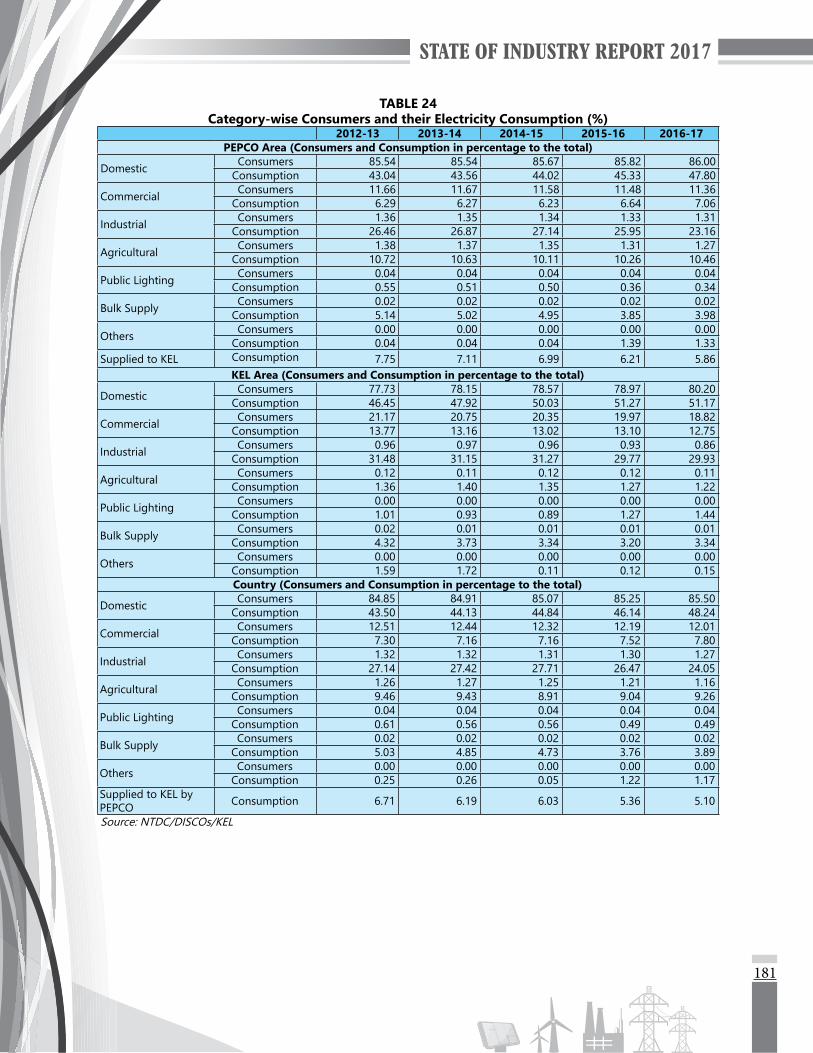
181
TABLE 24Category-wise Consumers and their Electricity Consumption (%)
2012-13 2013-14 2014-15 2015-16 2016-17PEPCO Area (Consumers and Consumption in percentage to the total)
Domestic Consumers 85.54 85.54 85.67 85.82 86.00Consumption 43.04 43.56 44.02 45.33 47.80
Commercial Consumers 11.66 11.67 11.58 11.48 11.36Consumption 6.29 6.27 6.23 6.64 7.06
Industrial Consumers 1.36 1.35 1.34 1.33 1.31Consumption 26.46 26.87 27.14 25.95 23.16
Agricultural Consumers 1.38 1.37 1.35 1.31 1.27Consumption 10.72 10.63 10.11 10.26 10.46
Public Lighting Consumers 0.04 0.04 0.04 0.04 0.04Consumption 0.55 0.51 0.50 0.36 0.34
Bulk Supply Consumers 0.02 0.02 0.02 0.02 0.02Consumption 5.14 5.02 4.95 3.85 3.98
Others Consumers 0.00 0.00 0.00 0.00 0.00Consumption 0.04 0.04 0.04 1.39 1.33
Supplied to KEL Consumption 7.75 7.11 6.99 6.21 5.86KEL Area (Consumers and Consumption in percentage to the total)
Domestic Consumers 77.73 78.15 78.57 78.97 80.20Consumption 46.45 47.92 50.03 51.27 51.17
Commercial Consumers 21.17 20.75 20.35 19.97 18.82Consumption 13.77 13.16 13.02 13.10 12.75
Industrial Consumers 0.96 0.97 0.96 0.93 0.86Consumption 31.48 31.15 31.27 29.77 29.93
Agricultural Consumers 0.12 0.11 0.12 0.12 0.11Consumption 1.36 1.40 1.35 1.27 1.22
Public Lighting Consumers 0.00 0.00 0.00 0.00 0.00Consumption 1.01 0.93 0.89 1.27 1.44
Bulk Supply Consumers 0.02 0.01 0.01 0.01 0.01Consumption 4.32 3.73 3.34 3.20 3.34
Others Consumers 0.00 0.00 0.00 0.00 0.00Consumption 1.59 1.72 0.11 0.12 0.15Country (Consumers and Consumption in percentage to the total)
Domestic Consumers 84.85 84.91 85.07 85.25 85.50Consumption 43.50 44.13 44.84 46.14 48.24
Commercial Consumers 12.51 12.44 12.32 12.19 12.01Consumption 7.30 7.16 7.16 7.52 7.80
Industrial Consumers 1.32 1.32 1.31 1.30 1.27Consumption 27.14 27.42 27.71 26.47 24.05
Agricultural Consumers 1.26 1.27 1.25 1.21 1.16Consumption 9.46 9.43 8.91 9.04 9.26
Public Lighting Consumers 0.04 0.04 0.04 0.04 0.04Consumption 0.61 0.56 0.56 0.49 0.49
Bulk Supply Consumers 0.02 0.02 0.02 0.02 0.02Consumption 5.03 4.85 4.73 3.76 3.89
Others Consumers 0.00 0.00 0.00 0.00 0.00Consumption 0.25 0.26 0.05 1.22 1.17
Supplied to KEL by PEPCO Consumption 6.71 6.19 6.03 5.36 5.10
Source: NTDC/DISCOs/KEL

182
10.7 PATTERN OF ELECTRICITY CONSUMPTIONThe overall electricity consumption in the country since 2000 was growing steadily. However, during the fiscal year 2016-17 electricity consumption in the country excluding K-Electric area increased by 6.31%. The sector-wise electricity consumption and their share in total electricity consumption of the country, for the years 2012-13 to 2016-17 are given in the following table:
TABLE 25Annual Growth Rate of Electricity Consumption
2012-13 2013-14 2014-15 2015-16 2016-17PEPCO Area
Domestic GWh 30,321.35 33,322.30 34,177.90 36,941.29 41,412.07% 0.39 9.90 2.57 8.09 12.10
Commercial GWh 4,433.71 4,792.50 4,837.89 5,411.43 6,114.64% -2.82 8.09 0.95 11.86 13.00
Industrial GWh 18,641.44 20,550.80 21,073.32 21,147.75 20,066.58% 1.32 10.24 2.54 0.35 -5.11
Agricultural GWh 7,550.34 8,129.49 7,849.97 8,362.27 9,063.15% -10.22 7.67 -3.44 6.53 8.38
Public Lighting GWh 387.09 389.90 391.31 294.64 298.29% 6.67 0.73 0.36 -24.70 1.24
Bulk Supply GWh 3,622.95 3,836.55 3,846.07 3,138.90 3,445.81% 39.43 5.90 0.25 -18.39 9.78
Others GWh 27.18 31.40 33.02 1,134.49 1,150.70% -97.10 15.52 5.16 3336.18 1.43
Supplied to K-EL GWh 5,463.00 5,441.00 5,427.00 5,059.00 5,077.00% -3.88 -0.40 -0.26 -6.78 0.36
Total GWh 70,447.04 76,493.93 77,636.48 81,489.76 86,628.24Percentage change % -1.00 8.58 1.49 4.96 6.31
KEL Area
Domestic GWh 5,083.00 5,489.00 6,150.00 6,596.00 6,643.00% 11.37 7.99 12.04 7.25 0.71
Commercial GWh 1,507.00 1,507.00 1,600.00 1,685.00 1,655.00% 33.60 0.00 6.17 5.31 -1.78
Industrial GWh 3,445.00 3,568.00 3,844.00 3,830.00 3,885.00% 3.08 3.57 7.74 -0.36 1.44
Agricultural GWh 149.00 160.00 166.00 163.00 159.00% 11.19 7.38 3.75 -1.81 -2.45
Public Lighting GWh 111.00 106.00 110.00 163.00 187.00% -5.93 -4.50 3.77 48.18 14.72
Bulk Supply GWh 473.00 427.00 410.00 412.00 433.00% -41.32 -9.73 -3.98 0.49 5.10
Others GWh 174.00 197.00 13.00 15.00 19.00% -7.45 13.22 -93.40 15.38 26.67
Total GWh 10,942.00 11,454.00 12,293.00 12,864.00 12,981.00Percentage change % 6.44 4.68 7.32 4.64 0.91
Country
Domestic GWh 35,404.35 38,811.30 40,327.90 43,537.29 48,055.07% 1.83 9.62 3.91 7.96 10.38
Commercial GWh 5,940.71 6,299.50 6,437.89 7,096.43 7,769.64% 4.40 6.04 2.20 10.23 9.49
Industrial GWh 22,086.44 24,118.80 24,917.32 24,977.75 23,951.58% 1.59 9.20 3.31 0.24 -4.11
Agricultural GWh 7,699.34 8,289.49 8,015.97 8,525.27 9,222.15% -9.88 7.66 -3.30 6.35 8.17
Public Lighting GWh 498.09 495.90 501.31 457.64 485.29% 3.58 -0.44 1.09 -8.71 6.04
Bulk Supply GWh 4,095.95 4,263.55 4,256.07 3,550.90 3,878.81% 20.32 4.09 -0.18 -16.57 9.23
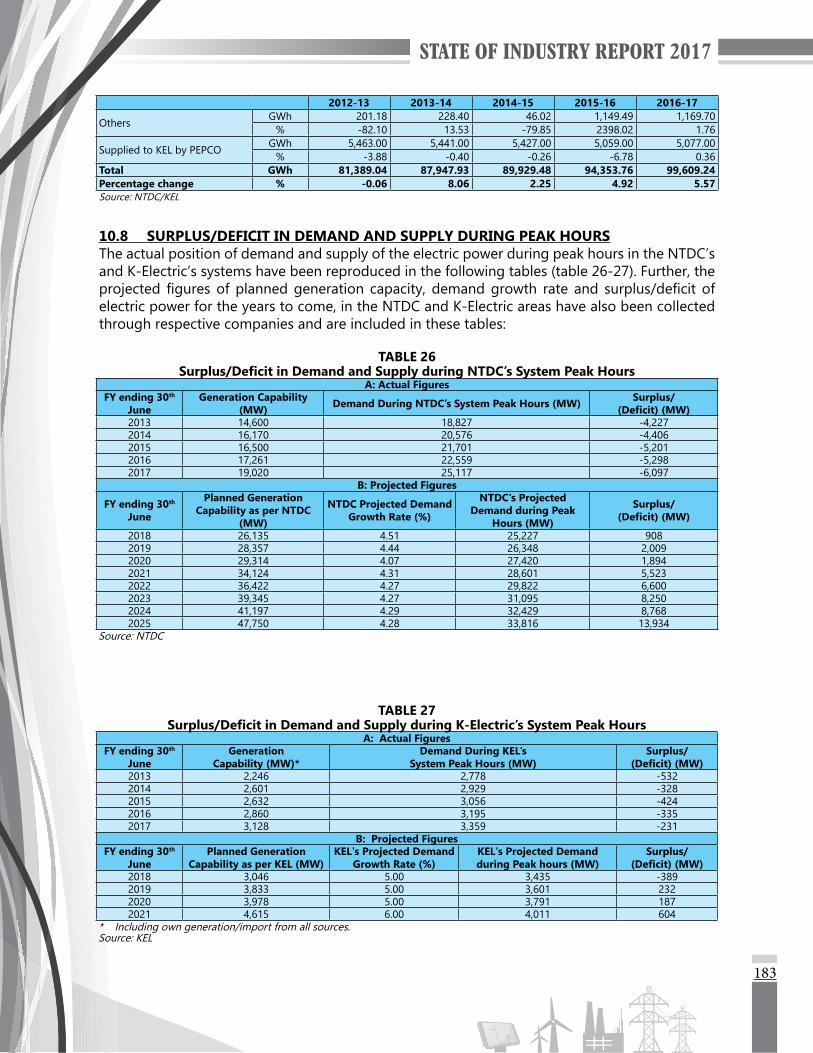
183
10.8 SURPLUS/DEFICIT IN DEMAND AND SUPPLY DURING PEAK HOURSThe actual position of demand and supply of the electric power during peak hours in the NTDC’s and K-Electric’s systems have been reproduced in the following tables (table 26-27). Further, the projected figures of planned generation capacity, demand growth rate and surplus/deficit of electric power for the years to come, in the NTDC and K-Electric areas have also been collected through respective companies and are included in these tables:
TABLE 26Surplus/Deficit in Demand and Supply during NTDC’s System Peak Hours
A: Actual FiguresFY ending 30th
JuneGeneration Capability
(MW) Demand During NTDC’s System Peak Hours (MW) Surplus/ (Deficit) (MW)
2013 14,600 18,827 -4,2272014 16,170 20,576 -4,4062015 16,500 21,701 -5,2012016 17,261 22,559 -5,2982017 19,020 25,117 -6,097
B: Projected Figures
FY ending 30th June
Planned Generation Capability as per NTDC
(MW)
NTDC Projected Demand Growth Rate (%)
NTDC's Projected Demand during Peak
Hours (MW)
Surplus/ (Deficit) (MW)
2018 26,135 4.51 25,227 9082019 28,357 4.44 26,348 2,0092020 29,314 4.07 27,420 1,8942021 34,124 4.31 28,601 5,5232022 36,422 4.27 29,822 6,6002023 39,345 4.27 31,095 8,2502024 41,197 4.29 32,429 8,7682025 47,750 4.28 33,816 13,934
Source: NTDC
TABLE 27Surplus/Deficit in Demand and Supply during K-Electric’s System Peak Hours
A: Actual FiguresFY ending 30th
JuneGeneration
Capability (MW)*Demand During KEL’s
System Peak Hours (MW)Surplus/
(Deficit) (MW)2013 2,246 2,778 -5322014 2,601 2,929 -3282015 2,632 3,056 -4242016 2,860 3,195 -3352017 3,128 3,359 -231
B: Projected FiguresFY ending 30th
JunePlanned Generation
Capability as per KEL (MW)KEL's Projected Demand
Growth Rate (%)KEL's Projected Demand during Peak hours (MW)
Surplus/ (Deficit) (MW)
2018 3,046 5.00 3,435 -3892019 3,833 5.00 3,601 2322020 3,978 5.00 3,791 1872021 4,615 6.00 4,011 604
* Including own generation/import from all sources.Source: KEL
2012-13 2013-14 2014-15 2015-16 2016-17
Others GWh 201.18 228.40 46.02 1,149.49 1,169.70% -82.10 13.53 -79.85 2398.02 1.76
Supplied to KEL by PEPCO GWh 5,463.00 5,441.00 5,427.00 5,059.00 5,077.00% -3.88 -0.40 -0.26 -6.78 0.36
Total GWh 81,389.04 87,947.93 89,929.48 94,353.76 99,609.24Percentage change % -0.06 8.06 2.25 4.92 5.57Source: NTDC/KEL


STATE OF INDUSTRY REPORT 2017
ELECTRICITY GENERATION


187
ELECTRICITY GENERATION
11.1 GENERALPakistan is facing chronic electricity shortages due to demand growth, high system losses, seasonal reductions in the availability of hydropower and circular debt etc. Rotating power outages (“load shedding”) are common and many villages are not yet electrified.
The power sector of Pakistan is a mix of thermal, hydro, nuclear and renewable energy power plants. Originally the ratio of hydel to thermal installed generation capacity, in the country was about 67% to 33% (1985) but with the passage of time, due to different reasons more of thermal generation was added thereby reducing the share of hydel generation. At present, ratio of hydel to thermal installed generation capacity is about 30% to 65%. The dilemma for Pakistan is that its power production is dominated by thermal power plants running on oil and gas.
11.2 THERMAL POWER GENERATIONMajority of Pakistan’s power generation is thermal, with furnace oil, natural gas and high-speed diesel as fuels; coal is almost non-existent yet. However, most of the upcoming power projects in the country would be based on coal and gas. The import of oil contributes as one of the major reason for current account deficit. Any strategy to cut current account deficit would require a cut down in the oil imports and for this it is essential to reduce the electricity generation through oil.
11.3 THERMAL POWER GENERATION AND FUEL CONSUMPTIONGas: During the year 2016-17, the share of electricity generated using gas in the total electricity generation of the country was 48.58% while this share during 2015-16 was 50.99%.
Oil: During the year 2016-17, the share of electricity generated using oil in the total electricity generation of the country was 49.24% while this share during 2015-16 was 48.81%.
RLNG: During the year 2016-17, the share of electricity generated using RLNG in the total electricity generation of the country was 0.83%.
Coal: During the year 2016-17, the share of electricity generated using coal in the total electricity generation of the country was 1.34% while this share during 2015-16 was 0.20%.
The historical record of thermal electricity generation using different fuels, from the years 2012-13 to 2016-17 is given in the following table:
TABLE 28Thermal Electricity Generation by Sector and by Fuel (GWh)
2012-13 2013-14 2014-15 2015-16 2016-17Thermal Generation by:
GENCOs 12,872.00 13,016.00 13,300.00 16,391.91 18,709.98 KEL Own Power Plants 8,567.00 8,709.00 9,319.00 10,323.00 10,147.00 IPPs PEPCO Area 40,062.00 43,692.00 44,369.00 45,146.42 47,972.09
KEL Area 1,116.00 1,380.00 1,525.00 1,421.00 1,531.00 Others (CPPs/SPPs)
PEPCO Area 1,280.00 1,108.00 1,015.00 251.00 271.00 KEL Area 137.00 168.00 191.00 139.00 187.00
Total Thermal Generation 64,034.00 68,073.00 69,719.00 73,672.33 78,818.07
11

188
11.4 HYDEL POWER GENERATIONPakistan has a potential of around 40,000 MW hydropower, whereas the installed hydel power capacity of Pakistan at the end of fiscal year 2016-17 was 7,116 MW. The share of existing hydel power installed capacity to the total installed generation capacity of the country is only 25.06% while this share in year 1985 was around 67%. The share of hydel power generation during fiscal year 2016-17, in the energy mix of Pakistan, was 26.60% as against 30.29% during same period last year. Most of the installed hydel power capacity of the country is owned by public sector (WAPDA) and only 214 MW of installed hydel power capacity is in private sector.
As discussed earlier, the availability of hydel power generation is subject to seasonal variation i.e. it depends upon the reservoir levels, inflow of water and discharge of water from the reservoir. Monthly variation in maximum hydropower generation capability, during past five years, as provided by NPCC is given in the following table:
TABLE 29Monthly Variation in Maximum Hydel Generating Capability (MW)
Month Year Tarbela Mangla Ghazi Barotha Warsak Chashma
HydelJinnah Hydel
Allai Khwar
Khan Khwar
Duber Khwar
Small Hydels Total
July
2012 2,923 1,039 1,450 186 144 - - - - 116 5,858 2013 3,605 1,115 1,450 190 160 39 121 - - 127 6,807 2014 3,522 1,115 1,450 180 120 n.p. n.p. n.p. n.p. 80 6,467 2015 3,352 1,085 981 144 80 13 95 35 127 65 5,977 2016 3,252 423 989 168 83 29 67 27 125 60 5,223
Aug
ust
2012 3,603 1,092 1,450 203 168 - - - - 126 6,642 2013 3,578 1,115 1,450 191 160 32 121 - - 128 6,775 2014 3,605 1,115 1,450 175 184 n.p. n.p. n.p. n.p. 78 6,607 2015 3,547 777 972 156 53 16 82 0 121 66 5,790 2016 3,386 638 998 175 132 28 52 28 118 67 5,622
Sept
embe
r 2012 3,674 1,115 1,450 203 184 - - - - 120 6,746 2013 3,613 1,115 1,450 190 184 70 121 - - 114 6,857 2014 3,605 1,115 1,450 150 184 n.p. n.p. n.p. n.p. 81 6,585 2015 3,197 943 1,019 141 143 40 40 1 64 64 5,652 2016 3,191 1,109 1,002 133 142 30 38 17 73 65 5,800
2012-13 2013-14 2014-15 2015-16 2016-17Thermal Generation using:
GasPEPCO Area* 21,817.00 23,877.00 23,892.06 29,497.41 31,519.83 KEL Area* 6,373.00 6,892.00 7,293.00 8,065.00 6,768.50 Total 28,190.00 30,769.00 31,185.06 37,562.41 38,288.33
FO and HSDPEPCO Area** 32,357.00 33,827.00 34,690.08 32,143.75 33,778.23 KEL Area** 3,447.00 3,365.00 3,742.00 3,818.00 5,034.50 Total 35,804.00 37,192.00 38,432.08 35,961.75 38,812.73
RLNG PEPCO Area 0.00 0.00 0.00 0.00 657.88 Total 0.00 0.00 0.00 0.00 657.88
CoalPEPCO Area 40.00 112.00 102.00 148.16 997.14 KEL Area 0.00 0.00 0.00 0.00 62.00 Total 40.00 112.00 102.00 148.16 1,059.14
Total Thermal Generation 64,034.00 68,073.00 69,719.14 73,672.32 78,818.07 * Including generation of SPPs. ** Including generation of CPPs.Source: NTDC/KEL
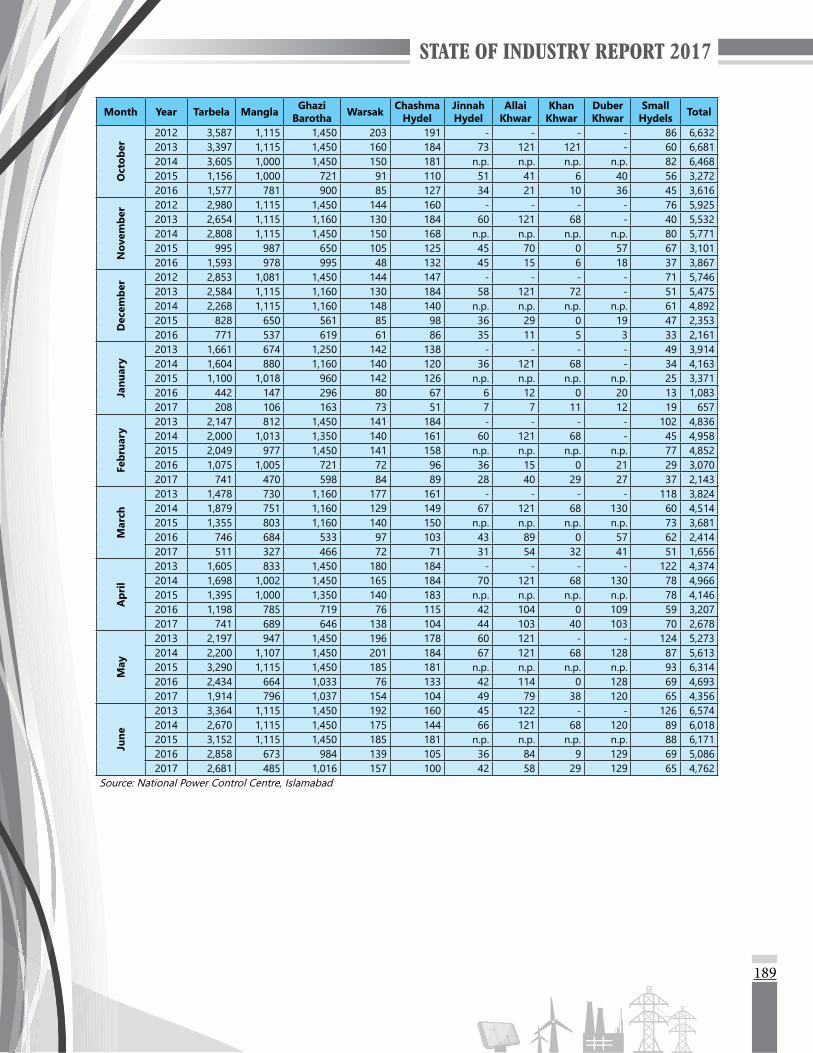
189
Month Year Tarbela Mangla Ghazi Barotha Warsak Chashma
HydelJinnah Hydel
Allai Khwar
Khan Khwar
Duber Khwar
Small Hydels Total
Oct
ober
2012 3,587 1,115 1,450 203 191 - - - - 86 6,632 2013 3,397 1,115 1,450 160 184 73 121 121 - 60 6,681 2014 3,605 1,000 1,450 150 181 n.p. n.p. n.p. n.p. 82 6,468 2015 1,156 1,000 721 91 110 51 41 6 40 56 3,272 2016 1,577 781 900 85 127 34 21 10 36 45 3,616
Nov
embe
r 2012 2,980 1,115 1,450 144 160 - - - - 76 5,925 2013 2,654 1,115 1,160 130 184 60 121 68 - 40 5,532 2014 2,808 1,115 1,450 150 168 n.p. n.p. n.p. n.p. 80 5,771 2015 995 987 650 105 125 45 70 0 57 67 3,101 2016 1,593 978 995 48 132 45 15 6 18 37 3,867
Dec
embe
r 2012 2,853 1,081 1,450 144 147 - - - - 71 5,746 2013 2,584 1,115 1,160 130 184 58 121 72 - 51 5,475 2014 2,268 1,115 1,160 148 140 n.p. n.p. n.p. n.p. 61 4,892 2015 828 650 561 85 98 36 29 0 19 47 2,353 2016 771 537 619 61 86 35 11 5 3 33 2,161
Janu
ary
2013 1,661 674 1,250 142 138 - - - - 49 3,914 2014 1,604 880 1,160 140 120 36 121 68 - 34 4,163 2015 1,100 1,018 960 142 126 n.p. n.p. n.p. n.p. 25 3,371 2016 442 147 296 80 67 6 12 0 20 13 1,083 2017 208 106 163 73 51 7 7 11 12 19 657
Febr
uary
2013 2,147 812 1,450 141 184 - - - - 102 4,836 2014 2,000 1,013 1,350 140 161 60 121 68 - 45 4,958 2015 2,049 977 1,450 141 158 n.p. n.p. n.p. n.p. 77 4,852 2016 1,075 1,005 721 72 96 36 15 0 21 29 3,070 2017 741 470 598 84 89 28 40 29 27 37 2,143
Mar
ch
2013 1,478 730 1,160 177 161 - - - - 118 3,824 2014 1,879 751 1,160 129 149 67 121 68 130 60 4,514 2015 1,355 803 1,160 140 150 n.p. n.p. n.p. n.p. 73 3,681 2016 746 684 533 97 103 43 89 0 57 62 2,414 2017 511 327 466 72 71 31 54 32 41 51 1,656
Apr
il
2013 1,605 833 1,450 180 184 - - - - 122 4,374 2014 1,698 1,002 1,450 165 184 70 121 68 130 78 4,966 2015 1,395 1,000 1,350 140 183 n.p. n.p. n.p. n.p. 78 4,146 2016 1,198 785 719 76 115 42 104 0 109 59 3,207 2017 741 689 646 138 104 44 103 40 103 70 2,678
May
2013 2,197 947 1,450 196 178 60 121 - - 124 5,273 2014 2,200 1,107 1,450 201 184 67 121 68 128 87 5,613 2015 3,290 1,115 1,450 185 181 n.p. n.p. n.p. n.p. 93 6,314 2016 2,434 664 1,033 76 133 42 114 0 128 69 4,693 2017 1,914 796 1,037 154 104 49 79 38 120 65 4,356
June
2013 3,364 1,115 1,450 192 160 45 122 - - 126 6,574 2014 2,670 1,115 1,450 175 144 66 121 68 120 89 6,018 2015 3,152 1,115 1,450 185 181 n.p. n.p. n.p. n.p. 88 6,171 2016 2,858 673 984 139 105 36 84 9 129 69 5,086 2017 2,681 485 1,016 157 100 42 58 29 129 65 4,762
Source: National Power Control Centre, Islamabad

190
11.5 NUCLEAR POWER GENERATIONPakistan Atomic Energy Commission, interalia, undertakes the projects of nuclear power plants’ development, operation and maintenance in the country. The 1st Nuclear Power Plant (NPP) of the country, namely Karachi Nuclear Power Plant (KANUPP), was commissioned in 1971 in Karachi through a turn-key agreement. The total installed capacity of this plant was 137 MW and the useful life of this plant was 30 years. However, after completion of 30 years life, the Pakistan Nuclear Regulatory Authority extended the operational life of this plant, by another 15 year at reduced capacity. The 2nd NPP of the country, namely the Chashma Nuclear Power Plant (CHASNUPP-I) was commissioned in year 2000 also through a turnkey agreement by China National Nuclear Corporation. The 3rd NPP namely Chashma Nuclear Power Plant (CHASNUPP-II) was commissioned on May 18, 2011. The installed capacity of this plant is 340 MW. During the reported period, the 4th NPP namely Chashma Nuclear Power Plant (CHASNUPP-III) having installed capacity of 340 MW has been commissioned on December 28, 2016.
11.6 RENEWABLE ENERGY GENERATION (WIND, SOLAR AND BAGASSE)Pakistan, like other developing countries of the region, is facing a serious challenge of energy deficit. Hence, Pakistan is working to expand the use of renewable energy to help bridge the gap of energy deficiency in the country. The country is blessed with natural resources that can be utilized to create electricity.
Renewable resources that are technologically viable and have prospects to be exploited commercially in Pakistan include wind energy, geothermal, solar energy, tidal energy, micro/small-hydel, bio-energy and emerging technologies like fuel cell etc. Pakistan can benefit from these resources and can supplement existing energy resources as well as can use as primary energy source when no other option in available.
The Coastal Belt of Sindh is blessed with a wind corridor that is 60 km wide (Gharo – Kati Bandar) and 180 km long (up to Hyderabad). This corridor has the exploitable potential of 50,000 MW of electricity generation through wind energy. In addition to that there are other wind sites available in Coastal Area of Balochistan and some in Northern Areas. Technically the grid can take up to 30-40% of wind energy. Most of the remote villages in the south can be electrified through micro-wind turbines.
The Government of Pakistan established the Alternative Energy Development Board (AEDB) in 2003 to create an environment in the country that is conducive to investment from the private sector in renewable energy. Besides AEDB, the Irrigation and Power Departments of Punjab and Khyber Pakhtunkhwa are actively involved in development of small hydel power plants. The Provincial/AJ&K Organizations which are involved in development of small hydropower projects are as under:
i) Pakhtunkhwa Energy Development Organization (PEDO)ii) Punjab Power Development Board (PPDB)iii) Irrigation and Power Development Board, Sindhiv) AJK Hydro Electric Board (AJKHEB) and AJK Private Power Cellv) Northern Area Public Works Department
The details of the project undertaken by PEDO are included in this report. At present, the share of renewable energy in the national grid of the country is non-existent as against a wind power potential of 63,000 MW in the country.
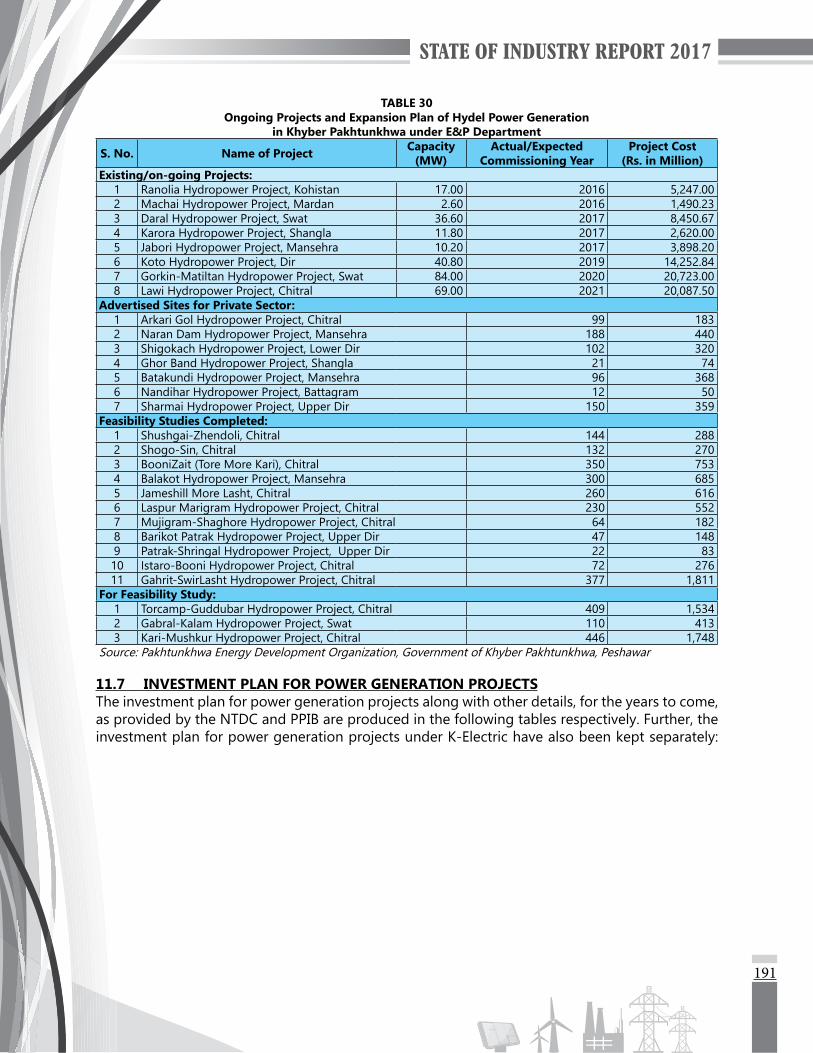
191
TABLE 30Ongoing Projects and Expansion Plan of Hydel Power Generation
in Khyber Pakhtunkhwa under E&P Department
S. No. Name of Project Capacity (MW)
Actual/Expected Commissioning Year
Project Cost (Rs. in Million)
Existing/on-going Projects:1 Ranolia Hydropower Project, Kohistan 17.00 2016 5,247.00 2 Machai Hydropower Project, Mardan 2.60 2016 1,490.23 3 Daral Hydropower Project, Swat 36.60 2017 8,450.67 4 Karora Hydropower Project, Shangla 11.80 2017 2,620.00 5 Jabori Hydropower Project, Mansehra 10.20 2017 3,898.20 6 Koto Hydropower Project, Dir 40.80 2019 14,252.84 7 Gorkin-Matiltan Hydropower Project, Swat 84.00 2020 20,723.00 8 Lawi Hydropower Project, Chitral 69.00 2021 20,087.50
Advertised Sites for Private Sector:1 Arkari Gol Hydropower Project, Chitral 99 1832 Naran Dam Hydropower Project, Mansehra 188 4403 Shigokach Hydropower Project, Lower Dir 102 3204 Ghor Band Hydropower Project, Shangla 21 745 Batakundi Hydropower Project, Mansehra 96 3686 Nandihar Hydropower Project, Battagram 12 507 Sharmai Hydropower Project, Upper Dir 150 359
Feasibility Studies Completed:1 Shushgai-Zhendoli, Chitral 144 2882 Shogo-Sin, Chitral 132 270 3 BooniZait (Tore More Kari), Chitral 350 753 4 Balakot Hydropower Project, Mansehra 300 685 5 Jameshill More Lasht, Chitral 260 616 6 Laspur Marigram Hydropower Project, Chitral 230 552 7 Mujigram-Shaghore Hydropower Project, Chitral 64 182 8 Barikot Patrak Hydropower Project, Upper Dir 47 148 9 Patrak-Shringal Hydropower Project, Upper Dir 22 83 10 Istaro-Booni Hydropower Project, Chitral 72 276 11 Gahrit-SwirLasht Hydropower Project, Chitral 377 1,811
For Feasibility Study:1 Torcamp-Guddubar Hydropower Project, Chitral 409 1,534 2 Gabral-Kalam Hydropower Project, Swat 110 413 3 Kari-Mushkur Hydropower Project, Chitral 446 1,748
Source: Pakhtunkhwa Energy Development Organization, Government of Khyber Pakhtunkhwa, Peshawar
11.7 INVESTMENT PLAN FOR POWER GENERATION PROJECTSThe investment plan for power generation projects along with other details, for the years to come, as provided by the NTDC and PPIB are produced in the following tables respectively. Further, the investment plan for power generation projects under K-Electric have also been kept separately:
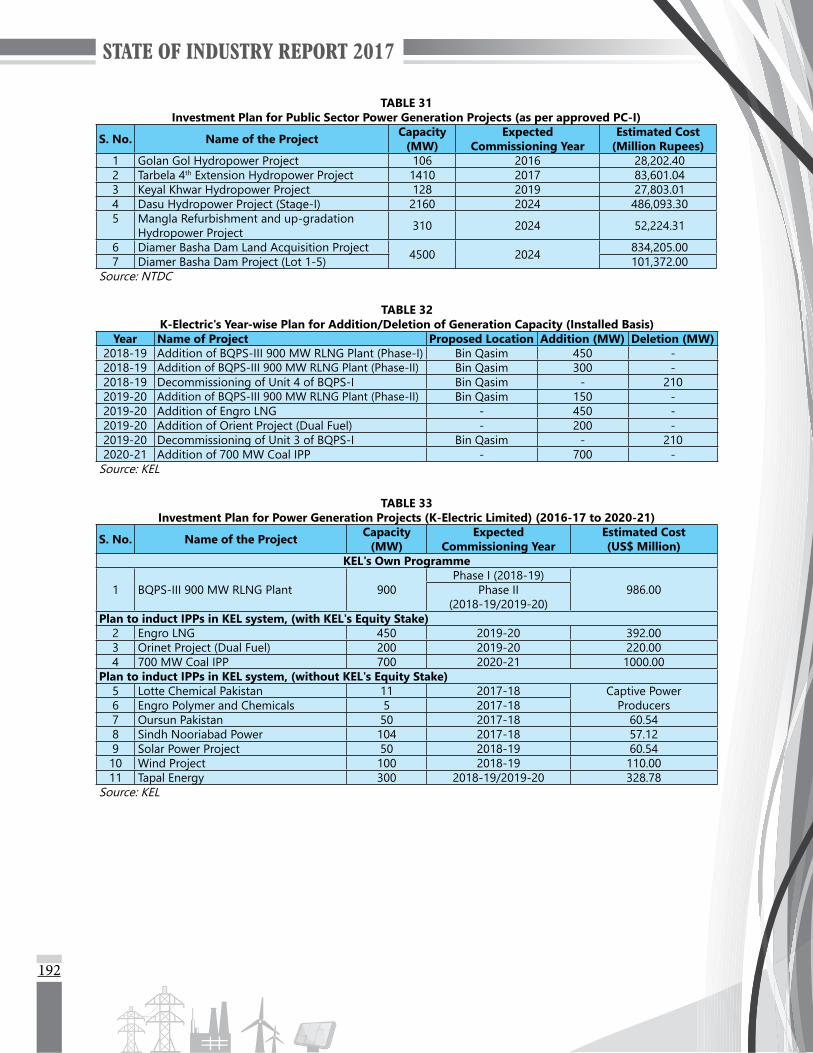
192
TABLE 31Investment Plan for Public Sector Power Generation Projects (as per approved PC-I)
S. No. Name of the Project Capacity (MW)
Expected Commissioning Year
Estimated Cost (Million Rupees)
1 Golan Gol Hydropower Project 106 2016 28,202.40 2 Tarbela 4th Extension Hydropower Project 1410 2017 83,601.04 3 Keyal Khwar Hydropower Project 128 2019 27,803.01 4 Dasu Hydropower Project (Stage-I) 2160 2024 486,093.30 5 Mangla Refurbishment and up-gradation
Hydropower Project 310 2024 52,224.31
6 Diamer Basha Dam Land Acquisition Project 4500 2024 834,205.00 7 Diamer Basha Dam Project (Lot 1-5) 101,372.00
Source: NTDC
TABLE 32K-Electric's Year-wise Plan for Addition/Deletion of Generation Capacity (Installed Basis)
Year Name of Project Proposed Location Addition (MW) Deletion (MW)2018-19 Addition of BQPS-III 900 MW RLNG Plant (Phase-I) Bin Qasim 450 -2018-19 Addition of BQPS-III 900 MW RLNG Plant (Phase-II) Bin Qasim 300 -2018-19 Decommissioning of Unit 4 of BQPS-I Bin Qasim - 2102019-20 Addition of BQPS-III 900 MW RLNG Plant (Phase-II) Bin Qasim 150 -2019-20 Addition of Engro LNG - 450 -2019-20 Addition of Orient Project (Dual Fuel) - 200 -2019-20 Decommissioning of Unit 3 of BQPS-I Bin Qasim - 2102020-21 Addition of 700 MW Coal IPP - 700 -
Source: KEL
TABLE 33Investment Plan for Power Generation Projects (K-Electric Limited) (2016-17 to 2020-21)
S. No. Name of the Project Capacity (MW)
Expected Commissioning Year
Estimated Cost (US$ Million)
KEL's Own Programme
1 BQPS-III 900 MW RLNG Plant 900Phase I (2018-19)
986.00Phase II (2018-19/2019-20)
Plan to induct IPPs in KEL system, (with KEL's Equity Stake)2 Engro LNG 450 2019-20 392.003 Orinet Project (Dual Fuel) 200 2019-20 220.004 700 MW Coal IPP 700 2020-21 1000.00
Plan to induct IPPs in KEL system, (without KEL's Equity Stake)5 Lotte Chemical Pakistan 11 2017-18 Captive Power
Producers6 Engro Polymer and Chemicals 5 2017-187 Oursun Pakistan 50 2017-18 60.548 Sindh Nooriabad Power 104 2017-18 57.129 Solar Power Project 50 2018-19 60.5410 Wind Project 100 2018-19 110.0011 Tapal Energy 300 2018-19/2019-20 328.78
Source: KEL
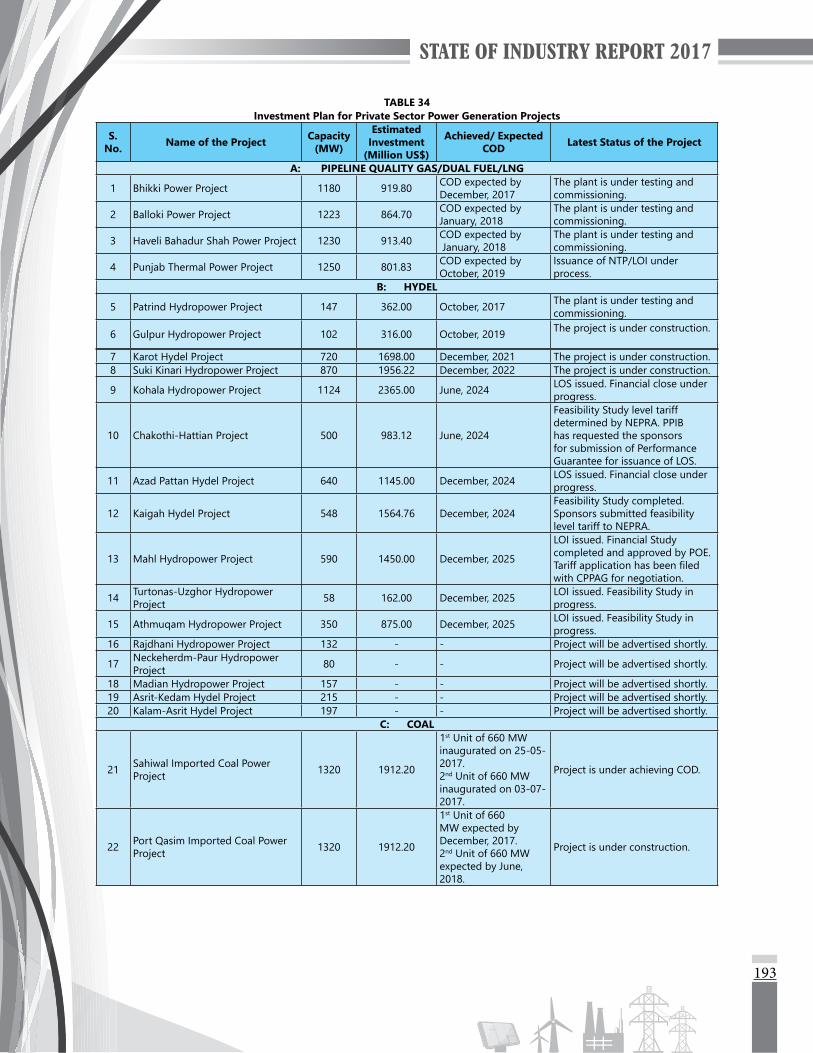
193
TABLE 34Investment Plan for Private Sector Power Generation Projects
S. No. Name of the Project Capacity
(MW)
Estimated Investment
(Million US$)
Achieved/ Expected COD Latest Status of the Project
A: PIPELINE QUALITY GAS/DUAL FUEL/LNG
1 Bhikki Power Project 1180 919.80 COD expected by December, 2017
The plant is under testing and commissioning.
2 Balloki Power Project 1223 864.70 COD expected by January, 2018
The plant is under testing and commissioning.
3 Haveli Bahadur Shah Power Project 1230 913.40 COD expected by January, 2018
The plant is under testing and commissioning.
4 Punjab Thermal Power Project 1250 801.83 COD expected by October, 2019
Issuance of NTP/LOI under process.
B: HYDEL
5 Patrind Hydropower Project 147 362.00 October, 2017 The plant is under testing and commissioning.
6 Gulpur Hydropower Project 102 316.00 October, 2019 The project is under construction.
7 Karot Hydel Project 720 1698.00 December, 2021 The project is under construction.8 Suki Kinari Hydropower Project 870 1956.22 December, 2022 The project is under construction.
9 Kohala Hydropower Project 1124 2365.00 June, 2024 LOS issued. Financial close under progress.
10 Chakothi-Hattian Project 500 983.12 June, 2024
Feasibility Study level tariff determined by NEPRA. PPIB has requested the sponsors for submission of Performance Guarantee for issuance of LOS.
11 Azad Pattan Hydel Project 640 1145.00 December, 2024 LOS issued. Financial close under progress.
12 Kaigah Hydel Project 548 1564.76 December, 2024Feasibility Study completed. Sponsors submitted feasibility level tariff to NEPRA.
13 Mahl Hydropower Project 590 1450.00 December, 2025
LOI issued. Financial Study completed and approved by POE. Tariff application has been filed with CPPAG for negotiation.
14 Turtonas-Uzghor Hydropower Project 58 162.00 December, 2025 LOI issued. Feasibility Study in
progress.
15 Athmuqam Hydropower Project 350 875.00 December, 2025 LOI issued. Feasibility Study in progress.
16 Rajdhani Hydropower Project 132 - - Project will be advertised shortly.
17 Neckeherdm-Paur Hydropower Project 80 - - Project will be advertised shortly.
18 Madian Hydropower Project 157 - - Project will be advertised shortly.19 Asrit-Kedam Hydel Project 215 - - Project will be advertised shortly.20 Kalam-Asrit Hydel Project 197 - - Project will be advertised shortly.
C: COAL
21 Sahiwal Imported Coal Power Project 1320 1912.20
1st Unit of 660 MW inaugurated on 25-05-2017. 2nd Unit of 660 MW inaugurated on 03-07-2017.
Project is under achieving COD.
22 Port Qasim Imported Coal Power Project 1320 1912.20
1st Unit of 660 MW expected by December, 2017. 2nd Unit of 660 MW expected by June, 2018.
Project is under construction.
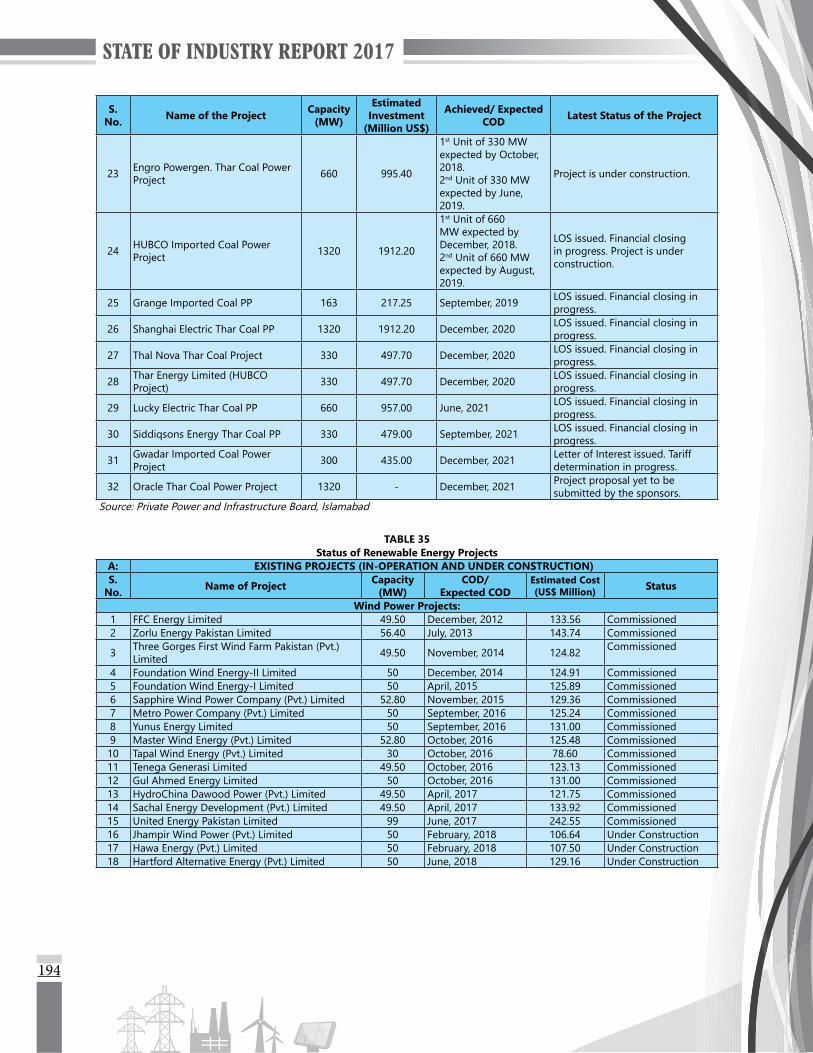
194
S. No. Name of the Project Capacity
(MW)
Estimated Investment
(Million US$)
Achieved/ Expected COD Latest Status of the Project
23 Engro Powergen. Thar Coal Power Project 660 995.40
1st Unit of 330 MW expected by October, 2018. 2nd Unit of 330 MW expected by June, 2019.
Project is under construction.
24 HUBCO Imported Coal Power Project 1320 1912.20
1st Unit of 660 MW expected by December, 2018. 2nd Unit of 660 MW expected by August, 2019.
LOS issued. Financial closing in progress. Project is under construction.
25 Grange Imported Coal PP 163 217.25 September, 2019 LOS issued. Financial closing in progress.
26 Shanghai Electric Thar Coal PP 1320 1912.20 December, 2020 LOS issued. Financial closing in progress.
27 Thal Nova Thar Coal Project 330 497.70 December, 2020 LOS issued. Financial closing in progress.
28 Thar Energy Limited (HUBCO Project) 330 497.70 December, 2020 LOS issued. Financial closing in
progress.
29 Lucky Electric Thar Coal PP 660 957.00 June, 2021 LOS issued. Financial closing in progress.
30 Siddiqsons Energy Thar Coal PP 330 479.00 September, 2021 LOS issued. Financial closing in progress.
31 Gwadar Imported Coal Power Project 300 435.00 December, 2021 Letter of Interest issued. Tariff
determination in progress.
32 Oracle Thar Coal Power Project 1320 - December, 2021 Project proposal yet to be submitted by the sponsors.
Source: Private Power and Infrastructure Board, Islamabad
TABLE 35Status of Renewable Energy Projects
A: EXISTING PROJECTS (IN-OPERATION AND UNDER CONSTRUCTION)S.
No. Name of Project Capacity (MW)
COD/ Expected COD
Estimated Cost (US$ Million) Status
Wind Power Projects:1 FFC Energy Limited 49.50 December, 2012 133.56 Commissioned2 Zorlu Energy Pakistan Limited 56.40 July, 2013 143.74 Commissioned
3 Three Gorges First Wind Farm Pakistan (Pvt.) Limited 49.50 November, 2014 124.82 Commissioned
4 Foundation Wind Energy-II Limited 50 December, 2014 124.91 Commissioned5 Foundation Wind Energy-I Limited 50 April, 2015 125.89 Commissioned6 Sapphire Wind Power Company (Pvt.) Limited 52.80 November, 2015 129.36 Commissioned7 Metro Power Company (Pvt.) Limited 50 September, 2016 125.24 Commissioned8 Yunus Energy Limited 50 September, 2016 131.00 Commissioned9 Master Wind Energy (Pvt.) Limited 52.80 October, 2016 125.48 Commissioned10 Tapal Wind Energy (Pvt.) Limited 30 October, 2016 78.60 Commissioned11 Tenega Generasi Limited 49.50 October, 2016 123.13 Commissioned12 Gul Ahmed Energy Limited 50 October, 2016 131.00 Commissioned13 HydroChina Dawood Power (Pvt.) Limited 49.50 April, 2017 121.75 Commissioned14 Sachal Energy Development (Pvt.) Limited 49.50 April, 2017 133.92 Commissioned15 United Energy Pakistan Limited 99 June, 2017 242.55 Commissioned16 Jhampir Wind Power (Pvt.) Limited 50 February, 2018 106.64 Under Construction17 Hawa Energy (Pvt.) Limited 50 February, 2018 107.50 Under Construction18 Hartford Alternative Energy (Pvt.) Limited 50 June, 2018 129.16 Under Construction

195
S. No. Name of Project Capacity
(MW)COD/
Expected CODEstimated Cost (US$ Million) Status
19 Three Gorges Second Wind Farm Pakistan (Pvt.) Limited 49.50 September, 2018 106.42 Under Construction
20 Three Gorges Third Wind Farm Pakistan (Pvt.) Limited 49.50 September, 2018 106.42 Under Construction
21 Zephyr Power (Pvt.) Limited 50 November, 2018 106.50 Under Construction
22 Tricon Boston Consulting Corporation (Pvt.) Limited (A) 50 November, 2018 106.64 Under Construction
23 Tricon Boston Consulting Corporation (Pvt.) Limited (B) 50 November, 2018 106.64 Under Construction
24 Tricon Boston Consulting Corporation (Pvt.) Limited (C) 50 November, 2018 106.64 Under Construction
Solar Power Projects:25 Quaid-e-Azam Solar Power (Pvt.) Limited 100 July, 2015 151.40 Operational26 Appolo Solar Development Pakistan Limited 100 August, 2016 151.40 Operational27 Best Green Energy Pakistan (Pvt.) Limited 100 August, 2016 151.40 Operational28 Crest Energy Pakistan Limited 100 August, 2016 151.40 Operational29 Harappa Solar (Pvt.) Limited 18 October, 2017 19.21 Under Construction30 AJ Power (Pvt.) Limited 12 November, 2017 12.80 Under Construction
Bagasse/Biomass Co-Generation Projects:31 JDW Sugar Mills Limited (Unit-II) 26.35 June, 2014 Based on
Upfront Tariff announced by NEPRA i.e. US$ 0.9966 Million per MW
Operational32 JDW Sugar Mills Limited (Unit-III) 26.35 October, 2014 Operational33 Chiniot Power Limited 62.40 November, 2014 Operational34 RYK Mills Limited 30 March, 2015 Operational
35 Hamza Sugar Mills Limited 15 March, 2017 Operational
B: FUTURE PROJECTSS.
No. Name of Project Capacity (MW) Status
Wind Power Projects:1 Burj Wind Energy (Pvt.) Limited 14 Feasibility Study in process.2 Western Energy (Pvt.) Limited 50 Will participate in Competitive Bidding.3 Trans Atlantic Energy (Pvt.) Limited 50 Will participate in Competitive Bidding.4 Shaheen Foundation, PAF 50 Feasibility Study approval is in process.
S. No. Name of Project Capacity
(MW)COD/
Expected COD
Estimated Cost
(US$ Million)Status
Solar Power Projects:5 Access Solar (Pvt.) Limited 11.52 March, 2018 12.29
Act
ive
unde
r AED
B Le
tter
of I
nter
ests
and
are
di
ffere
nt s
tage
s of
dev
elop
men
t.
6 Buksh Solar (Pvt.) Limited 10 March, 2018 10.677 Integrated Power Station 50 March, 2018 53.358 Jafri and Associates 50 March, 2018 53.359 Solar Blue (Pvt.) Limited 50 March, 2018 53.3510 Safe Solar Power (Pvt.) Limited 10.28 March, 2018 10.9711 Access Electric (Pvt.) Limited 11.52 March, 2018 12.2912 RE Solar (Pvt.) Limited (1) 20 June, 2018 21.3413 RE Solar (Pvt.) Limited (2) 20 June, 2018 21.3414 Jan Solar (Pvt.) Limited 10 June, 2018 10.6715 Lalpir Solar Power (Pvt.) Limited 10 June, 2018 10.6716 Blue Star Hydel (Pvt.) Limited 1 June, 2018 1.0717 Blue Star Electric (Pvt.) Limited 1 June, 2018 1.0718 Siddiqsons Energy Limited 50 June, 2018 53.3519 ET Solar (Pvt.) Limited (1) 50 December, 2018 53.3520 ET Solar (Pvt.) Limited (2) 25 December, 2018 26.6621 First Solar (Pvt.) Limited 2 December, 2018 2.1322 ACT Solar (Pvt.) Limited 50 May, 2019 53.3523 Asia Petroleum 30 June, 2019 32.01
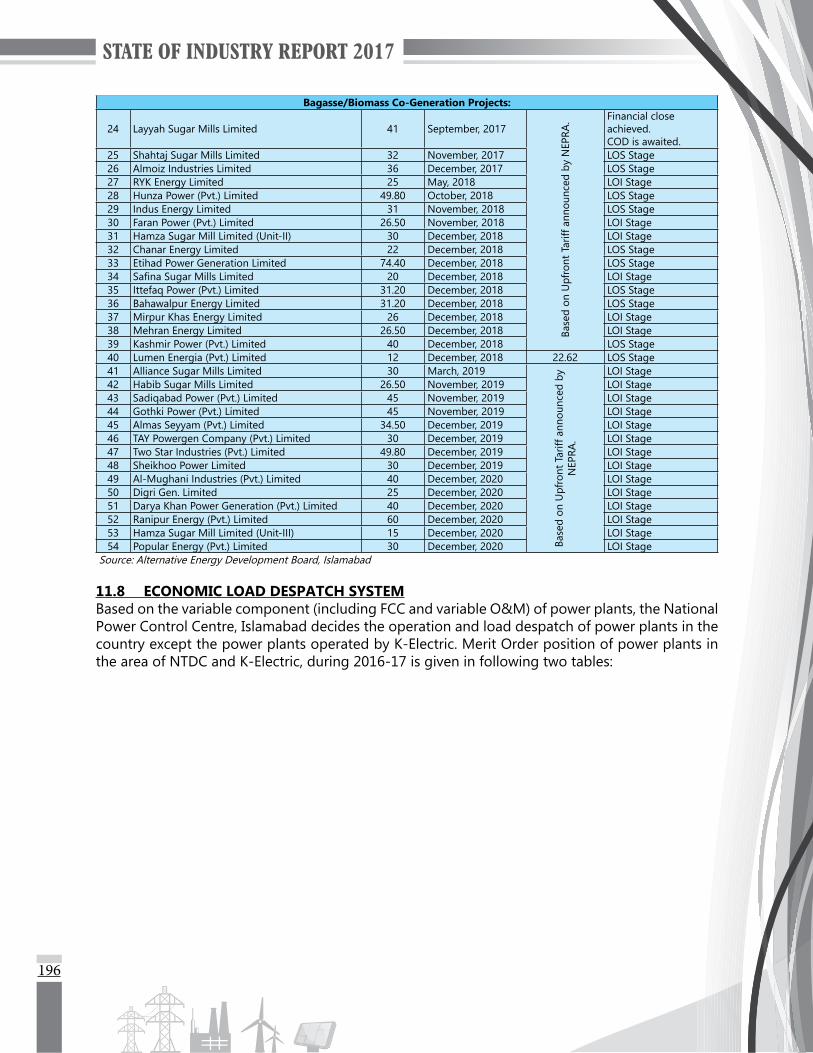
196
Bagasse/Biomass Co-Generation Projects:
24 Layyah Sugar Mills Limited 41 September, 2017
Base
d on
Upf
ront
Tar
iff a
nnou
nced
by
NEP
RA. Financial close
achieved. COD is awaited.
25 Shahtaj Sugar Mills Limited 32 November, 2017 LOS Stage26 Almoiz Industries Limited 36 December, 2017 LOS Stage27 RYK Energy Limited 25 May, 2018 LOI Stage28 Hunza Power (Pvt.) Limited 49.80 October, 2018 LOS Stage29 Indus Energy Limited 31 November, 2018 LOS Stage30 Faran Power (Pvt.) Limited 26.50 November, 2018 LOI Stage31 Hamza Sugar Mill Limited (Unit-II) 30 December, 2018 LOI Stage32 Chanar Energy Limited 22 December, 2018 LOS Stage33 Etihad Power Generation Limited 74.40 December, 2018 LOS Stage34 Safina Sugar Mills Limited 20 December, 2018 LOI Stage35 Ittefaq Power (Pvt.) Limited 31.20 December, 2018 LOS Stage36 Bahawalpur Energy Limited 31.20 December, 2018 LOS Stage37 Mirpur Khas Energy Limited 26 December, 2018 LOI Stage38 Mehran Energy Limited 26.50 December, 2018 LOI Stage39 Kashmir Power (Pvt.) Limited 40 December, 2018 LOS Stage40 Lumen Energia (Pvt.) Limited 12 December, 2018 22.62 LOS Stage41 Alliance Sugar Mills Limited 30 March, 2019
Base
d on
Upf
ront
Tar
iff a
nnou
nced
by
NEP
RA.
LOI Stage42 Habib Sugar Mills Limited 26.50 November, 2019 LOI Stage43 Sadiqabad Power (Pvt.) Limited 45 November, 2019 LOI Stage44 Gothki Power (Pvt.) Limited 45 November, 2019 LOI Stage45 Almas Seyyam (Pvt.) Limited 34.50 December, 2019 LOI Stage46 TAY Powergen Company (Pvt.) Limited 30 December, 2019 LOI Stage47 Two Star Industries (Pvt.) Limited 49.80 December, 2019 LOI Stage48 Sheikhoo Power Limited 30 December, 2019 LOI Stage49 Al-Mughani Industries (Pvt.) Limited 40 December, 2020 LOI Stage50 Digri Gen. Limited 25 December, 2020 LOI Stage51 Darya Khan Power Generation (Pvt.) Limited 40 December, 2020 LOI Stage52 Ranipur Energy (Pvt.) Limited 60 December, 2020 LOI Stage53 Hamza Sugar Mill Limited (Unit-III) 15 December, 2020 LOI Stage54 Popular Energy (Pvt.) Limited 30 December, 2020 LOI Stage
Source: Alternative Energy Development Board, Islamabad
11.8 ECONOMIC LOAD DESPATCH SYSTEMBased on the variable component (including FCC and variable O&M) of power plants, the National Power Control Centre, Islamabad decides the operation and load despatch of power plants in the country except the power plants operated by K-Electric. Merit Order position of power plants in the area of NTDC and K-Electric, during 2016-17 is given in following two tables:

197
TABLE 36Merit Order for Power Generation Plants (PEPCO System)
(Based on the revised fuel prices effective from 16-06-2017) (Rs./kWh)Order in
Merit Plant Groups Fuel TypeAs on 16th June, 2017 Status in Last Year
Merit Order (01-06-2016)Fuel Cost O&M Cost Specific Cost
1 Uch (upto 152.375 GWh) Gas 0.519 0.240 0.798 12 Liberty (upto 61.904 GWh) Gas 0.868 0.333 1.201 23 Uch (+ 152.375 GWh) Gas 2.298 0.240 2.576 34 Guddu 747 Gas 3.469 0.300 3.768 145 HCPC Gas 3.259 0.511 3.770 226 Fatima Energy Gas 3.981 0.000 3.981 --7 Foundation Power Gas 3.868 0.382 4.250 168 Guddu B-I (Unit 11-13) Gas 4.267 0.069 4.335 199 Lakhra Coal 4.266 0.195 4.461 410 Engro Power Gen. Gas 4.156 0.337 4.493 2111 Liberty (+ 61.904 GWh) Gas 4.341 0.333 4.674 1312 Sahiwal Coal Coal 4.715 0.000 4.715 --13 Altern (Phase-II) Gas 4.061 0.690 4.751 2514 Guddu B-II (Unit 5-10) Gas 4.740 0.069 4.809 2815 Uch-II Gas 4.786 0.221 5.007 1016 GTPS Faisalabad B-IV (Unit 5-9) Gas 5.055 0.120 5.175 1817 GTPS Kotri B-III (Unit 3-7) Gas 5.119 0.093 5.211 3618 Guddu B-III (Unit 3-4) Gas 5.688 0.069 5.757 4919 Jamshoro B-II (Unit 4) Gas 5.806 0.093 5.899 5420 Altern (Phase-I) Gas 5.218 0.690 5.908 4821 Jamshoro B-II (Unit 3) Gas 5.934 0.093 6.026 5822 Guddu B-IV (Unit 1-2) Gas 6.095 0.069 6.163 6423 Jamshoro B-II (Unit 2) Gas 6.096 0.093 6.188 6524 Muzaffargarh B-II (Unit 4) Gas 6.695 0.120 6.815 4225 Muzaffargarh B-I (Unit 1-3) Gas 6.852 0.120 6.972 4426 NGPS Multan B-VII (Unit 1-4) Gas 7.057 0.120 7.177 6827 Muzaffargarh B-III (Unit 5-6) Gas 7.129 0.120 7.249 6128 Nandipur RLNG 6.925 0.455 7.380 529 Orient Power RLNG 7.343 0.218 7.560 630 FKPCL RLNG 6.81688 0.75613 7.57301 2731 Sapphire Electric RLNG 7.343 0.366 7.709 732 Saif Power RLNG 7.343 0.370 7.713 833 Halmore Power RLNG 7.343 0.372 7.715 934 QATP Bhikki RLNG 8.057 0.000 8.057 --35 Haweli Bahadur Shah RLNG 7.763 0.323 8.086 --36 KAPCO B-I RLNG 7.901 0.267 8.168 1137 Attock Gen. RFO 7.279 0.949 8.228 2338 Rousch RLNG 8.332 0.282 8.333 1239 KAPCO B-I RFO 8.080 0.463 8.543 2440 SPS Faisalabad B-V (Unit 1-2) Gas 8.452 0.120 8.572 7141 Jamshoro B-II (Unit 4) Mix (**) 8.522 0.093 8.615 5342 Guddu B-III (Unit 3-4) Mix (**) 8.585 0.069 8.654 5543 Jamshoro B-II (Unit 3) Mix (**) 8.707 0.093 8.799 5744 Muzaffargarh B-II (Unit 4) Mix (**) 8.847 0.120 8.967 4645 KAPCO B-II RLNG 8.666 0.312 8.978 1546 Jamshoro B-II (Unit 2) Mix (**) 8.947 0.093 9.039 63

198
Order in Merit Plant Groups Fuel Type
As on 16th June, 2017 Status in Last Year Merit Order
(01-06-2016)Fuel Cost O&M Cost Specific Cost
47 Muzaffargarh B-I (Unit 1-3) Mix (**) 8.975 0.120 9.095 4748 GTPS Faisalabad B-VI (Unit 1-4) Gas 9.039 0.120 9.159 7849 Engro Power Gen. Mix (***) 8.849 0.339 9.188 5950 Nandipur RFO 8.748 0.480 9.228 2951 Nishat Chunian RFO 8.309 0.932 9.241 3352 Nishat Power RFO 8.309 0.934 9.243 3453 Liberty Power Tech. RFO 8.225 1.042 9.267 3754 Atlas Power RFO 8.335 0.934 9.269 3255 KEL RFO 8.737 0.602 9.339 3556 HUBCO RFO 9.267 0.185 9.452 3057 Japan Power RFO 8.915 0.574 9.490 3858 KAPCO B-II RFO 8.868 0.651 9.519 3159 KAPCO B-III RLNG 8.963 0.602 9.565 1760 Lal Pir Power RFO 9.541 0.172 9.713 3961 HUBCO Narowal RFO 8.836 0.889 9.725 2662 Pak Gen. Power RFO 9.563 0.172 9.736 4063 SEPCOL RFO 8.835 0.902 9.737 4364 Saba Power RFO 9.622 0.172 9.794 4165 Davis Energen RLNG 9.333 0.517 9.850 2066 Muzaffargarh B-III (Unit 5-6) Mix (**) 9.818 0.120 9.938 6667 Reshma PowerGen RFO 9.17280 0.87070 10.04350 --68 Gulf PowerGen RFO 9.173 0.871 10.044 --69 Jamshoro B-I (Unit 1) RFO 10.506 0.093 10.598 4570 GTPS Kotri B-IV (Unit 1-2) Gas 10.401 0.090 10.491 8571 NGPS Multan B-VII (Unit 1-4) Mix (**) 10.638 0.120 10.758 7572 Muzaffargarh B-II (Unit 4) RFO 10.999 0.120 11.119 5073 Muzaffargarh B-I (Unit 1-3) RFO 11.098 0.120 11.218 5274 Jamshoro B-II (Unit 4) RFO 11.239 0.093 11.331 5175 Guddu B-III (Unit 3-4) RFO 11.482 0.069 11.551 6076 Jamshoro B-II (Unit 3) RFO 11.480 0.093 11.573 5677 SPS Faisalabad B-V (Unit 1-2) Mix (**) 11.463 0.120 11.583 7678 Jamshoro B-II (Unit 2) RFO 11.798 0.093 11.891 6279 Muzaffargarh B-III (Unit 5-6) RFO 12.507 0.120 12.627 6780 KAPCO B-I HSD 12.700 0.268 12.968 6981 Orient Power HSD 12.651 0.357 13.008 7082 Halmore Power HSD 12.538 0.532 13.070 7383 Sapphire Electric HSD 12.561 0.529 13.090 7284 Saif Power HSD 12.733 0.534 13.268 7485 Engro Power Gen. HSD 13.542 0.341 13.883 7786 KAPCO B-II HSD 13.939 0.361 14.299 7987 NGPS Multan B-VII (Unit 1-4) RFO 14.220 0.120 14.340 8088 SPS Faisalabad B-V (Unit 1-2) RFO 14.475 0.120 14.595 8189 GTPS Faisalabad B-IV (Unit 5-9) HSD 14.895 0.120 15.015 8290 KAPCO B-III HSD 14.415 0.911 15.326 8391 GTPS Kotri B-III (Unit 3-7) HSD 17.462 0.090 17.552 8492 NGPS Multan B-VII (Unit 1-4) HSD 26.632 0.120 26.752 8693 GTPS Kotri B-IV (Unit 1-2) HSD 35.482 0.090 35.572 87
(**) Mixed [50% FO and 50% Gas] (***) Mixed [50% HSD and 50% Gas]Source: National Power Control Centre, Islamabad
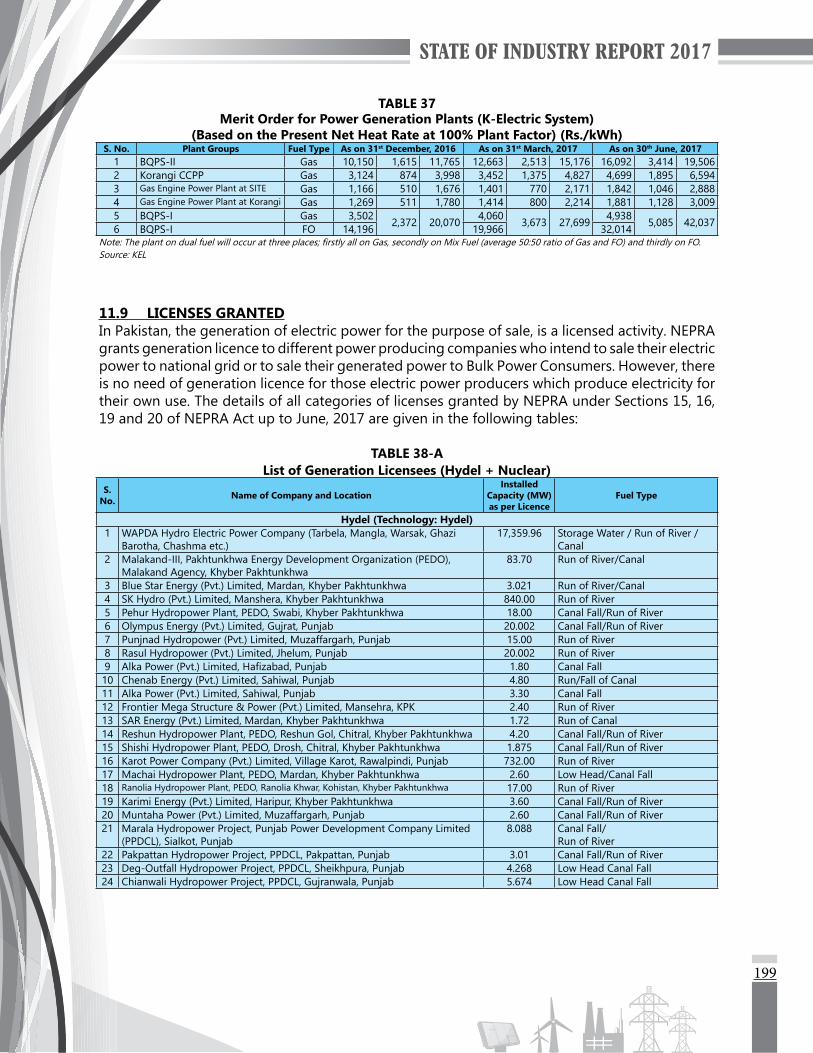
199
TABLE 37Merit Order for Power Generation Plants (K-Electric System)
(Based on the Present Net Heat Rate at 100% Plant Factor) (Rs./kWh)S. No. Plant Groups Fuel Type As on 31st December, 2016 As on 31st March, 2017 As on 30th June, 2017
1 BQPS-II Gas 10,150 1,615 11,765 12,663 2,513 15,176 16,092 3,414 19,506 2 Korangi CCPP Gas 3,124 874 3,998 3,452 1,375 4,827 4,699 1,895 6,594 3 Gas Engine Power Plant at SITE Gas 1,166 510 1,676 1,401 770 2,171 1,842 1,046 2,888 4 Gas Engine Power Plant at Korangi Gas 1,269 511 1,780 1,414 800 2,214 1,881 1,128 3,009 5 BQPS-I Gas 3,502 2,372 20,070 4,060 3,673 27,699 4,938 5,085 42,037 6 BQPS-I FO 14,196 19,966 32,014
Note: The plant on dual fuel will occur at three places; firstly all on Gas, secondly on Mix Fuel (average 50:50 ratio of Gas and FO) and thirdly on FO.Source: KEL
11.9 LICENSES GRANTEDIn Pakistan, the generation of electric power for the purpose of sale, is a licensed activity. NEPRA grants generation licence to different power producing companies who intend to sale their electric power to national grid or to sale their generated power to Bulk Power Consumers. However, there is no need of generation licence for those electric power producers which produce electricity for their own use. The details of all categories of licenses granted by NEPRA under Sections 15, 16, 19 and 20 of NEPRA Act up to June, 2017 are given in the following tables:
TABLE 38-AList of Generation Licensees (Hydel + Nuclear)
S. No. Name of Company and Location
Installed Capacity (MW) as per Licence
Fuel Type
Hydel (Technology: Hydel)1 WAPDA Hydro Electric Power Company (Tarbela, Mangla, Warsak, Ghazi
Barotha, Chashma etc.)17,359.96 Storage Water / Run of River /
Canal2 Malakand-III, Pakhtunkhwa Energy Development Organization (PEDO),
Malakand Agency, Khyber Pakhtunkhwa83.70 Run of River/Canal
3 Blue Star Energy (Pvt.) Limited, Mardan, Khyber Pakhtunkhwa 3.021 Run of River/Canal4 SK Hydro (Pvt.) Limited, Manshera, Khyber Pakhtunkhwa 840.00 Run of River5 Pehur Hydropower Plant, PEDO, Swabi, Khyber Pakhtunkhwa 18.00 Canal Fall/Run of River6 Olympus Energy (Pvt.) Limited, Gujrat, Punjab 20.002 Canal Fall/Run of River7 Punjnad Hydropower (Pvt.) Limited, Muzaffargarh, Punjab 15.00 Run of River8 Rasul Hydropower (Pvt.) Limited, Jhelum, Punjab 20.002 Run of River9 Alka Power (Pvt.) Limited, Hafizabad, Punjab 1.80 Canal Fall10 Chenab Energy (Pvt.) Limited, Sahiwal, Punjab 4.80 Run/Fall of Canal11 Alka Power (Pvt.) Limited, Sahiwal, Punjab 3.30 Canal Fall12 Frontier Mega Structure & Power (Pvt.) Limited, Mansehra, KPK 2.40 Run of River13 SAR Energy (Pvt.) Limited, Mardan, Khyber Pakhtunkhwa 1.72 Run of Canal14 Reshun Hydropower Plant, PEDO, Reshun Gol, Chitral, Khyber Pakhtunkhwa 4.20 Canal Fall/Run of River15 Shishi Hydropower Plant, PEDO, Drosh, Chitral, Khyber Pakhtunkhwa 1.875 Canal Fall/Run of River16 Karot Power Company (Pvt.) Limited, Village Karot, Rawalpindi, Punjab 732.00 Run of River17 Machai Hydropower Plant, PEDO, Mardan, Khyber Pakhtunkhwa 2.60 Low Head/Canal Fall18 Ranolia Hydropower Plant, PEDO, Ranolia Khwar, Kohistan, Khyber Pakhtunkhwa 17.00 Run of River19 Karimi Energy (Pvt.) Limited, Haripur, Khyber Pakhtunkhwa 3.60 Canal Fall/Run of River20 Muntaha Power (Pvt.) Limited, Muzaffargarh, Punjab 2.60 Canal Fall/Run of River21 Marala Hydropower Project, Punjab Power Development Company Limited
(PPDCL), Sialkot, Punjab8.088 Canal Fall/
Run of River22 Pakpattan Hydropower Project, PPDCL, Pakpattan, Punjab 3.01 Canal Fall/Run of River23 Deg-Outfall Hydropower Project, PPDCL, Sheikhpura, Punjab 4.268 Low Head Canal Fall24 Chianwali Hydropower Project, PPDCL, Gujranwala, Punjab 5.674 Low Head Canal Fall
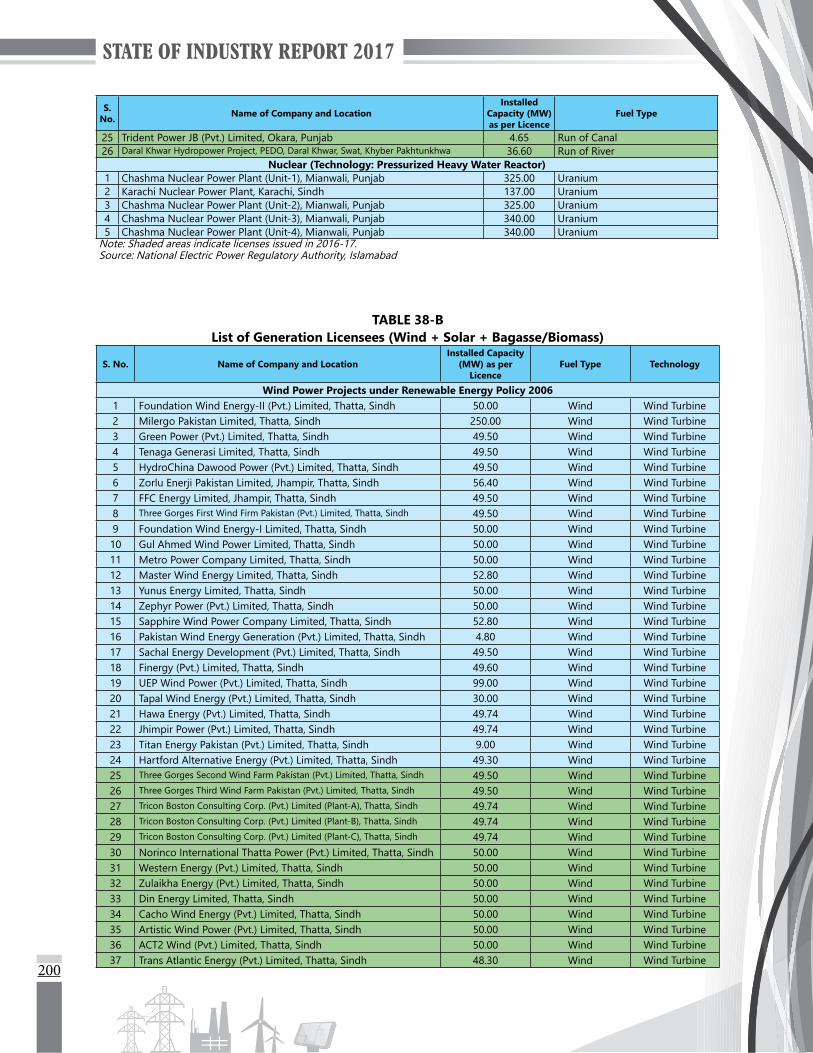
200
S. No. Name of Company and Location
Installed Capacity (MW) as per Licence
Fuel Type
25 Trident Power JB (Pvt.) Limited, Okara, Punjab 4.65 Run of Canal26 Daral Khwar Hydropower Project, PEDO, Daral Khwar, Swat, Khyber Pakhtunkhwa 36.60 Run of River
Nuclear (Technology: Pressurized Heavy Water Reactor)1 Chashma Nuclear Power Plant (Unit-1), Mianwali, Punjab 325.00 Uranium2 Karachi Nuclear Power Plant, Karachi, Sindh 137.00 Uranium3 Chashma Nuclear Power Plant (Unit-2), Mianwali, Punjab 325.00 Uranium4 Chashma Nuclear Power Plant (Unit-3), Mianwali, Punjab 340.00 Uranium5 Chashma Nuclear Power Plant (Unit-4), Mianwali, Punjab 340.00 Uranium
Note: Shaded areas indicate licenses issued in 2016-17.Source: National Electric Power Regulatory Authority, Islamabad
TABLE 38-BList of Generation Licensees (Wind + Solar + Bagasse/Biomass)
S. No. Name of Company and LocationInstalled Capacity
(MW) as per Licence
Fuel Type Technology
Wind Power Projects under Renewable Energy Policy 20061 Foundation Wind Energy-II (Pvt.) Limited, Thatta, Sindh 50.00 Wind Wind Turbine2 Milergo Pakistan Limited, Thatta, Sindh 250.00 Wind Wind Turbine3 Green Power (Pvt.) Limited, Thatta, Sindh 49.50 Wind Wind Turbine4 Tenaga Generasi Limited, Thatta, Sindh 49.50 Wind Wind Turbine5 HydroChina Dawood Power (Pvt.) Limited, Thatta, Sindh 49.50 Wind Wind Turbine6 Zorlu Enerji Pakistan Limited, Jhampir, Thatta, Sindh 56.40 Wind Wind Turbine7 FFC Energy Limited, Jhampir, Thatta, Sindh 49.50 Wind Wind Turbine8 Three Gorges First Wind Firm Pakistan (Pvt.) Limited, Thatta, Sindh 49.50 Wind Wind Turbine9 Foundation Wind Energy-I Limited, Thatta, Sindh 50.00 Wind Wind Turbine10 Gul Ahmed Wind Power Limited, Thatta, Sindh 50.00 Wind Wind Turbine11 Metro Power Company Limited, Thatta, Sindh 50.00 Wind Wind Turbine12 Master Wind Energy Limited, Thatta, Sindh 52.80 Wind Wind Turbine13 Yunus Energy Limited, Thatta, Sindh 50.00 Wind Wind Turbine14 Zephyr Power (Pvt.) Limited, Thatta, Sindh 50.00 Wind Wind Turbine15 Sapphire Wind Power Company Limited, Thatta, Sindh 52.80 Wind Wind Turbine16 Pakistan Wind Energy Generation (Pvt.) Limited, Thatta, Sindh 4.80 Wind Wind Turbine17 Sachal Energy Development (Pvt.) Limited, Thatta, Sindh 49.50 Wind Wind Turbine18 Finergy (Pvt.) Limited, Thatta, Sindh 49.60 Wind Wind Turbine19 UEP Wind Power (Pvt.) Limited, Thatta, Sindh 99.00 Wind Wind Turbine20 Tapal Wind Energy (Pvt.) Limited, Thatta, Sindh 30.00 Wind Wind Turbine21 Hawa Energy (Pvt.) Limited, Thatta, Sindh 49.74 Wind Wind Turbine22 Jhimpir Power (Pvt.) Limited, Thatta, Sindh 49.74 Wind Wind Turbine23 Titan Energy Pakistan (Pvt.) Limited, Thatta, Sindh 9.00 Wind Wind Turbine24 Hartford Alternative Energy (Pvt.) Limited, Thatta, Sindh 49.30 Wind Wind Turbine25 Three Gorges Second Wind Farm Pakistan (Pvt.) Limited, Thatta, Sindh 49.50 Wind Wind Turbine26 Three Gorges Third Wind Farm Pakistan (Pvt.) Limited, Thatta, Sindh 49.50 Wind Wind Turbine27 Tricon Boston Consulting Corp. (Pvt.) Limited (Plant-A), Thatta, Sindh 49.74 Wind Wind Turbine28 Tricon Boston Consulting Corp. (Pvt.) Limited (Plant-B), Thatta, Sindh 49.74 Wind Wind Turbine29 Tricon Boston Consulting Corp. (Pvt.) Limited (Plant-C), Thatta, Sindh 49.74 Wind Wind Turbine30 Norinco International Thatta Power (Pvt.) Limited, Thatta, Sindh 50.00 Wind Wind Turbine31 Western Energy (Pvt.) Limited, Thatta, Sindh 50.00 Wind Wind Turbine32 Zulaikha Energy (Pvt.) Limited, Thatta, Sindh 50.00 Wind Wind Turbine33 Din Energy Limited, Thatta, Sindh 50.00 Wind Wind Turbine34 Cacho Wind Energy (Pvt.) Limited, Thatta, Sindh 50.00 Wind Wind Turbine35 Artistic Wind Power (Pvt.) Limited, Thatta, Sindh 50.00 Wind Wind Turbine36 ACT2 Wind (Pvt.) Limited, Thatta, Sindh 50.00 Wind Wind Turbine37 Trans Atlantic Energy (Pvt.) Limited, Thatta, Sindh 48.30 Wind Wind Turbine
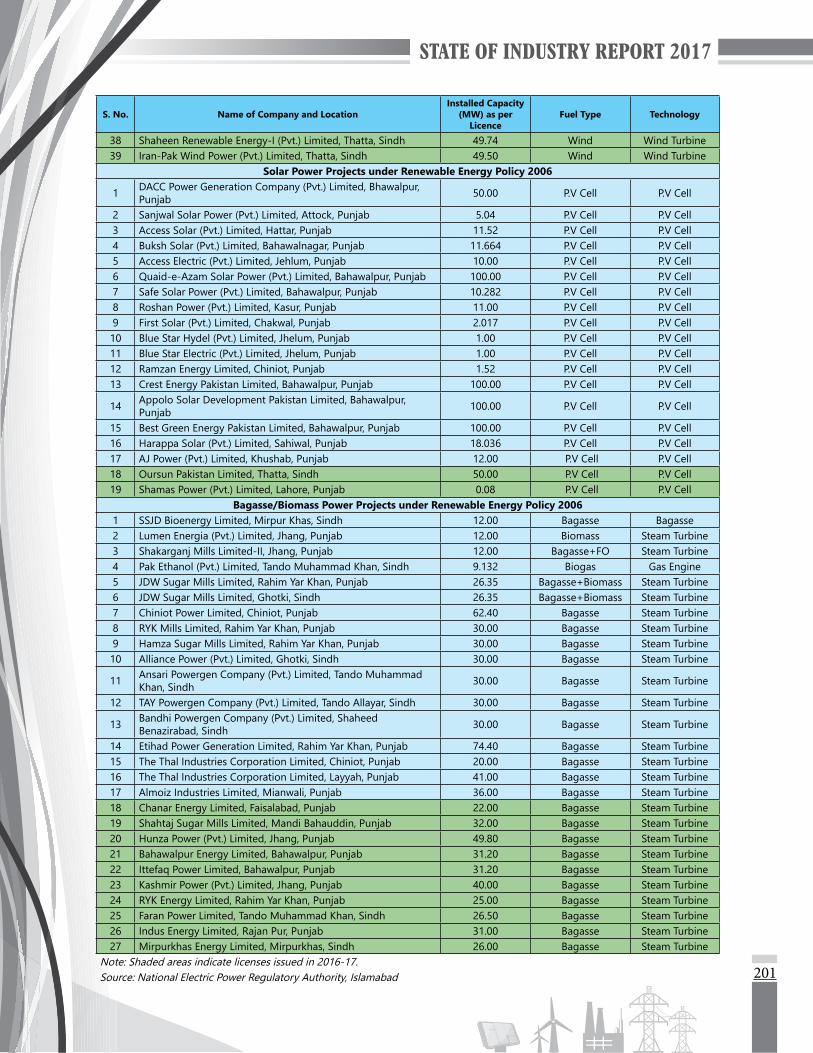
201
S. No. Name of Company and LocationInstalled Capacity
(MW) as per Licence
Fuel Type Technology
38 Shaheen Renewable Energy-I (Pvt.) Limited, Thatta, Sindh 49.74 Wind Wind Turbine39 Iran-Pak Wind Power (Pvt.) Limited, Thatta, Sindh 49.50 Wind Wind Turbine
Solar Power Projects under Renewable Energy Policy 2006
1 DACC Power Generation Company (Pvt.) Limited, Bhawalpur, Punjab 50.00 P.V Cell P.V Cell
2 Sanjwal Solar Power (Pvt.) Limited, Attock, Punjab 5.04 P.V Cell P.V Cell3 Access Solar (Pvt.) Limited, Hattar, Punjab 11.52 P.V Cell P.V Cell4 Buksh Solar (Pvt.) Limited, Bahawalnagar, Punjab 11.664 P.V Cell P.V Cell5 Access Electric (Pvt.) Limited, Jehlum, Punjab 10.00 P.V Cell P.V Cell6 Quaid-e-Azam Solar Power (Pvt.) Limited, Bahawalpur, Punjab 100.00 P.V Cell P.V Cell7 Safe Solar Power (Pvt.) Limited, Bahawalpur, Punjab 10.282 P.V Cell P.V Cell8 Roshan Power (Pvt.) Limited, Kasur, Punjab 11.00 P.V Cell P.V Cell9 First Solar (Pvt.) Limited, Chakwal, Punjab 2.017 P.V Cell P.V Cell10 Blue Star Hydel (Pvt.) Limited, Jhelum, Punjab 1.00 P.V Cell P.V Cell11 Blue Star Electric (Pvt.) Limited, Jhelum, Punjab 1.00 P.V Cell P.V Cell12 Ramzan Energy Limited, Chiniot, Punjab 1.52 P.V Cell P.V Cell13 Crest Energy Pakistan Limited, Bahawalpur, Punjab 100.00 P.V Cell P.V Cell
14 Appolo Solar Development Pakistan Limited, Bahawalpur, Punjab 100.00 P.V Cell P.V Cell
15 Best Green Energy Pakistan Limited, Bahawalpur, Punjab 100.00 P.V Cell P.V Cell16 Harappa Solar (Pvt.) Limited, Sahiwal, Punjab 18.036 P.V Cell P.V Cell17 AJ Power (Pvt.) Limited, Khushab, Punjab 12.00 P.V Cell P.V Cell18 Oursun Pakistan Limited, Thatta, Sindh 50.00 P.V Cell P.V Cell19 Shamas Power (Pvt.) Limited, Lahore, Punjab 0.08 P.V Cell P.V Cell
Bagasse/Biomass Power Projects under Renewable Energy Policy 20061 SSJD Bioenergy Limited, Mirpur Khas, Sindh 12.00 Bagasse Bagasse2 Lumen Energia (Pvt.) Limited, Jhang, Punjab 12.00 Biomass Steam Turbine3 Shakarganj Mills Limited-II, Jhang, Punjab 12.00 Bagasse+FO Steam Turbine4 Pak Ethanol (Pvt.) Limited, Tando Muhammad Khan, Sindh 9.132 Biogas Gas Engine5 JDW Sugar Mills Limited, Rahim Yar Khan, Punjab 26.35 Bagasse+Biomass Steam Turbine6 JDW Sugar Mills Limited, Ghotki, Sindh 26.35 Bagasse+Biomass Steam Turbine7 Chiniot Power Limited, Chiniot, Punjab 62.40 Bagasse Steam Turbine8 RYK Mills Limited, Rahim Yar Khan, Punjab 30.00 Bagasse Steam Turbine9 Hamza Sugar Mills Limited, Rahim Yar Khan, Punjab 30.00 Bagasse Steam Turbine10 Alliance Power (Pvt.) Limited, Ghotki, Sindh 30.00 Bagasse Steam Turbine
11 Ansari Powergen Company (Pvt.) Limited, Tando Muhammad Khan, Sindh 30.00 Bagasse Steam Turbine
12 TAY Powergen Company (Pvt.) Limited, Tando Allayar, Sindh 30.00 Bagasse Steam Turbine
13 Bandhi Powergen Company (Pvt.) Limited, Shaheed Benazirabad, Sindh 30.00 Bagasse Steam Turbine
14 Etihad Power Generation Limited, Rahim Yar Khan, Punjab 74.40 Bagasse Steam Turbine15 The Thal Industries Corporation Limited, Chiniot, Punjab 20.00 Bagasse Steam Turbine16 The Thal Industries Corporation Limited, Layyah, Punjab 41.00 Bagasse Steam Turbine17 Almoiz Industries Limited, Mianwali, Punjab 36.00 Bagasse Steam Turbine18 Chanar Energy Limited, Faisalabad, Punjab 22.00 Bagasse Steam Turbine19 Shahtaj Sugar Mills Limited, Mandi Bahauddin, Punjab 32.00 Bagasse Steam Turbine20 Hunza Power (Pvt.) Limited, Jhang, Punjab 49.80 Bagasse Steam Turbine21 Bahawalpur Energy Limited, Bahawalpur, Punjab 31.20 Bagasse Steam Turbine22 Ittefaq Power Limited, Bahawalpur, Punjab 31.20 Bagasse Steam Turbine23 Kashmir Power (Pvt.) Limited, Jhang, Punjab 40.00 Bagasse Steam Turbine24 RYK Energy Limited, Rahim Yar Khan, Punjab 25.00 Bagasse Steam Turbine25 Faran Power Limited, Tando Muhammad Khan, Sindh 26.50 Bagasse Steam Turbine26 Indus Energy Limited, Rajan Pur, Punjab 31.00 Bagasse Steam Turbine27 Mirpurkhas Energy Limited, Mirpurkhas, Sindh 26.00 Bagasse Steam Turbine
Note: Shaded areas indicate licenses issued in 2016-17.Source: National Electric Power Regulatory Authority, Islamabad

202
TABLE 38-CList of Generation Licensees (SPPs, CPPs, IGCs, N-CPPs, DGPs, STIPPs and other IPPs)
S. No. Name of Company and LocationInstalled
Capacity (MW) as per Licence
Fuel TypeTechnology-wise Capacity (MW)
Technology Capacity
Small Power Producers (SPPs)1 ICI Pakistan PowerGen Limited, Sheikhupura, Punjab 14.00 HFO DE 14.002 Sapphire Power Generation Limited, Sheikhupura, Punjab 56.80 HFO+Gas DE+GE 52.20+4.603 Crescent Powertec Limited, Shahkot, Punjab 10.60 HFO DE 10.604 Ellcot Spinning Mills Limited, Kotri (Sindh), Kasur and
Sheikhupura (Punjab)21.96 HFO+HSD DE 13.80+8.16
5 Mahmood Textile Mills Limited, Muzaffargarh, Punjab 15.05 FO+Gas DE+GE 9.20+5.856 Gulistan Power Generation Limited, Sheikhupura, Kasur
(Punjab) and Kotri (Sindh)20.945 HSD+HFO+Gas DE+GE 11.82+4.68
+4.457 Monnoo Energy Limited, Sheikhupura, Punjab 4.60 HFO DE 4.608 Sitara Energy Limited, Faisalabad, Punjab 87.82 HFO+Gas DE+GE 51.62+36.20
9 Bhanero Energy Limited, Kotri (Sindh) and Sheikhupura (Punjab) 37.33 HFO+Gas DE+GE 3.635+33.695
10 Quetta Textile Mills Limited, Kotri (Sindh) and Bhai Pheru (Punjab) 30.806 HFO+Gas DE+GE 8.1+22.70611 Ideal Energy Limited, Faisalabad, Punjab 11.82 HFO DE 11.8212 Genertech Pakistan Limited, Bhai Pheru, Punjab 27.52 HFO DE 27.5213 Zeeshan Energy Limited, Faisalabad, Punjab 6.90 HFO DE 6.9014 Ibrahim Fibres Limited, Faisalabad, Punjab 58.30 HFO+HSD+Gas RE 58.3015 Kohinoor Mills Limited, Kasur, Punjab 31.23 HSD+HFO+Gas DE+GE 31.23
Captive Power Producers (CPPs)1 Shakarganj Mills Limited, Jhang, Punjab 8.512 Biogas GE 8.5122 Prosperity Weaving Mills Limited, Sheikhupura, Punjab 6.90 HFO DE 6.903 Almoiz Industries Limited, Dera Ismail Khan, Khyber Pakhtunkhwa 43.60 Bagasse+FO ST 43.604 Roomi Fabrics Limited, Multan, Punjab 15.87 Gas GE 15.875 Din Textile Mills Limited, Kasur, Punjab 9.68 HSD+FO+Gas DE+GE +ST 5.18+4.506 Pakistan Steel Mills Limited, Karachi, Sindh 165.00 Gas ST 165.007 Nishat Mills Limited, Bhikki, Punjab 128.241 HSD+FO+Gas DE+GE +ST 128.2418 Indus Sugar Mills Limited, Rajanpur, Punjab 11.00 Bagasse+FO ST 11.009 Colony Mills Limited, Multan, Punjab 36.132 Gas GE 36.13210 JDW Sugar Mills Limited, Rahim Yar Khan, Punjab 31.00 Bagasse+FO ST 31.0011 Mekotex (Pvt.) Limited, Dadu, Sindh 5.01 Gas GE 5.0112 Brothers Sugar Mills Limited, Kasur, Punjab 13.00 Bagasse+FO ST 13.0013 Al-Noor Sugar Mills Limited, Shaheed Benazirabad, Sindh 36.80 Bagasse+FO ST 36.8014 SUNEC Wind Power Generation (Pvt.) Limited, Chakwal,
Punjab0.05 Wind WT 0.05
15 Shadman Cotton Mills Limited, Nankana, Punjab 9.25 HSD+HFO+Gas GE+DE 4.65+4.616 Agar Textiles Mills (Pvt.) Limited, Jamshoro, Sindh 16.185 Gas GE 16.18517 RYK Mills Limited, Rahim Yar Khan, Punjab 18.00 Bagasse+FO ST 18.0018 Sheikhoo Sugar Mills Limited, Muzaffargarh, Punjab 18.00 Bagasse ST 18.0019 Hi-Tech Pipes & Engineering Industries, Jamshoro, Sindh 3.78 Gas GE 3.7820 Ashraf Sugar Mills Limited, Bahawalpur, Punjab 24.50 Bagasse+FO ST 24.5021 Al-Abbas Sugar Mills Limited, Thatta, Sindh 15.00 Imported Coal ST 15.0022 The Thal Industries Corporation Limited, Layyah, Punjab 30.70 Bagasse+FO ST 30.7023 International Steel Limited, Karachi, Sindh 19.316 Gas GE+ST 18.066+1.250
24 International Industries Limited, Karachi, Sindh 4.38 Gas GE 4.3825 Hamza Sugar Mills Limited, Rahim Yar Khan, Punjab 23.60 Bagasse+FO ST 23.6026 Tuwairqi Steel Mills Limited, Karachi, Sindh 38.948 Gas+HSD GE+ST 26.948+12.00
27 Eithad Sugar Mills Limited, Rahim Yar Khan, Punjab 22.00 Bagasse+FO ST 22.0028 Deharki Sugar Mills (Pvt.) Limited, Ghotki, Sindh 15.00 Bagasse+FO ST 15.0029 Tando Allayar Sugar Mills (Pvt.) Limited, Tano Allahyar, Sindh 12.00 Bagasse+FO ST 12.0030 Shakarganj Mills Limited, Jhang, Punjab 12.00 Bagasse+FO ST 12.0031 Digri Sugar Mills Limited, Mirpur Khan, Sindh 6.00 Bagasse+FO ST 6.00

203
S. No. Name of Company and LocationInstalled
Capacity (MW) as per Licence
Fuel TypeTechnology-wise Capacity (MW)
Technology Capacity
32 Salim Yarn Mills (Pvt.) Limited, Kotri, Sindh 2.70 Gas GE 2.7033 Engro Powergen. Qadirpur Limited, Ghotki, Sindh 0.36 Solar Power P.V Cell 0.3634 Fatima Sugar Mills Limited, Kot Addu, Punjab 23.55 Bagasse+FO ST 23.5535 Bandhi Sugar Mills (Pvt.) Limited, Shaheed Benazirabad, Sindh 12.00 Bagasse+FO ST 12.0036 Kamalia Sugar Mills Limited, Toba Tek Singh, Punjab 17.00 Bagasse+FO ST 17.0037 Gadoon Textile Mills Limited, Swabi, Khyber Pakhtunkhwa 56.47 HFO+Gas RE 56.4738 Ramzan Sugar Mills Limited, Chiniot, Punjab 12.00 Bagasse+FO ST 12.0039 Lotte Chemical Pakistan Limited, Karachi, Sindh 48.10 Gas ST 48.10
40 Noon Sugar Mills Limited, Sargodha, Punjab 14.80 Bagasse ST 14.8041 Bahria Town Electric Supply Company (Pvt.) Limited, Rawalpindi, Punjab 10.00 Coal Water Slurry DE 10.0042 Fatima Energy Limited, Muzaffargarh, Punjab 120.00 Biomass/Coal ST 120.0043 Faran Sugar Mills Limited, Tando Muhammad Khan, Sindh 13.00 Biomass+FO ST 13.0044 Chambar Sugar Mills (Pvt.) Limited, Tando Allahyar, Sindh 5.00 Bagasse+FO ST 5.0045 Fimcotex Industries (Pvt.) Limited, Jamshoro, Sindh 35.538 Gas GE+ST 32.838+2.70
46 Thal Industries Corporation Limited (for Safina Sugar Mills Limited - Plant I), Chiniot, Punjab
11.00 Bagasse ST 11.00
47 Ranipur Sugar Mills (Pvt.) Limited, Khairpur, Sindh 25.50 Bagasse ST 25.5048 Unicol Limited, Mirpur Khas, Sindh 6.60 Bagasse ST 6.6049 Lucky Cement Limited, Lakki Marwat, Khyber Pakhtunkhwa 16.00 Waste Heat
Recovery Based TPS
Steam Generators
16.00
50 Alliance Sugar Mills (Pvt.) Limited, Ghotki, Sindh 13.50 Bagasse ST 13.5051 Habib Sugar Mills Limited, Benazirabad, Sindh 13.50 Bagasse ST 13.5052 Mehran Sugar Mills Limited, Tando Allahyar, Sindh 14.06 Bagasse ST 14.0653 Shahmurad Sugar Mills Limited, Thatta, Sindh 15.25 Bagasse ST 15.2554 Sanghar Sugar Mills Limited, Sanghar, Sindh 13.50 Bagasse ST 13.5055 Mirpurkhas Sugar Mills Limited, Mirpurkhas, Sindh 8.50 Bagasse ST 8.5056 Khairpur Sugar Mills Limited, Khairpur, Sindh 12.00 Bagasse+FO ST 12.0057 Data Hydropower (Pvt.) Limited, Chiniot, Punjab 0.30 Hydel Run of Canal 0.3058 Hytex Energy (Pvt.) Limited, Hyderabad, Sindh 5.00 Coal/Biomass ST 5.0059 NC Electric Company Limited, Kasur, Punjab 46.00 Imported/Local Coal ST 46.0060 Master Power (Pvt.) Limited, Lahore, Punjab 20.00 Imported/Local
Coal ST 20.00
61 Fazal Paper Mills (Pvt.) Limited, Okara, Punjab 8.00 Biomass/Local Coal ST 8.0062 Bismillah Energy (Pvt.) Limited, Sheikhupura, Punjab 6.00 Biomass/Municipal
Solid Waste ST 6.00
63 Maple Leaf Power Limited, Mianwali, Punjab 40.00 Imported Coal ST 40.00Isolated Generation Companies (IGCs)
1 Engro Polymer and Chemicals Limited, Karachi, Sindh 79.02 HSD+ Gas GT 5.202 Anoud Power Generation Limited, Karachi, Sindh 30.95 FO+Gas DG+GE 23.84+7.113 Olympia Power Generation (Pvt.) Limited, Karachi, Sindh 5.88 Biogas/Gas GE 5.884 Lucky Energy (Pvt.) Limited, Karachi, Sindh 56.575 Gas GE 56.5755 Nadeem Power Generation Limited, Karachi, Sindh 2.805 Gas GE 2.8056 Shakarganj Energy (Pvt.) Limited, Jhang, Punjab 31.50 Bagasse+FO ST 31.507 Asia Generation (Pvt.) Limited, Karachi, Sindh 11.10 Gas GE 11.108 Aquagen (Pvt.) Limited, Karachi, Sindh 7.357 Gas GE 7.3579 Innovative Energy Solutions Limited, Karachi, Sindh 8.031 Gas GE 3x2.677
New Captive Power Plants (N-CPPs)1 Dadu Energy (Pvt.) Limited, Dadu, Sindh 49.448 Gas GE+ST 46.648+2.80
2 Omni Power (Pvt.) Limited, Tando Muhammad Khan, Sindh 14.128 Gas GE+ST 13.328+0.80
3 Shikarpur Power (Pvt.) Limited Shikarpur, Sindh 17.66 Gas GE+ST 16.66+1.004 Naudero Energy (Pvt.) Limited, Larkana, Sindh 17.66 Gas GE+ST 16.66+2.005 Anoud Textile Mills Limited, Jamshoro, Sindh 11.70 Gas GE 11.706 Lucky Cement Limited, Karachi, Sindh 29.73 Gas GE 29.73
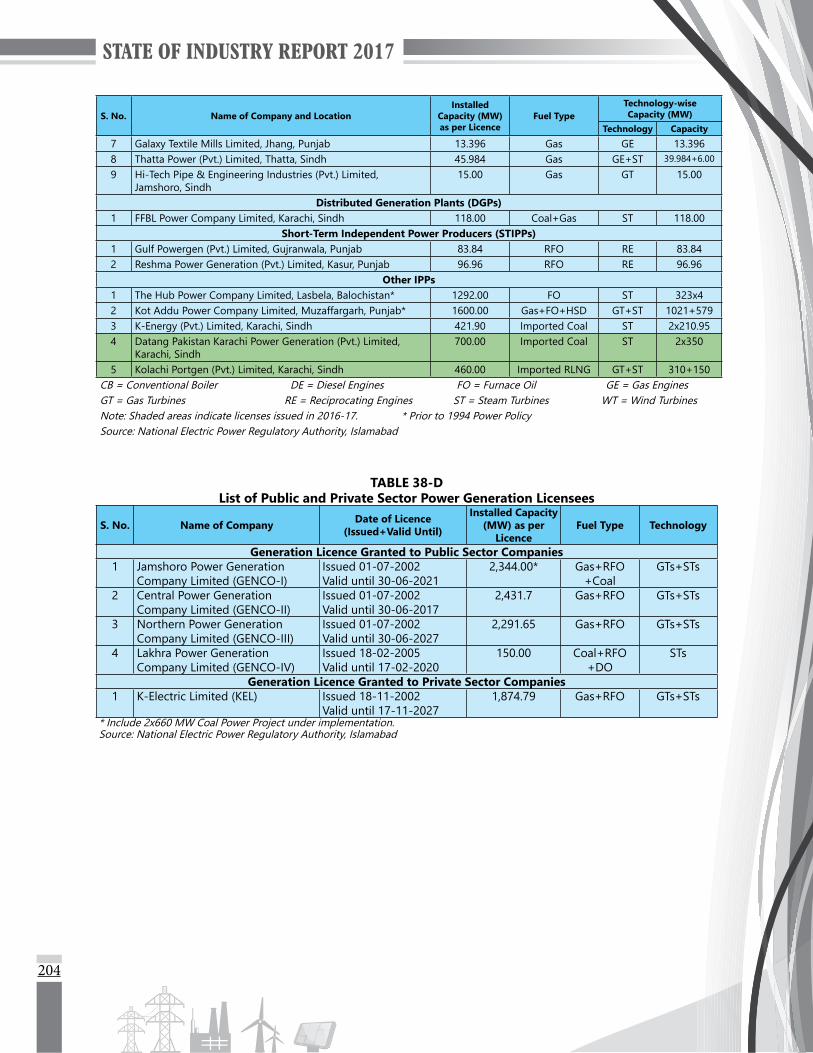
204
S. No. Name of Company and LocationInstalled
Capacity (MW) as per Licence
Fuel TypeTechnology-wise Capacity (MW)
Technology Capacity
7 Galaxy Textile Mills Limited, Jhang, Punjab 13.396 Gas GE 13.3968 Thatta Power (Pvt.) Limited, Thatta, Sindh 45.984 Gas GE+ST 39.984+6.00
9 Hi-Tech Pipe & Engineering Industries (Pvt.) Limited, Jamshoro, Sindh
15.00 Gas GT 15.00
Distributed Generation Plants (DGPs)1 FFBL Power Company Limited, Karachi, Sindh 118.00 Coal+Gas ST 118.00
Short-Term Independent Power Producers (STIPPs)1 Gulf Powergen (Pvt.) Limited, Gujranwala, Punjab 83.84 RFO RE 83.842 Reshma Power Generation (Pvt.) Limited, Kasur, Punjab 96.96 RFO RE 96.96
Other IPPs1 The Hub Power Company Limited, Lasbela, Balochistan* 1292.00 FO ST 323x42 Kot Addu Power Company Limited, Muzaffargarh, Punjab* 1600.00 Gas+FO+HSD GT+ST 1021+5793 K-Energy (Pvt.) Limited, Karachi, Sindh 421.90 Imported Coal ST 2x210.954 Datang Pakistan Karachi Power Generation (Pvt.) Limited,
Karachi, Sindh700.00 Imported Coal ST 2x350
5 Kolachi Portgen (Pvt.) Limited, Karachi, Sindh 460.00 Imported RLNG GT+ST 310+150CB = Conventional Boiler DE = Diesel Engines FO = Furnace Oil GE = Gas EnginesGT = Gas Turbines RE = Reciprocating Engines ST = Steam Turbines WT = Wind TurbinesNote: Shaded areas indicate licenses issued in 2016-17. * Prior to 1994 Power PolicySource: National Electric Power Regulatory Authority, Islamabad
TABLE 38-DList of Public and Private Sector Power Generation Licensees
S. No. Name of Company Date of Licence (Issued+Valid Until)
Installed Capacity (MW) as per
LicenceFuel Type Technology
Generation Licence Granted to Public Sector Companies1 Jamshoro Power Generation
Company Limited (GENCO-I)Issued 01-07-2002 Valid until 30-06-2021
2,344.00* Gas+RFO +Coal
GTs+STs
2 Central Power Generation Company Limited (GENCO-II)
Issued 01-07-2002 Valid until 30-06-2017
2,431.7 Gas+RFO GTs+STs
3 Northern Power Generation Company Limited (GENCO-III)
Issued 01-07-2002 Valid until 30-06-2027
2,291.65 Gas+RFO GTs+STs
4 Lakhra Power Generation Company Limited (GENCO-IV)
Issued 18-02-2005 Valid until 17-02-2020
150.00 Coal+RFO +DO
STs
Generation Licence Granted to Private Sector Companies1 K-Electric Limited (KEL) Issued 18-11-2002
Valid until 17-11-20271,874.79 Gas+RFO GTs+STs
* Include 2x660 MW Coal Power Project under implementation.Source: National Electric Power Regulatory Authority, Islamabad

205
TABLE 38-EList of Generation Licensees (IPPs under Power Policy 1994)
S. No. Name of Company and Location
Installed Capacity (MW) as per Licence
Fuel TypeTechnology-wise Capacity (MW)
Technology Capacity
1* Fauji Kabirwala Power Company Limited, Khanewal, Punjab 170.00 Gas GT+ST 96+742* TNB Liberty Power Limited, Daharki, Sindh 235.00 Gas GT+ST 156+79
3* Habibullah Coastal Power Company (Pvt.) Limited, Sheikh Manda, Balochistan 155.00 Gas GT+ST 111+29
4* Uch Power Limited, Naseerabad, Balochistan 586.20 Gas GT+ST 390+1965* Rousch (Pakistan) Power Limited, Khanewal, Punjab 450.00 Gas GT+ST 304+1466* Kohinoor Energy Limited, Raiwind, Punjab 131.44 FO DE+ST 131.447 Lal Pir Power (Pvt.) Limited, Muzaffargarh, Punjab 362.00 FO ST 3628 Pak Gen. Power (Pvt.) Limited, Muzaffargarh, Punjab 365.00 FO ST 3659 Saba Power Company Limited, Sheikhupura, Punjab 136.00 FO ST 13610 Gul Ahmed Energy Limited, Karachi, Sindh 136.17 RFO DE 15.13x911 Tapal Energy (Pvt.) Limited, Karachi, Sindh 126.00 RFO DE 12612 Japan Power Limited, Raiwind, Punjab 135.60 RFO DE 5.65x2413 Southern Electric Power Company Limited, Lahore, Punjab 117.00 RFO DE 23.4x514 Altern Energy Limited, Fateh Jhang, Punjab 14.00 Gas GE 1415 Davis Energen (Pvt.) Limited, Jhang, Punjab 12.16 Gas GE 3.04x4
* Combined Cycle technology is being used in these plants.Source: National Electric Power Regulatory Authority, Islamabad
TABLE 38-FList of Generation Licensees (IPPs under Power Policy 2002)
S. No. Name of Company and Location
Installed Capacity (MW) as per Licence
Fuel TypeTechnology-wise Capacity (MW)
Technology Capacity
1 DHA Cogen Limited, Karachi, Sindh 94.00 Gas GT+ST 67+272 Star Power Generation Limited, Daharki, Sindh 133.515 Gas GT+ST 88.244+45.2713 Orient Power Company (Pvt.) Limited, Balloki, Punjab 225.00 Gas GT+ST 151+744 Saif Power Limited, Sahiwal, Punjab 225.00 Gas+HSD GT+ST 152+735 Sapphire Electric Power Company Limited, Sheikhupura, Punjab 235.00 Gas+HSD GT+ST 152+836 Attock Gen Limited, Rawalpindi, Punjab 165.285 FO+HSD DG+ST 153.275+12.017 Halmore Power Generation Company (Pvt.) Limited, Bhikki, Punjab 225.00 Gas+HSD GT+ST 150+758 Foundation Power Company (Daharki) Limited, Daharki, Sindh 179.05 Gas+HSD GT+ST 114.9+64.159 Eastern Power Company Limited, Pasroor, Punjab 152.475 FO+HSD RE+ST 143.975+8.510 Atlas Power (Pvt.) Limited, Sheikhupura, Punjab 224.35 RFO+LDO RE+ST 207.9+16.4511 Gujranwala Energy Limited, Gujranwala, Punjab 201.451 HSFO+HSD RE+ST 187.836+13.61512 Engro Power Gen. Qadirpur Limited, Qadirpur, Sindh 226.52 Gas+HSD GT+ST 126.57+99.9513 Nishat Chunian Power Limited, Kasur, Punjab 202.179 RFO+HSD RE+ST 187.836+14.34314 Nishat Power Limited, Kasur, Punjab 202.179 RFO+HSD RE+ST 187.836+14.34315 Intergen (Pvt.) Limited, Lachi, Kohat, Khyber Pakhtunkhwa 165.285 HSFO+HSD RE+ST 153.684+11.60
16 The Hub Power Company Limited (Narowal Project), Narowal, Punjab 224.79 RFO+LDO RE+ST 207.9+16.89
17 Liberty Power Tech Limited, Faisalabad, Punjab 202.179 RFO+HSD RE+ST 187.836+14.34318 Grange Power Limited, Pakpattan, Punjab 163.353 Gas GT+ST 109+54.35319 Uch-II Power (Pvt.) Limited, Naseerabad, Balochistan 404.00 Gas GT+ST 267.54+136.46
20 Radian Energy Power Generation Company (Pvt.) Limited, Faisalabad, Punjab 164.368 RFO+LFO RE+ST 153.684+10.684
21 Port Qasim Electric Power Company Limited, Karachi, Sindh 1320.00 Imported Coal ST+CB 660x222 Engro Powergen Thar (Pvt.) Limited, Tharparkar, Sindh 660.00 Indigenous Coal ST+CB 330x2
23 Huaneng Shandong Ruyi (Pakistan) Energy (Pvt.) Limited, Sahiwal, Punjab 1320.00 Imported Coal ST+CB 660x2
24 Sindh Nooriabad Power Company (Pvt.) Limited, Jamshoro, Sindh 52.10 Gas GE+ST 9.72x5+3.5025 Sindh Nooriabad Power Company Phase-II (Pvt.) Limited, Sindh 52.10 Gas GE+ST 9.72x5+3.5026 Lucky Electric Power Company Limited, Karachi, Sindh 660.00 Imported Coal ST+CB 660.00
27 Thar Coal Block-I Power Generation Company (Pvt.) Limited, Tharparkar, Sindh 1320.00 Thar Coal ST+CB 660x2
Note: Shaded areas indicate licenses issued in 2016-17.Source: National Electric Power Regulatory Authority, Islamabad
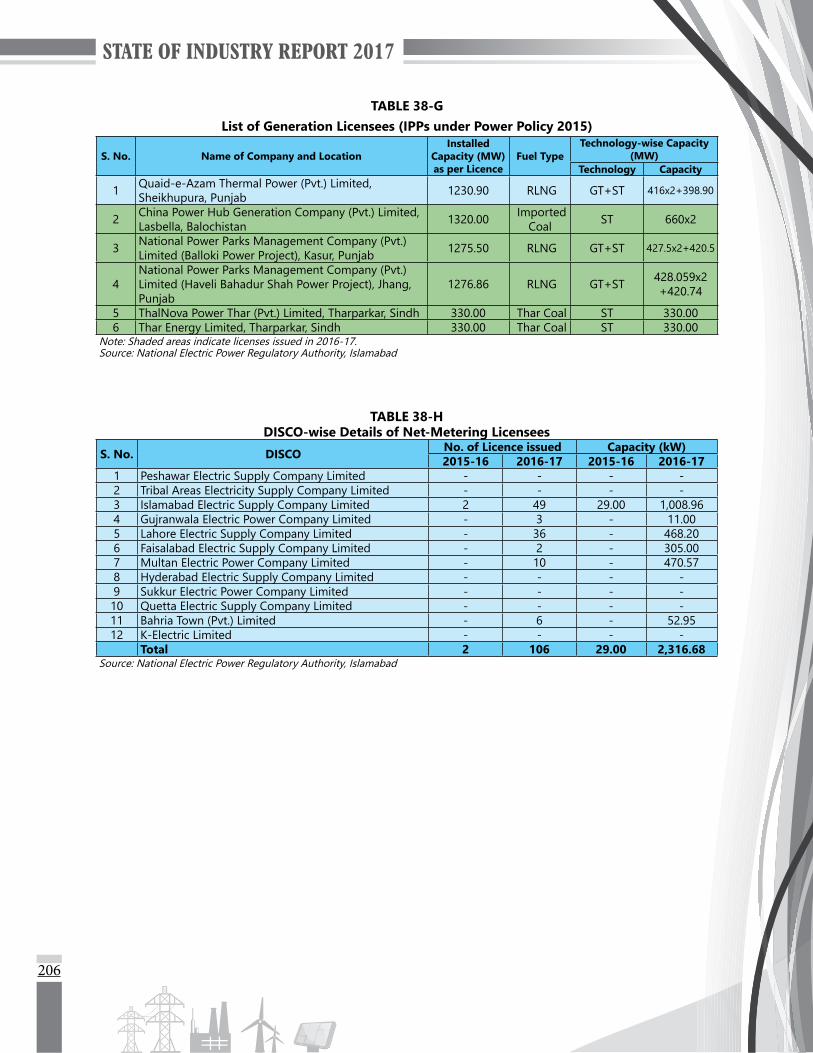
206
TABLE 38-GList of Generation Licensees (IPPs under Power Policy 2015)
S. No. Name of Company and LocationInstalled
Capacity (MW) as per Licence
Fuel TypeTechnology-wise Capacity
(MW)Technology Capacity
1 Quaid-e-Azam Thermal Power (Pvt.) Limited, Sheikhupura, Punjab 1230.90 RLNG GT+ST 416x2+398.90
2 China Power Hub Generation Company (Pvt.) Limited, Lasbella, Balochistan 1320.00 Imported
Coal ST 660x2
3 National Power Parks Management Company (Pvt.) Limited (Balloki Power Project), Kasur, Punjab 1275.50 RLNG GT+ST 427.5x2+420.5
4National Power Parks Management Company (Pvt.) Limited (Haveli Bahadur Shah Power Project), Jhang, Punjab
1276.86 RLNG GT+ST 428.059x2 +420.74
5 ThalNova Power Thar (Pvt.) Limited, Tharparkar, Sindh 330.00 Thar Coal ST 330.006 Thar Energy Limited, Tharparkar, Sindh 330.00 Thar Coal ST 330.00
Note: Shaded areas indicate licenses issued in 2016-17.Source: National Electric Power Regulatory Authority, Islamabad
TABLE 38-HDISCO-wise Details of Net-Metering Licensees
S. No. DISCO No. of Licence issued Capacity (kW)2015-16 2016-17 2015-16 2016-17
1 Peshawar Electric Supply Company Limited - - - -2 Tribal Areas Electricity Supply Company Limited - - - -3 Islamabad Electric Supply Company Limited 2 49 29.00 1,008.964 Gujranwala Electric Power Company Limited - 3 - 11.005 Lahore Electric Supply Company Limited - 36 - 468.206 Faisalabad Electric Supply Company Limited - 2 - 305.007 Multan Electric Power Company Limited - 10 - 470.578 Hyderabad Electric Supply Company Limited - - - -9 Sukkur Electric Power Company Limited - - - -10 Quetta Electric Supply Company Limited - - - -11 Bahria Town (Pvt.) Limited - 6 - 52.9512 K-Electric Limited - - - -
Total 2 106 29.00 2,316.68Source: National Electric Power Regulatory Authority, Islamabad
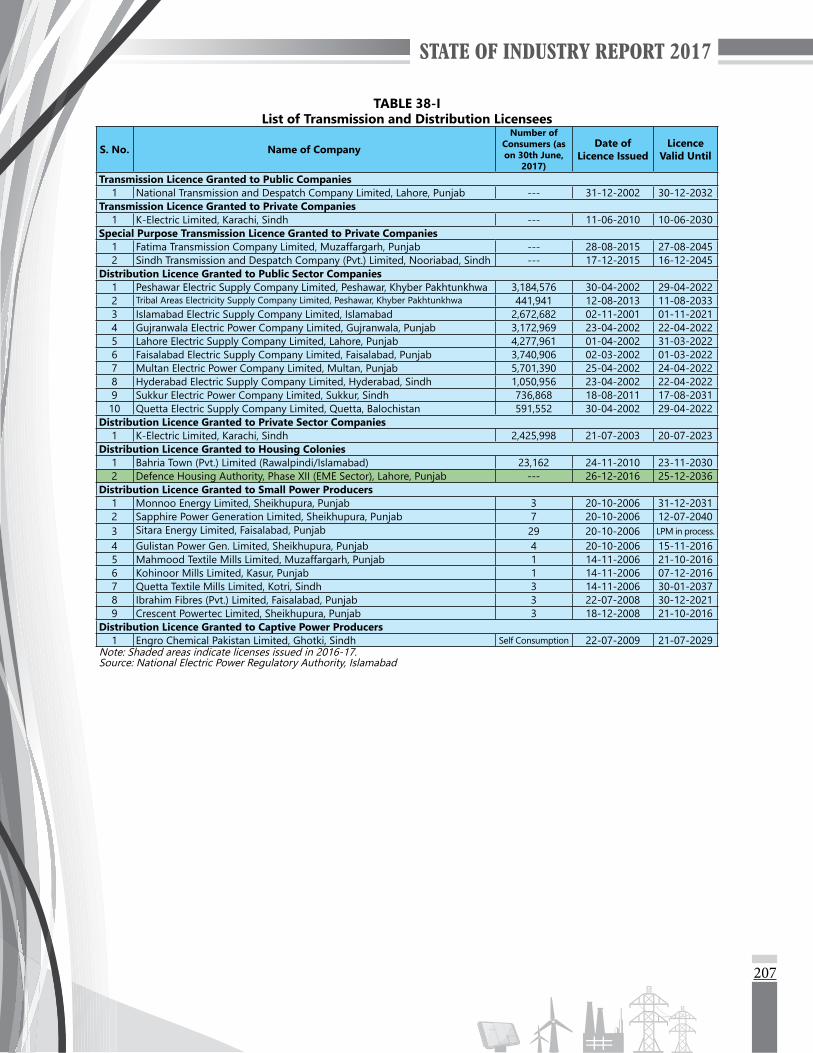
207
TABLE 38-IList of Transmission and Distribution Licensees
S. No. Name of CompanyNumber of
Consumers (as on 30th June,
2017)
Date of Licence Issued
Licence Valid Until
Transmission Licence Granted to Public Companies1 National Transmission and Despatch Company Limited, Lahore, Punjab --- 31-12-2002 30-12-2032
Transmission Licence Granted to Private Companies1 K-Electric Limited, Karachi, Sindh --- 11-06-2010 10-06-2030
Special Purpose Transmission Licence Granted to Private Companies1 Fatima Transmission Company Limited, Muzaffargarh, Punjab --- 28-08-2015 27-08-20452 Sindh Transmission and Despatch Company (Pvt.) Limited, Nooriabad, Sindh --- 17-12-2015 16-12-2045
Distribution Licence Granted to Public Sector Companies1 Peshawar Electric Supply Company Limited, Peshawar, Khyber Pakhtunkhwa 3,184,576 30-04-2002 29-04-20222 Tribal Areas Electricity Supply Company Limited, Peshawar, Khyber Pakhtunkhwa 441,941 12-08-2013 11-08-20333 Islamabad Electric Supply Company Limited, Islamabad 2,672,682 02-11-2001 01-11-20214 Gujranwala Electric Power Company Limited, Gujranwala, Punjab 3,172,969 23-04-2002 22-04-20225 Lahore Electric Supply Company Limited, Lahore, Punjab 4,277,961 01-04-2002 31-03-20226 Faisalabad Electric Supply Company Limited, Faisalabad, Punjab 3,740,906 02-03-2002 01-03-20227 Multan Electric Power Company Limited, Multan, Punjab 5,701,390 25-04-2002 24-04-20228 Hyderabad Electric Supply Company Limited, Hyderabad, Sindh 1,050,956 23-04-2002 22-04-20229 Sukkur Electric Power Company Limited, Sukkur, Sindh 736,868 18-08-2011 17-08-203110 Quetta Electric Supply Company Limited, Quetta, Balochistan 591,552 30-04-2002 29-04-2022
Distribution Licence Granted to Private Sector Companies1 K-Electric Limited, Karachi, Sindh 2,425,998 21-07-2003 20-07-2023
Distribution Licence Granted to Housing Colonies1 Bahria Town (Pvt.) Limited (Rawalpindi/Islamabad) 23,162 24-11-2010 23-11-20302 Defence Housing Authority, Phase XII (EME Sector), Lahore, Punjab --- 26-12-2016 25-12-2036
Distribution Licence Granted to Small Power Producers1 Monnoo Energy Limited, Sheikhupura, Punjab 3 20-10-2006 31-12-20312 Sapphire Power Generation Limited, Sheikhupura, Punjab 7 20-10-2006 12-07-20403 Sitara Energy Limited, Faisalabad, Punjab 29 20-10-2006 LPM in process.
4 Gulistan Power Gen. Limited, Sheikhupura, Punjab 4 20-10-2006 15-11-20165 Mahmood Textile Mills Limited, Muzaffargarh, Punjab 1 14-11-2006 21-10-20166 Kohinoor Mills Limited, Kasur, Punjab 1 14-11-2006 07-12-20167 Quetta Textile Mills Limited, Kotri, Sindh 3 14-11-2006 30-01-20378 Ibrahim Fibres (Pvt.) Limited, Faisalabad, Punjab 3 22-07-2008 30-12-20219 Crescent Powertec Limited, Sheikhupura, Punjab 3 18-12-2008 21-10-2016
Distribution Licence Granted to Captive Power Producers1 Engro Chemical Pakistan Limited, Ghotki, Sindh Self Consumption 22-07-2009 21-07-2029
Note: Shaded areas indicate licenses issued in 2016-17.Source: National Electric Power Regulatory Authority, Islamabad


STATE OF INDUSTRY REPORT 2017
ELECTRICITY TRANSMISSION


211
ELECTRICITY TRANSMISSION
12.1 GENERALIn Pakistan, there are two companies which are, presently engaged, in the business of electric power transmission under Section 17 of the NEPRA Act. One is NTDC and the other is K-Electric Limited. NTDC is the National Grid Company of Pakistan and is exclusively responsible for construction, operation, maintenance of 500 kV and 220 kV Grid Stations and Power Transmission Lines in the country except for the area served by K-Electric. NTDC is a public sector company and came into existence as a result of restructuring of WAPDA in 1998 and then obtained a transmission licence by NEPRA in 2002. At present, NTDC owns a network of 500 kV, 220 kV and some 132 kV (interconnections at CDPs) transmission lines and grid stations in its network.
Besides NTDC, the other company which is engaged in electric power transmission business is K-Electric. K-Electric is a vertically integrated company operating in private sector since 2005. Earlier the company was in public sector and responsible for generation, transmission and distribution of electric power in its service area. The transmission network of K-Electric is connected to the national grid (NTDC system) by 220 kV and 132 kV links.
12.2 TRANSMISSION LINES AND GRID STATIONS WITH NTDCThe interconnected transmission system of NTDC comprises of 500 kV and 220 kV transmission lines and grid stations. The status of transmission lines and grid stations, at the end of fiscal years from 2013 to 2017, owned and operated by NTDC are mentioned in the following table:
TABLE 39Transmission Lines and Grid Stations with NTDC
A: Transmission LinesAs on 30th
June500 kV 220 kV Total Transmission Lines and No. of Circuits
No. of Circuits Total km No. of Circuits Total km No. of Circuits Total km2013 30 5,144 124 8,358 154 13,5022014 30 5,183 124 9,104 154 14,2872015 30 5,197 124 9,814 154 15,0112016 33 5,281 128 10,335 161 15,6162017 33 5,281 133 10,762 166 16,043
B: Grid Stations
As on 30th June
500/220 kV 220/132 kV Total No. of Grid Stations and MVA CapacityNo. of Grid
Station MVA Capacity No. of Grid Station MVA Capacity Total No. of Grid
StationTotal MVA Capacity
2013 12 15,750 29 18,231 41 33,9812014 13 17,400 35 21,030 48 38,4302015 13 17,400 36 24,040 49 41,4402016 14 18,624 36 24,040 50 42,6642017 14 18,624 38 25,660 52 44,284
Source: NTDC
12
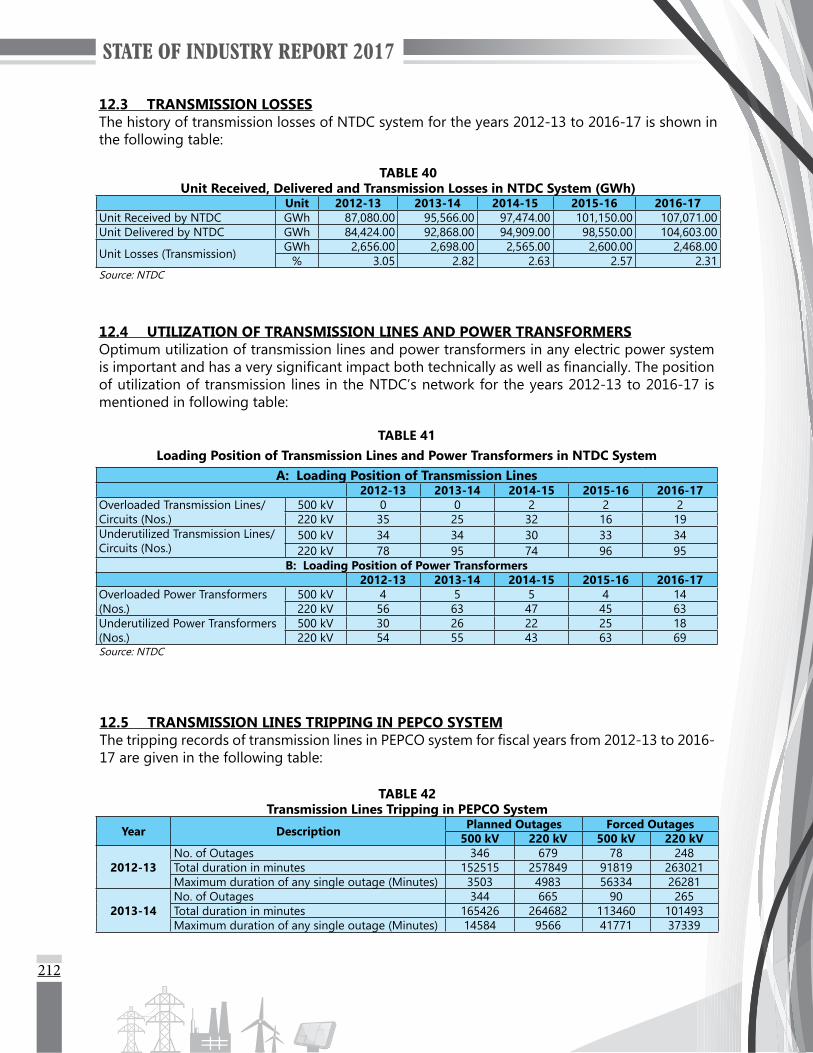
212
12.4 UTILIZATION OF TRANSMISSION LINES AND POWER TRANSFORMERSOptimum utilization of transmission lines and power transformers in any electric power system is important and has a very significant impact both technically as well as financially. The position of utilization of transmission lines in the NTDC’s network for the years 2012-13 to 2016-17 is mentioned in following table:
TABLE 41Loading Position of Transmission Lines and Power Transformers in NTDC System
A: Loading Position of Transmission Lines2012-13 2013-14 2014-15 2015-16 2016-17
Overloaded Transmission Lines/Circuits (Nos.)
500 kV 0 0 2 2 2220 kV 35 25 32 16 19
Underutilized Transmission Lines/Circuits (Nos.)
500 kV 34 34 30 33 34220 kV 78 95 74 96 95
B: Loading Position of Power Transformers2012-13 2013-14 2014-15 2015-16 2016-17
Overloaded Power Transformers (Nos.)
500 kV 4 5 5 4 14220 kV 56 63 47 45 63
Underutilized Power Transformers (Nos.)
500 kV 30 26 22 25 18220 kV 54 55 43 63 69
Source: NTDC
12.3 TRANSMISSION LOSSESThe history of transmission losses of NTDC system for the years 2012-13 to 2016-17 is shown in the following table:
TABLE 40Unit Received, Delivered and Transmission Losses in NTDC System (GWh)
Unit 2012-13 2013-14 2014-15 2015-16 2016-17Unit Received by NTDC GWh 87,080.00 95,566.00 97,474.00 101,150.00 107,071.00 Unit Delivered by NTDC GWh 84,424.00 92,868.00 94,909.00 98,550.00 104,603.00
Unit Losses (Transmission) GWh 2,656.00 2,698.00 2,565.00 2,600.00 2,468.00 % 3.05 2.82 2.63 2.57 2.31
Source: NTDC
12.5 TRANSMISSION LINES TRIPPING IN PEPCO SYSTEMThe tripping records of transmission lines in PEPCO system for fiscal years from 2012-13 to 2016-17 are given in the following table:
TABLE 42Transmission Lines Tripping in PEPCO System
Year Description Planned Outages Forced Outages500 kV 220 kV 500 kV 220 kV
2012-13No. of Outages 346 679 78 248Total duration in minutes 152515 257849 91819 263021Maximum duration of any single outage (Minutes) 3503 4983 56334 26281
2013-14No. of Outages 344 665 90 265Total duration in minutes 165426 264682 113460 101493Maximum duration of any single outage (Minutes) 14584 9566 41771 37339
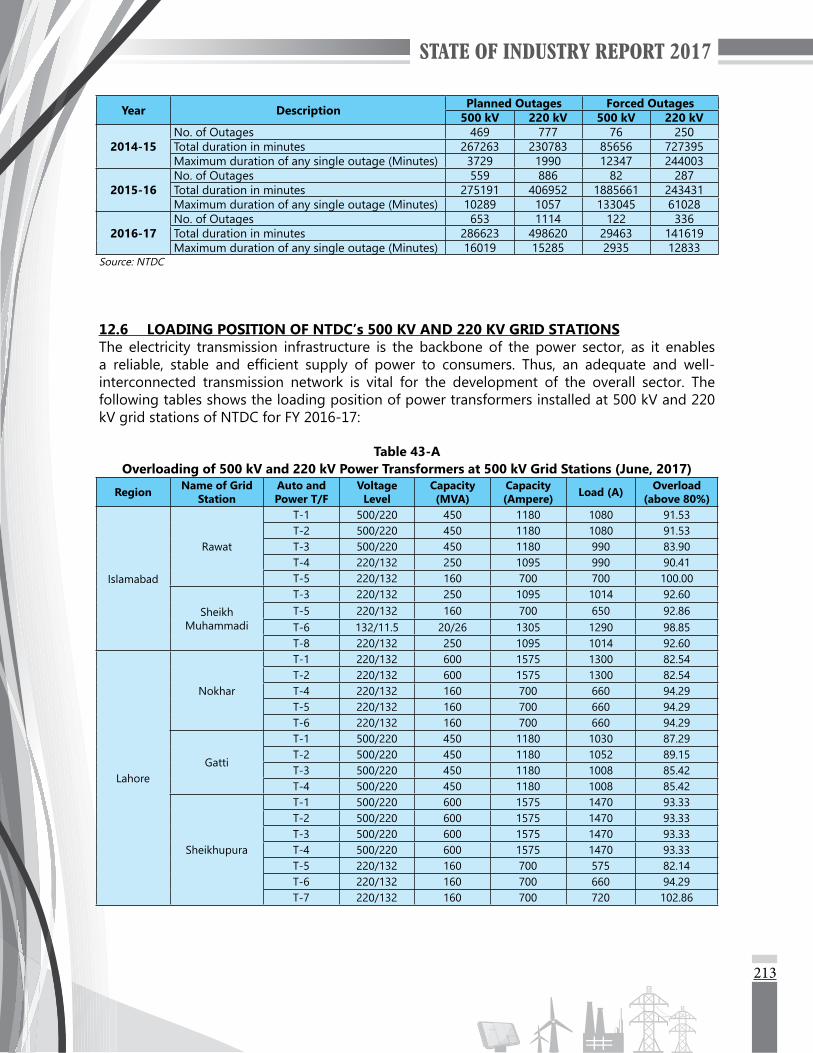
213
Year Description Planned Outages Forced Outages500 kV 220 kV 500 kV 220 kV
2014-15No. of Outages 469 777 76 250Total duration in minutes 267263 230783 85656 727395Maximum duration of any single outage (Minutes) 3729 1990 12347 244003
2015-16No. of Outages 559 886 82 287Total duration in minutes 275191 406952 1885661 243431Maximum duration of any single outage (Minutes) 10289 1057 133045 61028
2016-17No. of Outages 653 1114 122 336Total duration in minutes 286623 498620 29463 141619Maximum duration of any single outage (Minutes) 16019 15285 2935 12833
Source: NTDC
12.6 LOADING POSITION OF NTDC’s 500 KV AND 220 KV GRID STATIONSThe electricity transmission infrastructure is the backbone of the power sector, as it enables a reliable, stable and efficient supply of power to consumers. Thus, an adequate and well-interconnected transmission network is vital for the development of the overall sector. The following tables shows the loading position of power transformers installed at 500 kV and 220 kV grid stations of NTDC for FY 2016-17:
Table 43-AOverloading of 500 kV and 220 kV Power Transformers at 500 kV Grid Stations (June, 2017)
Region Name of Grid Station
Auto and Power T/F
Voltage Level
Capacity (MVA)
Capacity (Ampere) Load (A) Overload
(above 80%)
Islamabad
Rawat
T-1 500/220 450 1180 1080 91.53T-2 500/220 450 1180 1080 91.53T-3 500/220 450 1180 990 83.90T-4 220/132 250 1095 990 90.41T-5 220/132 160 700 700 100.00
Sheikh Muhammadi
T-3 220/132 250 1095 1014 92.60T-5 220/132 160 700 650 92.86T-6 132/11.5 20/26 1305 1290 98.85T-8 220/132 250 1095 1014 92.60
Lahore
Nokhar
T-1 220/132 600 1575 1300 82.54T-2 220/132 600 1575 1300 82.54T-4 220/132 160 700 660 94.29T-5 220/132 160 700 660 94.29T-6 220/132 160 700 660 94.29
Gatti
T-1 500/220 450 1180 1030 87.29T-2 500/220 450 1180 1052 89.15T-3 500/220 450 1180 1008 85.42T-4 500/220 450 1180 1008 85.42
Sheikhupura
T-1 500/220 600 1575 1470 93.33T-2 500/220 600 1575 1470 93.33T-3 500/220 600 1575 1470 93.33T-4 500/220 600 1575 1470 93.33T-5 220/132 160 700 575 82.14T-6 220/132 160 700 660 94.29T-7 220/132 160 700 720 102.86
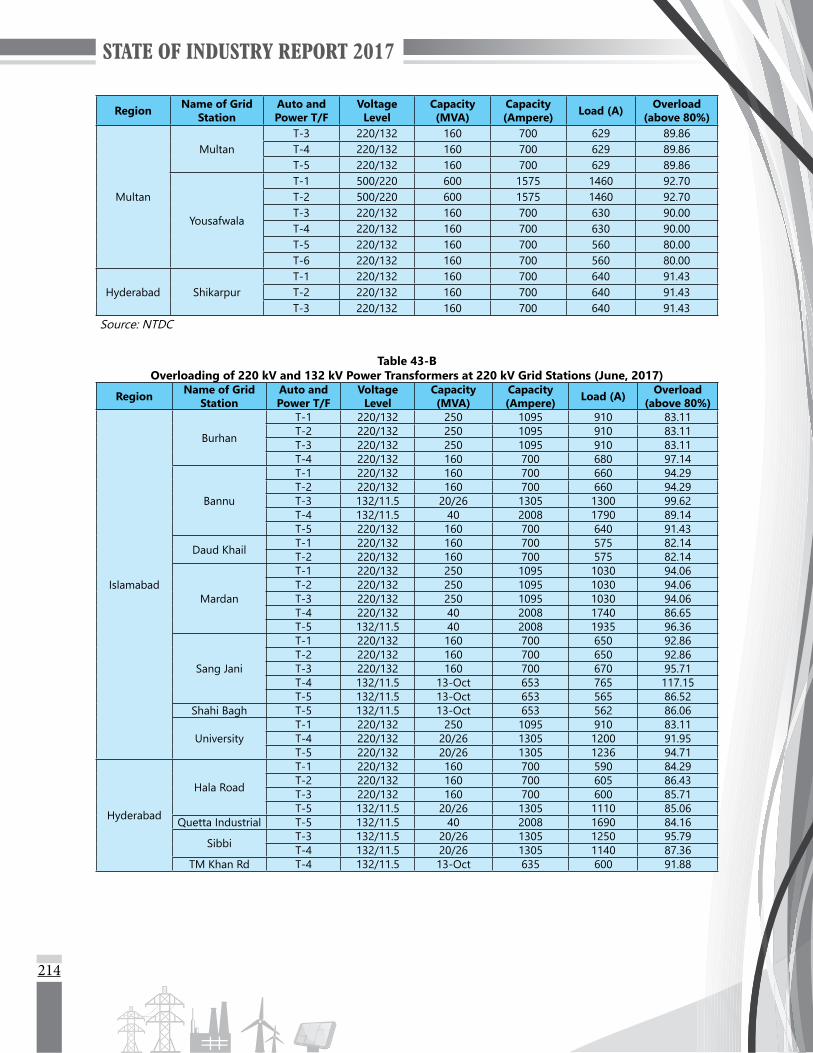
214
Region Name of Grid Station
Auto and Power T/F
Voltage Level
Capacity (MVA)
Capacity (Ampere) Load (A) Overload
(above 80%)
Multan
MultanT-3 220/132 160 700 629 89.86T-4 220/132 160 700 629 89.86T-5 220/132 160 700 629 89.86
Yousafwala
T-1 500/220 600 1575 1460 92.70T-2 500/220 600 1575 1460 92.70T-3 220/132 160 700 630 90.00T-4 220/132 160 700 630 90.00T-5 220/132 160 700 560 80.00T-6 220/132 160 700 560 80.00
Hyderabad ShikarpurT-1 220/132 160 700 640 91.43T-2 220/132 160 700 640 91.43T-3 220/132 160 700 640 91.43
Source: NTDC
Table 43-BOverloading of 220 kV and 132 kV Power Transformers at 220 kV Grid Stations (June, 2017)
Region Name of Grid Station
Auto and Power T/F
Voltage Level
Capacity (MVA)
Capacity (Ampere) Load (A) Overload
(above 80%)
Islamabad
Burhan
T-1 220/132 250 1095 910 83.11T-2 220/132 250 1095 910 83.11T-3 220/132 250 1095 910 83.11T-4 220/132 160 700 680 97.14
Bannu
T-1 220/132 160 700 660 94.29T-2 220/132 160 700 660 94.29T-3 132/11.5 20/26 1305 1300 99.62T-4 132/11.5 40 2008 1790 89.14T-5 220/132 160 700 640 91.43
Daud Khail T-1 220/132 160 700 575 82.14T-2 220/132 160 700 575 82.14
Mardan
T-1 220/132 250 1095 1030 94.06T-2 220/132 250 1095 1030 94.06T-3 220/132 250 1095 1030 94.06T-4 220/132 40 2008 1740 86.65T-5 132/11.5 40 2008 1935 96.36
Sang Jani
T-1 220/132 160 700 650 92.86T-2 220/132 160 700 650 92.86T-3 220/132 160 700 670 95.71T-4 132/11.5 13-Oct 653 765 117.15T-5 132/11.5 13-Oct 653 565 86.52
Shahi Bagh T-5 132/11.5 13-Oct 653 562 86.06
UniversityT-1 220/132 250 1095 910 83.11T-4 220/132 20/26 1305 1200 91.95T-5 220/132 20/26 1305 1236 94.71
Hyderabad
Hala Road
T-1 220/132 160 700 590 84.29T-2 220/132 160 700 605 86.43T-3 220/132 160 700 600 85.71T-5 132/11.5 20/26 1305 1110 85.06
Quetta Industrial T-5 132/11.5 40 2008 1690 84.16
Sibbi T-3 132/11.5 20/26 1305 1250 95.79T-4 132/11.5 20/26 1305 1140 87.36
TM Khan Rd T-4 132/11.5 13-Oct 635 600 91.88
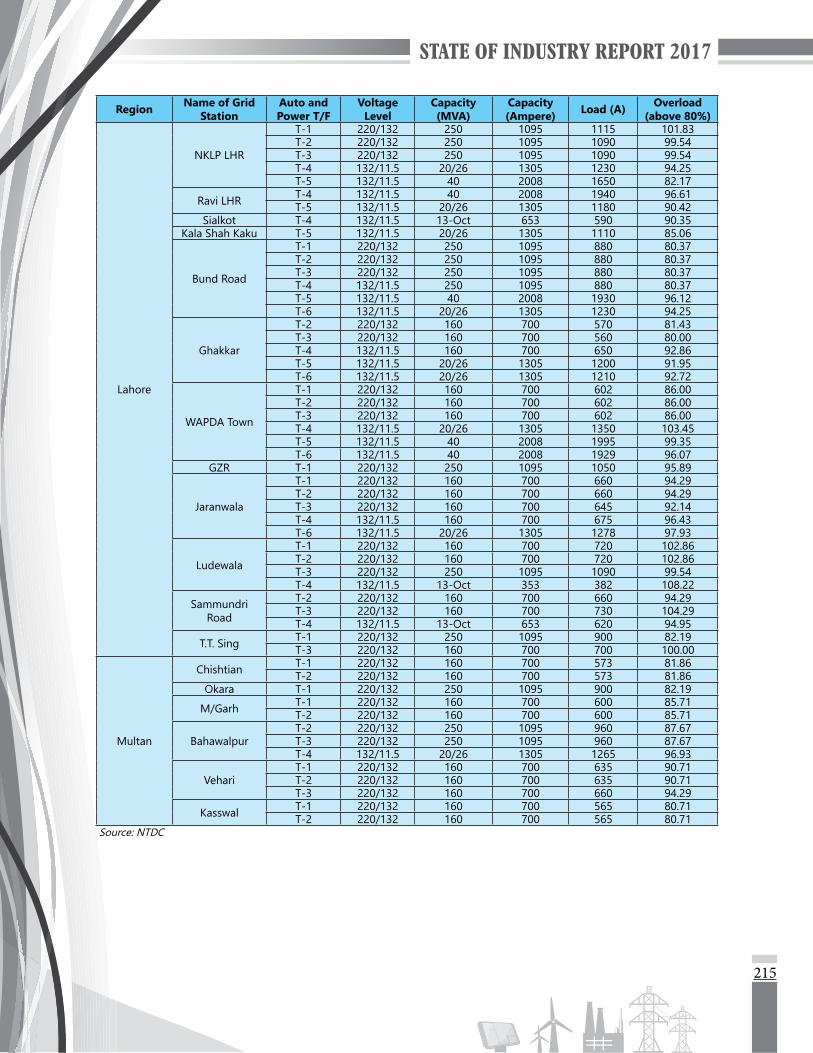
215
Region Name of Grid Station
Auto and Power T/F
Voltage Level
Capacity (MVA)
Capacity (Ampere) Load (A) Overload
(above 80%)
Lahore
NKLP LHR
T-1 220/132 250 1095 1115 101.83T-2 220/132 250 1095 1090 99.54T-3 220/132 250 1095 1090 99.54T-4 132/11.5 20/26 1305 1230 94.25T-5 132/11.5 40 2008 1650 82.17
Ravi LHR T-4 132/11.5 40 2008 1940 96.61T-5 132/11.5 20/26 1305 1180 90.42
Sialkot T-4 132/11.5 13-Oct 653 590 90.35Kala Shah Kaku T-5 132/11.5 20/26 1305 1110 85.06
Bund Road
T-1 220/132 250 1095 880 80.37T-2 220/132 250 1095 880 80.37T-3 220/132 250 1095 880 80.37T-4 132/11.5 250 1095 880 80.37T-5 132/11.5 40 2008 1930 96.12T-6 132/11.5 20/26 1305 1230 94.25
Ghakkar
T-2 220/132 160 700 570 81.43T-3 220/132 160 700 560 80.00T-4 132/11.5 160 700 650 92.86T-5 132/11.5 20/26 1305 1200 91.95T-6 132/11.5 20/26 1305 1210 92.72
WAPDA Town
T-1 220/132 160 700 602 86.00T-2 220/132 160 700 602 86.00T-3 220/132 160 700 602 86.00T-4 132/11.5 20/26 1305 1350 103.45T-5 132/11.5 40 2008 1995 99.35T-6 132/11.5 40 2008 1929 96.07
GZR T-1 220/132 250 1095 1050 95.89
Jaranwala
T-1 220/132 160 700 660 94.29T-2 220/132 160 700 660 94.29T-3 220/132 160 700 645 92.14T-4 132/11.5 160 700 675 96.43T-6 132/11.5 20/26 1305 1278 97.93
Ludewala
T-1 220/132 160 700 720 102.86T-2 220/132 160 700 720 102.86T-3 220/132 250 1095 1090 99.54T-4 132/11.5 13-Oct 353 382 108.22
Sammundri Road
T-2 220/132 160 700 660 94.29T-3 220/132 160 700 730 104.29T-4 132/11.5 13-Oct 653 620 94.95
T.T. Sing T-1 220/132 250 1095 900 82.19T-3 220/132 160 700 700 100.00
Multan
Chishtian T-1 220/132 160 700 573 81.86T-2 220/132 160 700 573 81.86
Okara T-1 220/132 250 1095 900 82.19
M/Garh T-1 220/132 160 700 600 85.71T-2 220/132 160 700 600 85.71
BahawalpurT-2 220/132 250 1095 960 87.67T-3 220/132 250 1095 960 87.67T-4 132/11.5 20/26 1305 1265 96.93
VehariT-1 220/132 160 700 635 90.71T-2 220/132 160 700 635 90.71T-3 220/132 160 700 660 94.29
Kasswal T-1 220/132 160 700 565 80.71T-2 220/132 160 700 565 80.71
Source: NTDC
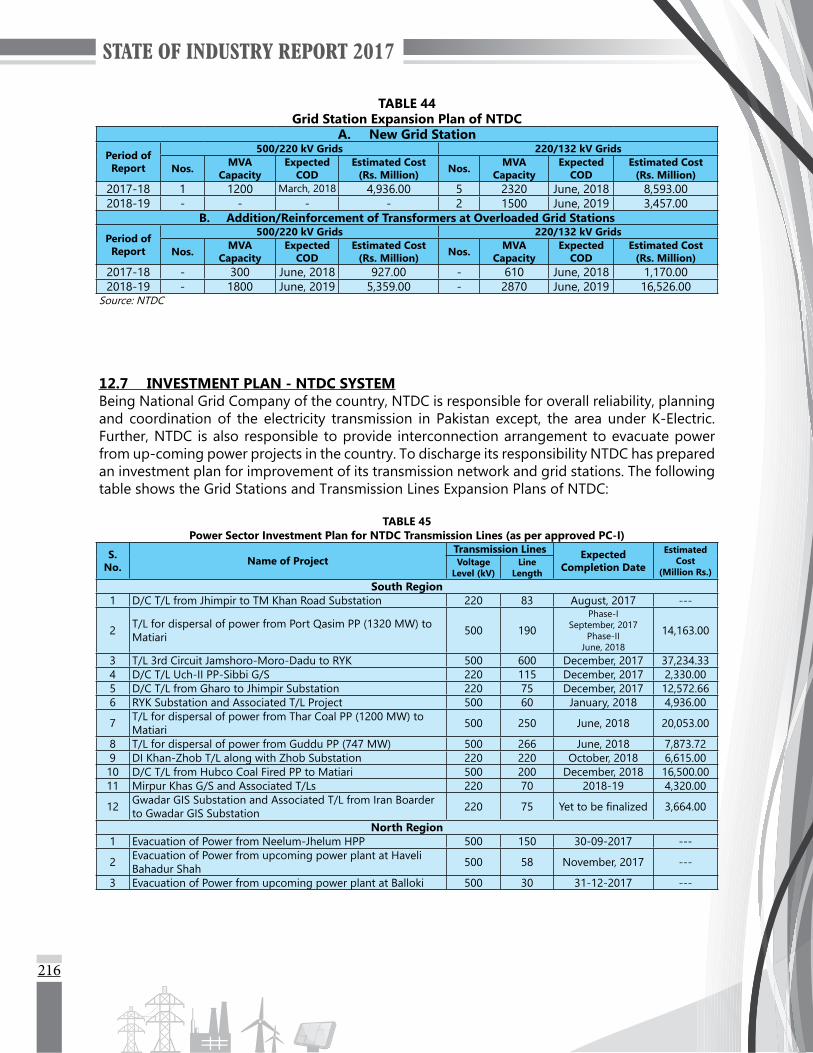
216
TABLE 44Grid Station Expansion Plan of NTDC
A. New Grid StationPeriod of Report
500/220 kV Grids 220/132 kV Grids
Nos. MVA Capacity
Expected COD
Estimated Cost (Rs. Million) Nos. MVA
CapacityExpected
CODEstimated Cost
(Rs. Million)2017-18 1 1200 March, 2018 4,936.00 5 2320 June, 2018 8,593.002018-19 - - - - 2 1500 June, 2019 3,457.00
B. Addition/Reinforcement of Transformers at Overloaded Grid Stations
Period of Report
500/220 kV Grids 220/132 kV Grids
Nos. MVA Capacity
Expected COD
Estimated Cost (Rs. Million) Nos. MVA
CapacityExpected
CODEstimated Cost
(Rs. Million)2017-18 - 300 June, 2018 927.00 - 610 June, 2018 1,170.002018-19 - 1800 June, 2019 5,359.00 - 2870 June, 2019 16,526.00
Source: NTDC
12.7 INVESTMENT PLAN - NTDC SYSTEMBeing National Grid Company of the country, NTDC is responsible for overall reliability, planning and coordination of the electricity transmission in Pakistan except, the area under K-Electric. Further, NTDC is also responsible to provide interconnection arrangement to evacuate power from up-coming power projects in the country. To discharge its responsibility NTDC has prepared an investment plan for improvement of its transmission network and grid stations. The following table shows the Grid Stations and Transmission Lines Expansion Plans of NTDC:
TABLE 45Power Sector Investment Plan for NTDC Transmission Lines (as per approved PC-I)
S. No. Name of Project
Transmission Lines Expected Completion Date
Estimated Cost
(Million Rs.)Voltage
Level (kV)Line
LengthSouth Region
1 D/C T/L from Jhimpir to TM Khan Road Substation 220 83 August, 2017 ---
2 T/L for dispersal of power from Port Qasim PP (1320 MW) to Matiari 500 190
Phase-I September, 2017
Phase-II June, 2018
14,163.00
3 T/L 3rd Circuit Jamshoro-Moro-Dadu to RYK 500 600 December, 2017 37,234.334 D/C T/L Uch-II PP-Sibbi G/S 220 115 December, 2017 2,330.005 D/C T/L from Gharo to Jhimpir Substation 220 75 December, 2017 12,572.666 RYK Substation and Associated T/L Project 500 60 January, 2018 4,936.00
7 T/L for dispersal of power from Thar Coal PP (1200 MW) to Matiari 500 250 June, 2018 20,053.00
8 T/L for dispersal of power from Guddu PP (747 MW) 500 266 June, 2018 7,873.729 DI Khan-Zhob T/L along with Zhob Substation 220 220 October, 2018 6,615.0010 D/C T/L from Hubco Coal Fired PP to Matiari 500 200 December, 2018 16,500.0011 Mirpur Khas G/S and Associated T/Ls 220 70 2018-19 4,320.00
12 Gwadar GIS Substation and Associated T/L from Iran Boarder to Gwadar GIS Substation 220 75 Yet to be finalized 3,664.00
North Region1 Evacuation of Power from Neelum-Jhelum HPP 500 150 30-09-2017 ---
2 Evacuation of Power from upcoming power plant at Haveli Bahadur Shah 500 58 November, 2017 ---
3 Evacuation of Power from upcoming power plant at Balloki 500 30 31-12-2017 ---

217
S. No. Name of Project
Transmission Lines Expected Completion Date
Estimated Cost
(Million Rs.)Voltage
Level (kV)Line
Length
4 550/220 kV T/L for 500 kV New Lahore and 220 kV Gujrat G/S 500 kV and 220 kV
66 (500 kV) 87 (220
kV)30-12-2017 12,524.00
5 220 kV T/L from Chakdara to Mardan 220 85 31-03-2018 3,230.00
6 220 kV D/C T/L on Twin Bundle Rail Conductor for looping, in/out of Chashma Nuclear-Ludewala 220 kV S/C at DI Khan New 220 100 31-03-2018 3,744.00
7 500/220 kV T/L for 500 kV Faisalabad West G/S 500/220 kV 120 2017-18 11,076.00Source: NTDC
TABLE 46Interconnection Arrangement to Evacuate Power from up-coming
(Public and Private Sector) Power Projects
S. No. Name of Power Project
Plant Capacity
(MW)
Expected COD Proposed Transmission Scheme
South Region1 Hawa Energy (Pvt.) Limited 49.74 15-01-2018
132 kV D/C T/L from Hawa, TGS, TGT and Jhimpir Wind Power Plants to 220 kV Jhimpir G/S (25 km)
2 Jhimpir Wind Power (Pvt.) Limited 49.74 15-01-20183 Three Gorges Second Wind Farm Pakistan Limited 49.50 10-06-20184 Three Gorges Third Wind Farm Pakistan Limited 49.50 10-06-2018
5 Hartford Alternative Energy (Pvt.) Limited 49.50 31-03-2018 132 kV D/C T/L In & Out from Tapal - Master T/L for Hartford (1 km)
6 Tricon Boston Consulting Corporation (Pvt.) Limited (A) 49.74 30-09-2018 132 kV D/C T/L from Tricon Boston
(A) & (B) to Jhimpir G/S (17 km)7 Tricon Boston Consulting Corporation (Pvt.) Limited (B) 49.74 30-09-2018
8 Tricon Boston Consulting Corporation (Pvt.) Limited (C) 49.74 30-09-2018 132 kV D/C T/L from Tricon Boston
(C) to Jhimpir G/S (14 km)
9 Zephyr Power (Pvt.) Limited 49.50 10-11-2018 132 kV D/C T/L In & Out from Thatta - Hydrochina T/L for Zephyr (4.5 km)
North Region
1 Neelum-Jhelum Hydropower Project 969.00 P-1: Commissioned P-2: December, 2018
2 RLNG Power Plant at Haveli Bahadur Shah 1200.00 31-02-20183 Imported CFPP at Sahiwal (Addition of ATB) 1320.00 ATB: August, 2018
4 RLNG Power Plant at Balloki (Addition of ATB) 1200.00 TL: 31-03-2018 ATB: August, 2018
5 Quaid-e-Azam Solar Park at Lal Suhanra 1000.00 20-02-20186 Patrind Hydropower Project (Phase-II) 147.00 April, 2018
7
Reinforcement in Islamabad and Burhan Area for Tarbela 4th Extension
30-06-2018Replacement of exiting 220 kV Tarbela-Burhan D/C T/L (35 km)Replacement of exiting 220 kV Tarbela-Burhan D/C T/L (62.5 km)
8 Evacuation of Power from RLNG Power Plant at Trimmu 1230.00 2018-19
Source: NTDC
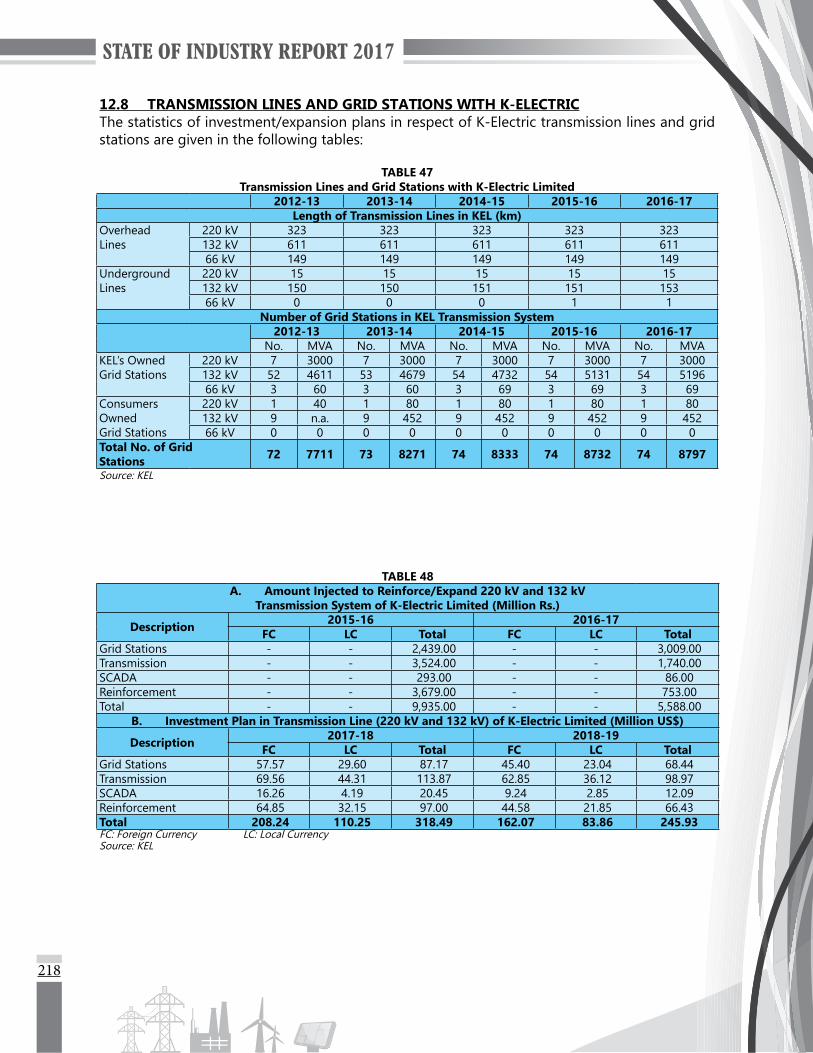
218
12.8 TRANSMISSION LINES AND GRID STATIONS WITH K-ELECTRICThe statistics of investment/expansion plans in respect of K-Electric transmission lines and grid stations are given in the following tables:
TABLE 47Transmission Lines and Grid Stations with K-Electric Limited
2012-13 2013-14 2014-15 2015-16 2016-17Length of Transmission Lines in KEL (km)
Overhead Lines
220 kV 323 323 323 323 323132 kV 611 611 611 611 61166 kV 149 149 149 149 149
Underground Lines
220 kV 15 15 15 15 15132 kV 150 150 151 151 15366 kV 0 0 0 1 1
Number of Grid Stations in KEL Transmission System2012-13 2013-14 2014-15 2015-16 2016-17
No. MVA No. MVA No. MVA No. MVA No. MVAKEL’s Owned Grid Stations
220 kV 7 3000 7 3000 7 3000 7 3000 7 3000132 kV 52 4611 53 4679 54 4732 54 5131 54 519666 kV 3 60 3 60 3 69 3 69 3 69
Consumers Owned Grid Stations
220 kV 1 40 1 80 1 80 1 80 1 80132 kV 9 n.a. 9 452 9 452 9 452 9 45266 kV 0 0 0 0 0 0 0 0 0 0
Total No. of Grid Stations 72 7711 73 8271 74 8333 74 8732 74 8797
Source: KEL
TABLE 48A. Amount Injected to Reinforce/Expand 220 kV and 132 kV
Transmission System of K-Electric Limited (Million Rs.)
Description 2015-16 2016-17FC LC Total FC LC Total
Grid Stations - - 2,439.00 - - 3,009.00 Transmission - - 3,524.00 - - 1,740.00 SCADA - - 293.00 - - 86.00 Reinforcement - - 3,679.00 - - 753.00 Total - - 9,935.00 - - 5,588.00
B. Investment Plan in Transmission Line (220 kV and 132 kV) of K-Electric Limited (Million US$)
Description 2017-18 2018-19FC LC Total FC LC Total
Grid Stations 57.57 29.60 87.17 45.40 23.04 68.44 Transmission 69.56 44.31 113.87 62.85 36.12 98.97 SCADA 16.26 4.19 20.45 9.24 2.85 12.09 Reinforcement 64.85 32.15 97.00 44.58 21.85 66.43 Total 208.24 110.25 318.49 162.07 83.86 245.93 FC: Foreign Currency LC: Local CurrencySource: KEL
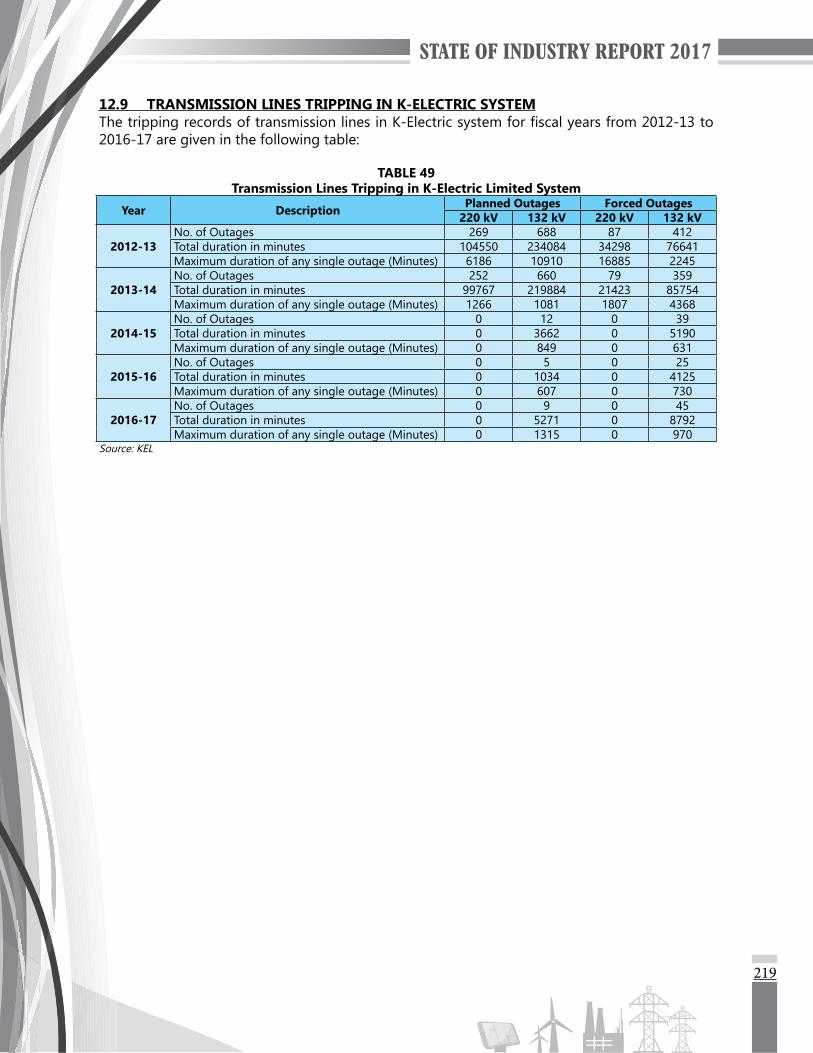
219
12.9 TRANSMISSION LINES TRIPPING IN K-ELECTRIC SYSTEMThe tripping records of transmission lines in K-Electric system for fiscal years from 2012-13 to 2016-17 are given in the following table:
TABLE 49Transmission Lines Tripping in K-Electric Limited System
Year Description Planned Outages Forced Outages220 kV 132 kV 220 kV 132 kV
2012-13No. of Outages 269 688 87 412Total duration in minutes 104550 234084 34298 76641Maximum duration of any single outage (Minutes) 6186 10910 16885 2245
2013-14No. of Outages 252 660 79 359Total duration in minutes 99767 219884 21423 85754Maximum duration of any single outage (Minutes) 1266 1081 1807 4368
2014-15No. of Outages 0 12 0 39Total duration in minutes 0 3662 0 5190Maximum duration of any single outage (Minutes) 0 849 0 631
2015-16No. of Outages 0 5 0 25Total duration in minutes 0 1034 0 4125Maximum duration of any single outage (Minutes) 0 607 0 730
2016-17No. of Outages 0 9 0 45Total duration in minutes 0 5271 0 8792Maximum duration of any single outage (Minutes) 0 1315 0 970
Source: KEL

STATE OF INDUSTRY REPORT 2017
ELECTRICITY DISTRIBUTION


223
ELECTRICITY DISTRIBUTION
13.1 GENERALPresently there are ten distribution companies in public sector, which are distributing electric power to end-consumers in Pakistan except the area served by K-Electric. In the area of Karachi city and its suburbs, K-Electric is solely responsible for distribution of electric power to end-consumers under a separate distribution licence granted by NEPRA. In addition to ten public sector Distribution Companies, one private sector Distribution Company i.e. K-Electric and two distribution licenses to Housing Colonies, NEPRA has granted nine distribution licenses to Small Power Producers and one distribution licence to Captive Power Producer for supply of electric power to designated BPCs.
TABLE 50List of Licenses Issued to Distribution Companies
S. No. Name of Company
Number of Consumers (as on 30th June,
2017)
Date of Licence Issued
Licence Valid Until
Distribution Companies working in Public Sector1 Peshawar Electric Supply Company Limited, Peshawar, KPK 3,184,576 30-04-2002 29-04-20222 Tribal Areas Electricity Supply Company Limited, Peshawar, KPK 441,941 12-08-2013 11-08-20333 Islamabad Electric Supply Company Limited, Islamabad 2,672,682 02-11-2001 01-11-20214 Gujranwala Electric Power Company Limited, Gujranwala, Punjab 3,172,969 23-04-2002 22-04-20225 Lahore Electric Supply Company Limited, Lahore, Punjab 4,277,961 01-04-2002 31-03-20226 Faisalabad Electric Supply Company Limited, Faisalabad, Punjab 3,740,906 02-03-2002 01-03-20227 Multan Electric Power Company Limited, Multan, Punjab 5,701,390 25-04-2002 24-04-20228 Hyderabad Electric Supply Company Limited, Hyderabad, Sindh 1,050,956 23-04-2002 22-04-20229 Sukkur Electric Supply Company Limited, Sukkur, Sindh 736,868 18-08-2011 17-08-203110 Quetta Electric Supply Company Limited, Quetta, Balochistan 591,552 30-04-2002 29-04-2022
Distribution Companies working in Private Sector1 K-Electric Limited, Karachi, Sindh 2,425,998 21-07-2003 20-07-2023
Distribution Licence Granted to Housing Colonies1 Bahria Town (Pvt.) Limited (Rawalpindi/Islamabad) 23,162 24-11-2010 23-11-2030
2 Defence Housing Authority, Phase XII (EME Sector), Lahore, Punjab
26-12-2016 25-12-2036
Distribution Licence Granted to Small Power Producers1 Monnoo Energy Limited, Sheikhupura, Punjab 3 20-10-2006 31-12-20312 Sapphire Power Generation Limited, Sheikhupura, Punjab 7 20-10-2006 12-07-2040
3 Sitara Energy Limited, Faisalabad, Punjab 29 20-10-2006 LPM in Process
4 Gulistan Power Gen. Limited, Sheikhupura, Punjab 4 20-10-2006 15-11-20165 Mahmood Textile Mills Limited, Muzaffargarh, Punjab 1 14-11-2006 21-10-20166 Kohinoor Mills Limited, Kasur, Punjab 1 14-11-2006 07-12-20167 Quetta Textile Mills Limited, Kotri, Sindh 3 14-11-2006 30-01-20378 Ibrahim Fibres (Pvt.) Limited, Faisalabad, Punjab 3 22-07-2008 30-12-20219 Crescent Powertec Limited, Sheikhupura, Punjab 3 18-12-2008 21-10-2016
Distribution Licence Granted to Captive Power Producers1 Engro Chemical Pakistan Limited, Ghotki, Sindh Self Consumption 22-07-2009 21-07-2029
Source: National Electric Power Regulatory Authority
13
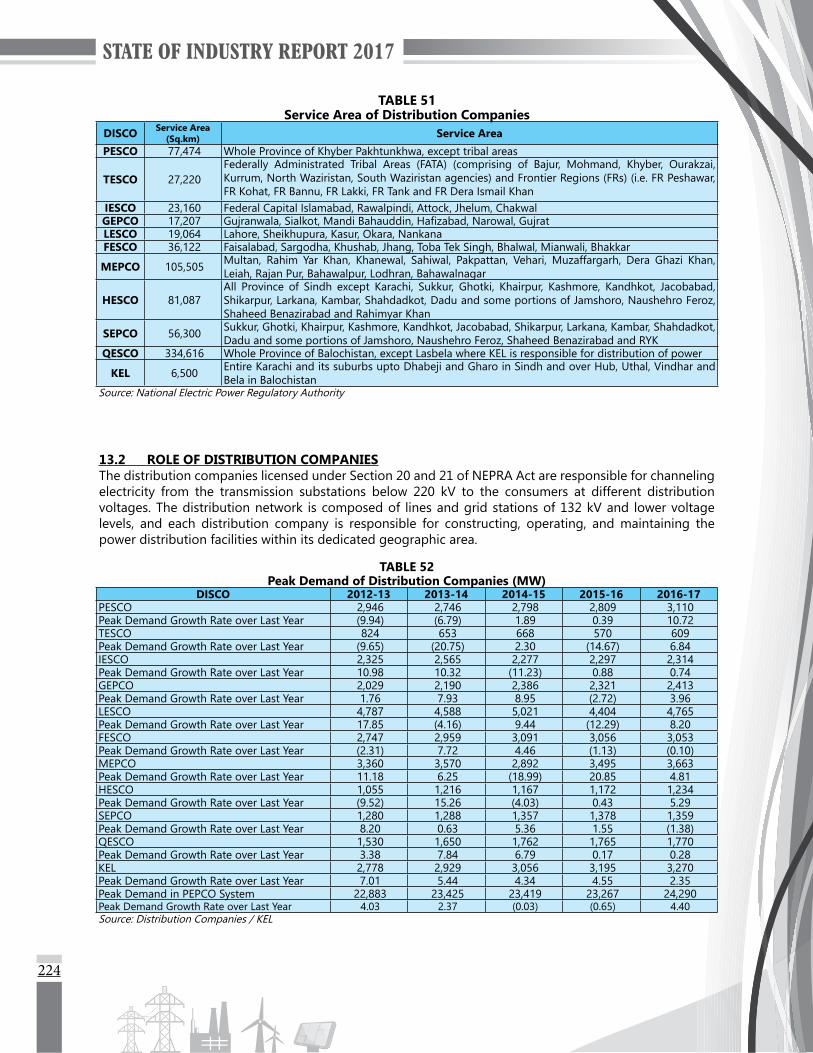
224
TABLE 51Service Area of Distribution Companies
DISCO Service Area(Sq.km) Service Area
PESCO 77,474 Whole Province of Khyber Pakhtunkhwa, except tribal areas
TESCO 27,220 Federally Administrated Tribal Areas (FATA) (comprising of Bajur, Mohmand, Khyber, Ourakzai, Kurrum, North Waziristan, South Waziristan agencies) and Frontier Regions (FRs) (i.e. FR Peshawar, FR Kohat, FR Bannu, FR Lakki, FR Tank and FR Dera Ismail Khan
IESCO 23,160 Federal Capital Islamabad, Rawalpindi, Attock, Jhelum, ChakwalGEPCO 17,207 Gujranwala, Sialkot, Mandi Bahauddin, Hafizabad, Narowal, GujratLESCO 19,064 Lahore, Sheikhupura, Kasur, Okara, NankanaFESCO 36,122 Faisalabad, Sargodha, Khushab, Jhang, Toba Tek Singh, Bhalwal, Mianwali, Bhakkar
MEPCO 105,505 Multan, Rahim Yar Khan, Khanewal, Sahiwal, Pakpattan, Vehari, Muzaffargarh, Dera Ghazi Khan, Leiah, Rajan Pur, Bahawalpur, Lodhran, Bahawalnagar
HESCO 81,087 All Province of Sindh except Karachi, Sukkur, Ghotki, Khairpur, Kashmore, Kandhkot, Jacobabad, Shikarpur, Larkana, Kambar, Shahdadkot, Dadu and some portions of Jamshoro, Naushehro Feroz, Shaheed Benazirabad and Rahimyar Khan
SEPCO 56,300 Sukkur, Ghotki, Khairpur, Kashmore, Kandhkot, Jacobabad, Shikarpur, Larkana, Kambar, Shahdadkot, Dadu and some portions of Jamshoro, Naushehro Feroz, Shaheed Benazirabad and RYK
QESCO 334,616 Whole Province of Balochistan, except Lasbela where KEL is responsible for distribution of power
KEL 6,500 Entire Karachi and its suburbs upto Dhabeji and Gharo in Sindh and over Hub, Uthal, Vindhar and Bela in Balochistan
Source: National Electric Power Regulatory Authority
13.2 ROLE OF DISTRIBUTION COMPANIESThe distribution companies licensed under Section 20 and 21 of NEPRA Act are responsible for channeling electricity from the transmission substations below 220 kV to the consumers at different distribution voltages. The distribution network is composed of lines and grid stations of 132 kV and lower voltage levels, and each distribution company is responsible for constructing, operating, and maintaining the power distribution facilities within its dedicated geographic area.
TABLE 52Peak Demand of Distribution Companies (MW)
DISCO 2012-13 2013-14 2014-15 2015-16 2016-17PESCO 2,946 2,746 2,798 2,809 3,110 Peak Demand Growth Rate over Last Year (9.94) (6.79) 1.89 0.39 10.72 TESCO 824 653 668 570 609 Peak Demand Growth Rate over Last Year (9.65) (20.75) 2.30 (14.67) 6.84 IESCO 2,325 2,565 2,277 2,297 2,314 Peak Demand Growth Rate over Last Year 10.98 10.32 (11.23) 0.88 0.74 GEPCO 2,029 2,190 2,386 2,321 2,413 Peak Demand Growth Rate over Last Year 1.76 7.93 8.95 (2.72) 3.96 LESCO 4,787 4,588 5,021 4,404 4,765 Peak Demand Growth Rate over Last Year 17.85 (4.16) 9.44 (12.29) 8.20 FESCO 2,747 2,959 3,091 3,056 3,053 Peak Demand Growth Rate over Last Year (2.31) 7.72 4.46 (1.13) (0.10)MEPCO 3,360 3,570 2,892 3,495 3,663 Peak Demand Growth Rate over Last Year 11.18 6.25 (18.99) 20.85 4.81 HESCO 1,055 1,216 1,167 1,172 1,234 Peak Demand Growth Rate over Last Year (9.52) 15.26 (4.03) 0.43 5.29 SEPCO 1,280 1,288 1,357 1,378 1,359 Peak Demand Growth Rate over Last Year 8.20 0.63 5.36 1.55 (1.38)QESCO 1,530 1,650 1,762 1,765 1,770 Peak Demand Growth Rate over Last Year 3.38 7.84 6.79 0.17 0.28 KEL 2,778 2,929 3,056 3,195 3,270 Peak Demand Growth Rate over Last Year 7.01 5.44 4.34 4.55 2.35 Peak Demand in PEPCO System 22,883 23,425 23,419 23,267 24,290 Peak Demand Growth Rate over Last Year 4.03 2.37 (0.03) (0.65) 4.40 Source: Distribution Companies / KEL
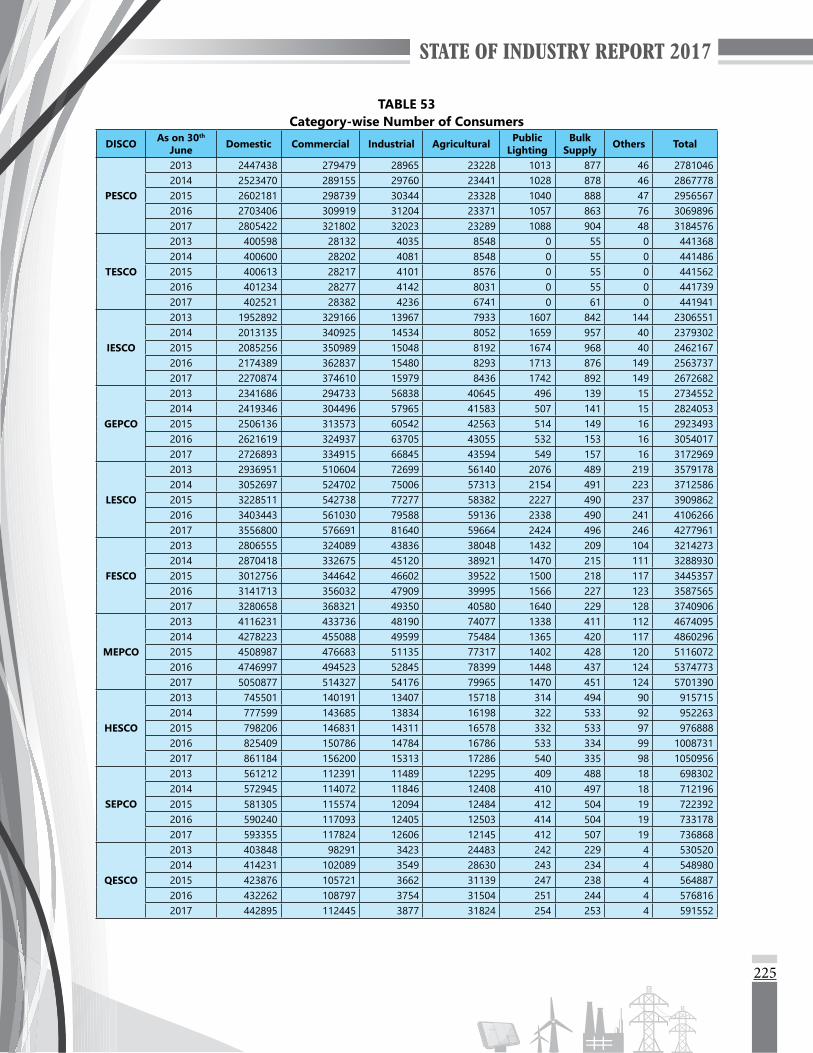
225
TABLE 53Category-wise Number of Consumers
DISCO As on 30th June Domestic Commercial Industrial Agricultural Public
LightingBulk
Supply Others Total
PESCO
2013 2447438 279479 28965 23228 1013 877 46 27810462014 2523470 289155 29760 23441 1028 878 46 28677782015 2602181 298739 30344 23328 1040 888 47 29565672016 2703406 309919 31204 23371 1057 863 76 30698962017 2805422 321802 32023 23289 1088 904 48 3184576
TESCO
2013 400598 28132 4035 8548 0 55 0 4413682014 400600 28202 4081 8548 0 55 0 4414862015 400613 28217 4101 8576 0 55 0 4415622016 401234 28277 4142 8031 0 55 0 4417392017 402521 28382 4236 6741 0 61 0 441941
IESCO
2013 1952892 329166 13967 7933 1607 842 144 23065512014 2013135 340925 14534 8052 1659 957 40 23793022015 2085256 350989 15048 8192 1674 968 40 24621672016 2174389 362837 15480 8293 1713 876 149 25637372017 2270874 374610 15979 8436 1742 892 149 2672682
GEPCO
2013 2341686 294733 56838 40645 496 139 15 27345522014 2419346 304496 57965 41583 507 141 15 28240532015 2506136 313573 60542 42563 514 149 16 29234932016 2621619 324937 63705 43055 532 153 16 30540172017 2726893 334915 66845 43594 549 157 16 3172969
LESCO
2013 2936951 510604 72699 56140 2076 489 219 35791782014 3052697 524702 75006 57313 2154 491 223 37125862015 3228511 542738 77277 58382 2227 490 237 39098622016 3403443 561030 79588 59136 2338 490 241 41062662017 3556800 576691 81640 59664 2424 496 246 4277961
FESCO
2013 2806555 324089 43836 38048 1432 209 104 32142732014 2870418 332675 45120 38921 1470 215 111 32889302015 3012756 344642 46602 39522 1500 218 117 34453572016 3141713 356032 47909 39995 1566 227 123 35875652017 3280658 368321 49350 40580 1640 229 128 3740906
MEPCO
2013 4116231 433736 48190 74077 1338 411 112 46740952014 4278223 455088 49599 75484 1365 420 117 48602962015 4508987 476683 51135 77317 1402 428 120 51160722016 4746997 494523 52845 78399 1448 437 124 53747732017 5050877 514327 54176 79965 1470 451 124 5701390
HESCO
2013 745501 140191 13407 15718 314 494 90 9157152014 777599 143685 13834 16198 322 533 92 9522632015 798206 146831 14311 16578 332 533 97 9768882016 825409 150786 14784 16786 533 334 99 10087312017 861184 156200 15313 17286 540 335 98 1050956
SEPCO
2013 561212 112391 11489 12295 409 488 18 6983022014 572945 114072 11846 12408 410 497 18 7121962015 581305 115574 12094 12484 412 504 19 7223922016 590240 117093 12405 12503 414 504 19 7331782017 593355 117824 12606 12145 412 507 19 736868
QESCO
2013 403848 98291 3423 24483 242 229 4 5305202014 414231 102089 3549 28630 243 234 4 5489802015 423876 105721 3662 31139 247 238 4 5648872016 432262 108797 3754 31504 251 244 4 5768162017 442895 112445 3877 31824 254 253 4 591552
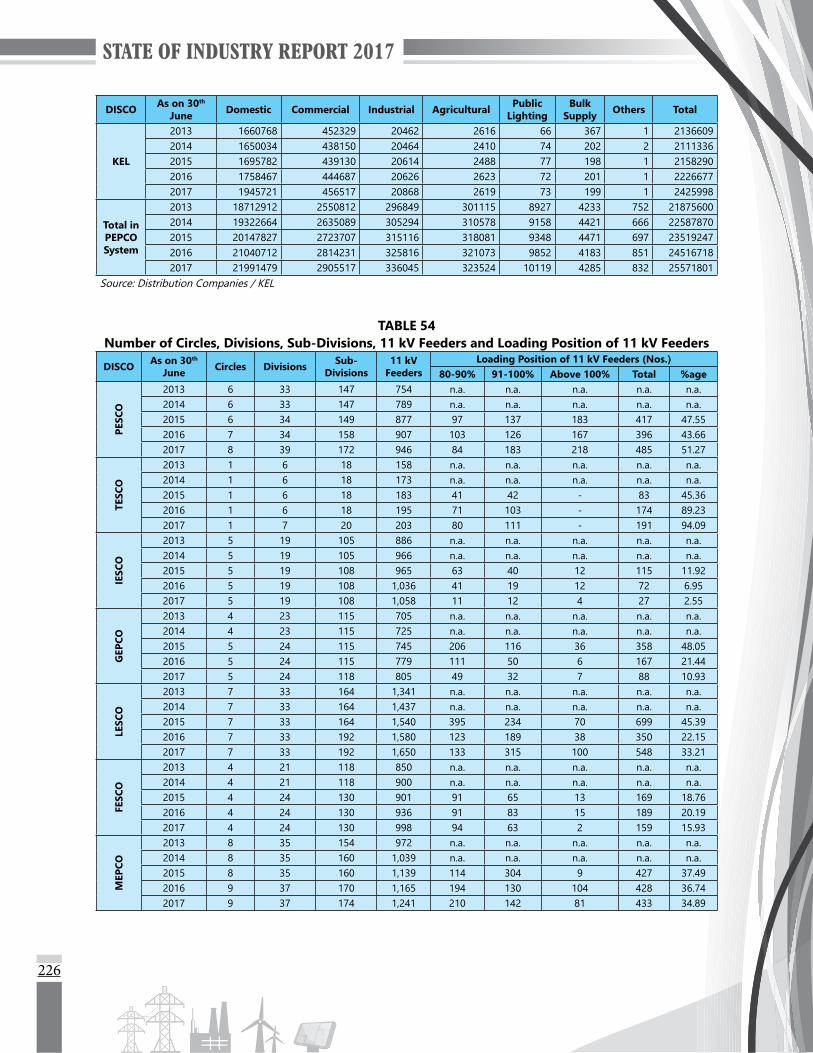
226
DISCO As on 30th
June Domestic Commercial Industrial Agricultural Public Lighting
Bulk Supply Others Total
KEL
2013 1660768 452329 20462 2616 66 367 1 21366092014 1650034 438150 20464 2410 74 202 2 21113362015 1695782 439130 20614 2488 77 198 1 21582902016 1758467 444687 20626 2623 72 201 1 22266772017 1945721 456517 20868 2619 73 199 1 2425998
Total in PEPCO System
2013 18712912 2550812 296849 301115 8927 4233 752 218756002014 19322664 2635089 305294 310578 9158 4421 666 225878702015 20147827 2723707 315116 318081 9348 4471 697 235192472016 21040712 2814231 325816 321073 9852 4183 851 245167182017 21991479 2905517 336045 323524 10119 4285 832 25571801
Source: Distribution Companies / KEL
TABLE 54Number of Circles, Divisions, Sub-Divisions, 11 kV Feeders and Loading Position of 11 kV Feeders
DISCO As on 30th June Circles Divisions Sub-
Divisions11 kV
FeedersLoading Position of 11 kV Feeders (Nos.)
80-90% 91-100% Above 100% Total %age
PESC
O
2013 6 33 147 754 n.a. n.a. n.a. n.a. n.a.2014 6 33 147 789 n.a. n.a. n.a. n.a. n.a.2015 6 34 149 877 97 137 183 417 47.552016 7 34 158 907 103 126 167 396 43.662017 8 39 172 946 84 183 218 485 51.27
TESC
O
2013 1 6 18 158 n.a. n.a. n.a. n.a. n.a.2014 1 6 18 173 n.a. n.a. n.a. n.a. n.a.2015 1 6 18 183 41 42 - 83 45.362016 1 6 18 195 71 103 - 174 89.232017 1 7 20 203 80 111 - 191 94.09
IESC
O
2013 5 19 105 886 n.a. n.a. n.a. n.a. n.a.2014 5 19 105 966 n.a. n.a. n.a. n.a. n.a.2015 5 19 108 965 63 40 12 115 11.922016 5 19 108 1,036 41 19 12 72 6.952017 5 19 108 1,058 11 12 4 27 2.55
GEP
CO
2013 4 23 115 705 n.a. n.a. n.a. n.a. n.a.2014 4 23 115 725 n.a. n.a. n.a. n.a. n.a.2015 5 24 115 745 206 116 36 358 48.052016 5 24 115 779 111 50 6 167 21.442017 5 24 118 805 49 32 7 88 10.93
LESC
O
2013 7 33 164 1,341 n.a. n.a. n.a. n.a. n.a.2014 7 33 164 1,437 n.a. n.a. n.a. n.a. n.a.2015 7 33 164 1,540 395 234 70 699 45.392016 7 33 192 1,580 123 189 38 350 22.152017 7 33 192 1,650 133 315 100 548 33.21
FESC
O
2013 4 21 118 850 n.a. n.a. n.a. n.a. n.a.2014 4 21 118 900 n.a. n.a. n.a. n.a. n.a.2015 4 24 130 901 91 65 13 169 18.762016 4 24 130 936 91 83 15 189 20.192017 4 24 130 998 94 63 2 159 15.93
MEP
CO
2013 8 35 154 972 n.a. n.a. n.a. n.a. n.a.2014 8 35 160 1,039 n.a. n.a. n.a. n.a. n.a.2015 8 35 160 1,139 114 304 9 427 37.492016 9 37 170 1,165 194 130 104 428 36.742017 9 37 174 1,241 210 142 81 433 34.89

227
DISCO As on 30th June Circles Divisions Sub-
Divisions11 kV
FeedersLoading Position of 11 kV Feeders (Nos.)
80-90% 91-100% Above 100% Total %ageH
ESCO
2013 3 14 62 442 n.a. n.a. n.a. n.a. n.a.2014 3 14 62 410* n.a. n.a. n.a. n.a. n.a.2015 4 15 67 425 15 47 24 86 20.242016 4 15 67 435 21 61 21 103 23.682017 4 15 68 463 33 54 34 121 26.13
SEPC
O
2013 3 13 55 398 n.a. n.a. n.a. n.a. n.a.2014 3 13 55 413 n.a. n.a. n.a. n.a. n.a.2015 7 29 96 433 73 51 76 200 46.192016 7 29 96 453 64 46 69 179 39.512017 7 29 96 462 47 41 79 167 36.15
QES
CO
2013 4 12 43 551 n.a. n.a. n.a. n.a. n.a.2014 4 13 44 550 n.a. n.a. n.a. n.a. n.a.2015 4 14 46 570 23 17 45 85 14.912016 6 14 54 613 47 67 107 221 36.052017 6 14 55 628 51 71 111 233 37.10
Tota
l in
PEPC
O S
ys-
tem
2013 45 209 981 7,057 n.a. n.a. n.a. n.a. n.a.2014 45 210 988 7,402 n.a. n.a. n.a. n.a. n.a.2015 51 233 1,053 7,778 1,118 1,053 468 2,639 33.932016 55 235 1,108 8,099 866 874 539 2,279 28.142017 56 241 1,133 8,454 792 1,024 636 2,452 29.00
KEL
As on 30th June IBCs VIBCs 11 kV
FeedersLoading Position of 11 kV Feeders (Nos.)
%age80-90% 91-100% Above 100% Total
2013 17 11 1,321 n.a. n.a. n.a. n.a. n.a. 2014 28 0 1,375 n.a. n.a. n.a. n.a. n.a. 2015 28 0 1,431 156 69 40 265 18.522016 29 0 1,524 76 20 8 104 6.822017 29 0 1,653 70 15 6 91 5.51
* 32 feeders dismantled due to flood and cyclonic effects.Source: Distribution Companies / KEL
TABLE 55Category-wise Sanctioned Load (MW)
DIS
CO As on 30th June Domestic Commercial Industrial Agricultural Public
Lighting Bulk Supply Others Total
PESC
O
2013 3119.19 601.13 1208.81 169.13 58.73 227.72 3.87 5388.582014 3270.83 630.37 1278.28 169.63 58.93 229.90 3.87 5641.812015 3427.01 658.62 1327.97 169.88 55.11 244.47 3.88 5886.942016 3649.69 690.88 1377.96 170.92 52.78 198.62 55.07 6195.922017 3870.45 726.79 1460.72 169.04 52.90 256.27 3.62 6539.79
TESC
O
2013 754.00 34.00 81.00 92.00 0.00 4.00 0.00 965.002014 754.00 35.00 86.00 92.00 0.00 4.00 0.00 971.002015 754.00 35.00 96.00 93.00 0.00 4.00 0.00 982.002016 758.00 35.00 102.00 90.00 0.00 4.00 0.00 989.002017 795.00 45.00 132.00 100.00 0.00 5.00 0.00 1077.00
IESC
O
2013 3451.53 959.92 911.55 84.38 99.16 458.73 283.14 6248.412014 3575.21 1005.14 941.62 86.30 99.27 469.02 289.01 6465.572015 3723.28 1043.20 971.22 88.68 99.37 483.05 289.01 6697.812016 3889.96 1078.30 995.53 90.48 99.70 502.30 290.14 6946.412017 4083.11 1115.34 1034.46 93.29 100.01 554.40 290.27 7270.88
GEP
CO
2013 3237.00 590.00 1390.00 286.00 34.00 67.00 1.00 5605.002014 3380.00 616.00 1446.00 291.00 34.00 70.00 1.00 5838.002015 3542.88 646.61 1528.06 297.27 33.73 88.76 0.74 6138.052016 3761.73 680.89 1605.40 301.12 33.11 89.20 0.74 6472.202017 3968.27 717.26 1685.37 305.40 32.40 91.26 1.22 6801.18

228
DIS
CO As on 30th June Domestic Commercial Industrial Agricultural Public
Lighting Bulk Supply Others TotalLE
SCO
2013 4399.00 1367.00 3547.00 572.00 112.00 178.00 40.00 10215.002014 4606.00 1420.00 3767.00 584.00 113.00 176.00 40.00 10706.002015 4912.00 1482.00 3915.00 596.00 112.00 179.00 42.00 11238.002016 5225.00 1558.00 4112 607.00 113.00 200.00 41.00 11856.002017 5530.00 1640.00 4290.00 620.00 110.00 220.00 40.00 12450.00
FESC
O
2013 6757.71 699.31 1680.91 433.35 10.47 136.53 6.06 9724.342014 6922.50 729.95 1773.72 444.79 10.73 150.41 6.45 10038.552015 7290.00 768.00 1901.00 451.00 11.00 187.00 7.00 10615.002016 7638.00 805.00 2006.00 454.00 11.00 199.00 7.00 11120.002017 8024.00 856.00 2118.00 462.00 10.00 204.00 7.00 11681.00
MEP
CO
2013 5645.94 827.50 2007.88 1142.13 14.89 86.82 22.95 9748.112014 5916.49 878.07 2118.38 1168.23 15.11 99.03 23.41 10218.722015 6292.03 917.43 2194.31 1195.08 15.19 105.09 23.74 10742.872016 6657.42 959.06 2251.58 1193.60 14.33 112.96 24.02 11212.972017 7124.70 1003.99 2291.82 1210.08 14.20 117.80 23.69 11786.28
HES
CO
2013 997.71 251.46 694.61 215.81 35.69 25.47 7.69 2228.442014 1036.82 260.44 736.80 225.53 43.71 25.56 7.82 2336.682015 1065.48 269.34 777.41 229.41 44.77 25.56 8.21 2420.182016 1104.19 281.22 816.79 233.02 23.93 47.76 8.29 2515.202017 1161.14 298.80 854.15 236.85 24.02 47.29 8.46 2630.71
SEPC
O
2013 610.09 175.98 326.70 159.76 12.23 50.20 2.18 1337.142014 638.05 185.40 356.98 175.81 12.24 51.72 2.18 1422.372015 655.01 192.22 362.59 178.80 12.30 52.09 2.20 1455.20
2016 661.68 196.44 379.85 171.75 12.57 70.02 2.75 1495.062017 667.88 200.42 409.58 167.65 12.56 61.40 2.24 1521.73
QES
CO
2013 604.78 162.76 144.18 661.76 5.30 49.78 0.02 1628.582014 617.83 168.06 150.83 788.69 5.35 52.10 0.02 1782.872015 629.99 174.02 158.28 864.48 5.47 52.44 0.02 1884.682016 642.31 178.40 163.17 875.75 5.49 53.18 0.02 1918.322017 656.20 184.81 171.74 885.65 5.54 54.50 0.02 1958.46
KEL
2013 3393.00 1481.00 1968.00 82.00 7.00 270.00 0.00 7201.002014 3741.00 1504.00 1544.00 37.00 1.00 123.00 0.00 6950.002015 4008.00 1579.00 1674.00 40.00 1.00 135.00 0.00 7437.002016 4450.00 1625.00 1751.00 43.00 1.00 147.00 0.00 8017.002017 5047.00 1709.00 1847.00 43.00 1.00 189.00 0.00 8836.00
Tota
l in
PEPC
O
Syst
em
2013 29576.95 5669.06 11992.64 3816.32 382.47 1284.25 366.91 53088.602014 30717.73 5928.43 12655.61 4025.98 392.34 1327.74 373.76 55421.572015 32291.67 6186.43 13231.84 4163.60 388.94 1421.45 376.79 58060.732016 33987.98 6463.19 13810.28 4187.65 365.90 1477.04 429.04 60721.072017 35880.75 6788.41 14447.84 4249.96 361.63 1611.92 376.52 63717.03
Source: Distribution Companies / KEL
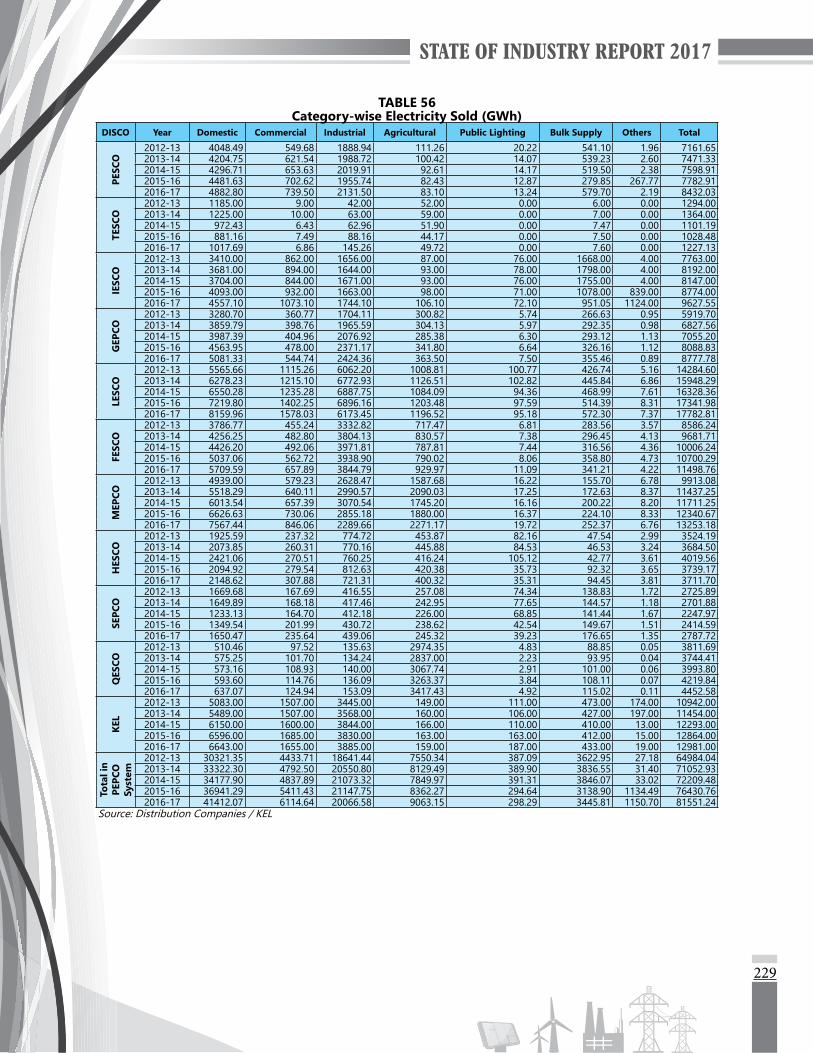
229
TABLE 56Category-wise Electricity Sold (GWh)
DISCO Year Domestic Commercial Industrial Agricultural Public Lighting Bulk Supply Others Total
PESC
O
2012-13 4048.49 549.68 1888.94 111.26 20.22 541.10 1.96 7161.652013-14 4204.75 621.54 1988.72 100.42 14.07 539.23 2.60 7471.332014-15 4296.71 653.63 2019.91 92.61 14.17 519.50 2.38 7598.912015-16 4481.63 702.62 1955.74 82.43 12.87 279.85 267.77 7782.912016-17 4882.80 739.50 2131.50 83.10 13.24 579.70 2.19 8432.03
TESC
O
2012-13 1185.00 9.00 42.00 52.00 0.00 6.00 0.00 1294.002013-14 1225.00 10.00 63.00 59.00 0.00 7.00 0.00 1364.002014-15 972.43 6.43 62.96 51.90 0.00 7.47 0.00 1101.192015-16 881.16 7.49 88.16 44.17 0.00 7.50 0.00 1028.482016-17 1017.69 6.86 145.26 49.72 0.00 7.60 0.00 1227.13
IESC
O
2012-13 3410.00 862.00 1656.00 87.00 76.00 1668.00 4.00 7763.002013-14 3681.00 894.00 1644.00 93.00 78.00 1798.00 4.00 8192.002014-15 3704.00 844.00 1671.00 93.00 76.00 1755.00 4.00 8147.002015-16 4093.00 932.00 1663.00 98.00 71.00 1078.00 839.00 8774.002016-17 4557.10 1073.10 1744.10 106.10 72.10 951.05 1124.00 9627.55
GEP
CO
2012-13 3280.70 360.77 1704.11 300.82 5.74 266.63 0.95 5919.702013-14 3859.79 398.76 1965.59 304.13 5.97 292.35 0.98 6827.562014-15 3987.39 404.96 2076.92 285.38 6.30 293.12 1.13 7055.202015-16 4563.95 478.00 2371.17 341.80 6.64 326.16 1.12 8088.832016-17 5081.33 544.74 2424.36 363.50 7.50 355.46 0.89 8777.78
LESC
O
2012-13 5565.66 1115.26 6062.20 1008.81 100.77 426.74 5.16 14284.602013-14 6278.23 1215.10 6772.93 1126.51 102.82 445.84 6.86 15948.292014-15 6550.28 1235.28 6887.75 1084.09 94.36 468.99 7.61 16328.362015-16 7219.80 1402.25 6896.16 1203.48 97.59 514.39 8.31 17341.982016-17 8159.96 1578.03 6173.45 1196.52 95.18 572.30 7.37 17782.81
FESC
O
2012-13 3786.77 455.24 3332.82 717.47 6.81 283.56 3.57 8586.242013-14 4256.25 482.80 3804.13 830.57 7.38 296.45 4.13 9681.712014-15 4426.20 492.06 3971.81 787.81 7.44 316.56 4.36 10006.242015-16 5037.06 562.72 3938.90 790.02 8.06 358.80 4.73 10700.292016-17 5709.59 657.89 3844.79 929.97 11.09 341.21 4.22 11498.76
MEP
CO
2012-13 4939.00 579.23 2628.47 1587.68 16.22 155.70 6.78 9913.082013-14 5518.29 640.11 2990.57 2090.03 17.25 172.63 8.37 11437.252014-15 6013.54 657.39 3070.54 1745.20 16.16 200.22 8.20 11711.252015-16 6626.63 730.06 2855.18 1880.00 16.37 224.10 8.33 12340.672016-17 7567.44 846.06 2289.66 2271.17 19.72 252.37 6.76 13253.18
HES
CO
2012-13 1925.59 237.32 774.72 453.87 82.16 47.54 2.99 3524.192013-14 2073.85 260.31 770.16 445.88 84.53 46.53 3.24 3684.502014-15 2421.06 270.51 760.25 416.24 105.12 42.77 3.61 4019.562015-16 2094.92 279.54 812.63 420.38 35.73 92.32 3.65 3739.172016-17 2148.62 307.88 721.31 400.32 35.31 94.45 3.81 3711.70
SEPC
O
2012-13 1669.68 167.69 416.55 257.08 74.34 138.83 1.72 2725.892013-14 1649.89 168.18 417.46 242.95 77.65 144.57 1.18 2701.882014-15 1233.13 164.70 412.18 226.00 68.85 141.44 1.67 2247.972015-16 1349.54 201.99 430.72 238.62 42.54 149.67 1.51 2414.592016-17 1650.47 235.64 439.06 245.32 39.23 176.65 1.35 2787.72
QES
CO
2012-13 510.46 97.52 135.63 2974.35 4.83 88.85 0.05 3811.692013-14 575.25 101.70 134.24 2837.00 2.23 93.95 0.04 3744.412014-15 573.16 108.93 140.00 3067.74 2.91 101.00 0.06 3993.802015-16 593.60 114.76 136.09 3263.37 3.84 108.11 0.07 4219.842016-17 637.07 124.94 153.09 3417.43 4.92 115.02 0.11 4452.58
KEL
2012-13 5083.00 1507.00 3445.00 149.00 111.00 473.00 174.00 10942.002013-14 5489.00 1507.00 3568.00 160.00 106.00 427.00 197.00 11454.002014-15 6150.00 1600.00 3844.00 166.00 110.00 410.00 13.00 12293.002015-16 6596.00 1685.00 3830.00 163.00 163.00 412.00 15.00 12864.002016-17 6643.00 1655.00 3885.00 159.00 187.00 433.00 19.00 12981.00
Tota
l in
PEPC
O
Syst
em
2012-13 30321.35 4433.71 18641.44 7550.34 387.09 3622.95 27.18 64984.042013-14 33322.30 4792.50 20550.80 8129.49 389.90 3836.55 31.40 71052.932014-15 34177.90 4837.89 21073.32 7849.97 391.31 3846.07 33.02 72209.482015-16 36941.29 5411.43 21147.75 8362.27 294.64 3138.90 1134.49 76430.762016-17 41412.07 6114.64 20066.58 9063.15 298.29 3445.81 1150.70 81551.24
Source: Distribution Companies / KEL
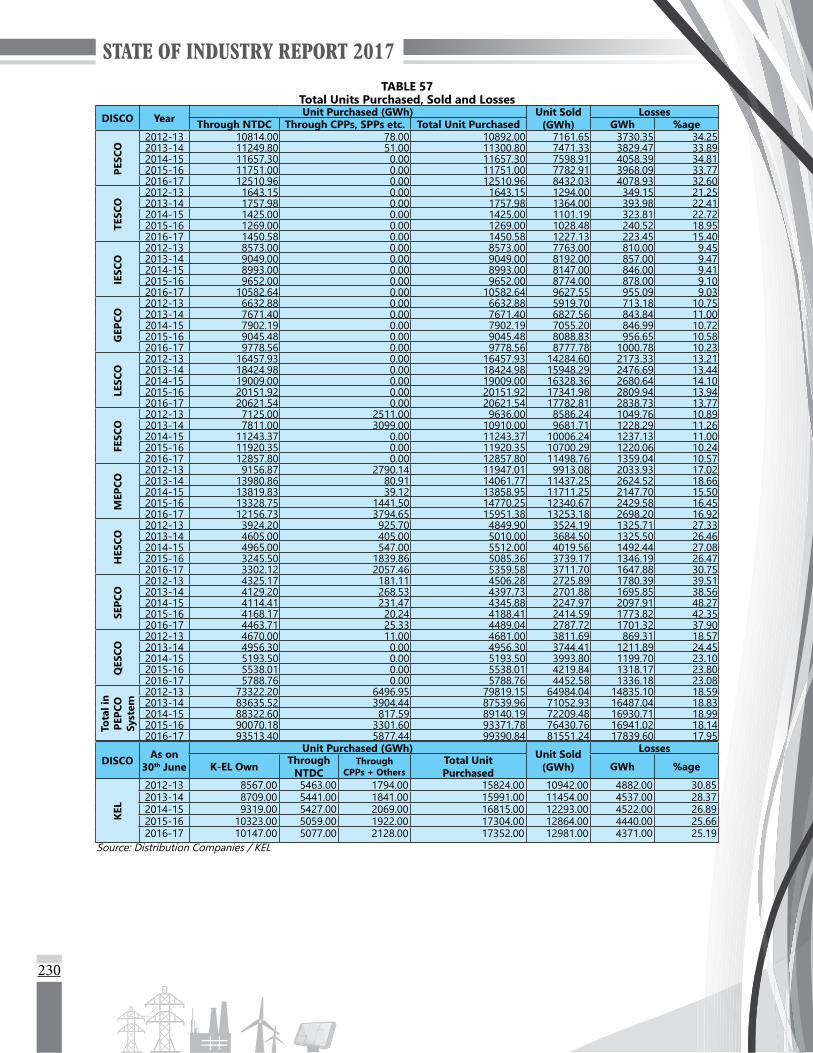
230
TABLE 57Total Units Purchased, Sold and Losses
DISCO Year Unit Purchased (GWh) Unit Sold (GWh)
LossesThrough NTDC Through CPPs, SPPs etc. Total Unit Purchased GWh %age
PESC
O
2012-13 10814.00 78.00 10892.00 7161.65 3730.35 34.252013-14 11249.80 51.00 11300.80 7471.33 3829.47 33.892014-15 11657.30 0.00 11657.30 7598.91 4058.39 34.812015-16 11751.00 0.00 11751.00 7782.91 3968.09 33.772016-17 12510.96 0.00 12510.96 8432.03 4078.93 32.60
TESC
O
2012-13 1643.15 0.00 1643.15 1294.00 349.15 21.252013-14 1757.98 0.00 1757.98 1364.00 393.98 22.412014-15 1425.00 0.00 1425.00 1101.19 323.81 22.722015-16 1269.00 0.00 1269.00 1028.48 240.52 18.952016-17 1450.58 0.00 1450.58 1227.13 223.45 15.40
IESC
O
2012-13 8573.00 0.00 8573.00 7763.00 810.00 9.452013-14 9049.00 0.00 9049.00 8192.00 857.00 9.472014-15 8993.00 0.00 8993.00 8147.00 846.00 9.412015-16 9652.00 0.00 9652.00 8774.00 878.00 9.102016-17 10582.64 0.00 10582.64 9627.55 955.09 9.03
GEP
CO
2012-13 6632.88 0.00 6632.88 5919.70 713.18 10.752013-14 7671.40 0.00 7671.40 6827.56 843.84 11.002014-15 7902.19 0.00 7902.19 7055.20 846.99 10.722015-16 9045.48 0.00 9045.48 8088.83 956.65 10.582016-17 9778.56 0.00 9778.56 8777.78 1000.78 10.23
LESC
O
2012-13 16457.93 0.00 16457.93 14284.60 2173.33 13.212013-14 18424.98 0.00 18424.98 15948.29 2476.69 13.442014-15 19009.00 0.00 19009.00 16328.36 2680.64 14.102015-16 20151.92 0.00 20151.92 17341.98 2809.94 13.942016-17 20621.54 0.00 20621.54 17782.81 2838.73 13.77
FESC
O
2012-13 7125.00 2511.00 9636.00 8586.24 1049.76 10.892013-14 7811.00 3099.00 10910.00 9681.71 1228.29 11.262014-15 11243.37 0.00 11243.37 10006.24 1237.13 11.002015-16 11920.35 0.00 11920.35 10700.29 1220.06 10.242016-17 12857.80 0.00 12857.80 11498.76 1359.04 10.57
MEP
CO
2012-13 9156.87 2790.14 11947.01 9913.08 2033.93 17.022013-14 13980.86 80.91 14061.77 11437.25 2624.52 18.662014-15 13819.83 39.12 13858.95 11711.25 2147.70 15.502015-16 13328.75 1441.50 14770.25 12340.67 2429.58 16.452016-17 12156.73 3794.65 15951.38 13253.18 2698.20 16.92
HES
CO
2012-13 3924.20 925.70 4849.90 3524.19 1325.71 27.332013-14 4605.00 405.00 5010.00 3684.50 1325.50 26.462014-15 4965.00 547.00 5512.00 4019.56 1492.44 27.082015-16 3245.50 1839.86 5085.36 3739.17 1346.19 26.472016-17 3302.12 2057.46 5359.58 3711.70 1647.88 30.75
SEPC
O
2012-13 4325.17 181.11 4506.28 2725.89 1780.39 39.512013-14 4129.20 268.53 4397.73 2701.88 1695.85 38.562014-15 4114.41 231.47 4345.88 2247.97 2097.91 48.272015-16 4168.17 20.24 4188.41 2414.59 1773.82 42.352016-17 4463.71 25.33 4489.04 2787.72 1701.32 37.90
QES
CO
2012-13 4670.00 11.00 4681.00 3811.69 869.31 18.572013-14 4956.30 0.00 4956.30 3744.41 1211.89 24.452014-15 5193.50 0.00 5193.50 3993.80 1199.70 23.102015-16 5538.01 0.00 5538.01 4219.84 1318.17 23.802016-17 5788.76 0.00 5788.76 4452.58 1336.18 23.08
Tota
l in
PEPC
O
Syst
em
2012-13 73322.20 6496.95 79819.15 64984.04 14835.10 18.592013-14 83635.52 3904.44 87539.96 71052.93 16487.04 18.832014-15 88322.60 817.59 89140.19 72209.48 16930.71 18.992015-16 90070.18 3301.60 93371.78 76430.76 16941.02 18.142016-17 93513.40 5877.44 99390.84 81551.24 17839.60 17.95
DISCO As on 30th June
Unit Purchased (GWh) Unit Sold (GWh)
Losses
K-EL Own Through NTDC
Through CPPs + Others
Total Unit Purchased GWh %age
KEL
2012-13 8567.00 5463.00 1794.00 15824.00 10942.00 4882.00 30.852013-14 8709.00 5441.00 1841.00 15991.00 11454.00 4537.00 28.372014-15 9319.00 5427.00 2069.00 16815.00 12293.00 4522.00 26.892015-16 10323.00 5059.00 1922.00 17304.00 12864.00 4440.00 25.662016-17 10147.00 5077.00 2128.00 17352.00 12981.00 4371.00 25.19
Source: Distribution Companies / KEL
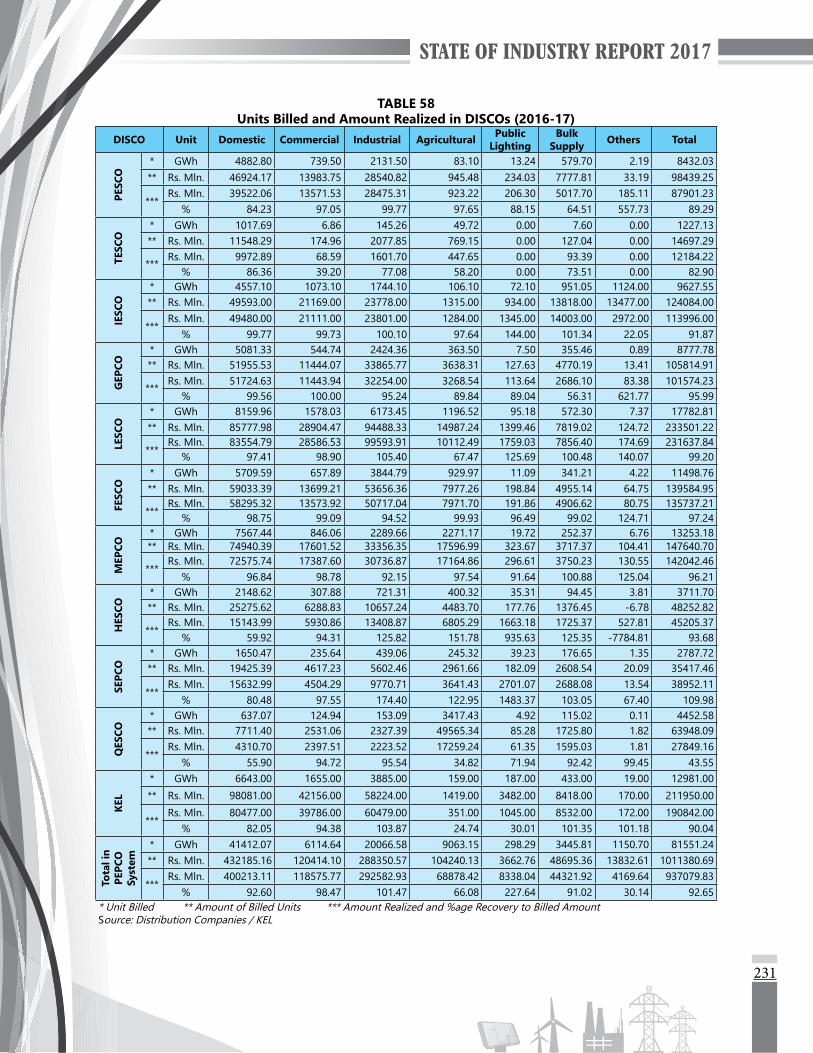
231
TABLE 58Units Billed and Amount Realized in DISCOs (2016-17)
DISCO Unit Domestic Commercial Industrial Agricultural Public Lighting
Bulk Supply Others Total
PESC
O
* GWh 4882.80 739.50 2131.50 83.10 13.24 579.70 2.19 8432.03** Rs. Mln. 46924.17 13983.75 28540.82 945.48 234.03 7777.81 33.19 98439.25
***Rs. Mln. 39522.06 13571.53 28475.31 923.22 206.30 5017.70 185.11 87901.23
% 84.23 97.05 99.77 97.65 88.15 64.51 557.73 89.29
TESC
O
* GWh 1017.69 6.86 145.26 49.72 0.00 7.60 0.00 1227.13** Rs. Mln. 11548.29 174.96 2077.85 769.15 0.00 127.04 0.00 14697.29
***Rs. Mln. 9972.89 68.59 1601.70 447.65 0.00 93.39 0.00 12184.22
% 86.36 39.20 77.08 58.20 0.00 73.51 0.00 82.90
IESC
O
* GWh 4557.10 1073.10 1744.10 106.10 72.10 951.05 1124.00 9627.55** Rs. Mln. 49593.00 21169.00 23778.00 1315.00 934.00 13818.00 13477.00 124084.00
***Rs. Mln. 49480.00 21111.00 23801.00 1284.00 1345.00 14003.00 2972.00 113996.00
% 99.77 99.73 100.10 97.64 144.00 101.34 22.05 91.87
GEP
CO
* GWh 5081.33 544.74 2424.36 363.50 7.50 355.46 0.89 8777.78** Rs. Mln. 51955.53 11444.07 33865.77 3638.31 127.63 4770.19 13.41 105814.91
***Rs. Mln. 51724.63 11443.94 32254.00 3268.54 113.64 2686.10 83.38 101574.23
% 99.56 100.00 95.24 89.84 89.04 56.31 621.77 95.99
LESC
O
* GWh 8159.96 1578.03 6173.45 1196.52 95.18 572.30 7.37 17782.81** Rs. Mln. 85777.98 28904.47 94488.33 14987.24 1399.46 7819.02 124.72 233501.22
***Rs. Mln. 83554.79 28586.53 99593.91 10112.49 1759.03 7856.40 174.69 231637.84
% 97.41 98.90 105.40 67.47 125.69 100.48 140.07 99.20
FESC
O
* GWh 5709.59 657.89 3844.79 929.97 11.09 341.21 4.22 11498.76** Rs. Mln. 59033.39 13699.21 53656.36 7977.26 198.84 4955.14 64.75 139584.95
***Rs. Mln. 58295.32 13573.92 50717.04 7971.70 191.86 4906.62 80.75 135737.21
% 98.75 99.09 94.52 99.93 96.49 99.02 124.71 97.24
MEP
CO
* GWh 7567.44 846.06 2289.66 2271.17 19.72 252.37 6.76 13253.18** Rs. Mln. 74940.39 17601.52 33356.35 17596.99 323.67 3717.37 104.41 147640.70
***Rs. Mln. 72575.74 17387.60 30736.87 17164.86 296.61 3750.23 130.55 142042.46
% 96.84 98.78 92.15 97.54 91.64 100.88 125.04 96.21
HES
CO
* GWh 2148.62 307.88 721.31 400.32 35.31 94.45 3.81 3711.70** Rs. Mln. 25275.62 6288.83 10657.24 4483.70 177.76 1376.45 -6.78 48252.82
***Rs. Mln. 15143.99 5930.86 13408.87 6805.29 1663.18 1725.37 527.81 45205.37
% 59.92 94.31 125.82 151.78 935.63 125.35 -7784.81 93.68
SEPC
O
* GWh 1650.47 235.64 439.06 245.32 39.23 176.65 1.35 2787.72** Rs. Mln. 19425.39 4617.23 5602.46 2961.66 182.09 2608.54 20.09 35417.46
***Rs. Mln. 15632.99 4504.29 9770.71 3641.43 2701.07 2688.08 13.54 38952.11
% 80.48 97.55 174.40 122.95 1483.37 103.05 67.40 109.98
QES
CO
* GWh 637.07 124.94 153.09 3417.43 4.92 115.02 0.11 4452.58** Rs. Mln. 7711.40 2531.06 2327.39 49565.34 85.28 1725.80 1.82 63948.09
***Rs. Mln. 4310.70 2397.51 2223.52 17259.24 61.35 1595.03 1.81 27849.16
% 55.90 94.72 95.54 34.82 71.94 92.42 99.45 43.55
KEL
* GWh 6643.00 1655.00 3885.00 159.00 187.00 433.00 19.00 12981.00** Rs. Mln. 98081.00 42156.00 58224.00 1419.00 3482.00 8418.00 170.00 211950.00
***Rs. Mln. 80477.00 39786.00 60479.00 351.00 1045.00 8532.00 172.00 190842.00
% 82.05 94.38 103.87 24.74 30.01 101.35 101.18 90.04
Tota
l in
PEPC
O
Syst
em
* GWh 41412.07 6114.64 20066.58 9063.15 298.29 3445.81 1150.70 81551.24** Rs. Mln. 432185.16 120414.10 288350.57 104240.13 3662.76 48695.36 13832.61 1011380.69
***Rs. Mln. 400213.11 118575.77 292582.93 68878.42 8338.04 44321.92 4169.64 937079.83
% 92.60 98.47 101.47 66.08 227.64 91.02 30.14 92.65* Unit Billed ** Amount of Billed Units *** Amount Realized and %age Recovery to Billed AmountSource: Distribution Companies / KEL
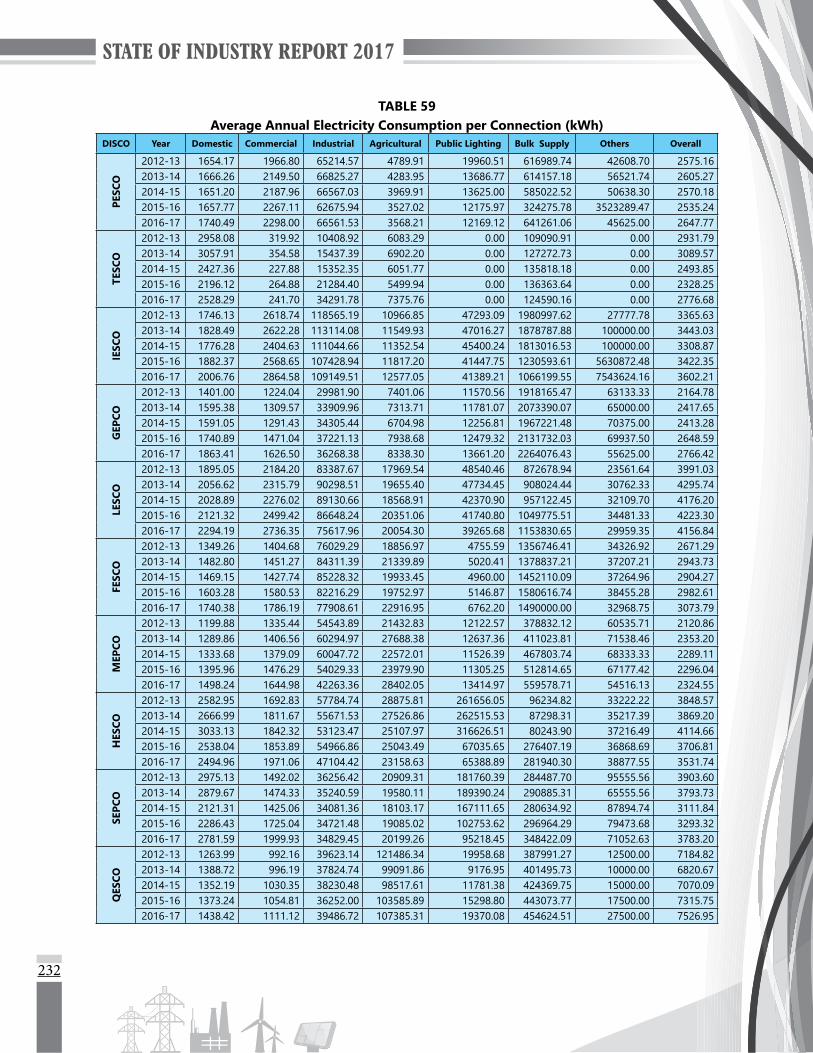
232
TABLE 59Average Annual Electricity Consumption per Connection (kWh)
DISCO Year Domestic Commercial Industrial Agricultural Public Lighting Bulk Supply Others Overall
PESC
O
2012-13 1654.17 1966.80 65214.57 4789.91 19960.51 616989.74 42608.70 2575.162013-14 1666.26 2149.50 66825.27 4283.95 13686.77 614157.18 56521.74 2605.272014-15 1651.20 2187.96 66567.03 3969.91 13625.00 585022.52 50638.30 2570.182015-16 1657.77 2267.11 62675.94 3527.02 12175.97 324275.78 3523289.47 2535.242016-17 1740.49 2298.00 66561.53 3568.21 12169.12 641261.06 45625.00 2647.77
TESC
O
2012-13 2958.08 319.92 10408.92 6083.29 0.00 109090.91 0.00 2931.792013-14 3057.91 354.58 15437.39 6902.20 0.00 127272.73 0.00 3089.572014-15 2427.36 227.88 15352.35 6051.77 0.00 135818.18 0.00 2493.852015-16 2196.12 264.88 21284.40 5499.94 0.00 136363.64 0.00 2328.252016-17 2528.29 241.70 34291.78 7375.76 0.00 124590.16 0.00 2776.68
IESC
O
2012-13 1746.13 2618.74 118565.19 10966.85 47293.09 1980997.62 27777.78 3365.632013-14 1828.49 2622.28 113114.08 11549.93 47016.27 1878787.88 100000.00 3443.032014-15 1776.28 2404.63 111044.66 11352.54 45400.24 1813016.53 100000.00 3308.872015-16 1882.37 2568.65 107428.94 11817.20 41447.75 1230593.61 5630872.48 3422.352016-17 2006.76 2864.58 109149.51 12577.05 41389.21 1066199.55 7543624.16 3602.21
GEP
CO
2012-13 1401.00 1224.04 29981.90 7401.06 11570.56 1918165.47 63133.33 2164.782013-14 1595.38 1309.57 33909.96 7313.71 11781.07 2073390.07 65000.00 2417.652014-15 1591.05 1291.43 34305.44 6704.98 12256.81 1967221.48 70375.00 2413.282015-16 1740.89 1471.04 37221.13 7938.68 12479.32 2131732.03 69937.50 2648.592016-17 1863.41 1626.50 36268.38 8338.30 13661.20 2264076.43 55625.00 2766.42
LESC
O
2012-13 1895.05 2184.20 83387.67 17969.54 48540.46 872678.94 23561.64 3991.032013-14 2056.62 2315.79 90298.51 19655.40 47734.45 908024.44 30762.33 4295.742014-15 2028.89 2276.02 89130.66 18568.91 42370.90 957122.45 32109.70 4176.202015-16 2121.32 2499.42 86648.24 20351.06 41740.80 1049775.51 34481.33 4223.302016-17 2294.19 2736.35 75617.96 20054.30 39265.68 1153830.65 29959.35 4156.84
FESC
O
2012-13 1349.26 1404.68 76029.29 18856.97 4755.59 1356746.41 34326.92 2671.292013-14 1482.80 1451.27 84311.39 21339.89 5020.41 1378837.21 37207.21 2943.732014-15 1469.15 1427.74 85228.32 19933.45 4960.00 1452110.09 37264.96 2904.272015-16 1603.28 1580.53 82216.29 19752.97 5146.87 1580616.74 38455.28 2982.612016-17 1740.38 1786.19 77908.61 22916.95 6762.20 1490000.00 32968.75 3073.79
MEP
CO
2012-13 1199.88 1335.44 54543.89 21432.83 12122.57 378832.12 60535.71 2120.862013-14 1289.86 1406.56 60294.97 27688.38 12637.36 411023.81 71538.46 2353.202014-15 1333.68 1379.09 60047.72 22572.01 11526.39 467803.74 68333.33 2289.112015-16 1395.96 1476.29 54029.33 23979.90 11305.25 512814.65 67177.42 2296.042016-17 1498.24 1644.98 42263.36 28402.05 13414.97 559578.71 54516.13 2324.55
HES
CO
2012-13 2582.95 1692.83 57784.74 28875.81 261656.05 96234.82 33222.22 3848.572013-14 2666.99 1811.67 55671.53 27526.86 262515.53 87298.31 35217.39 3869.202014-15 3033.13 1842.32 53123.47 25107.97 316626.51 80243.90 37216.49 4114.662015-16 2538.04 1853.89 54966.86 25043.49 67035.65 276407.19 36868.69 3706.812016-17 2494.96 1971.06 47104.42 23158.63 65388.89 281940.30 38877.55 3531.74
SEPC
O
2012-13 2975.13 1492.02 36256.42 20909.31 181760.39 284487.70 95555.56 3903.602013-14 2879.67 1474.33 35240.59 19580.11 189390.24 290885.31 65555.56 3793.732014-15 2121.31 1425.06 34081.36 18103.17 167111.65 280634.92 87894.74 3111.842015-16 2286.43 1725.04 34721.48 19085.02 102753.62 296964.29 79473.68 3293.322016-17 2781.59 1999.93 34829.45 20199.26 95218.45 348422.09 71052.63 3783.20
QES
CO
2012-13 1263.99 992.16 39623.14 121486.34 19958.68 387991.27 12500.00 7184.822013-14 1388.72 996.19 37824.74 99091.86 9176.95 401495.73 10000.00 6820.672014-15 1352.19 1030.35 38230.48 98517.61 11781.38 424369.75 15000.00 7070.092015-16 1373.24 1054.81 36252.00 103585.89 15298.80 443073.77 17500.00 7315.752016-17 1438.42 1111.12 39486.72 107385.31 19370.08 454624.51 27500.00 7526.95

233
DISCO Year Domestic Commercial Industrial Agricultural Public Lighting Bulk Supply Others OverallKE
L2012-13 3060.63 3331.65 168360.86 56957.19 1681818.18 1288828.34 174000000.00 5121.202013-14 3326.60 3439.46 174354.96 66390.04 1432432.43 2113861.39 98500000.00 5425.002014-15 3626.65 3643.57 186475.21 66720.26 1428571.43 2070707.07 13000000.00 5695.712015-16 3750.99 3789.18 185687.97 62142.58 2263888.89 2049751.24 15000000.00 5777.222016-17 3414.16 3625.28 186170.21 60710.19 2561643.84 2175879.40 19000000.00 5350.79
Tota
l in
PEP-
CO S
yste
m
2012-13 1620.34 1738.15 62797.72 25074.59 43361.60 855881.17 36139.63 2970.622013-14 1724.52 1818.72 67314.79 26175.34 42575.13 867800.95 47139.64 3145.622014-15 1696.36 1776.21 66874.80 24679.17 41860.29 860225.01 47368.72 3070.232015-16 1755.71 1922.88 64907.04 26044.76 29906.52 750393.26 1333124.56 3117.502016-17 1883.10 2104.49 59713.97 28013.84 29478.21 804156.36 1383052.88 3189.11
Source: Distribution Companies / KEL
TABLE 60
Distribution Losses (voltage category-wise)
Losses of2012-13 2013-14 2014-15 2015-16 2016-17
GWh % GWh % GWh % GWh % GWh %
PESC
O
132 kV system (including 66 & 33 kV) 391.90 3.59 379.50 3.36 379.50 3.26 431.70 3.70 385.00 3.10
11 kV and below system 3338.60 31.79 3450.10 31.59 3681.10 31.58 3536.40 31.20 3693.50 30.50
Overall system 3730.35 34.25 3829.47 33.89 4058.39 34.81 3968.09 33.77 4078.93 32.60
TESC
O
132 kV system (including 66 & 33 kV) 46.99 2.86 98.48 5.60 65.98 4.63 48.86 3.85 44.95 3.10
11 kV and below system 311.25 19.50 295.50 17.81 240.55 17.70 191.62 15.10 177.92 12.27
Overall system 349.15 21.25 393.98 22.41 323.81 22.72 240.52 18.95 223.45 15.40
IESC
O
132 kV system (including 66 & 33 kV) 151.00 1.76 151.12 1.67 177.00 1.96 162.15 1.68 201.00 1.90
11 kV and below system 657.00 7.80 705.60 7.93 669.00 7.59 715.53 7.54 754.00 7.26
Overall system 810.00 9.45 857.00 9.47 846.00 9.41 878.00 9.10 955.09 9.03
GEP
CO
132 kV system (including 66 & 33 kV) 102.81 1.55 141.15 1.84 127.46 1.61 141.65 1.57 147.55 1.51
11 kV and below system 610.56 9.35 702.57 9.33 719.53 9.25 814.99 9.15 853.38 8.86
Overall system 713.18 10.75 843.84 11.00 846.99 10.72 956.65 10.58 1000.78 10.23
LESC
O
132 kV system (including 66 & 33 kV) 102.80 0.62 145.90 0.79 273.80 1.14 275.54 1.37 233.93 1.10
11 kV and below system 2070.60 12.66 2330.80 12.75 2407.10 12.80 2534.41 12.80 2604.85 12.80
Overall system 2173.33 13.21 2476.69 13.44 2680.64 14.10 2809.94 13.94 2838.73 13.77
FESC
O
132 kV system (including 66 & 33 kV) 137.00 1.42 211.87 1.94 219.90 2.00 178.80 1.48 244.28 1.90
11 kV and below system 912.46 9.61 1016.33 9.50 1017.24 9.20 1044.97 8.82 1109.92 8.80
Overall system 1049.76 10.89 1228.29 11.26 1237.13 11.00 1220.06 10.24 1359.04 10.57
MEP
CO
132 kV system (including 66 & 33 kV) 309.08 2.59 483.76 3.44 417.14 3.01 436.05 2.91 433.15 2.70
11 kV and below system 1724.84 14.82 2104.59 15.50 1740.71 12.95 1993.54 13.90 2265.24 14.60
Overall system 2033.93 17.02 2624.52 18.66 2147.70 15.50 2429.58 16.45 2698.20 16.92
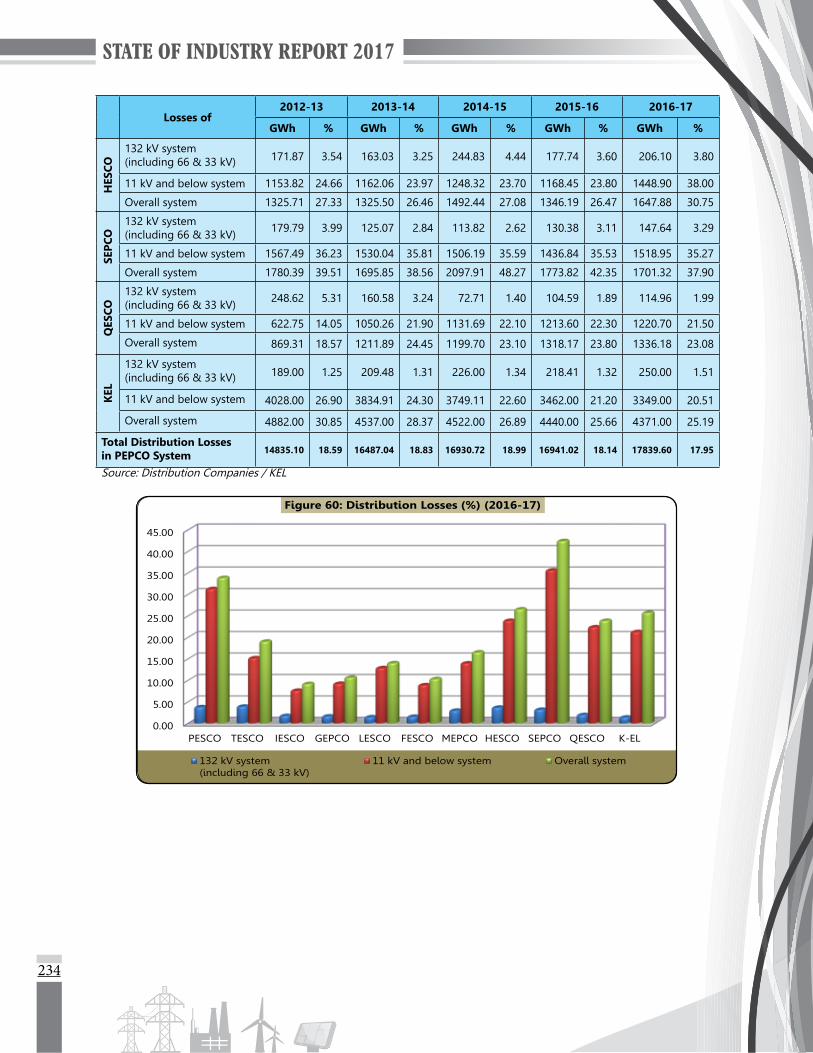
234
Losses of2012-13 2013-14 2014-15 2015-16 2016-17
GWh % GWh % GWh % GWh % GWh %
HES
CO
132 kV system (including 66 & 33 kV) 171.87 3.54 163.03 3.25 244.83 4.44 177.74 3.60 206.10 3.80
11 kV and below system 1153.82 24.66 1162.06 23.97 1248.32 23.70 1168.45 23.80 1448.90 38.00
Overall system 1325.71 27.33 1325.50 26.46 1492.44 27.08 1346.19 26.47 1647.88 30.75
SEPC
O
132 kV system (including 66 & 33 kV) 179.79 3.99 125.07 2.84 113.82 2.62 130.38 3.11 147.64 3.29
11 kV and below system 1567.49 36.23 1530.04 35.81 1506.19 35.59 1436.84 35.53 1518.95 35.27
Overall system 1780.39 39.51 1695.85 38.56 2097.91 48.27 1773.82 42.35 1701.32 37.90
QES
CO
132 kV system (including 66 & 33 kV) 248.62 5.31 160.58 3.24 72.71 1.40 104.59 1.89 114.96 1.99
11 kV and below system 622.75 14.05 1050.26 21.90 1131.69 22.10 1213.60 22.30 1220.70 21.50
Overall system 869.31 18.57 1211.89 24.45 1199.70 23.10 1318.17 23.80 1336.18 23.08
KEL
132 kV system (including 66 & 33 kV) 189.00 1.25 209.48 1.31 226.00 1.34 218.41 1.32 250.00 1.51
11 kV and below system 4028.00 26.90 3834.91 24.30 3749.11 22.60 3462.00 21.20 3349.00 20.51
Overall system 4882.00 30.85 4537.00 28.37 4522.00 26.89 4440.00 25.66 4371.00 25.19
Total Distribution Losses in PEPCO System 14835.10 18.59 16487.04 18.83 16930.72 18.99 16941.02 18.14 17839.60 17.95
Source: Distribution Companies / KEL
0.00
5.00
10.00
15.00
20.00
25.00
30.00
35.00
40.00
45.00
PESCO TESCO IESCO GEPCO LESCO FESCO MEPCO HESCO SEPCO QESCO K-EL
Figure 60: Distribution Losses (%) (2016-17)
132 kV system(including 66 & 33 kV)
11 kV and below system Overall system

235
13.3 DISTRIBUTION SYSTEM PERFORMANCEThe continuity of supply is one of the most important indicators to measure the performance of any DISCO. Besides others, the following indicators are commonly used to monitor the system performance of DISCOs, in respect of reliability and quality of supply:
System Average Interruption Frequency Index (SAIFI)
=Total annual number of all Consumer Power Supply Interruptions
Total number of consumers served by the distribution company in a given year
System Average Interruption Duration Index (SAIDI)
=Aggregate sum of all Consumer Power Supply Interruption durations in minutes
Total number of consumers served by the distribution company in a given year
A comparison of SAIFI and SAIDI in respect of all DISCOs of the country, for the year 2012-13 to 2016-17, is included in the following table. Pursuant to NEPRA Performance Standards (Distribution) Rules, 2005 maximum allowed limit for SAIFI is 13 (No.) and for SAIDI is 14 minutes.
TABLE 61Comparison of SAIFI and SAIDI of all Distribution Companies
DISCO 2012-13 2013-14 2014-15 2015-16 2016-17
Total Number of Consumers
(Nos.)
PESCO 2530655 2588473 2618779 2634015 2850613TESCO - 390723 384031 390757 n.p.IESCO 2260203 2342241 2423317 2513206 2623499GEPCO 2568859 2736688 2812997 3054228 3173183LESCO 3164986 3286668 3432160 3600237 4277967FESCO 3214275 3288932 2445562 3587565 3639360MEPCO 4535062 4693061 4989020 5228862 5527875HESCO 915805 952296 976923 1008762 1050998SEPCO 687045 711727 721087 720120 736901QESCO 516327 535145 561280 568826 569399
KEL 2385100 2358357 2317947 2337331 2427413BTPL 11838 15636 16879 19824 23162Total 22790155 23899947 23699982 25663733 26900370
Total Annual Number of Consumer
Power Supply Interruptions
PESCO 864386357 819134634 825967981 689188370 457826993TESCO - 49458 36879 49480 n.p.IESCO 1391792 120949 86134 78485 76983GEPCO 69726399 28804296 29294902 108242345 10344034LESCO 160058187 256478823 180162181 164844249 160171299FESCO 182579281 116444302 160355190 116271556 145550105MEPCO 678829469 945813581 886095371 1062001609 1299108797HESCO 668882208 218961910 197662324 185846807 198002822SEPCO 2870251802 178978331 164384407 156059275 443148860QESCO 79422810 77573236 63193661 60817656 55187529
KEL 74576586 58293812 51478645 47967018 47584903BTPL 40510 105 81 103 64Total 5650145401 2700653437 2558717756 2591366953 2817002389

236
DISCO 2012-13 2013-14 2014-15 2015-16 2016-17
Aggregate sum of all Consumer
Power Supply Interruptions (Duration in
Minutes)
PESCO 74832413870 72339031400 73155560030 65658404750 41741621410TESCO - 819028 508279 819058 n.p.IESCO 78663777 3886042 2411513 2054338 2065394GEPCO 676186878 35971518 37129560 181711508 174615596LESCO 14608740454 15643260013 10331785985 10535348491 23937902384FESCO 4019965724 3739602394 9243009119 6148446280 5575659600MEPCO 58111790700 83088717833 78216126150 91984306830 11283120340HESCO 19419312750 15883027060 10397137520 12733146710 13451848430SEPCO 3297761640 1738562122 1544108334 1353325030 4175349628QESCO 6523770172 6351140612 4213425000 4146474102 4731924602
KEL 4270360371 3526349005 3083517500 2827979300 2773327573BTPL 81454 12303 12107 17230 13171
Total 185839047790 202350379330 190224731097 195572033627 107847448128
System Average
Interruption Frequency
Index (SAIFI), Power Supply Interruptions per consumer
per year
PESCO 341.57 316.45 315.40 261.65 160.60TESCO - 0.12 0.10 0.13 n.p.IESCO 0.62 0.05 0.04 0.03 0.03GEPCO 27.14 10.53 10.41 35.44 3.26LESCO 50.57 78.04 52.49 45.79 37.44FESCO 56.80 35.40 46.54 32.41 39.99MEPCO 149.68 201.53 177.61 203.00 235.00HESCO 730.38 229.93 202.33 184.00 188.40SEPCO 4177.68 251.48 227.96 216.71 601.37QESCO 153.82 144.95 112.58 107.00 96.92
KEL 31.27 24.71 22.21 20.52 19.60BTPL 3.42 0.006 0.010 0.01 0.003
System Average
Interruption Duration
Index (SAIDI), Power Supply Interruptions
Durations
PESCO 29570.37 27946.60 27934.98 24927.12 14643.00TESCO - 2.09 1.32 2.10 n.p.IESCO 34.80 1.66 0.10 0.82 0.79GEPCO 263.22 13.14 13.20 59.49 55.03LESCO 4615.74 4759.61 3010.29 2926.29 5595.63FESCO 1250.66 1137.02 2682.58 1714.00 1532.04MEPCO 12813.89 17704.58 15677.65 17592.00 20411.32HESCO 21204.64 16678.66 10642.74 12623.00 12799.12SEPCO 4799.92 2442.73 2141.36 1879.31 5666.01QESCO 12634.96 11868.07 7506.81 7290.00 8310.40
KEL 1790.43 1495.25 1330.30 1210.00 1142.50BTPL 6.90 0.78 1.43 1.72 0.569
Source: Distribution Companies / KEL / BTPL / NEPRA
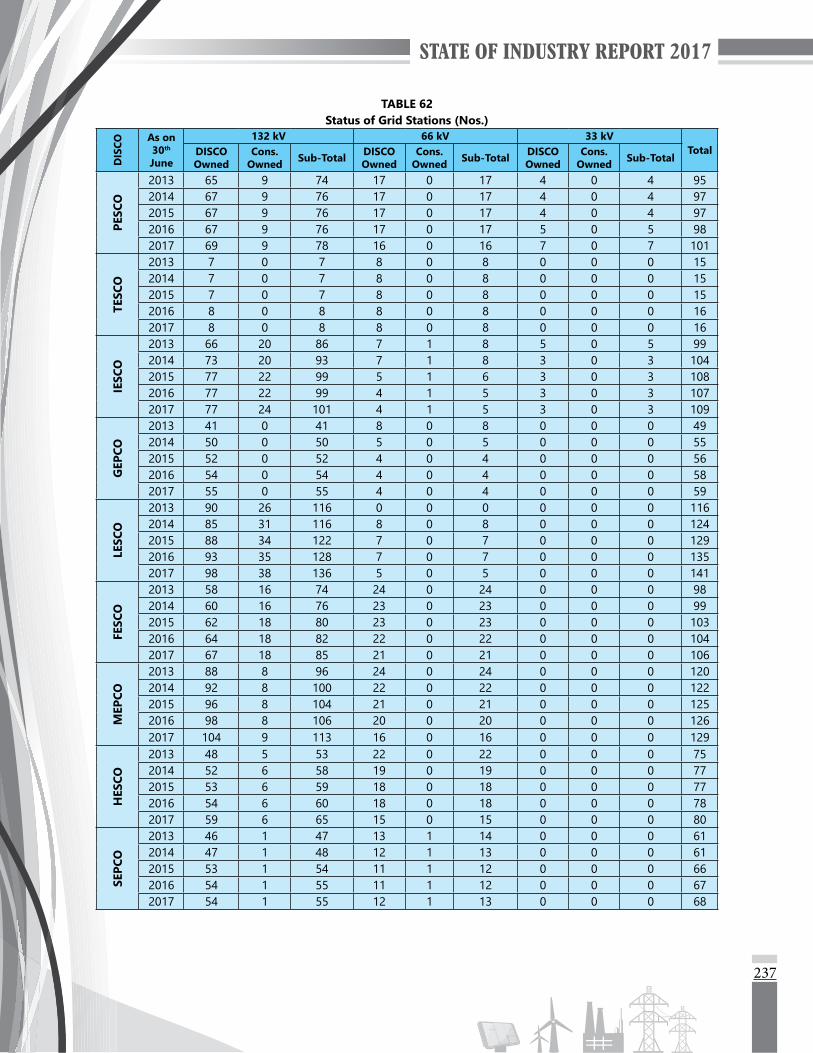
237
TABLE 62Status of Grid Stations (Nos.)
DIS
CO
As on 30th
June
132 kV 66 kV 33 kVTotalDISCO
OwnedCons.
Owned Sub-Total DISCO Owned
Cons. Owned Sub-Total DISCO
OwnedCons.
Owned Sub-Total
PESC
O
2013 65 9 74 17 0 17 4 0 4 952014 67 9 76 17 0 17 4 0 4 972015 67 9 76 17 0 17 4 0 4 972016 67 9 76 17 0 17 5 0 5 982017 69 9 78 16 0 16 7 0 7 101
TESC
O
2013 7 0 7 8 0 8 0 0 0 152014 7 0 7 8 0 8 0 0 0 152015 7 0 7 8 0 8 0 0 0 152016 8 0 8 8 0 8 0 0 0 162017 8 0 8 8 0 8 0 0 0 16
IESC
O
2013 66 20 86 7 1 8 5 0 5 992014 73 20 93 7 1 8 3 0 3 1042015 77 22 99 5 1 6 3 0 3 1082016 77 22 99 4 1 5 3 0 3 1072017 77 24 101 4 1 5 3 0 3 109
GEP
CO
2013 41 0 41 8 0 8 0 0 0 492014 50 0 50 5 0 5 0 0 0 552015 52 0 52 4 0 4 0 0 0 562016 54 0 54 4 0 4 0 0 0 582017 55 0 55 4 0 4 0 0 0 59
LESC
O
2013 90 26 116 0 0 0 0 0 0 1162014 85 31 116 8 0 8 0 0 0 1242015 88 34 122 7 0 7 0 0 0 1292016 93 35 128 7 0 7 0 0 0 1352017 98 38 136 5 0 5 0 0 0 141
FESC
O
2013 58 16 74 24 0 24 0 0 0 982014 60 16 76 23 0 23 0 0 0 992015 62 18 80 23 0 23 0 0 0 1032016 64 18 82 22 0 22 0 0 0 1042017 67 18 85 21 0 21 0 0 0 106
MEP
CO
2013 88 8 96 24 0 24 0 0 0 1202014 92 8 100 22 0 22 0 0 0 1222015 96 8 104 21 0 21 0 0 0 1252016 98 8 106 20 0 20 0 0 0 1262017 104 9 113 16 0 16 0 0 0 129
HES
CO
2013 48 5 53 22 0 22 0 0 0 752014 52 6 58 19 0 19 0 0 0 772015 53 6 59 18 0 18 0 0 0 772016 54 6 60 18 0 18 0 0 0 782017 59 6 65 15 0 15 0 0 0 80
SEPC
O
2013 46 1 47 13 1 14 0 0 0 612014 47 1 48 12 1 13 0 0 0 612015 53 1 54 11 1 12 0 0 0 662016 54 1 55 11 1 12 0 0 0 672017 54 1 55 12 1 13 0 0 0 68

238
DIS
COAs on 30th June
132 kV 66 kV 33 kVTotalDISCO
OwnedCons.
Owned Sub-Total DISCO Owned
Cons. Owned Sub-Total DISCO
OwnedCons.
Owned Sub-TotalQ
ESCO
2013 56 0 56 10 0 10 26 0 26 922014 56 0 56 10 0 10 26 0 26 922015 58 0 58 10 0 10 25 0 25 932016 64 0 64 8 0 8 23 0 23 952017 64 0 64 8 0 8 30 0 30 102
KEL
2013 52 9 61 3 0 3 0 0 0 642014 53 9 62 3 0 3 0 0 0 652015 54 9 63 3 0 3 0 0 0 662016 54 9 63 3 0 3 0 0 0 662017 54 9 63 3 0 3 0 0 0 66
Tota
l in
PEPC
O
Syst
em
2013 565 85 650 133 2 135 35 0 35 8202014 589 91 680 131 2 133 33 0 33 8462015 613 98 711 124 2 126 32 0 32 8692016 633 99 732 119 2 121 31 0 31 8842017 655 105 760 109 2 111 40 0 40 911
Source: Distribution Companies / K-EL
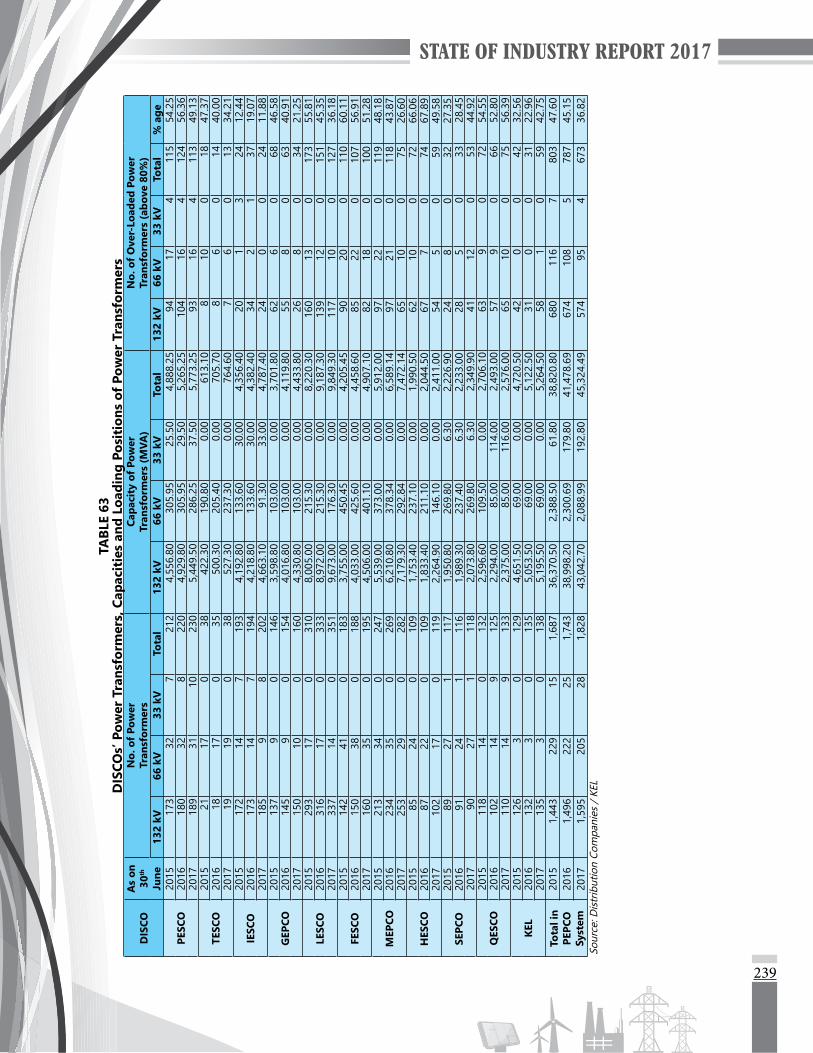
239
TABL
E 63
DIS
COs’
Pow
er T
rans
form
ers,
Cap
acit
ies
and
Load
ing
Posi
tion
s of
Pow
er T
rans
form
ers
DIS
COA
s on
30
th
June
No.
of
Pow
er
Tran
sfor
mer
sCa
paci
ty o
f Po
wer
Tr
ansf
orm
ers
(MVA
)N
o. o
f O
ver-
Load
ed P
ower
Tr
ansf
orm
ers
(abo
ve 8
0%)
132
kV66
kV
33 k
VTo
tal
132
kV66
kV
33 k
VTo
tal
132
kV66
kV
33 k
VTo
tal
% a
ge
PESC
O20
1517
332
721
24,
556.
8030
5.95
25.5
04,
888.
2594
174
115
54.2
520
1618
032
822
04,
929.
8030
5.95
29.5
05,
265.
2510
416
412
456
.36
2017
189
3110
230
5,44
9.50
286.
2537
.50
5,77
3.25
9316
411
349
.13
TESC
O20
1521
170
3842
2.30
190.
800.
0061
3.10
810
018
47.3
720
1618
170
3550
0.30
205.
400.
0070
5.70
86
014
40.0
020
1719
190
3852
7.30
237.
300.
0076
4.60
76
013
34.2
1
IESC
O20
1517
214
719
34,
192.
8013
3.60
30.0
04,
356.
4020
13
2412
.44
2016
173
147
194
4,21
8.80
133.
6030
.00
4,38
2.40
342
137
19.0
720
1718
59
820
24,
663.
1091
.30
33.0
04,
787.
4024
00
2411
.88
GEP
CO20
1513
79
014
63,
598.
8010
3.00
0.00
3,70
1.80
626
068
46.5
820
1614
59
015
44,
016.
8010
3.00
0.00
4,11
9.80
558
063
40.9
120
1715
010
016
04,
330.
8010
3.00
0.00
4,43
3.80
268
034
21.2
5
LESC
O20
1529
317
031
08,
005.
0021
5.30
0.00
8,22
0.30
160
130
173
55.8
120
1631
617
033
38,
972.
0021
5.30
0.00
9,18
7.30
139
120
151
45.3
520
1733
714
035
19,
673.
0017
6.30
0.00
9,84
9.30
117
100
127
36.1
8
FESC
O20
1514
241
018
33,
755.
0045
0.45
0.00
4,20
5.45
9020
011
060
.11
2016
150
380
188
4,03
3.00
425.
600.
004,
458.
6085
220
107
56.9
120
1716
035
019
54,
506.
0040
1.10
0.00
4,90
7.10
8218
010
051
.28
MEP
CO20
1521
334
024
75,
539.
0037
3.00
0.00
5,91
2.00
9722
011
948
.18
2016
234
350
269
6,21
0.80
378.
340.
006,
589.
1497
210
118
43.8
720
1725
329
028
27,
179.
3029
2.84
0.00
7,47
2.14
6510
075
26.6
0
HES
CO20
1585
240
109
1,75
3.40
237.
100.
001,
990.
5062
100
7266
.06
2016
8722
010
91,
833.
4021
1.10
0.00
2,04
4.50
677
074
67.8
920
1710
217
011
92,
264.
9014
6.10
0.00
2,41
1.00
545
059
49.5
8
SEPC
O20
1589
271
117
1,95
0.80
269.
806.
302,
226.
9024
80
3227
.35
2016
9124
111
61,
989.
3023
7.40
6.30
2,23
3.00
285
033
28.4
520
1790
271
118
2,07
3.80
269.
806.
302,
349.
9041
120
5344
.92
QES
CO20
1511
814
013
22,
596.
6010
9.50
0.00
2,70
6.10
639
072
54.5
520
1610
214
912
52,
294.
0085
.00
114.
002,
493.
0057
90
6652
.80
2017
110
149
133
2,37
5.00
85.0
011
6.00
2,57
6.00
6510
075
56.3
9
KEL
2015
126
30
129
4,65
1.50
69.0
00.
004,
720.
5042
00
4232
.56
2016
132
30
135
5,05
3.50
69.0
00.
005,
122.
5031
00
3122
.96
2017
135
30
138
5,19
5.50
69.0
00.
005,
264.
5058
10
5942
.75
Tota
l in
PEPC
O
Syst
em
2015
1,44
322
915
1,68
736
,370
.50
2,38
8.50
61.8
038
,820
.80
680
116
780
347
.60
2016
1,49
622
225
1,74
338
,998
.20
2,30
0.69
179.
8041
,478
.69
674
108
578
745
.15
2017
1,59
520
528
1,82
843
,042
.70
2,08
8.99
192.
8045
,324
.49
574
954
673
36.8
2So
urce
: Dis
trib
utio
n Co
mpa
nies
/ KE
L

240
TABLE 64Status of Distribution Lines (km)
DISCO As on 30th June 132 kV 66 kV 33 kV 11 kV Total HT
LinesTotal LT Lines
(0.4 kV)
PESC
O
2013 2,080 861 311 33,006 36,258 43,560 2014 2,147 841 311 33,337 36,636 43,801 2015 2,164 841 312 33,464 36,781 43,999 2016 2,209 841 312 33,785 37,147 44,330 2017 2,245 802 312 35,751 39,110 44,574
TESC
O
2013 259 383 805 7,363 8,810 6,380 2014 259 383 805 7,363 8,810 6,380 2015 259 383 805 7,746 9,193 6,532 2016 359 383 805 9,234 10,781 6,532 2017 359 402 805 9,935 11,501 6,532
IESC
O
2013 2,702 581 153 23,409 26,845 25,800 2014 2,717 581 153 23,596 27,047 26,009 2015 2,772 581 153 24,272 27,778 26,145 2016 2,897 581 153 24,607 28,238 26,286 2017 2,897 581 69 24,833 28,380 26,499
GEP
CO
2013 1,897 416 - 21,971 24,284 17,955 2014 2,054 332 - 22,216 24,602 18,087 2015 2,233 447 - 22,468 25,148 18,227 2016 2,349 447 - 22,520 25,316 18,227 2017 2,354 447 - 22,619 25,420 18,227
LESC
O
2013 2,519 - - 26,297 28,816 14,647 2014 2,572 - - 26,657 29,229 14,730 2015 2,252 429 - 27,095 29,776 14,808 2016 2,425 429 - 27,950 30,804 14,819 2017 2,554 410 - 27,950 30,914 14,819
FESC
O
2013 1,705 1,292 - 37,644 40,641 25,429 2014 1,844 1,260 - 38,093 41,197 25,770 2015 1,865 1,260 - 38,614 41,739 25,965 2016 2,014 1,260 - 39,266 42,540 28,036 2017 2,242 1,280 - 42,083 45,605 29,702
MEP
CO
2013 2,987 1,266 - 68,647 72,900 45,970 2014 3,169 1,154 - 69,453 73,776 46,251 2015 3,286 1,154 - 71,102 75,542 46,866 2016 3,305 1,048 - 71,971 76,324 47,204 2017 3,538 977 - 72,899 77,414 47,723
HES
CO
2013 1,939 975 - 26,196 29,110 14,132 2014 2,067 975 - 26,612 29,654 14,392 2015 2,133 975 - 26,914 30,022 14,690 2016 2,158 957 - 27,850 30,965 14,833 2017 2,445 899 - 28,055 31,399 14,892
SEPC
O
2013 1,887 753 - 23,814 26,454 13,272 2014 1,900 753 - 24,277 26,930 13,471 2015 1,995 753 - 24,192 26,940 13,471 2016 2,017 733 - 23,880 26,630 13,348 2017 2,135 733 - 24,449 27,317 13,497
QES
CO
2013 4,299 491 985 32,153 37,928 14,042 2014 4,299 491 985 33,425 39,200 14,373 2015 4,299 491 985 34,179 39,954 14,654 2016 4,299 502 985 35,086 40,872 14,958 2017 4,299 502 1,981 36,088 42,870 15,577

241
As on 30th June 132 kV 66 kV 33 kV 11 kV Total HT
LinesTotal LT Lines
(0.4 kV)KE
L2013 761 149 - 8,071 8,981 n.p. 2014 761 149 - 8,335 9,245 17,645 2015 762 149 - 8,834 9,745 17,645 2016 762 149 - 9,247 10,158 18,000 2017 766 149 - 9,363 10,278 19,962
Tota
l in
PEPC
O
Syst
em
2013 22,274 7,018 2,254 300,500 332,046 221,187 2014 23,028 6,770 2,254 305,029 337,081 223,264 2015 23,258 7,314 2,255 310,046 342,873 225,357 2016 24,032 7,181 2,255 316,149 349,617 228,573 2017 25,068 7,033 3,167 324,662 359,930 232,042
Source: Distribution Companies / KEL
TABLE 65Feeders Outages Statistics of DISCOs (2016-17)
DISCONature of Tripping
132 kV Feeders 66 kV Feeders 33 kV Feeders 11 kV Feeders All FeedersNo. of
TrippingDuration
(Min.)No. of
TrippingDuration
(Min.)No. of
TrippingDuration
(Min.)No. of
TrippingDuration
(Min.)No. of
TrippingDuration
(Min.)
PESCOPlanned 394 199509 104 38255 5 1825 15638 1321187 16141 1560776Forced 416 68074 146 33516 39 720 28386 2507381 28987 2609691Total 810 267583 250 71771 44 2545 44024 3828568 45128 4170467
TESCOPlanned 30 2640 40 2920 35 3150 2640 2730 2745 11440Forced 34 2505 40 2820 33 2775 1220 29270 1327 37370Total 64 5145 80 5740 68 5925 3860 32000 4072 48810
IESCOPlanned 142 63275 7 181 18 255 976859 59658660 977026 59722371Forced 87 2256 5 165 0 0 23202 1735268 23294 1737689Total 229 65531 12 346 18 255 1000061 61393928 1000320 61460060
GEPCOPlanned 29 10560 14 4620 0 0 1978 275580 2021 275623Forced 242 40391 47 3521 0 0 4546 125640 4835 169552Total 271 50951 61 8141 0 0 6524 401220 6856 445175
LESCOPlanned 876 127201 63 6015 0 0 0 0 939 133216Forced 5782 362741 1419 98170 0 0 0 0 7201 460911Total 6658 489942 1482 104185 0 0 0 0 8140 594127
FESCOPlanned 252 63008 87 22348 0 0 7627 1557456 7966 1642812Forced 96 17151 44 4987 0 0 66338 1030902 66478 1053040Total 348 80159 131 27335 0 0 73965 2588358 74444 2695852
MEPCOPlanned 1010 286993 127 60255 0 0 3802 681009 4939 1028257Forced 578 134760 105 10750 0 0 194661 2198192 195344 2343702Total 1588 421753 232 71005 0 0 198463 2879201 200283 3371959
HESCOPlanned 51 20685 35 11145 0 0 293 24060 379 55890Forced 283 57931 298 70653 0 0 54702 503880 55283 632464Total 334 78616 333 81798 0 0 54995 527940 55662 688354
SEPCOPlanned 668 446811 137 45899 0 0 2164 574156 2969 1066866Forced 200 61762 93 19858 0 0 136480 23520024 136773 23601644Total 868 508573 230 65757 0 0 138644 24094180 139742 24668510
QESCOPlanned 127 22860 32 5760 0 0 3840 460800 3999 489420Forced 71 8570 23 2760 0 0 15360 307200 15454 318530Total 198 31430 55 8520 0 0 19200 768000 19453 807950
KELPlanned 9 5271 0 0 0 0 11327 4162951 11336 4168222Forced 45 8792 0 0 0 0 22808 1288688 22853 1297480Total 54 14063 0 0 0 0 34135 5451639 34189 5465702
Source: Distribution Companies / KEL
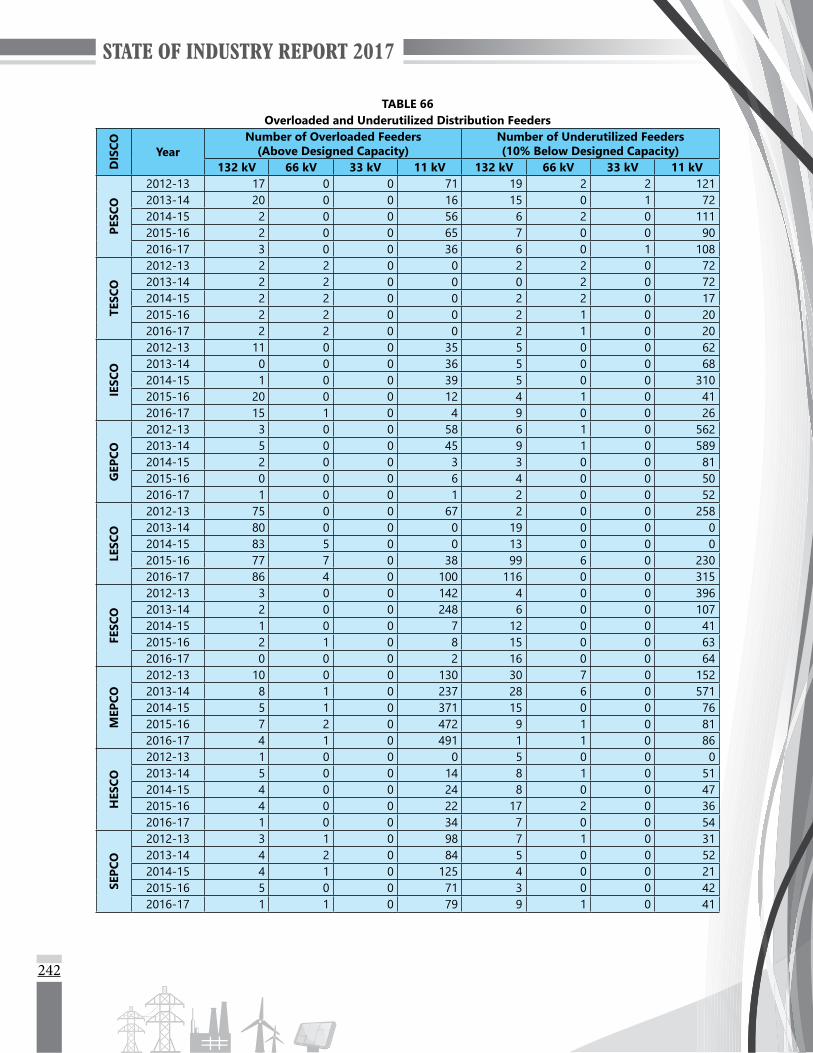
242
TABLE 66Overloaded and Underutilized Distribution Feeders
DIS
CO YearNumber of Overloaded Feeders
(Above Designed Capacity)Number of Underutilized Feeders (10% Below Designed Capacity)
132 kV 66 kV 33 kV 11 kV 132 kV 66 kV 33 kV 11 kV
PESC
O
2012-13 17 0 0 71 19 2 2 1212013-14 20 0 0 16 15 0 1 722014-15 2 0 0 56 6 2 0 1112015-16 2 0 0 65 7 0 0 902016-17 3 0 0 36 6 0 1 108
TESC
O
2012-13 2 2 0 0 2 2 0 722013-14 2 2 0 0 0 2 0 722014-15 2 2 0 0 2 2 0 172015-16 2 2 0 0 2 1 0 202016-17 2 2 0 0 2 1 0 20
IESC
O
2012-13 11 0 0 35 5 0 0 622013-14 0 0 0 36 5 0 0 682014-15 1 0 0 39 5 0 0 3102015-16 20 0 0 12 4 1 0 412016-17 15 1 0 4 9 0 0 26
GEP
CO
2012-13 3 0 0 58 6 1 0 5622013-14 5 0 0 45 9 1 0 5892014-15 2 0 0 3 3 0 0 812015-16 0 0 0 6 4 0 0 502016-17 1 0 0 1 2 0 0 52
LESC
O
2012-13 75 0 0 67 2 0 0 2582013-14 80 0 0 0 19 0 0 02014-15 83 5 0 0 13 0 0 02015-16 77 7 0 38 99 6 0 2302016-17 86 4 0 100 116 0 0 315
FESC
O
2012-13 3 0 0 142 4 0 0 3962013-14 2 0 0 248 6 0 0 1072014-15 1 0 0 7 12 0 0 412015-16 2 1 0 8 15 0 0 632016-17 0 0 0 2 16 0 0 64
MEP
CO
2012-13 10 0 0 130 30 7 0 1522013-14 8 1 0 237 28 6 0 5712014-15 5 1 0 371 15 0 0 762015-16 7 2 0 472 9 1 0 812016-17 4 1 0 491 1 1 0 86
HES
CO
2012-13 1 0 0 0 5 0 0 02013-14 5 0 0 14 8 1 0 512014-15 4 0 0 24 8 0 0 472015-16 4 0 0 22 17 2 0 362016-17 1 0 0 34 7 0 0 54
SEPC
O
2012-13 3 1 0 98 7 1 0 312013-14 4 2 0 84 5 0 0 522014-15 4 1 0 125 4 0 0 212015-16 5 0 0 71 3 0 0 422016-17 1 1 0 79 9 1 0 41
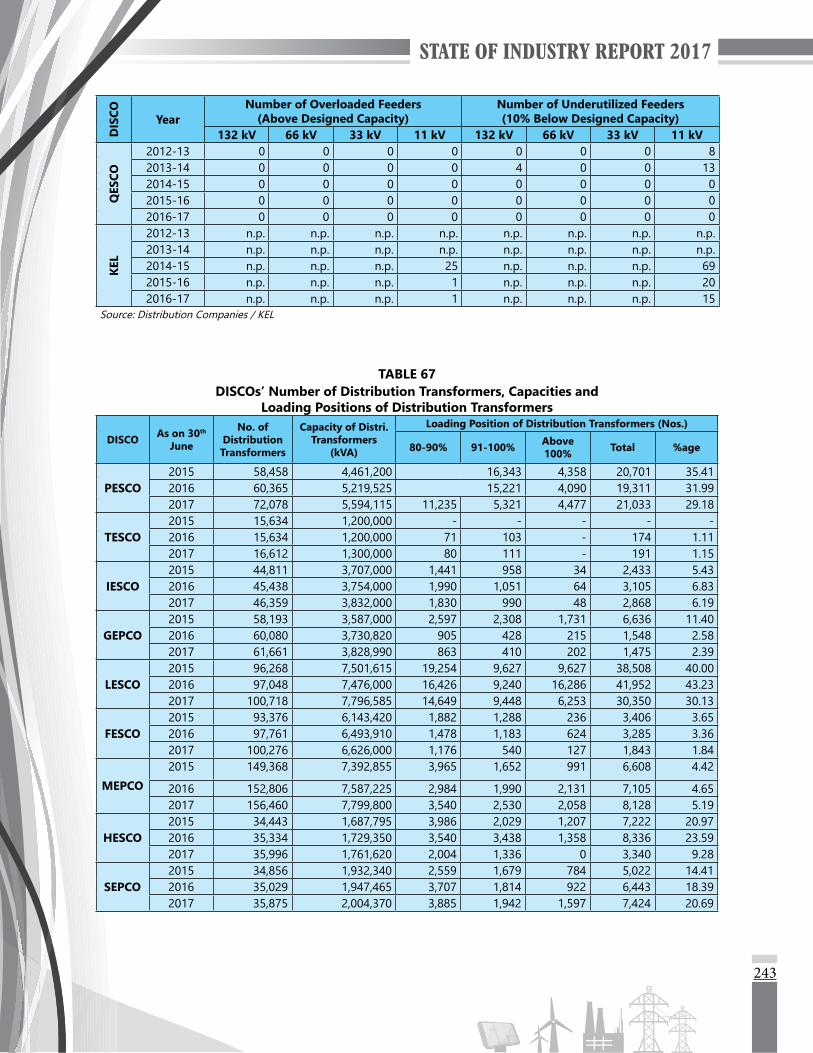
243
DIS
CO YearNumber of Overloaded Feeders
(Above Designed Capacity)Number of Underutilized Feeders (10% Below Designed Capacity)
132 kV 66 kV 33 kV 11 kV 132 kV 66 kV 33 kV 11 kV
QES
CO
2012-13 0 0 0 0 0 0 0 82013-14 0 0 0 0 4 0 0 132014-15 0 0 0 0 0 0 0 02015-16 0 0 0 0 0 0 0 02016-17 0 0 0 0 0 0 0 0
KEL
2012-13 n.p. n.p. n.p. n.p. n.p. n.p. n.p. n.p.2013-14 n.p. n.p. n.p. n.p. n.p. n.p. n.p. n.p.2014-15 n.p. n.p. n.p. 25 n.p. n.p. n.p. 692015-16 n.p. n.p. n.p. 1 n.p. n.p. n.p. 202016-17 n.p. n.p. n.p. 1 n.p. n.p. n.p. 15
Source: Distribution Companies / KEL
TABLE 67DISCOs’ Number of Distribution Transformers, Capacities and
Loading Positions of Distribution Transformers
DISCO As on 30th June
No. of Distribution Transformers
Capacity of Distri.Transformers
(kVA)
Loading Position of Distribution Transformers (Nos.)
80-90% 91-100% Above 100% Total %age
PESCO2015 58,458 4,461,200 16,343 4,358 20,701 35.412016 60,365 5,219,525 15,221 4,090 19,311 31.992017 72,078 5,594,115 11,235 5,321 4,477 21,033 29.18
TESCO2015 15,634 1,200,000 - - - - - 2016 15,634 1,200,000 71 103 - 174 1.112017 16,612 1,300,000 80 111 - 191 1.15
IESCO2015 44,811 3,707,000 1,441 958 34 2,433 5.432016 45,438 3,754,000 1,990 1,051 64 3,105 6.832017 46,359 3,832,000 1,830 990 48 2,868 6.19
GEPCO2015 58,193 3,587,000 2,597 2,308 1,731 6,636 11.402016 60,080 3,730,820 905 428 215 1,548 2.582017 61,661 3,828,990 863 410 202 1,475 2.39
LESCO2015 96,268 7,501,615 19,254 9,627 9,627 38,508 40.002016 97,048 7,476,000 16,426 9,240 16,286 41,952 43.232017 100,718 7,796,585 14,649 9,448 6,253 30,350 30.13
FESCO2015 93,376 6,143,420 1,882 1,288 236 3,406 3.652016 97,761 6,493,910 1,478 1,183 624 3,285 3.362017 100,276 6,626,000 1,176 540 127 1,843 1.84
MEPCO2015 149,368 7,392,855 3,965 1,652 991 6,608 4.42
2016 152,806 7,587,225 2,984 1,990 2,131 7,105 4.652017 156,460 7,799,800 3,540 2,530 2,058 8,128 5.19
HESCO2015 34,443 1,687,795 3,986 2,029 1,207 7,222 20.972016 35,334 1,729,350 3,540 3,438 1,358 8,336 23.592017 35,996 1,761,620 2,004 1,336 0 3,340 9.28
SEPCO2015 34,856 1,932,340 2,559 1,679 784 5,022 14.412016 35,029 1,947,465 3,707 1,814 922 6,443 18.392017 35,875 2,004,370 3,885 1,942 1,597 7,424 20.69

244
DISCO As on 30th June
No. of Distribution Transformers
Capacity of Distri. Transformers
(kVA)
Loading Position of Distribution Transformers (Nos.)
80-90% 91-100% Above 100% Total %age
QES
CO
2015 51,886 2,571,468 4,125 2,350 1,807 8,282 15.962016 53,646 2,643,795 4,081 2,725 1,937 8,743 16.302017 55,770 2,752,000 4,191 2,735 1,947 8,873 15.91
KEL
2015 20,979 6,047,850 468 185 76 729 3.472016 23,321 6,302,340 416 165 67 648 2.782017 25,667 7,230,425 354 140 57 551 2.15
Tota
l in
PEPC
O
Syst
em
2015 637,293 40,184,693 56,152 21,891 20,775 98,818 15.512016 653,141 41,782,090 50,403 21,972 27,627 100,002 15.312017 681,805 43,295,480 43,453 25,363 16,709 85,525 12.54
Source: Distribution Companies / KEL
TABLE 68Village Electrification in all Distribution Companies
DISCO As on 30th June Total Number of Villages
Total Villages Electrified
Percentage of Total Electrified Villages
PESCO
2013 26,017 20,274 77.932014 26,387 20,554 77.892015 27,817 20,961 75.352016 28,844 22,202 76.972017 30,098 23,664 78.62
TESCO
2013 39 38 97.442014 58 38 65.522015 397 19 4.792016 397 30 7.562017 400 35 8.75
IESCO
2013 2,717 2,109 77.622014 2,717 2,109 77.622015 537 270 50.282016 700 266 38.002017 591 271 45.85
GEPCO
2013 6,804 6,804 100.002014 6,854 6,854 100.002015 6,977 6,886 98.702016 7,070 7,013 99.192017 7,070 7,013 99.19
LESCO
2013 3,686 2,543 68.992014 3,913 2,728 69.722015 3,913 2,859 73.062016 4,159 2,976 71.562017 4,159 2,976 71.56
FESCO
2013 22,657 21,209 93.612014 22,930 21,505 93.792015 23,277 21,831 93.792016 25,325 22,499 88.842017 26,069 22,890 87.81

245
DISCO As on 30th June Total Number of Villages
Total Villages Electrified
Percentage of Total Electrified Villages
MEPCO
2013 21,325 19,902 93.332014 25,055 21,240 84.772015 26,310 22,287 84.712016 28,618 24,595 85.942017 31,651 26,315 83.14
HESCO
2013 23,803 15,961 67.052014 23,803 16,424 69.002015 23,803 17,010 71.462016 23,803 17,643 74.122017 23,803 18,147 76.24
SEPCO
2013 22,927 15,795 68.892014 23,263 16,189 69.592015 23,263 16,515 70.992016 23,263 16,949 72.862017 23,263 17,365 74.65
QESCO
2013 17,123 16,016 93.542014 23,819 17,517 73.542015 23,819 18,017 75.642016 23,819 19,559 82.122017 23,819 21,586 90.63
KEL
2013 889 636 71.542014 889 661 74.352015 889 702 78.972016 889 747 84.032017 889 821 92.35
Total in PEPCO System
2013 147,098 120,651 82.022014 158,799 125,158 78.822015 160,113 126,655 79.102016 165,998 133,732 80.562017 170,923 140,262 82.06
Source: Distribution Companies / KEL
TABLE 69Applications of New Connections Received, Energized and Pending
DISCO Year Applications Received (Nos.)
Connection Applications Pending (Nos.)Sanctioned (Nos.) Load (kW)
PESCO
2012-13 80,374 89,626 169,208 -9,2522013-14 106,014 82,407 188,240 23,6072014-15 126,970 103,848 217,731 23,1222015-16 127,476 109,693 260,302 17,7832016-17 132,615 113,460 286,783 19,155
TESCO
2012-13 117 84 1,844 332013-14 609 63 258 5462014-15 641 162 2,853 4792015-16 722 722 7,932 02016-17 200 120 410 80
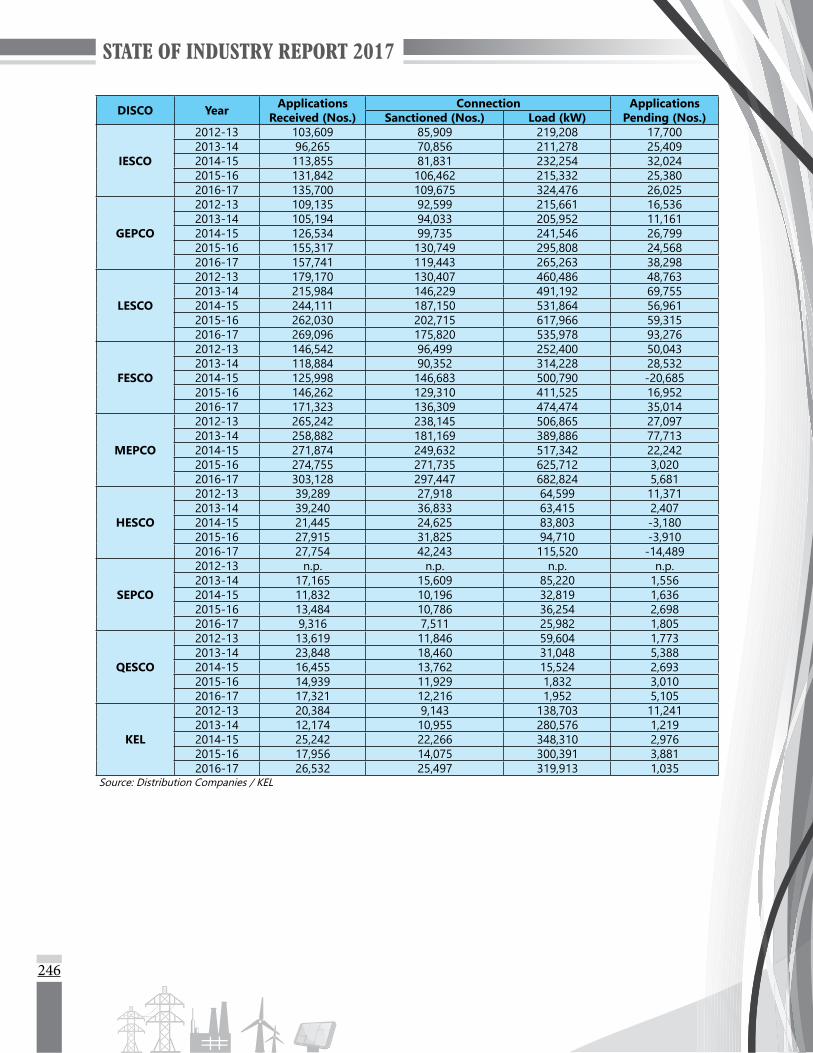
246
DISCO Year Applications Received (Nos.)
Connection Applications Pending (Nos.)Sanctioned (Nos.) Load (kW)
IESCO
2012-13 103,609 85,909 219,208 17,7002013-14 96,265 70,856 211,278 25,4092014-15 113,855 81,831 232,254 32,0242015-16 131,842 106,462 215,332 25,3802016-17 135,700 109,675 324,476 26,025
GEPCO
2012-13 109,135 92,599 215,661 16,5362013-14 105,194 94,033 205,952 11,1612014-15 126,534 99,735 241,546 26,7992015-16 155,317 130,749 295,808 24,5682016-17 157,741 119,443 265,263 38,298
LESCO
2012-13 179,170 130,407 460,486 48,7632013-14 215,984 146,229 491,192 69,7552014-15 244,111 187,150 531,864 56,9612015-16 262,030 202,715 617,966 59,3152016-17 269,096 175,820 535,978 93,276
FESCO
2012-13 146,542 96,499 252,400 50,0432013-14 118,884 90,352 314,228 28,5322014-15 125,998 146,683 500,790 -20,6852015-16 146,262 129,310 411,525 16,9522016-17 171,323 136,309 474,474 35,014
MEPCO
2012-13 265,242 238,145 506,865 27,0972013-14 258,882 181,169 389,886 77,7132014-15 271,874 249,632 517,342 22,2422015-16 274,755 271,735 625,712 3,0202016-17 303,128 297,447 682,824 5,681
HESCO
2012-13 39,289 27,918 64,599 11,3712013-14 39,240 36,833 63,415 2,4072014-15 21,445 24,625 83,803 -3,1802015-16 27,915 31,825 94,710 -3,9102016-17 27,754 42,243 115,520 -14,489
SEPCO
2012-13 n.p. n.p. n.p. n.p.2013-14 17,165 15,609 85,220 1,5562014-15 11,832 10,196 32,819 1,6362015-16 13,484 10,786 36,254 2,6982016-17 9,316 7,511 25,982 1,805
QESCO
2012-13 13,619 11,846 59,604 1,7732013-14 23,848 18,460 31,048 5,3882014-15 16,455 13,762 15,524 2,6932015-16 14,939 11,929 1,832 3,0102016-17 17,321 12,216 1,952 5,105
KEL
2012-13 20,384 9,143 138,703 11,2412013-14 12,174 10,955 280,576 1,2192014-15 25,242 22,266 348,310 2,9762015-16 17,956 14,075 300,391 3,8812016-17 26,532 25,497 319,913 1,035
Source: Distribution Companies / KEL
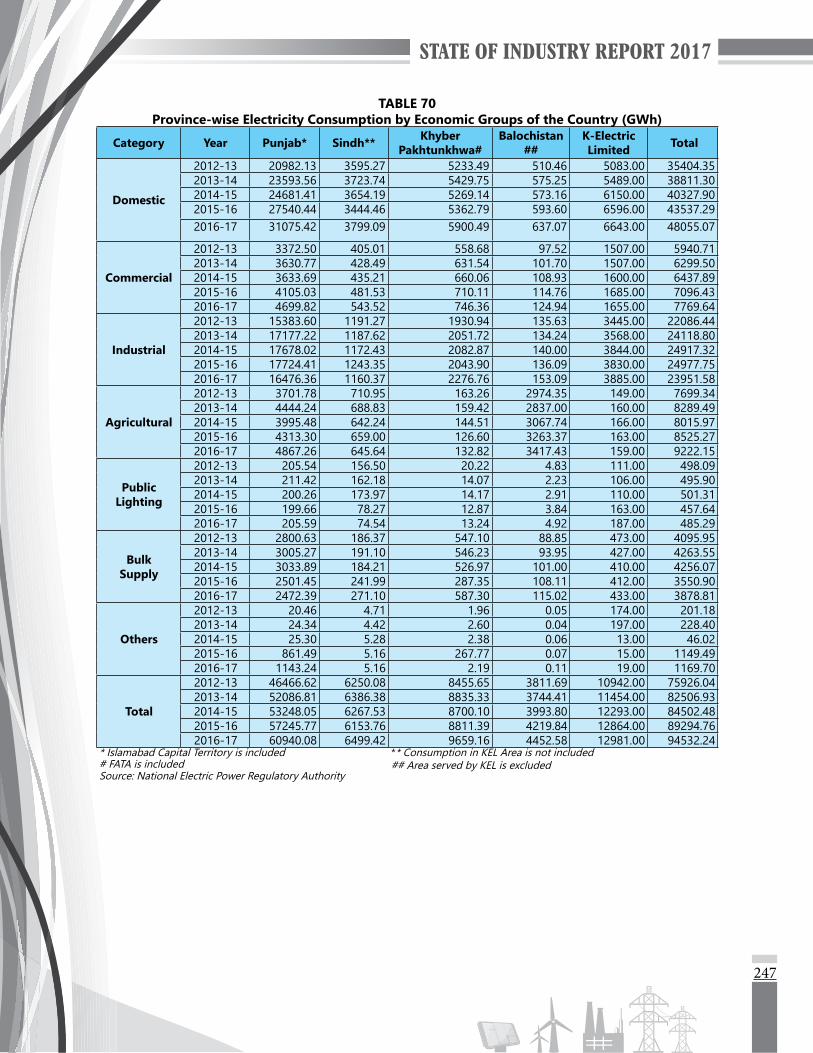
247
TABLE 70Province-wise Electricity Consumption by Economic Groups of the Country (GWh)
Category Year Punjab* Sindh** Khyber Pakhtunkhwa#
Balochistan##
K-Electric Limited Total
Domestic
2012-13 20982.13 3595.27 5233.49 510.46 5083.00 35404.352013-14 23593.56 3723.74 5429.75 575.25 5489.00 38811.302014-15 24681.41 3654.19 5269.14 573.16 6150.00 40327.902015-16 27540.44 3444.46 5362.79 593.60 6596.00 43537.292016-17 31075.42 3799.09 5900.49 637.07 6643.00 48055.07
Commercial
2012-13 3372.50 405.01 558.68 97.52 1507.00 5940.712013-14 3630.77 428.49 631.54 101.70 1507.00 6299.502014-15 3633.69 435.21 660.06 108.93 1600.00 6437.892015-16 4105.03 481.53 710.11 114.76 1685.00 7096.432016-17 4699.82 543.52 746.36 124.94 1655.00 7769.64
Industrial
2012-13 15383.60 1191.27 1930.94 135.63 3445.00 22086.442013-14 17177.22 1187.62 2051.72 134.24 3568.00 24118.802014-15 17678.02 1172.43 2082.87 140.00 3844.00 24917.322015-16 17724.41 1243.35 2043.90 136.09 3830.00 24977.752016-17 16476.36 1160.37 2276.76 153.09 3885.00 23951.58
Agricultural
2012-13 3701.78 710.95 163.26 2974.35 149.00 7699.342013-14 4444.24 688.83 159.42 2837.00 160.00 8289.492014-15 3995.48 642.24 144.51 3067.74 166.00 8015.972015-16 4313.30 659.00 126.60 3263.37 163.00 8525.272016-17 4867.26 645.64 132.82 3417.43 159.00 9222.15
Public Lighting
2012-13 205.54 156.50 20.22 4.83 111.00 498.092013-14 211.42 162.18 14.07 2.23 106.00 495.902014-15 200.26 173.97 14.17 2.91 110.00 501.312015-16 199.66 78.27 12.87 3.84 163.00 457.642016-17 205.59 74.54 13.24 4.92 187.00 485.29
Bulk Supply
2012-13 2800.63 186.37 547.10 88.85 473.00 4095.952013-14 3005.27 191.10 546.23 93.95 427.00 4263.552014-15 3033.89 184.21 526.97 101.00 410.00 4256.072015-16 2501.45 241.99 287.35 108.11 412.00 3550.902016-17 2472.39 271.10 587.30 115.02 433.00 3878.81
Others
2012-13 20.46 4.71 1.96 0.05 174.00 201.182013-14 24.34 4.42 2.60 0.04 197.00 228.402014-15 25.30 5.28 2.38 0.06 13.00 46.022015-16 861.49 5.16 267.77 0.07 15.00 1149.492016-17 1143.24 5.16 2.19 0.11 19.00 1169.70
Total
2012-13 46466.62 6250.08 8455.65 3811.69 10942.00 75926.042013-14 52086.81 6386.38 8835.33 3744.41 11454.00 82506.932014-15 53248.05 6267.53 8700.10 3993.80 12293.00 84502.482015-16 57245.77 6153.76 8811.39 4219.84 12864.00 89294.762016-17 60940.08 6499.42 9659.16 4452.58 12981.00 94532.24
* Islamabad Capital Territory is included ** Consumption in KEL Area is not included## Area served by KEL is excluded# FATA is included
Source: National Electric Power Regulatory Authority

248
TABLE 71Province-wise Electricity Consumption by Economic Groups of the Country (%)
Category Year Punjab* Sindh** Khyber Pakhtunkhwa#
Balochistan##
K-Electric Limited Total
Domestic
2012-13 45.16 57.52 61.89 13.39 46.45 46.632013-14 45.30 58.31 61.45 15.36 47.92 47.042014-15 46.35 58.30 60.56 14.35 50.03 47.722015-16 48.11 55.97 60.86 14.07 51.27 48.762016-17 50.99 58.45 61.09 14.31 51.17 50.83
Commercial
2012-13 7.26 6.48 6.61 2.56 13.77 7.822013-14 6.97 6.71 7.15 2.72 13.16 7.642014-15 6.82 6.94 7.59 2.73 13.02 7.622015-16 7.17 7.82 8.06 2.72 13.10 7.952016-17 7.71 8.36 7.73 2.81 12.75 8.22
Industrial
2012-13 33.11 19.06 22.84 3.56 31.48 29.092013-14 32.98 18.60 23.22 3.59 31.15 29.232014-15 33.20 18.71 23.94 3.51 31.27 29.492015-16 30.96 20.20 23.20 3.23 29.77 27.972016-17 27.04 17.85 23.57 3.44 29.93 25.34
Agricultural
2012-13 7.97 11.38 1.93 78.03 1.36 10.142013-14 8.53 10.79 1.80 75.77 1.40 10.052014-15 7.50 10.25 1.66 76.81 1.35 9.492015-16 7.53 10.71 1.44 77.33 1.27 9.552016-17 7.99 9.93 1.38 76.75 1.22 9.76
Public Lighting
2012-13 0.44 2.50 0.24 0.13 1.01 0.662013-14 0.41 2.54 0.16 0.06 0.93 0.602014-15 0.38 2.78 0.16 0.07 0.89 0.592015-16 0.35 1.27 0.15 0.09 1.27 0.512016-17 0.34 1.15 0.14 0.11 1.44 0.51
Bulk Supply
2012-13 6.03 2.98 6.47 2.33 4.32 5.392013-14 5.77 2.99 6.18 2.51 3.73 5.172014-15 5.70 2.94 6.06 2.53 3.34 5.042015-16 4.37 3.93 3.26 2.56 3.20 3.982016-17 4.06 4.17 6.08 2.58 3.34 4.10
Others
2012-13 0.04 0.08 0.02 0.00 1.59 0.262013-14 0.05 0.07 0.03 0.00 1.72 0.282014-15 0.05 0.08 0.03 0.00 0.11 0.052015-16 1.50 0.08 3.04 0.00 0.12 1.292016-17 1.88 0.08 0.02 0.00 0.15 1.24
Total
2012-13 100.00 100.00 100.00 100.00 100.00 100.002013-14 100.00 100.00 100.00 100.00 100.00 100.002014-15 100.00 100.00 100.00 100.00 100.00 100.002015-16 100.00 100.00 100.00 100.00 100.00 100.002016-17 100.00 100.00 100.00 100.00 100.00 100.00
* Islamabad Capital Territory is included ** Consumption in KEL Area is not included# FATA is included ## Area served by KEL is excludedSource: National Electric Power Regulatory Authority

STATE OF INDUSTRY REPORT 2017
ELECTRICITY TARIFF

251
ELECTRICITY TARIFF
14.1 GENERALThe determination of tariff for electric power services is one of the primary responsibilities of NEPRA. NEPRA determines electricity tariff, keeping in view the principles of economic efficiency and service quality according to the prescribed Tariff Standards and Procedure Rules, 1998. Under Section 7 (3) of the NEPRA Act, NEPRA has been expressly conferred the power to determine tariff, rates, charges and other terms and conditions for the supply of electric power services by generation, transmission and distribution companies and to recommend these to the Federal Government for notification.
14.2 TARIFF SETTINGThe procedures and standards in accordance with which tariffs are required to be determined, modified or revised are prescribed in the NEPRA (Tariff Standards and Procedure) Rules, 1998.
14.3 TARIFF STANDARDSi) Tariffs should allow licensees the recovery of any and all costs prudently incurred to meet the
demonstrated needs of their customers, provided that assessments of licensees’ prudence may not be required where tariffs are set on other than cost-of-service basis, such as formula-based tariffs that are designed to be in place for more than one year;
ii) Tariffs should generally be calculated by including a depreciation charge and a rate of return on the capital investment of each licensee commensurate to the earned by other investments of comparable risk;
iii) Tariffs should allow licensees a rate of return which promotes continued reasonable investment in equipment and facilities for improved and efficient service;
iv) Tariffs should include a mechanism to allow licensees a benefit from, and penalties for failure to achieve, the efficiencies in the cost of providing the service and the quality of service;
v) Tariffs should reflect marginal cost principles to the extent feasible, keeping in view the financial stability of the sector;
vi) The Authority shall have a preference for competition rather than regulation and shall adopt policies and establish tariffs towards that end;
vii) The tariff regime should clearly identify interclass and inter-region subsides and shall provide such subsides transparently if found essential, with a view to minimizing if not eliminating them keeping in view the need for an adequate transition period;
viii) Tariffs may be set below the level of cost of providing the service to consumers consuming electric power below the consumption levels determined for the purpose from time to time by the Authority, as long as such tariffs are financially sustainable;
ix) Tariffs should, to the extent feasible, reflect the full cost of service to consumer groups with similar service requirements;
x) Tariff should take into account Government subsidies or the need for adjustment to finance rural electrification in accordance with the policies of the Government;
xi) The application of the tariffs should allow reasonable transition periods for the adjustments of tariffs to meet the standards and other requirements pursuant to the NEPRA Act including the performance standards, industry standards and the uniform codes of conduct;
xii) Tariffs should seek to provide stability and predictability for customers; andxiii) Tariffs should be comprehensible, free of misinterpretation and shall state explicitly each component
thereof.
NEPRA is required to determine electricity tariff so as to protect the interest of the consumers as well as electric power producers/suppliers. Any raise in tariff requested by the producers/ suppliers of electricity has to be allowed or rejected by NEPRA after analyzing all the costs involved in the proposed sale price. For any determination of tariff, the following points are generally considered by NEPRA in addition to other points on a case-to-case basis:
i) Utility should be able to recover its costs with some surplus for capacity expansion or return on equity.
ii) The average sale rate should provide for reasonable rate of return.
14
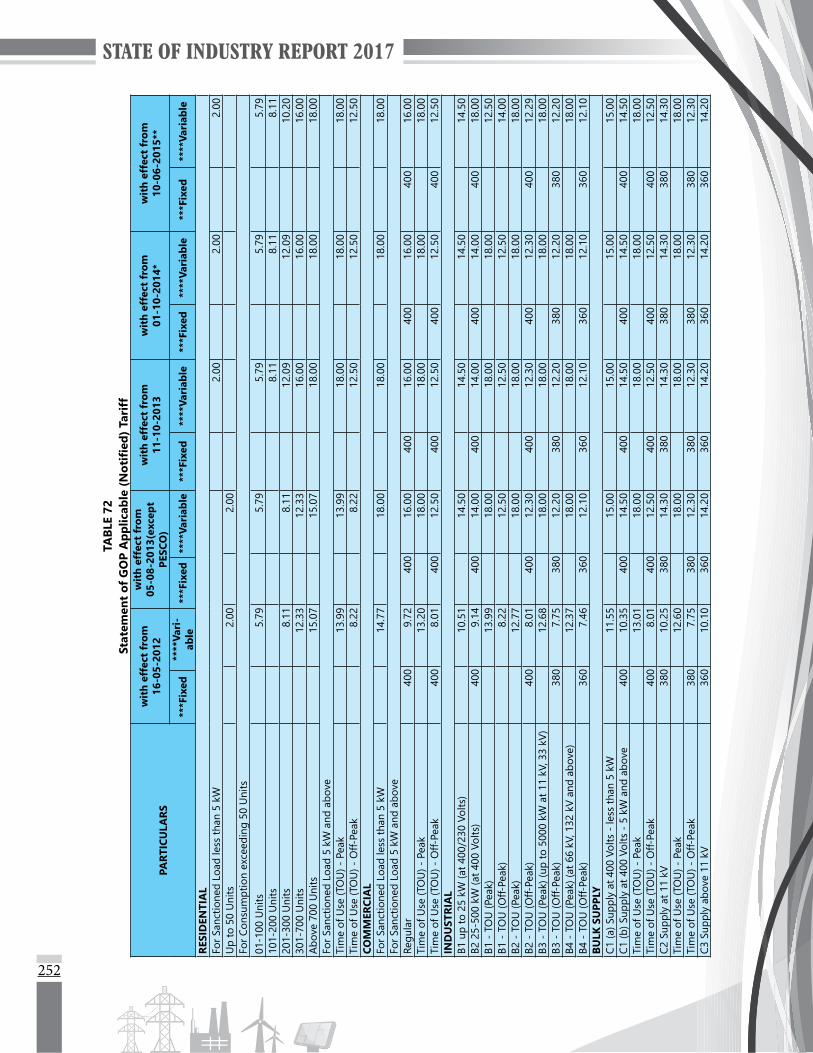
252
TABL
E 72
Stat
emen
t of
GO
P A
pplic
able
(Not
ified
) Tar
iff
PART
ICU
LARS
wit
h ef
fect
fro
m
16-0
5-20
12
wit
h ef
fect
fro
m
05-0
8-20
13(e
xcep
t PE
SCO
)
wit
h ef
fect
fro
m
11-1
0-20
13
wit
h ef
fect
fro
m
01-1
0-20
14*
wit
h ef
fect
fro
m
10-0
6-20
15**
***F
ixed
****
Vari
-ab
le**
*Fix
ed**
**Va
riab
le**
*Fix
ed**
**Va
riab
le**
*Fix
ed**
**Va
riab
le**
*Fix
ed**
**Va
riab
le
RESI
DEN
TIA
LFo
r San
ctio
ned
Load
less
than
5 k
W
2.00
2.00
2
.00
Up
to 5
0 U
nits
2.
00
2.
00
For C
onsu
mpt
ion
exce
edin
g 50
Uni
ts01
-100
Uni
ts
5.79
5.79
5.79
5.79
5
.79
101-
200
Uni
ts
8.11
8.11
8
.11
201-
300
Uni
ts
8.11
8.11
12.0
9
12.0
9
10.2
0 30
1-70
0 U
nits
12
.33
12
.33
16
.00
16
.00
16
.00
Abo
ve 7
00 U
nits
15
.07
15
.07
18
.00
18
.00
18
.00
For S
anct
ione
d Lo
ad 5
kW
and
abo
veTi
me
of U
se (T
OU
) - P
eak
13
.99
13
.99
18
.00
18
.00
18
.00
Tim
e of
Use
(TO
U) -
Off-
Peak
8.
22
8.
22
12
.50
12
.50
12
.50
COM
MER
CIA
LFo
r San
ctio
ned
Load
less
than
5 k
W
14.7
7
18.0
0
18.0
0
18.0
0
18.0
0 Fo
r San
ctio
ned
Load
5 k
W a
nd a
bove
Regu
lar
400
9.72
40
0 16
.00
400
16.0
0 40
0 16
.00
400
16.0
0 Ti
me
of U
se (T
OU
) - P
eak
13
.20
18
.00
18
.00
18
.00
18
.00
Tim
e of
Use
(TO
U) -
Off-
Peak
400
8.01
40
0 12
.50
400
12.5
0 40
0 12
.50
400
12.5
0 IN
DU
STRI
AL
B1 u
p to
25
kW (a
t 400
/230
Vol
ts)
10
.51
14
.50
14
.50
14
.50
14
.50
B2 2
5-50
0 kW
(at 4
00 V
olts
)40
0 9.
14
400
14.0
0 40
0 14
.00
400
14.0
040
0 18
.00
B1 -
TO
U (P
eak)
13
.99
18
.00
18
.00
18
.00
12
.50
B1 -
TO
U (O
ff-Pe
ak)
8.
22
12
.50
12
.50
12
.50
14
.00
B2 -
TO
U (P
eak)
12
.77
18
.00
18
.00
18
.00
18
.00
B2 -
TO
U (O
ff-Pe
ak)
400
8.01
40
0 12
.30
400
12.3
0 40
0 12
.30
400
12.2
9 B3
- T
OU
(Pea
k) (u
p to
500
0 kW
at 1
1 kV
, 33
kV)
12
.68
18
.00
18
.00
18
.00
18
.00
B3 -
TO
U (O
ff-Pe
ak)
380
7.75
38
0 12
.20
380
12.2
0 38
0 12
.20
380
12.2
0 B4
- T
OU
(Pea
k) (a
t 66
kV, 1
32 k
V an
d ab
ove)
12
.37
18
.00
18
.00
18
.00
18
.00
B4 -
TO
U (O
ff-Pe
ak)
360
7.46
36
0 12
.10
360
12.1
0 36
0 12
.10
360
12.1
0 BU
LK S
UPP
LY
C1 (a
) Sup
ply
at 4
00 V
olts
- le
ss th
an 5
kW
11
.55
15
.00
15
.00
15
.00
15
.00
C1 (b
) Sup
ply
at 4
00 V
olts
- 5
kW
and
abo
ve40
0 10
.35
400
14.5
0 40
0 14
.50
400
14.5
040
0 14
.50
Tim
e of
Use
(TO
U) -
Pea
k
13.0
1
18.0
0
18.0
0
18.0
0
18.0
0 Ti
me
of U
se (T
OU
) - O
ff-Pe
ak40
0 8.
01
400
12.5
0 40
0 12
.50
400
12.5
040
0 12
.50
C2 S
uppl
y at
11
kV38
0 10
.25
380
14.3
0 38
0 14
.30
380
14.3
038
0 14
.30
Tim
e of
Use
(TO
U) -
Pea
k
12.6
0
18.0
0
18.0
0
18.0
0
18.0
0 Ti
me
of U
se (T
OU
) - O
ff-Pe
ak38
0 7.
75
380
12.3
0 38
0 12
.30
380
12.3
038
0 12
.30
C3 S
uppl
y ab
ove
11 k
V36
0 10
.10
360
14.2
0 36
0 14
.20
360
14.2
036
0 14
.20
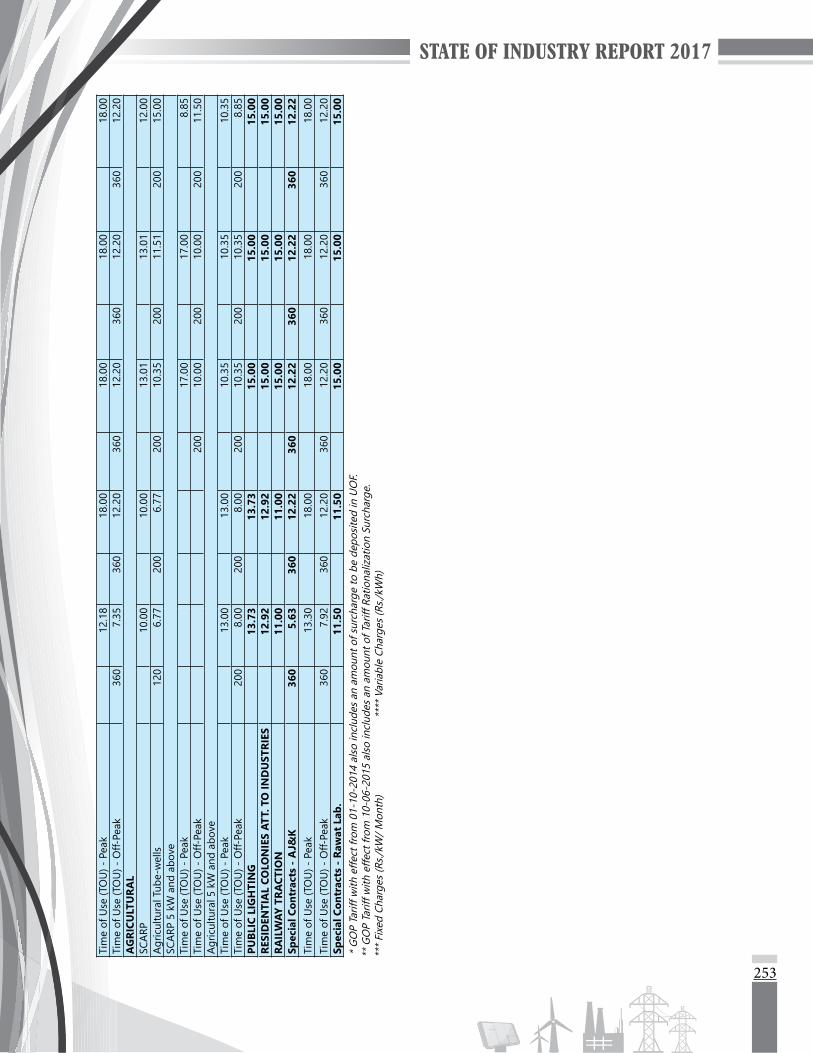
253
Tim
e of
Use
(TO
U) -
Pea
k
12.1
8
18.0
0
18.0
0
18.0
0
18.0
0 Ti
me
of U
se (T
OU
) - O
ff-Pe
ak36
0 7.
35
360
12.2
0 36
0 12
.20
360
12.2
036
0 12
.20
AG
RICU
LTU
RAL
SCA
RP
10.0
0
10.0
0
13.0
1
13.0
1
12.0
0 A
gric
ultu
ral T
ube-
wel
ls12
0 6.
77
200
6.77
20
0 10
.35
200
11.5
120
0 15
.00
SCA
RP 5
kW
and
abo
veTi
me
of U
se (T
OU
) - P
eak
17
.00
17
.00
8
.85
Tim
e of
Use
(TO
U) -
Off-
Peak
200
10.0
0 20
0 10
.00
200
11.5
0 A
gric
ultu
ral 5
kW
and
abo
veTi
me
of U
se (T
OU
) - P
eak
13
.00
13
.00
10
.35
10
.35
10
.35
Tim
e of
Use
(TO
U) -
Off-
Peak
200
8.00
20
0 8.
00
200
10.3
5 20
0 10
.35
200
8.8
5 PU
BLIC
LIG
HTI
NG
13
.73
13
.73
15
.00
15
.00
15
.00
RESI
DEN
TIA
L CO
LON
IES
ATT.
TO
IND
UST
RIES
12
.92
12
.92
15
.00
15
.00
15
.00
RAIL
WAY
TRA
CTIO
N
11.0
0
11.0
0
15.0
0
15.0
0
15.0
0 Sp
ecia
l Con
trac
ts -
AJ&
K36
0 5.
63
360
12.2
2 36
0 12
.22
360
12.2
236
0 12
.22
Tim
e of
Use
(TO
U) -
Pea
k
13.3
0
18.0
0
18.0
0
18.0
0
18.0
0 Ti
me
of U
se (T
OU
) - O
ff-Pe
ak36
0 7.
92
360
12.2
0 36
0 12
.20
360
12.2
036
0 12
.20
Spec
ial C
ontr
acts
- R
awat
Lab
.
11.5
0
11.5
0
15.0
0
15.0
0
15.0
0 *
GO
P Ta
riff w
ith e
ffect
from
01-
10-2
014
also
incl
udes
an
amou
nt o
f sur
char
ge to
be
depo
site
d in
UO
F.**
GO
P Ta
riff w
ith e
ffect
from
10-
06-2
015
also
incl
udes
an
amou
nt o
f Tar
iff R
atio
naliz
atio
n Su
rcha
rge.
***
Fixe
d Ch
arge
s (R
s./kW
/ Mon
th)
**
** V
aria
ble
Char
ges
(Rs./
kWh)

254
TABL
E 73
COM
PARA
TIV
E TA
RIFF
STA
TEM
ENT
OF
PESH
AW
AR
ELEC
TRIC
SU
PPLY
CO
MPA
NY
LIM
ITED
(PES
CO)
PART
ICU
LARS
2011
-12
2012
-13
2013
-14
2014
-15
2015
-16
Fixe
d*Va
riab
le**
Fixe
d*Va
riab
le**
Fixe
d*Va
riab
le**
Fixe
d*Va
riab
le**
Fixe
d*Va
riab
le**
RESI
DEN
TIA
L U
p to
50
Uni
ts
3.00
4.00
4.00
4.00
4.00
Fo
r Pea
k Lo
ad re
quire
men
t les
s th
an 5
kW
01-
100
Uni
ts
11.
15
1
5.00
13.
00
1
2.50
9.15
1
01-2
00 U
nits
1
6.24
16.
50
1
3.15
2
01-3
00 U
nits
1
5.50
16.
50
1
6.24
16.
50
1
3.20
3
01-7
00 U
nits
1
7.50
18.
50
1
7.90
17.
90
1
4.55
A
bove
700
Uni
ts
19.
50
2
0.50
19.
00
1
9.00
15.
65
Load
Exc
eedi
ng 5
kW
Tim
e of
Use
(TO
U) -
Pea
k
19.
50
2
0.50
19.
00
1
9.00
15.
65
Tim
e of
Use
(TO
U) -
Off-
Peak
1
1.50
15.
50
1
3.30
13.
30
1
0.05
Te
mpo
rary
Sup
ply
1
5.65
CO
MM
ERCI
AL
- A
2Lo
ad le
ss th
an 5
kW
1
9.50
20.
50
1
9.00
19.
00
1
5.65
Lo
ad 5
kW
and
abo
ve R
egul
ar 4
00.0
0 1
7.00
4
00.0
0 1
9.00
4
00.0
0 1
6.00
4
00.0
0 1
5.00
4
00.0
0 1
1.10
T
ime
of U
se (T
OU
) - P
eak
1
9.50
20.
50
1
9.00
19.
00
1
5.65
T
ime
of U
se (T
OU
) - O
ff-Pe
ak 4
00.0
0 1
1.50
4
00.0
0 1
5.50
4
00.0
0 1
3.30
4
00.0
0 1
3.30
4
00.0
0 1
0.05
Te
mpo
rary
Sup
ply
1
5.65
G
ENER
AL
SERV
ICES
- A
3
12.
45
IND
UST
RIA
L B
1
15.
50
1
7.00
15.
50
1
4.50
11.
15
B1
(Pea
k)
19.
50
2
0.50
19.
00
1
9.00
15.
65
B1
(Off-
Peak
)
11.
50
1
5.50
13.
30
1
3.30
10.
05
B2
400
.00
14.
50
400
.00
16.
50
400
.00
15.
00
400
.00
14.
00
400
.00
10.
65
B2
- TO
U (P
eak)
1
9.50
20.
50
1
9.00
19.
00
1
5.65
B
2 -
TOU
(Off-
Peak
) 4
00.0
0 1
1.40
4
00.0
0 1
5.30
4
00.0
0 1
3.10
4
00.0
0 1
3.10
4
00.0
0 9.
85
B3
- TO
U (P
eak)
1
9.50
20.
50
1
9.00
19.
00
1
5.65
B
3 -
TOU
(Off-
Peak
) 3
80.0
0 1
1.30
3
80.0
0 1
5.20
3
80.0
0 1
3.00
3
80.0
0 1
3.00
3
80.0
0 9.
75
B4
- TO
U (P
eak)
1
9.50
20.
50
1
9.00
19.
00
1
5.65
B
4 -
TOU
(Off-
Peak
) 3
60.0
0 1
1.20
3
60.0
0 1
5.10
3
60.0
0 1
2.90
3
60.0
0 1
2.90
3
60.0
0 9.
65
Tem
pora
ry S
uppl
y
11.
15
BULK
SU
PPLY
C1 (a
) Sup
ply
at 4
00/2
30 V
olts
- le
ss th
an 5
kW
1
6.50
17.
50
1
6.00
15.
00
1
1.65
C1
(b) S
uppl
y at
400
/230
Vol
ts -
5 k
W a
nd u
pto
500
kW 4
00.0
0 1
5.50
4
00.0
0 1
6.50
4
00.0
0 1
5.50
4
00.0
0 1
4.50
4
00.0
0 1
1.15
T
ime
of U
se (T
OU
) - P
eak
1
9.50
20.
50
1
9.00
19.
00
1
5.65
T
ime
of U
se (T
OU
) - O
ff-Pe
ak 4
00.0
0 1
1.40
4
00.0
0 1
5.50
4
00.0
0 1
3.30
4
00.0
0 1
3.30
4
00.0
0 1
0.05
C2
Sup
ply
at 1
1, 3
3 kV
upt
o an
d in
clud
ing
5000
kW
380
.00
15.
25
380
.00
16.
30
380
.00
15.
30
380
.00
14.
30
380
.00
10.
95
Tim
e of
Use
(TO
U) -
Pea
k
19.
50
2
0.50
19.
00
1
9.00
15.
65
Tim
e of
Use
(TO
U) -
Off-
Peak
380
.00
11.
30
380
.00
15.
40
380
.00
13.
10
380
.00
13.
10
380
.00
9.85

255
C3 S
uppl
y at
66
kV a
nd a
bove
and
san
ctio
ned
load
abo
ve
5000
kW
360
.00
15.
00
360
.00
16.
20
360
.00
15.
20
360
.00
14.
20
360
.00
10.
85
Tim
e of
Use
(TO
U) -
Pea
k
19.
50
2
0.50
19.
00
1
9.00
15.
65
Tim
e of
Use
(TO
U) -
Off-
Peak
360
.00
11.
20
360
.00
15.
30
360
.00
13.
00
360
.00
13.
00
360
.00
9.75
A
GRI
CULT
URA
LSC
ARP
1
4.30
17.
00
1
5.50
14.
50
1
1.15
T
ime
of U
se (T
OU
) - P
eak
1
9.00
19.
00
1
5.65
T
ime
of U
se (T
OU
) - O
ff-Pe
ak
2
00.0
0 1
3.00
2
00.0
0 1
3.00
2
00.0
0 1
0.05
A
gric
ultu
ral T
ube-
wel
ls 2
00.0
0 1
3.30
2
00.0
0 1
6.50
2
00.0
0 1
5.00
2
00.0
0 1
4.00
2
00.0
0 1
0.65
T
ime
of U
se (T
OU
) - P
eak
1
9.50
20.
50
1
9.00
19.
00
1
5.65
T
ime
of U
se (T
OU
) - O
ff-Pe
ak 2
00.0
0 1
1.00
2
00.0
0 1
5.30
2
00.0
0 1
3.00
2
00.0
0 1
3.00
2
00.0
0 1
0.05
PU
BLIC
LIG
HTI
NG
1
6.40
15.
85
1
5.00
14.
00
1
0.65
RE
SID
ENTI
AL
COLO
NIE
S AT
T. T
O IN
DU
STRI
ES
16.
40
1
5.00
15.
00
1
4.00
10.
65
SPEC
IAL
CON
TRA
CTS
- A
J&K
360
.00
13.
50
360
.00
16.
16
360
.00
14.
38
360
.00
14.
00
360
.00
10.
65
Tim
e of
Use
(TO
U) -
Pea
k
19.
50
2
0.50
19.
00
1
9.00
15.
65
Tim
e of
Use
(TO
U) -
Off-
Peak
360
.00
11.
00
360
.00
15.
30
360
.00
13.
00
360
.00
13.
30
360
.00
10.
05
SPEC
IAL
CON
TRA
CT -
TA
RIFF
-JJ-
1 Fo
r Sup
ply
at 6
6 kV
and
abo
ve 3
60.0
0 1
0.85
T
ime
of U
se (T
OU
) - P
eak
1
5.65
T
ime
of U
se (T
OU
) - O
ff-Pe
ak 3
60.0
0 9.
75
J-2
(a)F
or S
uppl
y at
11,
33
kV
380
.00
10.
95
Tim
e of
Use
(TO
U) -
Pea
k
15.
65
Tim
e of
Use
(TO
U) -
Off-
Peak
380
.00
9.85
J-
2 (b
)For
Sup
ply
at 6
6 kV
and
abo
ve 3
60.0
0 1
0.85
T
ime
of U
se (T
OU
) - P
eak
1
5.65
T
ime
of U
se (T
OU
) - O
ff-Pe
ak 3
60.0
0 9.
75
J-3
(a)F
or S
uppl
y at
11,
33
kV
380
.00
10.
95
Tim
e of
Use
(TO
U) -
Pea
k
15.
65
Tim
e of
Use
(TO
U) -
Off-
Peak
380
.00
9.85
J-
3 (b
)For
Sup
ply
at 6
6 kV
and
abo
ve 3
60.0
0 1
0.85
T
ime
of U
se (T
OU
) - P
eak
1
5.65
T
ime
of U
se (T
OU
) - O
ff-Pe
ak 3
60.0
0 9.
75
* Fi
xed
Char
ges (
Rs./
kW/ M
onth
) **
Var
iabl
e Ch
arge
s (Rs
./kW
h)
Sour
ce: N
ation
al E
lect
ric P
ower
Reg
ulat
ory
Auth
ority
, Isla
mab
ad
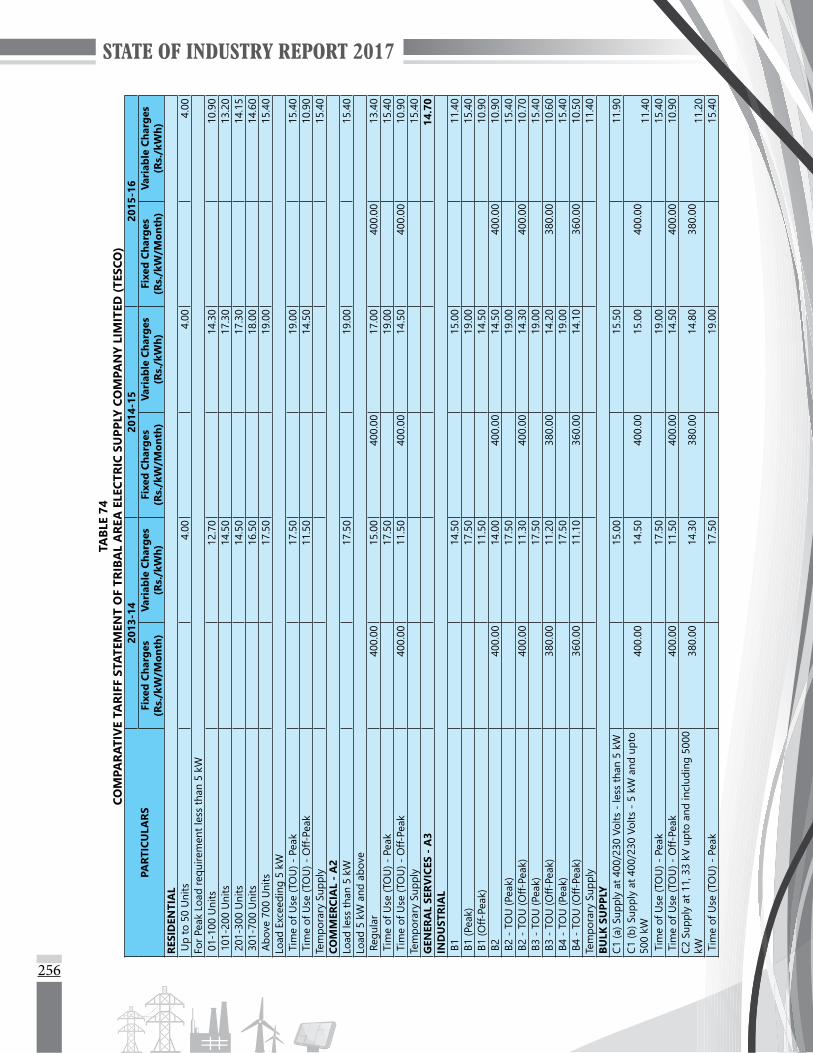
256
TABL
E 74
COM
PARA
TIV
E TA
RIFF
STA
TEM
ENT
OF
TRIB
AL
ARE
A E
LECT
RIC
SUPP
LY C
OM
PAN
Y LI
MIT
ED (T
ESCO
)
PART
ICU
LARS
2013
-14
2014
-15
2015
-16
Fixe
d Ch
arge
s (R
s./k
W/M
onth
)Va
riab
le C
harg
es
(Rs.
/kW
h)Fi
xed
Char
ges
(Rs.
/kW
/Mon
th)
Vari
able
Cha
rges
(R
s./k
Wh)
Fixe
d Ch
arge
s (R
s./k
W/M
onth
)Va
riab
le C
harg
es
(Rs.
/kW
h)RE
SID
ENTI
AL
Up
to 5
0 U
nits
4
.00
4
.00
4
.00
For P
eak
Load
requ
irem
ent l
ess
than
5 k
W 0
1-10
0 U
nits
1
2.70
14.
30
1
0.90
1
01-2
00 U
nits
1
4.50
17.
30
1
3.20
2
01-3
00 U
nits
1
4.50
17.
30
1
4.15
3
01-7
00 U
nits
1
6.50
18.
00
1
4.60
A
bove
700
Uni
ts
17.
50
1
9.00
15.
40
Load
Exc
eedi
ng 5
kW
Tim
e of
Use
(TO
U) -
Pea
k
17.
50
1
9.00
15.
40
Tim
e of
Use
(TO
U) -
Off-
Peak
1
1.50
14.
50
1
0.90
Te
mpo
rary
Sup
ply
1
5.40
CO
MM
ERCI
AL
- A
2Lo
ad le
ss th
an 5
kW
1
7.50
19.
00
1
5.40
Lo
ad 5
kW
and
abo
ve R
egul
ar40
0.00
1
5.00
40
0.00
1
7.00
40
0.00
1
3.40
T
ime
of U
se (T
OU
) - P
eak
1
7.50
19.
00
1
5.40
T
ime
of U
se (T
OU
) - O
ff-Pe
ak40
0.00
1
1.50
40
0.00
1
4.50
40
0.00
1
0.90
Te
mpo
rary
Sup
ply
1
5.40
G
ENER
AL
SERV
ICES
- A
3
14.
70
IND
UST
RIA
L B
1
14.
50
1
5.00
11.
40
B1
(Pea
k)
17.
50
1
9.00
15.
40
B1
(Off-
Peak
)
11.
50
1
4.50
10.
90
B2
400.
00
14.
00
400.
00
14.
50
400.
00
10.
90
B2
- TO
U (P
eak)
1
7.50
19.
00
1
5.40
B
2 -
TOU
(Off-
Peak
)40
0.00
1
1.30
40
0.00
1
4.30
40
0.00
1
0.70
B
3 -
TOU
(Pea
k)
17.
50
1
9.00
15.
40
B3
- TO
U (O
ff-Pe
ak)
380.
00
11.
20
380.
00
14.
20
380.
00
10.
60
B4
- TO
U (P
eak)
1
7.50
19.
00
1
5.40
B
4 -
TOU
(Off-
Peak
)36
0.00
1
1.10
36
0.00
1
4.10
36
0.00
1
0.50
Te
mpo
rary
Sup
ply
1
1.40
BU
LK S
UPP
LYC1
(a) S
uppl
y at
400
/230
Vol
ts -
less
than
5 k
W
15.
00
1
5.50
11.
90
C1 (b
) Sup
ply
at 4
00/2
30 V
olts
- 5
kW
and
upt
o 50
0 kW
400.
00
14.
50
400.
00
15.
00
400.
00
11.
40
Tim
e of
Use
(TO
U) -
Pea
k
17.
50
1
9.00
15.
40
Tim
e of
Use
(TO
U) -
Off-
Peak
400.
00
11.
50
400.
00
14.
50
400.
00
10.
90
C2 S
uppl
y at
11,
33
kV u
pto
and
incl
udin
g 50
00
kW38
0.00
1
4.30
38
0.00
1
4.80
38
0.00
1
1.20
T
ime
of U
se (T
OU
) - P
eak
1
7.50
19.
00
1
5.40

257
Tim
e of
Use
(TO
U) -
Off-
Peak
380.
00
11.
30
380.
00
14.
30
380.
00
10.
70
C3 S
uppl
y at
66
kV a
nd a
bove
and
san
ctio
ned
load
abo
ve 5
000
kW36
0.00
1
4.20
36
0.00
1
4.70
36
0.00
1
1.10
T
ime
of U
se (T
OU
) - P
eak
1
7.50
19.
00
1
5.40
T
ime
of U
se (T
OU
) - O
ff-Pe
ak36
0.00
1
1.20
36
0.00
1
4.20
36
0.00
1
0.60
A
GRI
CULT
URA
LSC
ARP
1
3.50
15.
00
1
1.40
T
ime
of U
se (T
OU
) - P
eak
1
7.50
19.
00
1
5.40
T
ime
of U
se (T
OU
) - O
ff-Pe
ak20
0.00
1
1.20
20
0.00
1
4.20
20
0.00
1
0.60
A
gric
ultu
ral T
ube-
wel
ls20
0.00
1
2.97
20
0.00
1
4.50
20
0.00
1
0.90
T
ime
of U
se (T
OU
) - P
eak
1
7.50
19.
00
1
5.40
T
ime
of U
se (T
OU
) - O
ff-Pe
ak20
0.00
1
1.20
20
0.00
1
4.20
20
0.00
1
0.60
PU
BLIC
LIG
HTI
NG
1
5.00
15.
00
1
1.40
RE
SID
ENTI
AL
COLO
NIE
S AT
T. T
O IN
DU
S-TR
IES
1
5.00
15.
00
1
1.40
SP
ECIA
L CO
NTR
ACT
- T
ARI
FF-J
J-1
For S
uppl
y at
66
kV a
nd a
bove
360.
00
11.
10
Tim
e of
Use
(TO
U) -
Pea
k
15.
40
Tim
e of
Use
(TO
U) -
Off-
Peak
360.
00
10.
60
J-2
(a)F
or S
uppl
y at
11,
33
kV
380.
00
11.
20
Tim
e of
Use
(TO
U) -
Pea
k
15.
40
Tim
e of
Use
(TO
U) -
Off-
Peak
380.
00
10.
70
J-2
(b)F
or S
uppl
y at
66
kV a
nd a
bove
360.
00
11.
10
Tim
e of
Use
(TO
U) -
Pea
k
15.
40
Tim
e of
Use
(TO
U) -
Off-
Peak
360.
00
10.
60
J-3
(a)F
or S
uppl
y at
11,
33
kV
380.
00
11.
20
Tim
e of
Use
(TO
U) -
Pea
k
15.
40
Tim
e of
Use
(TO
U) -
Off-
Peak
380.
00
10.
70
J-3
(b)F
or S
uppl
y at
66
kV a
nd a
bove
360.
00
11.
10
Tim
e of
Use
(TO
U) -
Pea
k
15.
40
Tim
e of
Use
(TO
U) -
Off-
Peak
360.
00
10.
60
Sour
ce: N
atio
nal E
lect
ric P
ower
Reg
ulat
ory
Auth
ority
, Isl
amab
ad

258
TA
BLE
75CO
MPA
RATI
VE
TARI
FF S
TATE
MEN
T O
F IS
LAM
ABA
D E
LECT
RIC
SUPP
LY C
OM
PAN
Y LI
MIT
ED (I
ESCO
)
PART
ICU
LARS
2011
-12
2012
-13
2013
-14
2014
-15
2015
-16*
Fixe
d**
Vari
able
***
Fixe
d**
Vari
able
***
Fixe
d**
Vari
able
***
Fixe
d**
Vari
able
***
Fixe
d**
Vari
able
***
RESI
DEN
TIA
L U
p to
50
Uni
ts
3.00
4.00
4.00
4.00
4.00
Fo
r Pea
k Lo
ad re
quire
men
t les
s th
an 5
kW
01-
100
Uni
ts
8.70
11.
00
1
0.50
9.00
7.75
1
01-2
00 U
nits
1
2.50
11.
00
1
1.00
2
01-3
00 U
nits
1
0.20
15.
00
1
2.50
11.
00
1
2.50
3
01-7
00 U
nits
1
4.00
17.
00
1
5.00
13.
00
1
3.80
A
bove
700
Uni
ts
16.
50
1
8.00
17.
50
1
5.00
15.
15
Load
Exc
eedi
ng 5
kW
Tim
e of
Use
(TO
U) -
Pea
k
15.
50
1
8.00
17.
50
1
5.00
15.
15
Tim
e of
Use
(TO
U) -
Off-
Peak
9.
10
1
2.50
11.
50
9.
25
7.
75
Tem
pora
ry S
uppl
y
15.
15
COM
MER
CIA
L -
A2
Load
less
than
5 k
W
16.
50
1
8.00
17.
50
1
5.00
14.
25
Load
5 k
W a
nd a
bove
Reg
ular
400
.00
11.
00
400
.00
16.
00
400
.00
15.
00
400
.00
12.
00
400
.00
11.
25
Tim
e of
Use
(TO
U) -
Pea
k
15.
00
1
8.00
17.
50
1
5.00
15.
15
Tim
e of
Use
(TO
U) -
Off-
Peak
400
.00
9.30
4
00.0
0 1
2.50
4
00.0
0 1
1.50
4
00.0
0 9.
25
400
.00
7.75
Te
mpo
rary
Sup
ply
1
4.25
G
ENER
AL
SERV
ICES
- A
3
12.
10
IND
UST
RIA
L B
1
11.
70
1
4.50
14.
50
1
2.00
11.
25
B1
(Pea
k)
15.
50
1
8.00
17.
50
1
5.00
15.
15
B1
(Off-
Peak
)
9.10
12.
50
1
1.50
9.25
7.75
B
2 4
00.0
0 1
0.30
4
00.0
0 1
4.00
4
00.0
0 1
4.00
4
00.0
0 1
1.50
4
00.0
0 1
0.75
B
2 -
TOU
(Pea
k)
14.
30
1
8.00
17.
50
1
5.00
15.
15
B2
- TO
U (O
ff-Pe
ak)
400
.00
9.00
4
00.0
0 1
2.30
4
00.0
0 1
1.30
4
00.0
0 9.
05
400
.00
7.55
B
3 -
TOU
(Pea
k)
14.
10
1
8.00
17.
50
1
5.00
15.
15
B3
- TO
U (O
ff-Pe
ak)
380
.00
8.90
3
80.0
0 1
2.20
3
80.0
0 1
1.20
3
80.0
0 8.
85
380
.00
7.35
B
4 -
TOU
(Pea
k)
13.
90
1
8.00
17.
50
1
5.00
15.
15
B4
- TO
U (O
ff-Pe
ak)
360
.00
8.80
3
60.0
0 1
2.10
3
60.0
0 1
1.10
3
60.0
0 8.
75
360
.00
7.25
Te
mpo
rary
Sup
ply
1
1.25
BU
LK S
UPP
LYC1
(a) S
uppl
y at
400
/230
Vol
ts -
less
than
5 k
W
12.
50
1
5.00
15.
00
1
2.50
11.
75
C1 (b
) Sup
ply
at 4
00/2
30 V
olts
- 5
kW
and
upt
o 50
0 kW
400
.00
11.
50
400
.00
14.
50
400
.00
14.
50
400
.00
12.
00
400
.00
11.
25
Tim
e of
Use
(TO
U) -
Pea
k
14.
30
1
8.00
17.
50
1
5.00
15.
15
Tim
e of
Use
(TO
U) -
Off-
Peak
400
.00
9.00
4
00.0
0 1
2.50
4
00.0
0 1
1.50
4
00.0
0 9.
25
400
.00
7.75
C2
Sup
ply
at 1
1, 3
3 kV
upt
o an
d in
clud
ing
5000
kW
380
.00
11.
30
380
.00
14.
30
380
.00
14.
30
380
.00
11.
80
380
.00
11.
05
Tim
e of
Use
(TO
U) -
Pea
k
14.
10
1
8.00
17.
50
1
5.00
15.
15
Tim
e of
Use
(TO
U) -
Off-
Peak
380
.00
8.90
3
80.0
0 1
2.30
3
80.0
0 1
1.30
3
80.0
0 9.
05
380
.00
7.55

259
C3 S
uppl
y at
66
kV a
nd a
bove
and
san
ctio
ned
load
abo
ve
5000
kW
360
.00
11.
10
360
.00
14.
20
360
.00
14.
20
360
.00
11.
70
360
.00
10.
95
Tim
e of
Use
(TO
U) -
Pea
k
13.
90
1
8.00
17.
50
1
5.00
15.
15
Tim
e of
Use
(TO
U) -
Off-
Peak
360
.00
8.80
3
60.0
0 1
2.20
3
60.0
0 1
1.20
3
60.0
0 8.
85
360
.00
7.35
A
GRI
CULT
URA
LSC
ARP
1
1.20
14.
50
1
4.50
12.
00
1
2.15
T
ime
of U
se (T
OU
) - P
eak
1
7.50
15.
00
1
5.15
T
ime
of U
se (T
OU
) - O
ff-Pe
ak
2
00.0
0 1
1.20
2
00.0
0 8.
85
200
.00
7.35
A
gric
ultu
ral T
ube-
wel
ls 2
00.0
0 8.
00
200
.00
14.
00
200
.00
14.
00
200
.00
11.
50
200
.00
10.
10
Tim
e of
Use
(TO
U) -
Pea
k
13.
00
1
8.00
17.
50
1
5.00
15.
15
Tim
e of
Use
(TO
U) -
Off-
Peak
200
.00
8.00
2
00.0
0 1
2.20
2
00.0
0 1
1.20
2
00.0
0 8.
85
200
.00
7.35
PU
BLIC
LIG
HTI
NG
1
5.00
15.
00
1
5.00
14.
00
1
3.25
RE
SID
ENTI
AL
COLO
NIE
S AT
T. T
O IN
DU
STRI
ES
14.
00
1
5.00
15.
00
1
4.00
13.
25
SPEC
IAL
CON
TRA
CTS
- A
J&K
360
.00
9.60
3
60.0
0 1
2.22
3
60.0
0 1
4.38
3
60.0
0 1
1.24
3
60.0
0 1
0.50
T
ime
of U
se (T
OU
) - P
eak
1
5.00
18.
00
1
7.50
15.
00
1
5.15
T
ime
of U
se (T
OU
) - O
ff-Pe
ak 3
60.0
0 9.
00
360
.00
12.
20
360
.00
11.
20
360
.00
8.85
3
60.0
0 7.
45
SPEC
IAL
CON
TRA
CT -
RA
WAT
LA
B.
11.
50
1
5.00
15.
00
1
4.00
13.
25
SPEC
IAL
CON
TRA
CT -
TA
RIFF
-JJ-
1 Fo
r Sup
ply
at 6
6 kV
and
abo
ve 3
60.0
0 1
0.95
T
ime
of U
se (T
OU
) - P
eak
1
5.15
T
ime
of U
se (T
OU
) - O
ff-Pe
ak 3
60.0
0 7.
35
J-2
(a)F
or S
uppl
y at
11,
33
kV
380
.00
` 11.
05
Tim
e of
Use
(TO
U) -
Pea
k
15.
15
Tim
e of
Use
(TO
U) -
Off-
Peak
380
.00
7.55
J-
2 (b
)For
Sup
ply
at 6
6 kV
and
abo
ve 3
60.0
0 1
0.95
T
ime
of U
se (T
OU
) - P
eak
1
5.15
T
ime
of U
se (T
OU
) - O
ff-Pe
ak 3
60.0
0 7.
35
J-3
(a)F
or S
uppl
y at
11,
33
kV
380
.00
11.
05
Tim
e of
Use
(TO
U) -
Pea
k
15.
15
Tim
e of
Use
(TO
U) -
Off-
Peak
380
.00
7.55
J-
3 (b
)For
Sup
ply
at 6
6 kV
and
abo
ve 3
60.0
0 1
0.95
T
ime
of U
se (T
OU
) - P
eak
1
5.15
T
ime
of U
se (T
OU
) - O
ff-Pe
ak 3
60.0
0 7.
35
*Re
pres
ents
Mul
ti Ye
ar Ta
riff sc
hedu
les.
**
Fixe
d Ch
arge
s (Rs
./kW
/Mon
th)
***V
aria
ble
Char
ges (
Rs./
kWh)
Sou
rce:
Nati
onal
Ele
ctric
Pow
er R
egul
ator
y Au
thor
ity, I
slam
abad

260
TABL
E 76
COM
PARA
TIV
E TA
RIFF
STA
TEM
ENT
OF
GU
JRA
NW
ALA
ELE
CTRI
C PO
WER
CO
MPA
NY
LIM
ITED
(GEP
CO)
PART
ICU
LARS
2011
-12
2012
-13
2013
-14
2014
-15
2015
-16
Fixe
d*Va
ri-
able
**Fi
xed*
Vari
-ab
le**
Fixe
d*Va
ri-
able
**Fi
xed*
Vari
able
**Fi
xed*
Vari
able
**
RESI
DEN
TIA
L U
p to
50
Uni
ts
3.00
4.00
4.00
4.00
4.00
Fo
r Pea
k Lo
ad re
quire
men
t les
s th
an 5
kW
01-
100
Uni
ts
9.50
12.
10
1
3.26
11.
82
8.
60
101
-200
Uni
ts
16.
90
1
4.00
10.
25
201
-300
Uni
ts
13.
55
1
5.00
16.
90
1
4.00
11.
55
301
-700
Uni
ts
15.
50
1
7.00
17.
90
1
7.00
14.
50
Abo
ve 7
00 U
nits
1
6.50
19.
00
1
9.00
19.
00
1
5.20
Lo
ad E
xcee
ding
5 k
W T
ime
of U
se (T
OU
) - P
eak
1
5.00
19.
00
1
9.00
19.
00
1
5.20
T
ime
of U
se (T
OU
) - O
ff-Pe
ak
9.50
12.
50
1
3.50
13.
00
8.
60
Tem
pora
ry S
uppl
y
15.
20
COM
MER
CIA
L -
A2
Load
less
than
5 k
W
17.
50
1
8.00
19.
00
1
9.00
14.
20
Load
5 k
W a
nd a
bove
Reg
ular
400
.00
14.
50
400
.00
16.
00
400
.00
16.
00
400
.00
15.
00
400
.00
10.
20
Tim
e of
Use
(TO
U) -
Pea
k
15.
00
1
9.00
19.
00
1
9.00
15.
20
Tim
e of
Use
(TO
U) -
Off-
Peak
400
.00
9.50
4
00.0
0 1
2.50
4
00.0
0 1
3.50
4
00.0
0 1
3.00
4
00.0
0 8.
60
Tem
pora
ry S
uppl
y
14.
20
GEN
ERA
L SE
RVIC
ES -
A3
1
1.55
IN
DU
STRI
AL
B1
1
2.00
15.
50
1
5.50
14.
50
9.
70
B1
(Pea
k)
15.
00
1
9.00
19.
00
1
9.00
15.
20
B1
(Off-
Peak
)
9.50
12.
50
1
3.50
13.
00
8.
60
B2
400.
00
10.
50
400
.00
15.
00
400.
00
15.
00
400
.00
14.
00
400
.00
9.20
B
2 -
TOU
(Pea
k)
15.
00
1
9.00
19.
00
1
9.00
15.
20
B2
- TO
U (O
ff-Pe
ak)
400.
00
9.30
4
00.0
0 1
2.30
40
0.00
1
3.30
4
00.0
0 1
2.80
4
00.0
0 8.
40
B3
- TO
U (P
eak)
1
4.70
19.
00
1
9.00
19.
00
1
5.20
B
3 -
TOU
(Off-
Peak
)38
0.00
9.
20
380
.00
12.
20
80.
00
13.
20
380
.00
12.
70
380
.00
8.30
B
4 -
TOU
(Pea
k)
14.
50
1
9.00
19.
00
1
9.00
15.
20
B4
- TO
U (O
ff-Pe
ak)
60.
00
9.10
3
60.0
0 1
2.10
36
0.00
1
3.10
3
60.0
0 1
2.60
3
60.0
0 8.
20
Tem
pora
ry S
uppl
y
9.70
BU
LK S
UPP
LYC1
(a) S
uppl
y at
400
/230
Vol
ts -
less
than
5 k
W
13.
00
1
5.00
16.
00
1
5.00
10.
20
C1 (b
) Sup
ply
at 4
00/2
30 V
olts
- 5
kW
and
upt
o 50
0 kW
400.
00
11.
50
400
.00
14.
50
00.
00
15.
50
400
.00
14.
50
400
.00
9.70
T
ime
of U
se (T
OU
) - P
eak
1
5.00
19.
00
1
9.00
19.
00
1
5.20
T
ime
of U
se (T
OU
) - O
ff-Pe
ak40
0.00
9.
30
400
.00
12.
50
00.
00
13.
50
400
.00
13.
00
400
.00
8.60
C2
Sup
ply
at 1
1, 3
3 kV
upt
o an
d in
clud
ing
5000
kW
80.
00
11.
40
380
.00
14.
40
380.
00
15.
30
380
.00
14.
30
380
.00
9.50
T
ime
of U
se (T
OU
) - P
eak
1
4.70
19.
00
1
9.00
19.
00
1
5.20
T
ime
of U
se (T
OU
) - O
ff-Pe
ak38
0.00
9.
20
380
.00
12.
30
380.
00
13.
30
380
.00
12.
80
380
.00
8.40
C3
Sup
ply
at 6
6 kV
and
abo
ve a
nd s
anct
ione
d lo
ad a
bove
50
00 k
W36
0.00
1
1.30
3
60.0
0 1
4.30
36
0.00
1
5.20
3
60.0
0 1
4.20
3
60.0
0 9.
40
Tim
e of
Use
(TO
U) -
Pea
k
14.
50
1
9.00
19.
00
1
9.00
15.
20
Tim
e of
Use
(TO
U) -
Off-
Peak
360.
00
9.10
3
60.0
0 1
2.20
6
0.00
1
3.20
3
60.0
0 1
2.70
3
60.0
0 8.
30

261
AG
RICU
LTU
RAL
SCA
RP
11.
00
1
5.50
15.
50
1
4.50
10.
70
Tim
e of
Use
(TO
U) -
Pea
k
19.
00
1
9.00
15.
20
Tim
e of
Use
(TO
U) -
Off-
Peak
200.
00
13.
20
200
.00
12.
70
200
.00
8.30
A
gric
ultu
ral T
ube-
wel
ls20
0.00
9.
50
200
.00
15.
00
00.
00
15.
00
200
.00
14.
00
200
.00
9.60
T
ime
of U
se (T
OU
) - P
eak
1
4.50
19.
00
1
9.00
19.
00
1
5.20
T
ime
of U
se (T
OU
) - O
ff-Pe
ak20
0.00
9.
10
200
.00
12.
20
00.
00
13.
20
200
.00
12.
70
200
.00
8.30
PU
BLIC
LIG
HTI
NG
1
5.00
15.
00
1
5.00
14.
00
9.
20
RESI
DEN
TIA
L CO
LON
IES
ATT.
TO
IND
UST
RIES
1
4.25
15.
00
1
5.00
14.
00
9.
20
SPEC
IAL
CON
TRA
CTS
- A
J&K
360.
00
13.
00
360
.00
13.
33
360.
00
15.
00
360
.00
14.
00
360
.00
9.20
T
ime
of U
se (T
OU
) - P
eak
1
4.50
19.
00
1
9.00
19.
00
1
5.20
T
ime
of U
se (T
OU
) - O
ff-Pe
ak 6
0.00
9.
10
360
.00
12.
20
360.
00
13.
20
360
.00
12.
70
360
.00
9.90
SP
ECIA
L CO
NTR
ACT
- T
ARI
FF-J
J-1
For S
uppl
y at
66
kV a
nd a
bove
360
.00
9.40
T
ime
of U
se (T
OU
) - P
eak
1
5.20
T
ime
of U
se (T
OU
) - O
ff-Pe
ak 3
60.0
0 8.
30
J-2
(a)F
or S
uppl
y at
11,
33
kV
380
.00
9.50
T
ime
of U
se (T
OU
) - P
eak
1
5.20
T
ime
of U
se (T
OU
) - O
ff-Pe
ak 3
80.0
0 8.
40
J-2
(b)F
or S
uppl
y at
66
kV a
nd a
bove
360
.00
9.40
T
ime
of U
se (T
OU
) - P
eak
1
5.20
T
ime
of U
se (T
OU
) - O
ff-Pe
ak 3
60.0
0 8.
30
J-3
(a)F
or S
uppl
y at
11,
33
kV
380
.00
9.50
T
ime
of U
se (T
OU
) - P
eak
1
5.20
T
ime
of U
se (T
OU
) - O
ff-Pe
ak 3
80.0
0 8.
40
J-3
(b)F
or S
uppl
y at
66
kV a
nd a
bove
360
.00
9.40
T
ime
of U
se (T
OU
) - P
eak
1
5.20
T
ime
of U
se (T
OU
) - O
ff-Pe
ak 3
60.0
0 8.
30
* Fi
xed
Char
ges (
Rs./
kW/M
onth
) **
Varia
ble
Char
ges (
Rs./
kWh)
Sour
ce: N
ation
al E
lect
ric P
ower
Reg
ulat
ory
Auth
ority
, Isla
mab
ad
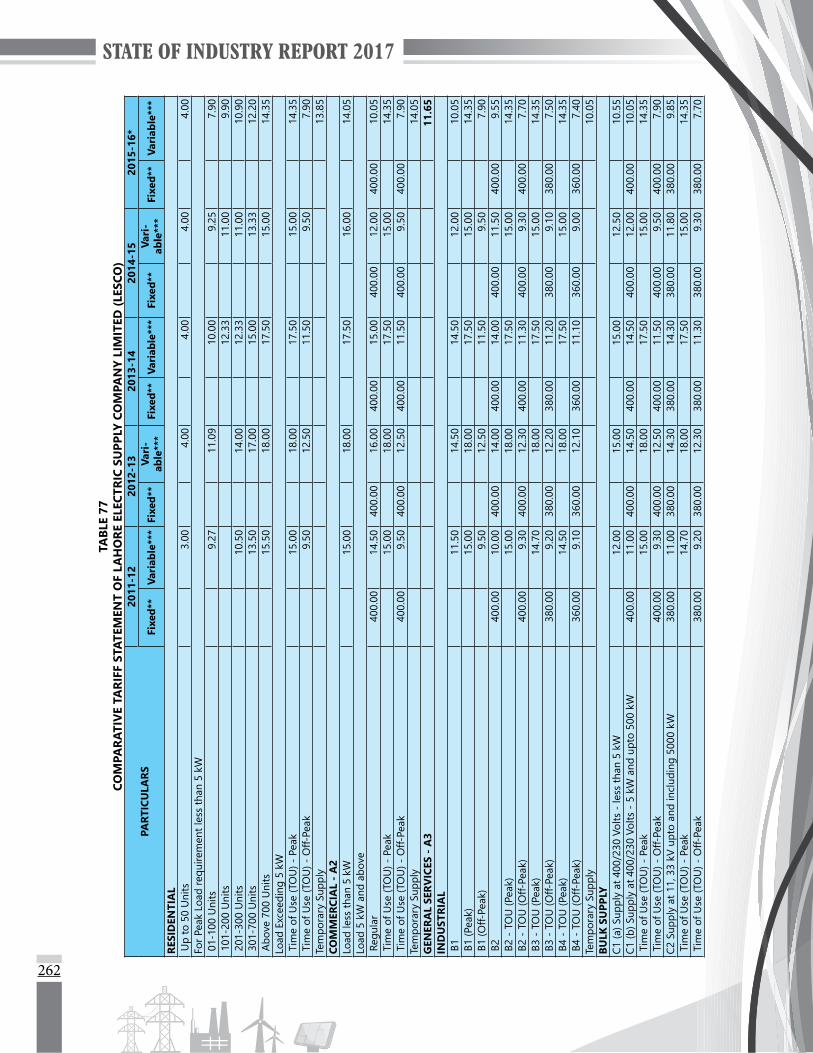
262
TABL
E 77
COM
PARA
TIV
E TA
RIFF
STA
TEM
ENT
OF
LAH
ORE
ELE
CTRI
C SU
PPLY
CO
MPA
NY
LIM
ITED
(LES
CO)
PART
ICU
LARS
2011
-12
2012
-13
2013
-14
2014
-15
2015
-16*
Fixe
d**
Vari
able
***
Fixe
d**
Vari
-ab
le**
*Fi
xed*
*Va
riab
le**
*Fi
xed*
*Va
ri-
able
***
Fixe
d**
Vari
able
***
RESI
DEN
TIA
L U
p to
50
Uni
ts
3.00
4.00
4.00
4.00
4.00
Fo
r Pea
k Lo
ad re
quire
men
t les
s th
an 5
kW
01-
100
Uni
ts
9.27
11.
09
1
0.00
9.25
7.90
1
01-2
00 U
nits
1
2.33
11.
00
9.
90
201
-300
Uni
ts
10.
50
1
4.00
12.
33
1
1.00
10.
90
301
-700
Uni
ts
13.
50
1
7.00
15.
00
1
3.33
12.
20
Abo
ve 7
00 U
nits
1
5.50
18.
00
1
7.50
15.
00
1
4.35
Lo
ad E
xcee
ding
5 k
W T
ime
of U
se (T
OU
) - P
eak
1
5.00
18.
00
1
7.50
15.
00
1
4.35
T
ime
of U
se (T
OU
) - O
ff-Pe
ak
9.50
12.
50
1
1.50
9.50
7.90
Te
mpo
rary
Sup
ply
1
3.85
CO
MM
ERCI
AL
- A
2Lo
ad le
ss th
an 5
kW
1
5.00
18.
00
1
7.50
16.
00
1
4.05
Lo
ad 5
kW
and
abo
ve R
egul
ar 4
00.0
0 1
4.50
4
00.0
0 1
6.00
4
00.0
0 1
5.00
4
00.0
0 1
2.00
4
00.0
0 1
0.05
T
ime
of U
se (T
OU
) - P
eak
1
5.00
18.
00
1
7.50
15.
00
1
4.35
T
ime
of U
se (T
OU
) - O
ff-Pe
ak 4
00.0
0 9.
50
400
.00
12.
50
400
.00
11.
50
400
.00
9.50
4
00.0
0 7.
90
Tem
pora
ry S
uppl
y
14.
05
GEN
ERA
L SE
RVIC
ES -
A3
1
1.65
IN
DU
STRI
AL
B1
1
1.50
14.
50
1
4.50
12.
00
1
0.05
B
1 (P
eak)
1
5.00
18.
00
1
7.50
15.
00
1
4.35
B
1 (O
ff-Pe
ak)
9.
50
1
2.50
11.
50
9.
50
7.
90
B2
400
.00
10.
00
400
.00
14.
00
400
.00
14.
00
400
.00
11.
50
400
.00
9.55
B
2 -
TOU
(Pea
k)
15.
00
1
8.00
17.
50
1
5.00
14.
35
B2
- TO
U (O
ff-Pe
ak)
400
.00
9.30
4
00.0
0 1
2.30
4
00.0
0 1
1.30
4
00.0
0 9.
30
400
.00
7.70
B
3 -
TOU
(Pea
k)
14.
70
1
8.00
17.
50
1
5.00
14.
35
B3
- TO
U (O
ff-Pe
ak)
380
.00
9.20
3
80.0
0 1
2.20
3
80.0
0 1
1.20
3
80.0
0 9.
10
380
.00
7.50
B
4 -
TOU
(Pea
k)
14.
50
1
8.00
17.
50
1
5.00
14.
35
B4
- TO
U (O
ff-Pe
ak)
360
.00
9.10
3
60.0
0 1
2.10
3
60.0
0 1
1.10
3
60.0
0 9.
00
360
.00
7.40
Te
mpo
rary
Sup
ply
1
0.05
BU
LK S
UPP
LYC1
(a) S
uppl
y at
400
/230
Vol
ts -
less
than
5 k
W
12.
00
1
5.00
15.
00
1
2.50
10.
55
C1 (b
) Sup
ply
at 4
00/2
30 V
olts
- 5
kW
and
upt
o 50
0 kW
400
.00
11.
00
400
.00
14.
50
400
.00
14.
50
400
.00
12.
00
400
.00
10.
05
Tim
e of
Use
(TO
U) -
Pea
k
15.
00
1
8.00
17.
50
1
5.00
14.
35
Tim
e of
Use
(TO
U) -
Off-
Peak
400
.00
9.30
4
00.0
0 1
2.50
4
00.0
0 1
1.50
4
00.0
0 9.
50
400
.00
7.90
C2
Sup
ply
at 1
1, 3
3 kV
upt
o an
d in
clud
ing
5000
kW
380
.00
11.
00
380
.00
14.
30
380
.00
14.
30
380
.00
11.
80
380
.00
9.85
T
ime
of U
se (T
OU
) - P
eak
1
4.70
18.
00
1
7.50
15.
00
1
4.35
T
ime
of U
se (T
OU
) - O
ff-Pe
ak 3
80.0
0 9.
20
380
.00
12.
30
380
.00
11.
30
380
.00
9.30
3
80.0
0 7.
70

263
C3 S
uppl
y at
66
kV a
nd a
bove
and
san
ctio
ned
load
abo
ve 5
000
kW 3
60.0
0 1
1.00
3
60.0
0 1
4.20
3
60.0
0 1
4.20
3
60.0
0 1
1.70
3
60.0
0 9.
75
Tim
e of
Use
(TO
U) -
Pea
k
14.
50
1
8.00
17.
50
1
5.00
14.
35
Tim
e of
Use
(TO
U) -
Off-
Peak
360
.00
9.10
3
60.0
0 1
2.20
3
60.0
0 1
1.20
3
60.0
0 9.
10
360
.00
7.50
A
GRI
CULT
URA
LSC
ARP
1
0.00
14.
50
1
4.50
12.
00
1
1.45
T
ime
of U
se (T
OU
) - P
eak
1
7.50
15.
00
1
4.35
T
ime
of U
se (T
OU
) - O
ff-Pe
ak
2
00.0
0 1
1.20
2
00.0
0 9.
10
200
.00
7.50
A
gric
ultu
ral T
ube-
wel
ls 2
00.0
0 8.
00
200
.00
14.
00
200
.00
14.
00
200
.00
11.
50
200
.00
11.
80
Tim
e of
Use
(TO
U) -
Pea
k
14.
50
1
8.00
17.
50
1
5.00
14.
35
Tim
e of
Use
(TO
U) -
Off-
Peak
200
.00
9.10
2
00.0
0 1
2.20
2
00.0
0 1
1.20
2
00.0
0 9.
10
200
.00
7.50
PU
BLIC
LIG
HTI
NG
1
4.50
15.
00
1
5.00
14.
00
1
2.20
RE
SID
ENTI
AL
COLO
NIE
S AT
T. T
O IN
DU
STRI
ES
13.
50
1
5.00
15.
00
1
4.00
12.
20
RAIL
WAY
TRA
CTIO
N
12.
50
1
5.00
15.
00
1
4.00
12.
20
SPEC
IAL
CON
TRA
CT -
TA
RIFF
-JJ-
1 Fo
r Sup
ply
at 6
6 kV
and
abo
ve 3
60.0
0 9.
75
Tim
e of
Use
(TO
U) -
Pea
k
14.
35
Tim
e of
Use
(TO
U) -
Off-
Peak
360
.00
7.50
J-
2 (a
)For
Sup
ply
at 1
1, 3
3 kV
3
80.0
0 9.
85
Tim
e of
Use
(TO
U) -
Pea
k
14.
35
Tim
e of
Use
(TO
U) -
Off-
Peak
380
.00
7.70
J-
2 (b
)For
Sup
ply
at 6
6 kV
and
abo
ve 3
60.0
0 9.
75
Tim
e of
Use
(TO
U) -
Pea
k
14.
35
Tim
e of
Use
(TO
U) -
Off-
Peak
360
.00
7.50
J-
3 (a
)For
Sup
ply
at 1
1, 3
3 kV
3
80.0
0 9.
85
Tim
e of
Use
(TO
U) -
Pea
k
14.
35
Tim
e of
Use
(TO
U) -
Off-
Peak
380
.00
7.70
J-
3 (b
)For
Sup
ply
at 6
6 kV
and
abo
ve 3
60.0
0 9.
75
Tim
e of
Use
(TO
U) -
Pea
k
14.
35
Tim
e of
Use
(TO
U) -
Off-
Peak
360
.00
7.50
*R
epre
sent
s M
ulti
Year
Tar
iff s
ched
ules
.
**Fi
xed
Char
ges
(Rs./
kW/M
onth
)
***V
aria
ble
Char
ges
(Rs./
kWh)
Sour
ce: N
atio
nal E
lect
ric P
ower
Reg
ulat
ory
Auth
ority
, Isl
amab
ad
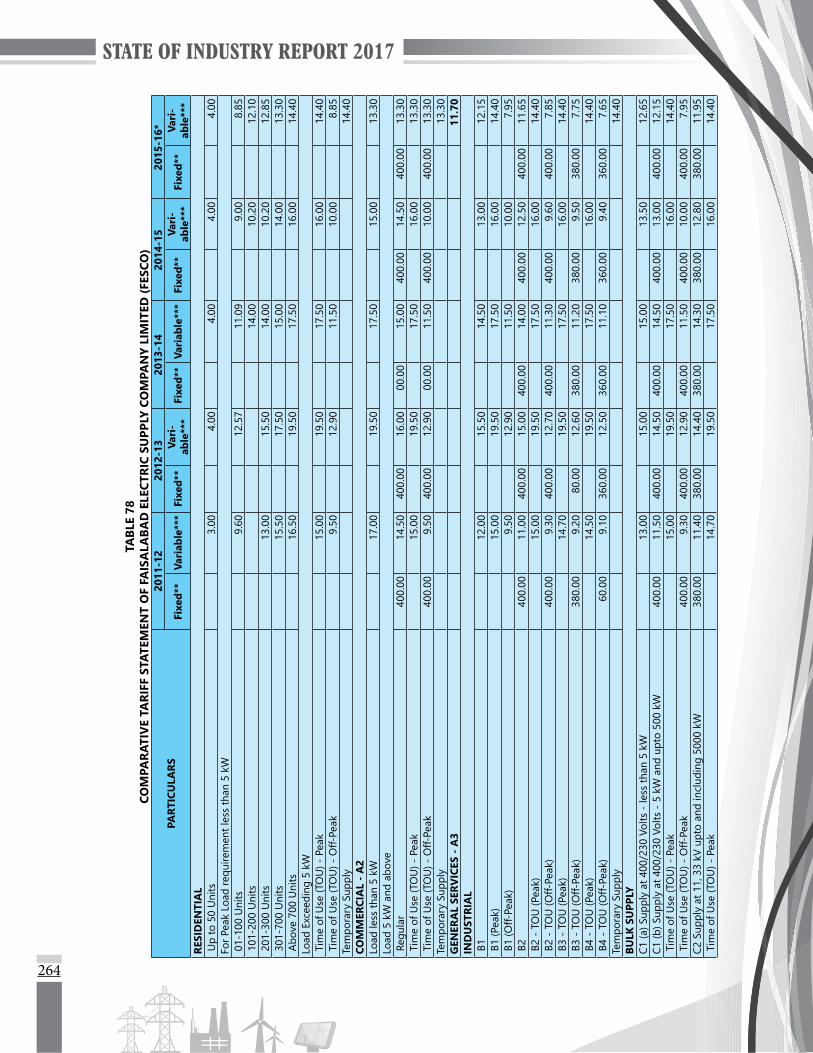
264
TABL
E 78
COM
PARA
TIV
E TA
RIFF
STA
TEM
ENT
OF
FAIS
ALA
BAD
ELE
CTRI
C SU
PPLY
CO
MPA
NY
LIM
ITED
(FES
CO)
PART
ICU
LARS
2011
-12
2012
-13
2013
-14
2014
-15
2015
-16*
Fixe
d**
Vari
able
***
Fixe
d**
Vari
-ab
le**
*Fi
xed*
*Va
riab
le**
*Fi
xed*
*Va
ri-
able
***
Fixe
d**
Vari
-ab
le**
*RE
SID
ENTI
AL
Up
to 5
0 U
nits
3.
00
4.
00
4.
00
4.
00
4.
00
For P
eak
Load
requ
irem
ent l
ess
than
5 k
W 0
1-10
0 U
nits
9.
60
1
2.57
11.
09
9.
00
8.
85
101
-200
Uni
ts
14.
00
1
0.20
12.
10
201
-300
Uni
ts
13.
00
1
5.50
14.
00
1
0.20
12.
85
301
-700
Uni
ts
15.
50
1
7.50
15.
00
1
4.00
13.
30
Abo
ve 7
00 U
nits
1
6.50
19.
50
1
7.50
16.
00
1
4.40
Lo
ad E
xcee
ding
5 k
W T
ime
of U
se (T
OU
) - P
eak
1
5.00
19.
50
1
7.50
16.
00
1
4.40
T
ime
of U
se (T
OU
) - O
ff-Pe
ak
9.50
12.
90
1
1.50
10.
00
8.
85
Tem
pora
ry S
uppl
y
14.
40
COM
MER
CIA
L -
A2
Load
less
than
5 k
W
17.
00
1
9.50
17.
50
1
5.00
13.
30
Load
5 k
W a
nd a
bove
Reg
ular
400.
00
14.
50
400.
00
16.
00
00.
00
15.
00
400
.00
14.
50
400
.00
13.3
0 T
ime
of U
se (T
OU
) - P
eak
1
5.00
19.
50
1
7.50
16.
00
1
3.30
T
ime
of U
se (T
OU
) - O
ff-Pe
ak40
0.00
9.
50
400.
00
12.
90
00.
00
11.
50
400
.00
10.
00
400
.00
13.
30
Tem
pora
ry S
uppl
y
13.
30
GEN
ERA
L SE
RVIC
ES -
A3
1
1.70
IN
DU
STRI
AL
B1
1
2.00
15.
50
1
4.50
13.
00
1
2.15
B
1 (P
eak)
1
5.00
19.
50
1
7.50
16.
00
1
4.40
B
1 (O
ff-Pe
ak)
9.
50
1
2.90
11.
50
1
0.00
7.95
B
240
0.00
1
1.00
40
0.00
1
5.00
40
0.00
1
4.00
4
00.0
0 1
2.50
4
00.0
0 1
1.65
B
2 -
TOU
(Pea
k)
15.
00
1
9.50
17.
50
1
6.00
14.
40
B2
- TO
U (O
ff-Pe
ak)
400.
00
9.30
40
0.00
1
2.70
40
0.00
1
1.30
4
00.0
0 9.
60
400
.00
7.85
B
3 -
TOU
(Pea
k)
14.
70
1
9.50
17.
50
1
6.00
14.
40
B3
- TO
U (O
ff-Pe
ak)
380.
00
9.20
8
0.00
1
2.60
38
0.00
1
1.20
3
80.0
0 9.
50
380
.00
7.75
B
4 -
TOU
(Pea
k)
14.
50
1
9.50
17.
50
1
6.00
14.
40
B4
- TO
U (O
ff-Pe
ak)
60.
00
9.10
36
0.00
1
2.50
36
0.00
1
1.10
3
60.0
0 9.
40
360
.00
7.65
Te
mpo
rary
Sup
ply
1
4.40
BU
LK S
UPP
LYC1
(a) S
uppl
y at
400
/230
Vol
ts -
less
than
5 k
W
13.
00
1
5.00
15.
00
1
3.50
12.
65
C1 (b
) Sup
ply
at 4
00/2
30 V
olts
- 5
kW
and
upt
o 50
0 kW
400.
00
11.
50
400.
00
14.
50
400.
00
14.
50
400
.00
13.
00
400
.00
12.
15
Tim
e of
Use
(TO
U) -
Pea
k
15.
00
1
9.50
17.
50
1
6.00
14.
40
Tim
e of
Use
(TO
U) -
Off-
Peak
400
.00
9.30
40
0.00
1
2.90
40
0.00
1
1.50
4
00.0
0 1
0.00
4
00.0
0 7.
95
C2 S
uppl
y at
11,
33
kV u
pto
and
incl
udin
g 50
00 k
W 3
80.0
0 1
1.40
38
0.00
1
4.40
38
0.00
1
4.30
3
80.0
0 1
2.80
3
80.0
0 1
1.95
T
ime
of U
se (T
OU
) - P
eak
1
4.70
19.
50
1
7.50
16.
00
1
4.40
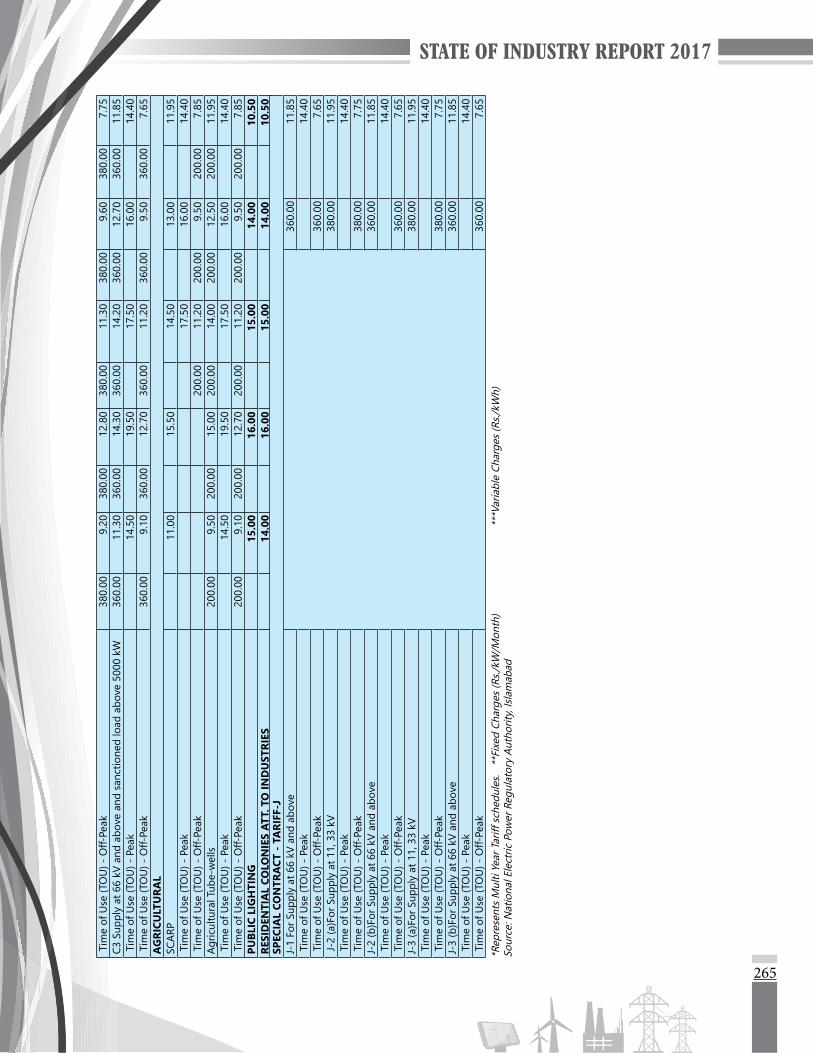
265
Tim
e of
Use
(TO
U) -
Off-
Peak
380
.00
9.20
38
0.00
1
2.80
38
0.00
1
1.30
3
80.0
0 9.
60
380
.00
7.75
C3
Sup
ply
at 6
6 kV
and
abo
ve a
nd s
anct
ione
d lo
ad a
bove
500
0 kW
360
.00
11.
30
360.
00
14.
30
360.
00
14.
20
360
.00
12.
70
360
.00
11.
85
Tim
e of
Use
(TO
U) -
Pea
k
14.
50
1
9.50
17.
50
1
6.00
14.
40
Tim
e of
Use
(TO
U) -
Off-
Peak
360
.00
9.10
36
0.00
1
2.70
36
0.00
1
1.20
3
60.0
0 9.
50
360
.00
7.65
A
GRI
CULT
URA
LSC
ARP
1
1.00
15.
50
1
4.50
13.
00
1
1.95
T
ime
of U
se (T
OU
) - P
eak
1
7.50
16.
00
1
4.40
T
ime
of U
se (T
OU
) - O
ff-Pe
ak
20
0.00
1
1.20
2
00.0
0 9.
50
200
.00
7.85
A
gric
ultu
ral T
ube-
wel
ls 2
00.0
0 9.
50
200.
00
15.
00
200.
00
14.
00
200
.00
12.
50
200
.00
11.
95
Tim
e of
Use
(TO
U) -
Pea
k
14.
50
1
9.50
17.
50
1
6.00
14.
40
Tim
e of
Use
(TO
U) -
Off-
Peak
200
.00
9.10
20
0.00
1
2.70
20
0.00
1
1.20
2
00.0
0 9.
50
200
.00
7.85
PU
BLIC
LIG
HTI
NG
1
5.00
16.
00
1
5.00
14.
00
1
0.50
RE
SID
ENTI
AL
COLO
NIE
S AT
T. T
O IN
DU
STRI
ES
14.
00
1
6.00
15.
00
1
4.00
10.
50
SPEC
IAL
CON
TRA
CT -
TA
RIFF
-JJ-
1 Fo
r Sup
ply
at 6
6 kV
and
abo
ve 3
60.0
0 1
1.85
T
ime
of U
se (T
OU
) - P
eak
1
4.40
T
ime
of U
se (T
OU
) - O
ff-Pe
ak 3
60.0
0 7.
65
J-2
(a)F
or S
uppl
y at
11,
33
kV
380
.00
11.
95
Tim
e of
Use
(TO
U) -
Pea
k
14.
40
Tim
e of
Use
(TO
U) -
Off-
Peak
380
.00
7.75
J-
2 (b
)For
Sup
ply
at 6
6 kV
and
abo
ve 3
60.0
0 1
1.85
T
ime
of U
se (T
OU
) - P
eak
1
4.40
T
ime
of U
se (T
OU
) - O
ff-Pe
ak 3
60.0
0 7.
65
J-3
(a)F
or S
uppl
y at
11,
33
kV
380
.00
11.
95
Tim
e of
Use
(TO
U) -
Pea
k
14.
40
Tim
e of
Use
(TO
U) -
Off-
Peak
380
.00
7.75
J-
3 (b
)For
Sup
ply
at 6
6 kV
and
abo
ve 3
60.0
0 1
1.85
T
ime
of U
se (T
OU
) - P
eak
1
4.40
T
ime
of U
se (T
OU
) - O
ff-Pe
ak 3
60.0
0 7.
65
*Rep
rese
nts
Mul
ti Ye
ar T
ariff
sch
edul
es.
**Fi
xed
Char
ges
(Rs./
kW/M
onth
)
***V
aria
ble
Char
ges
(Rs./
kWh)
Sour
ce: N
atio
nal E
lect
ric P
ower
Reg
ulat
ory
Auth
ority
, Isl
amab
ad

266
TABL
E 79
COM
PARA
TIV
E TA
RIFF
STA
TEM
ENT
OF
MU
LTA
N E
LECT
RIC
POW
ER C
OM
PAN
Y LI
MIT
ED (M
EPCO
)
PART
ICU
LARS
2011
-12
2012
-13
2013
-14
2014
-15
2015
-16
Fixe
d*Va
ri-
able
**Fi
xed*
Vari
able
**Fi
xed*
Vari
able
**Fi
xed*
Vari
-ab
le**
Fixe
d*Va
ri-
able
**RE
SID
ENTI
AL
Up
to 5
0 U
nits
3.
00
4.
00
4.
00
4.
00
4.
00
For P
eak
Load
requ
irem
ent l
ess
than
5 k
W 0
1-10
0 U
nits
1
0.00
13.
50
1
3.00
9.52
7.65
1
01-2
00 U
nits
1
6.90
12.
00
1
0.85
2
01-3
00 U
nits
1
4.50
15.
65
1
6.90
12.
00
1
1.30
3
01-7
00 U
nits
1
6.40
17.
65
1
7.90
15.
00
1
3.40
A
bove
700
Uni
ts
18.
00
1
9.50
19.
00
1
6.00
16.
00
Load
Exc
eedi
ng 5
kW
Tim
e of
Use
(TO
U) -
Pea
k
17.
00
1
9.50
19.
00
1
6.00
16.
00
Tim
e of
Use
(TO
U) -
Off-
Peak
1
0.00
14.
00
1
3.30
10.
50
9.
70
Tem
pora
ry S
uppl
y
14.
00
COM
MER
CIA
L -
A2
Load
less
than
5 k
W
18.
50
1
9.50
19.
00
1
6.00
16.
40
Load
5 k
W a
nd a
bove
Reg
ular
400
.00
16.
00
400
.00
16.
00
400
.00
16.
00
400.
00
14.
00
400.
00
14.
40
Tim
e of
Use
(TO
U) -
Pea
k
17.
00
1
9.50
19.
00
1
6.00
16.
00
Tim
e of
Use
(TO
U) -
Off-
Peak
400
.00
10.
00
400
.00
14.
00
400
.00
13.
30
400.
00
10.
50
400.
00
9.70
Te
mpo
rary
Sup
ply
1
6.40
G
ENER
AL
SERV
ICES
- A
3
11.
50
IND
UST
RIA
L B
1
13.
00
1
5.50
15.
50
1
3.50
13.
90
B1
(Pea
k)
17.
00
1
9.50
19.
00
1
6.00
16.
00
B1
(Off-
Peak
)
10.
00
1
4.00
13.
30
1
0.50
9.70
B
2 4
00.0
0 1
1.50
4
00.0
0 1
5.00
4
00.0
0 1
5.00
40
0.00
1
3.00
40
0.00
1
3.40
B
2 -
TOU
(Pea
k)
16.
00
1
9.50
19.
00
1
6.00
16.
00
B2
- TO
U (O
ff-Pe
ak)
400
.00
9.70
4
00.0
0 1
3.80
4
00.0
0 1
3.10
40
0.00
1
0.30
40
0.00
9.
50
B3
- TO
U (P
eak)
1
5.70
19.
50
1
9.00
16.
00
1
6.00
B
3 -
TOU
(Off-
Peak
) 3
80.0
0 9.
60
380
.00
13.
70
380
.00
13.
00
380.
00
10.
20
380
.00
9.40
B
4 -
TOU
(Pea
k)
15.
50
1
9.50
19.
00
1
6.00
16.
00
B4
- TO
U (O
ff-Pe
ak)
360
.00
9.50
3
60.0
0 1
3.60
3
60.0
0 1
2.90
36
0.00
1
0.10
36
0.00
9.
30
Tem
pora
ry S
uppl
y
13.
90
BULK
SU
PPLY
C1 (a
) Sup
ply
at 4
00/2
30 V
olts
- le
ss th
an 5
kW
1
4.00
15.
00
1
6.00
14.
00
1
4.40
C1
(b) S
uppl
y at
400
/230
Vol
ts -
5 k
W a
nd u
pto
500
kW 4
00.0
0 1
2.50
4
00.0
0 1
4.50
4
00.0
0 1
5.50
40
0.00
1
3.50
40
0.00
1
3.90
T
ime
of U
se (T
OU
) - P
eak
1
6.00
19.
50
1
9.00
16.
00
1
6.00
T
ime
of U
se (T
OU
) - O
ff-Pe
ak 4
00.0
0 9.
70
400
.00
14.
00
400
.00
13.
30
400.
00
10.
50
400.
00
9.70
C2
Sup
ply
at 1
1, 3
3 kV
upt
o an
d in
clud
ing
5000
kW
380
.00
12.
40
380
.00
14.
40
380
.00
15.
30
380.
00
13.
30
380.
00
13.
70
Tim
e of
Use
(TO
U) -
Pea
k
15.
70
1
9.50
19.
00
1
6.00
16.
00
Tim
e of
Use
(TO
U) -
Off-
Peak
380
.00
9.60
3
80.0
0 1
3.90
3
80.0
0 1
3.10
38
0.00
1
0.30
38
0.00
9.
50
C3 S
uppl
y at
66
kV a
nd a
bove
and
san
ctio
ned
load
abo
ve 5
000
kW 3
60.0
0 1
2.30
3
60.0
0 1
4.30
3
60.0
0 1
5.20
36
0.00
1
3.20
36
0.00
1
3.60
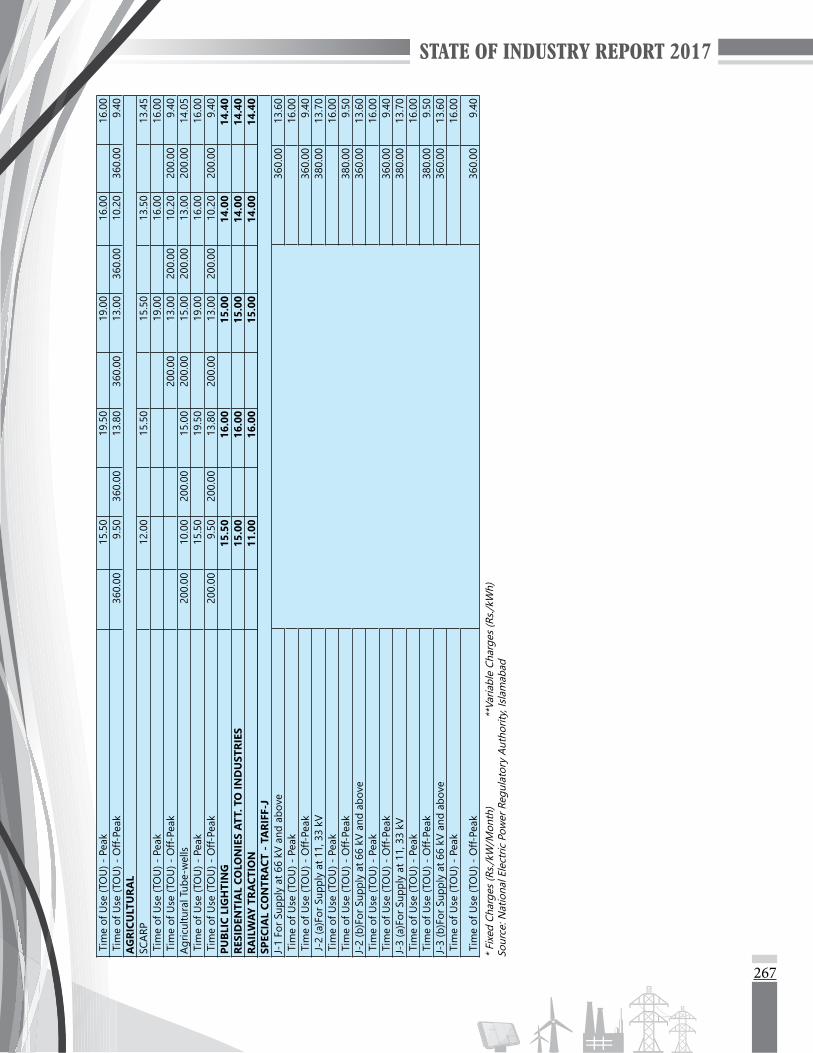
267
Tim
e of
Use
(TO
U) -
Pea
k
15.
50
1
9.50
19.
00
1
6.00
16.
00
Tim
e of
Use
(TO
U) -
Off-
Peak
360
.00
9.50
3
60.0
0 1
3.80
3
60.0
0 1
3.00
36
0.00
1
0.20
36
0.00
9.
40
AG
RICU
LTU
RAL
SCA
RP
12.
00
1
5.50
15.
50
1
3.50
13.
45
Tim
e of
Use
(TO
U) -
Pea
k
19.
00
1
6.00
16.
00
Tim
e of
Use
(TO
U) -
Off-
Peak
200
.00
13.
00
200.
00
10.
20
200.
00
9.40
A
gric
ultu
ral T
ube-
wel
ls 2
00.0
0 1
0.00
2
00.0
0 1
5.00
2
00.0
0 1
5.00
20
0.00
1
3.00
20
0.00
1
4.05
T
ime
of U
se (T
OU
) - P
eak
1
5.50
19.
50
1
9.00
16.
00
1
6.00
T
ime
of U
se (T
OU
) - O
ff-Pe
ak 2
00.0
0 9.
50
200
.00
13.
80
200
.00
13.
00
200.
00
10.
20
200.
00
9.40
PU
BLIC
LIG
HTI
NG
1
5.50
16.
00
1
5.00
14.
00
1
4.40
RE
SID
ENTI
AL
COLO
NIE
S AT
T. T
O IN
DU
STRI
ES
15.
00
1
6.00
15.
00
1
4.00
14.
40
RAIL
WAY
TRA
CTIO
N
11.
00
1
6.00
15.
00
1
4.00
14.
40
SPEC
IAL
CON
TRA
CT -
TA
RIFF
-JJ-
1 Fo
r Sup
ply
at 6
6 kV
and
abo
ve 3
60.0
0 1
3.60
T
ime
of U
se (T
OU
) - P
eak
1
6.00
T
ime
of U
se (T
OU
) - O
ff-Pe
ak 3
60.0
0 9.
40
J-2
(a)F
or S
uppl
y at
11,
33
kV
380
.00
13.
70
Tim
e of
Use
(TO
U) -
Pea
k
16.
00
Tim
e of
Use
(TO
U) -
Off-
Peak
380
.00
9.50
J-
2 (b
)For
Sup
ply
at 6
6 kV
and
abo
ve 3
60.0
0 1
3.60
T
ime
of U
se (T
OU
) - P
eak
1
6.00
T
ime
of U
se (T
OU
) - O
ff-Pe
ak 3
60.0
0 9.
40
J-3
(a)F
or S
uppl
y at
11,
33
kV
380
.00
13.
70
Tim
e of
Use
(TO
U) -
Pea
k
16.
00
Tim
e of
Use
(TO
U) -
Off-
Peak
380
.00
9.50
J-
3 (b
)For
Sup
ply
at 6
6 kV
and
abo
ve 3
60.0
0 1
3.60
T
ime
of U
se (T
OU
) - P
eak
1
6.00
Tim
e of
Use
(TO
U) -
Off-
Peak
360
.00
9.40
*
Fixe
d Ch
arge
s (R
s./kW
/Mon
th)
**
Varia
ble
Char
ges
(Rs./
kWh)
Sour
ce: N
atio
nal E
lect
ric P
ower
Reg
ulat
ory
Auth
ority
, Isl
amab
ad
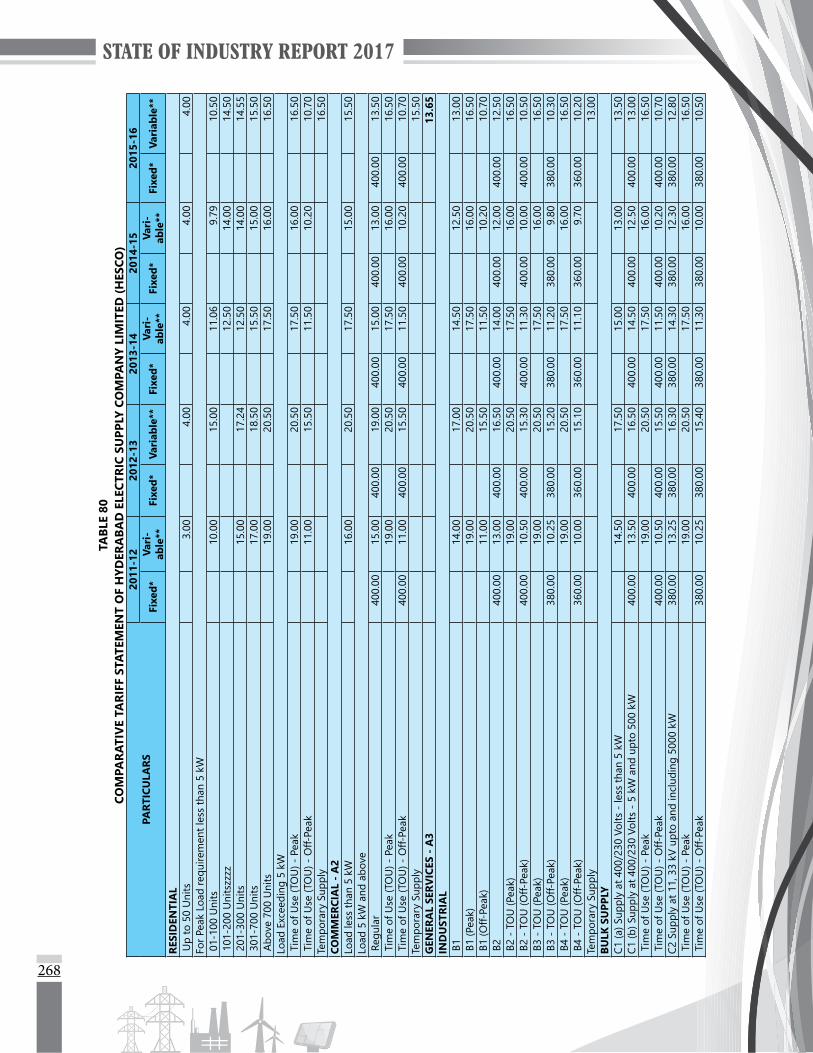
268
TABL
E 80
COM
PARA
TIV
E TA
RIFF
STA
TEM
ENT
OF
HYD
ERA
BAD
ELE
CTRI
C SU
PPLY
CO
MPA
NY
LIM
ITED
(HES
CO)
PART
ICU
LARS
2011
-12
2012
-13
2013
-14
2014
-15
2015
-16
Fixe
d*Va
ri-
able
**Fi
xed*
Vari
able
**Fi
xed*
Vari
-ab
le**
Fixe
d*Va
ri-
able
**Fi
xed*
Vari
able
**
RESI
DEN
TIA
L U
p to
50
Uni
ts
3.00
4.00
4.00
4.00
4.00
Fo
r Pea
k Lo
ad re
quire
men
t les
s th
an 5
kW
01-
100
Uni
ts
10.
00
1
5.00
11.
06
9.
79
1
0.50
1
01-2
00 U
nits
zzzz
1
2.50
14.
00
1
4.50
2
01-3
00 U
nits
1
5.00
17.
24
1
2.50
14.
00
1
4.55
3
01-7
00 U
nits
1
7.00
18.
50
1
5.50
15.
00
1
5.50
A
bove
700
Uni
ts
19.
00
2
0.50
17.
50
1
6.00
16.
50
Load
Exc
eedi
ng 5
kW
Tim
e of
Use
(TO
U) -
Pea
k
19.
00
2
0.50
17.
50
1
6.00
16.
50
Tim
e of
Use
(TO
U) -
Off-
Peak
1
1.00
15.
50
1
1.50
10.
20
1
0.70
Te
mpo
rary
Sup
ply
1
6.50
CO
MM
ERCI
AL
- A
2Lo
ad le
ss th
an 5
kW
1
6.00
20.
50
1
7.50
15.
00
1
5.50
Lo
ad 5
kW
and
abo
ve R
egul
ar 4
00.0
0 1
5.00
4
00.0
0 1
9.00
4
00.0
0 1
5.00
4
00.0
0 1
3.00
4
00.0
0 1
3.50
T
ime
of U
se (T
OU
) - P
eak
1
9.00
20.
50
1
7.50
16.
00
1
6.50
T
ime
of U
se (T
OU
) - O
ff-Pe
ak 4
00.0
0 1
1.00
4
00.0
0 1
5.50
4
00.0
0 1
1.50
4
00.0
0 1
0.20
4
00.0
0 1
0.70
Te
mpo
rary
Sup
ply
1
5.50
G
ENER
AL
SERV
ICES
- A
3
13.
65
IND
UST
RIA
L B
1
14.
00
1
7.00
14.
50
1
2.50
13.
00
B1
(Pea
k)
19.
00
2
0.50
17.
50
1
6.00
16.
50
B1
(Off-
Peak
)
11.
00
1
5.50
11.
50
1
0.20
10.
70
B2
400
.00
13.
00
400
.00
16.
50
400
.00
14.
00
400
.00
12.
00
400
.00
12.
50
B2
- TO
U (P
eak)
1
9.00
20.
50
1
7.50
16.
00
1
6.50
B
2 -
TOU
(Off-
Peak
) 4
00.0
0 1
0.50
4
00.0
0 1
5.30
4
00.0
0 1
1.30
4
00.0
0 1
0.00
4
00.0
0 1
0.50
B
3 -
TOU
(Pea
k)
19.
00
2
0.50
17.
50
1
6.00
16.
50
B3
- TO
U (O
ff-Pe
ak)
380
.00
10.
25
380
.00
15.
20
380
.00
11.
20
380
.00
9.80
3
80.0
0 1
0.30
B
4 -
TOU
(Pea
k)
19.
00
2
0.50
17.
50
1
6.00
16.
50
B4
- TO
U (O
ff-Pe
ak)
360
.00
10.
00
360
.00
15.
10
360
.00
11.
10
360
.00
9.70
3
60.0
0 1
0.20
Te
mpo
rary
Sup
ply
1
3.00
BU
LK S
UPP
LYC1
(a) S
uppl
y at
400
/230
Vol
ts -
less
than
5 k
W
14.
50
1
7.50
15.
00
1
3.00
13.
50
C1 (b
) Sup
ply
at 4
00/2
30 V
olts
- 5
kW
and
upt
o 50
0 kW
400
.00
13.
50
400
.00
16.
50
400
.00
14.
50
400
.00
12.
50
400
.00
13.
00
Tim
e of
Use
(TO
U) -
Pea
k
19.
00
2
0.50
17.
50
1
6.00
16.
50
Tim
e of
Use
(TO
U) -
Off-
Peak
400
.00
10.
50
400
.00
15.
50
400
.00
11.
50
400
.00
10.
20
400
.00
10.
70
C2 S
uppl
y at
11,
33
kV u
pto
and
incl
udin
g 50
00 k
W 3
80.0
0 1
3.25
3
80.0
0 1
6.30
3
80.0
0 1
4.30
3
80.0
0 1
2.30
3
80.0
0 1
2.80
T
ime
of U
se (T
OU
) - P
eak
1
9.00
20.
50
1
7.50
16.
00
1
6.50
T
ime
of U
se (T
OU
) - O
ff-Pe
ak 3
80.0
0 1
0.25
3
80.0
0 1
5.40
3
80.0
0 1
1.30
3
80.0
0 1
0.00
3
80.0
0 1
0.50
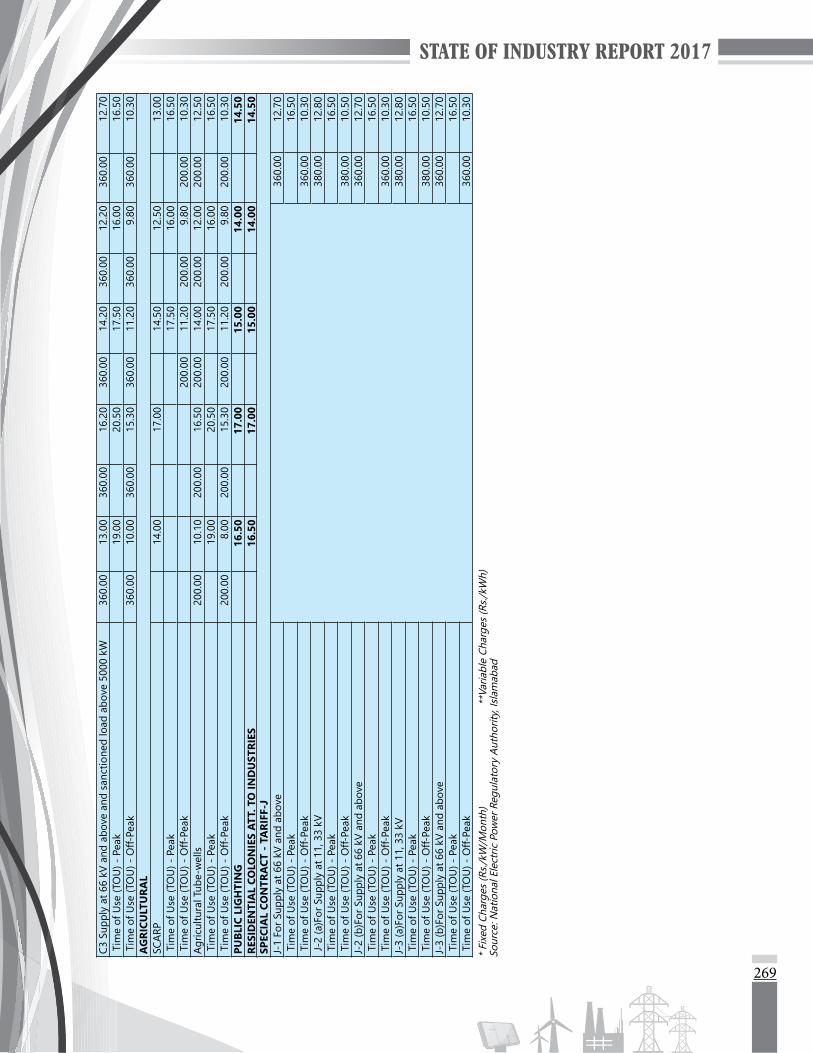
269
C3 S
uppl
y at
66
kV a
nd a
bove
and
san
ctio
ned
load
abo
ve 5
000
kW 3
60.0
0 1
3.00
3
60.0
0 1
6.20
3
60.0
0 1
4.20
3
60.0
0 1
2.20
3
60.0
0 1
2.70
T
ime
of U
se (T
OU
) - P
eak
1
9.00
20.
50
1
7.50
16.
00
1
6.50
T
ime
of U
se (T
OU
) - O
ff-Pe
ak 3
60.0
0 1
0.00
3
60.0
0 1
5.30
3
60.0
0 1
1.20
3
60.0
0 9.
80
360
.00
10.
30
AG
RICU
LTU
RAL
SCA
RP
14.
00
1
7.00
14.
50
1
2.50
13.
00
Tim
e of
Use
(TO
U) -
Pea
k
17.
50
1
6.00
16.
50
Tim
e of
Use
(TO
U) -
Off-
Peak
200
.00
11.
20
200
.00
9.80
2
00.0
0 1
0.30
A
gric
ultu
ral T
ube-
wel
ls 2
00.0
0 1
0.10
2
00.0
0 1
6.50
2
00.0
0 1
4.00
2
00.0
0 1
2.00
2
00.0
0 1
2.50
T
ime
of U
se (T
OU
) - P
eak
1
9.00
20.
50
1
7.50
16.
00
1
6.50
T
ime
of U
se (T
OU
) - O
ff-Pe
ak 2
00.0
0 8.
00
200
.00
15.
30
200
.00
11.
20
200
.00
9.80
2
00.0
0 1
0.30
PU
BLIC
LIG
HTI
NG
1
6.50
17.
00
1
5.00
14.
00
1
4.50
RE
SID
ENTI
AL
COLO
NIE
S AT
T. T
O IN
DU
STRI
ES
16.
50
1
7.00
15.
00
1
4.00
14.
50
SPEC
IAL
CON
TRA
CT -
TA
RIFF
-JJ-
1 Fo
r Sup
ply
at 6
6 kV
and
abo
ve 3
60.0
0 1
2.70
T
ime
of U
se (T
OU
) - P
eak
1
6.50
T
ime
of U
se (T
OU
) - O
ff-Pe
ak 3
60.0
0 1
0.30
J-
2 (a
)For
Sup
ply
at 1
1, 3
3 kV
3
80.0
0 1
2.80
T
ime
of U
se (T
OU
) - P
eak
1
6.50
T
ime
of U
se (T
OU
) - O
ff-Pe
ak 3
80.0
0 1
0.50
J-
2 (b
)For
Sup
ply
at 6
6 kV
and
abo
ve 3
60.0
0 1
2.70
T
ime
of U
se (T
OU
) - P
eak
1
6.50
T
ime
of U
se (T
OU
) - O
ff-Pe
ak 3
60.0
0 1
0.30
J-
3 (a
)For
Sup
ply
at 1
1, 3
3 kV
3
80.0
0 1
2.80
T
ime
of U
se (T
OU
) - P
eak
1
6.50
T
ime
of U
se (T
OU
) - O
ff-Pe
ak 3
80.0
0 1
0.50
J-
3 (b
)For
Sup
ply
at 6
6 kV
and
abo
ve 3
60.0
0 1
2.70
T
ime
of U
se (T
OU
) - P
eak
1
6.50
T
ime
of U
se (T
OU
) - O
ff-Pe
ak 3
60.0
0 1
0.30
*
Fixe
d Ch
arge
s (R
s./kW
/Mon
th)
**
Varia
ble
Char
ges
(Rs./
kWh)
Sour
ce: N
atio
nal E
lect
ric P
ower
Reg
ulat
ory
Auth
ority
, Isl
amab
ad

270
TABL
E 81
COM
PARA
TIV
E TA
RIFF
STA
TEM
ENT
OF
SUKK
UR
ELEC
TRIC
SU
PPLY
CO
MPA
NY
LIM
ITED
(SEP
CO)
PART
ICU
LARS
2011
-12
2012
-13
2013
-14
2014
-15
2015
-16
Fixe
d*Va
ri-
able
**Fi
xed*
Vari
-ab
le**
Fixe
d*Va
ri-
able
**Fi
xed*
Vari
able
**Fi
xed*
Vari
able
**
RESI
DEN
TIA
L U
p to
50
Uni
ts
3.00
4.00
4.00
4.00
4.00
Fo
r Pea
k Lo
ad re
quire
men
t les
s th
an 5
kW
01-
100
Uni
ts
11.
13
1
5.00
10.
50
1
1.00
9.95
1
01-2
00 U
nits
1
2.50
13.
52
1
1.50
2
01-3
00 U
nits
1
5.00
16.
00
1
2.50
13.
52
1
2.70
3
01-7
00 U
nits
1
7.00
17.
00
1
5.50
16.
00
1
6.55
A
bove
700
Uni
ts
19.
00
2
0.00
17.
50
1
9.00
19.
90
Load
Exc
eedi
ng 5
kW
Tim
e of
Use
(TO
U) -
Pea
k
19.
00
2
0.00
17.
50
1
9.00
19.
90
Tim
e of
Use
(TO
U) -
Off-
Peak
1
1.50
15.
50
1
1.50
13.
00
1
3.95
Te
mpo
rary
Sup
ply
1
7.55
CO
MM
ERCI
AL
- A
2Lo
ad le
ss th
an 5
kW
1
6.00
20.
00
1
7.50
19.
00
1
9.80
Lo
ad 5
kW
and
abo
ve R
egul
ar 4
00.0
0 1
5.00
4
00.0
0 1
9.00
4
00.0
0 1
5.00
4
00.0
0 1
5.00
4
00.0
0 1
7.80
T
ime
of U
se (T
OU
) - P
eak
1
9.00
20.
00
1
7.50
19.
00
1
9.90
T
ime
of U
se (T
OU
) - O
ff-Pe
ak 4
00.0
0 1
1.50
4
00.0
0 1
5.50
4
00.0
0 1
1.50
4
00.0
0 1
3.00
4
00.0
0 1
3.95
Te
mpo
rary
Sup
ply
1
9.80
G
ENER
AL
SERV
ICES
- A
3
15.
00
IND
UST
RIA
L B
1
14.
00
1
7.00
14.
50
1
4.50
17.
30
B1
(Pea
k)
19.
00
2
0.00
17.
50
1
9.00
19.
90
B1
(Off-
Peak
)
11.
50
1
5.50
11.
50
1
3.00
13.
95
B2
400
.00
13.
00
400
.00
16.
50
400
.00
14.
00
400
.00
14.
00
400
.00
16.
80
B2
- TO
U (P
eak)
1
9.00
20.
00
1
7.50
19.
00
1
9.90
B
2 -
TOU
(Off-
Peak
) 4
00.0
0 1
1.00
4
00.0
0 1
5.30
4
00.0
0 1
1.30
4
00.0
0 1
2.80
4
00.0
0 1
3.75
B
3 -
TOU
(Pea
k)
19.
00
2
0.00
17.
50
1
9.00
19.
90
B3
- TO
U (O
ff-Pe
ak)
380
.00
10.
50
380
.00
15.
20
380
.00
11.
20
380
.00
12.
70
380
.00
13.
65
B4
- TO
U (P
eak)
1
9.00
20.
00
1
7.50
19.
00
1
9.90
B
4 -
TOU
(Off-
Peak
) 3
60.0
0 1
0.25
3
60.0
0 1
5.10
3
60.0
0 1
1.10
3
60.0
0 1
2.60
3
60.0
0 1
3.55
Te
mpo
rary
Sup
ply
1
7.30
BU
LK S
UPP
LYC1
(a) S
uppl
y at
400
/230
Vol
ts -
less
than
5 k
W
14.
50
1
7.50
15.
00
1
5.00
17.
80
C1 (b
) Sup
ply
at 4
00/2
30 V
olts
- 5
kW
and
upt
o 50
0 kW
400
.00
13.
50
400
.00
16.
50
400
.00
14.
50
400
.00
14.
50
400
.00
17.
30
Tim
e of
Use
(TO
U) -
Pea
k
19.
00
2
0.00
17.
50
1
9.00
19.
90
Tim
e of
Use
(TO
U) -
Off-
Peak
400
.00
11.
00
400
.00
15.
50
400
.00
11.
50
400
.00
13.
00
400
.00
13.
95
C2 S
uppl
y at
11,
33
kV u
pto
and
incl
udin
g 50
00 k
W 3
80.0
0 1
3.25
3
80.0
0 1
6.30
3
80.0
0 1
4.30
3
80.0
0 1
4.30
3
80.0
0 1
7.10
T
ime
of U
se (T
OU
) - P
eak
1
9.00
20.
00
1
7.50
19.
00
1
9.90
T
ime
of U
se (T
OU
) - O
ff-Pe
ak 3
80.0
0 1
0.50
3
80.0
0 1
5.40
3
80.0
0 1
1.30
3
80.0
0 1
2.80
3
80.0
0 1
3.75
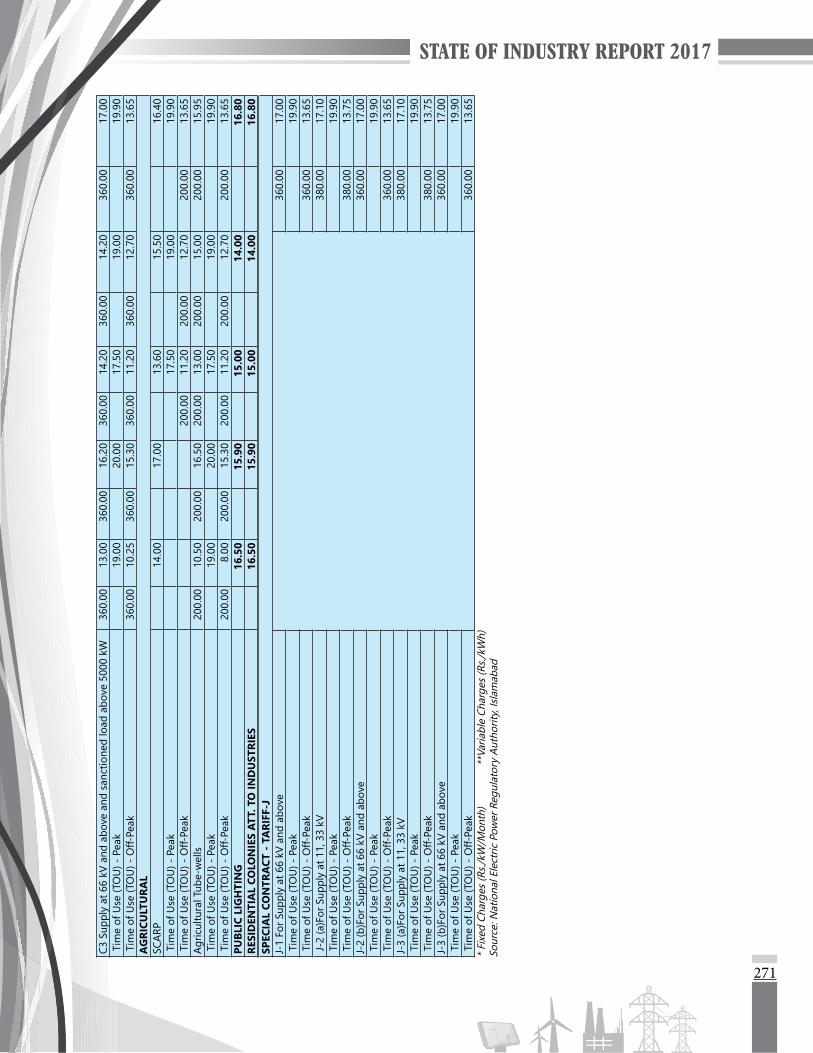
271
C3 S
uppl
y at
66
kV a
nd a
bove
and
san
ctio
ned
load
abo
ve 5
000
kW 3
60.0
0 1
3.00
3
60.0
0 1
6.20
3
60.0
0 1
4.20
3
60.0
0 1
4.20
3
60.0
0 1
7.00
T
ime
of U
se (T
OU
) - P
eak
1
9.00
20.
00
1
7.50
19.
00
1
9.90
T
ime
of U
se (T
OU
) - O
ff-Pe
ak 3
60.0
0 1
0.25
3
60.0
0 1
5.30
3
60.0
0 1
1.20
3
60.0
0 1
2.70
3
60.0
0 1
3.65
A
GRI
CULT
URA
LSC
ARP
1
4.00
17.
00
1
3.60
15.
50
1
6.40
T
ime
of U
se (T
OU
) - P
eak
1
7.50
19.
00
1
9.90
T
ime
of U
se (T
OU
) - O
ff-Pe
ak
2
00.0
0 1
1.20
2
00.0
0 1
2.70
2
00.0
0 1
3.65
A
gric
ultu
ral T
ube-
wel
ls 2
00.0
0 1
0.50
2
00.0
0 1
6.50
2
00.0
0 1
3.00
2
00.0
0 1
5.00
2
00.0
0 1
5.95
T
ime
of U
se (T
OU
) - P
eak
1
9.00
20.
00
1
7.50
19.
00
1
9.90
T
ime
of U
se (T
OU
) - O
ff-Pe
ak 2
00.0
0 8.
00
200
.00
15.
30
200
.00
11.
20
200
.00
12.
70
200
.00
13.
65
PUBL
IC L
IGH
TIN
G
16.
50
1
5.90
15.
00
1
4.00
16.
80
RESI
DEN
TIA
L CO
LON
IES
ATT.
TO
IND
UST
RIES
1
6.50
15.
90
1
5.00
14.
00
1
6.80
SP
ECIA
L CO
NTR
ACT
- T
ARI
FF-J
J-
1 Fo
r Sup
ply
at 6
6 kV
and
abo
ve
360
.00
17.0
0 T
ime
of U
se (T
OU
) - P
eak
19.9
0 T
ime
of U
se (T
OU
) - O
ff-Pe
ak36
0.00
13.6
5 J-
2 (a
)For
Sup
ply
at 1
1, 3
3 kV
38
0.00
17.1
0 T
ime
of U
se (T
OU
) - P
eak
19.9
0 T
ime
of U
se (T
OU
) - O
ff-Pe
ak38
0.00
13.7
5J-
2 (b
)For
Sup
ply
at 6
6 kV
and
abo
ve36
0.00
17.0
0 T
ime
of U
se (T
OU
) - P
eak
19.9
0 T
ime
of U
se (T
OU
) - O
ff-Pe
ak36
0.00
13.6
5J-
3 (a
)For
Sup
ply
at 1
1, 3
3 kV
38
0.00
17.1
0 T
ime
of U
se (T
OU
) - P
eak
19.9
0 T
ime
of U
se (T
OU
) - O
ff-Pe
ak38
0.00
13.7
5J-
3 (b
)For
Sup
ply
at 6
6 kV
and
abo
ve36
0.00
17.0
0 T
ime
of U
se (T
OU
) - P
eak
19.9
0 T
ime
of U
se (T
OU
) - O
ff-Pe
ak36
0.00
13.6
5*
Fixe
d Ch
arge
s (R
s./kW
/Mon
th)
**Va
riabl
e Ch
arge
s (R
s./kW
h)So
urce
: Nat
iona
l Ele
ctric
Pow
er R
egul
ator
y Au
thor
ity, I
slam
abad
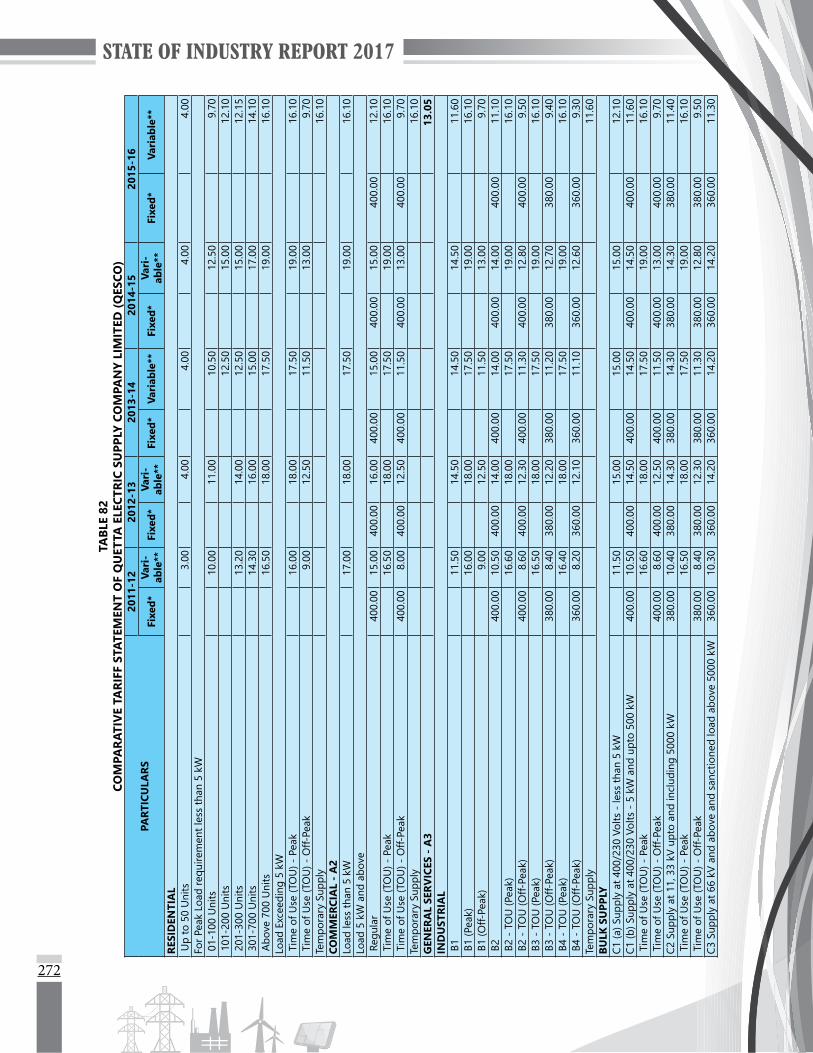
272
TABL
E 82
COM
PARA
TIV
E TA
RIFF
STA
TEM
ENT
OF
QU
ETTA
ELE
CTRI
C SU
PPLY
CO
MPA
NY
LIM
ITED
(QES
CO)
PART
ICU
LARS
2011
-12
2012
-13
2013
-14
2014
-15
2015
-16
Fixe
d*Va
ri-
able
**Fi
xed*
Vari
-ab
le**
Fixe
d*Va
riab
le**
Fixe
d*Va
ri-
able
**Fi
xed*
Vari
able
**
RESI
DEN
TIA
L U
p to
50
Uni
ts
3.00
4.00
4.00
4.00
4.00
Fo
r Pea
k Lo
ad re
quire
men
t les
s th
an 5
kW
01-
100
Uni
ts
10.
00
1
1.00
10.
50
1
2.50
9.70
1
01-2
00 U
nits
1
2.50
15.
00
1
2.10
2
01-3
00 U
nits
1
3.20
14.
00
1
2.50
15.
00
1
2.15
3
01-7
00 U
nits
1
4.30
16.
00
1
5.00
17.
00
1
4.10
A
bove
700
Uni
ts
16.
50
1
8.00
17.
50
1
9.00
16.
10
Load
Exc
eedi
ng 5
kW
Tim
e of
Use
(TO
U) -
Pea
k
16.
00
1
8.00
17.
50
1
9.00
16.
10
Tim
e of
Use
(TO
U) -
Off-
Peak
9.
00
1
2.50
11.
50
1
3.00
9.70
Te
mpo
rary
Sup
ply
1
6.10
CO
MM
ERCI
AL
- A
2Lo
ad le
ss th
an 5
kW
1
7.00
18.
00
1
7.50
19.
00
1
6.10
Lo
ad 5
kW
and
abo
ve R
egul
ar 4
00.0
0 1
5.00
4
00.0
0 1
6.00
4
00.0
0 1
5.00
4
00.0
0 1
5.00
4
00.0
0 1
2.10
T
ime
of U
se (T
OU
) - P
eak
1
6.50
18.
00
1
7.50
19.
00
1
6.10
T
ime
of U
se (T
OU
) - O
ff-Pe
ak 4
00.0
0 8.
00
400
.00
12.
50
400
.00
11.
50
400
.00
13.
00
400
.00
9.70
Te
mpo
rary
Sup
ply
1
6.10
G
ENER
AL
SERV
ICES
- A
3
13.
05
IND
UST
RIA
L B
1
11.
50
1
4.50
14.
50
1
4.50
11.
60
B1
(Pea
k)
16.
00
1
8.00
17.
50
1
9.00
16.
10
B1
(Off-
Peak
)
9.00
12.
50
1
1.50
13.
00
9.
70
B2
400
.00
10.
50
400
.00
14.
00
400
.00
14.
00
400
.00
14.
00
400
.00
11.
10
B2
- TO
U (P
eak)
1
6.60
18.
00
1
7.50
19.
00
1
6.10
B
2 -
TOU
(Off-
Peak
) 4
00.0
0 8.
60
400
.00
12.
30
400
.00
11.
30
400
.00
12.
80
400
.00
9.50
B
3 -
TOU
(Pea
k)
16.
50
1
8.00
17.
50
1
9.00
16.
10
B3
- TO
U (O
ff-Pe
ak)
380
.00
8.40
3
80.0
0 1
2.20
3
80.0
0 1
1.20
3
80.0
0 1
2.70
3
80.0
0 9.
40
B4
- TO
U (P
eak)
1
6.40
18.
00
1
7.50
19.
00
1
6.10
B
4 -
TOU
(Off-
Peak
) 3
60.0
0 8.
20
360
.00
12.
10
360
.00
11.
10
360
.00
12.
60
360
.00
9.30
Te
mpo
rary
Sup
ply
1
1.60
BU
LK S
UPP
LYC1
(a) S
uppl
y at
400
/230
Vol
ts -
less
than
5 k
W
11.
50
1
5.00
15.
00
1
5.00
12.
10
C1 (b
) Sup
ply
at 4
00/2
30 V
olts
- 5
kW
and
upt
o 50
0 kW
400
.00
10.
50
400
.00
14.
50
400
.00
14.
50
400
.00
14.
50
400
.00
11.
60
Tim
e of
Use
(TO
U) -
Pea
k
16.
60
1
8.00
17.
50
1
9.00
16.
10
Tim
e of
Use
(TO
U) -
Off-
Peak
400
.00
8.60
4
00.0
0 1
2.50
4
00.0
0 1
1.50
4
00.0
0 1
3.00
4
00.0
0 9.
70
C2 S
uppl
y at
11,
33
kV u
pto
and
incl
udin
g 50
00 k
W 3
80.0
0 1
0.40
3
80.0
0 1
4.30
3
80.0
0 1
4.30
3
80.0
0 1
4.30
3
80.0
0 1
1.40
T
ime
of U
se (T
OU
) - P
eak
1
6.50
18.
00
1
7.50
19.
00
1
6.10
T
ime
of U
se (T
OU
) - O
ff-Pe
ak 3
80.0
0 8.
40
380
.00
12.
30
380
.00
11.
30
380
.00
12.
80
380
.00
9.50
C3
Sup
ply
at 6
6 kV
and
abo
ve a
nd s
anct
ione
d lo
ad a
bove
500
0 kW
360
.00
10.
30
360
.00
14.
20
360
.00
14.
20
360
.00
14.
20
360
.00
11.
30

273
Tim
e of
Use
(TO
U) -
Pea
k
16.
40
1
8.00
17.
50
1
9.00
16.
10
Tim
e of
Use
(TO
U) -
Off-
Peak
360
.00
8.20
3
60.0
0 1
2.20
3
60.0
0 1
1.20
3
60.0
0 1
2.70
3
60.0
0 9.
40
AG
RICU
LTU
RAL
SCA
RP
13.
00
1
3.01
14.
00
1
5.20
12.
30
Tim
e of
Use
(TO
U) -
Pea
k
17.
50
1
9.00
16.
10
Tim
e of
Use
(TO
U) -
Off-
Peak
200
.00
11.
20
200
.00
12.
70
200
.00
9.40
A
gric
ultu
ral T
ube-
wel
ls 2
00.0
0 1
1.50
2
00.0
0 1
1.51
2
00.0
0 1
3.61
2
00.0
0 1
4.70
2
00.0
0 1
1.80
T
ime
of U
se (T
OU
) - P
eak
1
6.50
17.
00
1
7.50
19.
00
1
6.10
T
ime
of U
se (T
OU
) - O
ff-Pe
ak 2
00.0
0 8.
00
200
.00
10.
00
200
.00
11.
20
200
.00
12.
70
200
.00
9.40
PU
BLIC
LIG
HTI
NG
1
4.00
15.
00
1
5.00
14.
00
1
1.10
RE
SID
ENTI
AL
COLO
NIE
S AT
T. T
O IN
DU
STRI
ES
14.
00
1
5.00
15.
00
1
4.00
11.
10
SPEC
IAL
CON
TRA
CT -
TA
RIFF
-J
J-1
For S
uppl
y at
66
kV a
nd a
bove
360
.00
11.
30
Tim
e of
Use
(TO
U) -
Pea
k
16.
10
Tim
e of
Use
(TO
U) -
Off-
Peak
360
.00
9.40
J-
2 (a
)For
Sup
ply
at 1
1, 3
3 kV
3
80.0
0 1
1.40
T
ime
of U
se (T
OU
) - P
eak
1
6.10
T
ime
of U
se (T
OU
) - O
ff-Pe
ak 3
80.0
0 9.
50
J-2
(b)F
or S
uppl
y at
66
kV a
nd a
bove
360
.00
11.
30
Tim
e of
Use
(TO
U) -
Pea
k
16.
10
Tim
e of
Use
(TO
U) -
Off-
Peak
360
.00
9.40
J-
3 (a
)For
Sup
ply
at 1
1, 3
3 kV
3
80.0
0 1
1.40
T
ime
of U
se (T
OU
) - P
eak
1
6.10
T
ime
of U
se (T
OU
) - O
ff-Pe
ak 3
80.0
0 9.
50
J-3
(b)F
or S
uppl
y at
66
kV a
nd a
bove
360
.00
11.
30
Tim
e of
Use
(TO
U) -
Pea
k
16.
10
Tim
e of
Use
(TO
U) -
Off-
Peak
360
.00
9.40
*
Fixe
d Ch
arge
s (R
s./kW
/Mon
th)
**
Varia
ble
Char
ges
(Rs./
kWh)
Sour
ce: N
atio
nal E
lect
ric P
ower
Reg
ulat
ory
Auth
ority
, Isl
amab
ad

274
TABL
E 83
NEP
RA’s
Mon
thly
Fue
l Pri
ce A
djus
tmen
ts in
res
pect
of
all D
ISCO
sM
onth
PESC
OTE
SCO
IESC
OG
EPCO
LESC
OFE
SCO
MEP
COH
ESCO
SEPC
OQ
ESCO
Incr
ease
/(D
ecre
ase)
Rs.
/kW
hJu
ly, 2
016
(2.4
93)
(2.4
93)
(2.4
93)
(2.4
93)
(2.4
93)
(2.4
93)
(2.4
93)
(2.4
93)
(2.4
93)
(2.4
93)
Aug
ust,
2016
(2.5
65)
(2.5
65)
(2.5
65)
(2.5
65)
(2.5
65)
(2.5
65)
(2.5
65)
(2.5
65)
(2.5
65)
(2.5
65)
Sept
embe
r, 20
16 (2
.773
) (2
.773
) (2
.773
) (2
.773
) (2
.773
) (2
.773
) (2
.773
) (2
.773
) (2
.773
) (2
.773
)O
ctob
er, 2
016
(2.6
10)
(2.6
10)
(2.6
10)
(2.6
10)
(2.6
10)
(2.6
10)
(2.6
10)
(2.6
10)
(2.6
10)
(2.6
10)
Nov
embe
r, 20
16 (3
.608
) (3
.608
) (3
.608
) (3
.608
) (3
.608
) (3
.608
) (3
.608
) (3
.608
) (3
.608
) (3
.608
)D
ecem
ber,
2016
(2.2
20)
(2.2
20)
(2.2
20)
(2.2
20)
(2.2
20)
(2.2
20)
(2.2
20)
(2.2
20)
(2.2
20)
(2.2
20)
Janu
ary,
201
7 (3
.309
) (3
.309
) (3
.309
) (3
.309
) (3
.309
) (3
.309
) (3
.309
) (3
.309
) (3
.309
) (3
.309
)Fe
brua
ry, 2
017
(2.1
50)
(2.1
50)
(2.1
50)
(2.1
50)
(2.1
50)
(2.1
50)
(2.1
50)
(2.1
50)
(2.1
50)
(2.1
50)
Mar
ch, 2
017
(2.1
48)
(2.1
48)
(2.1
48)
(2.1
48)
(2.1
48)
(2.1
48)
(2.1
48)
(2.1
48)
(2.1
48)
(2.1
48)
Apr
il, 2
017
(1.9
62)
(1.9
62)
(1.9
62)
(1.9
62)
(1.9
62)
(1.9
62)
(1.9
62)
(1.9
62)
(1.9
62)
(1.9
62)
May
, 201
7 (1
.752
) (1
.752
) (1
.752
) (1
.752
) (1
.752
) (1
.752
) (1
.752
) (1
.752
) (1
.752
) (1
.752
)Ju
ne, 2
017
(2.2
36)
(2.2
36)
(2.2
36)
(2.2
36)
(2.2
36)
(2.2
36)
(2.2
36)
(2.2
36)
(2.2
36)
(2.2
36)

275
TABL
E 84
Mon
thly
Sou
rce-
wis
e Po
wer
Sen
t O
ut a
nd F
uel C
ost
(201
6-17
)Ju
lyA
ug.
Sept
.O
ct.
Nov
.D
ec.
Jan.
Feb.
Mar
chA
pril
May
June
Tota
l
Hydel
Gen
erat
ion
GW
h 3,
948.
02
4,24
9.59
4,
209.
50
2,76
2.04
2,
842.
53
1,64
2.65
5
11.7
8 1
,493
.46
1,2
84.2
4 2
,025
.71
3,32
6.00
3,
490.
23
31,7
85.7
5
%
35.
92
39.
47
41.
24
31.
87
40.
99
22.
82
7.4
0 2
3.40
1
6.84
2
2.91
3
0.17
3
0.46
2
9.70
Fue
l Cos
t M
ln. R
s. -
-
-
-
-
-
-
-
-
-
-
-
-
Rs./
kWh
-
-
-
-
-
-
-
-
-
-
-
-
-
Coal
Gen
erat
ion
GW
h 5
.40
10.
44
8.1
3 1
0.17
-
2
.53
8.6
2 4
.62
8.7
3 5
4.96
2
47.0
2 6
52.4
4 1
,013
.06
%
0.0
5 0
.10
0.0
8 0
.12
-
0.0
4 0
.12
0.0
7 0
.11
0.6
2 2
.24
5.6
9 0
.95
Fue
l Cos
t M
ln. R
s. 2
4.29
4
6.97
3
6.57
4
5.78
-
1
1.39
3
8.79
2
0.77
3
9.29
2
01.9
9 1
,051
.68
2,8
03.2
5 4
,320
.77
Rs./
kWh
4.5
0 4
.50
4.5
0 4
.50
-
4.5
0 4
.50
4.5
0 4
.50
3.6
8 -
4
.30
4.2
7
HSD
Gen
erat
ion
GW
h 6
5.53
1
42.1
6 1
01.6
6 1
72.6
4 -
6
0.62
3
62.0
8 5
.95
38.
15
137
.65
406
.56
155
.37
1,6
48.3
7
%
0.6
0 1
.32
1.0
0 1
.99
-
0.8
4 5
.24
0.0
9 0
.50
1.5
6 3
.69
1.3
6 1
.54
Fue
l Cos
t M
ln. R
s. 8
36.3
1 1
,790
.76
1,2
53.4
2 2
,017
.48
-
729
.84
4,9
66.1
5 8
9.29
5
74.0
2 2
,062
.22
5,9
81.3
0 2
,230
.60
22,
531.
39
Rs./
kWh
12.
76
12.
60
12.
33
11.
69
-
12.
04
13.
72
15.
01
15.
05
14.
98
14.
71
14.
36
13.
67
RFO
Gen
erat
ion
GW
h 3
,186
.70
3,0
54.4
2 2
,651
.33
2,6
30.3
5 1
,345
.02
2,6
73.3
0 3
,296
.96
1,6
77.5
3 2
,495
.77
3,0
81.2
4 3
,305
.80
2,5
59.9
3 3
1,95
8.35
%
28.
99
28.
37
25.
97
30.
35
19.
39
37.
13
47.
69
26.
28
32.
72
34.
85
29.
99
22.
34
29.
86
Fue
l Cos
t M
ln. R
s. 23
,625
.82
23,2
47.4
5 20
,044
.37
20,9
26.2
7 11
,019
.67
23,0
98.3
1 29
,188
.04
17,3
75.1
5 24
,660
.01
30,3
10.1
5 31
,076
.05
24,3
05.3
3 27
8,87
6.62
Rs./
kWh
7.4
1 7
.61
7.5
6 7
.96
8.1
9 8
.64
8.8
5 1
0.36
9
.88
9.8
4 9
.40
9.4
9 8
.73
Gas/RLNG
Gen
erat
ion
GW
h 3
,041
.38
2,6
20.8
7 2
,518
.22
2,4
59.4
2 2
,211
.72
2,1
51.9
5 1
,866
.82
2,3
34.4
8 2
,829
.97
2,7
24.1
3 2
,801
.96
3,5
18.5
4 3
1,07
9.46
%
27.
67
24.
34
24.
67
28.
38
31.
89
29.
89
27.
00
36.
57
37.
10
30.
81
25.
42
30.
71
29.
04
Fue
l Cos
t M
ln. R
s. 15
,747
.97
14,0
57.9
8 13
,517
.58
13,9
02.6
3 12
,544
.72
11,7
03.4
2 8
,032
.22
11,6
76.5
6 1
5,08
4.64
15
,093
.21
15,3
17.5
2 19
,463
.65
166,
142.
10
Rs./
kWh
5.1
8 5
.36
5.3
7 5
.65
5.6
7 5
.44
4.3
0 5
.00
5.3
3 5
.54
5.4
7 5
.53
5.3
5
Nuclear
Gen
erat
ion
GW
h 4
34.5
8 4
32.1
9 4
22.3
1 4
37.4
2 3
38.4
0 4
41.6
9 5
80.5
5 5
81.0
8 6
16.6
2 4
40.8
0 4
85.4
4 6
57.1
4 5
,868
.22
%
3.9
5 4
.01
4.1
4 5
.05
4.8
8 6
.13
8.4
0 9
.10
8.0
8 4
.99
4.4
0 5
.74
5.4
8
Fue
l Cos
t M
ln. R
s. 5
04.2
6 5
01.1
8 4
90.0
0 5
07.5
6 4
00.5
3 2
67.2
0 4
70.2
7 6
51.8
0 6
62.7
6 4
42.1
9 5
06.7
8 5
25.9
2 5
,930
.45
Rs./
kWh
1.1
6 1
.16
1.1
6 1
.16
1.1
8 0
.60
0.8
1 1
.12
1.0
7 1
.00
1.0
4 0
.80
1.0
1
Import Iran
Gen
erat
ion
GW
h 4
5.81
4
4.72
4
2.09
4
1.34
3
5.02
3
2.05
3
4.58
3
3.81
3
8.72
4
4.91
4
9.48
5
3.88
4
96.4
1
%
0.4
2 0
.42
0.4
1 0
.48
0.5
0 0
.45
0.5
0 0
.53
0.5
1 0
.51
0.4
5 0
.47
0.4
6
Fue
l Cos
t M
ln. R
s. 4
85.5
4 4
74.0
2 4
46.1
9 4
39.4
6 3
72.2
7 3
40.6
6 3
67.5
9 3
59.4
4 4
11.5
5 4
77.3
9 5
25.9
5 5
72.7
1 5
,272
.77
Rs./
kWh
10.
60
10.
60
10.
60
10.
63
10.
63
10.
63
10.
63
10.
63
10.
63
10.
63
10.
63
10.
63
10.
62

276
July
Aug
.Se
pt.
Oct
.N
ov.
Dec
.Ja
n.Fe
b.M
arch
Apr
ilM
ayJu
neTo
tal
Mixed
Gen
erat
ion
GW
h 8
.11
7.8
4 7
.03
5.9
8 1
4.57
2
7.79
3
2.46
3
6.11
5
0.21
2
9.54
2
5.08
2
6.67
2
71.3
9
%
0.0
7 0
.07
0.0
7 0
.07
0.2
1 0
.39
0.4
7 0
.57
0.6
6 0
.33
0.2
3 0
.23
0.2
5
Fue
l Cos
t M
ln. R
s. 6
2.64
6
0.45
5
4.25
4
6.14
1
02.4
4 1
81.2
3 2
10.1
5 2
34.5
8 3
31.6
8 2
03.1
0 1
72.6
0 1
85.9
8 1
,845
.24
Rs./
kWh
7.7
2 7
.71
7.7
2 7
.72
7.0
3 6
.52
6.4
7 6
.50
6.6
1 6
.88
6.8
8 6
.97
6.8
0
Wind Power
Gen
erat
ion
GW
h 1
29.8
5 8
2.63
1
43.0
8 7
1.59
4
6.67
5
4.13
1
06.6
1 8
1.02
8
6.64
1
49.2
7 2
10.0
7 1
95.6
5 1
,357
.21
%
1.1
8 0
.77
1.4
0 0
.83
0.6
7 0
.75
1.5
4 1
.27
1.1
4 1
.69
1.9
1 1
.71
1.2
7
Fue
l Cos
t M
ln. R
s. -
-
-
-
-
-
-
-
-
-
-
-
-
Rs./
kWh
-
-
-
-
-
-
-
-
-
-
-
-
-
Solar Power
Gen
erat
ion
GW
h 5
7.61
5
2.00
6
1.87
5
6.41
4
5.34
4
3.16
3
9.89
5
4.23
6
2.87
6
2.76
6
2.85
5
4.29
6
53.2
8
%
0.5
2 0
.48
0.6
1 0
.65
0.6
5 0
.60
0.5
8 0
.85
0.8
2 0
.71
0.5
7 0
.47
0.6
1
Fue
l Cos
t M
ln. R
s. -
-
-
-
-
-
-
-
-
-
-
-
-
Rs./
kWh
-
-
-
-
-
-
-
-
-
-
-
-
-
Bagasse
Gen
erat
ion
GW
h 6
8.84
6
8.95
4
2.21
1
8.68
5
5.99
6
9.78
7
3.28
8
0.46
1
16.2
7 9
1.01
1
03.5
9 9
4.09
8
83.1
5
%
0.6
3 0
.64
0.4
1 0
.22
0.8
1 0
.97
1.0
6 1
.26
1.5
2 1
.03
0.9
4 0
.82
0.8
3
Fue
l Cos
t M
ln. R
s. 4
10.0
4 4
11.4
9 2
51.6
2 1
11.7
7 3
34.9
7 3
93.2
4 3
59.1
6 3
43.0
7 4
63.6
7 5
49.5
9 6
28.2
8 5
78.1
8 4
,835
.08
Rs./
kWh
-
-
-
-
-
-
-
-
-
-
6.0
7 6
.14
5.4
7 N
ote:
As
per d
ata
prov
ided
by
CPPA
-G

277
Table 85K-Electric - Summary of Monthly Fuel Cost Adjustments (2016-17)
Description July Aug Sep Oct NovFuel Cost - Gas (Rs./MMBTu) 613 613 613 613 613 Fuel Cost - Furnace Oil (Rs/ M.ton) 29,889 29,637 30,520 32,326 34,633 Bin Qasim Power PlantWeighted Average Fuel Cost (Rs./kWh) Reference 7.07 7.07 7.07 7.55 7.55 Weighted Average Fuel Cost (Rs./kWh) Actual 7.48 7.51 7.55 8.09 8.63 Difference (Rs. /kWh) 0.411 0.431 0.479 0.539 1.072 Number of Units Sent Out (Mln kWh) 440.90 405.51 361.82 344.85 235.25 Fuel Cost Variation (Mln Rs) 181.00 174.80 173.35 185.95 252.17 Bin Qasim Power Plant-IIWeighted Average Fuel Cost (Rs./kWh) Reference - - - - - Weighted Average Fuel Cost (Rs./kWh) Actual - - - - - Difference (Rs. /kWh) - - - - - Number of Units Sent Out (Mln kWh) 342.45 342.06 334.20 352.26 349.11 Fuel Cost Variation (Mln Rs) - - - - - Korangi Gas-IIWeighted Average Fuel Cost (Rs./kWh) Reference 5.82 5.82 5.82 5.82 5.82 Weighted Average Fuel Cost (Rs./kWh) Actual 5.82 5.82 5.82 5.82 5.82 Difference (Rs. /kWh) - - 0.00 (0.00) (0.00)Number of Units Sent Out (Mln kWh) 47.07 48.57 45.56 42.09 22.19 Fuel Cost Variation (Mln Rs) - - 0.00 (0.00) (0.00)Site Gas-IIWeighted Average Fuel Cost (Rs./kWh) Reference 5.82 5.82 5.82 5.82 5.82 Weighted Average Fuel Cost (Rs./kWh) Actual 5.82 5.82 5.82 5.82 5.82 Difference (Rs. /kWh) - - 0.00 (0.00) (0.00)Number of Units Sent Out (Mln kWh) 48.90 50.65 39.48 47.74 4.99 Fuel Cost Variation (Mln Rs) - - 0.00 (0.00) (0.00)Korangi CCPPWeighted Average Fuel Cost (Rs./kWh) Reference 5.58 5.58 5.58 5.58 5.58 Weighted Average Fuel Cost (Rs./kWh) Actual 5.58 5.58 5.58 5.58 5.58 Difference (Rs. /kWh) - - 0.00 (0.00) (0.00)Number of Units Sent Out (Mln kWh) 133.51 108.97 109.57 123.74 52.23 Fuel Cost Variation (Mln Rs) - - 0.00 (0.00) (0.00)Fuel Cost Variation of Own Generation (Mln/ Rs.) 181.00 174.80 173.35 185.95 252.17 Power PurchasesWeighted Average Fuel Cost (Rs./kWh) Reference 4.74 4.74 4.74 4.46 4.46 Weighted Average Fuel Cost (Rs./kWh) Actual 4.80 4.77 4.46 5.32 4.55 Difference (Rs. /kWh) 0.06 0.03 (0.28) 0.87 0.09 Units Purchased (Mln kWh) 623.53 629.17 586.47 600.27 543.96 Fuel Cost Variation of Power Purchase (Mln Rs) 36.08 17.90 (165.86) 520.29 50.92 Total Fuel Cost Variation (Own Gen + Power Purchased) Mln Rs. 217.08 192.71 7.50 706.24 303.09
Total Units Sent Out (Own Gen + Power Purchased) Mln kWh 1,636.36 1,584.93 1,477.10 1,510.94 1,207.73 Fue Cost Variation (Ps./kWh) 13.27 12.16 0.51 46.74 25.10 * Energy figures of each power station are worked out on the basis set target of Auxiliary Consumption.** Fuel Cost of each power station is worked out on the basis of Heat Rates approved by the Authority.*** Fuel Cost of Bin Qasim-II is not reflected as the Heat Rate of this Power Station has not been finalized. **** Fuel cost variations have not been allowed to K-Electric for own generation and power purchases after November, 2016.***** The fuel cost variations from July to November, 2016 have been allowed on provisional basis and are liable to adjustment once new tariff is notified.
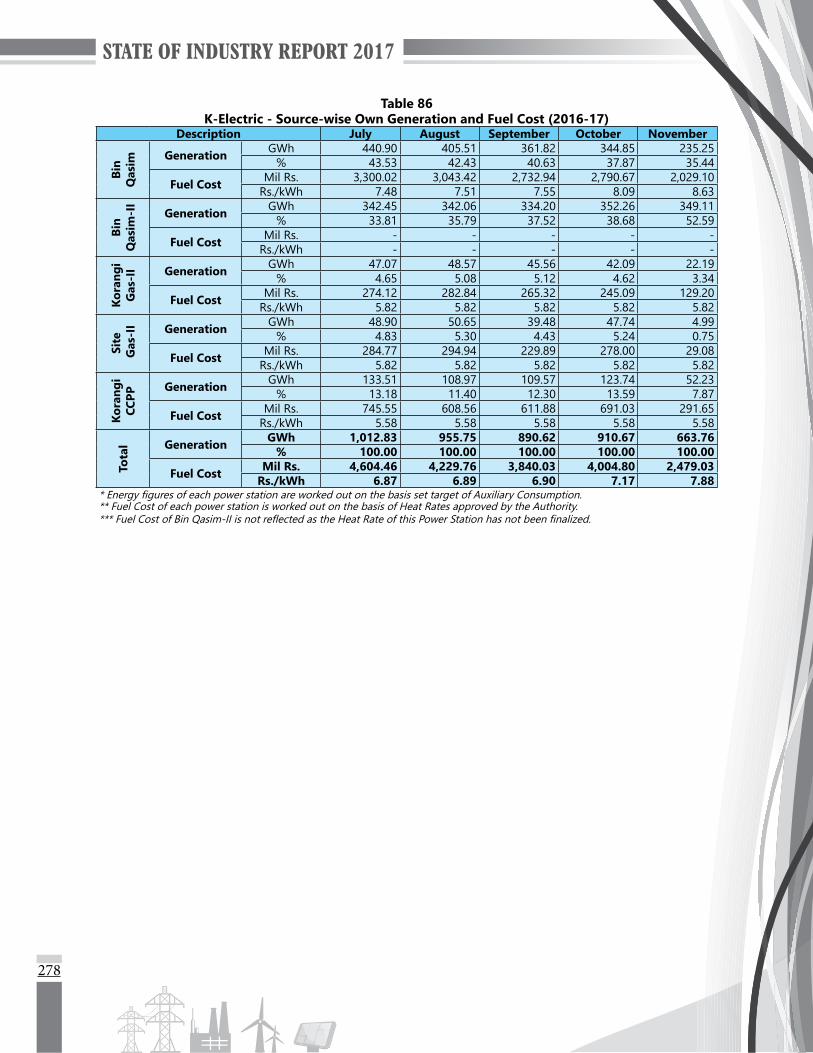
278
Table 86K-Electric - Source-wise Own Generation and Fuel Cost (2016-17)
Description July August September October NovemberBi
n Q
asim Generation GWh 440.90 405.51 361.82 344.85 235.25
% 43.53 42.43 40.63 37.87 35.44
Fuel Cost Mil Rs. 3,300.02 3,043.42 2,732.94 2,790.67 2,029.10 Rs./kWh 7.48 7.51 7.55 8.09 8.63
Bin
Q
asim
-II
Generation GWh 342.45 342.06 334.20 352.26 349.11 % 33.81 35.79 37.52 38.68 52.59
Fuel Cost Mil Rs. - - - - - Rs./kWh - - - - -
Kora
ngi
Gas
-II Generation GWh 47.07 48.57 45.56 42.09 22.19
% 4.65 5.08 5.12 4.62 3.34
Fuel Cost Mil Rs. 274.12 282.84 265.32 245.09 129.20 Rs./kWh 5.82 5.82 5.82 5.82 5.82
Site
G
as-I
I Generation GWh 48.90 50.65 39.48 47.74 4.99 % 4.83 5.30 4.43 5.24 0.75
Fuel Cost Mil Rs. 284.77 294.94 229.89 278.00 29.08 Rs./kWh 5.82 5.82 5.82 5.82 5.82
Kora
ngi
CCPP
Generation GWh 133.51 108.97 109.57 123.74 52.23 % 13.18 11.40 12.30 13.59 7.87
Fuel Cost Mil Rs. 745.55 608.56 611.88 691.03 291.65 Rs./kWh 5.58 5.58 5.58 5.58 5.58
Tota
l Generation GWh 1,012.83 955.75 890.62 910.67 663.76 % 100.00 100.00 100.00 100.00 100.00
Fuel Cost Mil Rs. 4,604.46 4,229.76 3,840.03 4,004.80 2,479.03 Rs./kWh 6.87 6.89 6.90 7.17 7.88
* Energy figures of each power station are worked out on the basis set target of Auxiliary Consumption.** Fuel Cost of each power station is worked out on the basis of Heat Rates approved by the Authority.*** Fuel Cost of Bin Qasim-II is not reflected as the Heat Rate of this Power Station has not been finalized.

279
Table 87K-Electric - Source-wise Power Purchases and Fuel Cost (2016-17)
Description July August September October NovemberCP
PA-G Generation GWh 434.43 439.01 428.15 435.41 413.42
% 69.67 69.77 73.00 72.54 76.00
Fuel Cost Mil Rs. 1,737.69 1,708.30 1,566.67 2,058.32 1,527.82 Rs./kWh 4.00 3.89 3.66 4.73 3.70
Tapa
l En
ergy Generation GWh 66.34 71.57 59.46 52.85 39.75
% 10.64 11.38 10.14 8.80 7.31
Fuel Cost Mil Rs. 433.38 483.24 387.03 355.72 283.13 Rs./kWh 6.53 6.75 6.51 6.73 7.12
Gul
A
hmed Generation GWh 66.98 74.28 63.20 61.40 44.86
% 10.74 11.81 10.78 10.23 8.25
Fuel Cost Mil Rs. 461.14 521.35 428.10 445.01 353.06 Rs./kWh 6.88 7.02 6.77 7.25 7.87
KAN
UPP Generation GWh 44.32 34.35 24.93 39.26 35.82
% 7.11 5.46 4.25 6.54 6.58
Fuel Cost Mil Rs. 290.84 228.28 166.61 266.68 247.15 Rs./kWh 6.56 6.65 6.68 6.79 6.90
PASM
IC Generation GWh - - - - - % 0.00 0.00 0.00 0.00 0.00
Fuel Cost Mil Rs. - - - - - Rs./kWh - - - - -
Ano
ud
Pow
er Generation GWh 5.07 4.93 4.93 4.94 4.80 % 0.81 0.78 0.84 0.82 0.88
Fuel Cost Mil Rs. 31.77 30.00 32.11 33.04 33.60 Rs./kWh 6.26 6.09 6.51 6.69 6.99
IIL
Generation GWh 6.38 5.04 5.81 6.40 5.31 % 1.02 0.80 0.99 1.07 0.98
Fuel Cost Mil Rs. 37.05 29.26 33.75 37.28 30.94 Rs./kWh 5.81 5.81 5.81 5.82 5.82
Tota
l Generation GWh 623.53 629.17 586.47 600.27 543.96 % 100.00 100.00 100.00 100.00 100.00
Fuel Cost Mil Rs. 2,991.87 3,000.45 2,614.27 3,196.06 2,475.69 Rs./kWh 4.80 4.77 4.46 5.32 4.55
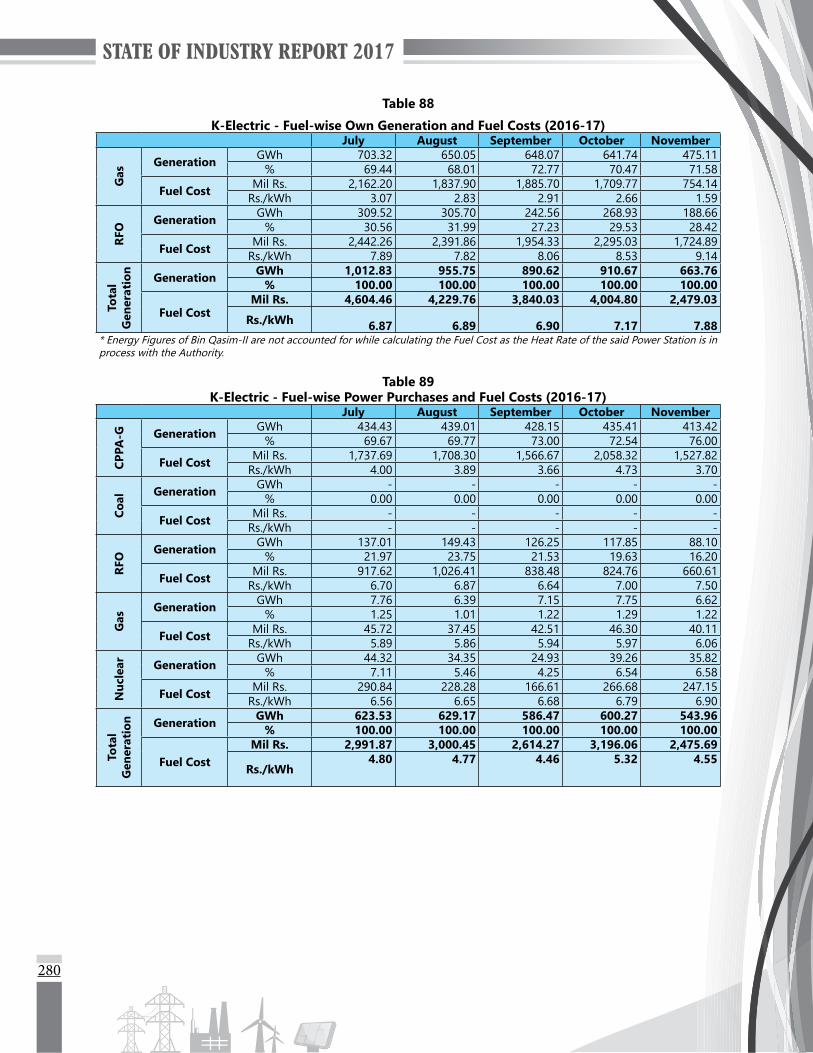
280
Table 88
K-Electric - Fuel-wise Own Generation and Fuel Costs (2016-17)July August September October November
Gas
Generation GWh 703.32 650.05 648.07 641.74 475.11 % 69.44 68.01 72.77 70.47 71.58
Fuel Cost Mil Rs. 2,162.20 1,837.90 1,885.70 1,709.77 754.14 Rs./kWh 3.07 2.83 2.91 2.66 1.59
RFO Generation GWh 309.52 305.70 242.56 268.93 188.66
% 30.56 31.99 27.23 29.53 28.42
Fuel Cost Mil Rs. 2,442.26 2,391.86 1,954.33 2,295.03 1,724.89 Rs./kWh 7.89 7.82 8.06 8.53 9.14
Tota
l G
ener
atio
n
Generation GWh 1,012.83 955.75 890.62 910.67 663.76 % 100.00 100.00 100.00 100.00 100.00
Fuel CostMil Rs. 4,604.46 4,229.76 3,840.03 4,004.80 2,479.03
Rs./kWh 6.87 6.89 6.90 7.17 7.88 * Energy Figures of Bin Qasim-II are not accounted for while calculating the Fuel Cost as the Heat Rate of the said Power Station is in process with the Authority.
Table 89K-Electric - Fuel-wise Power Purchases and Fuel Costs (2016-17)
July August September October November
CPPA
-G Generation GWh 434.43 439.01 428.15 435.41 413.42 % 69.67 69.77 73.00 72.54 76.00
Fuel Cost Mil Rs. 1,737.69 1,708.30 1,566.67 2,058.32 1,527.82 Rs./kWh 4.00 3.89 3.66 4.73 3.70
Coal Generation GWh - - - - -
% 0.00 0.00 0.00 0.00 0.00
Fuel Cost Mil Rs. - - - - - Rs./kWh - - - - -
RFO Generation GWh 137.01 149.43 126.25 117.85 88.10
% 21.97 23.75 21.53 19.63 16.20
Fuel Cost Mil Rs. 917.62 1,026.41 838.48 824.76 660.61 Rs./kWh 6.70 6.87 6.64 7.00 7.50
Gas
Generation GWh 7.76 6.39 7.15 7.75 6.62 % 1.25 1.01 1.22 1.29 1.22
Fuel Cost Mil Rs. 45.72 37.45 42.51 46.30 40.11 Rs./kWh 5.89 5.86 5.94 5.97 6.06
Nuc
lear Generation GWh 44.32 34.35 24.93 39.26 35.82
% 7.11 5.46 4.25 6.54 6.58
Fuel Cost Mil Rs. 290.84 228.28 166.61 266.68 247.15 Rs./kWh 6.56 6.65 6.68 6.79 6.90
Tota
l G
ener
atio
n Generation GWh 623.53 629.17 586.47 600.27 543.96 % 100.00 100.00 100.00 100.00 100.00
Fuel CostMil Rs. 2,991.87 3,000.45 2,614.27 3,196.06 2,475.69
Rs./kWh 4.80 4.77 4.46 5.32 4.55
281
LIST OF TABLES
Table 1 Primary Energy Supplies by Source (MTOE)Table 2 Final Energy Consumption by Source (MTOE)Table 3 Fuel Consumption for Thermal Power Generation (TOE) Table 4 Installed Capacity by Type (MW)Table 5 Plant-wise Installed Capacity (MW)Table 6 Installed Capacity by Systems and by Sectors (MW)Table 7 Electricity Generation by Type (GWh)Table 8 Plant-wise Electricity Generation (GWh)Table 9 Electricity Generation by Systems and by Sectors (GWh)Table 10 Electricity Statistics of K-Electric LimitedTable 11 Thermal Electricity Generation by Fuel (GWh)Table 12 Fuel Consumption and Cost of Generation Data (GENCOs)Table 13 Fuel Consumption and Cost of Generation Data (K-Electric Limited)Table 14 Fuel Consumption and Cost of Generation Data (IPPs)Table 15 Auxiliary Consumption and other Factors (Hydel Power Stations)Table 16 Auxiliary Consumption and other Factors (GENCOs)Table 17 Auxiliary Consumption and other Factors (K-Electric Power Stations)Table 18 Auxiliary Consumption and other Factors (IPPs)Table 19 Heat Rate and Plant Efficiency Data (GENCOs)Table 20 Heat Rate and Plant Efficiency Data (IPPs)Table 21 Main Electricity Statistics of the CountryTable 22 Hourly System Demand (MW)Table 23 Category-wise Energy Sales in PEPCO and K-Electric SystemTable 24 Category-wise Consumers and their Electricity ConsumptionTable 25 Annual Growth Rate of Electricity ConsumptionTable 26 Surplus/Deficit in Demand and Supply during NTDC’s System Peak HoursTable 27 Surplus/Deficit in Demand and Supply during K-Electric’s System Peak HoursTable 28 Thermal Electricity Generation by Sector and by Fuel (GWh)Table 29 Monthly Variation in Maximum Hydel Generating Capability (MW)Table 30 Ongoing Projects and Expansion Plan of Hydel Power Generation in Khyber PakhtunkhwaTable 31 Investment Plan for Public Sector Power Generation Projects (as per approved PC-1)Table 32 K-Electric’s Year-wise Plan for Addition/Deletion of Generation CapacityTable 33 Investment Plan for Power Generation Projects (K-Electric Limited)Table 34 Investment Plan for Private Sector Power Generation ProjectsTable 35 Status of Renewable Energy ProjectsTable 36 Merit Order for Power Generation Plants (PEPCO System)Table 37 Merit Order for Power Generation Plants (K-Electric System)
282
Table 38
A: List of Generation Licensees (Hydel + Nuclear)
B: List of Generation Licensees (Wind + Solar + Bagasse/Biomass)C: List of Generation Licensees (SPPs, CPPs, IGCs, N-CPPs, DGPs, STIPPs and other IPPs)D: List of Public and Private Sector Power Generation LicenseesE: List of Generation Licensees (IPPs under Power Policy 1994)F: List of Generation Licensees (IPPs under Power Policy 2002)G: List of Generation Licensees (IPPs under Power Policy 2015)H: DISCO-wise Details of Net-Metering LicenseesI: List of Transmission and Distribution Licensees
Table 39 Transmission Lines and Grid Stations with NTDCTable 40 Unit Received, Delivered and Transmission Losses in NTDC System (GWh)Table 41 Loading Position of Transmission Lines and Power Transformers in NTDC SystemTable 42 Transmission Lines Tripping in PEPCO System
Table 43A: Overloading of 500 kV and 220 kV Power Transformers at 500 Grid StationsB: Overloading of 220 kV and 132 kV Power Transformers at 220 kV Grid Stations
Table 44 Grid Station Expansion Plan of NTDCTable 45 Power Sector Investment Plan for NTDC Transmission Lines (as per approved PC-I)Table 46 Interconnection Arrangement to Evacuate Power from Up-coming Power ProjectsTable 47 Transmission Lines and Grid Stations with K-Electric Limited
Table 48
A: Amount Injected to Reinforce/Expand 220 and 132 kV Transmission System of K-Electric Limited (Million Rs.)
B: Investment Plan in Transmission Line (220 and 132 kV) of K-Electric Limited (Million US$)
Table 49 Transmission Lines Tripping in K-Electric SystemTable 50 List of Licensed Issued to Distribution CompaniesTable 51 Service Area of Distribution CompaniesTable 52 Peak Demand of Distribution CompaniesTable 53 Category-wise Number of ConsumersTable 54 Number of Circles, Divisions, Sub-Divisions, 11 kV Feeders and Loading Positions of 11 kV
FeedersTable 55 Category-wise Sanctioned LoadTable 56 Category-wise Electricity SoldTable 57 Total Units Purchased, Sold and LossesTable 58 Units Billed and Amount Realized in DISCOsTable 59 Average Annual Electricity Consumption per ConnectionTable 60 Distribution Losses (voltage category-wise)Table 61 Comparison of SAIFI and SAIDI of all Distribution CompaniesTable 62 Status of Grid StationsTable 63 DISCOs’ Power Transformers, Capacities and Loading Positions of Power TransformersTable 64 Status of Distribution LinesTable 65 Feeders Outages Statistics of DISCOsTable 66 Overloaded and Underutilized Distribution Feeders
283
Table 67 DISCOs’ Number of Distribution Transformers, Capacities and Loading Positions of Distribution Transformers
Table 68 Village Electrification in all Distribution CompaniesTable 69 Applications of New Connections Received, Energized and PendingTable 70 Province-wise Electricity Consumption by Economic Groups of the Country (GWh)Table 71 Province-wise Electricity Consumption by Economic Groups of the Country (%)Table 72 Statement of GOP Applicable (Notified) TariffTable 73 Comparative Tariff Statement of PESCOTable 74 Comparative Tariff Statement of TESCOTable 75 Comparative Tariff Statement of IESCOTable 76 Comparative Tariff Statement of GEPCOTable 77 Comparative Tariff Statement of LESCOTable 78 Comparative Tariff Statement of FESCOTable 79 Comparative Tariff Statement of MEPCOTable 80 Comparative Tariff Statement of HESCOTable 81 Comparative Tariff Statement of SEPCOTable 82 Comparative Tariff Statement of QESCOTable 83 NEPRA’s Monthly Fuel Price Adjustment in respect of all DISCOsTable 84 Monthly Source-wise Power Sent Out and Fuel CostTable 85 K-Electric – Summary of Monthly Fuel Cost AdjustmentsTable 86 K-Electric – Source-wise Own Generation and Fuel CostTable 87 K-Electric – Source-wise Power Purchases and Fuel CostTable 88 K-Electric – Fuel-wise Own Generation and Fuel CostTable 89 K-Electric – Fuel-wise Power Purchases and Fuel Cost
284
ACRONYMS AND ABBREVIATIONS
ADB Asian Development BankAEDB Alternative Energy Development BoardAJKHEB Azad Jammu and Kashmir Hydel Electricity BoardAMRS Automated Meter Reading SystemBPC Bulk Power ConsumerBQCCPP Bin Qasim Combined Cycle Power PlantBQTPS Bin Qasim Thermal Power StationBTPL Bahira Town (Pvt.) LimitedCCPP Combined Cycle Power PlantCDP Common Delivery PointCHASNUPP Chashma Nuclear Power PlantCkt CircuitCOD Commercial Operation DateCPGCL Central Power Generation Company LimitedCPI Consumer Price IndexCPP Captive Power PlantCPPA-G Central Power Purchasing Agency GuaranteeDEs Diesel EnginesDISCO Distribution CompanyDOP Development of PowerECNEC Executive Committee of the National Economic CouncilEHV Extra High VoltageELR Energy Loss ReductionFBC Fluidized Bed CombustionFDI Foreign Direct InvestmentFESCO Faisalabad Electric Supply Company LimitedFO Furnace OilGDP Gross Domestic ProductGENCO Generation CompanyGEPCO Gujranwala Electric Power Company LimitedGEs Gas EnginesGOP Government of PakistanGST General Sales TaxGTPS Gas Thermal Power StationGWh Giga Watt – hourHDIP Hydrocarbon Development Institute of PakistanHESCO Hyderabad Electric Supply Company LimitedHFO Heavy Furnace OilHPP Hydropower ProjectHSD High Speed DieselHVDC High Voltage Direct CurrentIA Implementation AgreementIBC Integrated Business CentreICB International Competitive BiddingIESCO Islamabad Electric Supply Company LimitedIPP Independent Power Producers
285
IRR Internal Rate of ReturnJPCL Jamshoro Power Company LimitedKANUPP Karachi Nuclear Power PlantKCCPP Korangi Combined Cycle Power PlantKEL K-Electric LimitedKTGTPS Korangi Town Gas Turbine Power StationKTPS Korangi Thermal Power StationkV Kilo VoltKVA Kilovolt AmperekWh Kilowatt – hoursLESCO Lahore Electric Supply Company LimitedLPGCL Lakhra Power Generation Company LimitedLtr. LitreMEPCO Multan Electric Power Company LimitedMMBTU Million British Thermal UnitMMCFT Million Cubic FeetMTOE Million Tonees of Oil EquivalentMVA Megavolt AmpereMW MegawattMWh Megawatt – hourMYT Multi-year Tariffn.a. & n.p. Not available and not providedNCPP New Captive Power PlantNEPRA National Electric Power Regulatory AuthorityNGPS Natural Gas Power StationNPCC National Power Control CentreNPGCL Northern Power Generation Company LimitedNTDC National Transmission and Despatch Company LimitedO&M Operation and MaintenanceOCPP Open Cycle Power PlantPAEC Pakistan Atomic Energy CommissionPASMIC Pakistan Steel Mills CorporationPEDO Pakhtunkhwa Energy Development OrganizationPEPCO Pakistan Electric Power Company LimitedPESCO Peshawar Electric Supply Company LimitedPNRA Pakistan Nuclear Regulatory AuthorityPPA Power Purchase AgreementPPDB Punjab Power Development BoardPPIB Private Power and Infrastructure BoardQESCO Quetta Electric Supply Company LimitedRFO Residue Furnace OilSCADA Supervisory Control and Data AcquisitionSCARP Salinity Control and Reclamation ProjectSEPCO Sukkur Electric Power Company LimitedSGTPS Site Gas Turbine Power StationPEDO Pakhtunkhwa Energy Development OrganizationSPP Small Power ProducerSPS Steam Power Station

286
STG Secondary Transmission and GridST Steam TurbineSVC Static Var CompensatorsT&D Transmission and DistributionTCEB Thar Coal and Energy BoardTESCO Tribal Area Electricity Supply Company LimitedTOD Time of DayTOU Time of UseTPS Thermal Power StationUNDP United Nations Development ProgramUSAID United States Agency for International DevelopmentWAPDA Water and Power Development AuthorityWPPO WAPDA Power Privatisation Organization
SOURCE OF INFORMATIONThe following sources of information have been used in the compilation of this State of Industry Report 2017:
i) Distribution Companiesii) K-Electric Limitediii) National Power Control Centre, NTDCiv) National Transmission and Despatch Company Limitedv) Pakistan Energy Yearbook, Hydrocarbon Development Institute of Pakistanvi) Power System Statistics, Planning Power, NTDCvii) Private Power and Infrastructure Boardviii) Alternative Energy Development Boardix) Pakhtunkhwa Energy Development Organizationx) All Independent Power Producersxi) Public Sector Generation Companiesxii) Tariff Petitions submitted to NEPRA by Distribution Companiesxiii) Water and Power Development Authorityxiv) Others
