state of environment in myanmar ... and trends – land degradation • causes of land degradation...
TRANSCRIPT

Institute for Global Environmental Strategies
State of Environment in Myanmar
13 November 2012
IGES Bangkok Regional Centre
Institute for Global Environmental Strategies
2
Content
• Biophysical Characteristics • Important Drivers of Environmental Change • Current State and Trends of Environmental Quality and Natural
Resources Degradation • Existing Institutional and Policy Responses • Policy Options • Climate Change Considerations • Conclusions and Recommendations
Institute for Global Environmental Strategies
3
Biophysical Characteristics
• ASEAN’s second largest land area at 676,577 sq. km. • Abundant forests, rivers, wetlands, and coastline. • More than 300 mammal species, over 1,000
different resident and migrating bird species, 360 reptile species, more than 1,200 butterflies, and more than 7,000 plant species.
• Habitat of elephants, white-handed gibbons, hoolock gibbons, Malayan sun bears, Asiatic black bears, banteng, gaur, serow, gorals, tigers, leopards, clouded leopards, Asian Golden cats, great hornbills, great pea fowl, Arakan Forest turtles, and many other endangered species of wildlife.
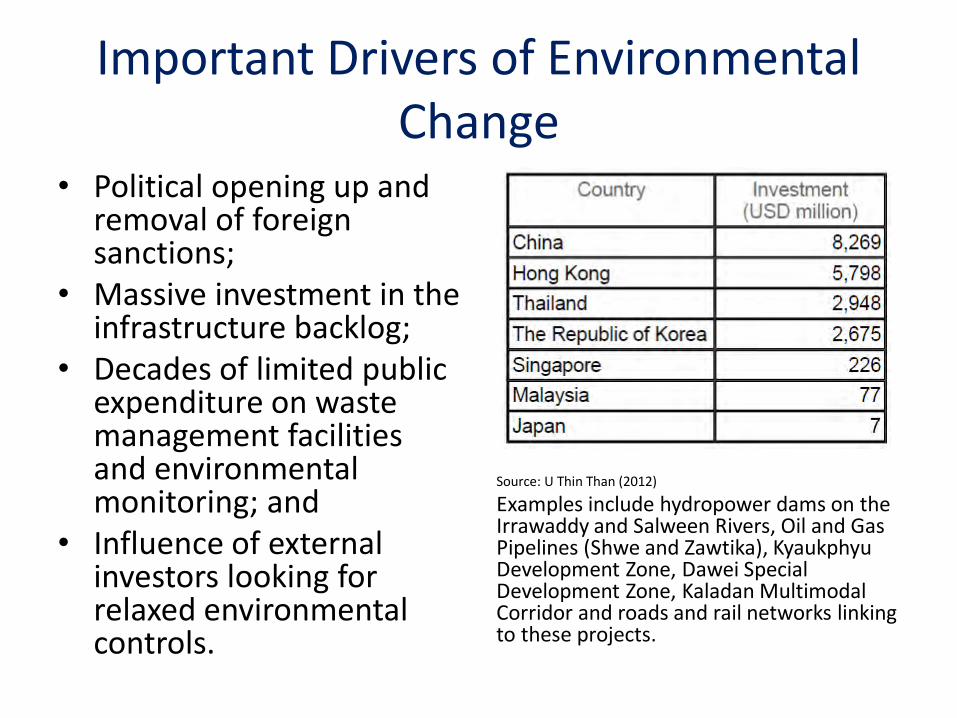
Important Drivers of Environmental Change
• Political opening up and removal of foreign sanctions;
• Massive investment in the infrastructure backlog;
• Decades of limited public expenditure on waste management facilities and environmental monitoring; and
• Influence of external investors looking for relaxed environmental controls.
Source: U Thin Than (2012)
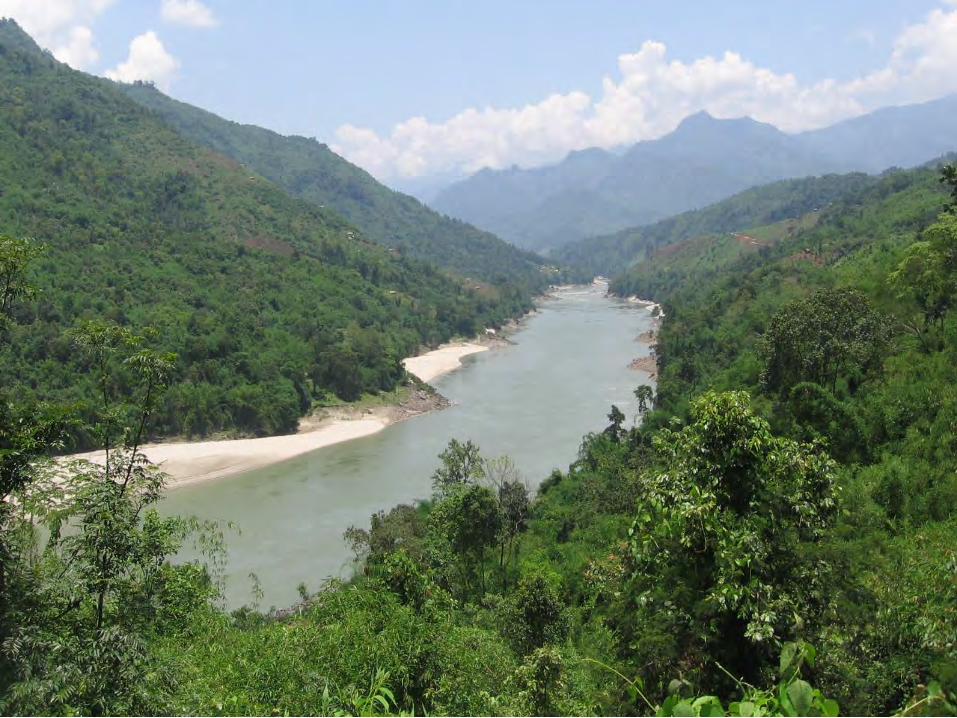
Examples include hydropower dams on the Irrawaddy and Salween Rivers, Oil and Gas Pipelines (Shwe and Zawtika), Kyaukphyu Development Zone, Dawei Special Development Zone, Kaladan Multimodal Corridor and roads and rail networks linking to these projects.

Important Drivers of Environmental Change (cont.)
• Population increase – estimated at >2.0%; 62 million by 2015;
• Deferred consumption and urbanization;
• Massive resource and energy demands of neighbouring countries;
• Global climate change, sea level rise, and ocean acidification.
Rural and Urban Population (‘000), 1985‒2015

Institute for Global Environmental Strategies
6
Current State and Trends
• Most recent information is from the Environmental Performance Review 2012 (in press).
• Priority environmental concerns are: Forest degradation; Water resources and water quality; Land degradation; Climate change; Solid waste management; Biodiversity loss; and Impacts of mining on the environment.

State and Trends - Forestry • Forests accounted for 61%
of total land area in 1975, 59% in 1989, 52% in 1998, and 49% in 2006;
• 41 million ha in 1975 and 33 million ha in 2006;
• Doubling of annual wood removal from 624 m3 per 1,000 ha of forest in 1975 to 1,291 m3 in 2006; and
• Forest Policy and Master Plan - 30% of total land area under permanent forest estate and another 5% under the protected area system.
0.0%
10.0%
20.0%
30.0%
40.0%
50.0%
60.0%
70.0%
1975 1989 1997 1998 2006
% of Total L and
0
200400
600
800
10001200
1400
1975
1978
1981
1984
1987
1990
1993
1996
1999
2002
2005
R atio m3/000 hec tare
Forest Cover as a Percentage of Total Land Area, 1975‒2006
Ratio of Annual Wood Removal (m3 per 1,000 ha of forest area), 1975‒2006


State and Trends - Water • Irrigable areas increased
from 0.80 million ha in 1997‒1998 to 1.4 million ha in 2008‒2009;
• From1990-2010, Irrigation Department constructed 169 dams for irrigation and flood protection; and
• In 1997, 45% of the population had access to safe drinking water, peaking at 90% in 2003, but dropping to 80% in 2007;
• Piped water to houses is 21% in urban areas but only 2% in rural areas.
0
50
100
150
200
250
300
1990/91 1995/96 2000/01 2005/06 2009/10
No.
of D
am
Dams and Reservoirs Constructed by the Government, 1990‒2010
“Myanmar is making progress towards its target to ensure access to safe drinking water for the entire population and to provide sufficient irrigation water for agriculture.”
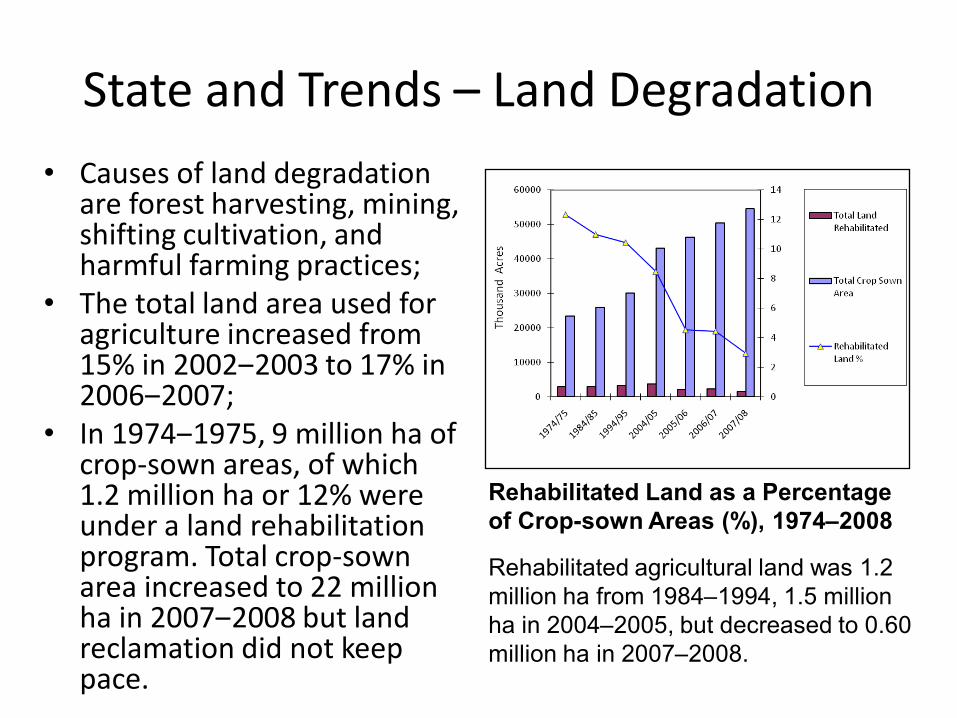
State and Trends – Land Degradation • Causes of land degradation
are forest harvesting, mining, shifting cultivation, and harmful farming practices;
• The total land area used for agriculture increased from 15% in 2002‒2003 to 17% in 2006‒2007;
• In 1974‒1975, 9 million ha of crop-sown areas, of which 1.2 million ha or 12% were under a land rehabilitation program. Total crop-sown area increased to 22 million ha in 2007‒2008 but land reclamation did not keep pace.
Rehabilitated Land as a Percentage of Crop-sown Areas (%), 1974‒2008
Rehabilitated agricultural land was 1.2 million ha from 1984‒1994, 1.5 million ha in 2004‒2005, but decreased to 0.60 million ha in 2007‒2008.


State and Trends – Climate Change
• Late starter – just preparing 1st National Communication;
• Evidence that climate change is already happening – temp. increasing, rainfall decreasing, drought increasing; and
• Cyclones, flash floods and cyclone and flood losses are increasing.
Heat Indices in Myanmar, 1960‒2000
Drought Indices, 1951‒2000

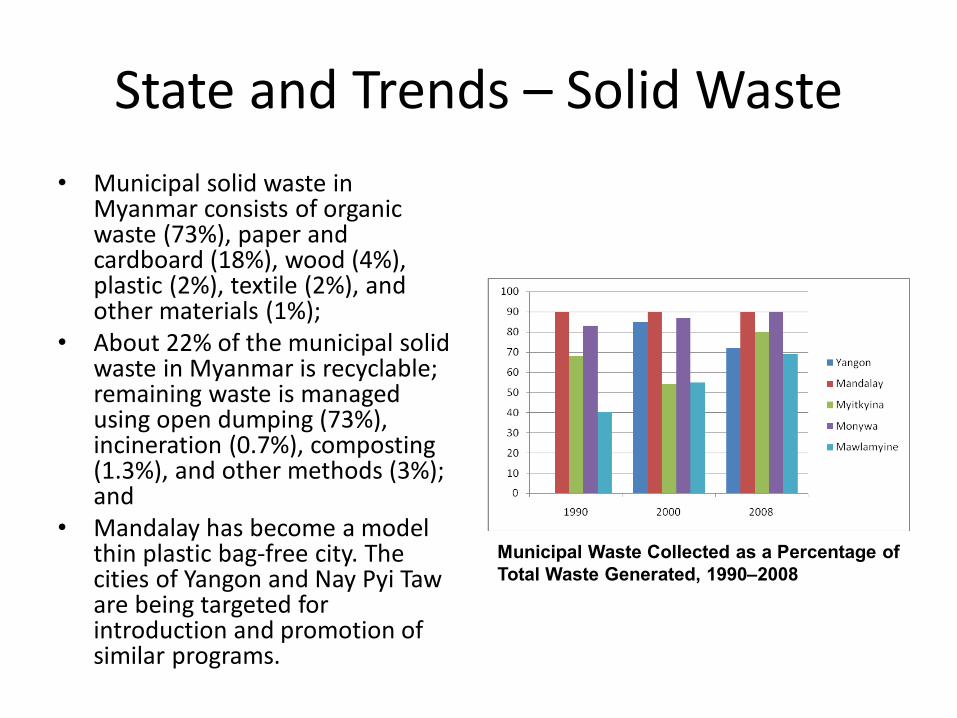
State and Trends – Solid Waste • Municipal solid waste in
Myanmar consists of organic waste (73%), paper and cardboard (18%), wood (4%), plastic (2%), textile (2%), and other materials (1%);
• About 22% of the municipal solid waste in Myanmar is recyclable; remaining waste is managed using open dumping (73%), incineration (0.7%), composting (1.3%), and other methods (3%); and
• Mandalay has become a model thin plastic bag-free city. The cities of Yangon and Nay Pyi Taw are being targeted for introduction and promotion of similar programs.
Municipal Waste Collected as a Percentage of Total Waste Generated, 1990‒2008


State and Trends - Biodiversity • Indo-Myanmar hotspot is
one of 8 global hotspots where most plants and vertebrates are likely to disappear due to loss of forest cover;
• By 2004, 34 Protected Areas (PAs) accounting for 4% of total land area. Proposed establishment of nine new PAs covering 2,285,000 ha will achieve 5% target; and
• Myanmar acceded to CITES in 1997.
Threatened Species in Myanmar as a Percentage of Globally Threatened Species
Protected Areas as a Percentage of Total Land Area, 1918‒2004


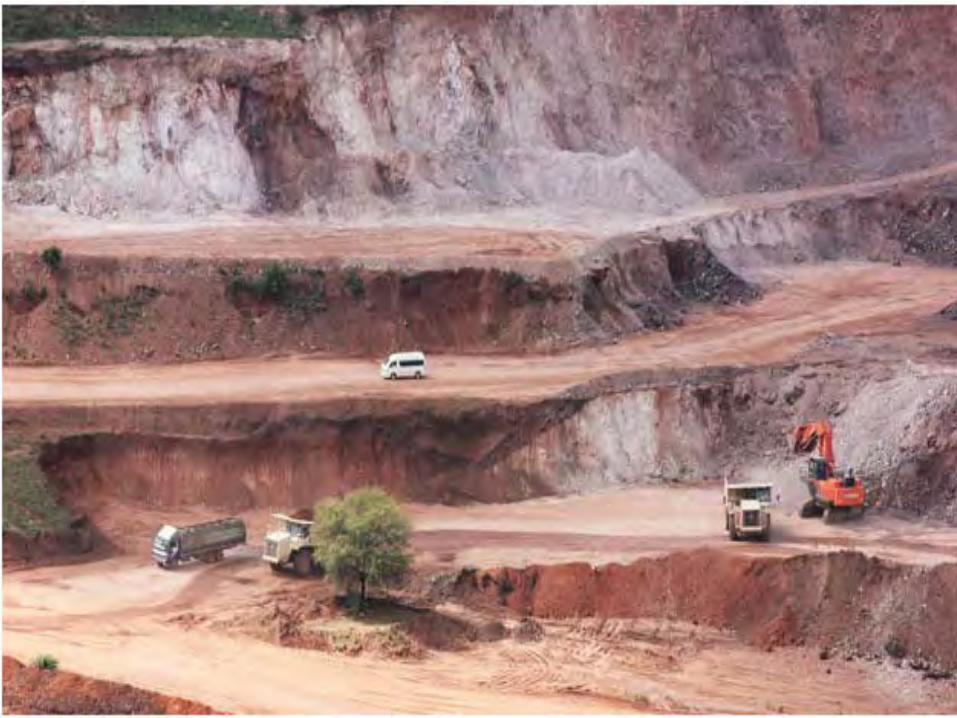
State and Trends - Mining • Mining sector is an
important source of foreign earnings. From 1990-2007, jade production increased by more than 8,500%, gems by 7,000%, coal by 970%, and refined gold by 170%;
• Main pollutants – dust, acid, toxic waste - plus biodiversity loss, land degradation, floods and health problems associated with mines.
Monywa Copper Mine - Myanmar
Illegal gold mining - Myanmar

Institute for Global Environmental Strategies
21
Institutional and Policy Responses
• Environmental Conservation Law (under revision) • National Commission for Environmental Affairs 1990 • Myanmar’s Agenda 21 • Myanmar Forest Policy 1995 • National Forestry Action Plan 1995 • National Sustainable Development Strategy 2009 • Environmental Performance Assessment 2008, 2010 • National Adaptation Programme of Action (draft) • Initial National Communication to UNFCCC (draft) • Ministry of Environmental Conservation and
Forestry 2012

Institute for Global Environmental Strategies
22
Policy Options
• Some key policy targets outlined in the latest EPA report (2010) include:
• Set aside 30% of total land area under permanent forest estate;
• Increase protected areas to 10% of total land area by 2017; • Reforest 20,000 ha of degraded land annually; • Full access to safe drinking water by 2010 (4 million people
per year); • Introduce plastic bag free cities – Yangon & Nay Pyi Taw; and • Surpass MDG targets in implementing national plans.

Institute for Global Environmental Strategies
23
Climate Change Considerations
• Myanmar ratified UNFCCC on 25 November 1994; • GEF funding was provided for Initial National Communication
in 2008; • Total GHG emissions (2000) are estimated at 7,775 Gg CO2
equiv. – mainly from energy/industry (30%) and transport (28%);
• Per capita GHG emissions are low, in part because of high proportion of hydropower in the energy mix;
• Other GHG sources include methane from irrigated rice, solid waste, livestock, and forest degradation; and
• Opportunities exist to build climate change considerations into the revised Environment Law and into environmental impact assessments.

Institute for Global Environmental Strategies
24
Conclusions and Recommendations
• Despite having a Forest Law since 1902, Myanmar is a relative latecomer in environmental governance, but now has an opportunity to leapfrog ahead of its ASEAN neighbors and to learn from regional and global best practice;
• Strengthened laws, regulations, and implementation capacity are needed in the areas of climate change, environmental impact assessment, strategic environmental assessment, urban green growth, mining, biodiversity loss, pollution control, toxic and hazardous wastes, and land degradation;
• Recent changes and the willingness of the international community to help with improving environmental quality in Myanmar suggest a bright future ahead.

Institute for Global Environmental Strategies
25
Acknowledgements
• Much of the text for this presentation comes from the final draft of the Second Environmental Performance Assessment for Myanmar (in press), courtesy of ADB;
• Other information and several photos were supplied by NCEA (2009) National Sustainable Development Strategy for Myanmar;
• Review and suggestions for the presentation were provided by colleagues in UNEP and IGES, although all errors and opinions expressed are solely of the author. Contact with the author is as follows:
• Dr. Peter N. King, Senior Policy Advisor, IGES - • [email protected]