land degradation in south asia: its severity, causes … degradation in south asia its...
TRANSCRIPT
Land degradation in south Asia: Its severity, causes and effects upon t... http://www.fao.org/docrep/V4360E/V4360E00.htm#Contents
1 van 3 12/10/2007 15:14
Land degradation in south Asia: Its severity,causes and effects upon the people
Table of Contents
World Soil Resources ReportsFOOD AND AGRICULTURE ORGANIZATION OF THE UNITED NATIONSRome, 1994
The designations employed and the presentation of material in this publication do not imply the expressionof any opinion whatsoever on the part of the Food and Agriculture Organization of the United Nations, ofthe United Nations Development Programme or of the United Nations Environment Programmeconcerning the legal statue of any country, territory, city or area or of its authorities, or concerning thedelimitation of its frontiers or boundaries.
M-51ISBN 92-5-103595-4
All rights reserved. No part of this publication may be reproduced, stored in a retrieval system ortransmitted in any form or by any means, electronic, mechanical, photocopying or otherwise, without theprior permission of the copyright owner. Applications for such permission, with a statement of the purposeand extent of the reproduction, should be addressed to the Director, Publications Division, Food andAgriculture Organization of the United Nations, Viale delle Terme di Caracalla, 00100 Rome, Italy.
(c) FAO, UNDP and UNEP 1994
Contents
AcknowledgementsSummaryChapter 1 - Introduction
Origin, objectives and constraintsBackground to the South Asia regionArrangement of the report
Chapter 2 - Types of land degradation
DefinitionsTypes of land degradation assessed
Originated by: Agriculture and ConsumerProtection
Title: Land degradation in south Asia: Its severity, causes and effects upon the people... More details
Land degradation in south Asia: Its severity, causes and effects upon t... http://www.fao.org/docrep/V4360E/V4360E00.htm#Contents
2 van 3 12/10/2007 15:14
Other types of degradation includedTypes of degradation excluded from the studyProblems of the natural environmentReversible degradation and land reclamation
Chapter 3 - Sources of data
Global assessment of soil degradation (GLASOD)Other sources of dataVariations in data and the need for definition of degrees of severity
Chapter 4 - Status of degradation. I. Erosion and fertility decline
Water erosionWind erosion Soil fertility decline
Chapter 5 - Status of degradation. II. Other types of degradation and summary
Waterlogging Salinization Lowering of the water table Other types of degradationWatershed degradation and managementSummary: the severity and extent of land degradationDiscussion
Chapter 6 - Causes of land degradation
Natural degradation hazardsDirect causes of degradationUnderlying causes of degradationLand, population, poverty and degradation: the causal nexus
Chapter 7 - Economic consequences of land degradation
Introduction: economic and social consequencesEconomic valuation of natural resources and degradationLand degradation in South Asia: the orders of magnitude of the economic costsMacroeconomic impact of land degradation
Chapter 8 - Effects upon the people
Effects upon productionConsequences for the peopleLand degradation and the poor
Chapter 9 - Institutions and programmes to combat degradation
National institutionsNational institutions: discussionEnvironmental legislationInternational institutions in the regionRegional collaborative programmes

Land degradation in south Asia: Its severity, causes and effects upon t... http://www.fao.org/docrep/V4360E/V4360E00.htm#Contents
3 van 3 12/10/2007 15:14
Chapter 10 - Conclusions and proposals
Conclusions from the studyProposals: introductionProposals for strengthening efforts to combat land degradation
ReferencesWorld soil resources reports
Untitled Normal Page http://www.fao.org/docrep/V4360E/V4360E02.htm#Chapter%201%...
1 van 6 12/10/2007 15:14
Chapter 1 - Introduction
Back to contents - Previous file - Next file
Origin, objectives and constraintsBackground to the South Asia regionArrangement of the report
Origin, objectives and constraints
Origin of the study
This study originated in Resolution Number 1991/97 of the Economic and Social Council of the United Nations, passed at its 32ndplenary meeting on 26th July 1991, entitled:
Combating aridity, soil erosion, salinity, water-logging, desertification and the effects of drought in South Asia.
This begins by recalling a General Assembly resolution of 1989 which stressed the imperative need to address the problem ofdesertification. It notes that South Asia is one of the most populous regions of the world, and that it contains significant areas subjectto soil erosion, salinity and other kind of degradation, "which affect the rives of millions of peoples and the entire environment of theregion".
The Resolution then:
"Requests the Secretary-General, in close collaboration with the Executive Director of the United Nations EnvironmentProgramme... [and other organizations]...to undertake a study...to assess the extent of this problem and its effects on the peoples ofthe region, and to provide a framework for national and international cooperative efforts...to tackle this problem in its physical andhuman dimensions, and to submit the study to the Economic and Social Council in 1992."
Consultations were held between UNEP, UNDP, FAO and ESCAP¹, leading to the preparation of draft outline and work plan forthe study. This latter made clear that the focus was to be on the problem of land de gradation, and the human impacts on naturalresources which reduce their productive capacity.
FAO was selected as the Executing Agency. A Project Document was drawn up as Project Number RAS/92/560/A/01/12, with aduration of four months, entitled Study of land degradation in South Asia. This defines South Asia for the purpose of the study asincluding eight countries of the ESCAP region: Afghanistan, Bangladesh, Bhutan, India, Iran, Nepal, Pakistan, and Sri Lanka. Datawas to be made available from sources of UNDP, UNEP, FAO, ESCAP, the World Bank, UNCED, and by means of limited visitsto selected countries of the region. The project document further sets out the outputs and objectives.
Objectives
The immediate objective of the project is to undertake a comprehensive study on combating aridity, soil erosion, salinity,waterlogging, desertification and the effects of drought in South Asia, for submission to the Secretary General of the United Nationsin response to ECOSOC Resolution 1991/97.
The contents specified for the report constitute the objectives of the study. These are to review, analyse and summarize:
The statue of land degradation in South Asia.1.The causes of land degradation, and its effects on the people of the region.2.Existing institutions and current national and international cooperative programmes to combat land degradation.3.To suggest a framework for strengthening national and international cooperative efforts to tackle land degradation in itsphysical and human dimensions, at national, regional and international levers.
4.
In carrying out the study, an attempt has been made to give equal attention to the first two of these objectives: the statue, meaningthe nature, extent and severity, of land degradation; and its effects, social and economic, upon the people.
Constraints
Originated by: Agriculture and ConsumerProtection
Title: Land degradation in south Asia: Its severity, causes and effects upon the people... More details
Untitled Normal Page http://www.fao.org/docrep/V4360E/V4360E02.htm#Chapter%201%...
2 van 6 12/10/2007 15:14
The range of material to be covered is vast and the time available short, less than six person-months. It was therefore necessary tobase the study entirely on existing publications and reports, supplemented by discussions with staff members of national andinternational institutions.
Over 200 publications and reports based on the region were consulted. Two were of fundamental importance. Extensive use wasmade of a recent comprehensive and primary study, the Global assessment of land degradation (GLASOD) (Oldeman et al., 1990;UNEP, 1992a). Besides the published maps and data, the organizations responsible, UNEP and ISRIC, made available primary datafor the region. The second starting point was the report of the FAO/RAPA consultation, Environmental issues in land and waterdevelopment (FAO/RAPA, 1992). This includes a regional review (Dent, 1992) and country papers on Bangladesh, India, Nepal,Pakistan and Sri Lanka.
The study was based on the FAO Regional Office for Asia and the Pacific (RAPA), Bangkok. Time shortage and politicalconditions placed constraints on field visits. Short visits were made to five countries of the region: Bangladesh, India, Nepal,Pakistan and Sri Lanka, to conduct interviews with staff of organizations engaged in research into land degradation and efforts tocombat its effects. Discussions were also held with staff of the World Bank and the World Resources Institute, Washington DC.Publications were consulted in the FAO Library, Rome, and the FAO and United Nations Libraries, Bangkok.
It should be emphasized that the time and human resources available to carry out this study were extremely limited in comparisonwith the magnitude of the task to be carried out. Consequently, the results should be regarded as provisional and subject tomodification. A call for further and more detailed studies is made in the recommendations.
Background to the South Asia region
Land and population
Eight countries are included in the region (Figure 1):
Short title Full title
Afghanistan Democratic Republic of Afghanistan
Bangladesh People's Republic of Bangladesh
Bhutan Kingdom of Bhutan
India Republic of India
Iran Islamic Republic of Iran
Nepal Kingdom of Nepal
Pakistan Islamic Republic of Pakistan
Sri Lanka Democratic Socialist Republic of Sri Lanka
Throughout this study, these eight countries are called the South Asian region or, in short, the region.
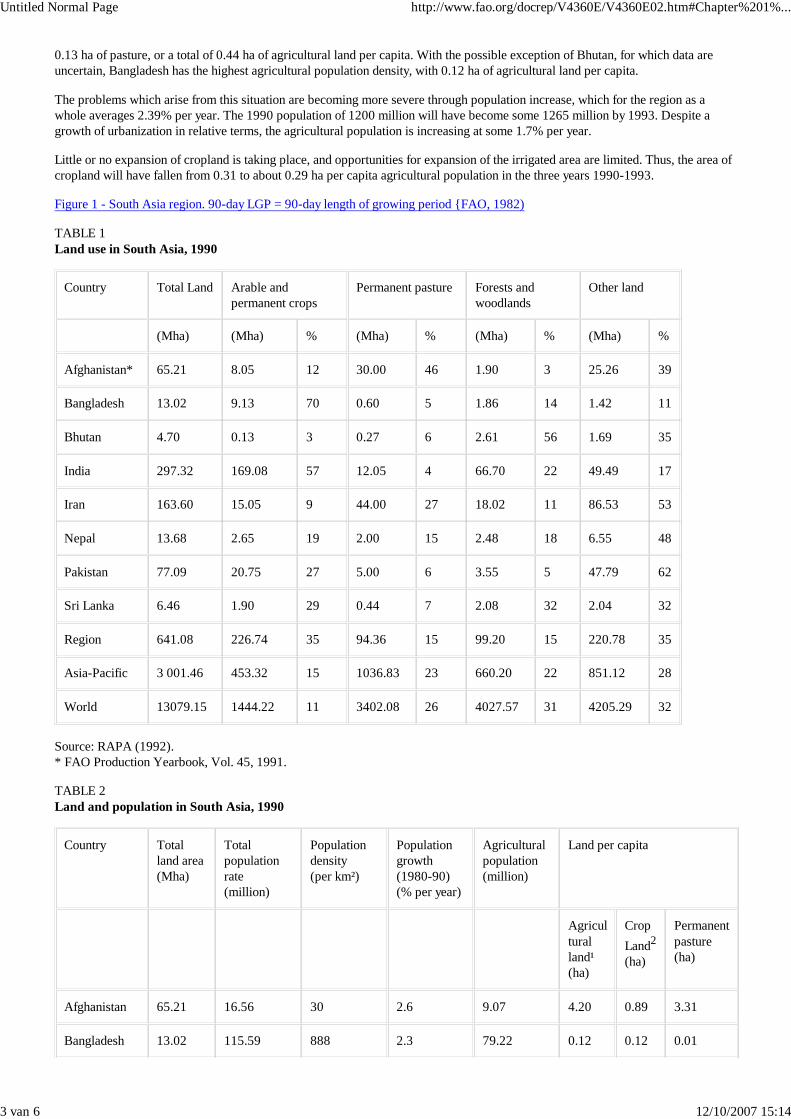
The region has a land area of 641 M ha and a population (1990) of 1200 million (Tables 1 and 2). The agricultural population is768 million, 61 % of the total. The area of cropland is 227 M ha, of pasture 94 M ha, and thus of cropland and pasture together,here called agricultural land, 321 M ha.
These bare statistics indicate three basic characteristics of the region: the large total population, high density in relation to landresources, and large proportion of total land under agricultural use. Over 22% of the world's agricultural population live on justunder 5% of its land area; whilst almost exactly 50% of the total land is under agricultural use, a far higher proportion than for theworld as a whole.
India has 46% of the land area of the region but 71% of its population. Iran is the next largest country in terms of area, but Pakistanand Bangladesh have the second and third largest populations.
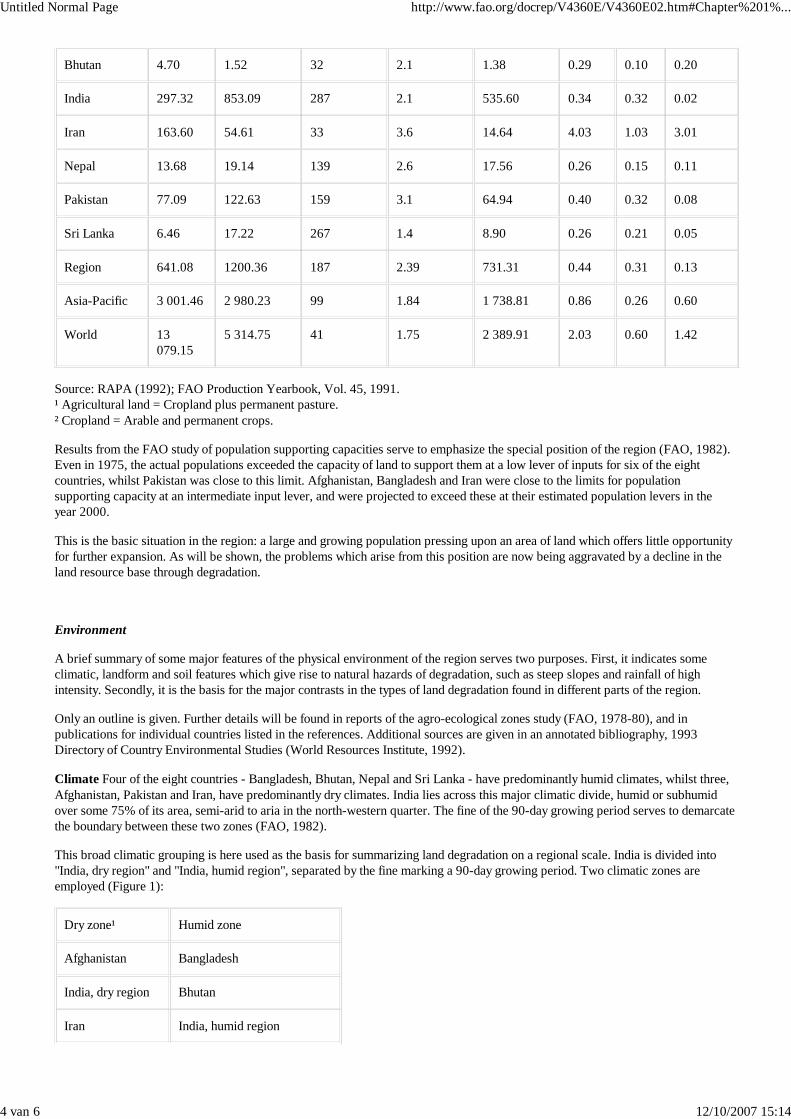
These high agricultural population densities result in low availability of land. On average, there are 0.31 ha of cropland per capita,
Untitled Normal Page http://www.fao.org/docrep/V4360E/V4360E02.htm#Chapter%201%...
3 van 6 12/10/2007 15:14
0.13 ha of pasture, or a total of 0.44 ha of agricultural land per capita. With the possible exception of Bhutan, for which data areuncertain, Bangladesh has the highest agricultural population density, with 0.12 ha of agricultural land per capita.
The problems which arise from this situation are becoming more severe through population increase, which for the region as awhole averages 2.39% per year. The 1990 population of 1200 million will have become some 1265 million by 1993. Despite agrowth of urbanization in relative terms, the agricultural population is increasing at some 1.7% per year.
Little or no expansion of cropland is taking place, and opportunities for expansion of the irrigated area are limited. Thus, the area ofcropland will have fallen from 0.31 to about 0.29 ha per capita agricultural population in the three years 1990-1993.
Figure 1 - South Asia region. 90-day LGP = 90-day length of growing period {FAO, 1982)
TABLE 1 Land use in South Asia, 1990
Country Total Land Arable andpermanent crops
Permanent pasture Forests andwoodlands
Other land
(Mha) (Mha) % (Mha) % (Mha) % (Mha) %
Afghanistan* 65.21 8.05 12 30.00 46 1.90 3 25.26 39
Bangladesh 13.02 9.13 70 0.60 5 1.86 14 1.42 11
Bhutan 4.70 0.13 3 0.27 6 2.61 56 1.69 35
India 297.32 169.08 57 12.05 4 66.70 22 49.49 17
Iran 163.60 15.05 9 44.00 27 18.02 11 86.53 53
Nepal 13.68 2.65 19 2.00 15 2.48 18 6.55 48
Pakistan 77.09 20.75 27 5.00 6 3.55 5 47.79 62
Sri Lanka 6.46 1.90 29 0.44 7 2.08 32 2.04 32
Region 641.08 226.74 35 94.36 15 99.20 15 220.78 35
Asia-Pacific 3 001.46 453.32 15 1036.83 23 660.20 22 851.12 28
World 13079.15 1444.22 11 3402.08 26 4027.57 31 4205.29 32
Source: RAPA (1992).* FAO Production Yearbook, Vol. 45, 1991.
TABLE 2Land and population in South Asia, 1990
Country Total land area(Mha)
Totalpopulationrate(million)
Populationdensity(per km²)
Populationgrowth (1980-90) (% per year)
Agriculturalpopulation (million)
Land per capita
Agriculturalland¹(ha)
Crop
Land2
(ha)
Permanentpasture(ha)
Afghanistan 65.21 16.56 30 2.6 9.07 4.20 0.89 3.31
Bangladesh 13.02 115.59 888 2.3 79.22 0.12 0.12 0.01
Untitled Normal Page http://www.fao.org/docrep/V4360E/V4360E02.htm#Chapter%201%...
4 van 6 12/10/2007 15:14
Bhutan 4.70 1.52 32 2.1 1.38 0.29 0.10 0.20
India 297.32 853.09 287 2.1 535.60 0.34 0.32 0.02
Iran 163.60 54.61 33 3.6 14.64 4.03 1.03 3.01
Nepal 13.68 19.14 139 2.6 17.56 0.26 0.15 0.11
Pakistan 77.09 122.63 159 3.1 64.94 0.40 0.32 0.08
Sri Lanka 6.46 17.22 267 1.4 8.90 0.26 0.21 0.05
Region 641.08 1200.36 187 2.39 731.31 0.44 0.31 0.13
Asia-Pacific 3 001.46 2 980.23 99 1.84 1 738.81 0.86 0.26 0.60
World 13 079.15
5 314.75 41 1.75 2 389.91 2.03 0.60 1.42
Source: RAPA (1992); FAO Production Yearbook, Vol. 45, 1991.¹ Agricultural land = Cropland plus permanent pasture.² Cropland = Arable and permanent crops.
Results from the FAO study of population supporting capacities serve to emphasize the special position of the region (FAO, 1982).Even in 1975, the actual populations exceeded the capacity of land to support them at a low lever of inputs for six of the eightcountries, whilst Pakistan was close to this limit. Afghanistan, Bangladesh and Iran were close to the limits for populationsupporting capacity at an intermediate input lever, and were projected to exceed these at their estimated population levers in theyear 2000.
This is the basic situation in the region: a large and growing population pressing upon an area of land which offers little opportunityfor further expansion. As will be shown, the problems which arise from this position are now being aggravated by a decline in theland resource base through degradation.
Environment
A brief summary of some major features of the physical environment of the region serves two purposes. First, it indicates someclimatic, landform and soil features which give rise to natural hazards of degradation, such as steep slopes and rainfall of highintensity. Secondly, it is the basis for the major contrasts in the types of land degradation found in different parts of the region.
Only an outline is given. Further details will be found in reports of the agro-ecological zones study (FAO, 1978-80), and inpublications for individual countries listed in the references. Additional sources are given in an annotated bibliography, 1993Directory of Country Environmental Studies (World Resources Institute, 1992).
Climate Four of the eight countries - Bangladesh, Bhutan, Nepal and Sri Lanka - have predominantly humid climates, whilst three,Afghanistan, Pakistan and Iran, have predominantly dry climates. India lies across this major climatic divide, humid or subhumidover some 75% of its area, semi-arid to aria in the north-western quarter. The fine of the 90-day growing period serves to demarcatethe boundary between these two zones (FAO, 1982).
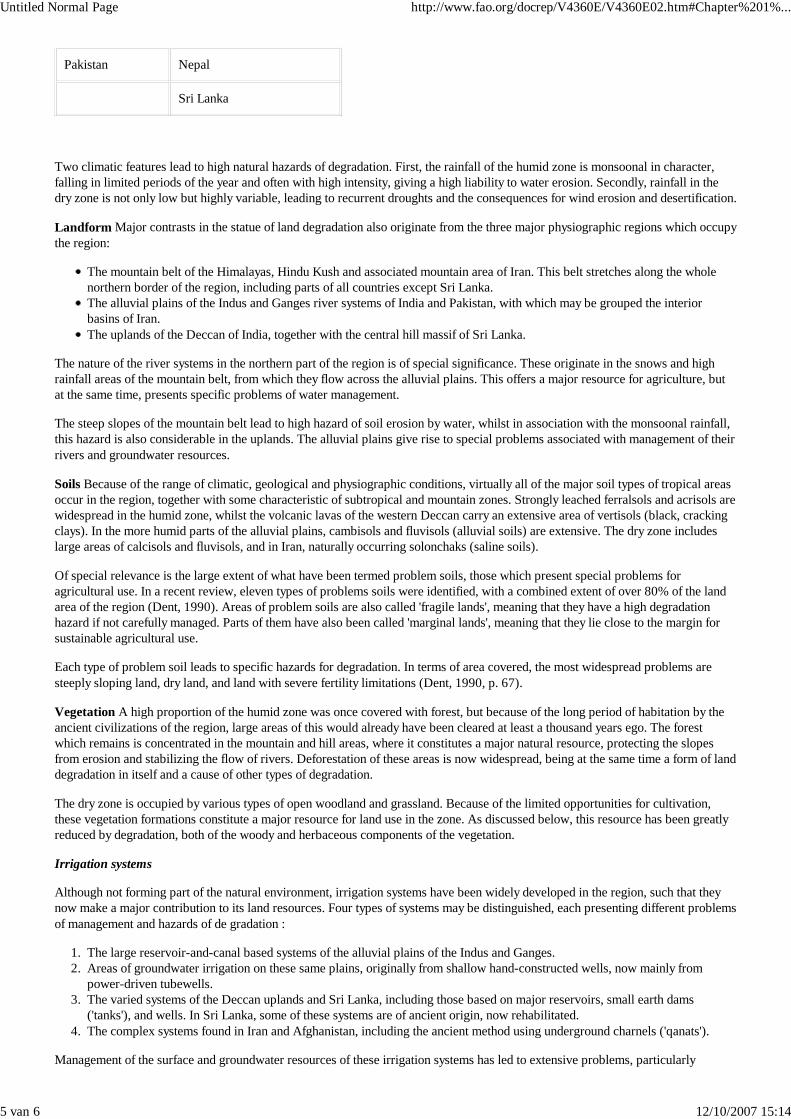
This broad climatic grouping is here used as the basis for summarizing land degradation on a regional scale. India is divided into"India, dry region" and "India, humid region", separated by the fine marking a 90-day growing period. Two climatic zones areemployed (Figure 1):
Dry zone¹ Humid zone
Afghanistan Bangladesh
India, dry region Bhutan
Iran India, humid region
Untitled Normal Page http://www.fao.org/docrep/V4360E/V4360E02.htm#Chapter%201%...
5 van 6 12/10/2007 15:14
Pakistan Nepal
Sri Lanka
Two climatic features lead to high natural hazards of degradation. First, the rainfall of the humid zone is monsoonal in character,falling in limited periods of the year and often with high intensity, giving a high liability to water erosion. Secondly, rainfall in thedry zone is not only low but highly variable, leading to recurrent droughts and the consequences for wind erosion and desertification.
Landform Major contrasts in the statue of land degradation also originate from the three major physiographic regions which occupythe region:
The mountain belt of the Himalayas, Hindu Kush and associated mountain area of Iran. This belt stretches along the wholenorthern border of the region, including parts of all countries except Sri Lanka.The alluvial plains of the Indus and Ganges river systems of India and Pakistan, with which may be grouped the interiorbasins of Iran.The uplands of the Deccan of India, together with the central hill massif of Sri Lanka.
The nature of the river systems in the northern part of the region is of special significance. These originate in the snows and highrainfall areas of the mountain belt, from which they flow across the alluvial plains. This offers a major resource for agriculture, butat the same time, presents specific problems of water management.
The steep slopes of the mountain belt lead to high hazard of soil erosion by water, whilst in association with the monsoonal rainfall,this hazard is also considerable in the uplands. The alluvial plains give rise to special problems associated with management of theirrivers and groundwater resources.
Soils Because of the range of climatic, geological and physiographic conditions, virtually all of the major soil types of tropical areasoccur in the region, together with some characteristic of subtropical and mountain zones. Strongly leached ferralsols and acrisols arewidespread in the humid zone, whilst the volcanic lavas of the western Deccan carry an extensive area of vertisols (black, crackingclays). In the more humid parts of the alluvial plains, cambisols and fluvisols (alluvial soils) are extensive. The dry zone includeslarge areas of calcisols and fluvisols, and in Iran, naturally occurring solonchaks (saline soils).
Of special relevance is the large extent of what have been termed problem soils, those which present special problems foragricultural use. In a recent review, eleven types of problems soils were identified, with a combined extent of over 80% of the landarea of the region (Dent, 1990). Areas of problem soils are also called 'fragile lands', meaning that they have a high degradationhazard if not carefully managed. Parts of them have also been called 'marginal lands', meaning that they lie close to the margin forsustainable agricultural use.
Each type of problem soil leads to specific hazards for degradation. In terms of area covered, the most widespread problems aresteeply sloping land, dry land, and land with severe fertility limitations (Dent, 1990, p. 67).
Vegetation A high proportion of the humid zone was once covered with forest, but because of the long period of habitation by theancient civilizations of the region, large areas of this would already have been cleared at least a thousand years ego. The forestwhich remains is concentrated in the mountain and hill areas, where it constitutes a major natural resource, protecting the slopesfrom erosion and stabilizing the flow of rivers. Deforestation of these areas is now widespread, being at the same time a form of landdegradation in itself and a cause of other types of degradation.
The dry zone is occupied by various types of open woodland and grassland. Because of the limited opportunities for cultivation,these vegetation formations constitute a major resource for land use in the zone. As discussed below, this resource has been greatlyreduced by degradation, both of the woody and herbaceous components of the vegetation.
Irrigation systems
Although not forming part of the natural environment, irrigation systems have been widely developed in the region, such that theynow make a major contribution to its land resources. Four types of systems may be distinguished, each presenting different problemsof management and hazards of de gradation :
The large reservoir-and-canal based systems of the alluvial plains of the Indus and Ganges.1.Areas of groundwater irrigation on these same plains, originally from shallow hand-constructed wells, now mainly frompower-driven tubewells.
2.
The varied systems of the Deccan uplands and Sri Lanka, including those based on major reservoirs, small earth dams('tanks'), and wells. In Sri Lanka, some of these systems are of ancient origin, now rehabilitated.
3.
The complex systems found in Iran and Afghanistan, including the ancient method using underground charnels ('qanats').4.
Management of the surface and groundwater resources of these irrigation systems has led to extensive problems, particularly
Untitled Normal Page http://www.fao.org/docrep/V4360E/V4360E02.htm#Chapter%201%...
6 van 6 12/10/2007 15:14
waterlogging and salinization.
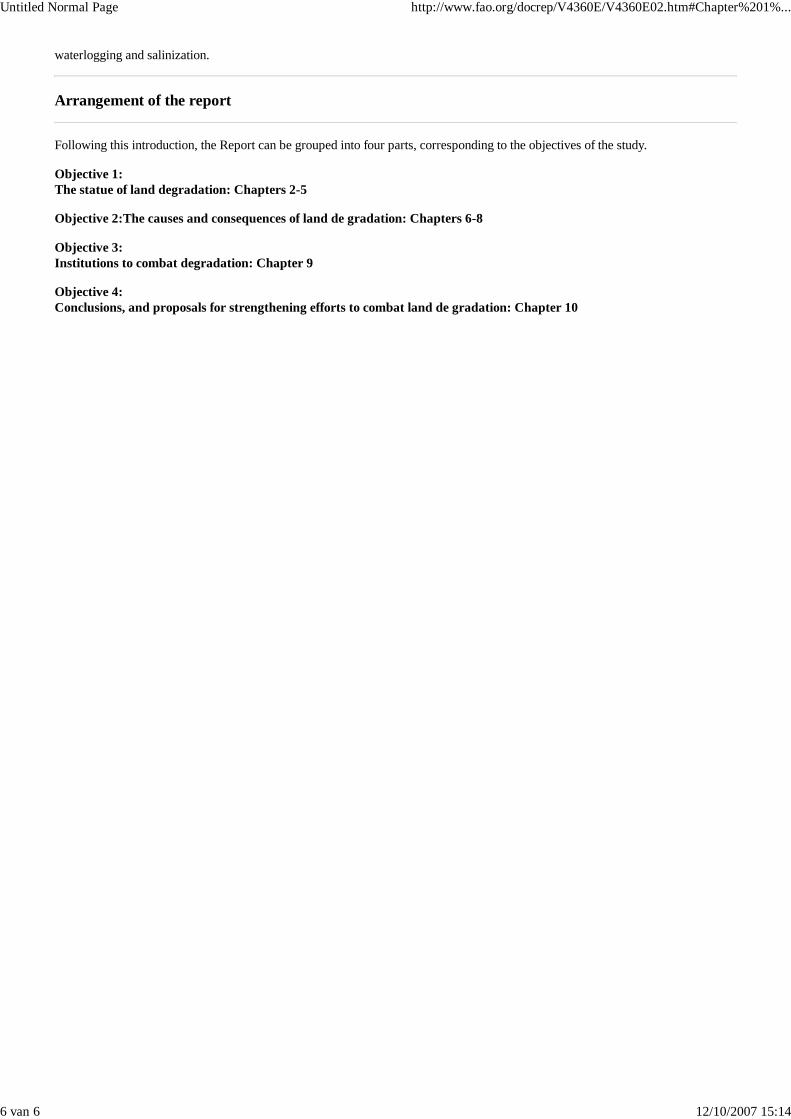
Arrangement of the report
Following this introduction, the Report can be grouped into four parts, corresponding to the objectives of the study.
Objective 1:The statue of land degradation: Chapters 2-5
Objective 2:The causes and consequences of land de gradation: Chapters 6-8
Objective 3:Institutions to combat degradation: Chapter 9
Objective 4:Conclusions, and proposals for strengthening efforts to combat land de gradation: Chapter 10
Untitled Normal Page http://www.fao.org/docrep/V4360E/V4360E03.htm#Chapter%202%...
1 van 4 12/10/2007 15:14
Chapter 2 - Types of land degradation
Back to contents - Previous file - Next file
DefinitionsTypes of land degradation assessedOther types of degradation includedTypes of degradation excluded from the studyProblems of the natural environmentReversible degradation and land reclamation
Definitions
The term land, as employed in land evaluation, land use planning, etc., has a wider meaning than just soil.It refers to all natural resources which contribute to agricultural production, including livestock productionand forestry. Land thus covers climate and water resources, landform, soils and vegetation, including bothgrassland resources and forests (FAO, 1976; UNEP, 1992b).
Land degradation is the temporary or permanent lowering of the productive capacity of land (UNEP,1992b). It thus covers the various forms of soil degradation, adverse human impacts on water resources,deforestation, and lowering of the productive capacity of rangelands.
This study takes the degradation of soil resources as its focus. This includes soil erosion by water andwind, deterioration in soil physical, chemical and biological properties, waterlogging, and the build-up oftoxicities, particularly salts, in the soil. Since soil productivity is intimately connected with wateravailability, lowering of the groundwater table is also noted. Since deforestation is being treated in detail ina current FAO study, it is here considered primarily as a cause of soil degradation, particularly erosion.
Land degradation has both on-site and off-site effects. On-site effects are the lowering of the productivecapacity of the land, causing either reduced outputs (crop yields, livestock yields) or the need for increasedinputs. Off-site effects of water erosion occur through changes in the water regime, including decline inriver water quality, and sedimentation of river beds and reservoirs. The main off-site effect of wind erosionis overblowing, or sand deposition.
Desertification The term desertification originated with a specific meaning, as for exemple in the 1977World map of desertification (UNEP, 1977). It was subsequently widely used and misused in a broadersense. These wider meanings have sometimes been extended to almost all forms of land degradation, forexemple soil erosion in the humid tropics (Young, 1985). The recent World atlas of desertification (UNEP,1992a) includes all the six groups of land degradation covered in the present study thus implicitly, from itstitle, using the term in the broader sense.
Following agreement at a recent UNEP conference, the term has been defined with a more restrictedmeaning:
Desertification is land degradation in aria, semi-arid and dry subhumid areas resulting from adverse human
Originated by: Agriculture and ConsumerProtection
Title: Land degradation in south Asia: Its severity, causes and effects upon the people... More details
Untitled Normal Page http://www.fao.org/docrep/V4360E/V4360E03.htm#Chapter%202%...
2 van 4 12/10/2007 15:14
impact (UNEP, 1992b).
This is the meaning in which the term is employed in the ESCAP network on desertification (ESCAP,1983, 1991b). In this study, therefore, desertification is equivalent to land degradation in the dry zone, andneed not be separately assessed as a type of degradation.
Types of land degradation assessed
For the purpose of this study, the many and varied processes of land degradation have been grouped intosix classes: water erosion, wind erosion, soil fertility decline, salinization, waterlogging, and lowering ofthe water table.
Water erosion covers all forms of soil erosion by water, including sheet and rill erosion and gullying.Human-induced intensification of landsliding, caused by vegetation clearance, road construction, etc., isalso included.
Wind erosion refers to loss of soil by wind, occurring primarily in dry regions.
Soil fertility decline is used as a short term to refer to what is more precisely described as deterioration insoil physical, chemical and biological properties. Whilst decline in fertility is indeed a major effect oferosion, the term is used here of cover effects of processes other than erosion. The main processesinvolved are:
lowering of soil organic master, with associated decline in soil biological activity;degradation of soil physical properties (structure, aeration, water holding capacity), as brought aboutby reduced organic master;adverse changes in soil nutrient resources, including reduction in availability of the major nutrients(nitrogen, phosphorus, potassium), onset of micronutrient deficiencies, and development of nutrientimbalances.buildup of toxicities, primarily acidification through incorrect fertilizer use.
Waterlogging is the lowering in land productivity through the rise in groundwater close to the soil surface.Also included under this heading is the severe form, termed ponding, where the water table rises above thesurface. Waterlogging is linked with salinization, both being brought about by incorrect irrigationmanagement.
Salinization is used in its broad sense, to refer to all types of soil degradation brought about by theincrease of salts in the soil. It thus covers both salinization in its strict sense, the buildup of free salts; andcodification (also called alkalization), the development of dominance of the exchange complex by sodium.As human-induced processes, these occur mainly through incorrect planning and management of irrigationschemes. Also covered is saline intrusion, the incursion of sea water into coastal soils arising fromover-abstraction of groundwater.
Lowering of the water table is a self-explanatory form of land degradation, brought about throughtubewell pumping of groundwater for irrigation exceeding the natural recharge capacity. This occurs inareas of non-saline ('sweet') groundwater. Pumping for urban and industrial use is a further cause.
Other types of degradation included
Untitled Normal Page http://www.fao.org/docrep/V4360E/V4360E03.htm#Chapter%202%...
3 van 4 12/10/2007 15:14
Other types of land degradation are treated briefly, treated as causes, or excluded from this review. This isbecause they are localized or of small extent on a regional scale, or because they are more fully treatedelsewhere.
Four further classes are recognized as types of land degradation, and as having considerable importance inthe region. One case, deforestation, has been treated by reference to an external review. The two othertypes are considered in more generalized terms.
Deforestation The occurrence of deforestation is widespread and extremely serious in the region. It is notindependently assessed here, in view of more detailed treatment in the current FAO Forest resourcesassessment 1990 project. Deforestation is also discussed as a cause of erosion.
Forest degradation This is the reduction of biotic resources and lowering of productive capacity offorests through human activities. It is under review in a current survey (Banerjee and Grimes, inpreparation).
Rangeland degradation This is the lowering of the productive capacity of rangelands. It is considered ingeneralized terms, but no quantitative data have been identified.
Types of degradation excluded from the study
Other types of degradation are excluded from this study, either because they are of small extent on aregional scale, or they are more fully treated elsewhere. These are:
Acid sulphate formation, a serious but localized form of degradation, which may occur on drainageof coastal swamps.Soil pollution, from industrial or mining effluents, to the atmosphere, rivers or groundwater. This isan important concern in the region, but is strongly localized.Soil destruction through mining and quarrying activities, the failure to restore soil afterextraction. The same remarks apply as for soil pollution.Urban and industrial encroachment onto agricultural land. With the projected increase inurbanization, this will continue to be a substantial cause of loss of agricultural land, but it is adifferent problem from land degradation.Effects of war. Land degradation on a substantial scale through effects of war has been reportedfrom Iran (western borderlands) and Afghanistan, in the latter case including the destruction ofirrigation schemes.Potential effects of global climatic change. It is beyond question that the composition of theworld's atmosphere is being substantially altered as a result of human activities. A small butsignificant global warming has already been observed and is projected to continue. It is possible thatthis may lead to modifications to the general atmospheric circulation with consequent changes inrainfall.
These changes could be beneficial or adverse to land productivity or human welfare: specifically, insemi-arid regions, rainfall might become higher or longer, more reliable or less, or with longer or higherincidence of droughts. There is, however, no firm evidence of what such changes may tee.
If adverse changes occur in some areas, then these will certainly constitute a most serious form ofhuman-induced degradation of natural resources. It is accepted that, for a range of reasons, action shouldbe taken to reduce emissions of 'greenhouse gases'. However, until there is clearer evidence, its potentialeffects upon climate must remain a master of research, and these will not be further considered.

Untitled Normal Page http://www.fao.org/docrep/V4360E/V4360E03.htm#Chapter%202%...
4 van 4 12/10/2007 15:14
Problems of the natural environment
Aridity and drought 'Aridity' and 'drought' are referred to in the ECOSOC resolution on which this studyis based. These, however, are problems of the natural environment in semi-arid and aria areas. In thesubsequent amplifications of the terms of reference it is clear that degradation, namely human-inducedadverse environmental changes, is the intended focus. Therefore aridity and drought would only properlybe included if it could be shown that rainfall had been reduced, or drought spells made more frequent, as aresult of man's activities. This has not been established.
Problem soils. Soils which present special difficulties for agriculture may be called problem soils. Theyinclude saline soils, sandy soils, cracking clays, strongly acid soils, shallow soils, and soils on steeplysloping or poorly drained land. A comprehensive review for Asia and the Pacific is given in FAO/RAPA(1990) and a map of problem soils is in preparation.
To the extent that these are problems of the natural environment, problem soils do not constitute landdegradation. However, land degradation frequently leads to an increase in the extent or severity of problemsoils, for example, erosion causes shallow soils. A clear case is that of saline soils: these occur naturally, inwhich case they are problem soils, but their extent has been greatly increased by human-inducedsalinization.
Reversible degradation and land reclamation
The effects of water and wind erosion are largely irreversible. Although plant nutrients and soil organicmaster may be replaced, to replace the actual loss of soil material would require taking the soil out of usefor many thousands of years, an impractical course of action.
In other cases, land degradation is reversible: soils with reduced organic master can be restored byadditions of plant residues, degraded pastures may recover under improved range management. Salinizedsoils can be restored to productive use, although at a high cost, through salinity control and reclamationprojects.
Land reclamation frequently requires inputs which are costly, labour-demanding or both. The reclamationprojects in salinized and waterlogged irrigated areas demonstrate this fact clearly. In other cases, the landcan only be restored by taking it out of productive use for some years, as in reclamation forestry. The costof reclamation, or restoration to productive use, of degraded soils is invariably less than the cost ofpreventing degradation before it occurs.
Untitled Normal Page http://www.fao.org/docrep/V4360E/V4360E04.htm#Chapter%203%...
1 van 5 12/10/2007 15:15
Chapter 3 - Sources of data
Back to contents - Previous file - Next file
Global assessment of soil degradation (GLASOD)Other sources of dataVariations in data and the need for definition of degrees of severity
Global assessment of soil degradation (GLASOD)
Under an international project, Global assessment of soil degradation (GLASOD), an attempt has beenmade for the first time to map the severity of degradation on a world scale, as the World map of the statue ofhuman-induced soil degradation (Oldeman et al., 1990). The scale at the Equator is 1:15 000 000, becoming1:13 000 000 at 30° latitude. The project was conducted by the International Soils Research andInformation Centre (ISRIC) under the aegis of UNEP.
A standardized methodology, including definitions, was developed through international consultation. Datafor individual countries was provided by the leading experts available, moderated by ISRIC with the aim ofstandardization. The GLASOD assessment (as it will be called) includes all the types of land degradationcovered in the present study, somewhat differently subdivided but in ways that are compatible with theclassification adopted here. This lest feature is of the highest value for filling what would otherwise be gapsin data from other sources.
At the same time, the authors of GLASOD acknowledge that there are certainly deficiencies in this firstoutput, and that the World Map should be regarded as a first approximation. For some countries of SouthAsia, there exist other estimates, mainly governmental, of the extent of degradation, derived by somewhatdifferent means. This range of sources provides the opportunity to compare data with the objectives first, ofseeing how consistent these are, and secondly, to obtain best estimates.
For these reasons, it was decided in the present study:
To take the GLASOD classification of types of degradation as the basis for development of that usedhere, which is simplified and partly regrouped. The equivalence between GLASOD types and thoseof the present survey is given in Table 3.
1.
To adopt the GLASOD definitions for degrees of severity of degradation (see below).2.To treat the GLASOD assessments of the extent of degradation as a starting point or standard, againstwhich other estimates can be compared; but not necessarily to adopt them as the best estimates whereevidence suggests otherwise.
3.
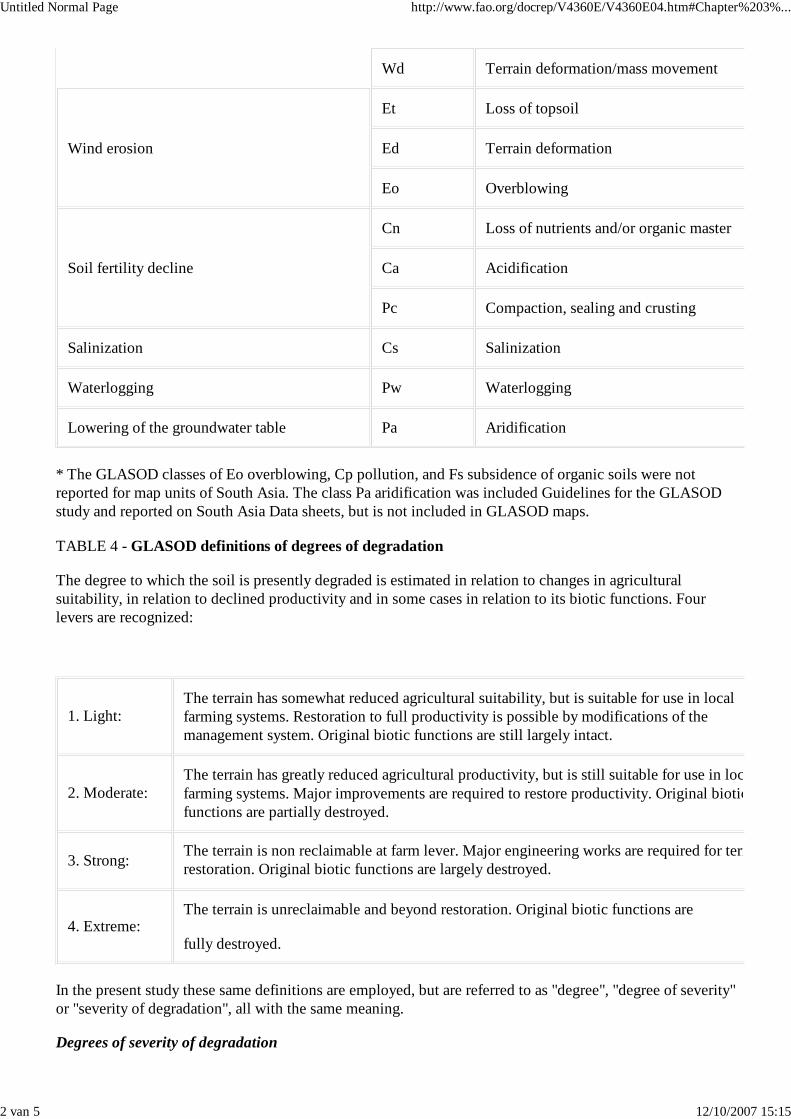
TABLE 3 - Correspondence between GLASOD types of degradation and those of the present study
Originated by: Agriculture and ConsumerProtection
Title: Land degradation in south Asia: Its severity, causes and effects upon the people... More details
Untitled Normal Page http://www.fao.org/docrep/V4360E/V4360E04.htm#Chapter%203%...
2 van 5 12/10/2007 15:15
Wd Terrain deformation/mass movement
Wind erosion
Et Loss of topsoil
Ed Terrain deformation
Eo Overblowing
Soil fertility decline
Cn Loss of nutrients and/or organic master
Ca Acidification
Pc Compaction, sealing and crusting
Salinization Cs Salinization
Waterlogging Pw Waterlogging
Lowering of the groundwater table Pa Aridification
* The GLASOD classes of Eo overblowing, Cp pollution, and Fs subsidence of organic soils were notreported for map units of South Asia. The class Pa aridification was included Guidelines for the GLASODstudy and reported on South Asia Data sheets, but is not included in GLASOD maps.
TABLE 4 - GLASOD definitions of degrees of degradation
The degree to which the soil is presently degraded is estimated in relation to changes in agriculturalsuitability, in relation to declined productivity and in some cases in relation to its biotic functions. Fourlevers are recognized:
1. Light:The terrain has somewhat reduced agricultural suitability, but is suitable for use in localfarming systems. Restoration to full productivity is possible by modifications of themanagement system. Original biotic functions are still largely intact.
2. Moderate:The terrain has greatly reduced agricultural productivity, but is still suitable for use in localfarming systems. Major improvements are required to restore productivity. Original bioticfunctions are partially destroyed.
3. Strong:The terrain is non reclaimable at farm lever. Major engineering works are required for terrainrestoration. Original biotic functions are largely destroyed.
4. Extreme:The terrain is unreclaimable and beyond restoration. Original biotic functions are
fully destroyed.
In the present study these same definitions are employed, but are referred to as "degree", "degree of severity"or "severity of degradation", all with the same meaning.
Degrees of severity of degradation
Untitled Normal Page http://www.fao.org/docrep/V4360E/V4360E04.htm#Chapter%203%...
3 van 5 12/10/2007 15:15
As will be made clear in later discussion, the definition of the degree, or severity, of degradation is of thehighest importance. The definitions used in the present study are the same as those of degrees ofdegradation in GLASOD. In the present state of knowledge they are necessarily nonquantitative, althoughthey contain guidelines for quantification.
In view of the importance of these definitions, they are given in full in Table 4. In abbreviated form thedegrees of degradation are:
Light: somewhat reduced agricultural productivity. Moderate: greatly reduced agricultural productivity. Strong: unreclaimable at farm lever. Extreme: unreclaimable and impossible to restore (with present technology).
The class 'Extreme' was not reported for any map unit in South Asia (one data sheet contained it originally,reduced on moderation to 'Strong').
In terms of their effects, the farmer is still using land with light and moderate degrees of degradation, butthe boundary with strong degradation is the point at which land use has to be abandoned. Light degradationmay not be clearly visible, but the farmer knows that yields (or other production) are longer than they mightotherwise have been, or that additional inputs are necessary. Moderate degradation will often be visiblyapparent, including stunted crops or sparsely vegetated rangeland, and yields are clearly and substantiallylonger. By definition, strong degradation means that the land has been abandoned , and no longer haspotential for production.
Data for South Asia
For reason of cartographic necessity, the GLASOD World Map shows only the dominant form ofdegradation (as severity times extent) as coloured mapped areas, with the secondary form shown in the mapsymbol. Where, as happened widely, three or more forms of degradation were reported for the same mapunit, only the first two appear on the map. This results in gaps when an attempt is made to abstract one formof degradation, say wind erosion, for all areas. This situation has recently been improved by the printing ofmaps of individual kinds of degradation, at a smaller scale, in the World atlas of desertification (UNEP,1992a).
As part of the collaborative input to the present project, however, the complete original data sheets weremade available, together with associated country maps and correspondence. These contain substantiallymore information than the published maps. Each data sheet (known as matrix tables) refers to a delineatedmap unit. For the unit, it gives:
background information: physiography, soils, geology, climate, population, land use, vegetation;area of the map unit (square kilometres);a list of all types of land degradation identified, giving for each its type, degree (severity), extent (aspercentage of the map unit affected), present rate, and principal causes;remarks, on each type and on the unit as whole.
Data on extent are given as five classes on a quasi-geometric scale, with bounds of S. 10, 25 and 50%. Forthe present study these were converted to a central value (using the geometric mean) and multiplied by thearea of the unit to give a best estimate of the area affected by the type of degradation.
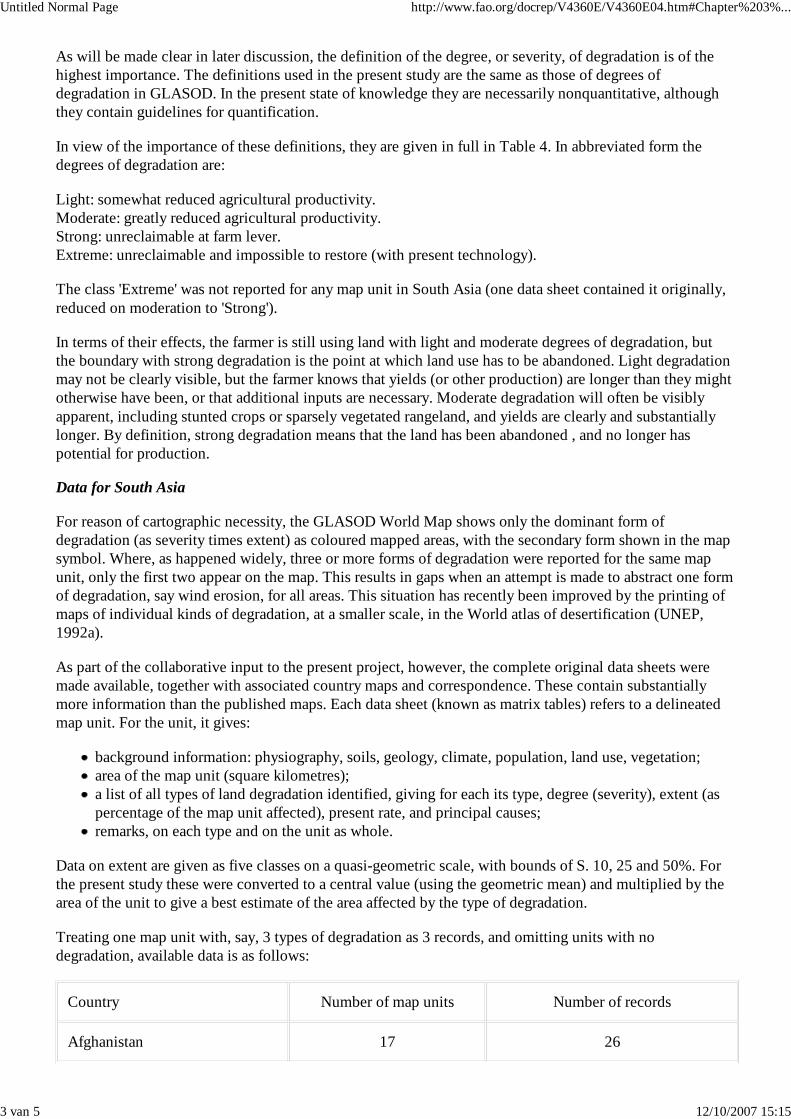
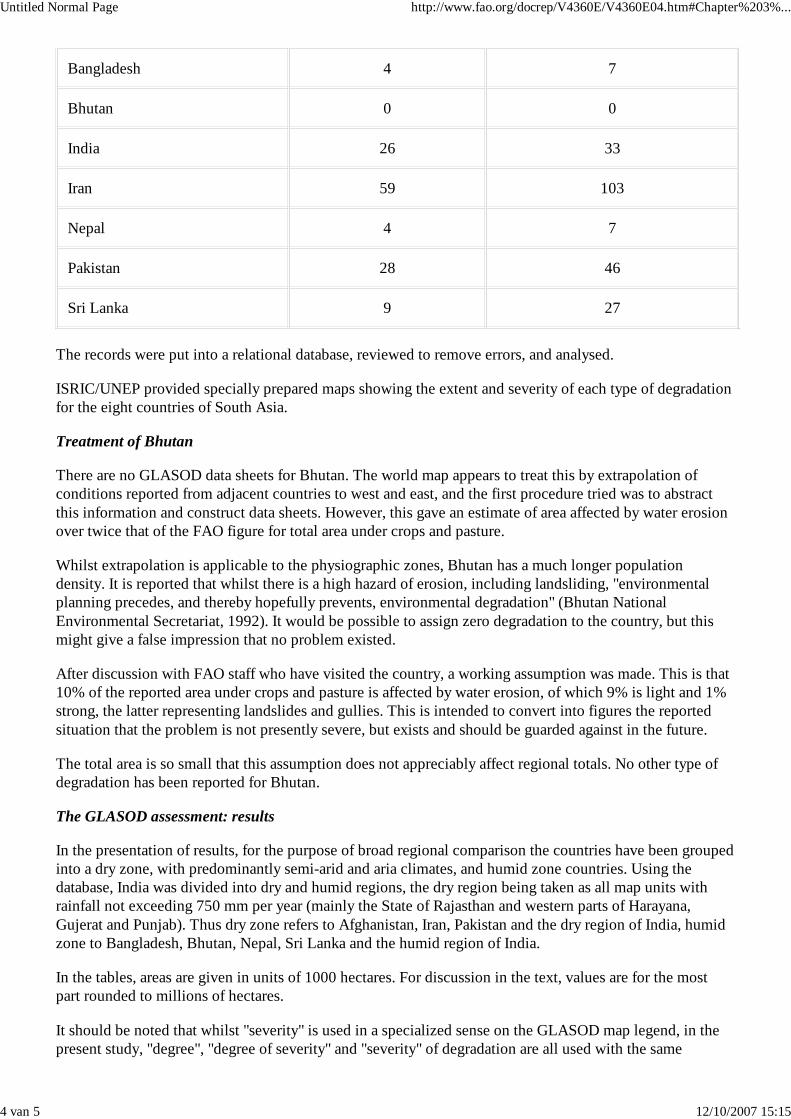
Treating one map unit with, say, 3 types of degradation as 3 records, and omitting units with nodegradation, available data is as follows:
Country Number of map units Number of records
Afghanistan 17 26
Untitled Normal Page http://www.fao.org/docrep/V4360E/V4360E04.htm#Chapter%203%...
4 van 5 12/10/2007 15:15
Bangladesh 4 7
Bhutan 0 0
India 26 33
Iran 59 103
Nepal 4 7
Pakistan 28 46
Sri Lanka 9 27
The records were put into a relational database, reviewed to remove errors, and analysed.
ISRIC/UNEP provided specially prepared maps showing the extent and severity of each type of degradationfor the eight countries of South Asia.
Treatment of Bhutan
There are no GLASOD data sheets for Bhutan. The world map appears to treat this by extrapolation ofconditions reported from adjacent countries to west and east, and the first procedure tried was to abstractthis information and construct data sheets. However, this gave an estimate of area affected by water erosionover twice that of the FAO figure for total area under crops and pasture.
Whilst extrapolation is applicable to the physiographic zones, Bhutan has a much longer populationdensity. It is reported that whilst there is a high hazard of erosion, including landsliding, "environmentalplanning precedes, and thereby hopefully prevents, environmental degradation" (Bhutan NationalEnvironmental Secretariat, 1992). It would be possible to assign zero degradation to the country, but thismight give a false impression that no problem existed.
After discussion with FAO staff who have visited the country, a working assumption was made. This is that10% of the reported area under crops and pasture is affected by water erosion, of which 9% is light and 1%strong, the latter representing landslides and gullies. This is intended to convert into figures the reportedsituation that the problem is not presently severe, but exists and should be guarded against in the future.
The total area is so small that this assumption does not appreciably affect regional totals. No other type ofdegradation has been reported for Bhutan.
The GLASOD assessment: results
In the presentation of results, for the purpose of broad regional comparison the countries have been groupedinto a dry zone, with predominantly semi-arid and aria climates, and humid zone countries. Using thedatabase, India was divided into dry and humid regions, the dry region being taken as all map units withrainfall not exceeding 750 mm per year (mainly the State of Rajasthan and western parts of Harayana,Gujerat and Punjab). Thus dry zone refers to Afghanistan, Iran, Pakistan and the dry region of India, humidzone to Bangladesh, Bhutan, Nepal, Sri Lanka and the humid region of India.
In the tables, areas are given in units of 1000 hectares. For discussion in the text, values are for the mostpart rounded to millions of hectares.
It should be noted that whilst "severity" is used in a specialized sense on the GLASOD map legend, in thepresent study, "degree", "degree of severity" and "severity" of degradation are all used with the same
Untitled Normal Page http://www.fao.org/docrep/V4360E/V4360E04.htm#Chapter%203%...
5 van 5 12/10/2007 15:15
meaning.
Other sources of data
The starting point for estimates of the type, severity and extent of degradation is the report of the regionalexpert consultation Environmental issues in land and water development (FAO/RAPA, 1992). This includesa regional overview, and country reports for Bangladesh, India, Nepal, Pakistan and Sri Lanka. Other recentreviews containing data for more than one type of degradation are FAO/RAPA (1990) and ESCAP (1990a).Data for Afghanistan and Bhutan are qualitative only, and were obtained mainly from the respectiveUNCED reports (Afghanistan, Ministry of Planning, 1992; Bhutan, National Environmental Secretariat,1992). Data sources for specific types of degradation are cited in context below. A valuable recent guide tosources of environrnental data is the annotated bibliography 1992 Directory of country environmentalstudies (World Resources Institute, 1992).
Most of these data ultimately derive from surveys or estimates by Government institutions: soil survey, soilconservation and irrigation management departments. Most of these estimates were initially obtained withcare and effort, either from surveys or by assembly of estimates submitted by state and district branches andofficers. They suffer, however, from a failure properly to define the degree of severity of the degradation forwhich an area is reported. As a consequence, different estimates may vary by a factor of two, or sometimesmore.
The same data may be copied many times. Secondary publications sometimes do not make clear theirsources (or even, in a few instances, units!). For all these other sources the data are highly non-uniform,both in availability and nature, as between the countries of the region.
For these reasons, the decision was made to take the GLASOD survey as a standard, which is thencompared with other estimates. Only where there appears to be clear evidence of a data bias in theGLASOD survey have its results been modified from other sources to obtain best estimates as used in thepresent study.
Variations in data and the need for definition of degrees of severity
A major finding of the present comparative review is that large variations exist between different estimatesof areas affected by degradation. A lack of surveys, and different methods used, is a contributory factor tothis problem. The major cause, however, is believed to be the lack of precision in defining what is beingsurveyed.
Untitled Normal Page http://www.fao.org/docrep/V4360E/V4360E05.htm#Chapter%204%...
1 van 8 12/10/2007 15:15
Chapter 4 - Status of degradation. I. Erosion and fertility decline
Back to contents - Previous file - Next file
Water erosionWind erosion Soil fertility decline
Water erosion
(Tables 5 and 6, Figures 2 and 3)
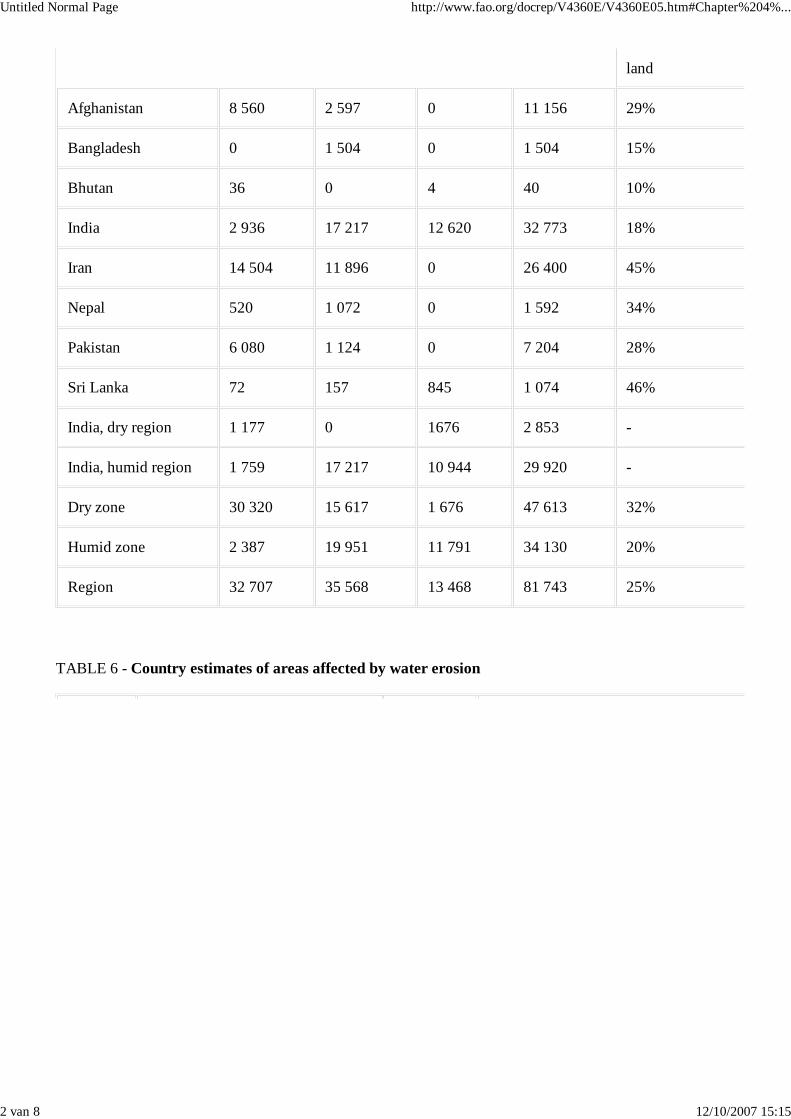
According to the GLASOD assessment, a total of 83 M ha is assessed as affected by water erosion in theregion, or 25 % of the total area under crops and pasture. This is made up of 33 M ha with light erosion, 36M ha moderate and 13 M ha strong erosion. The dry zone is most affected with 39% of the area under cropsand pasture, compared with 18% for the humid zone.
The countries most seriously affected are in absolute area India and Iran, and relative to crops and pasture,Iran, Sri Lanka and Nepal. Examples where erosion has reached the severe degree, leading to abandonmentof land, include parts of the hill areas of Sri Lanka (Stocking, 1992; Sri Lanka, Natural Resources, Energyand Science Authority, 1991, p.120), and the Pothwar Plateau of the Punjab region of Pakistan¹ (Nizami andShafiq, 1990). For current erosion under inappropriate land use, there are many estimates in excess of 100t/ha per year, including for parts of India, Nepal and Sri Lanka (e.g. Das et al., 1991; Stocking, 1992).
The map shows a clear relation to physiographic units. Most affected are the populated mountain regions ofthe Himalaya-Hindu Kush, the mountainous rim of Iran, and the areas of predominantly rainfed agricultureof the Deccan of India (with the Western Ghats most seriously affected) and Sri Lanka. Also affected arestrips where the Gangetic river system has cut into terraces, whilst ravines are widespread along the riversJumna and Chambal.
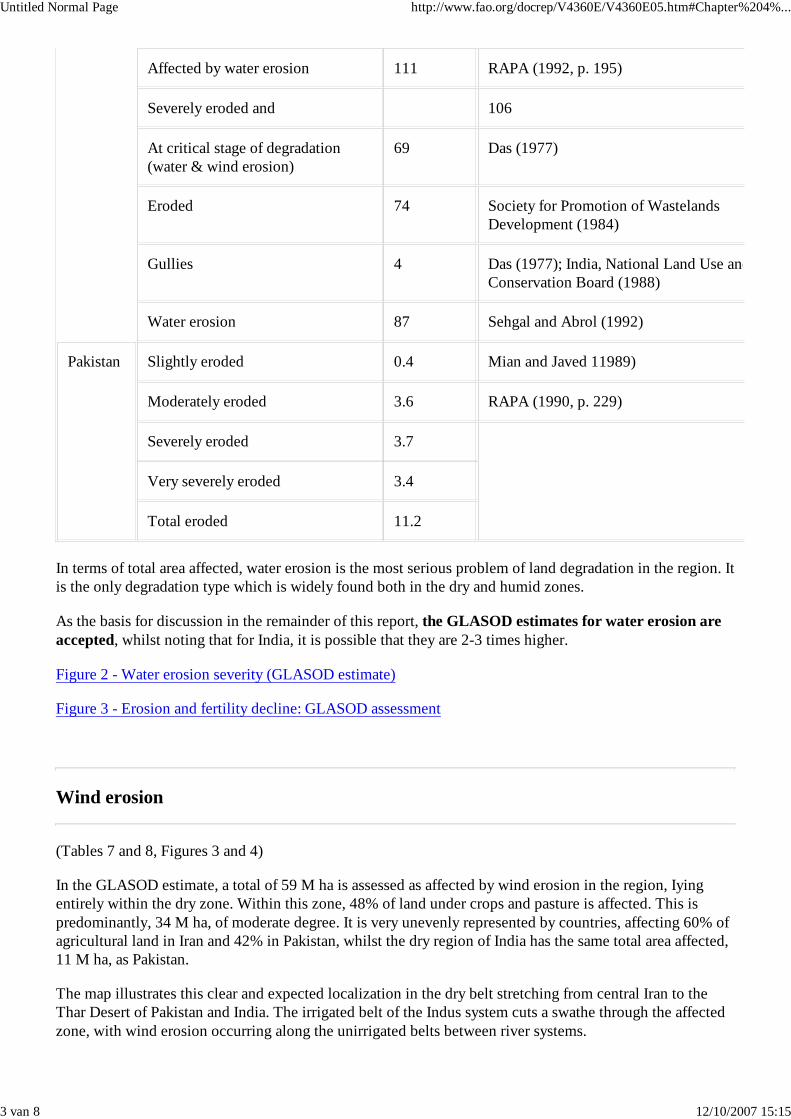
Table 6 shows some estimates of areas affected by water erosion, giving the words used to define the areasstated. For India, the earlier estimates are in the range 69-127 M ha, which is 2-4 times the GLASODestimate. The figure of 4 M ha under gullies or ravines has frequently been quoted, and is one third that ofthe GLASOD value for strong degradation. The estimate of Sehgal and Abrol (1992) is a new assessment bythe National Bureau of Soil Survey and Land Use Planning "following the criteria and guidelines of theGLASOD methodology". The value is over twice the original GLASOD estimate. For Pakistan, the totalsare of the same magnitude, 11.2 as compared with 7.2 M ha.
These comparisons illustrate what will be found repeatedly, that estimates of areas affected by landdegradation show a wide range of values.
TABLE 5 - GLASOD assessment: areas affected by water erosion (Unit: 1000 ha)
Light Moderate Strong Total Total as percent of
Originated by: Agriculture and ConsumerProtection
Title: Land degradation in south Asia: Its severity, causes and effects upon the people... More details
Untitled Normal Page http://www.fao.org/docrep/V4360E/V4360E05.htm#Chapter%204%...
2 van 8 12/10/2007 15:15
land
Afghanistan 8 560 2 597 0 11 156 29%
Bangladesh 0 1 504 0 1 504 15%
Bhutan 36 0 4 40 10%
India 2 936 17 217 12 620 32 773 18%
Iran 14 504 11 896 0 26 400 45%
Nepal 520 1 072 0 1 592 34%
Pakistan 6 080 1 124 0 7 204 28%
Sri Lanka 72 157 845 1 074 46%
India, dry region 1 177 0 1676 2 853 -
India, humid region 1 759 17 217 10 944 29 920 -
Dry zone 30 320 15 617 1 676 47 613 32%
Humid zone 2 387 19 951 11 791 34 130 20%
Region 32 707 35 568 13 468 81 743 25%
TABLE 6 - Country estimates of areas affected by water erosion
Untitled Normal Page http://www.fao.org/docrep/V4360E/V4360E05.htm#Chapter%204%...
3 van 8 12/10/2007 15:15
Affected by water erosion 111 RAPA (1992, p. 195)
Severely eroded and 106
At critical stage of degradation(water & wind erosion)
69 Das (1977)
Eroded 74 Society for Promotion of WastelandsDevelopment (1984)
Gullies 4 Das (1977); India, National Land Use andConservation Board (1988)
Water erosion 87 Sehgal and Abrol (1992)
Pakistan Slightly eroded 0.4 Mian and Javed 11989)
Moderately eroded 3.6 RAPA (1990, p. 229)
Severely eroded 3.7
Very severely eroded 3.4
Total eroded 11.2
In terms of total area affected, water erosion is the most serious problem of land degradation in the region. Itis the only degradation type which is widely found both in the dry and humid zones.
As the basis for discussion in the remainder of this report, the GLASOD estimates for water erosion areaccepted, whilst noting that for India, it is possible that they are 2-3 times higher.
Figure 2 - Water erosion severity (GLASOD estimate)
Figure 3 - Erosion and fertility decline: GLASOD assessment
Wind erosion
(Tables 7 and 8, Figures 3 and 4)
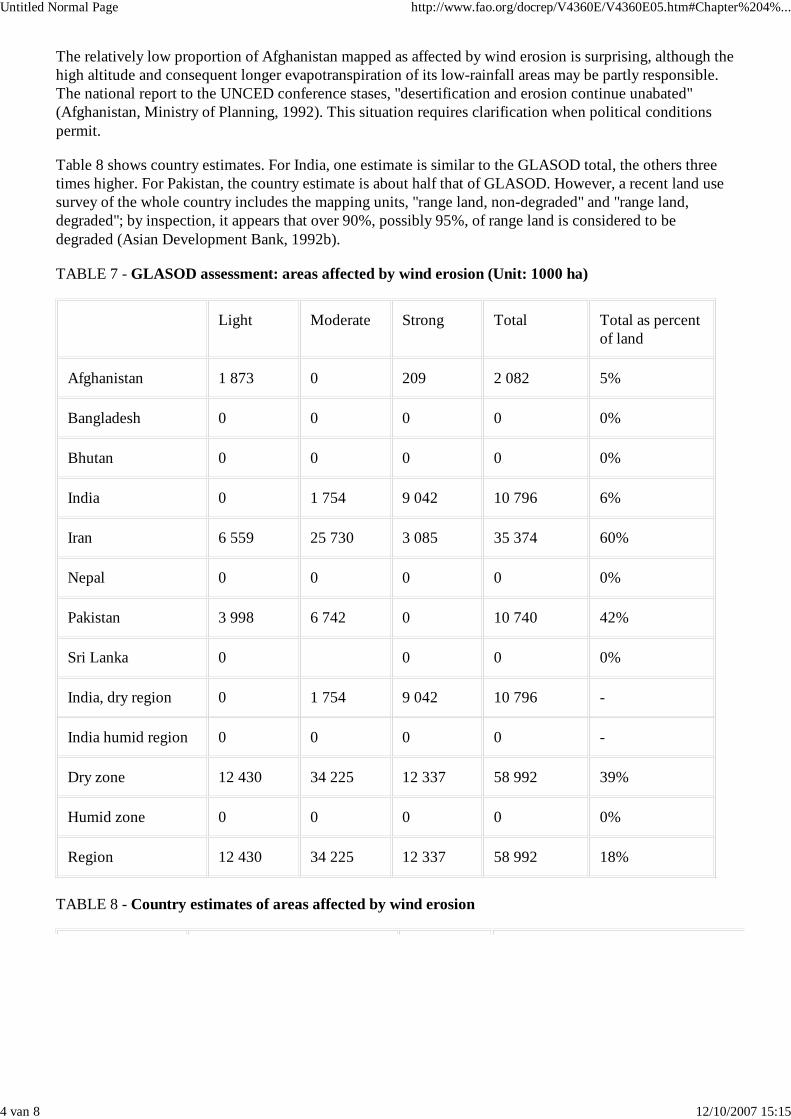
In the GLASOD estimate, a total of 59 M ha is assessed as affected by wind erosion in the region, Iyingentirely within the dry zone. Within this zone, 48% of land under crops and pasture is affected. This ispredominantly, 34 M ha, of moderate degree. It is very unevenly represented by countries, affecting 60% ofagricultural land in Iran and 42% in Pakistan, whilst the dry region of India has the same total area affected,11 M ha, as Pakistan.
The map illustrates this clear and expected localization in the dry belt stretching from central Iran to theThar Desert of Pakistan and India. The irrigated belt of the Indus system cuts a swathe through the affectedzone, with wind erosion occurring along the unirrigated belts between river systems.
Untitled Normal Page http://www.fao.org/docrep/V4360E/V4360E05.htm#Chapter%204%...
4 van 8 12/10/2007 15:15
The relatively low proportion of Afghanistan mapped as affected by wind erosion is surprising, although thehigh altitude and consequent longer evapotranspiration of its low-rainfall areas may be partly responsible.The national report to the UNCED conference stases, "desertification and erosion continue unabated"(Afghanistan, Ministry of Planning, 1992). This situation requires clarification when political conditionspermit.
Table 8 shows country estimates. For India, one estimate is similar to the GLASOD total, the others threetimes higher. For Pakistan, the country estimate is about half that of GLASOD. However, a recent land usesurvey of the whole country includes the mapping units, "range land, non-degraded" and "range land,degraded"; by inspection, it appears that over 90%, possibly 95%, of range land is considered to bedegraded (Asian Development Bank, 1992b).
TABLE 7 - GLASOD assessment: areas affected by wind erosion (Unit: 1000 ha)
Light Moderate Strong Total Total as percentof land
Afghanistan 1 873 0 209 2 082 5%
Bangladesh 0 0 0 0 0%
Bhutan 0 0 0 0 0%
India 0 1 754 9 042 10 796 6%
Iran 6 559 25 730 3 085 35 374 60%
Nepal 0 0 0 0 0%
Pakistan 3 998 6 742 0 10 740 42%
Sri Lanka 0 0 0 0%
India, dry region 0 1 754 9 042 10 796 -
India humid region 0 0 0 0 -
Dry zone 12 430 34 225 12 337 58 992 39%
Humid zone 0 0 0 0 0%
Region 12 430 34 225 12 337 58 992 18%
TABLE 8 - Country estimates of areas affected by wind erosion
Untitled Normal Page http://www.fao.org/docrep/V4360E/V4360E05.htm#Chapter%204%...
5 van 8 12/10/2007 15:15
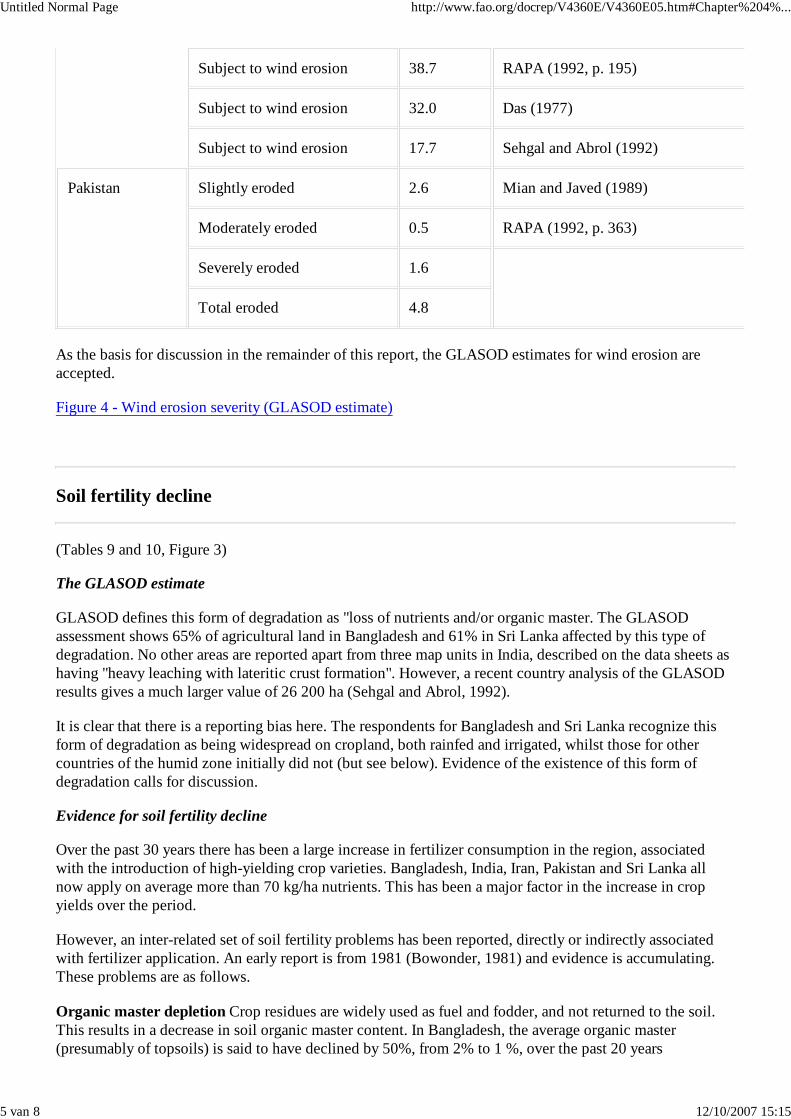
Subject to wind erosion 38.7 RAPA (1992, p. 195)
Subject to wind erosion 32.0 Das (1977)
Subject to wind erosion 17.7 Sehgal and Abrol (1992)
Pakistan Slightly eroded 2.6 Mian and Javed (1989)
Moderately eroded 0.5 RAPA (1992, p. 363)
Severely eroded 1.6
Total eroded 4.8
As the basis for discussion in the remainder of this report, the GLASOD estimates for wind erosion areaccepted.
Figure 4 - Wind erosion severity (GLASOD estimate)
Soil fertility decline
(Tables 9 and 10, Figure 3)
The GLASOD estimate
GLASOD defines this form of degradation as "loss of nutrients and/or organic master. The GLASODassessment shows 65% of agricultural land in Bangladesh and 61% in Sri Lanka affected by this type ofdegradation. No other areas are reported apart from three map units in India, described on the data sheets ashaving "heavy leaching with lateritic crust formation". However, a recent country analysis of the GLASODresults gives a much larger value of 26 200 ha (Sehgal and Abrol, 1992).
It is clear that there is a reporting bias here. The respondents for Bangladesh and Sri Lanka recognize thisform of degradation as being widespread on cropland, both rainfed and irrigated, whilst those for othercountries of the humid zone initially did not (but see below). Evidence of the existence of this form ofdegradation calls for discussion.
Evidence for soil fertility decline
Over the past 30 years there has been a large increase in fertilizer consumption in the region, associatedwith the introduction of high-yielding crop varieties. Bangladesh, India, Iran, Pakistan and Sri Lanka allnow apply on average more than 70 kg/ha nutrients. This has been a major factor in the increase in cropyields over the period.
However, an inter-related set of soil fertility problems has been reported, directly or indirectly associatedwith fertilizer application. An early report is from 1981 (Bowonder, 1981) and evidence is accumulating.These problems are as follows.
Organic master depletion Crop residues are widely used as fuel and fodder, and not returned to the soil.This results in a decrease in soil organic master content. In Bangladesh, the average organic master(presumably of topsoils) is said to have declined by 50%, from 2% to 1 %, over the past 20 years
Untitled Normal Page http://www.fao.org/docrep/V4360E/V4360E05.htm#Chapter%204%...
6 van 8 12/10/2007 15:15
(Bangladesh, 1992). For the Indian State of Harayana, soil test reports over 15 years show a decrease in soilcarbon (Chaudhary and Aneja, 1991). Decreased organic master leads to:
degradation of soil physical properties, including water holding capacity, as has developed in India(Indian Council of Agricultural Research, persona! communication);reduced nutrient retention capacity;longer release of nutrients, including micronutrients, from mineralization of organic master.
As a consequence of all these effects, there may be longer response to fertilizer.
A continuing negative soil nutrient balance. Removal of nutrients from the soil in crop harvest appearssubstantially to exceed inputs as natural replacement and fertilizers. Negative soil nutrient balances havebeen reported for all three major nutrients in Bangladesh and Nepal; for phosphorus and potassium in SriLanka, and a large deficit for potassium in Pakistan (FAO, 1986b). Nutrient depletion has been reported foreach of the 15 agro-climatic regions of India (Biswas and Tewatia, 1991; Tandon, 1992, citing othersources). For India, a deficiency between nutrient removal and addition of 60 kg/ha per year, or 9 Mt for thewhole country, has been estimated (Tandon, 1992).
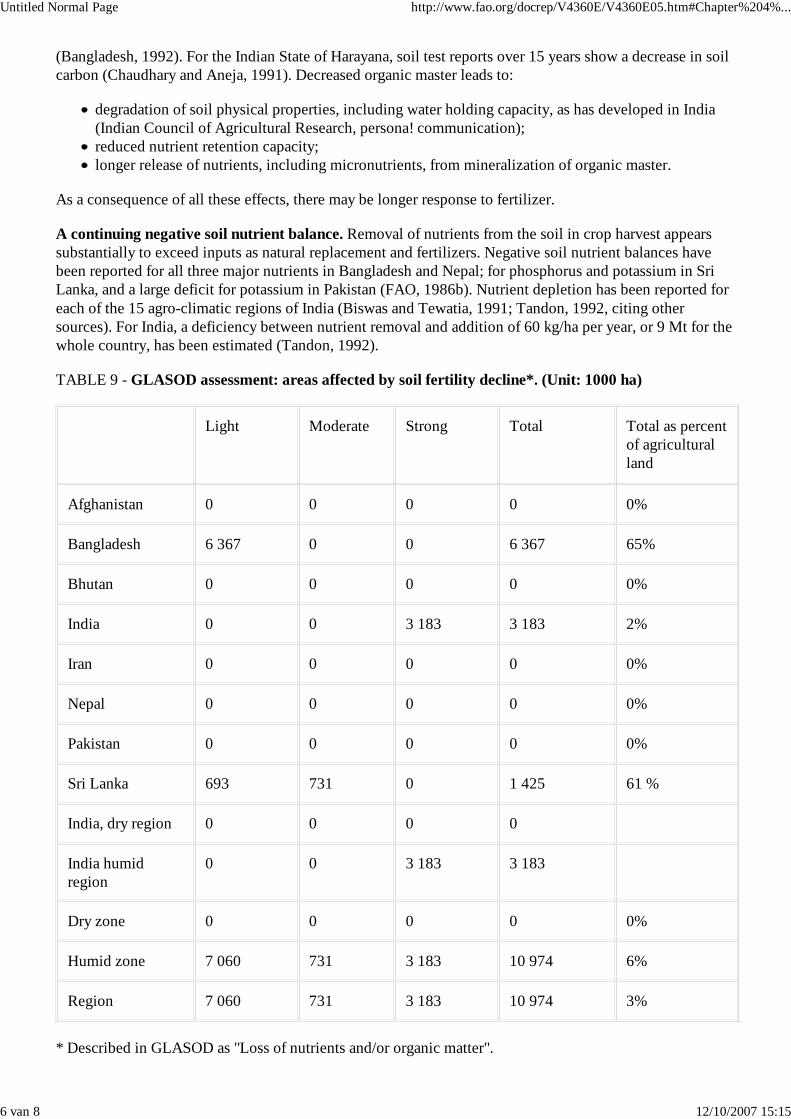
TABLE 9 - GLASOD assessment: areas affected by soil fertility decline*. (Unit: 1000 ha)
Light Moderate Strong Total Total as percentof agricultural land
Afghanistan 0 0 0 0 0%
Bangladesh 6 367 0 0 6 367 65%
Bhutan 0 0 0 0 0%
India 0 0 3 183 3 183 2%
Iran 0 0 0 0 0%
Nepal 0 0 0 0 0%
Pakistan 0 0 0 0 0%
Sri Lanka 693 731 0 1 425 61 %
India, dry region 0 0 0 0
India humidregion
0 0 3 183 3 183
Dry zone 0 0 0 0 0%
Humid zone 7 060 731 3 183 10 974 6%
Region 7 060 731 3 183 10 974 3%
* Described in GLASOD as "Loss of nutrients and/or organic matter".
Untitled Normal Page http://www.fao.org/docrep/V4360E/V4360E05.htm#Chapter%204%...
7 van 8 12/10/2007 15:15
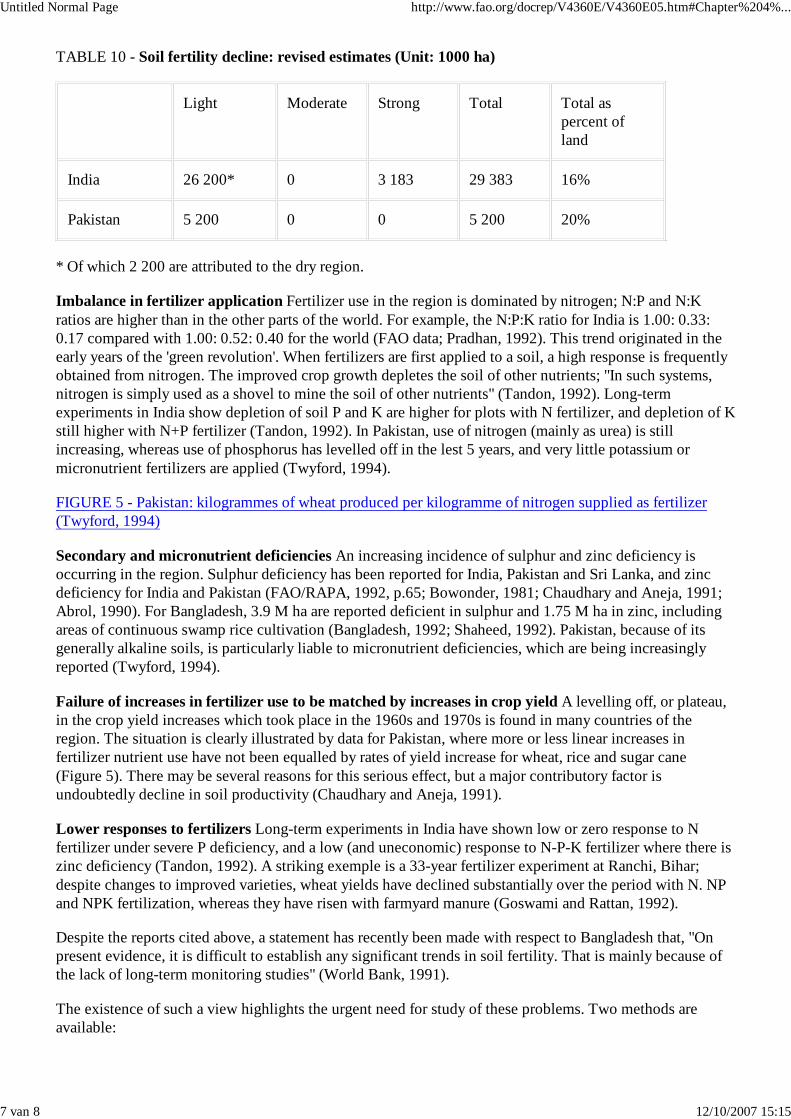
TABLE 10 - Soil fertility decline: revised estimates (Unit: 1000 ha)
Light Moderate Strong Total Total aspercent of land
India 26 200* 0 3 183 29 383 16%
Pakistan 5 200 0 0 5 200 20%
* Of which 2 200 are attributed to the dry region.
Imbalance in fertilizer application Fertilizer use in the region is dominated by nitrogen; N:P and N:Kratios are higher than in the other parts of the world. For example, the N:P:K ratio for India is 1.00: 0.33:0.17 compared with 1.00: 0.52: 0.40 for the world (FAO data; Pradhan, 1992). This trend originated in theearly years of the 'green revolution'. When fertilizers are first applied to a soil, a high response is frequentlyobtained from nitrogen. The improved crop growth depletes the soil of other nutrients; "In such systems,nitrogen is simply used as a shovel to mine the soil of other nutrients" (Tandon, 1992). Long-termexperiments in India show depletion of soil P and K are higher for plots with N fertilizer, and depletion of Kstill higher with N+P fertilizer (Tandon, 1992). In Pakistan, use of nitrogen (mainly as urea) is stillincreasing, whereas use of phosphorus has levelled off in the lest 5 years, and very little potassium ormicronutrient fertilizers are applied (Twyford, 1994).
FIGURE 5 - Pakistan: kilogrammes of wheat produced per kilogramme of nitrogen supplied as fertilizer(Twyford, 1994)
Secondary and micronutrient deficiencies An increasing incidence of sulphur and zinc deficiency isoccurring in the region. Sulphur deficiency has been reported for India, Pakistan and Sri Lanka, and zincdeficiency for India and Pakistan (FAO/RAPA, 1992, p.65; Bowonder, 1981; Chaudhary and Aneja, 1991;Abrol, 1990). For Bangladesh, 3.9 M ha are reported deficient in sulphur and 1.75 M ha in zinc, includingareas of continuous swamp rice cultivation (Bangladesh, 1992; Shaheed, 1992). Pakistan, because of itsgenerally alkaline soils, is particularly liable to micronutrient deficiencies, which are being increasinglyreported (Twyford, 1994).
Failure of increases in fertilizer use to be matched by increases in crop yield A levelling off, or plateau,in the crop yield increases which took place in the 1960s and 1970s is found in many countries of theregion. The situation is clearly illustrated by data for Pakistan, where more or less linear increases infertilizer nutrient use have not been equalled by rates of yield increase for wheat, rice and sugar cane(Figure 5). There may be several reasons for this serious effect, but a major contributory factor isundoubtedly decline in soil productivity (Chaudhary and Aneja, 1991).
Lower responses to fertilizers Long-term experiments in India have shown low or zero response to Nfertilizer under severe P deficiency, and a low (and uneconomic) response to N-P-K fertilizer where there iszinc deficiency (Tandon, 1992). A striking exemple is a 33-year fertilizer experiment at Ranchi, Bihar;despite changes to improved varieties, wheat yields have declined substantially over the period with N. NPand NPK fertilization, whereas they have risen with farmyard manure (Goswami and Rattan, 1992).
Despite the reports cited above, a statement has recently been made with respect to Bangladesh that, "Onpresent evidence, it is difficult to establish any significant trends in soil fertility. That is mainly because ofthe lack of long-term monitoring studies" (World Bank, 1991).
The existence of such a view highlights the urgent need for study of these problems. Two methods areavailable:
Untitled Normal Page http://www.fao.org/docrep/V4360E/V4360E05.htm#Chapter%204%...
8 van 8 12/10/2007 15:15
Long-term experiments These should be maintained or, where necessary, established at a limitednumber of representative sites in countries of the region. Difficulties are sometimes experienced injustifying funding for long-term experiments, but they are of immense value, and considerationshould be given to international support for a network.
1.
Soil monitoring This is the monitoring of changes in soil properties over time, on astatistically-based selection of sites on farmland. A high degree of standardization of analyticalmethods is essential. Soil monitoring should become a major element in the work of national soilsurvey organizations (Young, 1991).
2.
The above evidence does not indicate the areal extent of soil fertility decline, other than that it is extensivein the region. It is the objective of this study, however, to obtain best estimates, and for this purpose, anadjustment will be made to what is considered a reporting bias in the GLASOD estimates. Given the largeareas (60-65 % of agricultural land) reported as having nutrient deficiency in Bangladesh and Sri Lanka, andthe existence of reports as outlined above, it is tentatively, and conservatively, estimated that an additional20% of the agricultural land of both India and Pakistan are affected by soil fertility decline, at least to a lightdegree.
Revised country estimates Whilst soil fertility decline was shown for India only for a small area, as theabove evidence has accumulated its greater extent has been accepted. A recent estimate gives 26.2 M ha asaffected by loss of nutrients. There is no corresponding estimate for Pakistan, but evidence of thewidespread occurrence of fertility decline is equally strong.
Consequently, as the basis for the rest of this report, the GLASOD estimates for soil fertility decline arerevised for India and Pakistan, as in Table 10.
Untitled Normal Page http://www.fao.org/docrep/V4360E/V4360E06.htm#Chapter%205%...
1 van 8 12/10/2007 15:15
Chapter 5 - Status of degradation. II. Other types of degradation andsummary
Back to contents - Previous file - Next file
Waterlogging Salinization Lowering of the water table Other types of degradationWatershed degradation and managementSummary: the severity and extent of land degradationDiscussion
Waterlogging
(Tables 11 and 12, Figure 6)
Waterlogging is the rise of the water table into the root zone of the soil profile, such that plant growth isadversely affected by deficiency of oxygen. The critical depth depends on the kind of crop, but waterlogging iscommonly defined as light for a soil profile depth of 3 m for substantial parts of the year, and moderate for lessthan 1.5 m. The severe degree occurs with a water table at 0-30 cm depth, and also included in this study isponding, where it rises above the surface.
Waterlogging as a form of land degradation should be distinguished from naturally occurring poorly drainedareas, and also from the different problem of flooding, which is noted below.
In the GLASOD estimate, waterlogging affects 4.6 M ha, largely in the irrigated areas of India and Pakistan. It isclosely linked with salinization. In Iran it occurs in the coastal zone. The progressive rise in the water tablebeneath the Indo-Gangetic plains since the commencement of large scale irrigation schemes in the 1930s hasbeen monitored (e. g. Ahmad and Kutcher, 1992).
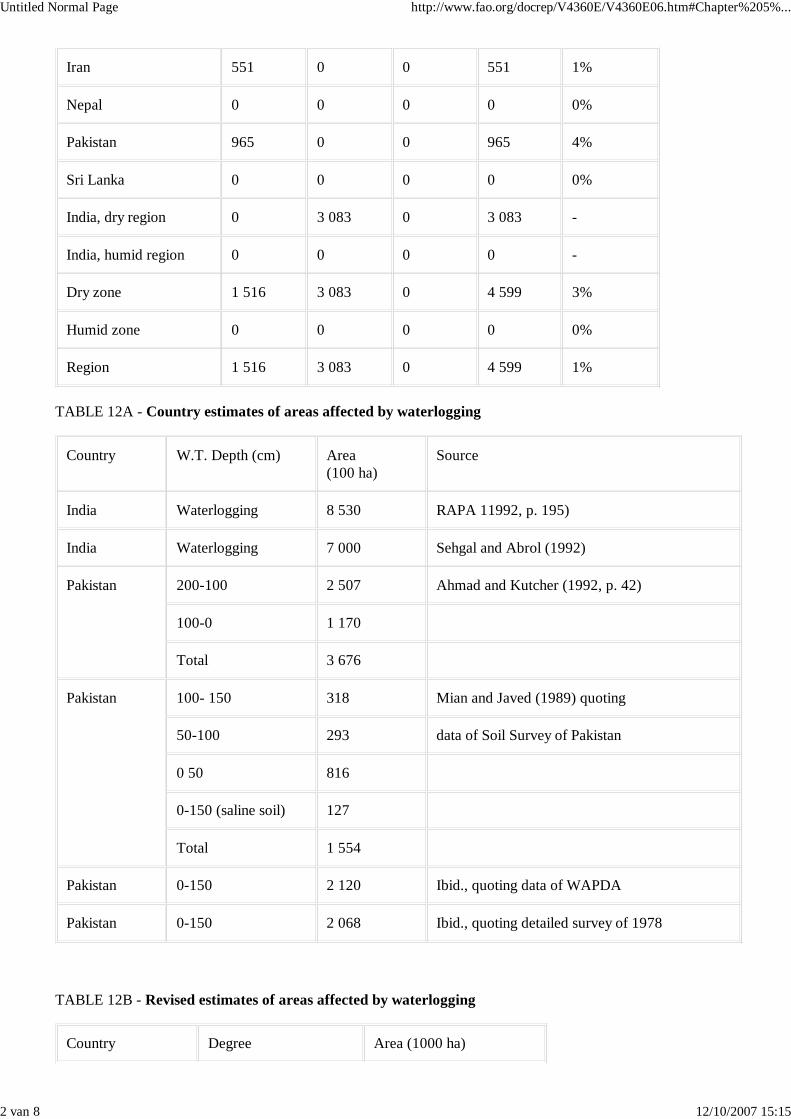
TABLE 11 - GLASOD assessment: areas affected by waterlogging (Unit: 1000 ha)
Light Moderate Strong Total Total aspercent of agriculturalland
Afghanistan 0 0 0 0 0%
Bangladesh 0 0 0 0 0%
Bhutan 0 0 0 0 0%
India 0 3 083 0 3 083 2%
Originated by: Agriculture and ConsumerProtection
Title: Land degradation in south Asia: Its severity, causes and effects upon the people... More details
Untitled Normal Page http://www.fao.org/docrep/V4360E/V4360E06.htm#Chapter%205%...
2 van 8 12/10/2007 15:15
Iran 551 0 0 551 1%
Nepal 0 0 0 0 0%
Pakistan 965 0 0 965 4%
Sri Lanka 0 0 0 0 0%
India, dry region 0 3 083 0 3 083 -
India, humid region 0 0 0 0 -
Dry zone 1 516 3 083 0 4 599 3%
Humid zone 0 0 0 0 0%
Region 1 516 3 083 0 4 599 1%
TABLE 12A - Country estimates of areas affected by waterlogging
Country W.T. Depth (cm) Area (100 ha)
Source
India Waterlogging 8 530 RAPA 11992, p. 195)
India Waterlogging 7 000 Sehgal and Abrol (1992)
Pakistan 200-100 2 507 Ahmad and Kutcher (1992, p. 42)
100-0 1 170
Total 3 676
Pakistan 100- 150 318 Mian and Javed (1989) quoting
50-100 293 data of Soil Survey of Pakistan
0 50 816
0-150 (saline soil) 127
Total 1 554
Pakistan 0-150 2 120 Ibid., quoting data of WAPDA
Pakistan 0-150 2 068 Ibid., quoting detailed survey of 1978
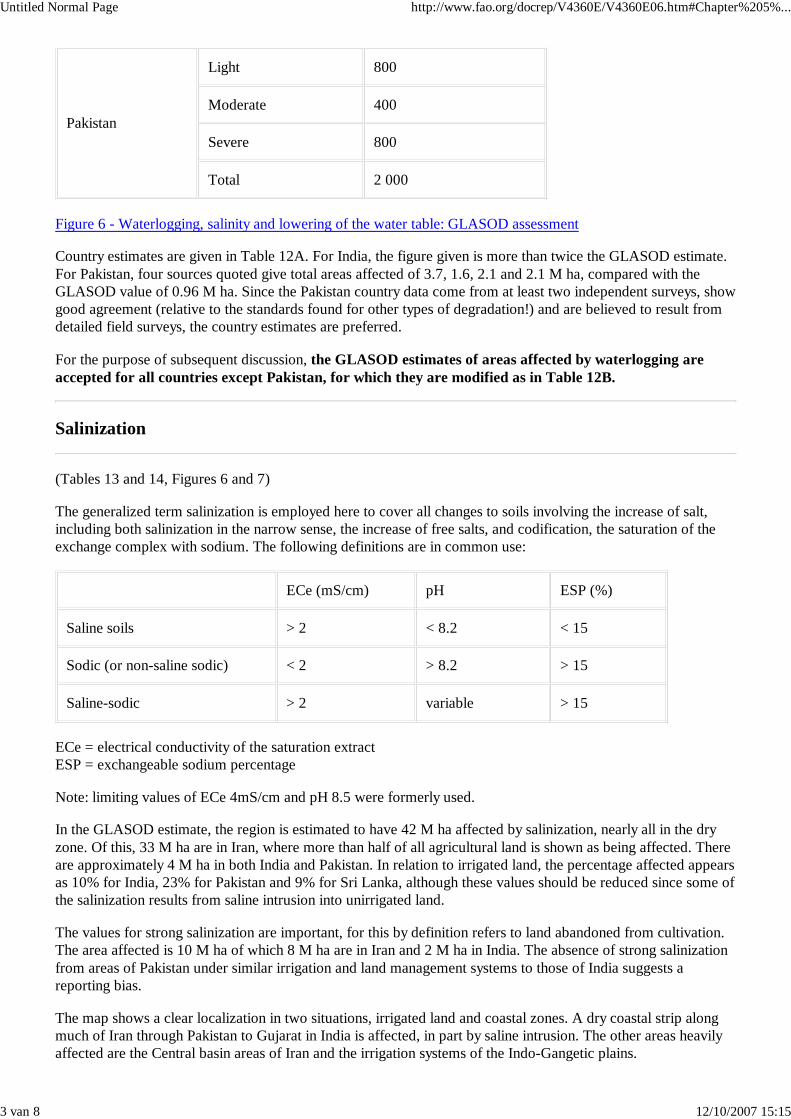
TABLE 12B - Revised estimates of areas affected by waterlogging
Country Degree Area (1000 ha)
Untitled Normal Page http://www.fao.org/docrep/V4360E/V4360E06.htm#Chapter%205%...
3 van 8 12/10/2007 15:15
Pakistan
Light 800
Moderate 400
Severe 800
Total 2 000
Figure 6 - Waterlogging, salinity and lowering of the water table: GLASOD assessment
Country estimates are given in Table 12A. For India, the figure given is more than twice the GLASOD estimate.For Pakistan, four sources quoted give total areas affected of 3.7, 1.6, 2.1 and 2.1 M ha, compared with theGLASOD value of 0.96 M ha. Since the Pakistan country data come from at least two independent surveys, showgood agreement (relative to the standards found for other types of degradation!) and are believed to result fromdetailed field surveys, the country estimates are preferred.
For the purpose of subsequent discussion, the GLASOD estimates of areas affected by waterlogging areaccepted for all countries except Pakistan, for which they are modified as in Table 12B.
Salinization
(Tables 13 and 14, Figures 6 and 7)
The generalized term salinization is employed here to cover all changes to soils involving the increase of salt,including both salinization in the narrow sense, the increase of free salts, and codification, the saturation of theexchange complex with sodium. The following definitions are in common use:
ECe (mS/cm) pH ESP (%)
Saline soils > 2 < 8.2 < 15
Sodic (or non-saline sodic) < 2 > 8.2 > 15
Saline-sodic > 2 variable > 15
ECe = electrical conductivity of the saturation extract ESP = exchangeable sodium percentage
Note: limiting values of ECe 4mS/cm and pH 8.5 were formerly used.
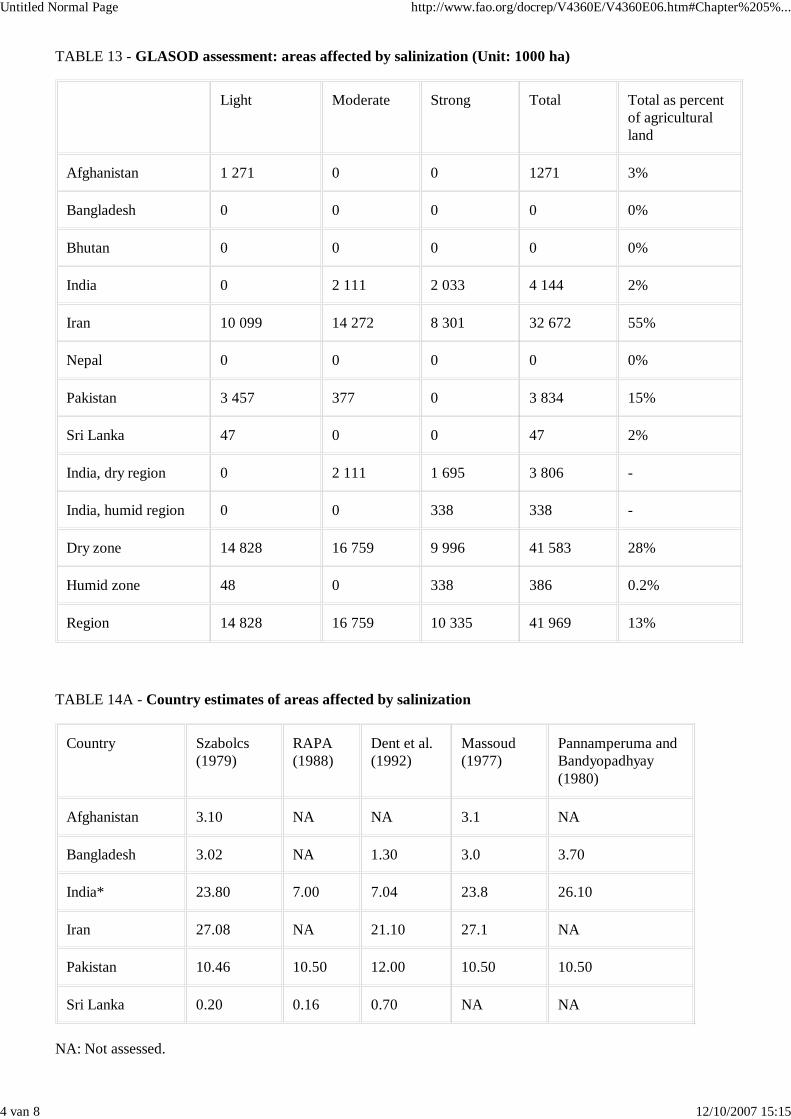
In the GLASOD estimate, the region is estimated to have 42 M ha affected by salinization, nearly all in the dryzone. Of this, 33 M ha are in Iran, where more than half of all agricultural land is shown as being affected. Thereare approximately 4 M ha in both India and Pakistan. In relation to irrigated land, the percentage affected appearsas 10% for India, 23% for Pakistan and 9% for Sri Lanka, although these values should be reduced since some ofthe salinization results from saline intrusion into unirrigated land.
The values for strong salinization are important, for this by definition refers to land abandoned from cultivation.The area affected is 10 M ha of which 8 M ha are in Iran and 2 M ha in India. The absence of strong salinizationfrom areas of Pakistan under similar irrigation and land management systems to those of India suggests areporting bias.
The map shows a clear localization in two situations, irrigated land and coastal zones. A dry coastal strip alongmuch of Iran through Pakistan to Gujarat in India is affected, in part by saline intrusion. The other areas heavilyaffected are the Central basin areas of Iran and the irrigation systems of the Indo-Gangetic plains.
Untitled Normal Page http://www.fao.org/docrep/V4360E/V4360E06.htm#Chapter%205%...
4 van 8 12/10/2007 15:15
TABLE 13 - GLASOD assessment: areas affected by salinization (Unit: 1000 ha)
Light Moderate Strong Total Total as percentof agricultural land
Afghanistan 1 271 0 0 1271 3%
Bangladesh 0 0 0 0 0%
Bhutan 0 0 0 0 0%
India 0 2 111 2 033 4 144 2%
Iran 10 099 14 272 8 301 32 672 55%
Nepal 0 0 0 0 0%
Pakistan 3 457 377 0 3 834 15%
Sri Lanka 47 0 0 47 2%
India, dry region 0 2 111 1 695 3 806 -
India, humid region 0 0 338 338 -
Dry zone 14 828 16 759 9 996 41 583 28%
Humid zone 48 0 338 386 0.2%
Region 14 828 16 759 10 335 41 969 13%
TABLE 14A - Country estimates of areas affected by salinization
Country Szabolcs(1979)
RAPA (1988)
Dent et al.(1992)
Massoud(1977)
Pannamperuma andBandyopadhyay (1980)
Afghanistan 3.10 NA NA 3.1 NA
Bangladesh 3.02 NA 1.30 3.0 3.70
India* 23.80 7.00 7.04 23.8 26.10
Iran 27.08 NA 21.10 27.1 NA
Pakistan 10.46 10.50 12.00 10.50 10.50
Sri Lanka 0.20 0.16 0.70 NA NA
NA: Not assessed.
Untitled Normal Page http://www.fao.org/docrep/V4360E/V4360E06.htm#Chapter%205%...
5 van 8 12/10/2007 15:15
* For India, a further estimate of 6Mha is given by Sehgal and Abrol (1992).
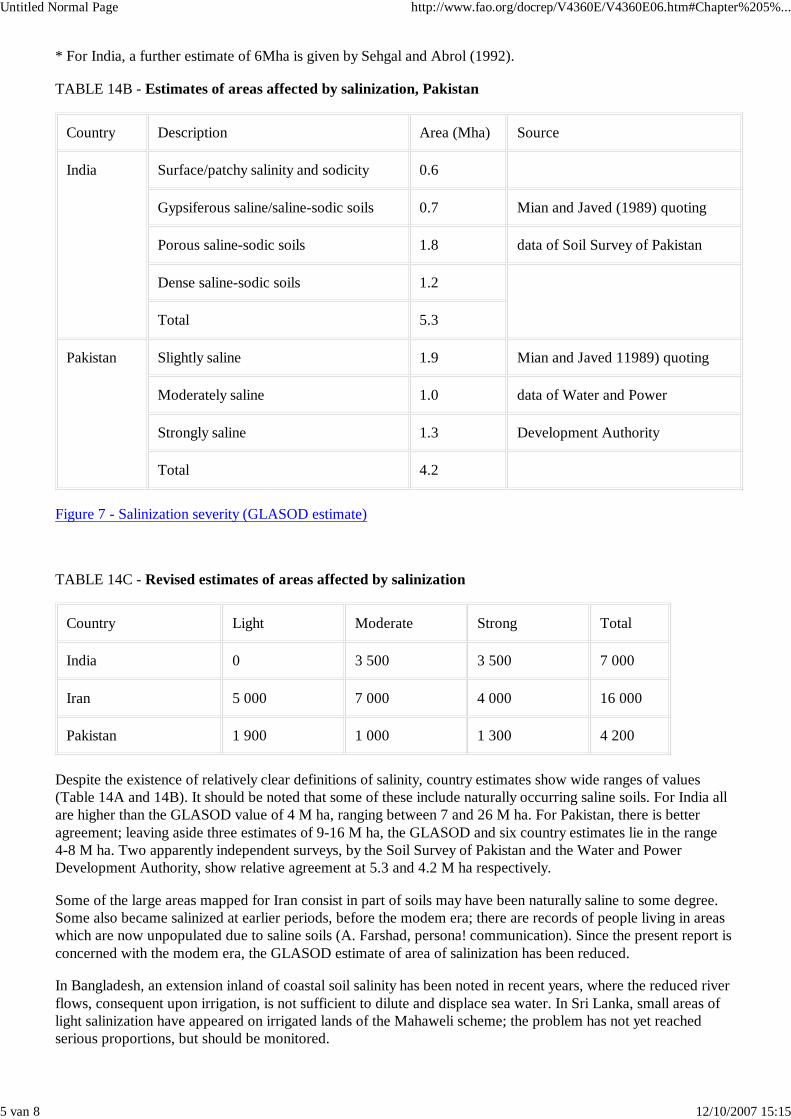
TABLE 14B - Estimates of areas affected by salinization, Pakistan
Country Description Area (Mha) Source
India Surface/patchy salinity and sodicity 0.6
Gypsiferous saline/saline-sodic soils 0.7 Mian and Javed (1989) quoting
Porous saline-sodic soils 1.8 data of Soil Survey of Pakistan
Dense saline-sodic soils 1.2
Total 5.3
Pakistan Slightly saline 1.9 Mian and Javed 11989) quoting
Moderately saline 1.0 data of Water and Power
Strongly saline 1.3 Development Authority
Total 4.2
Figure 7 - Salinization severity (GLASOD estimate)
TABLE 14C - Revised estimates of areas affected by salinization
Country Light Moderate Strong Total
India 0 3 500 3 500 7 000
Iran 5 000 7 000 4 000 16 000
Pakistan 1 900 1 000 1 300 4 200
Despite the existence of relatively clear definitions of salinity, country estimates show wide ranges of values(Table 14A and 14B). It should be noted that some of these include naturally occurring saline soils. For India allare higher than the GLASOD value of 4 M ha, ranging between 7 and 26 M ha. For Pakistan, there is betteragreement; leaving aside three estimates of 9-16 M ha, the GLASOD and six country estimates lie in the range4-8 M ha. Two apparently independent surveys, by the Soil Survey of Pakistan and the Water and PowerDevelopment Authority, show relative agreement at 5.3 and 4.2 M ha respectively.
Some of the large areas mapped for Iran consist in part of soils may have been naturally saline to some degree.Some also became salinized at earlier periods, before the modem era; there are records of people living in areaswhich are now unpopulated due to saline soils (A. Farshad, persona! communication). Since the present report isconcerned with the modem era, the GLASOD estimate of area of salinization has been reduced.
In Bangladesh, an extension inland of coastal soil salinity has been noted in recent years, where the reduced riverflows, consequent upon irrigation, is not sufficient to dilute and displace sea water. In Sri Lanka, small areas oflight salinization have appeared on irrigated lands of the Mahaweli scheme; the problem has not yet reachedserious proportions, but should be monitored.
Untitled Normal Page http://www.fao.org/docrep/V4360E/V4360E06.htm#Chapter%205%...
6 van 8 12/10/2007 15:15
Estimates of the extent of saline soils need to be associated with the dates of survey. Through successfulreclamation, the extent of saline soils has been reduced in some areas, particularly as a consequence of the seriesof Salinity Control and Reclamation Projects (SCARP) in Pakistan. For example in the Pakistan Punjab the areaof waterlogged and saline soils, which had risen from 61 000 ha in 1960 to 68 000 in 1966, had been reduced to23 000 ha by 1985 (Chopra, 1989).
On the basis of this information, the GLASOD estimates for India, Iran and Pakistan are revised as inTable 14C.
Lowering of the water table
(Table 15, Figure 6)
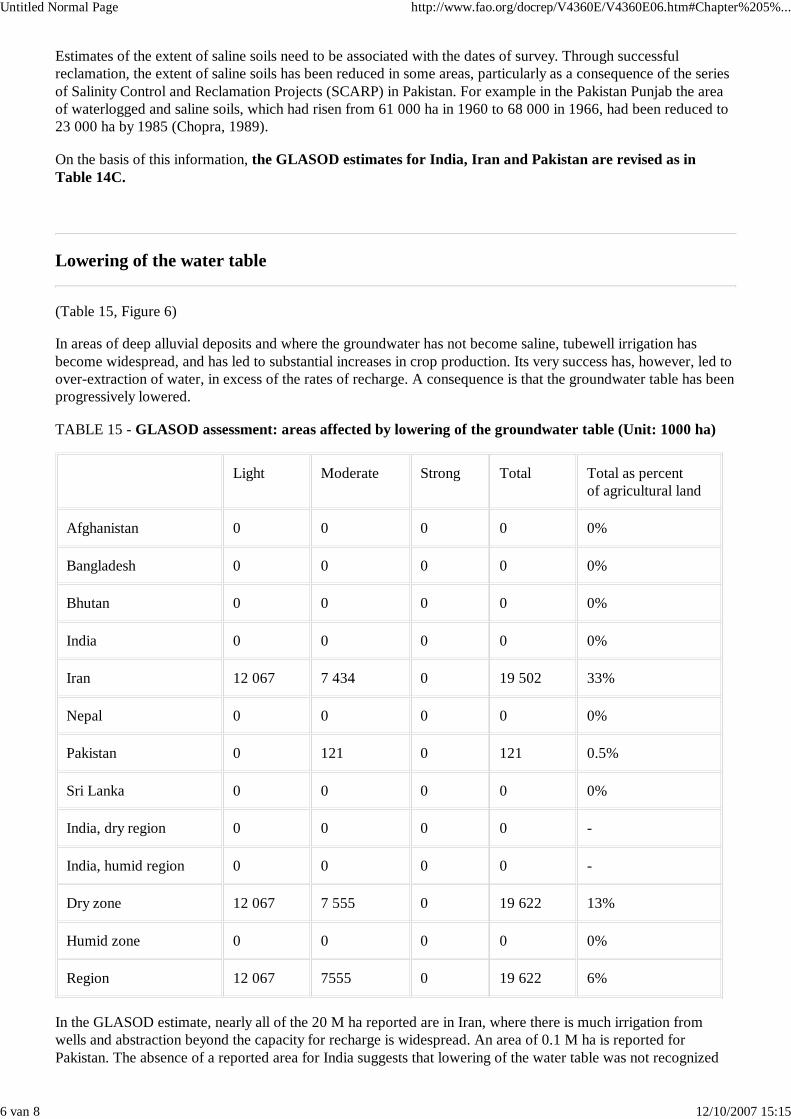
In areas of deep alluvial deposits and where the groundwater has not become saline, tubewell irrigation hasbecome widespread, and has led to substantial increases in crop production. Its very success has, however, led toover-extraction of water, in excess of the rates of recharge. A consequence is that the groundwater table has beenprogressively lowered.
TABLE 15 - GLASOD assessment: areas affected by lowering of the groundwater table (Unit: 1000 ha)
Light Moderate Strong Total Total as percent of agricultural land
Afghanistan 0 0 0 0 0%
Bangladesh 0 0 0 0 0%
Bhutan 0 0 0 0 0%
India 0 0 0 0 0%
Iran 12 067 7 434 0 19 502 33%
Nepal 0 0 0 0 0%
Pakistan 0 121 0 121 0.5%
Sri Lanka 0 0 0 0 0%
India, dry region 0 0 0 0 -
India, humid region 0 0 0 0 -
Dry zone 12 067 7 555 0 19 622 13%
Humid zone 0 0 0 0 0%
Region 12 067 7555 0 19 622 6%
In the GLASOD estimate, nearly all of the 20 M ha reported are in Iran, where there is much irrigation fromwells and abstraction beyond the capacity for recharge is widespread. An area of 0.1 M ha is reported forPakistan. The absence of a reported area for India suggests that lowering of the water table was not recognized
Untitled Normal Page http://www.fao.org/docrep/V4360E/V4360E06.htm#Chapter%205%...
7 van 8 12/10/2007 15:15
by the responding organization as a form of "land" degradation.
This form of degradation has certainly occurred in India. In parts of the Punjab, the water table has fallen bybetween 0.5 and 4.0 m in the eight year period 1978-86, and is receding at 0.3-0.5 m per year (Singh, 1992). Inthe Sudhar block of Ludhiana district, it has fallen between 1965 and 1989 from 3 m to 11 m, and in Haryanabetween 1974 and 1989 from 4.8 m to 7.7 m (Joshi and Tyagi, 1991).
Data on the extent of such lowering in India have not been identified, and the definitions of degrees of severityare not fully applicable to this type of degradation. However, on the basis of these reports, nominal additions tothe GLASOD estimates of 100 000 ha light and 100 000 ha moderate degradation are made.
Other types of degradation
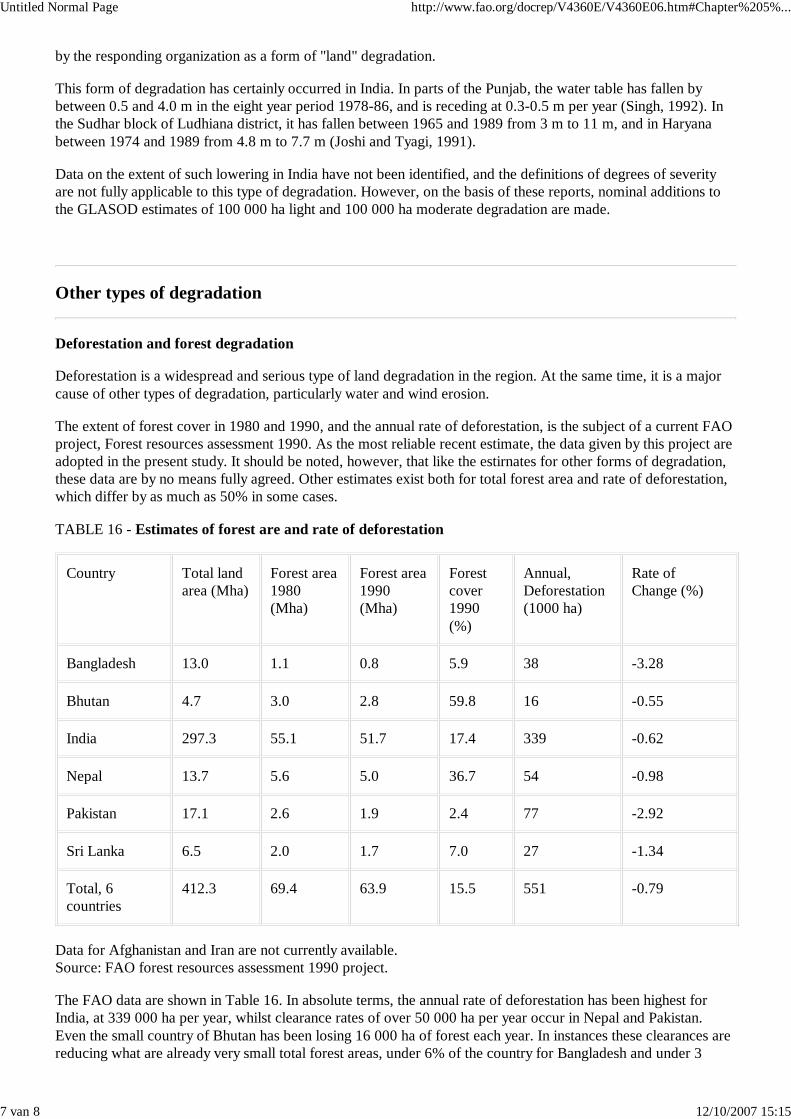
Deforestation and forest degradation
Deforestation is a widespread and serious type of land degradation in the region. At the same time, it is a majorcause of other types of degradation, particularly water and wind erosion.
The extent of forest cover in 1980 and 1990, and the annual rate of deforestation, is the subject of a current FAOproject, Forest resources assessment 1990. As the most reliable recent estimate, the data given by this project areadopted in the present study. It should be noted, however, that like the estirnates for other forms of degradation,these data are by no means fully agreed. Other estimates exist both for total forest area and rate of deforestation,which differ by as much as 50% in some cases.
TABLE 16 - Estimates of forest are and rate of deforestation
Country Total landarea (Mha)
Forest area1980 (Mha)
Forest area1990 (Mha)
Forestcover 1990 (%)
Annual,Deforestation(1000 ha)
Rate of Change (%)
Bangladesh 13.0 1.1 0.8 5.9 38 -3.28
Bhutan 4.7 3.0 2.8 59.8 16 -0.55
India 297.3 55.1 51.7 17.4 339 -0.62
Nepal 13.7 5.6 5.0 36.7 54 -0.98
Pakistan 17.1 2.6 1.9 2.4 77 -2.92
Sri Lanka 6.5 2.0 1.7 7.0 27 -1.34
Total, 6countries
412.3 69.4 63.9 15.5 551 -0.79
Data for Afghanistan and Iran are not currently available.Source: FAO forest resources assessment 1990 project.
The FAO data are shown in Table 16. In absolute terms, the annual rate of deforestation has been highest forIndia, at 339 000 ha per year, whilst clearance rates of over 50 000 ha per year occur in Nepal and Pakistan.Even the small country of Bhutan has been losing 16 000 ha of forest each year. In instances these clearances arereducing what are already very small total forest areas, under 6% of the country for Bangladesh and under 3
Untitled Normal Page http://www.fao.org/docrep/V4360E/V4360E06.htm#Chapter%205%...
8 van 8 12/10/2007 15:15
percent for Pakistan. Both these countries are losing 3% of their small remaining forest areas annually.
Quantitative data from the FAO assessment are not currently available for Afghanistan and Iran, but rates ofdeforestation there are known to be high. Further information on deforestation for countries of the region is givenin ESCAP (1986).
A related form of land degradation is forest degradation, the reduction of the standing biomass and, in extremecases, potential for regrowth of areas which still remain as forest or woodland (Banerjee and Grimes, in press).Forest degradation results from the cutting of woody formations in excess of their capacity for regrowth. Mostinvolve cutting of natural forests, but illegal clearances of forest plantations are also found. The problem isparticularly serious, for example, in Nepal and Pakistan, but occurs widely in the region.
Rangeland degradation
Rangeland degradation is reduction in the capacity of natural rangelands to support livestock. It occurs as a resultof excessive livestock populations, inadequate pasture management, or both..
It has not been possible to obtain quantitative estimates of the extent and severity of rangeland degradation,although these may exist in some of the grassland research institutes of countries of the region. There is no doubt,however, that the problem is widespread in all countries of the dry zone.
In Pakistan, the productivity of most of the large area of rangelands is estimated to be 1050% of its potential(Asian Development Bank, 1992a); however, there may still be the capacity for quite rapid recovery whereappropriate pasture management measures are taken (N. Martin, persona! communication). In India, with some200 M cattle, grazing pressures have caused widespread exhaustion of the stored food reserves of perennialgrasses and their replacement by coarse grasses (Singh, 1988). Rangeland degradation is reported to be severeand widespread in Afghanistan (ESCAP, 1983).
As defined above, desertification refers to all types of land degradation in the dry zone of the region. It istherefore not separately assessed. Accounts, with some quantitative data, are given in reports of theDesertification Control Network for Asia and the Pacific (DESCONAP) (ESCAP, 1983, 1987, 1991b) and incountry reports for Iran (Kholdebarin, 1992; Noohi, 1992) and Pakistan (Hutchinson and Webb, 1987).Desertification, described as the transformation of savanna to steppe and desert, is reported to have affected largeareas of India (Singh, 1988). It is also widespread and serious in Afghanistan, Iran and Pakistan.
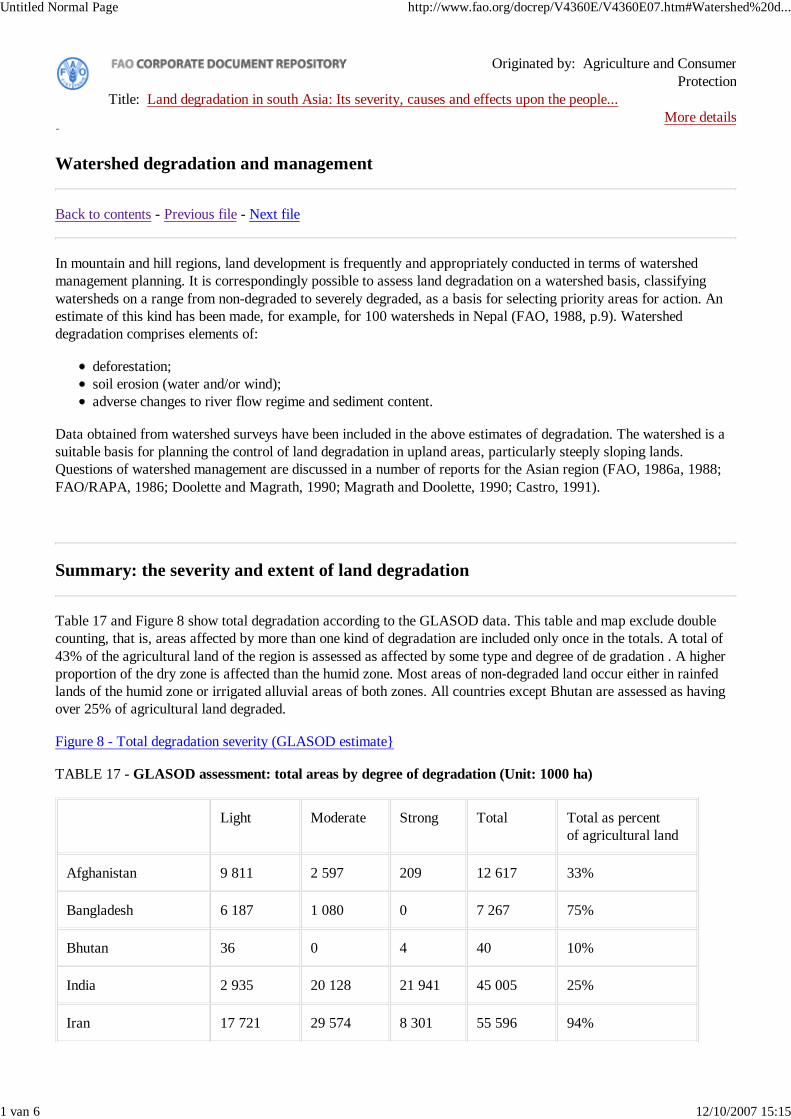
Untitled Normal Page http://www.fao.org/docrep/V4360E/V4360E07.htm#Watershed%20d...
1 van 6 12/10/2007 15:15
Watershed degradation and management
Back to contents - Previous file - Next file
In mountain and hill regions, land development is frequently and appropriately conducted in terms of watershedmanagement planning. It is correspondingly possible to assess land degradation on a watershed basis, classifyingwatersheds on a range from non-degraded to severely degraded, as a basis for selecting priority areas for action. Anestimate of this kind has been made, for example, for 100 watersheds in Nepal (FAO, 1988, p.9). Watersheddegradation comprises elements of:
deforestation; soil erosion (water and/or wind); adverse changes to river flow regime and sediment content.
Data obtained from watershed surveys have been included in the above estimates of degradation. The watershed is asuitable basis for planning the control of land degradation in upland areas, particularly steeply sloping lands.Questions of watershed management are discussed in a number of reports for the Asian region (FAO, 1986a, 1988;FAO/RAPA, 1986; Doolette and Magrath, 1990; Magrath and Doolette, 1990; Castro, 1991).
Summary: the severity and extent of land degradation
Table 17 and Figure 8 show total degradation according to the GLASOD data. This table and map exclude doublecounting, that is, areas affected by more than one kind of degradation are included only once in the totals. A total of43% of the agricultural land of the region is assessed as affected by some type and degree of de gradation . A higherproportion of the dry zone is affected than the humid zone. Most areas of non-degraded land occur either in rainfedlands of the humid zone or irrigated alluvial areas of both zones. All countries except Bhutan are assessed as havingover 25% of agricultural land degraded.
Figure 8 - Total degradation severity (GLASOD estimate}
TABLE 17 - GLASOD assessment: total areas by degree of degradation (Unit: 1000 ha)
Light Moderate Strong Total Total as percentof agricultural land
Afghanistan 9 811 2 597 209 12 617 33%
Bangladesh 6 187 1 080 0 7 267 75%
Bhutan 36 0 4 40 10%
India 2 935 20 128 21 941 45 005 25%
Iran 17 721 29 574 8 301 55 596 94%
Originated by: Agriculture and ConsumerProtection
Title: Land degradation in south Asia: Its severity, causes and effects upon the people... More details
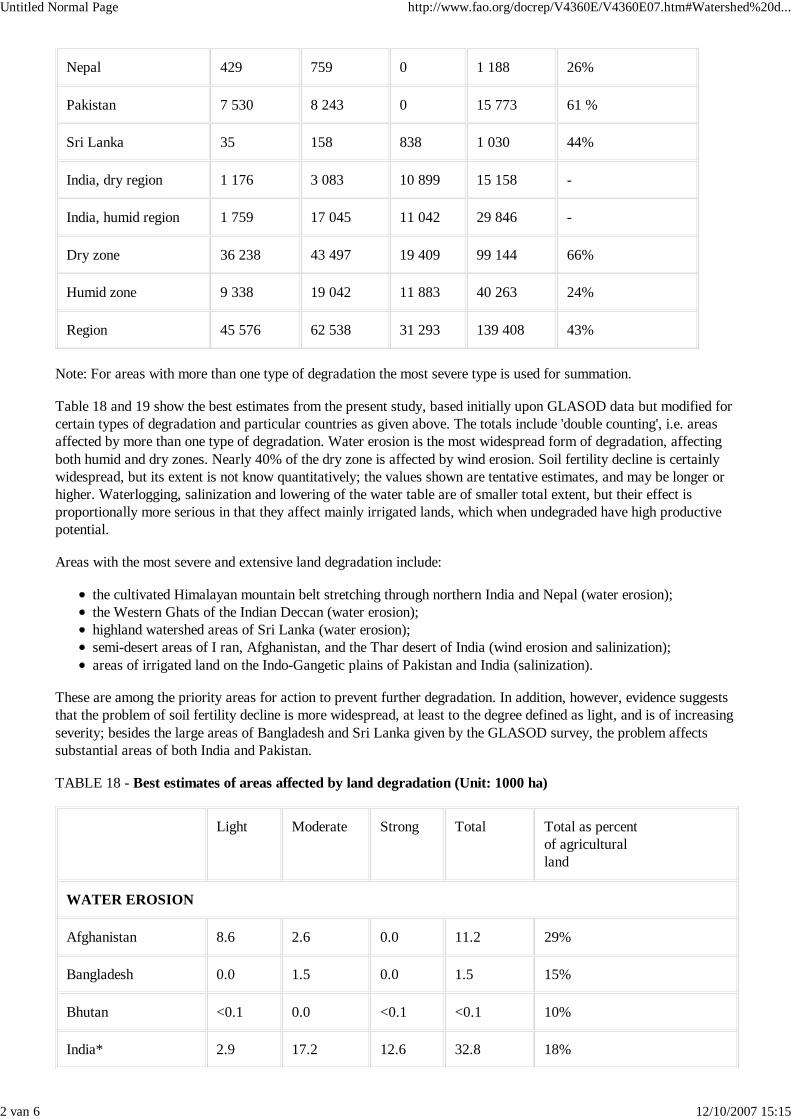
Untitled Normal Page http://www.fao.org/docrep/V4360E/V4360E07.htm#Watershed%20d...
2 van 6 12/10/2007 15:15
Nepal 429 759 0 1 188 26%
Pakistan 7 530 8 243 0 15 773 61 %
Sri Lanka 35 158 838 1 030 44%
India, dry region 1 176 3 083 10 899 15 158 -
India, humid region 1 759 17 045 11 042 29 846 -
Dry zone 36 238 43 497 19 409 99 144 66%
Humid zone 9 338 19 042 11 883 40 263 24%
Region 45 576 62 538 31 293 139 408 43%
Note: For areas with more than one type of degradation the most severe type is used for summation.
Table 18 and 19 show the best estimates from the present study, based initially upon GLASOD data but modified forcertain types of degradation and particular countries as given above. The totals include 'double counting', i.e. areasaffected by more than one type of degradation. Water erosion is the most widespread form of degradation, affectingboth humid and dry zones. Nearly 40% of the dry zone is affected by wind erosion. Soil fertility decline is certainlywidespread, but its extent is not know quantitatively; the values shown are tentative estimates, and may be longer orhigher. Waterlogging, salinization and lowering of the water table are of smaller total extent, but their effect isproportionally more serious in that they affect mainly irrigated lands, which when undegraded have high productivepotential.
Areas with the most severe and extensive land degradation include:
the cultivated Himalayan mountain belt stretching through northern India and Nepal (water erosion);the Western Ghats of the Indian Deccan (water erosion);highland watershed areas of Sri Lanka (water erosion);semi-desert areas of I ran, Afghanistan, and the Thar desert of India (wind erosion and salinization);areas of irrigated land on the Indo-Gangetic plains of Pakistan and India (salinization).
These are among the priority areas for action to prevent further degradation. In addition, however, evidence suggeststhat the problem of soil fertility decline is more widespread, at least to the degree defined as light, and is of increasingseverity; besides the large areas of Bangladesh and Sri Lanka given by the GLASOD survey, the problem affectssubstantial areas of both India and Pakistan.
TABLE 18 - Best estimates of areas affected by land degradation (Unit: 1000 ha)
Light Moderate Strong Total Total as percentof agriculturalland
WATER EROSION
Afghanistan 8.6 2.6 0.0 11.2 29%
Bangladesh 0.0 1.5 0.0 1.5 15%
Bhutan <0.1 0.0 <0.1 <0.1 10%
India* 2.9 17.2 12.6 32.8 18%
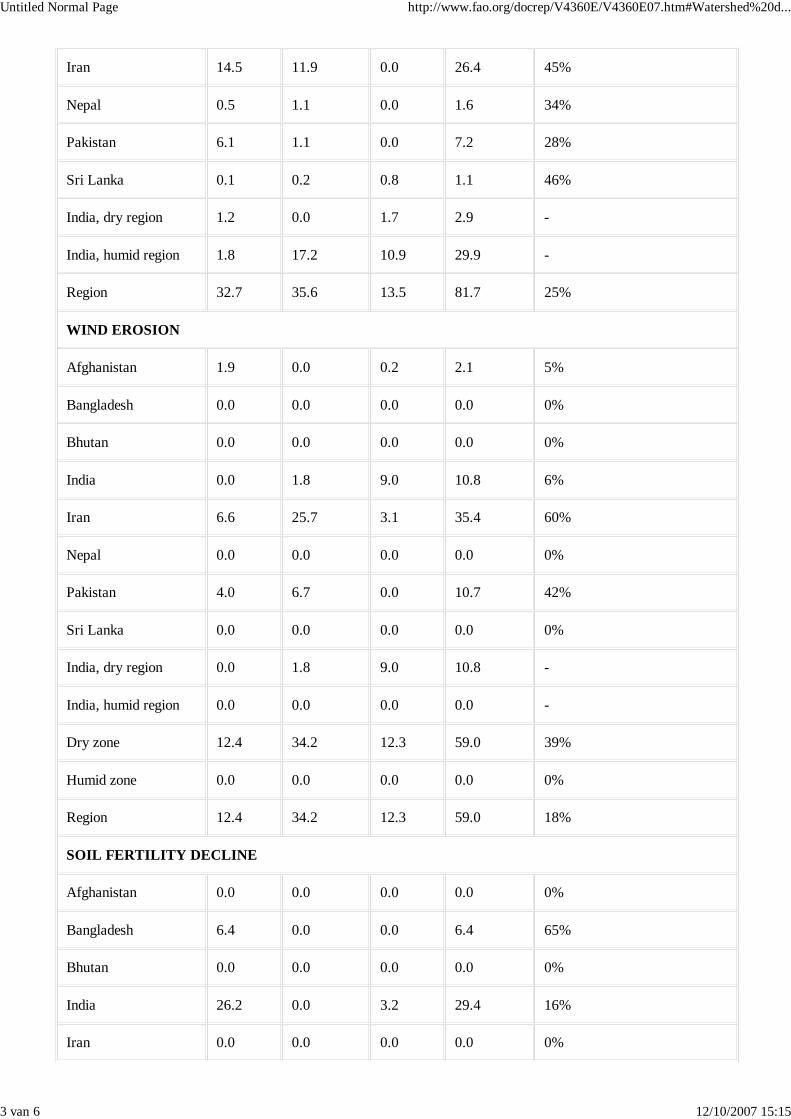
Untitled Normal Page http://www.fao.org/docrep/V4360E/V4360E07.htm#Watershed%20d...
3 van 6 12/10/2007 15:15
Iran 14.5 11.9 0.0 26.4 45%
Nepal 0.5 1.1 0.0 1.6 34%
Pakistan 6.1 1.1 0.0 7.2 28%
Sri Lanka 0.1 0.2 0.8 1.1 46%
India, dry region 1.2 0.0 1.7 2.9 -
India, humid region 1.8 17.2 10.9 29.9 -
Region 32.7 35.6 13.5 81.7 25%
WIND EROSION
Afghanistan 1.9 0.0 0.2 2.1 5%
Bangladesh 0.0 0.0 0.0 0.0 0%
Bhutan 0.0 0.0 0.0 0.0 0%
India 0.0 1.8 9.0 10.8 6%
Iran 6.6 25.7 3.1 35.4 60%
Nepal 0.0 0.0 0.0 0.0 0%
Pakistan 4.0 6.7 0.0 10.7 42%
Sri Lanka 0.0 0.0 0.0 0.0 0%
India, dry region 0.0 1.8 9.0 10.8 -
India, humid region 0.0 0.0 0.0 0.0 -
Dry zone 12.4 34.2 12.3 59.0 39%
Humid zone 0.0 0.0 0.0 0.0 0%
Region 12.4 34.2 12.3 59.0 18%
SOIL FERTILITY DECLINE
Afghanistan 0.0 0.0 0.0 0.0 0%
Bangladesh 6.4 0.0 0.0 6.4 65%
Bhutan 0.0 0.0 0.0 0.0 0%
India 26.2 0.0 3.2 29.4 16%
Iran 0.0 0.0 0.0 0.0 0%
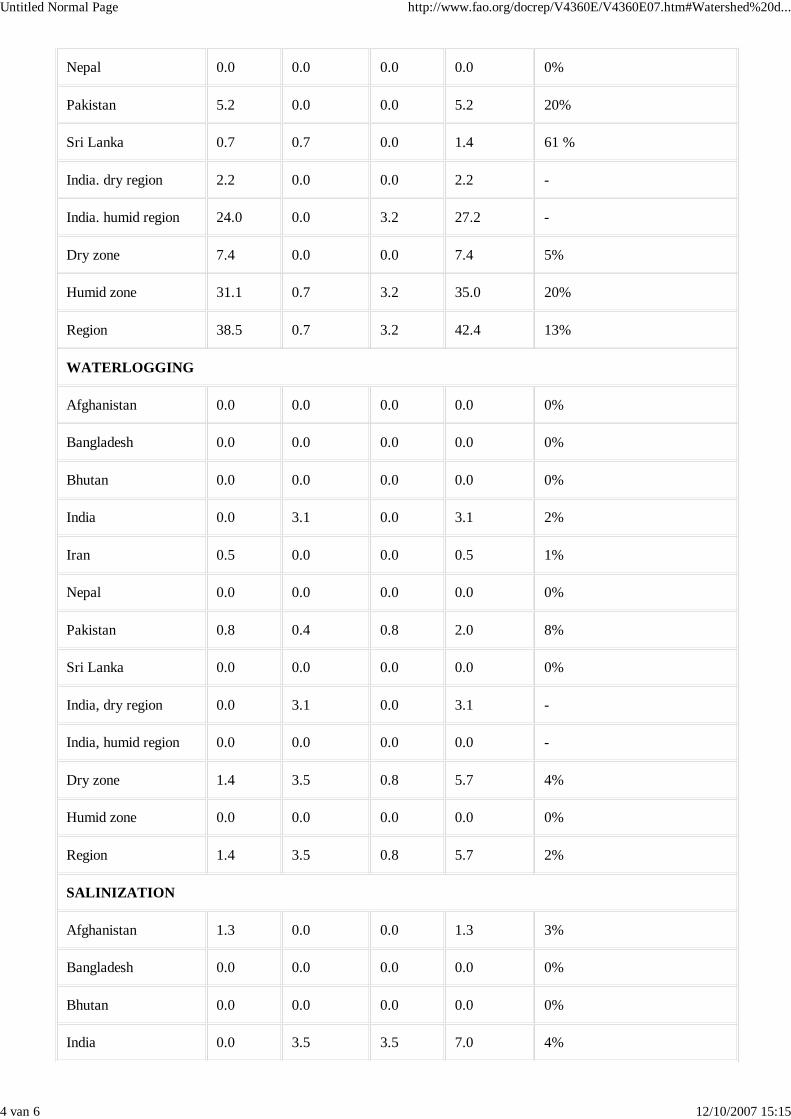
Untitled Normal Page http://www.fao.org/docrep/V4360E/V4360E07.htm#Watershed%20d...
4 van 6 12/10/2007 15:15
Nepal 0.0 0.0 0.0 0.0 0%
Pakistan 5.2 0.0 0.0 5.2 20%
Sri Lanka 0.7 0.7 0.0 1.4 61 %
India. dry region 2.2 0.0 0.0 2.2 -
India. humid region 24.0 0.0 3.2 27.2 -
Dry zone 7.4 0.0 0.0 7.4 5%
Humid zone 31.1 0.7 3.2 35.0 20%
Region 38.5 0.7 3.2 42.4 13%
WATERLOGGING
Afghanistan 0.0 0.0 0.0 0.0 0%
Bangladesh 0.0 0.0 0.0 0.0 0%
Bhutan 0.0 0.0 0.0 0.0 0%
India 0.0 3.1 0.0 3.1 2%
Iran 0.5 0.0 0.0 0.5 1%
Nepal 0.0 0.0 0.0 0.0 0%
Pakistan 0.8 0.4 0.8 2.0 8%
Sri Lanka 0.0 0.0 0.0 0.0 0%
India, dry region 0.0 3.1 0.0 3.1 -
India, humid region 0.0 0.0 0.0 0.0 -
Dry zone 1.4 3.5 0.8 5.7 4%
Humid zone 0.0 0.0 0.0 0.0 0%
Region 1.4 3.5 0.8 5.7 2%
SALINIZATION
Afghanistan 1.3 0.0 0.0 1.3 3%
Bangladesh 0.0 0.0 0.0 0.0 0%
Bhutan 0.0 0.0 0.0 0.0 0%
India 0.0 3.5 3.5 7.0 4%
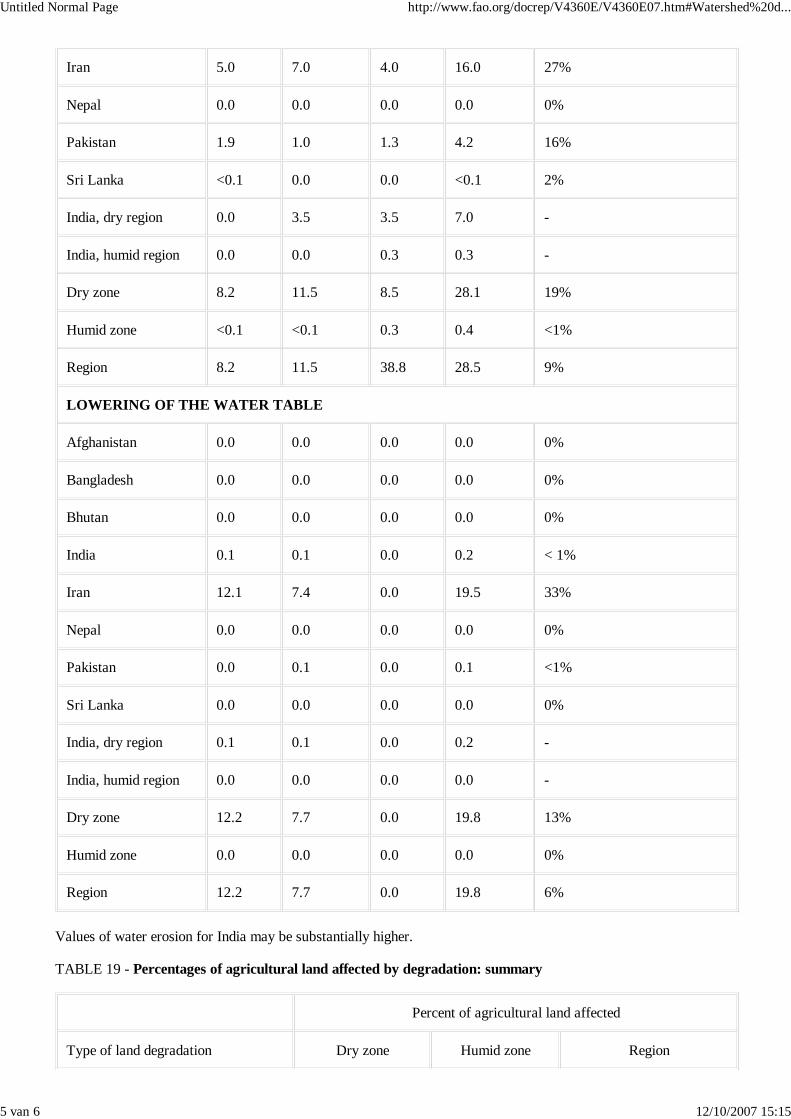
Untitled Normal Page http://www.fao.org/docrep/V4360E/V4360E07.htm#Watershed%20d...
5 van 6 12/10/2007 15:15
Iran 5.0 7.0 4.0 16.0 27%
Nepal 0.0 0.0 0.0 0.0 0%
Pakistan 1.9 1.0 1.3 4.2 16%
Sri Lanka <0.1 0.0 0.0 <0.1 2%
India, dry region 0.0 3.5 3.5 7.0 -
India, humid region 0.0 0.0 0.3 0.3 -
Dry zone 8.2 11.5 8.5 28.1 19%
Humid zone <0.1 <0.1 0.3 0.4 <1%
Region 8.2 11.5 38.8 28.5 9%
LOWERING OF THE WATER TABLE
Afghanistan 0.0 0.0 0.0 0.0 0%
Bangladesh 0.0 0.0 0.0 0.0 0%
Bhutan 0.0 0.0 0.0 0.0 0%
India 0.1 0.1 0.0 0.2 < 1%
Iran 12.1 7.4 0.0 19.5 33%
Nepal 0.0 0.0 0.0 0.0 0%
Pakistan 0.0 0.1 0.0 0.1 <1%
Sri Lanka 0.0 0.0 0.0 0.0 0%
India, dry region 0.1 0.1 0.0 0.2 -
India, humid region 0.0 0.0 0.0 0.0 -
Dry zone 12.2 7.7 0.0 19.8 13%
Humid zone 0.0 0.0 0.0 0.0 0%
Region 12.2 7.7 0.0 19.8 6%
Values of water erosion for India may be substantially higher.
TABLE 19 - Percentages of agricultural land affected by degradation: summary
Percent of agricultural land affected
Type of land degradation Dry zone Humid zone Region
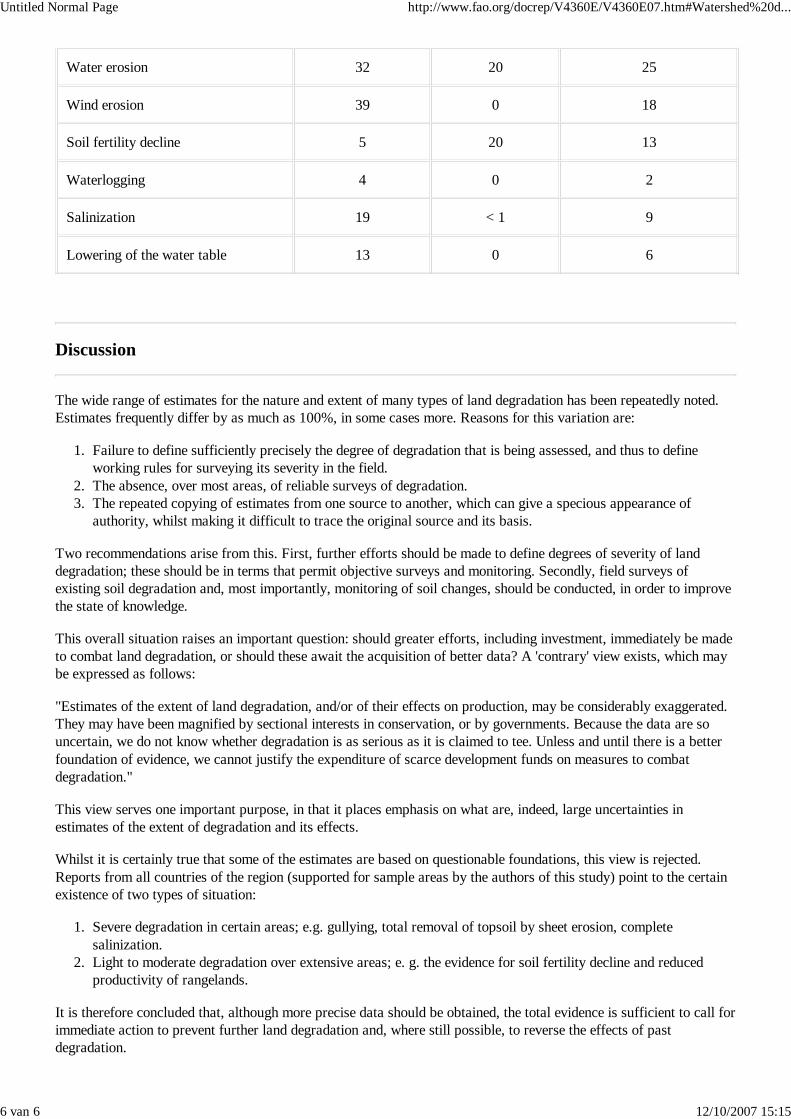
Untitled Normal Page http://www.fao.org/docrep/V4360E/V4360E07.htm#Watershed%20d...
6 van 6 12/10/2007 15:15
Water erosion 32 20 25
Wind erosion 39 0 18
Soil fertility decline 5 20 13
Waterlogging 4 0 2
Salinization 19 < 1 9
Lowering of the water table 13 0 6
Discussion
The wide range of estimates for the nature and extent of many types of land degradation has been repeatedly noted.Estimates frequently differ by as much as 100%, in some cases more. Reasons for this variation are:
Failure to define sufficiently precisely the degree of degradation that is being assessed, and thus to defineworking rules for surveying its severity in the field.
1.
The absence, over most areas, of reliable surveys of degradation.2.The repeated copying of estimates from one source to another, which can give a specious appearance ofauthority, whilst making it difficult to trace the original source and its basis.
3.
Two recommendations arise from this. First, further efforts should be made to define degrees of severity of landdegradation; these should be in terms that permit objective surveys and monitoring. Secondly, field surveys ofexisting soil degradation and, most importantly, monitoring of soil changes, should be conducted, in order to improvethe state of knowledge.
This overall situation raises an important question: should greater efforts, including investment, immediately be madeto combat land degradation, or should these await the acquisition of better data? A 'contrary' view exists, which maybe expressed as follows:
"Estimates of the extent of land degradation, and/or of their effects on production, may be considerably exaggerated.They may have been magnified by sectional interests in conservation, or by governments. Because the data are souncertain, we do not know whether degradation is as serious as it is claimed to tee. Unless and until there is a betterfoundation of evidence, we cannot justify the expenditure of scarce development funds on measures to combatdegradation."
This view serves one important purpose, in that it places emphasis on what are, indeed, large uncertainties inestimates of the extent of degradation and its effects.
Whilst it is certainly true that some of the estimates are based on questionable foundations, this view is rejected.Reports from all countries of the region (supported for sample areas by the authors of this study) point to the certainexistence of two types of situation:
Severe degradation in certain areas; e.g. gullying, total removal of topsoil by sheet erosion, completesalinization.
1.
Light to moderate degradation over extensive areas; e. g. the evidence for soil fertility decline and reducedproductivity of rangelands.
2.
It is therefore concluded that, although more precise data should be obtained, the total evidence is sufficient to call forimmediate action to prevent further land degradation and, where still possible, to reverse the effects of pastdegradation.
Untitled Normal Page http://www.fao.org/docrep/V4360E/V4360E08.htm#Chapter%206%...
1 van 7 12/10/2007 15:15
Chapter 6 - Causes of land degradation
Back to contents - Previous file - Next file
Natural degradation hazardsDirect causes of degradationUnderlying causes of degradationLand, population, poverty and degradation: the causal nexus
The causes of land degradation can be divided into natural hazards, direct causes, and underlying causes. Naturalhazards are the conditions of the physical environment which lead to the existence of a high degradation hazard, forexample steep slopes as a hazard for water erosion. Direct causes are unsuitable land use and inappropriate landmanagement practices, for example the cultivation of steep slopes without measures for soil conservation. Underlyingcauses are the reasons why these inappropriate types of land use and management are practised; for example, theslopes may be cultivated because the landless poor need food, and conservation measures not adopted because thesefarmers lack security of tenure.
There is a distinction, although with overlap, between unsuitable land use and inappropriate land managementpractices.
Unsuitable land use is the use of land for purposes for which it is environmentally unsuited for sustainable use. Anexample is forest clearance and arable use of steeply sloping upper watershed areas which would have more value tothe community as water sources, managed under a protective forest cover.
Inappropriate land management practices refer to the use of land in ways which could be sustainable if properlymanaged, but where the necessary practices are not adopted. An example is the failure to adopt soil conservationmeasures where these are needed. It can also refer to land use which is ecologically sustainable under low intensity ofuse but in which the management becomes inappropriate at higher intensifies. Examples are shifting cultivation andthe grazing of semi-arid rangelands.
The GLASOD assessment gives one or two causes for each map unit and type of degradation. In this assessment,only four causes were recognized, defined as:
de fore station and removal of natural vegetation;overgrazing; agricultural activities; over-exploitation of vegetation for domestic use.
This survey did not recognize a separate class of problems arising in the planning and management of irrigation, butit is clear from the results that such problems are included under agricultural activities.
The results from the GLASOD assessment of causes is summarized in Table 20. Other information on causes is frompublications and persona! information.
TABLE 20 - Causes of degradation as given in the GLASOD assessment
Type of degradation Percentage area of degradation type caused by
Originated by: Agriculture and ConsumerProtection
Title: Land degradation in south Asia: Its severity, causes and effects upon the people... More details
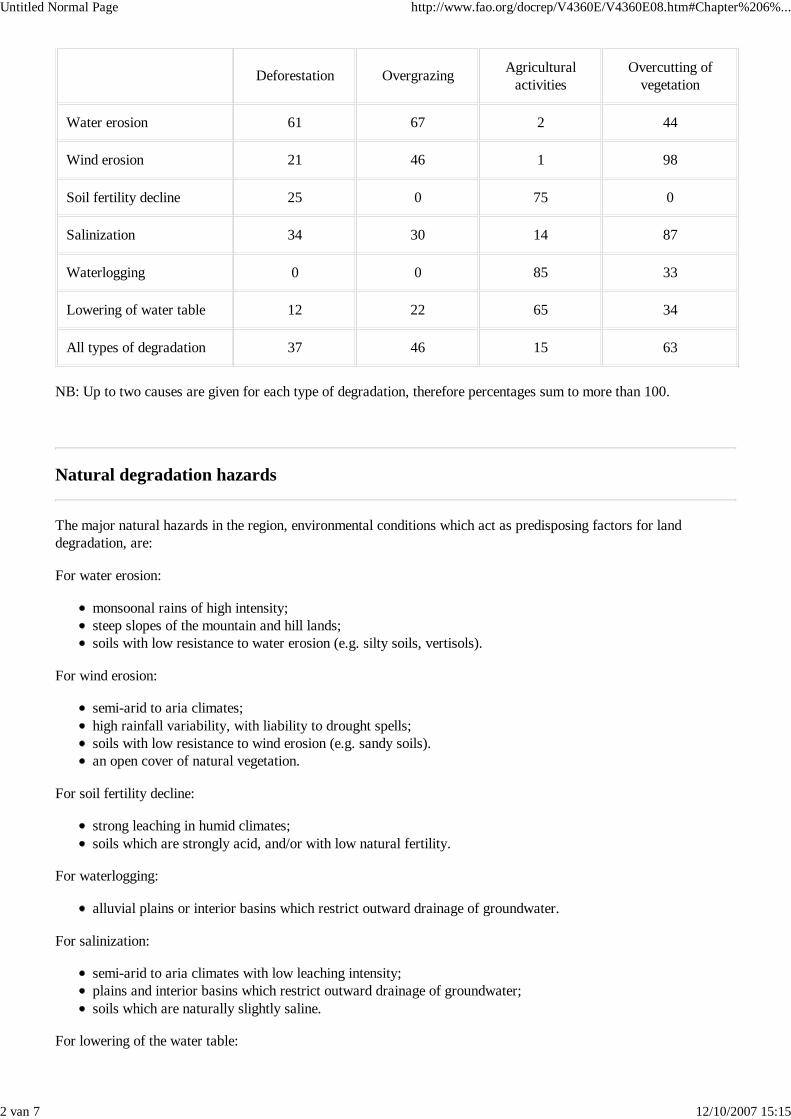
Untitled Normal Page http://www.fao.org/docrep/V4360E/V4360E08.htm#Chapter%206%...
2 van 7 12/10/2007 15:15
Deforestation OvergrazingAgricultural
activitiesOvercutting of
vegetation
Water erosion 61 67 2 44
Wind erosion 21 46 1 98
Soil fertility decline 25 0 75 0
Salinization 34 30 14 87
Waterlogging 0 0 85 33
Lowering of water table 12 22 65 34
All types of degradation 37 46 15 63
NB: Up to two causes are given for each type of degradation, therefore percentages sum to more than 100.
Natural degradation hazards
The major natural hazards in the region, environmental conditions which act as predisposing factors for landdegradation, are:
For water erosion:
monsoonal rains of high intensity;steep slopes of the mountain and hill lands;soils with low resistance to water erosion (e.g. silty soils, vertisols).
For wind erosion:
semi-arid to aria climates; high rainfall variability, with liability to drought spells;soils with low resistance to wind erosion (e.g. sandy soils).an open cover of natural vegetation.
For soil fertility decline:
strong leaching in humid climates;soils which are strongly acid, and/or with low natural fertility.
For waterlogging:
alluvial plains or interior basins which restrict outward drainage of groundwater.
For salinization:
semi-arid to aria climates with low leaching intensity;plains and interior basins which restrict outward drainage of groundwater;soils which are naturally slightly saline.
For lowering of the water table:
Untitled Normal Page http://www.fao.org/docrep/V4360E/V4360E08.htm#Chapter%206%...
3 van 7 12/10/2007 15:15
semi-arid to aria climates with low rates of groundwater recharge.
In some cases, these natural hazards are of sufficient intensity to give rise to unproductive land without humaninterference. Examples are the naturally saline soils which occur in some interior basins of dry regions, or areas ofnatural gullying ('badlands'). Such conditions have been referred to as problem soils. Percentages of land covered byproblem soils are given in Dent (1990).
With respect to land degradation, the key feature is that land shortage in the region has led to the widespreadagricultural use of areas with natural hazards. These are the passive, or predisposing, conditions for landdegradation. Problem soils require special care in management, and failure to give such care leads to landdegradation.
Direct causes of degradation
Deforestation of unsuitable land Deforestation is both a type of degradation as such, and also a cause of othertypes, principally water erosion. Deforestation in itself is not necessarily degrading without it, most productiveagricultural lands (in the temperate zone as well as the tropics) would not be available. Deforestation becomes acause of degradation first, when the land that is cleared is steeply sloping, or has shallow or easily erodible soils; andsecondly, where the clearance is not followed by good management.
The extent of deforestation considered as a type of degradation has been summarized in Chapter 5, SectionDeforestation and forest degradation. It is the leading cause of water erosion in steeply sloping humid environments.It is also a contributory cause of wind erosion, soil fertility decline and salinization.
Overcutting of vegetation Rural people cut natural forests, woodlands and shrublands to obtain timber, fuelwoodand other forest products. Such cutting becomes unsustainable where it exceeds the rate of natural regrowth. This hashappened widely in semi-arid environments, where fuelwood shortages are often severe. Impoverishment of thenatural woody cover of trees and shrubs is a major factor in causing both water erosion and wind erosion. In theGLASOD assessment it is cited as a cause for 98% of the area affected by wind erosion. This assessment also cites itas a contributory cause to salinization.
Shifting cultivation without adequate fallow periods In the past, shifting cultivation was a sustainable form of landuse, at a time when low population densities allowed forest fallow periods of sufficient length to restore soilproperties. Population increase and enforced shortening of fallow periods has led to it becoming non-sustainable.Shifting cultivation is found in the hill areas of northeast India, where it is a cause of water erosion and soil fertilitydecline.
Overgrazing. Overgrazing is the grazing of natural pastures at stocking intensifies above the livestock carryingcapacity. It leads directly to decreases in the quantity and quality of the vegetation cover. This is a leading cause notonly of wind erosion, but also of water erosion in dry lands. Both degradation of the vegetation cover and erosion leadto a decline in soil organic master and physical properties, and hence in resistance to erosion.
Intense grazing at the end of the annual dry season, and during periods of drought, does not necessarily lead todegradation; the vegetation may recover during the succeeding rains. Degradation occurs when the recovery ofvegetation and soil properties during periods of normal rainfall does not reach its previous statue.
Non-adoption of soil-conservation management practices Under arable use, management practices are needed tocheck water erosion on all sloping lands. In dry lands, measures to check wind erosion are necessary also on leverland. Soil conserving management practices may be grouped into:
Biological methods: maintenance of a "round surface cover, of living plants or plant litter; vegetative barriers,including both contour hedgerows and grass strips; and windbreaks and shelterbelts.Earth structures: terraces, and the various forms of bank-and ditch structures (bunds, storm drains, etc.).Maintaining soil resistance to erosion: primarily, maintenance of soil organic master and thereby aggregationand structure.
Untitled Normal Page http://www.fao.org/docrep/V4360E/V4360E08.htm#Chapter%206%...
4 van 7 12/10/2007 15:15
Great efforts have been made by soil conservation services in the countries of the region to promote the adoption ofsuch management practices. In some areas, these efforts have achieved a considerable measure of success. In others,staff and resources have been greatly deficient, or adoption of recommended methods poor. The recent change ofemphasis in soil conservation with more use of biological methods, including agroforestry, and greater stress onfarmers' participation and economic incentives, has not yet been fully taken up by extension services.
Often, it is not the environment nor the type of land use which necessarily leads to degradation, but the standard ofmanagement. A clear example is seen in tee production in the hill lands of Sri Lanka. Well-managed farms maintain acomplete vegetation cover, which checks erosion even on steep slopes; on poorly-managed farms, rainfall strikes baresoil between plants, leading in places to very severe degradation.
Extension of cultivation onto lands of longer potentiel and/or high natural hazards These are also called 'fragile'or marginal lands. Historically the more fertile, or high-potential, agricultural lands were the first to be occupied.Population increase has led to the widespread use of lands of longer potential, those which are less fertile or havegreater degradation hazards. Such marginal lands include:
steeply sloping land;areas of shallow or sandy soils, or with laterite crusts;cultivation of semi-arid lands, and grazing of the crier semi-arid areas, marginal to deserts.
Such land is of great extent in the region, and makes a large contribution to its agricultural production. Except inareas of highest environmental hazards, e.g. upper watersheds, it is neither desirable nor practicable that they shouldbe taken out of production. What must be recognized is that such lands require higher standards of management iftheir resources are to be conserved. Unfortunately, they are often utilized by poorer farmers.
Improper crop rotations As a result of population growth, land shortage and economic pressures, farmers in someareas have adopted cereal-based, intensive crop rotations, based particularly on rice and wheat, in place of the morebalanced cereal-legume rotations that were formerly found. This is a contributory cause of soil fertility decline.
Unbalanced fertilizer use Where soil fertility has declined, as a result of prolonged cultivation or erosion, farmersattempt to maintain crop yields. The primary method available for doing so is application of fertilizer. In the shortterm, a yield response is most readily and cheaply obtained from nitrogenous fertilizer. There has been a steadyincrease in the ratios of nitrogen to phosphorus, and nitrogen to all other nutrients, in the region. Where phosphatedeficiencies have been recognized and counteracted by phosphatic fertilizer, deficiencies of other nutrients, includingsulphur and zinc, have been reported.
The short-term measure of combatting fertility decline by application only of macronutrients, and particularlynitrogenous fertilizer, is leading to a greater problem of nutrient imbalance in the medium term. Among theconsequences is likely to be longer yield responses to fertilizers.
Problems arising from planning and management of canal irrigation The development of salinization andwaterlogging on the large-scale canal irrigation schemes of the Indo-Gangetic plains has been frequently described.Application of water in excess of natural rainfall led to a progressive rise in the water table from the 1930s onward.Where the water table has reached close to the surface, waterlogging occurs leading, through evaporation of watercontaining salts, to salinization. Sodification follows where sodium replaces other bases in the soil exchange complex.The problem could have been avoided, or reduced, if deep drains had been included in the initial implementation ofirrigation schemes. More detailed accounts of the complex processes involved will be found in development planningstudies of Pakistan and Indian irrigated areas.
Overpumping of groundwater In areas of non-saline ('sweet') groundwater, the technology of tubewells has led toabstraction of water in excess of natural recharge by rainfall and river seepage. This has progressively lowered thewater table, as in Iran, India and Pakistan.
Underlying causes of degradation
Untitled Normal Page http://www.fao.org/docrep/V4360E/V4360E08.htm#Chapter%206%...
5 van 7 12/10/2007 15:15
There are more basic reasons underlying the reasons for land degradation outlined above. They apply to all directcauses, other than the problems of large-scale irrigation schemes which arose from lack of foresight in planning andmanagement.
Land shortage It has always been recognized that land is a finite resource, but only recently has the full impact ofthis fact occurred. In earlier times, food shortage or poverty could be combatted by taking new, unused, land intocultivation. Over most of South Asia, this solution is no longer available. The percentage change in agricultural landover the ten years 1980-1990 is under 2.5% for India, Pakistan, Sri Lanka and Afghanistan, whilst for Bangladeshthere has been a small absolute decrease. The increase recorded for Nepal has certainly been obtained bydeforestation and taking into agricultural use sloping land which is difficult to farm on a sustainable basis.
When combined with increases in rural population, land shortage has led to decreases in the already small areas ofagricultural land per person in six of the eight countries, including all in the humid zone. The relative decrease in landper person over 1980-90 was 14% for India and 22% for Pakistan. In Iran, with a smaller rural population increase,the land/people ratio has remained virtually constant.
There is almost no unused but usable land in South Asia. All of the best land is already taken up, and that which isnot, cannot be used agriculturally on a sustainable basis.
Land tenure: tenancy and open access resources Farmers will be reluctant to invest in measures to conserve landresources if their future rights to use these resources are not secure. Two kinds of property rights lead to thissituation, tenancy and open access resources.
Despite efforts by legislation and land reform programmes over many years, tenant occupation of farmland is stillvery widespread. The landowner is now frequently from the cities, and the land is farmed by tenants paying someform of rental. Relations between landlord and tenant are often good, and the tenant in fact remains on the same farmfor many years. However, such tenants lack the incentive to maintain the land in good condition, being interestedmainly in the immediate harvest.
Open access land resources are those which anyone, in practice the poor and otherwise landless, can use, withoutrights of continuing usufruct or tenure. This applies mainly to forest lands, nominally under government ownershipbut which are settled on a squatter basis.
There is a distinction between common property and open access resources. In common property resources, use isrestricted to members of a community, village or clan, and is subject to constraints, socially applied. For example,pastoralists often have customs for when certain areas must be rested from grazing, villages restrict the cutting ofcommunal woodland. On open access land there are no such constraints. With no legal basis to their use, incentive tofarm the land other than for immediate needs is completely lacking. This is a serious cause of deforestation followedby water erosion.
Economic pressures and attitudes Small land holdings lead to severe economic pressures on farmers, to obtainsufficient food and income to meet immediate needs. Because of such pressure in the short term, labour, land andcapital resources cannot be spared to care for the land, for example green manuring or soil conservation structures.This is also the underlying reason for two other direct causes noted above, improper crop rotations and unbalancedfertilizer use.
A contributory factor, not always appreciated by outside observers, is a change in economic attitudes. In formertimes, most farmers accepted the situation into which they were bore, even if it was one of relative poverty. Modemcommunications and influence have led to greater aspirations and consequent requirements for income, thusincreasing economic pressures.
Poverty Countries of the region have made great progress in economic development, achieving increases in grossdomestic product per capita. It is questionable whether there have been corresponding improvements in the realwelfare of the rural poor. The majority of farmers remain close to, or below, the margin of poverty, defined as accessto basic necessities of life.
Poverty leads to land degradation. It could almost certainly be shown that richer farmers maintain their soils in betterstate than poorer. Research based on sample studies to confirm this is desirable.
Untitled Normal Page http://www.fao.org/docrep/V4360E/V4360E08.htm#Chapter%206%...
6 van 7 12/10/2007 15:15
Population increase Together with land shortage, the second basic cause of degradation is the continuing increase inrural, agricultural, population. Growth rates for total population 19801990 for six countries range from 2.1-3.6% peryear (for Afghanistan the figure is affected by migration and war). Only in Sri Lanka have attempts to reduce the rateof population increase made substantial progress, with a growth rate of 1.4%.
Urban populations are increasing faster than rural. The trend towards urbanization, however, is not sufficient toreverse the key that absolute levers of rural population have increased and are increasing. In Bangladesh, Bhutan,India, Nepal and Pakistan, rural populations were 17-32% higher in 1990 than in 1980. In absolute terms, the scale isgreatest in India, where already densely populated rural areas contained 79 million more people in 1990 than 10 yearsearlier.
Land, population, poverty and degradation: the causal nexus
The direct and indirect causes of degradation are linked by a chain of cause and effect, or causal nexus (Figure 9).
The two external, or driving, forces are limited land resources and increase in rural population. Expressed anotherway, there are no longer substantial areas of usable, unused land in the region; but the number of people to besupported from this finite land resource is increasing every year.
These two primary forces combine to produce land shortage. This refers to increasing pressure of population on land,resulting in small farms, low production per person and increasing landlessness. A consequence of land shortage isthe next element, poverty.
Land shortage and poverty, taken together, lead to non-sustainable land management practices, meaning the directcauses of degradation. For reasons outlined above, poor farmers are led to clear forest, cultivate steep slopes withoutconservation, overgraze rangelands, make unbalanced fertilizer applications, and the other causes noted above.
FIGURE 9 - Causal nexus between land, population, poverty and degradation
The non-sustainable management practices lead to land degradation. This leads to reduced land productivity: a lowerresponse to the same inputs or, where farmers possess the resources, a need for higher inputs to maintain crop yieldsand farm incomes. This has the effect of increasing land shortage, thus completing the cycle.
Case studies illustrating the interconnections of this cycle are given in Asian Development Bank (1991).
There are two ways to check this cycle, improved technology and reduction in population increase. Improvedtechnology could be added as a third external force in Figure 1, divided into three elements:
land improvements (e.g. irrigation), which can reduce land shortage;increases in productive technology, which can reduce poverty and pressure upon land;better land resource conservation, which can reduce land degradation and, to a limited degree, reversedegradation.
Vast efforts have been made, by individual farmers, national governments and through international developmentassistance, to counteract the cycle of poverty and land degradation by research and development of improvedtechnology. Much success has been achieved, as in the spread of high-yielding crop varieties and use of fertilizerswhich was (optimistically) called the 'green revolution'.
All of this effort will be nullified, and in places reversed, if it is not accompanied by a reduction in rate of growth ofpopulation. The existence of limited land resources cannot be substantially changed. The other external force,increase in population, constantly drives the cycle that leads to poverty and land degradation.
Governments of the region, as well as international agencies, recognize the priority of limiting increase in population,as evidenced by reports. There is also the beginning of an awareness that population questions cannot be treated inisolation, but must be linked with sustainable land development. What is significant is that recognition of the nexus isfound not just among land resource institutions or Ministries of Agriculture, but widely within Asian development
Untitled Normal Page http://www.fao.org/docrep/V4360E/V4360E08.htm#Chapter%206%...
7 van 7 12/10/2007 15:15
agencies, as illustrated by the following quotations:
"It is population growth working in conjunction with other factors that is bringing about widespread environmentaldeterioration" (FAO/RAPA, 1990, p.10).
"Population issues currently encompass areas of concern such as poverty alleviation, environmentaldegradation...which are much broader than population size and growth alone" (ESCAP, 1991a, para. 529).
"Few institutions have developed a response strategy to the implications of population pressure on natural resourcemanagement" (Asian Development Bank, 1991, p.21).
"A significant reduction in population growth rates is absolutely essential for visible improvements in humandevelopment levers " (Asia Development Bank, 1990, p.48).
"Hypothetical village-lever consequences of rapid population growth...1. Environmental degradation: soilerosion/exhaustion, reduced fallow periods, movement to marginal farmlands, deforestation" (ESCAP, 1989, p.90).
Two views from outside the region may be added, from the most recent FAO and World Bank reviews:
"A lack of control over resources; population growth; a lack of alternative avenues of livelihood; and inequity are allcontributing to the degradation of the regions's [Asia] resources. In turn, environmental degradation perpetuatespoverty, as the poorest attempt to survive on a diminishing resource base" (FAO, 1992, p. 106).
"The close link between poverty and environmental problems makes a compelling case for increasing assistance toreduce poverty and [to] slow population growth...Rapid population growth can exacerbate the mutually reinforcingeffects of poverty and environmental damage. The poor are both victims and agents of environmental damage"(World Bank, 1992, pp. 3 and 7).
Statements recognizing the need to reduce population for the welfare of their people have been made by allgovernments of the region (e . g. ESCAP, 1987a) . In a regional study of natural disasters and protection of theenvironment, a summary table gives among causes of environmental problems, "population" for five of the six SouthAsian countries and "poverty" for four countries (SAARC, 1992, pp. 190-197).
Untitled Normal Page http://www.fao.org/docrep/V4360E/V4360E09.htm#Chapter%207%...
1 van 10 12/10/2007 15:15
Chapter 7 - Economic consequences of land degradation
Back to contents - Previous file - Next file
Introduction: economic and social consequencesEconomic valuation of natural resources and degradationLand degradation in South Asia: the orders of magnitude of the economic costsMacroeconomic impact of land degradation
Introduction: economic and social consequences
Chapters 7 and 8 are concerned with the economic and social consequences of land degradation: its implications forthe community as a whole, and thus for governments, and its effects upon the people, the rural population of the areasaffected. One of the main social consequences is, in fact, also an economic one, namely reduced income for thefarmers; whilst analysis at the macroeconomic lever is ultimately based upon aggregating the effects of degradationupon individual farmers.
This chapter covers the economic consequences of land degradation considered at the national and regional lever: itscost to the countries and their people. The effects on the rural population, including reduced incomes, are discussed inChapter 8.
Economic valuation of natural resources and degradation
Concepts and approaches in natural resource accounting
Natural resource accounting is a relatively new concept. Its implications for land degradation are so great that anintroductory outline of the concept and methods is called for.
The basis is simple: that natural resources, such as minerals, soils and forests, have an economic value. This is callednatural capital, to be distinguished from manufactured capital such as roads, factories and machinery. Changes inmanufactured capital - construction and depreciation - have always been considered in both financial and economicanalysis. Until recently, changes in natural capital have not been given money values, nor included in cost-benefit andother forms of economic analysis. Changes in natural capital are not currently included in systems of nationalaccounting, although there is pressure for their inclusion.
Natural resources have formerly been priced only in terms of their cost of use: minerals were priced only at the costsof extracting them, forests at the logging costs. In the case of soils, these were treated as the 'land' factor in classicaleconomics, priced at the market value of farmland. In effect, the capital value of the resources themselves was pricedas zero. It was assumed that they were so abundant as to have no scarcity value.
This led to some gross distortions in the apparent creation of wealth. Minerals are extracted, or forests cut clown, andthe money received from their sale is treated as national income. The decrease in the reserves of minerals or area offorest does not appear in the accounts. Wealth appears to have been created, based on the 'free' natural resources.
The example of minerals refers to a non-renewable natural resource, that of forest to a renewable one. The situation
Originated by: Agriculture and ConsumerProtection
Title: Land degradation in south Asia: Its severity, causes and effects upon the people... More details
Untitled Normal Page http://www.fao.org/docrep/V4360E/V4360E09.htm#Chapter%207%...
2 van 10 12/10/2007 15:15
for soil and water resources is more complex. The milder forms of land degradation, for example soil nutrientdepletion, can be reversed by changes in management; the resource is renewable, and the degradation reversible. Inthe case of two severe forms of degradation, salinization and waterlogging, land productivity can be restored byreclamation, even where degradation has progressed to the point of total loss of production; the degradation isreversible, although at high costs, as shown by the SCARP projects of Pakistan. Soil degradation may be reversibleor irreversible, as discussed below.
In the case of soil erosion, some of the effects may appear to be reversible, through checking further erosion by soilconservation programmes and restoring lost nutrients and organic master. Where land has been lost by gullying, orsevere sheet erosion has removed the soil clown to a gravelly residue, degradation is clearly irreversible. It should benoted, however, that this applies also to any actual loss of soil material, or reduced profile depth, since the rate ofnatural soil formation is extremely slow on a human time scale.
Two recent case studies, in the Philippines and Indonesia, illustrate the orders of magnitude which may be involved.In the Philippines it has been estimated that there is an annual rate of natural resource depletion equivalent to 4% ofthe gross domestic product (World Bank, 1989; Cruz and Repetto, 1992). For Indonesia, inclusion of the loss oftimber, oil and soil resources had the effect of reducing gross domestic produce by about 20%, whilst gross domesticinvestment was reduced to low, and in one year negative, values. The annual depletion of soil fertility was calculatedas 4% of the value of crop production, or as large as the annual increase in production (Repetto et al., 1989; Magrathand Arens, 1989).
Discussions of methods of natural resource accounting, drawn upon as the basis for the present discussion, includeAhmad et al., (1989), Chisholm and Dumsday (1987), Lutz and El Serafy (1988), Pearce and Turner (1990), Peskin(1989), Pezzey (1992) and Southgate (1989). A report of a seminar specific to Asia is given in Sun (1989), and aconsideration of natural resource accounting for India by Parikh et al. (1992).
Methods for the valuation of soil resources
Soil resources have been valued chiefly as the basis for analyzing the economics of soil conservation projects (Bojö,1992; Magrath, 1989). There has also been extensive cost-benefit analysis of reclamation projects to countersalinization and waterlogging. Five methods are found:
Defensive expenditure This is the cost of preventing the land degradation by soil conservation works, drainagesystems on irrigation schemes, and similar preventative measures. These have both capital and recurrentelements of expenditure.
1.
Lost production This method is widely used, and has the advantage of being applicable to all types of landdegradation. Crop yields, or other output, are estimated for the non-degraded and degraded soil, and thenpriced. The difference measures the value of lost production. The two situations, with and without degradation,are assessed by normal methods of farm economics.
2.
Replacement cost Of necessity, farmers go to much effort to avoid losses in production. The principal meansopen to them is to increase fertilizer inputs in order to maintain yields. For the same yield lever, the additionalfertilizer needed is a measure of the cost of degradation. This can be treated by estimating the quantity ofnitrogen, phosphorus and potassium removed in eroded soil. The cost of degradation is valued at the cost ofreplacing these nutrients by fertilizer. An estimate on this basis has been made for Zambia (Stocking, 1986).
3.
User cost This refers to the proportion of profits which need to be reinvested in some other way, if the sameincome is to be maintained after the resource has been exhausted (Lutz and El Seraphy, 1988). For example,some of the profits from extracting oil could be invested in construction of wind power generators. Applied tosoils, it would mean that a proportion of the profits made from some exploitative, degrading, land use werereinvested in some other way, say in reclaiming coastal marshland.
4.
Restoration or reclamation This is the cost of restoring the soil to its former productive state. In the case ofsalinization and waterlogging practical means are known, such as drainage, leaching and gypsum application,and have been costed. For lowering of the water table, it would refer to the production foregone by notabstracting water until its former lever had been restored, but this is not a realistic proposition.
5.
For the case of soil erosion, restoration costs have been incompletely assessed in previous analyses. Suppose thatland has lost 5 cm topsoil. It is not sufficient to value the cost of installing soil conservation measures, followed byimproved land management, for one is still working with the depleted, shallower, soil. If the soil is to be restored toits former conditions then it is necessary to:
Untitled Normal Page http://www.fao.org/docrep/V4360E/V4360E09.htm#Chapter%207%...
3 van 10 12/10/2007 15:15
Replace nutrients, as in method 2 above. Replace soil organic master, and thereby restore structure; this could be done, for example, by allotting part ofthe land to a green manure crop, foregoing production.Replace the soil.
One way to replace lost soil would be to buy it, as can be clone from a horticultural supplier. This solution succeedsin putting a market money value on soil volume, but is environmentally unacceptable, since it is robbing one area torestore another. The only true way to restore lost soil is by taking land out of production until it is restored by thenatural process of weathering. The rate of this process varies by orders of magnitude for different rock types, but forconsolidated strata it has been estimated as a maximum of 500 mm per thousand years (Saunders and Young, 1983).In soil conservation circles a top rate of "one inch in 30-300 years", or about 0.1-1.0 mm per year, has been quoted(Schertz, 1983). Assuming natural erosion to be very slow, then even at the fastest of these rates, it would meanputting land under fallow for 50 years to restore the lost 5 cm. This again is unrealistic as a practical proposition, butit gives a measure of the true resource loss incurred.
Provisional nature of these estimates
The natural resource accounting studies noted above, of the Philippines and Java, required a large input of effort,which it is out of the question to attempt here for the whole of South Asia. Nevertheless, a major objective of thisstudy would be missing if some attempt were not made to estimate the economic cost of land degradation.
It should be stated at the outset that such estimates are highly approximate. They are made with the intention ofindicating the orders of magnitude of the costs involved, with the objective of stimulating more detailed studies on anational and local scale.
The best researched cases are the impact of salinization and waterlogging in India and Pakistan (for example Ahmadand Kutcher, 1992; ESCAP, 1990b). A small number of local case studies have been identified, covering impacts ofsalinization, lowering of the water table, erosion, and soil fertility decline (Vittal et al., 1990; Joshi and Tyagi, 1991;Joshi and Jha, 1992; Chaudhary and Aneja, 1991). It is likely that other such studies exist.
For comparative purposes, the main approaches used here will be those of lost production, nutrient replacement, andreclamation or restoration. The starting point is the estimates for the extent and degree of each type of landdegradation obtained in Chapters 4 and 5. Some extremely broad assumptions as to typical yields, yield reductionsand farm production economics are necessary. To reduce the problems of differences between prices, types of landuse, etc. between countries, in some cases calculations are clone first for India (as having more than half thepopulation and agricultural production of the region) and then extended, still more approximately, to the region.
Best estimates for extent of land degradation are given in Table 18. Data on land use, fertilizer use, agriculturalproduction and prices are taken from FAO statistics.
Assumptions
The term production loss refers to the production lost as a result of land degradation, that is:
Production loss = production from non-degraded land - production from degraded land, with the same inputs andmanagement
Relative production loss is production loss as a percentage of production from non-degraded land. It should be notedthat in many cases, farmers do not accept reduced production but instead, counteract decreased soil productivity byincreasing inputs.
The following assumptions are made with respect to the effect of degrees of degradation on agricultural production:
Degree of degradation Relative production loss
Light 5%
Moderate 20%
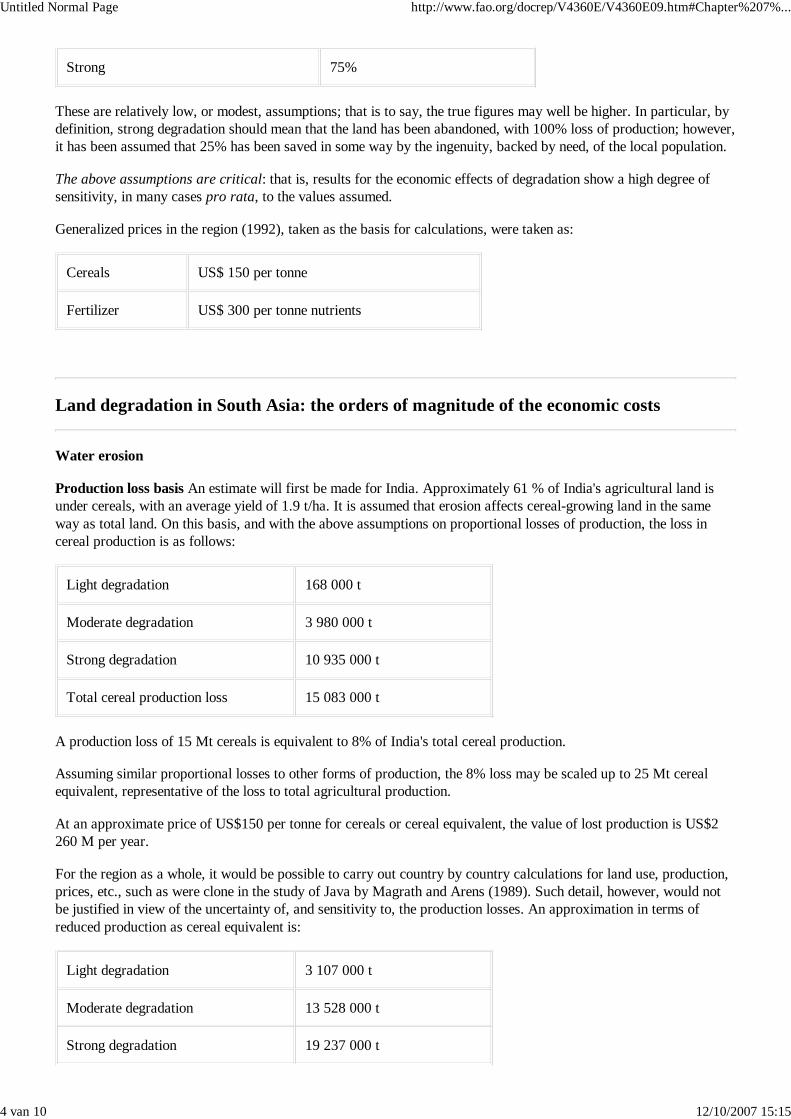
Untitled Normal Page http://www.fao.org/docrep/V4360E/V4360E09.htm#Chapter%207%...
4 van 10 12/10/2007 15:15
Strong 75%
These are relatively low, or modest, assumptions; that is to say, the true figures may well be higher. In particular, bydefinition, strong degradation should mean that the land has been abandoned, with 100% loss of production; however,it has been assumed that 25% has been saved in some way by the ingenuity, backed by need, of the local population.
The above assumptions are critical: that is, results for the economic effects of degradation show a high degree ofsensitivity, in many cases pro rata, to the values assumed.
Generalized prices in the region (1992), taken as the basis for calculations, were taken as:
Cereals US$ 150 per tonne
Fertilizer US$ 300 per tonne nutrients
Land degradation in South Asia: the orders of magnitude of the economic costs
Water erosion
Production loss basis An estimate will first be made for India. Approximately 61 % of India's agricultural land isunder cereals, with an average yield of 1.9 t/ha. It is assumed that erosion affects cereal-growing land in the sameway as total land. On this basis, and with the above assumptions on proportional losses of production, the loss incereal production is as follows:
Light degradation 168 000 t
Moderate degradation 3 980 000 t
Strong degradation 10 935 000 t
Total cereal production loss 15 083 000 t
A production loss of 15 Mt cereals is equivalent to 8% of India's total cereal production.
Assuming similar proportional losses to other forms of production, the 8% loss may be scaled up to 25 Mt cerealequivalent, representative of the loss to total agricultural production.
At an approximate price of US$150 per tonne for cereals or cereal equivalent, the value of lost production is US$2260 M per year.
For the region as a whole, it would be possible to carry out country by country calculations for land use, production,prices, etc., such as were clone in the study of Java by Magrath and Arens (1989). Such detail, however, would notbe justified in view of the uncertainty of, and sensitivity to, the production losses. An approximation in terms ofreduced production as cereal equivalent is:
Light degradation 3 107 000 t
Moderate degradation 13 528 000 t
Strong degradation 19 237 000 t
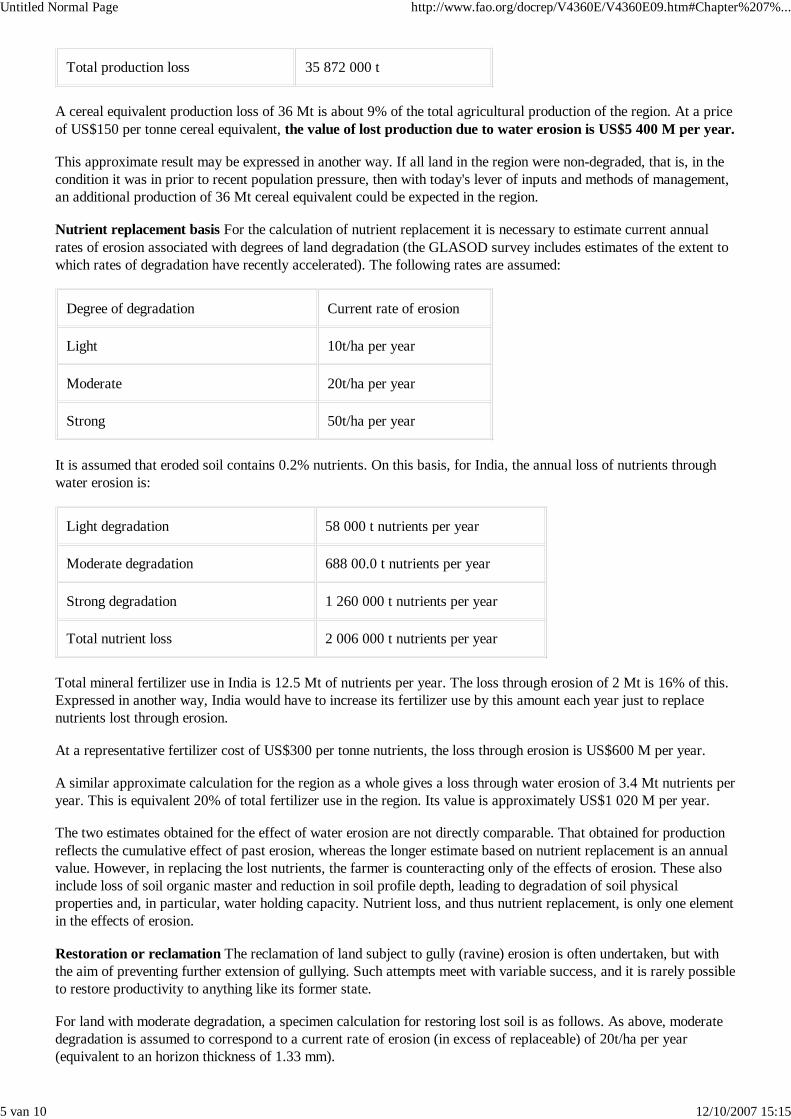
Untitled Normal Page http://www.fao.org/docrep/V4360E/V4360E09.htm#Chapter%207%...
5 van 10 12/10/2007 15:15
Total production loss 35 872 000 t
A cereal equivalent production loss of 36 Mt is about 9% of the total agricultural production of the region. At a priceof US$150 per tonne cereal equivalent, the value of lost production due to water erosion is US$5 400 M per year.
This approximate result may be expressed in another way. If all land in the region were non-degraded, that is, in thecondition it was in prior to recent population pressure, then with today's lever of inputs and methods of management,an additional production of 36 Mt cereal equivalent could be expected in the region.
Nutrient replacement basis For the calculation of nutrient replacement it is necessary to estimate current annualrates of erosion associated with degrees of land degradation (the GLASOD survey includes estimates of the extent towhich rates of degradation have recently accelerated). The following rates are assumed:
Degree of degradation Current rate of erosion
Light 10t/ha per year
Moderate 20t/ha per year
Strong 50t/ha per year
It is assumed that eroded soil contains 0.2% nutrients. On this basis, for India, the annual loss of nutrients throughwater erosion is:
Light degradation 58 000 t nutrients per year
Moderate degradation 688 00.0 t nutrients per year
Strong degradation 1 260 000 t nutrients per year
Total nutrient loss 2 006 000 t nutrients per year
Total mineral fertilizer use in India is 12.5 Mt of nutrients per year. The loss through erosion of 2 Mt is 16% of this.Expressed in another way, India would have to increase its fertilizer use by this amount each year just to replacenutrients lost through erosion.
At a representative fertilizer cost of US$300 per tonne nutrients, the loss through erosion is US$600 M per year.
A similar approximate calculation for the region as a whole gives a loss through water erosion of 3.4 Mt nutrients peryear. This is equivalent 20% of total fertilizer use in the region. Its value is approximately US$1 020 M per year.
The two estimates obtained for the effect of water erosion are not directly comparable. That obtained for productionreflects the cumulative effect of past erosion, whereas the longer estimate based on nutrient replacement is an annualvalue. However, in replacing the lost nutrients, the farmer is counteracting only of the effects of erosion. These alsoinclude loss of soil organic master and reduction in soil profile depth, leading to degradation of soil physicalproperties and, in particular, water holding capacity. Nutrient loss, and thus nutrient replacement, is only one elementin the effects of erosion.
Restoration or reclamation The reclamation of land subject to gully (ravine) erosion is often undertaken, but withthe aim of preventing further extension of gullying. Such attempts meet with variable success, and it is rarely possibleto restore productivity to anything like its former state.
For land with moderate degradation, a specimen calculation for restoring lost soil is as follows. As above, moderatedegradation is assumed to correspond to a current rate of erosion (in excess of replaceable) of 20t/ha per year(equivalent to an horizon thickness of 1.33 mm).
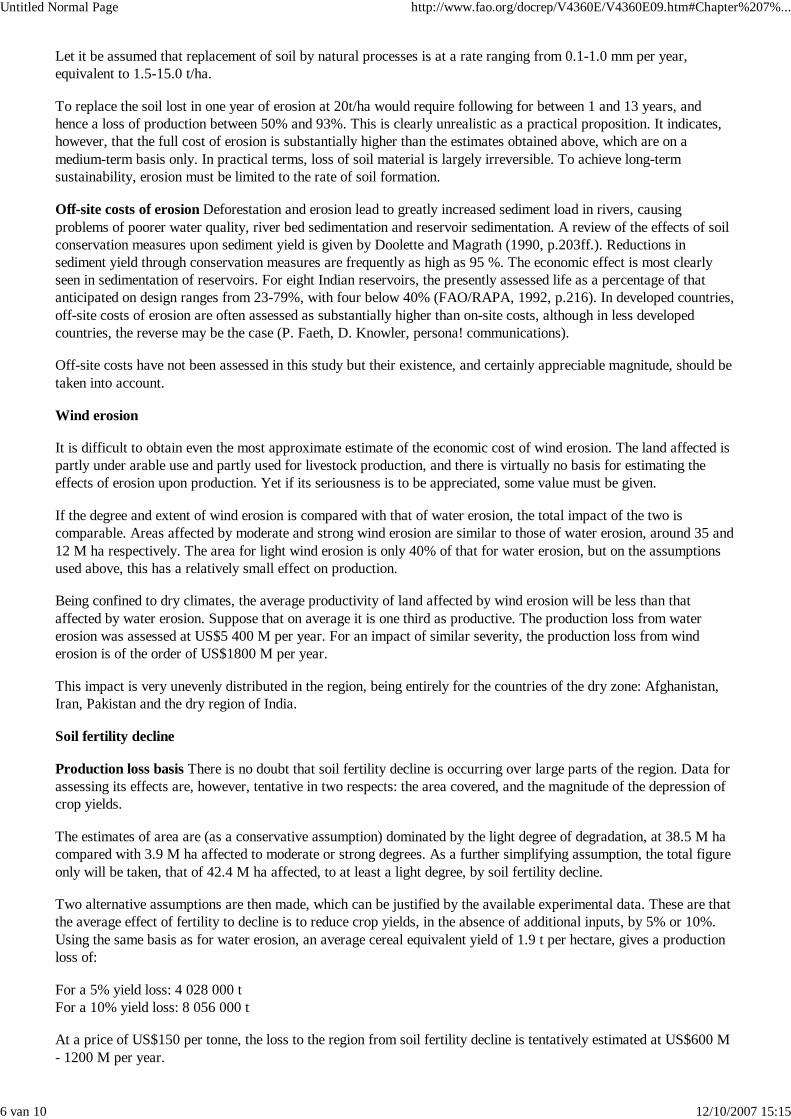
Untitled Normal Page http://www.fao.org/docrep/V4360E/V4360E09.htm#Chapter%207%...
6 van 10 12/10/2007 15:15
Let it be assumed that replacement of soil by natural processes is at a rate ranging from 0.1-1.0 mm per year,equivalent to 1.5-15.0 t/ha.
To replace the soil lost in one year of erosion at 20t/ha would require following for between 1 and 13 years, andhence a loss of production between 50% and 93%. This is clearly unrealistic as a practical proposition. It indicates,however, that the full cost of erosion is substantially higher than the estimates obtained above, which are on amedium-term basis only. In practical terms, loss of soil material is largely irreversible. To achieve long-termsustainability, erosion must be limited to the rate of soil formation.
Off-site costs of erosion Deforestation and erosion lead to greatly increased sediment load in rivers, causingproblems of poorer water quality, river bed sedimentation and reservoir sedimentation. A review of the effects of soilconservation measures upon sediment yield is given by Doolette and Magrath (1990, p.203ff.). Reductions insediment yield through conservation measures are frequently as high as 95 %. The economic effect is most clearlyseen in sedimentation of reservoirs. For eight Indian reservoirs, the presently assessed life as a percentage of thatanticipated on design ranges from 23-79%, with four below 40% (FAO/RAPA, 1992, p.216). In developed countries,off-site costs of erosion are often assessed as substantially higher than on-site costs, although in less developedcountries, the reverse may be the case (P. Faeth, D. Knowler, persona! communications).
Off-site costs have not been assessed in this study but their existence, and certainly appreciable magnitude, should betaken into account.
Wind erosion
It is difficult to obtain even the most approximate estimate of the economic cost of wind erosion. The land affected ispartly under arable use and partly used for livestock production, and there is virtually no basis for estimating theeffects of erosion upon production. Yet if its seriousness is to be appreciated, some value must be given.
If the degree and extent of wind erosion is compared with that of water erosion, the total impact of the two iscomparable. Areas affected by moderate and strong wind erosion are similar to those of water erosion, around 35 and12 M ha respectively. The area for light wind erosion is only 40% of that for water erosion, but on the assumptionsused above, this has a relatively small effect on production.
Being confined to dry climates, the average productivity of land affected by wind erosion will be less than thataffected by water erosion. Suppose that on average it is one third as productive. The production loss from watererosion was assessed at US$5 400 M per year. For an impact of similar severity, the production loss from winderosion is of the order of US$1800 M per year.
This impact is very unevenly distributed in the region, being entirely for the countries of the dry zone: Afghanistan,Iran, Pakistan and the dry region of India.
Soil fertility decline
Production loss basis There is no doubt that soil fertility decline is occurring over large parts of the region. Data forassessing its effects are, however, tentative in two respects: the area covered, and the magnitude of the depression ofcrop yields.
The estimates of area are (as a conservative assumption) dominated by the light degree of degradation, at 38.5 M hacompared with 3.9 M ha affected to moderate or strong degrees. As a further simplifying assumption, the total figureonly will be taken, that of 42.4 M ha affected, to at least a light degree, by soil fertility decline.
Two alternative assumptions are then made, which can be justified by the available experimental data. These are thatthe average effect of fertility to decline is to reduce crop yields, in the absence of additional inputs, by 5% or 10%.Using the same basis as for water erosion, an average cereal equivalent yield of 1.9 t per hectare, gives a productionloss of:
For a 5% yield loss: 4 028 000 t For a 10% yield loss: 8 056 000 t
At a price of US$150 per tonne, the loss to the region from soil fertility decline is tentatively estimated at US$600 M- 1200 M per year.
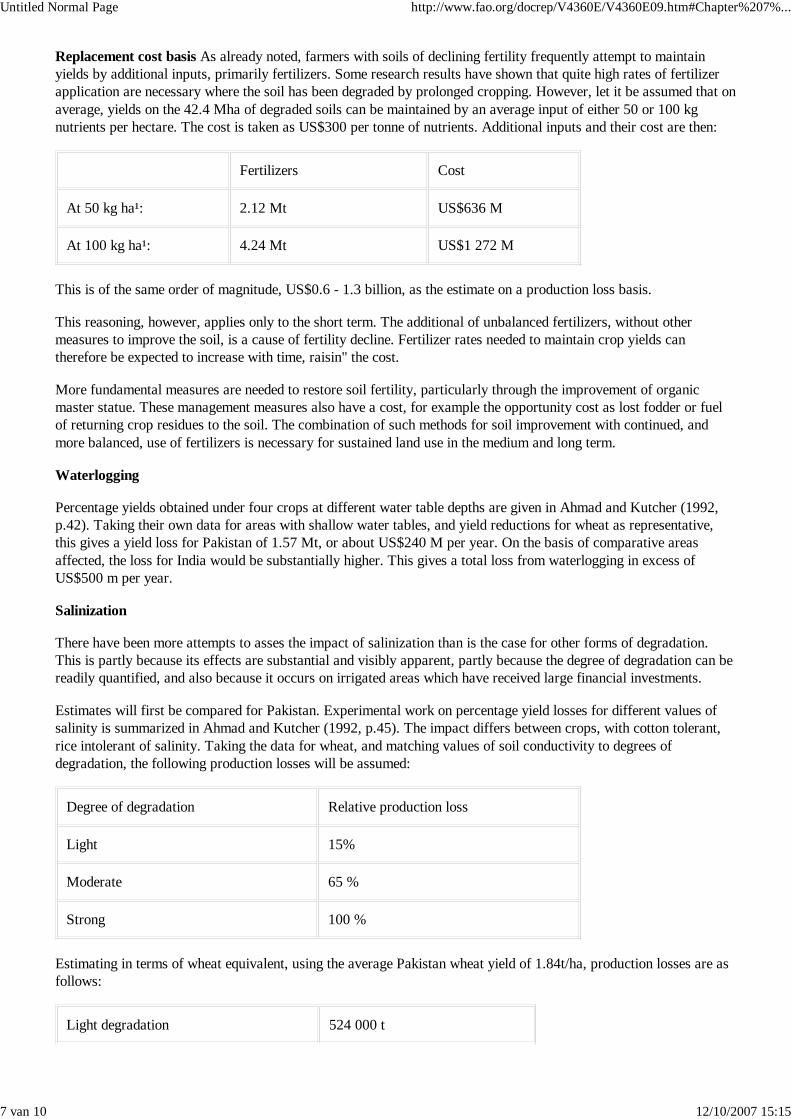
Untitled Normal Page http://www.fao.org/docrep/V4360E/V4360E09.htm#Chapter%207%...
7 van 10 12/10/2007 15:15
Replacement cost basis As already noted, farmers with soils of declining fertility frequently attempt to maintainyields by additional inputs, primarily fertilizers. Some research results have shown that quite high rates of fertilizerapplication are necessary where the soil has been degraded by prolonged cropping. However, let it be assumed that onaverage, yields on the 42.4 Mha of degraded soils can be maintained by an average input of either 50 or 100 kgnutrients per hectare. The cost is taken as US$300 per tonne of nutrients. Additional inputs and their cost are then:
Fertilizers Cost
At 50 kg ha¹: 2.12 Mt US$636 M
At 100 kg ha¹: 4.24 Mt US$1 272 M
This is of the same order of magnitude, US$0.6 - 1.3 billion, as the estimate on a production loss basis.
This reasoning, however, applies only to the short term. The additional of unbalanced fertilizers, without othermeasures to improve the soil, is a cause of fertility decline. Fertilizer rates needed to maintain crop yields cantherefore be expected to increase with time, raisin" the cost.
More fundamental measures are needed to restore soil fertility, particularly through the improvement of organicmaster statue. These management measures also have a cost, for example the opportunity cost as lost fodder or fuelof returning crop residues to the soil. The combination of such methods for soil improvement with continued, andmore balanced, use of fertilizers is necessary for sustained land use in the medium and long term.
Waterlogging
Percentage yields obtained under four crops at different water table depths are given in Ahmad and Kutcher (1992,p.42). Taking their own data for areas with shallow water tables, and yield reductions for wheat as representative,this gives a yield loss for Pakistan of 1.57 Mt, or about US$240 M per year. On the basis of comparative areasaffected, the loss for India would be substantially higher. This gives a total loss from waterlogging in excess ofUS$500 m per year.
Salinization
There have been more attempts to asses the impact of salinization than is the case for other forms of degradation.This is partly because its effects are substantial and visibly apparent, partly because the degree of degradation can bereadily quantified, and also because it occurs on irrigated areas which have received large financial investments.
Estimates will first be compared for Pakistan. Experimental work on percentage yield losses for different values ofsalinity is summarized in Ahmad and Kutcher (1992, p.45). The impact differs between crops, with cotton tolerant,rice intolerant of salinity. Taking the data for wheat, and matching values of soil conductivity to degrees ofdegradation, the following production losses will be assumed:
Degree of degradation Relative production loss
Light 15%
Moderate 65 %
Strong 100 %
Estimating in terms of wheat equivalent, using the average Pakistan wheat yield of 1.84t/ha, production losses are asfollows:
Light degradation 524 000 t
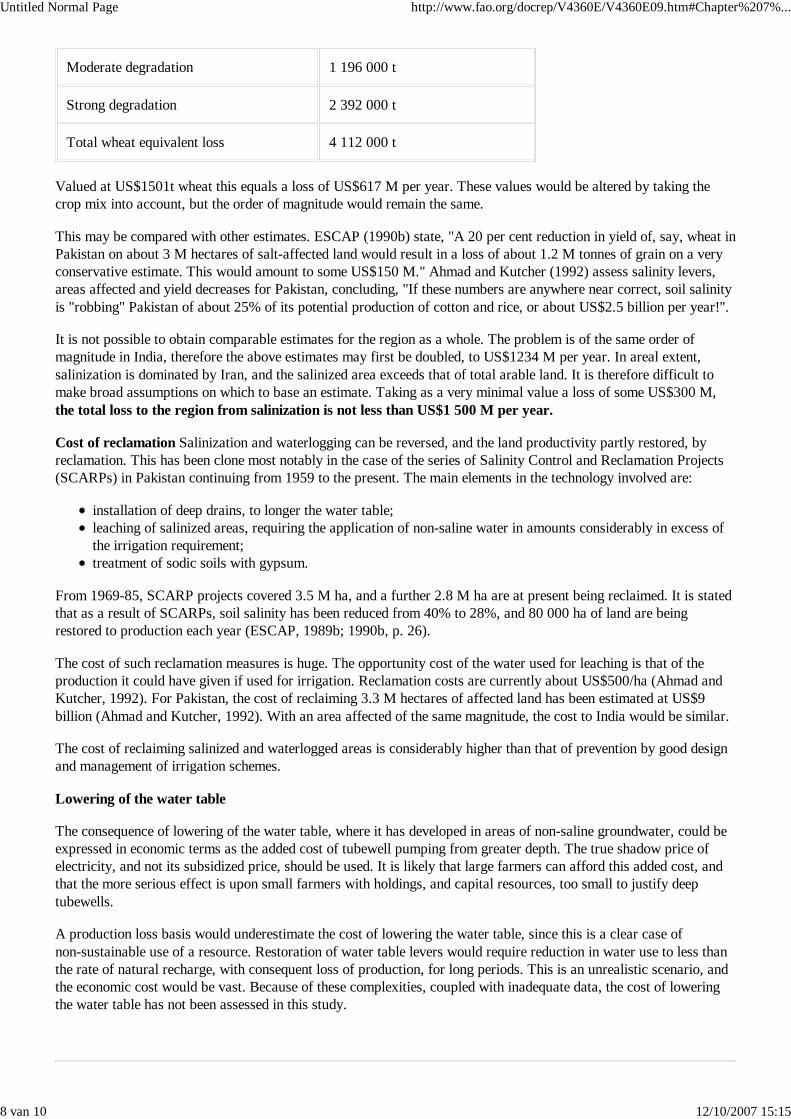
Untitled Normal Page http://www.fao.org/docrep/V4360E/V4360E09.htm#Chapter%207%...
8 van 10 12/10/2007 15:15
Moderate degradation 1 196 000 t
Strong degradation 2 392 000 t
Total wheat equivalent loss 4 112 000 t
Valued at US$1501t wheat this equals a loss of US$617 M per year. These values would be altered by taking thecrop mix into account, but the order of magnitude would remain the same.
This may be compared with other estimates. ESCAP (1990b) state, "A 20 per cent reduction in yield of, say, wheat inPakistan on about 3 M hectares of salt-affected land would result in a loss of about 1.2 M tonnes of grain on a veryconservative estimate. This would amount to some US$150 M." Ahmad and Kutcher (1992) assess salinity levers,areas affected and yield decreases for Pakistan, concluding, "If these numbers are anywhere near correct, soil salinityis "robbing" Pakistan of about 25% of its potential production of cotton and rice, or about US$2.5 billion per year!".
It is not possible to obtain comparable estimates for the region as a whole. The problem is of the same order ofmagnitude in India, therefore the above estimates may first be doubled, to US$1234 M per year. In areal extent,salinization is dominated by Iran, and the salinized area exceeds that of total arable land. It is therefore difficult tomake broad assumptions on which to base an estimate. Taking as a very minimal value a loss of some US$300 M,the total loss to the region from salinization is not less than US$1 500 M per year.
Cost of reclamation Salinization and waterlogging can be reversed, and the land productivity partly restored, byreclamation. This has been clone most notably in the case of the series of Salinity Control and Reclamation Projects(SCARPs) in Pakistan continuing from 1959 to the present. The main elements in the technology involved are:
installation of deep drains, to longer the water table;leaching of salinized areas, requiring the application of non-saline water in amounts considerably in excess ofthe irrigation requirement;treatment of sodic soils with gypsum.
From 1969-85, SCARP projects covered 3.5 M ha, and a further 2.8 M ha are at present being reclaimed. It is statedthat as a result of SCARPs, soil salinity has been reduced from 40% to 28%, and 80 000 ha of land are beingrestored to production each year (ESCAP, 1989b; 1990b, p. 26).
The cost of such reclamation measures is huge. The opportunity cost of the water used for leaching is that of theproduction it could have given if used for irrigation. Reclamation costs are currently about US$500/ha (Ahmad andKutcher, 1992). For Pakistan, the cost of reclaiming 3.3 M hectares of affected land has been estimated at US$9billion (Ahmad and Kutcher, 1992). With an area affected of the same magnitude, the cost to India would be similar.
The cost of reclaiming salinized and waterlogged areas is considerably higher than that of prevention by good designand management of irrigation schemes.
Lowering of the water table
The consequence of lowering of the water table, where it has developed in areas of non-saline groundwater, could beexpressed in economic terms as the added cost of tubewell pumping from greater depth. The true shadow price ofelectricity, and not its subsidized price, should be used. It is likely that large farmers can afford this added cost, andthat the more serious effect is upon small farmers with holdings, and capital resources, too small to justify deeptubewells.
A production loss basis would underestimate the cost of lowering the water table, since this is a clear case ofnon-sustainable use of a resource. Restoration of water table levers would require reduction in water use to less thanthe rate of natural recharge, with consequent loss of production, for long periods. This is an unrealistic scenario, andthe economic cost would be vast. Because of these complexities, coupled with inadequate data, the cost of loweringthe water table has not been assessed in this study.
Untitled Normal Page http://www.fao.org/docrep/V4360E/V4360E09.htm#Chapter%207%...
9 van 10 12/10/2007 15:15
Macroeconomic impact of land degradation
Summary
The difficulties and uncertainties that arise in assessing the economic effects of land de gradation must again beemphasized. Sources of error arise at all stages of assessment:
Estimates of the extent and severity of degradation.1.Assessment of the physical effects, primarily upon land productivity, of a given severity of degradation.2.Conversion of the physical effects into economic terms.3.
These sources of error are cumulative: an over- or under-assessment at one stage is multiplied by errors at successivestages. For stages 1 and 2, the sensitivity of the total estimate is almost pro rata with errors of estimate. If the areaaffected by a given extent and severity of degradation is over- or underestimated by 50%, the deduced economicimpact will be underestimated by the same amount. For the physical effects the relation is somewhat less simple, forexample, total loss of land reduces inputs as well as production, but the sensitivity of the final economic result to theproportional loss of production is still high.
It would be possible to argue that the overall degree or uncertainty is such that no total figure should be quoted. Todo this would be to miss the objective of this analysis, which is to signal that the problem of land degradationappears, on present evidence, to be of a magnitude that is significant in relation to the total wealth of the countriesconcerned.
Using the incomplete data above, and basing a summary on the method of lost production, the estimates are given inTable 21.
Summing these estimates for the direct, on-site, costs gives a total of US$9.8 - US$11 billion per year. Thus, inround figures, the cumulative effect of human-induced land degradation is estimated to cost countries of the region asum of the order of US$10 billion per year.
TABLE 21 - Provisional estimates of the cost of land degradation in the region
Type of degradation Cost, billion US$ per year Notes
Water erosion 5.4 On-site effects only
Wind erosion 1.8 Assessed relative to water erosion
Fertility decline 0.6-1.2 Tentative estimate
Waterlogging 0.5
Salinization 1.5
Lowering of water table Not assessed
The gross domestic product of the eight countries (1989) is US$488B, and their combined agricultural domesticproduct US$145 billion. The estimate obtained for the on-site effects of land degradation upon productivity isequivalent to 2 % of the gross domestic product of the region, or 7% of its agricultural gross domestic product. Theinclusion of off-site effects of water erosion would increase this value substantially.
The value of resources
The above discussion has been conducted largely on the basis of the user value of land resources, their value foragricultural production. There are, in addition, values which are not directly quantifiable but which are known. Forexample, a soil cover is needed to stabilize runoff and provide base flow; where there is no such cover, runoff is
Untitled Normal Page http://www.fao.org/docrep/V4360E/V4360E09.htm#Chapter%207%...
10 van 10 12/10/2007 15:15
immediate as floods. There are also user values which are not yet known; for example, a century ego, the resourcepotential of bauxitic soils was not appreciated.
However, natural resources also possess a primary value over and above the sum of their user, or secondary, values.In the case of soils, the primary value represents the outcome of processes of soil formation - rock weathering,pedogenesis, biological activity - which have taken of the order of 10 000 - 100 000 years. Within the human timespan, soil cannot be created (other than in extremely small amounts). The primary value represents the differencebetween land without soil and land with soil. For plant resources, the primary value includes the processes ofevolution.
The primary value of soils is not only to the present generation, nor to the 20-50 years commonly included inobtaining net present values by the procedure of cash flow discounting. Soils have been a resource for the past 2000and more years. There is no reason to support that the population will not be dependent upon them for a least thesame length of time into the future. Moreover, if there is continued population increase, land resources will certainlyincrease in relative value in the future.
Complex questions of economic analysis are involved in assessing primary values, which it is inappropriate todiscuss here. One simple means of obtaining a minimum figure is to estimate the sum of today's user values andmultiply this by, say, 2 000 without discounting. This represents the value to future generations of today's soilresources. Whilst not attempting such an assessment here, the essential point is that land resources have a value, forfuture generations, over and above the sum of either their current user values, or their discounted net present value.
Discussion
The existence of a 'contrary' view has already been noted. Expressed in terms of investment appraisal, this stases thatreports of land degradation may be greatly exaggerated; and that unless and until better data are obtained, theproblem does not meet the criteria for development investment.
For reasons given in Chapter 5, Section Discussion, this view is rejected. The present study does not seek to magnifythe seriousness of the problem. It is an attempt to obtain the best objective estimates on the basis of available data.The assumptions made in calculation of economic values err on the side of caution. On this basis, the best estimatethat can be obtained is that land degradation is costing countries of the region an economic loss of the order noless than US$10 billion, equivalent to 7% of their combined agricultural gross domestic product.
Efforts should certainly be made to improve the quality of the data, not only on the degree of degradation but also itseffects upon production. However, action to check degradation should not be withheld until such improved data areavailable. The loss of productive resources is already considerable and is becoming more serious year by year.
Untitled Normal Page http://www.fao.org/docrep/V4360E/V4360E0a.htm#Chapter%208%...
1 van 4 12/10/2007 15:15
Chapter 8 - Effects upon the people
Back to contents - Previous file - Next file
Effects upon productionConsequences for the peopleLand degradation and the poor
In Chapter 6, an attempt was made at a costing of the effects of land degradation considered on amacroeconomic basis, at the national and regional levers. This chapter considers the effects upon thepeople. These can be called social effects but, since an adequate income is a primary concern of farmers,they are also economic effects, at the microeconomic or farm economics lever.
The effect will be considered at two stages: effects upon production, and consequences for the people.
Effects upon production
Land degradation affects crop production, livestock production, and forest production. The consequencesdiffer according to the type and degree of degradation.
Total abandonment of land Where degradation reaches the severe degree, formerly productive land mustbe abandoned. Examples where this is clearly seen are:
Salinization patches, e.g. in India and Pakistan, where the outlines of fields can still be seen in areaswhere whole farms have been abandoned. Large tracts of land have totally gone out of production.Gullies, e.g. in the Pothwar Plateau of Pakistan, where former cropland is literally carried away,leaving a wilderness of ravines.Total removal of the soil from steep slopes, e.g. in parts of the hill country of Sri Lanka, whereformer tee cultivation has been abandoned and the land colonized by grassland of low productivepotential.
The initial abandonment of land takes place when, although some growth of crops is still possible, yieldsare so low.
Reduced crop yields Where land has been subject to light or moderate degradation, the same lever ofinputs will give longer outputs. These may be reduced crop yields or longer livestock production.
Relatively little precise data is yet available on lowering of production as a result of water and winderosion. The question is being studied in a FAO research network, although this does not at present includecountries of the region (FAO, 1991b). For Andhra Pradesh, India, a study based on artificial removal oftopsoil showed clear and strong relations between topsoil depth and crop yields, the slope of the loss curvebeing greater for high-rainfall than low-rainfall years (Vittal et al., 1990). Data for yield losses consequentupon soil fertility decline have been given in Chapter 3. Reductions in crop yield due to salinity has beenwell researched, with percentage losses differing as between salt sensitive and tolerant crops (e.g. Ahmad
Originated by: Agriculture and ConsumerProtection
Title: Land degradation in south Asia: Its severity, causes and effects upon the people... More details
Untitled Normal Page http://www.fao.org/docrep/V4360E/V4360E0a.htm#Chapter%208%...
2 van 4 12/10/2007 15:15
and Kutchler, 1992; Joshi and Jha, 1992).
For rangelands, a reduction in livestock productivity to 10-50 percent of its potential is estimated fordesertified rangelands of Pakistan (Asian Development Bank, 1992a). Other countries of the dry zonereport similar effects.
Forest productivity is also reduced on degraded land, although this is mitigated by the capacity of sometree species to tolerate poor soils, and the recuperative effects upon soil of appropriate reforestation.
Increased inputs and greater costs The level of poverty of many farmers is such that they cannot acceptthe consequence of reduced yields. Instead, they must attempt to maintain their food supplies from thedegraded land, by means of increased inputs. This is now widely the case where attempts are made tocombat soil fertility decline by increased inputs of fertilizers. Another response is to attempt to maintainlivestock numbers despite a reduced carrying capacity of pastures, thus leading to a vicious circle of furtherdegradation.
Reduced responses to inputs It is now accepted that fertilizers are best utilized by application of low tomoderate amounts, whilst seeking to obtain high responses. Land de gradation , particularly the loweringof soil organic matter , has the opposite effect, that of lowering fertilizer responses.
Reduced productivity on irrigated land A specific case of lower crop yields and reduced responses toinputs occurs on the irrigated lands which are widespread in the region. These irrigation systems have beenestablished at high cost, whether of capital, as in tubewells and the large reservoir and canal schemes, orlabour, as in the cases of hand-dug wells and earth dams. Lowered productivity, as a result of soil fertilitydecline, waterlogging and salinization, reduces the benefits from irrigation, leading to less efficient use ofcapital and labour inputs.
Loss of flexibility in land management Reduced crop yields can force farmers to grow only basic foodcrops, particularly cereals (Joshi and Jha, 1992). Again there is a feedback effect, since continuous cerealproduction causes further decline in soil fertility.
Greater risk Degraded land is less resilient, less able to recover from recurrent disasters, such as drought.One of the major effects of erosion is reduced water-holding capacity of the soil. Increase in risk placesconstraints on land management, making farmers reluctant to use up scarce capital on fertilizers.
Loss of water for irrigation An off-site effect of deforestation and erosion of watershed areas isdestabilization of river flow regimes, causing flooding after rains and reduced flows in subsequent dryperiods. Where there are downstream irrigation systems, this reduces water availability at times when it ismost needed.
Lowering of the water table increases irrigation costs, and can make groundwater totally unavailable tofarmers with small landholding, who cannot afford deep tubewells.
Diversion of resources to reclamation As already noted with respect to fertilizer inputs, pressure of needforces farmers to make great efforts in an attempt to maintain production. Thus they may construct gabionsacross gullies, or build terraces with fines of stores, requiring large amounts of labour, or construct deepertubewells. This has been called 'defensive expenditure'. All such inputs, whether of labour or capital, carryan opportunity cost, that of the alternative, productive, uses to which the resources could have beenapplied.
Consequences for the people
Untitled Normal Page http://www.fao.org/docrep/V4360E/V4360E0a.htm#Chapter%208%...
3 van 4 12/10/2007 15:15
The effects of land degradation upon production have impacts upon agricultural population, whetherengaged in crop production, livestock production, or dependent upon forest products.
Increased landlessness. Landlessness among the rural population is a problem of vast scale in parts of theregion (Sinha, 1984). The causes are many, among which abandonment of degraded land is only one. It isprobably a minor cause in statistical terms - but does not seem so to the farmers who have lost their land!
Lower and less reliable food supplies Lowering of crop yields means reduced production of food crops;increased risk means lowered food security.
Increased labour requirements Reduced crop yields and increased inputs both have the effect ofreducing the farmers' returns from labour. Labour used in reclamation and rehabilitation of land is labourlost from production.
A direct consequence is the effect of deforestation on labour needed to collect fuelwood. In parts of theHimalayan mountain belt, deforestation has forced farmers (often women) to walk great distances tocollect fuelwood. The drying up of rivers caused by destabilized flow, and the lowering of groundwater,similarly increase labour needed for water collection.
Lower incomes Out of all the consequences of land degradation, the most serious for the rural populationof the region is longer incomes. These result from either or both of the factors noted above: increasedinputs or reduced outputs.
In classical economic theory, 'land' was considered as a fixed resource, to which the factors of labour andcapital were applied. With land degradation occurring it becomes a declining resource, and as aconsequence, labour and capital are less efficiently applied and productivity is lowered.
If most farmers do not know about economic theory, they are very well aware of it in practice! Landdegradation means that they must either accept a lowered productivity, of food and other requirements, orelse put in greater effort and resources to maintain production.
Land degradation and the poor
Whenever adverse changes occur in the less developed world, it is usually the poor who suffer most. Thissituation arises from the very definition of the poor, those who lack adequate access to the basic necessitiesof life and the resources needed to obtain them.
This is certainly the case with land degradation. In the past rural population, however low their incomesmay seem in modern terms, had access to adequate land to meet their needs. When a disaster, such asflood, drought, attack by pests, or war, destroyed their normal means of livelihood, there were spare landresources to fall back upon. They could take new land into cultivation, kill the few livestock they possessedwhich fed upon natural pastures, or go into the forest and extract roots or hunt wildlife.
Because of land shortage, accentuated by degradation, these options are no longer available. Farmers withless than one hectare are dependent on that small area for all of their agricultural income. They aresurrounded by other farms, such common rangeland or woodland as there may be is degraded and of lowproductivity, and over large areas there is no forest left at all. The only alternatives open are to work onthe land for others, nonagricultural occupations, migration to the cities, or ultimately, dependence onfamine relief.
It is in these tightly constrained circumstances that land degradation hurts most. Production begins to fall.Because production is close to the limit for supplying basic needs, a response must be made to secure these
Untitled Normal Page http://www.fao.org/docrep/V4360E/V4360E0a.htm#Chapter%208%...
4 van 4 12/10/2007 15:15
needs in the short term. This may be clearance of fragile lands, for the sustainable management of which,poor farmers lack the resources. It may be increased inputs, particularly the attempt to maintain yields bynitrogen fertilizers. The non-sustainable land management leads to further degradation.
Larger farmers are less likely to degrade land. Certainly, cases are known where irresponsible rich farmersexploit the land, but by and large they will conserve their resources. When disasters occur, they can tightentheir belts, turn to alternative sources of income, or borrow and repay in better years. These options arenot open to the poor.
It is they who, through force of circumstances, play the greatest part in the causal nexus of land,population, poverty, and degradation (Figure 9, p. 57). It is the poor who suffer most from landdegradation.
Untitled Normal Page http://www.fao.org/docrep/V4360E/V4360E0b.htm#Chapter%209%...
1 van 7 12/10/2007 15:15
Chapter 9 - Institutions and programmes to combat degradation
Back to contents - Previous file - Next file
National institutionsNational institutions: discussionEnvironmental legislationInternational institutions in the regionRegional collaborative programmes
Whilst problems of the environment do not recognize international frontiers, efforts to combat landdegradation must be based largely upon national institutions. This applies not only to work undertaken atthe national lever, for example soil conservation programmes, but to regional and international efforts,which must be largely applied through national institutions.
A short review can consist only of brief indications of the major institutions, their mandate and work. Inmany cases where the functions are implicit, the name only is given. Institutions are divided broadly intoresearch and implementation. Research institutions are those of which the primary function is theacquisition of knowledge, implementation institutions those changed with putting into practice measures tocombat degradation.
Most national institutions are known in their respective countries by acronyms, but these are given hereonly for international organizations.
The constraint of time has meant that these summaries have not been reviewed by governments of thecountries concerned. Whilst every effort has been made, they doubtless contain omissions. They shouldtherefore be treated as indicative, not comprehensive.
National institutions
Afghanistan
For 14 years, Afghanistan has been torn by war and political instability. Besides destruction of resources,this has made the task of institutions extremely difficult. Whilst some efforts are being made in the presentdifficult circumstances, most land rehabilitation must await restoration of stable political conditions.
The present limited institutional structure includes:
Ministry of Planning Ministry of Agriculture and Land Reform
International institutions which provide constrained but active support include ADB, ESCAP, FAO, IMF
Originated by: Agriculture and ConsumerProtection
Title: Land degradation in south Asia: Its severity, causes and effects upon the people... More details
Untitled Normal Page http://www.fao.org/docrep/V4360E/V4360E0b.htm#Chapter%209%...
2 van 7 12/10/2007 15:15
and the World Bank. A report was made to the UNCED conference (Afghanistan, Ministry of Planning,1992).
Bangladesh
Five ministries are concerned, directly or indirectly, with affairs of land, the Ministries of Agriculture,Environment and Forests, Rural Development and Cooperatives, Planning, and Food.
The Bangladesh Agricultural Research Council coordinates work of the Bangladesh Agricultural Institute,four crop-based institutes (for rice, jute, sugar cane and tee) and an institute for nuclear research.
The Soil Resource Development Institute is a separate institute concerned with inventory and evaluation ofsoil resources; it also transfers knowledge for extension purposes. With international cooperation, theInstitute has acquired a considerable amount of detailed information, and is the main repository ofknowledge on land resources of the country.
The Bangladesh Water Development Board manages flood protection, drainage and irrigation projects, andis concerned with land and water use. The Land Reclamation Directorate functions under this Board. TheBangladesh Institute of Development Studies conducts research in economics, demography and socialsciences, including in relation to agriculture and land. The Hill Tract Development Board is concerned withmost aspects of development specific to the hill areas. Other relevant research institutes include theBangladesh Forest Research Institute, the Bangladesh Livestock Research Institute, and agriculturaluniversities.
Extension and implementation are conducted by the Department of Agricultural Extension, the ForestDepartment, the Department of Environment, the Bangladesh Rural Development Board, the BangladeshWater Development Board, the Land and Water Use Directorate, and the Department of Irrigation WaterDevelopment and Flood Control.
The Department of Environment was strengthened in 1985, and is responsible for environmental impactassessments.
During this short review, the impression was gained that there is some overlap of responsibilities within thearea of land resources.
Bhutan
Because of its small population, the institutional structure of Bhutan is simple. The National PlanningAgency formulates policy guidelines. The Department of Agriculture includes a Research and ExtensionDivision, within which there is a Soil Fertility Unit.
India
Because of its population and size, federal structure, and for historical reasons, there are a large number ofinstitutions active in the area of land resources in India, and the following account is selective.
At national lever the relevant ministries are the Ministries of Agriculture, Rural Development, andEnvironment and Forests, and Water Resources, together with the Planning Commission, a body of cabinetlever.
The Indian Council of Agricultural Research is the apex body for research and education in all aspects ofthe agricultural sciences. It has 43 institutes, 4 national bureaux, 21 national research centers, 9 projectdirectorates, and currently operates over 70 All India Coordinated Research Projects. The Indian Councilof Forestry Research and Education performs corresponding functions in the field of forestry.
Research institutes of particular relevance to land resources, conservation and degradation include, at the
Untitled Normal Page http://www.fao.org/docrep/V4360E/V4360E0b.htm#Chapter%209%...
3 van 7 12/10/2007 15:15
national lever:
Indian Agricultural Research Institute National Bureau of Soil Survey and Land Use Planning Central Soil and Water Conservation Research and Training Institute Central Soil Salinity Research Institute Central Research Institute for Dryland Agriculture Central Arid Zone Research Institute ICAR Research Complex for the North-Eastern Hills Region Indian Institute of Soil Science Indian Grassland and Fodder Research Institute Directorate of Water Management National Research Centre for Agroforestry
The National Bureau of Soil Survey and Land Use Planning is the primary institute for basic knowledge ofland resources and their management at the national lever. Applied knowledge is found within therespective institutes listed above, for example, soil salinization within the Central Soil Salinity ResearchInstitute.
At the state lever, some stases have Water and Land Management Institutes, Forest Research Institutes,Irrigation Research Institutes, and Agricultural Universities.
Some of the All India Coordinated Research Projects having particular relevance to land degradation are:
Management of salt affected soils and use of saline water in agriculture Micro and secondary nutrients and pollutants in soils and plants Microbial decomposition and recycling of organic wastes Soil physical conditions to increase agricultural production in problem areas Soil test crop response correlation Agroforestry Forage crops Agricultural drainage
In development, the National Wastelands Development Board has the aim of bringing wastelands (in largepart, degraded lands) into productive use, through afforestation and other measures. A National Land Useand Conservation Board formulates policy papers for the apex body, the National Land Use and WastelandDevelopment Council.
The Soil and Water Conservation Division in the Ministry of Agriculture plays a key role in theimplementation of integrated watershed management programmes. These are planned to cover 86 M/ha, ofwhich 26 M ha of highly critical areas have been taken up on a priority basis. These priority watershedswere identified by the All India Soil and Land Use Survey.
The first fine in agricultural extension is implementation through 109 Krishi Vigyan Kendras ('AgriculturalKnowledge Centres'), supported by National Demonstration Projects and Operational Research Projects.The Central Water Commission, under the Ministry of Water Resources, is concerned with thedevelopment and utilization of water resources. Implementation is further carried out through StateDepartments of Agriculture, Soil Conservation, Forestry, and Animal Husbandry.
Among numerous non-governmental organizations, of particular relevance to land degradation is theSociety for Promotion of Wastelands Development.
Whilst this may appear to be a complex institutional structure, it must be remembered that it serves overone fifth of the world's agricultural population. In many cases, responsibilities are relatively well defined,although cases of overlap will be apparent.
Iran
The principal institution concerned with land degradation is the Bureau of Sand Dune Fixation andCombating Desertification, a unit of the Forestry and Range Organization within the Ministry of
Untitled Normal Page http://www.fao.org/docrep/V4360E/V4360E0b.htm#Chapter%209%...
4 van 7 12/10/2007 15:15
Jihad-e-Sazandegi. Other relevant bodies include the Department of the Environment, the ResearchInstitute of Forest and Rangeland, and a Working Group on Agricultural Meteorology within theMeteorological Organization.
Nepal
At the lever of strategic planning, an Environment Protection Council has been established to coordinateefforts. Relevant ministries are the Ministry of Forest and Soil Conservation, the Ministry of Agriculture,and the Ministry of Water Supply.
Research is coordinated by the Nepal Agricultural Research Council. Relevant bodies and activities includethe Central Soil Science Division, the Integrated Soil Survey Project, the National Pasture and FodderResearch Division, and the Soil and Plant Nutrition Improvement Project.
In development, the nodal institution is the Department of Soil Conservation and Watershed Management,under the Ministry of Forests and Soil Conservation. Other relevant bodies include the Department ofAgriculture, Department of Irrigation, Department of Forests, and the Soil Fertility Advisory Unit.
Pakistan
Strategic planning is undertaken by the National Conservation Strategy Unit of the Environment and UrbanAffairs Division (an independent Ministry, currently with one division). This unit works in collaborationwith the World Conservation Union.
Research is coordinated by the Pakistan Agriculture Research Council. Key institutes involved in landdegradation and conservation research include:
Land Resources Section of the National Agricultural Research Centre Soil Survey of PakistanSoil and Water Conservation Research Institution, Punjab National Fertilizer Development CentreArid Zone Research InstituteInternational Waterlogging and Salinity Research Institute, part of the Water and Power DevelopmentAuthoritySoil Salinity Research Institute, PunjabDrainage and Reclamation Institute of Pakistan Pakistan Forest InstituteIrrigation Research InstituteRange Research Stations (provincial)
Within the irrigated lands, planning and development are controlled by the Water and Power DevelopmentAuthority. Of major importance are the Salinity Control and Reclamation Projects. Other implementation iscarried out at provincial lever, by provincial Directorates and Departments of Soil Conservation, Forestry,and Irrigation. Forestry is coordinated at the national lever by the Inspector General of Forests.
Sri Lanka
Ministerial responsibility is divided between the Ministry of Environment and Parliamentary Affairs, whichhas a coordinating role; the Ministry of Lands, Irrigation and Mahaweli Development; and the Ministry ofAgricultural Development and Research. The Government obtains information and cooperation onenvironmental planning from the Geography Department, University of Peredeniya.
The key research institution is the Land and Water Management Centre of the Central AgriculturalResearch Institute. Other research is conducted by commodity institutes, for example the Tea ResearchInstitute is active in soil conservation and agroforestry research.
Development institutes include the Land Use Policy and Planning Division and the Upper MahaweliEnvironment and Forest Conservation Division of the Mahaweli Authority. Environmental impactassessments are the responsibility of the Central Environmental Authority. Agricultural extension has
Untitled Normal Page http://www.fao.org/docrep/V4360E/V4360E0b.htm#Chapter%209%...
5 van 7 12/10/2007 15:15
recently been decentralized.
This is by no means a full list. It is recognized within Sri Lanka that the institutional structure within thearea of land resources is complex, and with some overlapping responsibilities. The position has beencontrasted with that in coastal conservation where one body, the Coast Conservation Department, hasresponsibility, legal powers, and is able to take effective action.
National institutions: discussion
The institutional structures of the various countries have developed differently with time, for a variety ofreasons. It is difficult to comment on them as a whole, but some generalizations may be made.
There is a tendency towards unduly complex structures, with overlapping responsibilities. Problems arise inlinking activities of the 'fine divisions', Departments of Agriculture, Forestry, and Livestock Production,with the various bodies concerned with environment, conservation, and land use planning.
Research and, especially, planning are often more advanced and active than actual implementation in thefield. It is so much easier to make a watershed management plan, for example, than to implement it. Therewould be benefits if those engaged in research in land degradation and conservation were on occasion totake some active part in implementation; and conversely, for feedback from field extension staff to be morefully incorporated into planning.
The area of environmental considerations is now so wide that at the lever of central environmentalauthorities, it would be useful to recognize divisions, or areas of responsibility, within it. Land resources isone such major area. Other divisions might cover, for example, environmental pollution, the marineenvironment, and the urban environment. Land resources covers the sustainable use of the resources ofclimate, water, soils, landform and vegetation, combining productive use in agriculture, including livestockproduction, and forestry, with conservation.
Countries should seek to clarify institutional responsibilities in the area of land resources.
Environmental legislation
It is recognized that environmental legislation has an important role to play in combatting land degradation.It has not been possible in this study to cover the state of legislation in different countries. A review isgiven in ESCAP (1990a, pp.185-200). This includes a summary table, "Statue of land use and resourceconservation legislation" in which the countries of the present study are classified as follows:
Extensive coverage: None Moderate coverage: Bangladesh, India, Sri Lanka Minimal coverage: Nepal, Pakistan Not included in the assessment: Afghanistan, Bhutan, Iran.
Two features are widely found in environmental legislation. First, the provisions of environmental laws(e.g. of soil conservation, forestry) often require revision to take account of changing circumstances.Secondly, difficulties are invariably experienced in enforcement of the legal requirements.
Untitled Normal Page http://www.fao.org/docrep/V4360E/V4360E0b.htm#Chapter%209%...
6 van 7 12/10/2007 15:15
International institutions in the region
Most of the major international institutions are active within the region, notably FAO, ESCAP, UNEP,UNDP, the World Bank, the International Monetary Fund, and the Asian Development Bank.
Many of the research institutions with headquarters in other parts of the world have stations, networks orcooperative programmes there. Note may be taken of those major international institutions which haveheadquarters in the region and which therefore, although their primary responsibilities are international,make particular contributions regionally, including through country collaborative programmes. These are:
International Centre for Research in the Semi-Arid Tropics (Hyderabad, India) International IrrigationManagement Institute (Kandy, Sri Lanka) International Centre for Integrated Mountain Development(Kathmandu, Nepal)
The World Conservation Union collaborates in the planning of environmental conservation in severalcountries of the region.
Regional collaborative programmes
Two regional collaborative programmes, both ongoing, have made considerable contributions to thecoordination of knowledge on land resources, degradation and conservation, and to providing policyguidelines of action.
Asian Network on Problem Soils This is organized by FAO through its Regional Office for Asia and thePacific (RAPA), located in Bangkok. Formed in 1989, this covers the FAO Asia and Pacific region, whichincludes six of the eight countries of the South Asian region covered in this report (excluding Afghanistanand Iran).
The network holds meetings every two years. Reports have been produced on the 1989 meeting, Problemsoils of Asia and the Pacific (FAO/RAPA, 1990), and the 1991 meeting, Environmental issues in land andwater development (FAO/RAPA, 1992). A third meeting will take place in 1993 on Collection and analysisof land degradation data, as recommended by the 21st FAO Regional Conference for Asia and the Pacific.
Desertification Control in Asia and the Pacific (DESCONAP) This is organized by the Economic andSocial Council for Asia and the Pacific (ESCAP). It includes all countries of the present South Asia region.Outputs from its meetings include Problems and prospects of desertification control in the ESCAP region(ESCAP, 1983) and Desertification through wind erosion and its control in Asia and the Pacific (ESCAP,1991b).
ESCAP issues a newsletter, ESCAP Environment News.
Fertilizer and Development Network for Asia and the Pacific (FADINAP) This network is concernedwith fertilizer production, trace and use. Of special relevance to land degradation is its 1992 meeting,Fertilization and the Environment (Pradhan, 1992; Tandon, 1992).
Forestry Research Support Programme for Asia and the Pacific (FORSPA) This is organized by FAOthrough its RAPA office. Its work is summarized in Forestry Research in the Asia-Pacific (FAO/FORSPA,1992). Aspects of its work of particular relevance to land degradation are tropical deforestation, forestry'srole in sustaining agricultural productivity, management of fragile tropical soils, fuelwood, and forestry and

Untitled Normal Page http://www.fao.org/docrep/V4360E/V4360E0b.htm#Chapter%209%...
7 van 7 12/10/2007 15:15
the environment. A newsletter is issued, Info FOPSPA.
Asian Bio and Organic Fertilizer Network Organized by FAO through RAPA, this led to the productionof Organic recycling in Asia and the Pacific (FAO/RAPA, 1991).
These networks continue to play an important role in exchange of scientific knowledge and formulation ofpolicy and programmes.
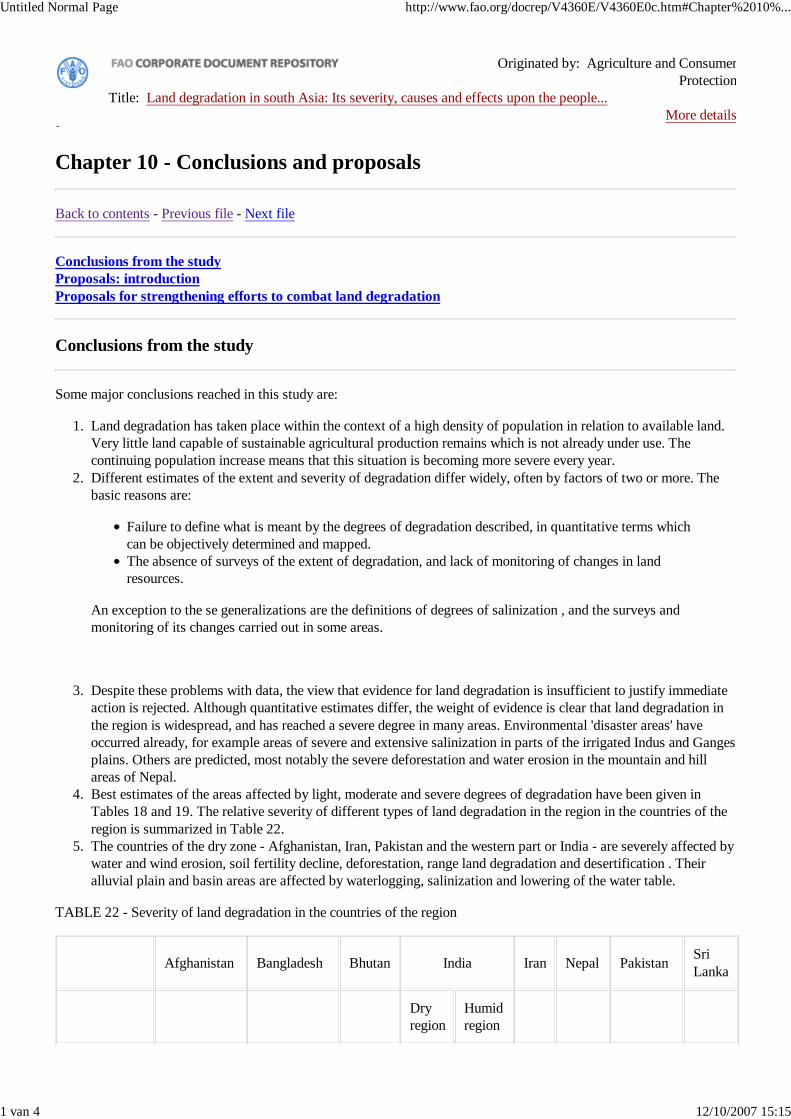
Untitled Normal Page http://www.fao.org/docrep/V4360E/V4360E0c.htm#Chapter%2010%...
1 van 4 12/10/2007 15:15
Chapter 10 - Conclusions and proposals
Back to contents - Previous file - Next file
Conclusions from the studyProposals: introductionProposals for strengthening efforts to combat land degradation
Conclusions from the study
Some major conclusions reached in this study are:
Land degradation has taken place within the context of a high density of population in relation to available land.Very little land capable of sustainable agricultural production remains which is not already under use. Thecontinuing population increase means that this situation is becoming more severe every year.
1.
Different estimates of the extent and severity of degradation differ widely, often by factors of two or more. Thebasic reasons are:
2.
Failure to define what is meant by the degrees of degradation described, in quantitative terms whichcan be objectively determined and mapped.The absence of surveys of the extent of degradation, and lack of monitoring of changes in landresources.
An exception to the se generalizations are the definitions of degrees of salinization , and the surveys andmonitoring of its changes carried out in some areas.
Despite these problems with data, the view that evidence for land degradation is insufficient to justify immediateaction is rejected. Although quantitative estimates differ, the weight of evidence is clear that land degradation inthe region is widespread, and has reached a severe degree in many areas. Environmental 'disaster areas' haveoccurred already, for example areas of severe and extensive salinization in parts of the irrigated Indus and Gangesplains. Others are predicted, most notably the severe deforestation and water erosion in the mountain and hillareas of Nepal.
3.
Best estimates of the areas affected by light, moderate and severe degrees of degradation have been given inTables 18 and 19. The relative severity of different types of land degradation in the region in the countries of theregion is summarized in Table 22.
4.
The countries of the dry zone - Afghanistan, Iran, Pakistan and the western part or India - are severely affected bywater and wind erosion, soil fertility decline, deforestation, range land degradation and desertification . Theiralluvial plain and basin areas are affected by waterlogging, salinization and lowering of the water table.
5.
TABLE 22 - Severity of land degradation in the countries of the region
Afghanistan Bangladesh Bhutan India Iran Nepal PakistanSriLanka
Dryregion
Humidregion
Originated by: Agriculture and ConsumerProtection
Title: Land degradation in south Asia: Its severity, causes and effects upon the people... More details
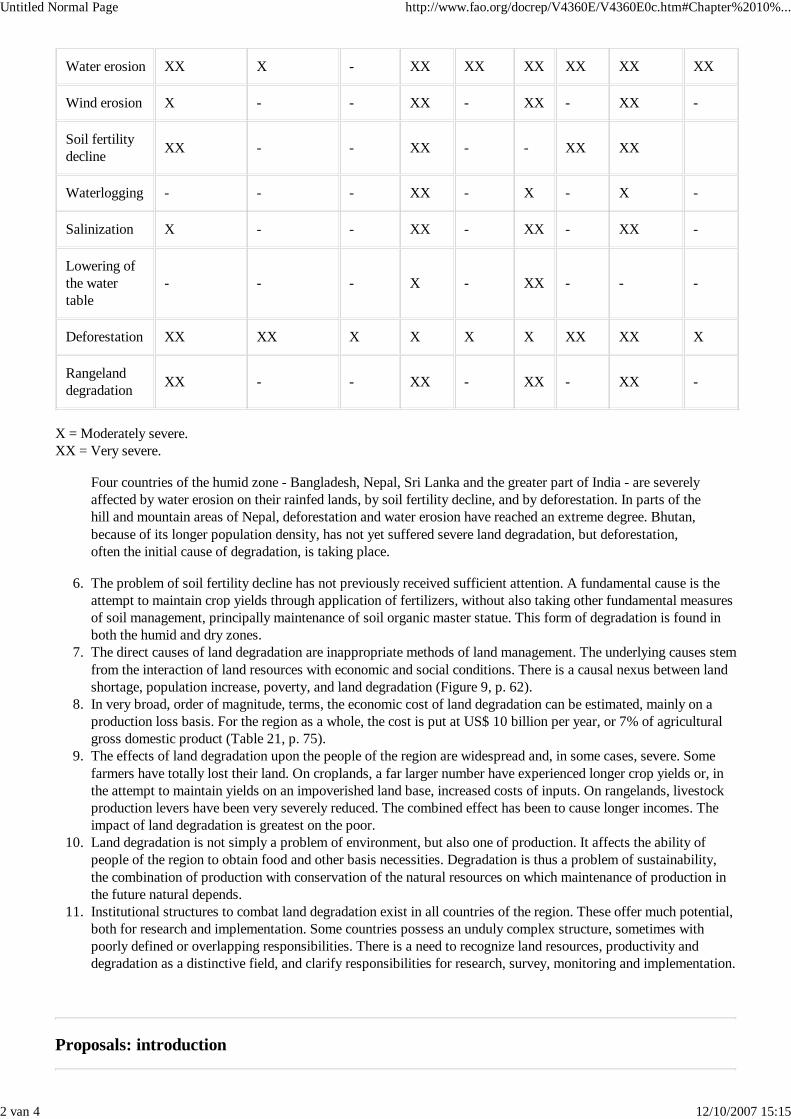
Untitled Normal Page http://www.fao.org/docrep/V4360E/V4360E0c.htm#Chapter%2010%...
2 van 4 12/10/2007 15:15
Water erosion XX X - XX XX XX XX XX XX
Wind erosion X - - XX - XX - XX -
Soil fertility decline
XX - - XX - - XX XX
Waterlogging - - - XX - X - X -
Salinization X - - XX - XX - XX -
Lowering of the watertable
- - - X - XX - - -
Deforestation XX XX X X X X XX XX X
Rangeland degradation
XX - - XX - XX - XX -
X = Moderately severe. XX = Very severe.
Four countries of the humid zone - Bangladesh, Nepal, Sri Lanka and the greater part of India - are severelyaffected by water erosion on their rainfed lands, by soil fertility decline, and by deforestation. In parts of thehill and mountain areas of Nepal, deforestation and water erosion have reached an extreme degree. Bhutan,because of its longer population density, has not yet suffered severe land degradation, but deforestation,often the initial cause of degradation, is taking place.
The problem of soil fertility decline has not previously received sufficient attention. A fundamental cause is theattempt to maintain crop yields through application of fertilizers, without also taking other fundamental measuresof soil management, principally maintenance of soil organic master statue. This form of degradation is found inboth the humid and dry zones.
6.
The direct causes of land degradation are inappropriate methods of land management. The underlying causes stemfrom the interaction of land resources with economic and social conditions. There is a causal nexus between landshortage, population increase, poverty, and land degradation (Figure 9, p. 62).
7.
In very broad, order of magnitude, terms, the economic cost of land degradation can be estimated, mainly on aproduction loss basis. For the region as a whole, the cost is put at US$ 10 billion per year, or 7% of agriculturalgross domestic product (Table 21, p. 75).
8.
The effects of land degradation upon the people of the region are widespread and, in some cases, severe. Somefarmers have totally lost their land. On croplands, a far larger number have experienced longer crop yields or, inthe attempt to maintain yields on an impoverished land base, increased costs of inputs. On rangelands, livestockproduction levers have been very severely reduced. The combined effect has been to cause longer incomes. Theimpact of land degradation is greatest on the poor.
9.
Land degradation is not simply a problem of environment, but also one of production. It affects the ability ofpeople of the region to obtain food and other basis necessities. Degradation is thus a problem of sustainability,the combination of production with conservation of the natural resources on which maintenance of production inthe future natural depends.
10.
Institutional structures to combat land degradation exist in all countries of the region. These offer much potential,both for research and implementation. Some countries possess an unduly complex structure, sometimes withpoorly defined or overlapping responsibilities. There is a need to recognize land resources, productivity anddegradation as a distinctive field, and clarify responsibilities for research, survey, monitoring and implementation.
11.
Proposals: introduction
Untitled Normal Page http://www.fao.org/docrep/V4360E/V4360E0c.htm#Chapter%2010%...
3 van 4 12/10/2007 15:15
The proposals arise from the above conclusions. They are confined to the main fines of approach and action. Many ofthe proposed actions will initially require discussion on a regional, and in some cases international, basis, in order tosecure uniformity of methods. They will subsequently require modifications in detail to meet the circumstances ofdifferent countries.
If integrated action is not taken, to combat both the direct and the indirect causes of land degradation:
resources will be destroyed, in some cases irreversibly;there will be further considerable economic losses at the national lever;the people, mainly the poor, will suffer.
A prerequisite for effective action is recognition, by national governments, of the severity of land degradation and itseffects upon the people and the national economies. It is not sufficient to pay lip service to 'environment' nor to writereports. There must be allocation of staff, budget and resources.
The proposals fall into two groups:
Assessment of the severity and extent of the problem, and its effects (Proposals 1-4).Action to check and reverse land degradation (Proposals 5-7).
Problems of land degradation have already been considered within the FAO/RAPA Asian Problem Soils Network andthe ESCAP Desertification Control Network. Following the two recent conferences of the former, a position paper wasproduced which includes detailed recommendations for action. Whilst written with respect to the whole of Asia and thePacific, it is certainly applicable to the present South Asian Region. The recommendations in that paper are given underthe heading, "A framework for action" (Dent et al., 1992, pp.20-26). They are fully in agreement with the proposals ofthe present study. They amplify and expand these with respect to development of national institutions and improvedmethods of land use management (training and implementation), and contain additional material on people'sparticipation.
Proposals for strengthening efforts to combat land degradation
Proposal 1: Practical definitions of degrees of severity of land degradation
In order to acquire more accurate data, it is first necessary to define the degrees of land degradation, in terms that offerpractical means of observation, monitoring and mapping. An early attempt to do so was made by FAO (1979). Thedefinitions employed in the GLASOD survey (Table 4, p. 24) provide a valid starting point, but these need to beconverted to quantitative form.
This action is best taken at international lever.
Proposal 2: Establishment of a regional programme and guidelines for survey of land degradation, andmonitoring of change
If surveys are to be conducted nationally, it is first necessary to establish detailed objectives, methods and priorities area regional lever. The programme should include:
Survey of the present state of degradation.Monitoring of soil changes. A discussion, with outline of methods and exemples, is given in Young ( 1991).
An FAO/RAPA meeting is scheduled for 1993 which will give initial consideration to such a programme.
Proposal 3: Study of the economic and social effects upon the people
Very few specific studies of this nature were identified in the course of the present review. Ideally, such work should beconducted in parallel with physical surveys, and include cooperation in the field between soil scientists and socialscientists.
The methodology for study of economic consequences at the macroeconomic lever, and of economic and social effects
Untitled Normal Page http://www.fao.org/docrep/V4360E/V4360E0c.htm#Chapter%2010%...
4 van 4 12/10/2007 15:15
upon the people, is less well established than that for physical surveys. Initial consideration at international lever wouldbe preferable.
Proposal 4: Translation of these guidelines (Proposals 3 and 4) into national programmes.
This is clearly a master for action at national lever. Among aspects to be covered are:
Clarify institutional responsibilities It may be necessary to establish a high-level advisory committee on landdegradation policy. This body should then seek, through collaboration with the Ministries and Departmentsconcerned, to clarify responsibilities in areas of research, planning and implementation.
It is desirable that countries should identify one nodal institution for land degradation affairs as a whole,together with others with defined responsibilities for particular types of degradation and aspects ofresearch, planning and implementation.
Identify priorities In all countries there are critical aspects, where land degradation and its consequences havealready reached serious proportions or threaten to do sot In some cases these will be specific land regional areas,such as those with particularly severe erosion or salinization. In others, a priority may arise in the existence of aproblem of moderate degree but occurring over a large area, such as soil fertility decline.Plan and carry out national programmes It is at this point that the international, regional and nationalactivities set out above will be put into practice.
Priority 5: Research into measures to combat degradation.
Practical field implementation needs to be continuously supported by research. Aspects which require particularattention include:
practical methods of improving and maintaining soil organic master statue;ways of securing participation of the people in the implementation of improved measures of land management,for example, soil conservation measures which provide intrinsic incentives for land users;research into the underlying causes of degradation, and the integration of land resource management with wideraspects of population policy.
Proposal 6: Implementation of measures to combat the direct causes of degradation.
Much activity of this nature is already being undertaken, but the scale of activity needs to be expanded. Increasedfunding will be required. Measures of this type include:
watershed management and soil conservation projects and extension work;method for improving soil organic master statue;application of integrated plant nutrition systems;salinity control and reclamation projects;reafforestation;further development of agroforestry, including applications for soil conservation;control of desertification, including sand dune fixation and improved rangeland management.
Proposal 7: Action directed towards removing the underlying causes of degradation, including integration ofland management measures with population policy.
Attempts to combat land degradation directly, by conservation measures or land reclamation, can have only short-termeffects unless they are accompanied by efforts to tackle the underlying causes. These lie in the causal nexus betweenpopulation increase, limited land resources, land shortage, poverty, non-sustainable management practices and landdegradation. In the prevailing situation in which there is no spare land available, population increases of 2-3 percent peryear will largely or entirely counteract the effects of measures for improvement.
Population is a sensitive issue, but all governments of the region are aware of the problems caused by continuedincrease at present rates. In the context of land degradation, a much greater integration between population policy,agriculture and land resource management is needed. For this to occur, new attitudes will be required.
Untitled Normal Page http://www.fao.org/docrep/V4360E/V4360E0d.htm#References
1 van 6 12/10/2007 15:16
References
Back to contents - Previous file - Next file
Abrol, I.P. 1990. Problem soils in India. In: Problem Soils of Asia and the Pacific (FAO/RAPA, Bangkok).pp. 153-65.
Afghanistan, Ministry of Planning. 1992. Afghanistan: the transition from war to rehabilitation anddevelopment. Report to UNCED. Ministry of Planning, Kabul, 131 pp.
Ahmad Y.J., El Serafy, S. and Lutz, E. (eds.). 1989. Environmental Accounting for SustainableDevelopment. World Bank, Washington DC, 100 pp.
Ahmad, M. and Kutcher, G.P. 1992. Irrigation planning with environmental considerations: a case study ofPakistan's Indus basin. World Bank Technical Paper 166. World Bank, Washington DC, 196 pp.
Asian Development Bank. 1990. Economic Policies for Sustainable Development. Asian DevelopmentBank, Manila, 253 pp.
Asian Development Bank. 1991. Population pressure and natural resources management: key issues andpossible actions. ADB Environment Paper 6. Asian Development Bank, Manila, 40 pp.
Asian Development Bank. 1992a. Pakistan: Forestry Sector Master Plan. Upland degraded WatershedComponent. Asian Development Bank, Manila.
Asian Development Bank. 1992b. Forest Cover/Land Use Maps of Pakistan. 1:250 000. AsianDevelopment Bank, Manila.
Banerjee, A. and Grimes, A. in press. Rehabilitation of Degraded Forests in Asia. World Bank, AsiaTechnical Department.
Bangladesh. 1992. Land Degradation. Paper presented to FAO 21st Regional Conference for Asia and thePacific, New Delhi.
Bhutan, National Environmental Secretariat. 1992. Bhutan: Towards Sustainable Development in a UniqueEnvironment. National Environmental Secretariat, Thimphu, 71 pp.
Biswas, A. and Tewatia, R.K. 1991. Nutrient balance in agro-climatic regions of India - an overview. Fert.News 36(6): 13- 18.
Bojo, J. 1992. Cost-benefit analysis of soil and water conservation projects: a review of 20 empiricalstudies. In: Soil Conservation for Survival. Kebebe Tato and H. Hurni (eds.). Soil and Water ConservationSociety, Ankeny, Iowa. pp. 195-205.
Bowonder, B.. 1981. The myth and reality of high yield varieties in Indian agriculture. Development andChange 12 (20).
Castro, C. 1991. Upland Conservation in Asia and the Pacific. FAO/RAPA, Bangkok. 114 pp.
Originated by: Agriculture and ConsumerProtection
Title: Land degradation in south Asia: Its severity, causes and effects upon the people... More details
Untitled Normal Page http://www.fao.org/docrep/V4360E/V4360E0d.htm#References
2 van 6 12/10/2007 15:16
Chaudhary, M.K. and Aneja, D.R. 1991. Impact of green revolution on long-term sustainability of land andwater resources in Harayana. Indian Journal of Agricultural Economics 45: 428-32.
Chisholm, A. and Dumsday, R. (eds.). 1987. Land Degradation: Problems and Policies. CambridgeUniversity Press, Cambridge, UK. 404 pp.
Chopra, H. 1989. Land degradation: dimensions and casualties. Indian Journal of Agricultural Economics44: 45-54.
Cruz, W. and Repetto, R. 1992. The Environmental Effects of Stabilization and Structural AdjustmentPrograms: The Philippines Case. World Resources Institute, Washington DC. 90 pp.
Das, D.C. 1977. Soil conservation practices and erosion control in India - a case study. FAO Soils Bulletin33. FAO, Rome. pp. 11-50.
Das, D.C., Dhuruvanarayana, V.V. and Sarkar, T.K. 1991. Soil-related constraints in crop production -soil erosion. Bull. No. 15, Indian Soc. Soil Sci., New Delhi. pp. 14-26.
Dent, F.J. 1992. Environmental issues in land and water development - a regional perspective. In:FAO/RAPA, Environmental Issues in Land and Water Development. FAO/RAPA, Bangkok. pp. 5274.
Dent, F.J., Rao, Y.S. and Takeuchi, K. 1992. Regional Strategies for Arresting Land Degradation ("Wombof the Earth)". FAO/RAPA, Bangkok, 26 pp.
Doolette, J.B. and Magrath, W.B. (eds.). 1990. Watershed development in Asia: strategies andtechnologies. World Bank Technical Paper 127. World Bank, Washington DC. 227 pp.
Environmental Resources Limited. 1988. Natural Resource Management for Sustainable Development: AStudy of Feasible Policies, Institutions and Investment Activities in Nepal with special emphasis on thehills. Environmental Resources Limited for the World Bank, London, 228 pp.
ESCAP. 1983. Problems and Prospects of Desertification Control in the ESCAP Region. ESCAP/UNEP,Bangkok. 372 pp.
ESCAP. 1986. Environmental and Socio-economic Aspects of Tropical Deforestation in Asia and thePacific. ESCAP, Bangkok. 142 pp.
ESCAP. 1987a. Population policies and programmes. Current statue and future directions. AsianPopulation Studies 84. UN, New York. 216 pp.
ESCAP. 1987b. Desertification in Asia and the Pacific: A Regional Review and Assessment. ESCAP,Bangkok.
ESCAP. 1989a. Consequences of population growth in Asia: a methodological guideline. Asia PopulationStudies 102. ESCAP, Bangkok. 154 pp.
ESCAP. 1989b. Desertification in Indus Basin due to Salinity and Waterlogging: A Case Study. ESCAP,Bangkok. 57 pp.
ESCAP. 1990a. State of the Environment in Asia and the Pacific. ESCAP, Bangkok. 352 pp.
ESCAP. 1990b. Waterlogging and Salinity Control in Asia and the Pacific. ESCAP, Bangkok. 61 pp.
ESCAP. 1991a. Economic and Social Commission for Asia and the Pacific. Annual Report, June 1990April 1991. UN, New York. 176 pp.
ESCAP. 1991b. Desertification through Wind Erosion and its Control in Asia and the Pacific. UN, New
Untitled Normal Page http://www.fao.org/docrep/V4360E/V4360E0d.htm#References
3 van 6 12/10/2007 15:16
York. 139 pp.
FAO. 1976. A framework for land evaluation. FAO Soils Bulletin 32. FAO, Rome.
FAO. 1979. A Provisional Methodology for Soil Degradation Assessment. FAO, Rome, 73 pp.
FAO. 1978-80. Report on Agro-ecological zones project. Vol. 2 (1978). Results for southwest Asia. Vol.4 (1980). Results for southeast Asia. World Soil Resources Report 48/2 and 48/4. FAO, Rome. 28 and 41pp.
FAO. 1982. Population Supporting Capacities of Lands in the Developing World. FAO, Rome 139 pp.plus maps.
FAO. 1986a. Watershed management in Asia and the Pacific: needs and opportunities for action. TechnicalReport FO:RAS/85/017. FAO, Rome. 166 pp.
FAO. 1986b. Status report on plant nutrition in fertilizer programmes countries in Asia and Pacific region.AGL/MISC/86/7. FAO, Rome.
FAO. 1988. Nepal: integrated watershed management, torrent control and land use development.FO:DP/NEP/74/020. UNDP/FAO, Rome. 44 pp.
FAO. 1991. Network on Erosion-induced Loss in Soil Productivity. FAO, Rome. 52 pp.
FAO. 1992. The State of Food and Agriculture 1991. FAO, Rome. 228 pp.
FAO. 1992. Findings and recommandations for the tropical zone. Forest Resources Assessment 1990Project. FAO, Rome 30 pp.
FAO/RAPA. 1986. Land Use Watersheds, and Planning in the Asia-Pacific Region. FAO/RAPA, Bangkok.230 pp.
FAO/RAPA. 1990. Problem soils of Asia and the Pacific. RAPA Report 1990/6. FAO/RAPA Bangkok.283 pp.
FAO/RAPA. 1991. Organic recycling in Asia and the Pacific. RAPA Bulletin 7. FAO/RAPA, Bangkok.112 pp.
FAO/RAPA. 1992. Environmental Issues in Land and Water Development. FAO/RAPA, Bangkok. 488pp. (Includes country papers on Bangladesh, India, Nepal, Pakistan and Sri Lanka.)
Goswami, N.N. and Rattan, R.K. 1992. Soil health - key to sustained agricultural productivity. FertilizerNews [India]. pp. 53-60.
Hutchinson C.F. and Webb, A.C. 1987. United States-Pakistan Workshop on Arid Lands Developmentand Desertification Control. Pakistan Agricultural Research Council, Islamabad. 235 pp.
Joshi, P.K. and Tyagi, N.K. 1991. Sustainability of existing farming system in Punjab and Harayana someissues on groundwater use. Indian Journal of Agricultural Economics 46: 412-21.
Joshi, P.K. and Jha, D. 1992. An economic enquiry into the impact of soil alkalinity and waterlogging.Indian Journal of Agricultural Economics 47: 195-204.
Kholdebarin A. 1992. Desertification and its Control in the Islamic Republic of Iran. Forestry and RangeOrganization, Teheran. 48 pp.
Lutz, E. and El Serafy, S. 1988. Environmental and resource accounting: an overview. Environment
Untitled Normal Page http://www.fao.org/docrep/V4360E/V4360E0d.htm#References
4 van 6 12/10/2007 15:16
Department Working Paper 6. World Bank, Washington DC. 14 pp.
Magrath, W.B. 1989. Economic analysis of soil conservation technologies. Environment Department,Division Working Paper 1989-4. World Bank, Washington DC. 28 pp.
Magrath, W.[B.] and Arens, P. 1989. The costs of soil erosion on Java: a natural resource accountingapproach. Environment Department Working Paper 18. World Bank, Washington DC. 67 pp.
Magrath, W. B. and Doolette, J.B. 1990. Strategic issues for watershed development in Asia. EnvironmentWorking Paper 30. World Bank, Washington DC. 34 pp.
Mellink, W., Rao, Y.S. and MacDicken, KG. (eds.). 1991. Agroforestry in Asia and the Pacific. RAPA,Bangkok. 304 pp.
Mian, A. and Javed. Y. 1989. The Soil Resources of Pakistan - Their Potential, Present State andStrategies for Conservation. Sector paper of the National Conservation Strategy. Soil Survey of Pakistan,Lahore. 53 pp.
Nizami, M.I. and Shafiq, M. 1990. Land clearances and soil conservation. A case study of PothwarPlateau. Proceedings of the 2nd National Soils Congress of Pakistan (Soil Science Society of Pakistan,Islamabad). pp. 162-69.
Noohi, K. 1992. Drought and Desertification. Report of Working Group on Agricultural Meteorology.Paper presented to meeting on elaboration of desertification assessment and mapping methodology,November 1992, Teheran. Meteorological Organization, Teheran. 43 pp
Oldeman, L.R., Hakkeling, A.T.A. and Sombroek, W.G. 1992. World Map of the Status of HumaninducedSoil Degradation. ISRIC, Wageningen and UNEP, Nairobi. 26 pp. with map in 3 sheets.
Parikh, K.S., Parikh, J.K., Sharma, V.K. and Painuly, J.P. 1992. Natural Resource Accounting: AFramework for India. Indira Ghandi Institute of Development Research, Bombay.
Pearce, D.W. and Turner, R.K. 1990. Economics of Natural Resources and the Environment. JohnsHopkins, Baltimore. 378 pp.
Peskin, H.M. 1990. Accounting for natural resource depletion and degradation in developing countries.Environment Department Working Paper 13. World Bank, Washington DC. 39 pp.
Pezzey, J. 1992. Sustainable development concepts: an economic analysis. Environment Paper 2. WorldBank, Washington DC. 71 pp.
Pradhan, S.B. 1992. Status of Fertilizer Use in the [Asia-Pacific] Region. Paper presented to FADINAPseminar, Fertilization and the environment, Chiang Mai, Thailand.
Repetto, R., Magrath, W., Wells, M., Beer, C. and Rossini, F. 1989. Wasting Assets: Natural Resources inthe National Income Accounts. World Resources Institute, Washington DC, 68 pp.
SAARC. 1992. Regional Study on the Causes and Consequences of Natural Disasters and the Protectionand Preservation of the Environment. South Asia Association for Regional Cooperation, Kathmandu. 212pp.
Salleh Modh. Nor. 1992. Forestry research in the Asia-Pacific. FORSPA Publication: 1,FAO/UNDP/ADB/CAB International, Bangkok. 55 pp.
Saunders, I. and Young, A. 1983. Rates of surface processes on slopes, slope retreat and denudation.Earth Surface Processes and landform 8: 473-501.
Untitled Normal Page http://www.fao.org/docrep/V4360E/V4360E0d.htm#References
5 van 6 12/10/2007 15:16
Schertz, D.L. 1983. The basis for soil loss tolerances. Journal of Soil and Water Conservation 38: 1014.
Sehgal, J. and Abrol, I. P. 1992. Land degradation statue: India. Desertification Bulletin 21: 24-31.
Shaheed, S.M. 1992. Environmental issues in land development in Bangladesh. In: Environmental Issues inLand and Water Development. FAO/RAPA, Bangkok. pp. 105-27.
Singh, B. 1992. Groundwater resources and agricultural development strategy: Punjab experience. IndianJournal of Agricultural Economics 47: 105-13.
Sing, P. 1988. Indian Rangelands: Status and Improvement. Plenary address, Third InternationalRangeland Congress, New Delhi. 40 pp.
Sinha, R. 1984. Landlessness: a growing problem. FAO Economic and Social Development Studies 28.FAO, Rome. 112 pp.
Southgate, D. 1989. The economics of land degradation in the third world. Environment DepartmentWorking Paper 2. World Bank, Washington DC. 17 pp.
Sri Lanka, Natural Resources, Energy and Science Authority. 1991. Natural Resources of Sri Lanka:Conditions and Trends. Natural Resources, Energy and Science Authority, Colombo. 280 pp.
Sri Lanka, Ministry of Environment and Parliamentary Affairs. 1991. National Environmental Action Plan.Ministry of Environment and Parliamentary Affairs. 100 pp.
Stocking, M. 1986. The cost of soil erosion in Zimbabwe in terms of the loss of three major nutrients.Consultants' Working Paper 3. AGLS, FAO, Rome. 164 pp.
Stocking, M. 1992. Soil erosion in the upper Mahaweli catchment. Technical Report 14, Forests/LanduseMapping Project. Mahaweli Authority of Sri Lanka, Polgolla. 56 pp.
Sun, P. (ed.). 1989. Land and water resource management in Asia. EDI Seminar Report 20. EconomicDevelopment Institute of the World Bank, Washington DC. 64 pp.
Tandon, H.L.S. 1992. Assessment of Soil Nutrient Depletion. Paper presented to FADINAP seminar,Fertilization and the environment, Chiang Mai, Thailand.
Twyford, I. 1994. Fertilizer Use and Crop Yields. Paper presented to 4th National Congress of the SoilScience Society of Pakistan, Islamabad. 1992.
UNEP. 1977. World Map of Desertification, at a scale of 1:25 000 000. FAO/UNEP/WMO/, Nairobi.
UNEP. 1992a. World Atlas of Desertification. Arnold, London. 69 pp.
UNEP. 1992b. Desertification, land degradation [definitions]. Desertification Control Bulletin 21.
Vittal, K.P.R., Vijayalakshmi, K. and Rao, U.M.B. 1990. The effect of cumulative erosion and rainfall onsorghum, pearl millet and castor bean yields under dry farming conditions in An&a Pradesh, India.Experimental Agriculture 26: 429-39.
World Bank. 1989. Philippines: Environment and Natural Resource Management Study. World Bank,Washington DC. 170 pp.
World Bank. 1991. Bangladesh: Environment strategy review. Report 9551-BD. World Bank, WashingtonDC. 73 pp.
World Bank. 1992. World Development Report 1992: Development and the Environment. Oxford
Untitled Normal Page http://www.fao.org/docrep/V4360E/V4360E0d.htm#References
6 van 6 12/10/2007 15:16
University Press, Oxford, for World Bank, Washington DC. 308 pp.
World Resources Institute. 1992. 1993 Directory of Country Environmental Studies. World ResourcesInstitute, Washington DC. 230 pp.
Yadav, J. S. P. 1993. Land degradation in South Asia. Consultant's Report, RAS/92/560. FAO/RAPA,Bangkok.
Young, A. 1985. Common sense about desertification? Soil Survey and Land Evaluation 4: 90-91.
Young, A. 1989. Agroforestry for Soil Conservation. CAB International, Wallingford, UK and ICRAF,Nairobi. 276 pp.
Young, A. 1991. Soil monitoring: a basic task for soil survey organizations. Soil Use and Management 7:126-30.
Young, A. 1992. Land Degradation in South Asia, its Severity, Causes, and Effects upon the People(according to ECOSOC Resolution 1991/97). Final Report. UNDP/FAO/UNEP, Rome. 23 pp.
Untitled Normal Page http://www.fao.org/docrep/V4360E/V4360E0e.htm#World%20soil%...
1 van 3 12/10/2007 15:16
World soil resources reports
Back to contents - Previous file
Report of the First Meeting of the Advisory Panel on the Soil Map of the World, Rome, 19-23 June1961.**
1.
Report of the First Meeting on Soil Survey, Correlation and Interpretation for Latin America, Rio deJaneiro, Brazil, 28-31 May 1962**
2.
Report of the First Soil Correlation Seminar for Europe, Moscow, USSR, 16-28 July 1962.**3.Report of the First Soil Correlation Seminar for South and Central Asia, Tashkent, Uzbekistan,USSR, 14 September-2 October 1962.**
4.
Report of the Fourth Session of the Working Party on Soil Classification and Survey(Subcommission on Land and Water Use of the European Commission on Agriculture), Lisbon,Portugal, 6-10 March 1963.**
5.
Report of the Second Meeting of the Advisory Panel on the Soil Map of the World, Rome, 9- 11July 1963.**
6.
Report of the Second Soil Correlation Seminar for Europe, Bucharest, Romania, 29 July-6 August1963.* *
7.
Report of the Third Meeting of the Advisory Panel on the Soil Map of the World, Paris, 3 January1964.* *
8.
Adequacy of Soil Studies in Paraguay, Bolivia and Peru, November-December 1963.**9.Report on the Soils of Bolivia, January 1964.**10.Report on the Soils of Paraguay, January 1964.**11.Preliminary Definition, Legend and Correlation Table for the Soil Map of the World, Rome, August1964.* *
12.
Report of the Fourth Meeting of the Advisory Panel on the Soil Map of the World, Rome, 16 21May 1964.**
13.
Report of the Meeting on the Classification and Correlation of Soils from Volcanic Ash, Tokyo,Japan, 11 -27 June 1964.* *
14.
Report of the First Session of the Working Party on Soil Classification, Survey and Soil Resourcesof the European Commission on Agriculture, Florence, Italy, 1-3 October 1964.**
15.
Detailed Legend for the Third Draft on the Soil Map of South America, June 1965.**16.Report of the First Meeting on Soil Correlation for North America, Mexico, 1-8 February 1965.**17.The Soil Resources of Latin America, October 1965.**18.Report of the Third Correlation Seminar for Europe: Bulgaria, Greece, Romania, Turkey,Yugoslavia, 29 August-22 September 1965.**
19.
Report of the Meeting of Rapporteurs, Soil Map of Europe (Scale 1:1000000) (Working Party onSoil Classification and Survey of the European Commission on Agriculture), Bonn, Federal Republicof Germany, 29 November-3 December 1965.**
20.
Report of the Second Meeting on Soil Survey, Correlation and Interpretation for Latin America, Riode Janeiro, Brazil, 13-16 July 1965.**
21.
Report of the Soil Resources Expedition in Wastern and Central Brazil, 24 June-9 July 1965.**22.Bibliography on Soils and Related Sciences for Latin America (1st edition), December 1965.**23.Report on the Soils of Paraguay (2nd edition), August 1964.**24.Report of the Soil Correlation Study Tour in Uruguay, Brazil and Argentina, June-August 1964.**25.Report of the Meeting on Soil Correlation and Soil Resources Appraisal in India, New Delhi , India,26.
Originated by: Agriculture and ConsumerProtection
Title: Land degradation in south Asia: Its severity, causes and effects upon the people... More details
Untitled Normal Page http://www.fao.org/docrep/V4360E/V4360E0e.htm#World%20soil%...
2 van 3 12/10/2007 15:16
5-15 April 1965.**Report of the Sixth Session of the Working Party on Soil Classification and Survey of the EuropeanCommission on Agriculture, Montpellier, France, 7-11 March 1967.**
27.
Report of the Second Meeting on Soil Correlation for North America, Winnipeg-Vancouver,Canada, 25 July-5 August 1966.**
28.
Report of the Fifth Meeting of the Advisory Panel on the Soil Map of the World, Moscow, USSR,20-28 August 1966.**
29.
Report of the Meeting of the Soil Correlation Committee for South America, Buenos Aires,Argentina, 12-19 December 1966.**
30.
Trace Element Problems in Relation to Soil Units in Europe (Working Party on Soil Classificationand Survey of the European Commission on Agriculture), Rome, 1967.**
31.
Approaches to Soil Classification, 1968.**32.Definitions of Soil Units for the Soil Map of the World, April 1968.**33.Soil Map of South America 1:5000000, Draft Explanatory Text, November 1968.**34.Report of a Soil Correlation Study Tour in Sweden and Poland, 27 September-14 October 1968.**35.Meeting of Rapporteurs, Soil Map of Europe (Scale 1:1000000) (Working Party on SoilClassification and Survey of the European Commission on Agriculture), Poitiers, France 21-23 June1967.**
36.
Supplement to Definition of Soil Units for the Soil Map of the World, July 1969.**37.Seventh Session of the Working Party on Soil Classification and Survey of the EuropeanCommission on Agriculture, Varna, Bulgaria, 11-13 September 1969.**
38.
A Correlation Study of Red and Yellow Soils in Areas with a Mediterranean Climate.**39.Report of the Regional Seminar of the Evaluation of Soil Resources in West Africa, Kumasi, Ghana,14-19 December 1970.**
40.
Soil Survey and Soil Fertility Research in Asia and the Far East, New Delhi, 15-20 February 1971.**41.Report of the Eighth Session of the Working Party on Soil Classification and Survey of theEuropean Commission on Agriculture, Helsinki, Finland, 5-7 July 1971.**
42.
Report of the Ninth Session of the Working Party on Soil Classification and Survey of the EuropeanCommission on Agriculture, Ghent, Belgium 28-31 August 1973.**
43.
First Meeting of the West African Sub-Committee on Soil Correlation for Soil Evaluation andManagement, Accra, Ghana, 12-19 June 1972.**
44.
Report of the Ad Hoc Expert Consultation on Land Evaluation, Rome, Italy, 6-8 January 1975.**45.First Meeting of the Eastern African Sub-Committee for Soil Correlation and Land Evaluation,Nairobi, Kenya, 11-16 March 1974.**
46.
Second Meeting of the Eastern African Sub-Committee for Soil Correlation and Land Evaluation,Addis Ababa, Ethiopia, 25-30 October 1976.
47.
Report on the Agro-Ecological Zones Project, Vol. I - Methodology and Results for Africa, 1978.Vol. 2 - Results for Southwest Asia, 1978.
48.
Report of an Expert Consultation on Land Evaluation Standards for Rainfed Agriculture, Rome,Italy, 25-28 October 1977.
49.
Report of an Expert Consultation on Land Evaluation Criteria for Irrigation, Rome, Italy, 27February-2 March 1979.
50.
Third Meeting of the Eastern African Sub-Committee for Soil Correlation and Land Evaluation,Lusaka, Zambia, 18-30 April 1978.
51.
Land Evaluation Guidelines for Rainfed Agriculture, Report of an Expert Consultation, 12-14December 1979.
52.
Fourth Meeting of the West African Sub-Committee for Soil Correlation and Land Evaluation,Banjul, The Gambia, 20-27 October 1979.
53.
Fourth Meeting of the Eastem African Sub-Committee for Soil Correlation and Land Evaluation,Arusha, Tanzania, 27 October-4 November 1980.
54.
Cinquième reunion du Sous-Comité Ouest et Centre africain de correlation des sols pour la mise envaleur des terres, Lomé, Togo, 7-12 décembre 1981.
55.
Fifth Meeting of the Eastern African Sub-Committee for Soil Correlation and Land Evaluation, WadMedani, Sudan, 5-10 December 1983.
56.
Untitled Normal Page http://www.fao.org/docrep/V4360E/V4360E0e.htm#World%20soil%...
3 van 3 12/10/2007 15:16
. Sixième réunion du Sous-Comité Ouest et Centre Africain de correlation des sols pour la mise envaleur des terres, Niamey, Niger, 6-12 fevrier 1984.
57.
Sixth Meeting of the Eastern African Sub-Committee for Soil Correlation and Land Evaluation,Maseru, Lesotho, 9- 18 October 1985.
58.
Septième réunion du Sous-Comité Ouest et Centre africain de correlation des sols pour la mise envaleur des terres, Ouagadougou, Burkina Faso, 10-17 novembre 1985.
59.
Revised Legend, Soil Map of the World, FAO-Unesco-lSRIC, 1988. Reprinted 1990.60.Huitième réunion du Sous-Comité Ouest et Centre africain de correlation des sols pour la mise envaleur des terres, Yaoundé, Cameroun, 19-28 janvier 1987.
61.
Seventh Meeting of the East and Southern African Sub-Committee for Soil Correlation andEvaluation, Gaborone, Botswana, 30 March-8 April 1987.
62.
Neuvième reunion du Sous-Comité Ouest et Centre africain de correlation des sols pour la mise envaleur des terres, Cotonou, Benin, 14-23 novembre 1988.
63.
FAO-ISRIC Soil Database (SDB), 1989.64.Eighth Meeting of the East and Southern African Sub-Committee for Soil Correlation and LandEvaluation, Harare, Zimbabwe, 9-13 October 1989.
65.
World soil resources. An explanatory note on the FAO World Soil Resources Map at 1:25 000 000scale, 1991. Rev. 1, 1993.
66.
Digitized Soil Map of the World, Volume 1: Africa. Volume 2: North and Central America. Volume3: Central and South America. Volume 4: Europe and West of the Urals. Volume 5: North EastAsia. Volume 6: Near East and Far East. Volume 7: South East Asia and Oceania. Release 1.0,November 1991.
67.
Land Use Planning Applications. Proceedings of the FAO Expert Consultation 1990, Rome, 10 14December 1990.
68.
Dixième réunion du Sous-Comité Ouest et Centre africain de correlation des sols pour la mise envaleur des terres, Bouake, Odienné, Côte d'Ivoire, Côte d'Ivoire, 5-12 november 1990.
69.
Ninth Meeting of the East and Southern African Sub-Committee for Soil Correlation and LandEvaluation, Lilongwe, Malawi, 25 November - 2 December 1991.
70.
Agro-ecological land resources assessment for agricultural development planning. A case study ofKenya. Resources data base and land productivity. Main Report. Technical Annex 1: Landresources. Technical Annex 2: Soil erosion and productivity. Technical Annex 3: Agro-climatic andagro-edaphic suitabilities for barley, oat, cowpea, green gram and pigeonpea. Technical Annex 4:Crop productivity. Technical Annex 5: Livestock productivity. Technical Annex 6: Fuelwoodproductivity. Technical Annex 7: Systems documentation guide to computer programs for landproductivity assessments. Technical Annex 8: Crop productivity assessment: results at district lever.1991. Main Report 71/9: Making land use choices for district planning, 1994.
71.
Computerized systems of land resources appraisal for agricultural development, 1993.72.FESLM: an international framework for evaluating sustainable land management, 1993.73.Global and national soils and terrain digital databases (SOTER), 1993.74.AEZ in Asia. Proceedings of the Regional Workshop on Agro-ecological Zones Methodology andApplications, Bangkok, Thailand, 17-23 November 1991.
75.
Green manuring for soil productivity improvement, 1994.76.Onzième reunion du Sous-Comité Ouest et Centre africain de correlation des sols pour la mise envaleur des terres, Ségou, Mali, 18-26 janvier 1993.
77.
Land degradation in South Asia: its severity, causes and effects upon the people, 1994.78.
** Out of print