state of connecticut ecs grant provides significant funding from the state of connecticut ... and...
TRANSCRIPT
Task Force to Study State Education Funding
Final Report
January 2013
State of Connecticut


TASK FORCE MEMBERS
Senator Andrea Stillman Task Force Co-Chair and Co-Chair of the Education Committee
Benjamin Barnes
Task Force Co-Chair and Secretary of the Office of Policy and Management
Mark D. Benigni, Ed.D Superintendent of Schools, Meriden
Portia Bonner, Ph.D.
Education Consultant, Wolcott Public Schools and former New Bedford Massachusetts Superintendent of Schools
Bill Davenport
Director of the Ellis Clark Regional Agriscience & Technology Program, Agriscience Teacher, Nonnewaug High School, Woodbury
Senator Toni Harp
Co-Chair of the Appropriations Committee and member of the Education Committee
Len Miller Certified Public Accountant, Co-Founder of Fairfield County Collaborative Alliance, and Treasurer of
Kids in Crisis
Representative Michael Molgano Member of the Education, Transportation, and Finance, Revenue and Bonding Committees
Dr. Elsa Núñez
President, Eastern Connecticut State University
Ray Rossomando Research and Policy Development Specialist, Office of Policy and Professional Practice
Connecticut Education Association
Theodore Sergi, Ph.D. Former Connecticut State Education Commissioner
Dudley Williams
Director, Corporate Citizenship and Diversity GE Asset Management
TASK FORCE STAFF
Subira Gordon, Chris Calabrese, and Sue Driscoll Education Committee Brian Mahoney State Department of Education Office of Policy and
Management Judith Lohman, John Moran, and Marybeth Sullivan Office of Legislative Research Alan Shepard Office of Fiscal Analysis

TASK FORCE CHARGE
Public Act 11-48, An Act Implementing Provisions of the Budget Concerning General Government, established a task force to study issues relating to state funding for education in the context of state constitutional requirements. The act specifically required the task force to focus on the Education Cost Sharing formula with consideration to state grants to interdistrict magnet schools, regional agricultural science and technology education centers, and funding issues relating to the cost of special education for the state and municipalities.
The task force’s final report on its findings and recommendations must be submitted to the governor and the Appropriations and Education committees. The task force terminates on the day it submits its final report.

TABLE OF CONTENTS
INTRODUCTION ……………………………………………………………………………………………..
1
RECOMMENDATIONS/ EXECUTIVE SUMMARY …………………………………………..
2
EDUCATION COST SHARING FORMULA AND FUNDING……………………………
3
Findings Objectives and Recommendations
FUNDING FOR SCHOOL CHOICE PROGRAMS………………………..……………………
8
Findings Recommendations
SPECIAL EDUCATION FUNDING……………………………………………………………………
11
Findings Recommendations
APPENDIX A: ECS TASK FORCE FORMULA SUBCOMMITTEE REPORT……….
14
APPENDIX B: ECS TASK FORCE SCHOOL CHOICE SUBCOMMITTEE REPORT…………………………………………………………………………………………………………….
24
APPENDIX C: ECS TASK FORCE SPECIAL EDUCATION SUBCOMMITTEE REPORT…………………………………………………………………………………………………………….
30
APPENDIX D: GLOSSARY OF TERMS……………………………………………………………….
35
INTRODUCTION
Since issuing its Interim Report in January 2012, the Task Force to Study State Education Funding (hereafter, Task Force) has continued to work toward its final recommendations addressing the Education Cost Sharing (ECS) grant formula, which distributes the largest share of state education aid to towns, and certain other major state education grants. This is the Task Force's final report and recommendations, approved unanimously by voice vote at its January 3, 2013 meeting. The final recommendations build on the interim recommendations to (1) support efforts to increase and make more predictable ECS funding; (2) update and improve the ECS formula; (3) support equitable funding for school choice programs, including interdistrict magnet schools and regional agriscience technology centers; and (4) explore fairer and more reasonable approaches to funding services for students with special educational needs. The Task Force designated three subcommittees made up of Task Force members to more closely examine (1) the ECS formula; (2) school choice programs, including magnets and agriscience centers; and (3) special education. Each subcommittee delivered its report and recommendations to the Task Force, which adopted those recommendations for this final report. Each subcommittee's full report is included in this final report as an appendix. Since issuing the interim report in January 2012, the Task Force has met 10 times including holding a public informational hearing in Bridgeport, its third event designed to gather public input. The full Task Force and the individual subcommittees have gathered information, listened to experts and interested parties, and deliberated possible recommendations. A complete list of meetings, presentations, plus related documents submitted to the Task Force is available on the Task Force’s website: www.cga.ct.gov/ed/CostSharing/taskforce.asp. The Task Force recognizes that its efforts under the statute must first reflect the state’s commitment to improving student achievement for all students and closing the achievement gap. Further, it must consider education funding in the context of both federal education funding and the state’s other commitments to schools and local governments. The Interim Report recommended the state provide greater access to, and enhancement of, pre-school and kindergarten programs. This report does not make additional recommendations regarding early childhood education because the issue (1) was significantly addressed by the 2012 education reform act (PA 12-116) that created 1,000 new school readiness seats and (2) is expected to be further addressed in the Achievement Gap Task Force's upcoming recommendations.

7
RECOMMENDATIONS/EXECUTIVE SUMMARY NOTE: Due to the state's current budget constraints, the Task Force offers its recommendations without a specific recommendation for more ECS funding and with the understanding that implementation of the recommendations may be hindered or delayed. ECS Formula
• Eliminate uncertainty of annual ECS grants by establishing a target for the total grant amount and criteria to maintain the grants over a period of years.
• Adopt a new ECS formula that: o weighs income more heavily in determining town wealth than under
current formula, o uses Free and Reduced Price Lunch (FRPL) eligibility to determine
student need, o raises per-student foundation amount, and o freezes minimum aid to wealthiest towns.
• Reserve part of the ECS grant for low-performing districts and create incentives to adopt best practices.
School Choice Programs
• Increase state per student grants for non-Sheff host magnets and regional agriscience center programs, and fund them equally to help provide more equitable funding of school choice programs.
• Phase-in the grant increase over four years at annual steps of 25%, 50%, 75% and 100% of the difference between the current grant and the new target.
• Maintain existing funding structures for (1) Connecticut technical high schools, (2) state charter schools, (3) host and regional education service center (RESC)-operated Sheff magnet schools, and (4) RESC-operated non-Sheff magnet schools.
Special Education
• Provide state funding for 100% of both the regular and special education costs of state-agency placed students.
• Increase and guarantee the special education excess cost grant and include a fixed definition of "excess" for all districts, such as $50,000.
• Increase state monitoring of districts with a disproportionate percentage of special education students for numerous aspects of special education including percentage of students in each special education classification, percentage of local budget spent on special education, cost of out-of-district placements, and special education students' achievement and participation in assessments.
8
EDUCATION COST SHARING FORMULA AND FUNDING
Public Act 11-48 requires the Task Force to study issues relating to state funding for education in the context of state constitutional requirements and to focus on the education aid grant formula set forth in CGS §10-262h (i.e., ECS). Summary of Findings
The ECS grant provides significant funding from the State of Connecticut to its 169
towns and cities to help fulfill the requirement under the state constitution that “there shall always be free public elementary and secondary schools in the state”(Art. Eighth, § 1) and under state law “that each child shall have… equal opportunity to receive a suitable program of educational experiences” (CGS § 10-4a).
The larger the share of overall funding for public education that comes from state
sources, the more equal the educational opportunities are across Connecticut’s 169 towns. Thus, the state must make a long-term commitment to increasing its proportional share of total educational funding in the state. This commitment must be faithfully carried out in the biennial state budget through annual increases in total state funding for education (including funding for ECS grants) that, in the aggregate, exceed annual increases in education spending from locally generated revenues.
Because the ECS grant is the largest single component of the state’s support for
elementary and secondary education, annual increases in the total ECS grant appropriation are required to enable the state to continue making progress toward the goal of equalizing educational opportunities for all students, regardless of where they live. Objectives and Recommendations
The task force's final recommendations concerning the ECS formula and its funding consist of two parts: (1) objectives for a new or amended formula and (2) formula changes to implement the objectives.
Objectives for a new or amended ECS formula are both general and specific. The formula must fulfill two general objectives: compliance with state constitution requirements for the equalization of educational opportunities, as well as helping the state eliminate the achievement gap between school districts. The ECS formula also must be designed to meet several specific objectives, for which the Task Force offers the following accompanying formula changes and related provisions:
1. Eliminate the uncertainty of the annual ECS grant. Recommendation:
establish a target for the total grant and criteria to maintain it over a period of years.

9
2. Establish a process to weigh property value and income in determining town wealth that is more equitable, stable, and free of distortions. Recommendation: use Median Household Income (MHI) with property value and weigh income more heavily than under the current formula to more accurately determine town wealth.
3. Update data used in determining wealth. Recommendation: use U.S. Census Bureau's American Community Survey income data, which is current and reliable rather than the once-a-decade Census long form data.
4. Determine a new measure of student need. Recommendation: use Free and Reduced Price Lunch (FRPL) eligibility to determine ECS student need weighting.
5. Consider increasing allocations to Alliance Districts. Recommendation: Increase the current law target amount allocation for Alliance Districts by four percentage points.
6. Help provide the needed support to districts with greater need. Recommendation: freeze funding to wealthier towns at the current level.
7. Reserve a part of the ECS grant for low-performing districts. Recommendation: create incentives to establish best practices and success.
8. Establish the ECS foundation amount. Recommendation: Raise per-student foundation dollar amount and consider comprehensive study for future estimates.
10
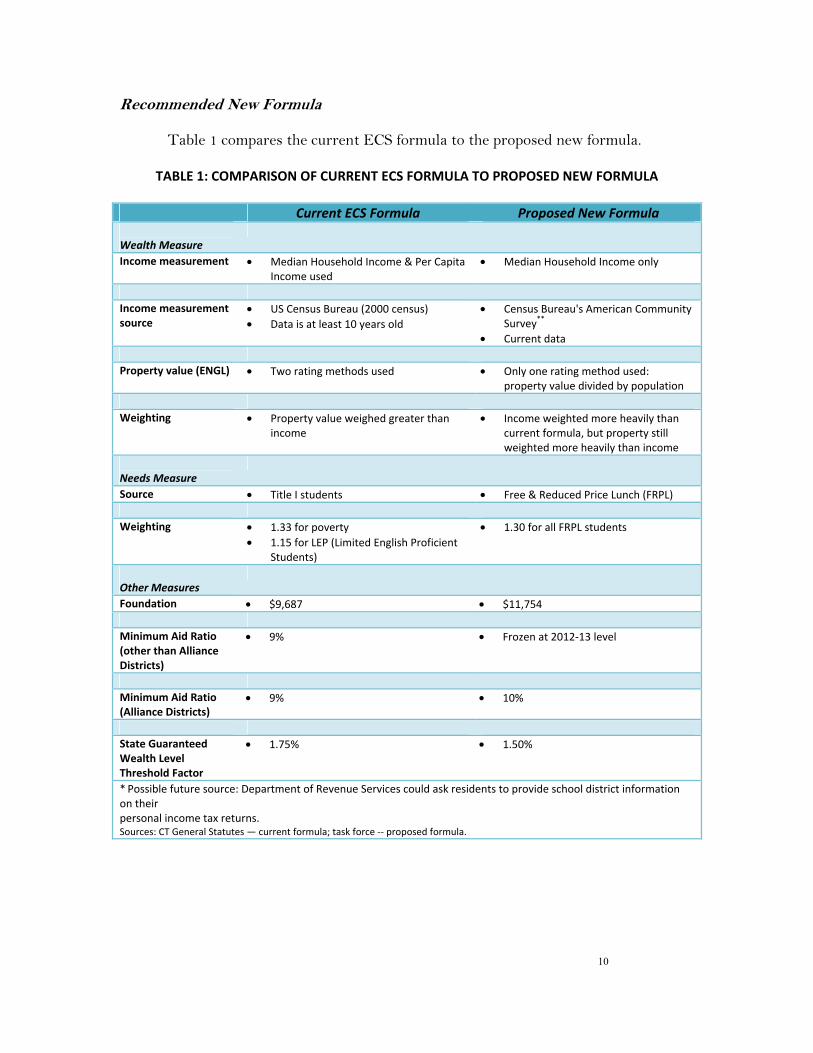
Recommended New Formula
Table 1 compares the current ECS formula to the proposed new formula.
TABLE 1: COMPARISON OF CURRENT ECS FORMULA TO PROPOSED NEW FORMULA
Current ECS Formula Proposed New Formula
Wealth Measure
Income measurement • Median Household Income & Per Capita Income used
• Median Household Income only
Income measurement source
• US Census Bureau (2000 census) • Data is at least 10 years old
• Census Bureau's American Community Survey**
• Current data Property value (ENGL) • Two rating methods used • Only one rating method used:
property value divided by population Weighting • Property value weighed greater than
income • Income weighted more heavily than
current formula, but property still weighted more heavily than income
Needs Measure
Source • Title I students • Free & Reduced Price Lunch (FRPL) Weighting • 1.33 for poverty
• 1.15 for LEP (Limited English Proficient Students)
• 1.30 for all FRPL students
Other Measures
Foundation • $9,687 • $11,754 Minimum Aid Ratio (other than Alliance Districts)
• 9% • Frozen at 2012-13 level
Minimum Aid Ratio (Alliance Districts)
• 9% • 10%
State Guaranteed Wealth Level Threshold Factor
• 1.75% • 1.50%
* Possible future source: Department of Revenue Services could ask residents to provide school district information on their personal income tax returns. Sources: CT General Statutes — current formula; task force -- proposed formula.

11
Below, Tables 2-5 demonstrate the proposed formula's results but should not be considered a specific recommendation to increase aid. To provide this demonstration, the model assumes an additional $700 million in ECS funds because this is the amount that would raise the formula aid from its FY 13 $1.94 billion appropriation to its fully funded current-law target. This is not a recommendation for a $700 million increase. The intention is to provide a comparison of the current law fully funded target to the Task Force recommendation. Furthermore, the tables illustrate the effects of the new recommended formula on certain groups of districts that are low performing or have lower financial capacity. There is considerable overlap in these groups.
TABLE 2: ALLIANCE DISTRICTS RESULTS*
Current Year Entitlement Current Law Target Task Force Recommendation
$1.237 billion $1.624 billion $1.717 billion *Alliance Districts are the 30 school districts with the lowest District Performance Index scores (DPI is a measurement of student achievement). They are: Ansonia, Bloomfield, Bridgeport, Bristol, Danbury, Derby, East Hartford, East Haven, East Windsor, Hamden, Hartford, Killingly, Manchester, Meriden, Middletown, Naugatuck, New Britain, New Haven, New London, Norwalk, Norwich, Putnam, Stamford, Vernon, Waterbury, West Haven, Winchester, Windham, Windsor, and Windsor Locks. Source: Office of Policy and Management and SDE
TABLE 3: POOREST DISTRICTS RESULTS (deciles 9 & 10)*
Current Year Entitlement Current Law Target Task Force Recommendation
$1.282 billion $1.642 billion $1.704 billion *The poorest districts are the 34 districts that make up the bottom two deciles of the list of districts ranked by wealth. They are: Ansonia, Bridgeport, Bristol, Brooklyn, Chaplin, Derby, East Hartford, East Haven, Enfield, Griswold, Hamden, Hartford, Killingly, Manchester, Meriden, Middletown, Naugatuck, New Britain, New Haven, New London, Norwich, Plainfield, Putnam, Sprague, Stafford, Sterling, Thomaston, Thompson, Torrington, Vernon, Waterbury, West Haven, Winchester, and Windham. Source: Office of Policy and Management and SDE

12
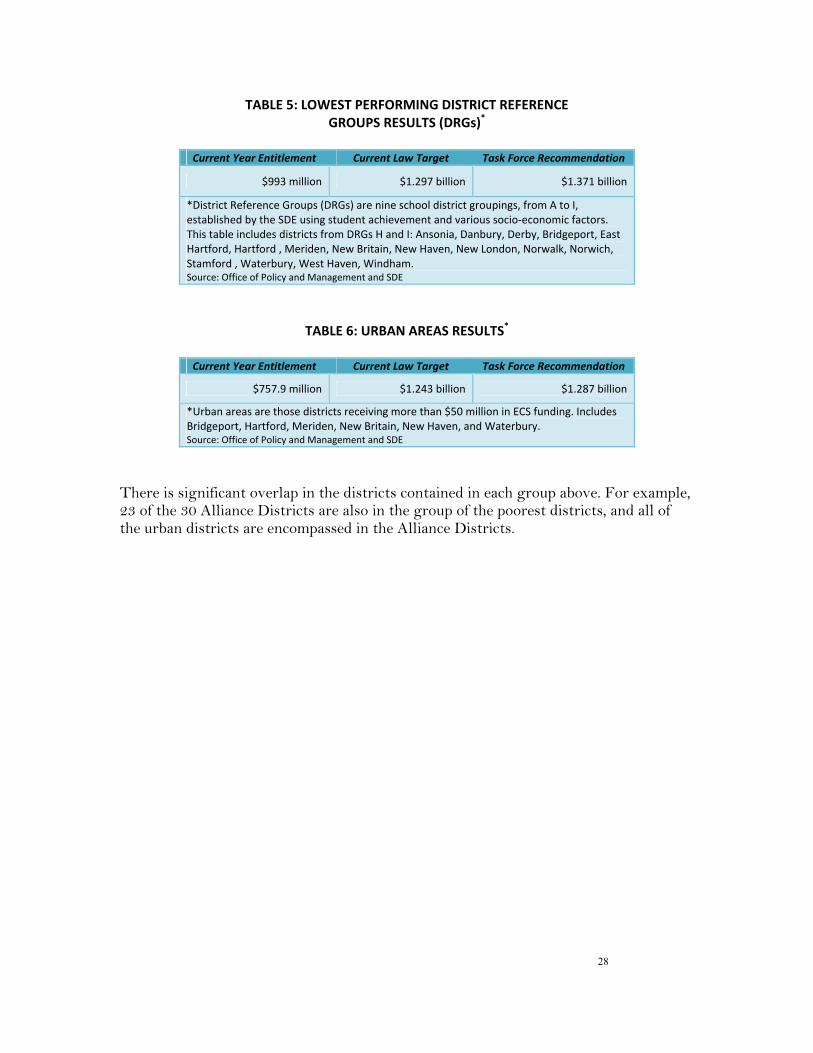
TABLE 4: LOWEST PERFORMING DISTRICT REFERENCE GROUPS RESULTS (DRGs)*
Current Year Entitlement Current Law Target Task Force Recommendation
$993 million $1.297 billion $1.371 billion *District Reference Groups (DRGs) are nine school district groupings, from A to I, established by the SDE using student achievement and various socio-economic factors. This table includes districts from DRGs H and I: Ansonia, Danbury, Derby, Bridgeport, East Hartford, Hartford , Meriden, New Britain, New Haven, New London, Norwalk, Norwich, Stamford , Waterbury, West Haven, Windham. Source: Office of Policy and Management and SDE
TABLE 5: URBAN AREAS RESULTS*
Current Year Entitlement Current Law Target Task Force Recommendation
$757.9 million $941 million $991.7 million *Urban areas are those districts receiving more than $50 million in ECS funding. They are Bridgeport, Hartford, Meriden, New Britain, New Haven, and Waterbury. Source: Office of Policy and Management and SDE
There is significant overlap in the districts contained in each group above. For example, 23 of the 30 Alliance Districts are also in the group of the poorest districts, and all of the urban districts are encompassed in the Alliance Districts.
13
FUNDING FOR SCHOOL CHOICE PROGRAMS
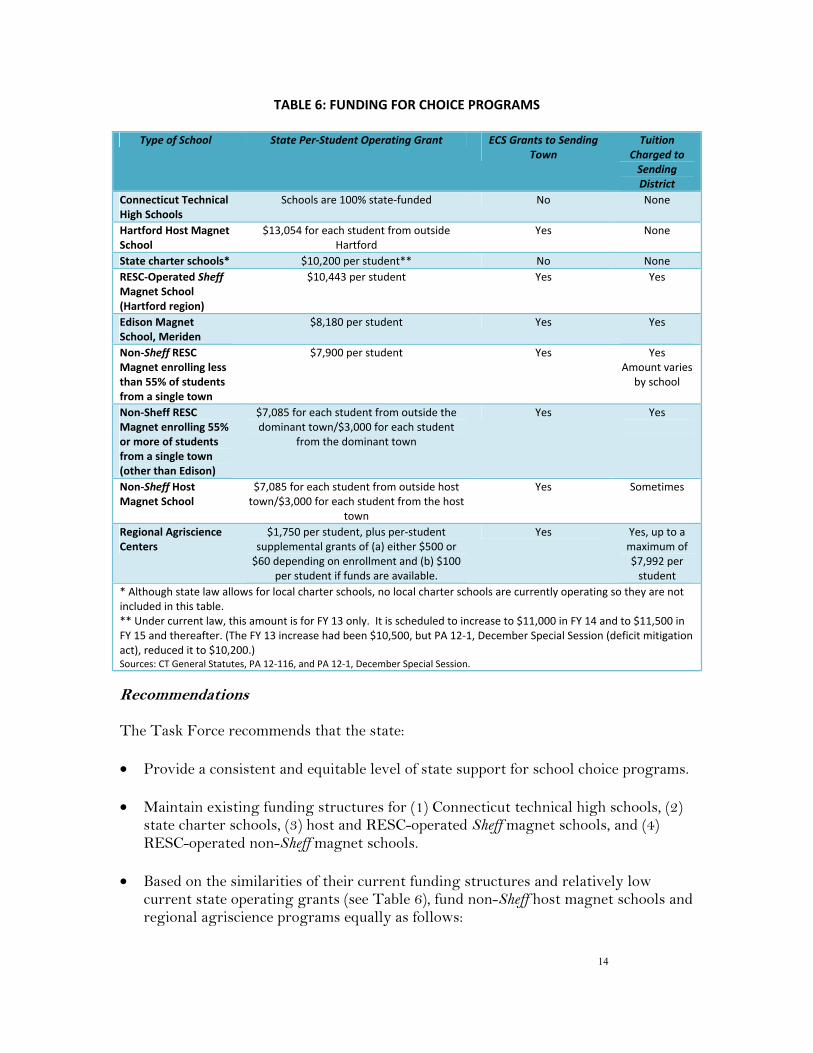
PA 11-48 requires the Task Force, in studying issues related to education funding, to give consideration to state grants to interdistrict magnet schools and regional agricultural science and technology education centers. Summary of Findings Through its choice programs, Connecticut offers students and parents a range of quality, flexible public education options. These programs allow each student to find a setting or educational theme that can help the student reach his or her potential. Connecticut's school choice options include interdistrict magnets, charters, technical high schools, and regional agriscience technology centers. Argiscience centers operate within existing high schools. (For additional information on the state's school choice programs please see the Task Force's Interim Report.) Choice programs in the Hartford area help address the Sheff v. O'Neill court decision and settlement that aim to reduce racial isolation for Hartford students. Because of this, magnet schools located in Hartford and surrounding towns that help address the Sheff settlement are known as Sheff magnets and those located in other parts of the state are known as non-Sheff magnets. Connecticut's choice programs receive varying levels of state support (see Table 6). Currently, non-Sheff host magnet schools receive a state operating grant of $7,085 for each student from outside the host district, and regional agriscience technology centers receive $1,750 for each student. This compares to (1) Sheff magnets receiving either $13,054 or $10,443 per out-of-district student (with Hartford-operated schools receiving the higher amount) and (2) state charter schools receiving $10,200 per student, with scheduled increases in FYs 14 and 15 to $11,000 and $11,500, respectively. Technical high schools are state-operated and therefore are fully supported by state funds.
14
TABLE 6: FUNDING FOR CHOICE PROGRAMS
Type of School State Per-Student Operating Grant ECS Grants to Sending Town
Tuition Charged to
Sending District
Connecticut Technical High Schools
Schools are 100% state-funded No None
Hartford Host Magnet School
$13,054 for each student from outside Hartford
Yes None
State charter schools* $10,200 per student** No None RESC-Operated Sheff Magnet School (Hartford region)
$10,443 per student Yes Yes
Edison Magnet School, Meriden
$8,180 per student Yes Yes
Non-Sheff RESC Magnet enrolling less than 55% of students from a single town
$7,900 per student Yes Yes Amount varies
by school
Non-Sheff RESC Magnet enrolling 55% or more of students from a single town (other than Edison)
$7,085 for each student from outside the dominant town/$3,000 for each student
from the dominant town
Yes Yes
Non-Sheff Host Magnet School
$7,085 for each student from outside host town/$3,000 for each student from the host
town
Yes Sometimes
Regional Agriscience Centers
$1,750 per student, plus per-student supplemental grants of (a) either $500 or
$60 depending on enrollment and (b) $100 per student if funds are available.
Yes Yes, up to a maximum of $7,992 per
student * Although state law allows for local charter schools, no local charter schools are currently operating so they are not included in this table. ** Under current law, this amount is for FY 13 only. It is scheduled to increase to $11,000 in FY 14 and to $11,500 in FY 15 and thereafter. (The FY 13 increase had been $10,500, but PA 12-1, December Special Session (deficit mitigation act), reduced it to $10,200.) Sources: CT General Statutes, PA 12-116, and PA 12-1, December Special Session.
Recommendations The Task Force recommends that the state: • Provide a consistent and equitable level of state support for school choice programs.
• Maintain existing funding structures for (1) Connecticut technical high schools, (2)
state charter schools, (3) host and RESC-operated Sheff magnet schools, and (4) RESC-operated non-Sheff magnet schools.
• Based on the similarities of their current funding structures and relatively low current state operating grants (see Table 6), fund non-Sheff host magnet schools and regional agriscience programs equally as follows:
15
o For each in-district student attending a regional agriscience program, provide a state grant of $3,000 (equal to the state grant host towns receive for each of their students attending their magnet schools).
o For each out-of-district student attending a regional agriscience program or a non-Sheff host magnet, provide a state grant equal to two-thirds of the state average regular program expenditures (RPE) for education for the prior year, plus 10% to compensate for more expensive specialized programs. Using the average per-student RPE for 2011-12 ($10,134), the proposed equalized funding for each out-of-district student would be $11,150. If the state provided two-thirds of this amount, it would increase the state grant for each out-of-district student (1) by $386, from $7,085 to $7,471, for non-Sheff host magnet schools and (2) by $5,721, from to $1,750 to $7,471, for regional agriscience centers.
o As is already the case for magnet schools, limit sending district tuition for students attending agriscience programs to no more than the difference between the state per-student grant and the prior year's average per-pupil cost of the program. This would reduce sending town tuition from the current maximum of $7,992 per student to approximately $3,500 to $4,500 per student. For less wealthy towns, per-student ECS grants will more than cover this level of per-student tuition.
o Phase-in the increased state grants over four years at 25%, 50%, and 75% of the difference between the current grant and the fully funded target grant.
16
SPECIAL EDUCATION FUNDING PA 11-48 requires the Task Force, in studying issues related to education funding, to give consideration to funding issues relating to the cost of special education for the state and municipalities. Summary of Findings
Special education services are cost-intensive, and include individualized education programs (IEPs) for each student; assistive technology; accommodations, such as taped textbooks, note takers, and other personal assistance; summer programming; and more. Connecticut school districts spent $1.715 billion on special education in FY 11, or approximately $27,000 per special education pupil, compared to an average of $14,425 per regular education student. The $1.715 billion represents 21.69% of total statewide education expenditures.
The state provides a state “excess cost” grant to help school districts with special education costs. The grant reimburses school districts for (1) any special education costs for a particular student that exceeds 4.5 times the district’s average per pupil expenditures for the preceding year and (2) 100% of special education costs if a student is placed in the district by a state agency and has no identifiable home district in the state.
For the past several fiscal years, the state budget has limited the state’s total expenditures for reimbursing local school districts for excess special education costs to the amount specified in the state budget. The State Department of Education (SDE) estimates total district excess special education costs for FY 13 to be $160-170 million. The department estimates that these costs will grow to $177 million in FY 14 and $186 million in FY 15. The state excess cost grant is currently capped at $140 million. Reimbursement grants for state-agency-placed children whose home districts cannot be identified (known as "no-nexus" children) are not affected by the cap and must be paid in full.
In 2011-12, 63,651 Connecticut students were identified as eligible for special education and related services. Districts were eligible for state excess cost grants for 4,366 of these students. The 4,366 excess-cost students generated approximately $374 million in costs in that year. A majority of these costs (52%) were incurred to provide services at public institutions, while 48% were attributable to private placements. State agency-placed students have a higher percentage of private placements (80%). Approximately 300 of the state agency-placed students are placed in facilities outside the state at a cost of $29 million annually.
The Task Force is not proposing to diminish or renege on the state's commitment to special education students. Rather, like most public policymakers today, special education officials and other educators need to find efficiencies, innovations, and alternative delivery methods if we are to continue providing the services we are legally mandated and morally committed to provide. To that end, the Task Force is making recommendations to both increase the state's financial support for special education and

17
reduce overall costs by (1) innovative new service delivery strategies and (2) better state coordination and monitoring of school district procedures. Recommendations
1. State Support of Special Education and the Excess Cost Grant. The state
should continue to support a portion of local special education expenditures to relieve the escalating financial burden on local school districts and to better meet its obligation to fund public education, including special education. This commitment must include a new process for reimbursing school districts for excess costs. Consequently:
• The state should pay 100% of both the regular and special education costs of
state- agency-placed students.
• For local school district placements, the General Assembly should adopt legislation to:
o increase and guarantee the excess cost grant; o include a new, fixed amount definition of “excess” for all districts, such as
$50,000 (see Table 7); and o develop state managed and supported IEPs for any pupil costing over
$150,000 (approximately 300 students statewide - see Table 7) or, in the alternative, a state inspected and validated IEP for all such high-cost pupils.
TABLE 7: CONNECTICUT SPECIAL EDUCATION EXCESS COST PLACEMENTS: 2011–12
Eligible
Students Costs Over
$50,000 Costs Over
$100,000 Costs Over
$150,000 Costs Over
$200,000 Costs Over
$300,000 State-placed 1,163 607 113 14 3 0 Locally placed 3,203 3,188 1,091 265 80 8 Total 4,366 3,795 1,204 279 83 8
• If sufficient state funding is not available to meet the full excess costs for all
towns, the state should consider, either (1) creating a sliding scale reimbursement based on a town’s wealth or (2) instituting a three- to five-year phase in to full funding.
2. Increased State Monitoring. The appropriateness of special education
identification and placement has a direct bearing on total costs.
• The State Department of Education should examine “outlier” districts every three years to determine each district's (1) percentage of special education students; (2) percentage of students in each special education classification; (3) percentage of the local budget spent on special education; (4) the percentage and cost of out-of- district placements; (5) the number, if any, of out-of-state placements; (6) special education students' achievement and numbers exiting
18
special education; and (7) special education students' participation in state assessments.
• As part of the examination, the causes of a district's outlier status must be
pursued and evaluated, and SDE and the district should develop a joint plan to implement, monitor, and report progress made.
3. State Incentive Grants. The state should provide small incentive grants to districts, regions, or higher education institutions that demonstrate superior special education programs and reduced costs.
4. Innovative Program Models. The state should engage higher education faculty in
the study of special education, taking advantage of their input and expertise. Goals of such studies should include (1) enhancing special education program quality, (2) improving the process for identifying children eligible for special education, (3) achieving better outcomes for special education students, (4) controlling costs, and (5) defining reasonable parameters for IEPs.
5. Inventory of Special Education Programs. The SDE and the six RESCs should
inventory local, regional, statewide, public and private special education programs against projected needs over the next 10 years. The inventory should include commentary on the availability of third-party insurers to cover medically related expenses for special education students. A planning and placement team adopting an IEP that uses higher-cost private programs over comparable, lower- cost public programs should be required to provide a compelling rationale for the selection.
This report was written at the Task Force's direction by: John Moran and Marybeth Sullivan Connecticut General Assembly Office of Legislative Research
2013-R-0064

19
APPENDIX A: ECS TASK FORCE FORMULA SUBCOMMITTEE REPORT
The Formula Subcommittee has focused on the education aid grant formula as set forth in section 10-262h of the Connecticut General Statutes as charged by the General Assembly. It has identified objectives which will give clarity and purpose to the ECS grant process, and to its funding. Its specific and general recommendations, if adopted, will provide guidance and stability to a complex and sometimes controversial exercise of determining the annual allocations.
The recommendations, if adopted, will lead to a fairer and more predictable allocation, and a more understandable and reliable process. There are, however, numerous variables that ultimately determine the district-by-district allocations, and changes that have been made over the years that have created some inconsistencies that may require in-depth analysis. In addition, the ultimate ECS grant amount is an important factor in determining the specific allocations, and this total amount is not presently funded. The amount to be funded in the near future is also not known, since economic conditions exist that will conceivably alter that amount. Therefore, the recommendation should be compared to the current law target amount (full funding goal under current law) to demonstrate the outcome of the recommendation when compared to the current formula. Further analysis will be required to explain certain district aid variances as compared to the current formula target amount.
What is critically important is that once the ECS grant is determined it be fully funded from year to year with an appropriate phase-in period if required. The uncertainty and unpredictably of the present funding creates undue hardships on districts making it very difficult for them to adequately forecast their annual budgets.
The recommendations will provide a path that will lead to a fairer and more understandable ECS grant process. There are variations of the recommendations that can be prepared, and perhaps additional analysis and work needs to be done. There can be no doubt that if the recommendations or variations of them are adopted, and a strong commitment by government is made to annually commit the funds to ECS, there will be a significant improvement to the ECS process that will greatly benefit the educational system and students of Connecticut.

20
SUMMARY OF OBJECTIVES AND RECOMMENDATIONS GENERAL OBJECTIVES Objective #1: Comply with state constitutional requirements for the equalization of educational opportunities. Court cases have consistently determined that students must receive an equal educational opportunity. The ECS formula must therefore continue to strive to direct state money inversely to districts’ capacity to pay for education. Objective #2: Help close the achievement gap. The achievement gap in Connecticut must be eliminated. This will require an effort by the state to ensure that all school districts have the resources necessary to help achieve this objective but particularly those districts with the greatest need and the lowest achievement. SPECIFIC OBJECTIVES & RECOMMENDATIONS Objective #1: Eliminate the uncertainty of the annual ECS grant. Recommendation #1: Establish target grant amount and criteria to maintain grant over a period of years. ECS grants are an integral part of educational funding, and the state should adopt a four-year funding goal for the new updated ECS formula starting in FY 14 and commit to reaching at least 90% of the goal within four years and 100% within two years thereafter. Funding the new formula target goal will be contingent on the state’s financial capability, but there should be criteria specifying the extraordinary circumstances under which the ECS goal would not be fully funded. At the end of the period that the formula is fully funded, the state should adopt a new four-year funding goal, after reevaluating the formula and its policy rationale, and making necessary or desirable adjustments. As much as possible, grants should be predictable by the districts to allow for more accurate budgeting. Current data should be incorporated into the formula and frozen for a four-year period to assure within a range the formula amounts that will be granted. As part of this commitment by the state, local districts must be committed to (1) spending the funds that are required for educational purposes and (2) providing education expenditure transparency to ensure public accountability. Future ECS grants could be adjusted if these funds are not utilized for education. Objective #2: Establish a process to weigh property value and income in determining town wealth that is more equitable, stable, and free of distortions.

21
Recommendation #2: Use Median Household Income (MHI) with property value and weigh income more heavily to more accurately determine town wealth. Currently, property value is the dominant measure of town wealth in the formula. Although median household income and per-capita income are also used, the formula is heavily weighted for property value. It is recommended that income be weighed more heavily to accurately reflect the wealth of a district. Town wealth should still rely most heavily on property value, but the formula adjustment for income should be greater than under the current formula, yet remain less than 50%. It would appear that using median household income alone, as opposed to per capita income and median household income, as the single income measure will provide a more precise measure of district income. Combined with one single measure of property value as opposed to using two measures of property value, this should result in a fairer and more stable measurement of wealth. Greater weighting of median household income appropriately recognizes the districts that are poorer in median income but may have above average property values. Three year rolling averages of data should be utilized whenever possible. Objective #3: Update data used in determining wealth. Recommendation #3: Use American Community Survey income data. At present the income data used to determine wealth is at least ten years old and since the U.S. Census no longer records income data using the long form survey, a new and current source of this information is required. The Census Bureau's American Community Survey income data is reliable and gathered annually rather than the once-a-decade Census long form data. It is also possible that in the future the Department of Revenue Services can ask residents to provide school district information on their personal income tax returns. If this is done a comparative analysis can be prepared to determine which data gathering process provides the most reliable information. What is important is that current data be utilized as opposed to Census Bureau data that is ten or more years old.
22
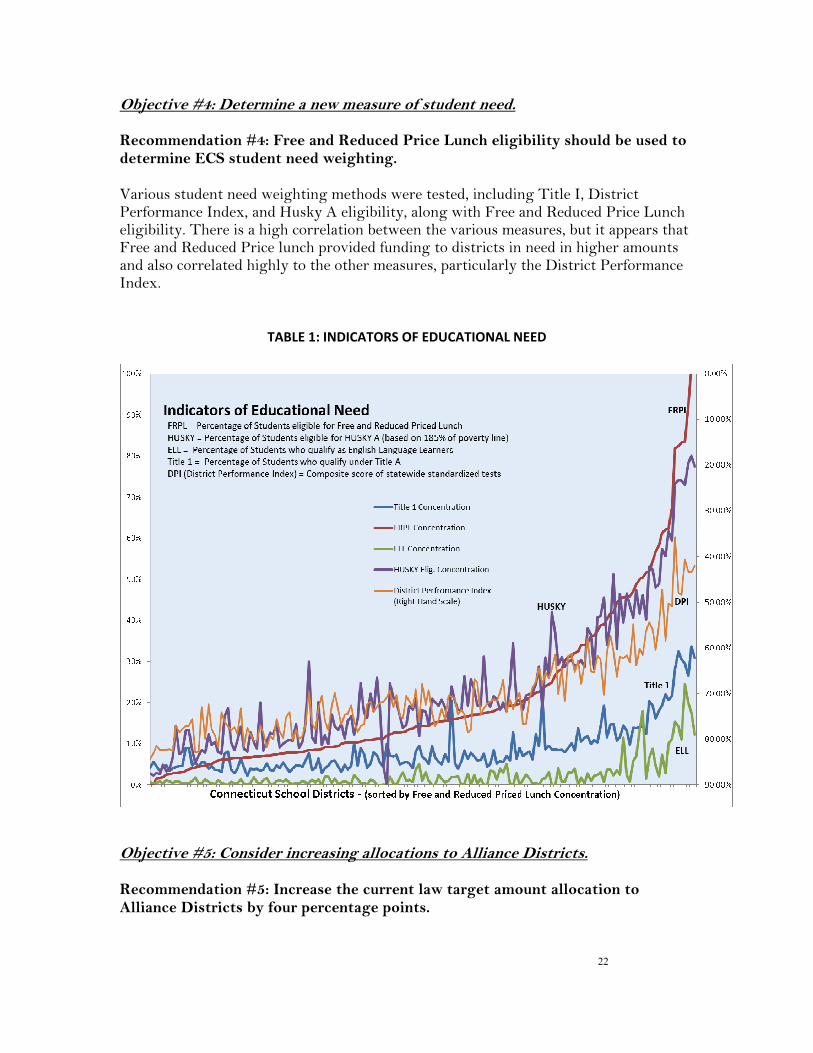
Objective #4: Determine a new measure of student need. Recommendation #4: Free and Reduced Price Lunch eligibility should be used to determine ECS student need weighting. Various student need weighting methods were tested, including Title I, District Performance Index, and Husky A eligibility, along with Free and Reduced Price Lunch eligibility. There is a high correlation between the various measures, but it appears that Free and Reduced Price lunch provided funding to districts in need in higher amounts and also correlated highly to the other measures, particularly the District Performance Index.
TABLE 1: INDICATORS OF EDUCATIONAL NEED
Objective #5: Consider increasing allocations to Alliance Districts. Recommendation #5: Increase the current law target amount allocation to Alliance Districts by four percentage points.

23
The state increased funding to Alliance Districts for FY 13 to help address a greater need for assistance in improving student academic achievement. Under the current law target amount, which is the full funding goal under the law, Alliance Districts would receive approximately 60% of the total state allocation. Consideration should be given to increasing the Alliance District allocation to approximately 64%. This should be done even in times of economic constraint to ensure that the overall balance of the ECS formula is weighted to the neediest districts. Objective #6: Help provide the needed support to districts with greater need. Recommendation #6: Freeze aid to wealthier towns at current level. A revision of the ECS should hold funding for wealthier towns at the current FY 13 level. Communities in need should receive sufficient and adequate funding and minimum aid to communities that are not in need would not increase under this recommendation. In the future, ability to pay should be revisited to determine whether further adjustments should be made in aid to the towns with the greatest ability to pay. Objective #7: Reserve a part of the ECS grant for low-performing districts. Recommendation #7: Create incentives to establish best practices and success. A determined amount would be contingent on the State Department of Education approving district plans to improve performance. This is to ensure that the lowest performing districts are implementing generally accepted, critical, research-based best practices to improve student achievement. A small percentage of the grants should be contingent on the districts’ specific plans and their performance in meeting their educational goals. Districts whose performance improves but whose wealth level remains the same should continue to receive this special funding. Expansion of this program should be considered depending on future success. Consideration should also be given to merging other school and district categorical grants into the reserve portion of the ECS Alliance District grant programs provided that it does not supplant ECS funding. This will increase efficiency and by adding these grants into the reserve portion of the ECS Alliance District grant programs it should be understood that this is not meant as a reduction of those grants nor a replacement for ECS funding.
24
Objective #8: Establish the ECS foundation amount. Recommendation #8: Raise per-student foundation and consider comprehensive study for future estimates. The foundation is a key component in the formula, and it must be adjusted to more accurately reflect current needs and costs. Criteria should be adopted to periodically increase the foundation amount so that it reflects the costs of educating public school children in Connecticut. Consideration should be given to a comprehensive cost study regarding the demographic, economic, and education cost factors that should be considered in determining an appropriate foundation level for the cost of education. This study should also review the allocation of educational costs and staff ratios in order to appropriately analyze efficiencies and effectiveness. ACCOMPANYING FINANCIAL FORMULA Note: The model presented is for comparative purposes only to demonstrate the change that the ECS Task Force recommendations make when compared to the current law target amount. The new formula would increase the allocations to the Alliance Districts, the poorer districts, the lower performing districts and the urban centers. A phase-in period of funding and equal distribution over a four-year period is assumed. Minor adjustments can be made that will alter the amounts that districts receive. In addition, the number of years for the phase-in as well as the amount phased-in each year could also be altered. GENERAL ASSUMPTIONS
• The targeted amount of the current law (i.e., the fully funded goal under current law) of approximately $2.7 billion is used for the new formula in order to compare results.
• A phase-in period has been assumed for the funding amounts of the new formula entitlement.
• Districts in need and those underperforming will receive a larger proportion of the funding than they do under current law.
SPECIFIC ASSUMPTIONS I. Phase-In
Simulation is based on the new formula funding level being phased-in equally over a 4 year period. Differences in funding between new formula and the current law target entitlement would also be phased in over a 4 year period.
Data would be frozen over phase-in period.
Note: It is possible that budgetary considerations may require the ECS grant to not be phased in at the 25% rate in the early years. As economic conditions improve, the phase-in would be accelerated over the later years to reach the target level. If this were to occur,

25
the Alliance Districts could receive a disproportionately larger share of the additional funding than they otherwise would receive.
II. Foundation
For the recommended formula, a foundation of $11,754 is used. III. Need-Weighted Students
Free and Reduced Price Lunch eligibility has been used to determine need students. A weighting of 1.30 is used for these students in the various models.
IV. Town Wealth
Median Household Income (MHI) replaces the average of MHI and Per Capita Income (PCI). Current data is utilized for MHI.
Property wealth, as measured by Equalized Net Grand List (ENGL), and MHI are weighted in the determination of Town Wealth. In the model, the weighting goal is to more equitably balance ENGL and MHI.
State Guaranteed Wealth Level is set at 1.5 times the median town wealth.
V. Target Aid The Minimum Aid Ratio is replaced by a freeze in ECS aid for wealthier towns,
with an exception for Alliance District towns. Alliance Districts will receive a minimum aid ratio of 10%.
Table 2 provides the comparison of the current law formula and the proposed new formula.

26
TABLE 2: COMPARISON OF CURRENT ECS FORMULA AND PROPOSED NEW FORMULA
Current ECS Formula Proposed New Formula
Wealth Measure
Income measurement • Median Household Income & Per Capita Income used
• Median Household Income only
Income measurement source
• US Census Bureau (2000 census) • Data is at least 10 years old
• American Community Survey* • Current data
Property value (ENGL) • Two rating methods used • Only one rating method used:
property value divided by population Weighting • Property value weighed greater than
income • Income weighed more heavily than
current formula, but property still weighted more heavily than income
Needs Measure
Source • Title I students • Free & Reduced Price Lunch (FRPL) Weighting • 1.33 for poverty
• 1.15 for LEP (limited English proficient students)
• 1.30 for all FRPL students
Other Measures
Foundation • $9,687 • $11,754 Minimum Aid Ratio (other than Alliance Districts)
• 9% • Frozen at 2012-13 level
Minimum Aid Ratio (Alliance Districts)
• 9% • 10%
State Guaranteed Wealth Level Threshold Factor
• 1.75% • 1.50%
* Possible future source: Department of Revenue Services could ask residents to provide school district information on their personal income tax returns. Sources: CT General Statutes -- Current formula; task force -- proposed formula.
Below, Tables 3-6 demonstrate the proposed formula's results but should not be
considered a specific recommendation to increase aid. To provide this demonstration, the model assumes an additional $700 million in ECS funds because this is the amount that would raise the formula aid from its FY 13 $1.94 billion appropriation to its fully funded current-law target. This is not a recommendation for a $700 million increase. The intention is to provide a comparison of the current law fully funded target to the Task Force recommendation. Furthermore, the tables illustrate the effects of the new recommended formula on certain groups of districts that are low performing or have lower financial capacity. There is considerable overlap in these groups.

27
TABLE 3: ALLIANCE DISTRICTS RESULTS*
Current Year Entitlement Current Law Target Task Force Recommendation
$1.236.7 billion $1.624 billion $1.717 billion *Alliance Districts are the 30 school districts with the lowest District Performance Index scores (DPI is a measurement of student achievement). They are: Ansonia, Bloomfield, Bridgeport, Bristol, Danbury, Derby, East Hartford, East Haven, East Windsor, Hamden, Hartford, Killingly, Manchester, Meriden, Middletown, Naugatuck, New Britain, New Haven, New London, Norwalk, Norwich, Putnam, Stamford, Vernon, Waterbury, West Haven, Winchester, Windham, Windsor, and Windsor Locks. Source: Office of Policy and Management and SDE
TABLE 4: POOREST DISTRICTS RESULTS (deciles 9 & 10)*
Current Year Entitlement Current Law Target Task Force Recommendation
$1.282 billion $1.642 billion $1.704 billion *The poorest districts are the 34 districts that make up the bottom two deciles of the list of districts ranked by wealth. They are: Ansonia, Bridgeport, Bristol, Brooklyn, Chaplin, Derby, East Hartford, East Haven, Enfield, Griswold, Hamden, Hartford, Killingly, Manchester, Meriden, Middletown, Naugatuck, New Britain, New Haven, New London, Norwich, Plainfield, Putnam, Sprague, Stafford, Sterling, Thomaston, Thompson, Torrington, Vernon, Waterbury, West Haven, Winchester, and Windham. Source: Office of Policy and Management and SDE
28
TABLE 5: LOWEST PERFORMING DISTRICT REFERENCE GROUPS RESULTS (DRGs)*
Current Year Entitlement Current Law Target Task Force Recommendation
$993 million $1.297 billion $1.371 billion *District Reference Groups (DRGs) are nine school district groupings, from A to I, established by the SDE using student achievement and various socio-economic factors. This table includes districts from DRGs H and I: Ansonia, Danbury, Derby, Bridgeport, East Hartford, Hartford , Meriden, New Britain, New Haven, New London, Norwalk, Norwich, Stamford , Waterbury, West Haven, Windham. Source: Office of Policy and Management and SDE
TABLE 6: URBAN AREAS RESULTS*
Current Year Entitlement Current Law Target Task Force Recommendation
$757.9 million $1.243 billion $1.287 billion *Urban areas are those districts receiving more than $50 million in ECS funding. Includes Bridgeport, Hartford, Meriden, New Britain, New Haven, and Waterbury. Source: Office of Policy and Management and SDE
There is significant overlap in the districts contained in each group above. For example, 23 of the 30 Alliance Districts are also in the group of the poorest districts, and all of the urban districts are encompassed in the Alliance Districts.

29
TABLE 7: ECS FORMULA WORKSHEET: CURRENT COMPARED TO TASK FORCE RECOMMENDATION
Base Formula Aid = (A) Need Students x (B) Base Aid Ratio x (C) Foundation + (D) Regional Bonus
I FORMULA Current Law Target Aid Simulated Target Aid
(A) Total Need Students 561,110 590,239
(B) Aid Ratio 1 – (Town Wealth / SGWL) 1 – ((ENGL per Capita / SGWL) + (MHI / SGWL)) / 2)
(C) Foundation – With Hold Harmless
$9,687 $11,754
(D) Regional Bonus $100 x (Number of Regional
Grades / 13) $100 x (Number of Regional
Grades / 13)
II FORMULA DETAIL
Student Weighting
Resident Students + 33% Title I Poverty +
15% Limited English Proficient Students
Resident Students + 30% Free and Reduced
Town Wealth Factors*
((ENGL per Capita + ENGL per Need Student) / 2) x
(((PCI/HPCI) + (MHI/HMHI)) / 2)
ENGL per Capita and MHI
State Guaranteed Wealth Level (SGWL)
Median Town Wealth x 1.75 Median Town ENGL per Capita x 1.5 and Median Town MHI x 1.5
III OTHER DATA
Minimum Aid Ratio 9% Frozen at 2012-13 level Minimum Aid Ratio for Alliance Districts
9% 10%
Target Aid Foundation x Need Students x
Aid Ratio Foundation x Need Students x Aid
Ratio
* Town Wealth Factors: ENGL Three-year average of the 2008-2009-2010 Equalized Net Grand List per Capita (Source:
Office of Policy and Management) PCI 2010 per Capita Income (Source: U.S. Bureau of the Census) MHI 2010 Median Household Income (Source: U.S. Bureau of the Census) HMHI & HPCI Town with the highest MHI and highest PCI.

30
APPENDIX B: ECS TASK FORCE SCHOOL CHOICE SUBCOMMITTEE REPORT
1. Provide a consistent and more equitable level of state support among school choice programs. 2. Fund non-Sheff host magnet school programs and regional agriscience programs equally by providing the following: a. For In-District (host school) students, the state would provide a standard $3,000 per student grant for each program. b. For Out-of-District (sending town) students, use the state average regular program expenditures (RPE) plus 10% (to compensate for more expensive specialized programs) as the true cost, and the state would provide a grant for 2/3 of this amount for each out-of-district student attending these schools. Their sending towns would be responsible for paying tuition for the amount up to, but not to exceed, the difference between the average NCEP and the state’s contribution. 3. Allow each sending town’s current ECS per pupil grant to reflect its ability to pay and give some relief to less wealthy towns. For Example: Direct cost = $11,150 2/3 = $7,471(state aid) 1/3 = $3,679(sending town tuition)
TABLE 1: ECS GRANTS AND MAXIMUM TUITIONS
Town ECS grant (2011-2012)
Maximum tuitioncharged
“ECS money retained” (even though
student leaves)
Ansonia $5,241 $3,679 $1,562 Naugatuck $5,719 $3,679 $2,040 Southbury $755 $3,679 none Bridgewater $592 $3,679 none

31
Currently, A. Non-Sheff host magnets receive $7,085 per student state support, and charge an average of $4,000 tuition for each sending town student, total average amount now collected is approximately $11,085 per student. Change: Host schools would receive $7,471 per student, and charge up to $3,679 tuition, total possible amount collected would now be $11,150 per student. Impact: Provide more state support for non-Sheff host magnet schools, and some sending town relief B. Agriscience schools receive $1,750 per student state support, and charge $7,992 tuition for sending town students, total amount now collected is $9,742 per student. Change: Host schools would receive $7,471 per student, and charge up to $3,679 tuition, total possible amount collected would now be $11,150 per student. Impact: Provide more state support for host agriscience schools, and provide large sending town relief. NOTE: Both schools could charge up to $3,679 tuition, yet most would charge a lower rate, as magnet schools do now, to continue to encourage districts to send students to these school choice programs, which would provide for more sending town relief. 4. The increased subsidy for both schools would be phased in over four years (25% each year). 5. Due to their unique funding structures, charter schools and Vocational Technical schools would be left out of the ECS formula.
Four Year Phase-In Plan
TABLE 2: ENROLLMENT (2011-2012)
Type of School In-district Students Out-of-district Students Total Enrollment Non-Sheff Host Magnet Schools 7,920 4,646 12,566 Regional Agriscience Schools 1,407 1,838 3,245

32
Additional Cost to the State Non-Sheff Host Magnet Schools - Total new money needed: $1.8 million dollars $7,471 - $7,085 = $386 X 4,646 out of district students = $1.8 million dollars more for magnets (2/3 cost – existing grant = $386 new funds X 4,646 students = $1.8 million more for magnets) YEAR ONE: 25% of the increase = $450,000 for magnets YEAR TWO: 25% of the increase = $450,000 for magnets YEAR THREE: 25% of the increase = $450,000 for magnets YEAR FOUR: 25% of the increase = $450,000 for magnets TOTAL AFTER FOUR YEARS: $1.8 million for more for magnets Regional Agriscience Schools - Total new money needed: $12.4 million dollars a. $7,471 - $1,750 = $5,721 X 1,838 out of district students = $10.5 million dollars for out of district students (2/3 cost – existing grant = $5,721 new funds X 1,838 students = 10.5 million more) b. $3,000 - $1,750 = $1,250 X 1,407 in district students = $1.8 million dollars for in-district students (new in-district funding level - existing grant = $1,250 new funds X 1,407 students = $1.8 million) YEAR ONE: 25% of the increase = $3.1 million for agriscience YEAR TWO: 25% of the increase = $3.1 million for agriscience YEAR THREE: 25% of the increase = $3.1 million for agriscience YEAR FOUR: 25% of the increase = $3.1 million for agriscience
• Total new money needed in 1st year: $450,000 (magnets) plus 3.1 million (agriscience) = $3.55 million
• Total new money needed in 2nd year: $450,000 (magnets) plus 3.1 million (agriscience) = $3.55 million
• Total new money needed in 3rd year: $450,000 (magnets) plus 3.1 million (agriscience) = $3.55 million
• Total new money needed in 4th year: $450,000 (magnets) plus 3.1 million (agriscience) = $3.55 million
TOTAL NEW MONEY TO ACCOMPLISH MORE EQUITY AFTER FOUR YEARS: $14.2 million

33
SUMMARY OF RECOMMENDATIONS AND RESULTS Recommendation #1: Provide a consistent and more equitable level of state support among school choice programs. Result #1: After the four year phase-in plan, both non-Sheff host magnets and agriscience programs will be at $7,471 state support per student, which brings them both closer to achieving equity of state support for all school choice programs. (Charters are at $10,500, RESC Operated Sheff Magnets are at $10,443, Vo-Tech is at $12,764.)
Table 3. Comparison of Current and Proposed Support for School Choice Programs BEFORE
$12,764
$10,500 $10,443
$7,085
$1,750
$0
$2,000
$4,000
$6,000
$8,000
$10,000
$12,000
$14,000
Vo-TechSchools
CharterSchools
RESCOperated Sheff
Magnets
Non-Sheff HostMagnets
AgriscienceSchools
CURRENT STATE PER STUDENT SUPPORTFOR SCHOOL CHOICE PROGRAMS, 2012-2013
AFTER
$12,764
$10,500 $10,443
$7,471 $7,471
$0
$2,000
$4,000
$6,000
$8,000
$10,000
$12,000
$14,000
Vo-TechSchools
CharterSchools
RESCOperated Sheff
Magnets
Non-Sheff HostMagnets
AgriscienceSchools
PROPOSED STATE PER STUDENT SUPPORTFOR SCHOOL CHOICE PROGRAMS
Recommendation #2: Fund non-sheff host magnet school programs and regional agriscience programs equally. Result #2: After the four year phase-in plan, both non-Sheff host magnets and agriscience programs will be funded equally at the level of $7,471 state support per student, and all sending towns will have the same maximum tuition charge (up to $3,679), regardless of which regional school choice program they send their students to (magnet or agriscience).

34
Recommendation #3: Allow each sending town’s current ECS per pupil grant to reflect their ability to pay and give some relief to less wealthy towns. Result #3: Sending towns, regardless of which program they send their students to, will get a reduction in tuition payments required (because of the increased level of state support per student). Also, since they have always “retained” the ECS payments for these students even though they leave their towns, the current ECS structure reflects their ability to pay, thus this concurs with the current SDE practice of ushering more state support to towns with more financial need. (i.e. less wealthy cities like Naugatuck get to “keep” much more of their larger piece of ECS money than wealthier towns like Southbury.) Recommendation #4: The increased subsidy for both schools would be phased in equally over four years (25% each year). Result #4:
• Total new money needed in 1st year: $450,000 (magnets) plus 3.1 million (agriscience) = $3.55 million
• Total new money needed in 2nd year: $450,000 (magnets) plus 3.1 million (agriscience) = $3.55 million
• Total new money needed in 3rd year: $450,000 (magnets) plus 3.1 million (agriscience) = $3.55 million
• Total new money needed in 4th year: $450,000 (magnets) plus 3.1 million (agriscience) = $3.55 million
TOTAL NEW MONEY TO ACCOMPLISH MORE EQUITY AFTER FOUR YEARS: $14.2 million Recommendation #5: Due to their unique funding structures, charter schools and vocational technical schools would be left out of the ECS formula. Result #5: Because their current funding mechanisms are unique and vastly differentfrom the regional magnet schools and the agriscience programs, charter schools and Vocational Technical schools are left as they are, and would remain out of the ECS formula.
35
IMPORTANT NOTE: Although this proposal will cost the state more money, it is actually relieving the 150+ sending towns of that same amount of money due to decreasing the tuition charged to these towns, since the state is increasing its funding share for these two regional programs, as well as providing all of the host towns (towns that host the non-Sheff host magnets and regional agriscience programs) with more state support. The bottom line is that the state will be picking up more of the cost of these programs, more in line with its financial commitment with the other school choice programs (charter, Sheff magnet and vo-tech) while all towns in the state will benefit financially (reduce their costs because the state is increasing their share of the financial burden) with this proposal.
36
APPENDIX C: ECS TASK FORCE SPECIAL EDUCATION SUBCOMMITTEE REPORT
A Short History of Special Education
During the early years of our nation’s history, children with mental retardation, children who were deaf, blind, or learning disabled, and children from other countries were housed with delinquent children in asylums and other facilities separate from the general population. (The very first special education school in the United States was the American Asylum for the Education and Instruction of the Deaf and Dumb in Hartford, Connecticut, in 1817.)
In the 1950s and even into the 1960s, students with special needs were still caught
between two unpleasant scenarios. Many were legally denied access to special education classes in their local schools, and depending on their disability — mental disability, physical handicaps such as vision or hearing loss, and other special needs — they were either institutionalized or lived at home without educational options. Those who were enrolled in schools were not always the luckier. It was not unusual to see students with physical and learning disabilities sitting next to students with behavioral and disciplinary issues in America’s special education classes, isolated from the rest of the school population. Developmentally disabled and autistic students could also be found in those same classrooms. The children of migrant workers who could not speak English were also placed in “special education” classes, which became in many school districts a catch-all for students for which educational services were simply too time-intensive or expensive to provide in mainstream classrooms. These classrooms often provided a bare minimum of educational instruction, and existed to babysit the children involved and keep the peace in the rest of the school.
By the mid-1960s, things started to change, although even in 1970, only 20 percent
of students with disabilities had access to public education. The Elementary and Secondary Education Act of 1965 created a Bureau of Education for the Handicapped, but providing service to people with special needs was not yet mandated by the law. In 1972, two Supreme Court decisions (PARC v Pennsylvania and Mills v D.C. Board of Education) established that children with disabilities have an equal right of access to public education. In 1975, Congress passed Public Act 94-142 — now known as the Individuals with Disabilities Act (IDEA) — and mandated that all school districts educate students with disabilities. Additionally, Connecticut proposed its own special education statute in 1967.
In particular, the law stipulated that students were to receive “free appropriate
public education” in the “least restrictive environment” possible. While the law also promised federal support for special education in the form of 40 percent of the funding, the federal government has never paid more than 15 percent of the costs of special education. Currently, the federal government is paying 7 percent of the costs of special education, or $132 million of a total of $1.7 million in Connecticut. Connecticut PA 12-173 was enacted on June 15, 2012.
37
The existence of a dual system — federal and state — including statutes, regulations, guidelines and court decisions, and the significant specification of the processes of identifying and serving special education students has made this the most often criticized and burdensome part of the public school system. Unfortunately, the focus on legal process requirements has resulted in less attention to the actual achievement and outcomes of special education students. Identification of a student as being a special education student, unfortunately, often comes with lower expectations from all those involved, with little chance of ever being de-certified and returned to regular education. Special Education Today
As a result of IDEA and other legislative actions, the percentage of special education students rose from 8.3 percent of all students in 1977 to about 13.7 percent in 2004, according to the U.S. Department of Education. In Connecticut, the statewide identification rate for special education was 11.7 percent in 2011–12, down from a high of 14 percent in the early 1990s. There are about a dozen districts with identification rates above 15 percent, “outliers” that will need additional study. The lowest performing districts have identification rates significantly higher than the state average. In raw numbers, 63,651 students in Connecticut were identified with special needs in 2011–12; over 2,000 were placed out of their district.
Among the disability classifications, the percentage of students identified with
learning disabilities declined from 4.8 percent in 2004 to 3.9 percent in 2011, probably due to tighter statewide definitions and better early reading programs. However, this trend was countered by an almost tripling of students identified with autism (from .4 to 1.1 percent). Districts are also doing a better job of monitoring the incidence of over-identification that has been occurring in recent years. Another likely cause of the decline of identified students is Connecticut’s use of Scientific Research-Based Interventions and Response to Intervention procedures.
Today’s students with special needs benefit from 35 years of federal law, state
educational systems with services specific to their needs, numerous parent advocacy groups, and a public expectation of service equal to that of mainstreamed students. In addition to special units in Departments of Education, each state also has numerous citizen groups in support of students with special needs. In Connecticut, those groups include the Connecticut Parent Advisory Group; the Connecticut Association of Private Special Education Facilities; and the Special Education Parents Advisory Group, to name a few. Special needs services range from interpreters for the deaf to computer-assisted technology for the physically impaired. Human resources in the form of note takers, physical and speech therapists, and counselors add significant costs to serving special needs students.
38
Providing Affordable Service
Balancing the commitment to providing service to constituents with the rising costs of these services is a challenge for all public service organizations — educators, health care officials, social service agencies, and others. In the case of special education, the level of service and the costs of providing the services have risen to a breaking point. Nationally, the cost of serving special need students hovers around 20 percent of a district’s budget, higher than the percentage of special need students in the overall student population.
In Connecticut, that figure ranges from 17-29 percent, depending on the school
district. At the same time that federal aid for special needs students to local schools has consumed a larger portion of the annual increases in federal education funds, the local contribution to financing special education now exceeds the state contribution. Connecticut districts spent $1.715 billion on special education in 2010–11, or approximately $27,000 per special education pupil, compared to an average of $14,425 per regular education student. This represented 21.69 percent of total statewide expenditures. These increased costs are trending upward at alarming rates. Over the past five years, special education expenditures in Connecticut have been growing at 5-6 percent a year, compared to the growth in overall education expenditures of 2-3 percent. If these rates continue, the long-term effect will be to reduce or negatively impact the quality or availability of regular education programs, especially given current state and local budget scenarios, and the continued failure of the federal government to pay anything near its original promise of 40 percent.
Illustrating the financial burden facing local school districts and the potential high
costs of serving students with special needs, Connecticut provides an “excess cost grant” to districts when the cost of serving an individual student exceeds 450 percent of the average cost per pupil. So if the average is $10,000, and the cost of serving an individual special needs student is $50,000, the state will cover the $5,000 overage. The full cost of the state excess cost grant for 2012-13 should be in the $160-170 million range, $177 million in 2013-14, and $186 million in 2014-15, as estimated by SDE; it is presently capped at $140 million. The federal contribution of $132 million a year is distributed to all the districts. Together, these state and federal dollars represent only 16 percent of the total $1.715 billion spent on special education. The capping of the grant for the past four years has resulted in the reduction of regular education programs and state services for all non-special education students.
Special education services are cost-intensive and include individualized education
plans for each student; assistive technology; accommodations such as taped textbooks, notetakers, and other personal assistance; summer programming; and more. Some of the other cost factors involved include:
• The size of the special needs population, about 12 percent of total K-12 enrollments,
or one out of eight students. • The breadth of eligibility — students with autism, deafness, blindness, emotional
issues, physical impairment, speech impairment, and learning disabilities, are all covered.

39
• The costs of specialized services, equipment, and human support.
Our nation and state have a 40-year history of socially mandated and legally protected services to people with special needs. This history is grounded in a fundamental concern for the educational needs of students, a respect for their parents and families, and a commitment to providing each student with educational opportunity.
No one is arguing that this commitment be diminished or reneged. Like most public
policymakers today, special education officials and other educators need to find efficiencies, innovations and alternative course delivery methods if we are to afford to continue to provide the services that we are legally mandated and morally committed to provide. Recommendations: 1. The State of Connecticut should continue to support a portion of local special
education expenditures to relieve the escalating financial burden on local school districts and to better meet its obligation to fund public education, including special education. This commitment must include a new process for reimbursing school districts for excess costs. The state shall pay 100 percent of the full cost of state agency-placed students. The
General Assembly should adopt legislation to: a. increase and guarantee the excess cost grant; b. include a new, fixed amount definition of “excess” for all districts (such as
$50,000); c. develop state managed and supported individualized education plans for any
pupil costing over $150,000 (approximately 300 students statewide), or in the alternative, a state inspected and validated IEP for all such high cost pupils;
d. create a sliding scale reimbursement based on a town’s wealth; and e. institute a 3- to 5-year phase in.
TABLE 1: CONNECTICUT SPECIAL EDUCATION EXCESS COST PLACEMENTS: 2011–12
Eligible
Students Costs in
excess of $50,000
Costs in excess of $100,000
Costs in excess of $150,000
Costs in excess of $200,000
Costs in excess of $300,000
State agency placed
1,163 607 113 14 3 0
Local agency placed
3,203 3,188 1,091 265 80 8
Total 4,366 3,795 1,204 279 83 8 2. The Connecticut State Department of Education (SDE) must perform regular
examinations each September of “outlier” districts to determine the percentage of special education students; the percent within each special education classification; the percentage of the local budget spent on special education; the percent and cost of
40
outplacements; the number, if any, of out-of-state placements; the achievement of special education students, and the numbers exiting special education; and the participation of special education students in state assessments. In the process, the causes for districts being outliers must be pursued and evaluated. In the process, the SDE and the districts should develop a joint plan to implement, monitor and report progress made. The appropriateness of identification and placement in special education has a direct bearing on total costs.
3. The SDE and the six regional educational service centers should inventory local, regional, statewide and private programs against projected needs over the next 10 years. The inventory should include commentary on the availability of third party insurers, covering medically related expenses. An IEP selecting higher cost private programs over comparable, lower cost public programs should be required to provide a compelling rationale.
4. The state should engage higher education faculty in the study of special education, taking advantage of their input and expertise. Goals should include enhancing the quality of special education programs; improving the identification process; achieving better outcomes for students; controlling costs; and defining reasonable parameters.
5. The state should provide small incentive grants to districts, regions or higher education institutions that demonstrate superior programs and reduced costs.
APPENDIX D: GLOSSARY OF TERMS
TERM DEFINITION CITATION
41
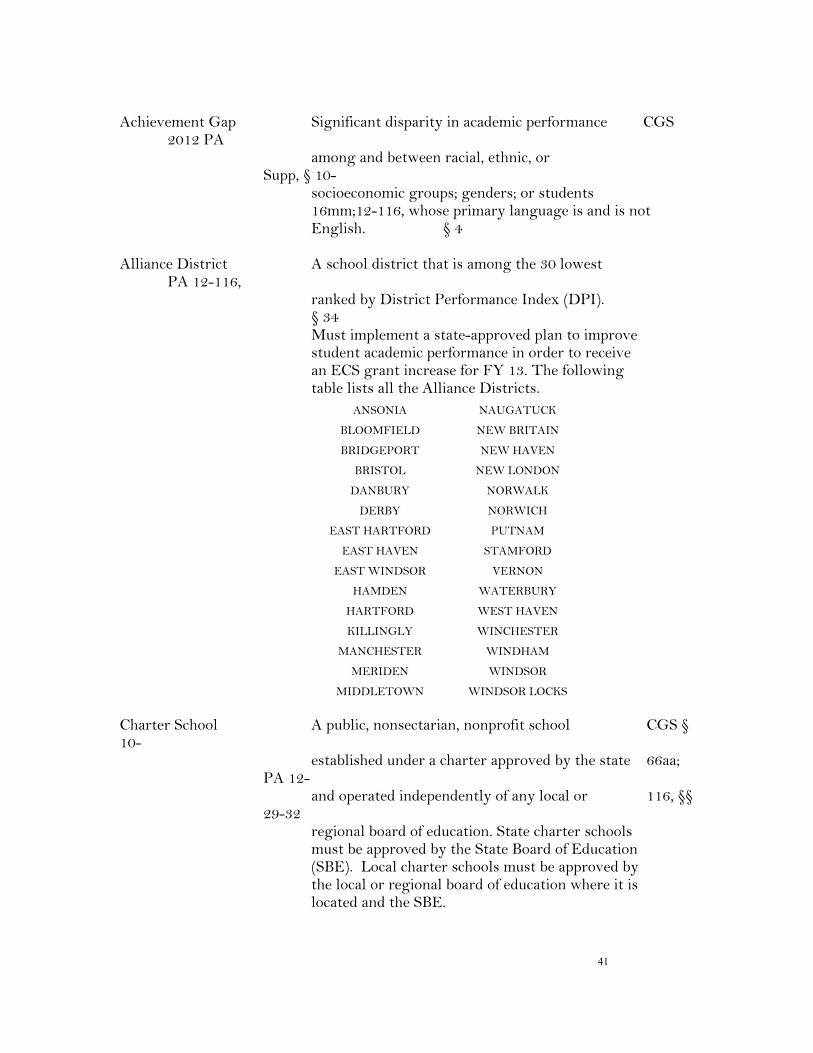
Achievement Gap Significant disparity in academic performance CGS
2012 PA among and between racial, ethnic, or
Supp, § 10- socioeconomic groups; genders; or students 16mm;12-116, whose primary language is and is not English. § 4
Alliance District A school district that is among the 30 lowest PA 12-116,
ranked by District Performance Index (DPI). § 34
Must implement a state-approved plan to improve student academic performance in order to receive an ECS grant increase for FY 13. The following table lists all the Alliance Districts.
ANSONIA NAUGATUCK
BLOOMFIELD NEW BRITAIN
BRIDGEPORT NEW HAVEN
BRISTOL NEW LONDON
DANBURY NORWALK
DERBY NORWICH
EAST HARTFORD PUTNAM
EAST HAVEN STAMFORD
EAST WINDSOR VERNON
HAMDEN WATERBURY
HARTFORD WEST HAVEN
KILLINGLY WINCHESTER
MANCHESTER WINDHAM
MERIDEN WINDSOR
MIDDLETOWN WINDSOR LOCKS
Charter School A public, nonsectarian, nonprofit school CGS § 10-
established under a charter approved by the state 66aa; PA 12-
and operated independently of any local or 116, §§ 29-32
regional board of education. State charter schools must be approved by the State Board of Education (SBE). Local charter schools must be approved by the local or regional board of education where it is located and the SBE.

42
District Performance Index Measure of a district's academic performance PA 12-116, (DPI) derived from its students' weighted performance § 34
on statewide mastery tests in reading, writing, and mathematics given in grades three through eight and 10, and science in grades five, eight, and 10.
English Language Learner Student with limited English proficiency who, No statutory (ELL) as a result, requires additional educational definition.
services. Interdistrict Magnet School A school that (1) supports racial, ethnic, CGS § 10-264l (a)
and economic diversity; (2) offers a special and high quality curriculum; and (3) requires enrolled students to attend at least half time. Excludes technical high schools, regional vocational agriculture centers, and regional special education facilities.
Low-Achieving School A school that is (1) identified as in need of CGS § 10-223e(c)(1); improvement under the state accountability PA 12-116, § 18
plan and requiring corrective action under the federal No Child Left Behind (NCLB) Act and subject to intensified supervision and direction by SBE, or (2) a Category 4 or 5 or focus school.
Non-Sheff Magnet School An interdistrict magnet school that is not part PA 12-116,
of the state's response to the Sheff decision. § 63 Located outside of Hartford and surrounding towns. Generally receives lower state per-student grants than a Sheff magnet school.
Open Choice Program A voluntary statewide interdistrict school CGS § 10-266aa (b);
attendance program whose purpose is to PA 12-116, § 12
(1) improve academic achievement; (2) reduce racial, ethnic, and economic isolation or preserve racial and ethnic balance; and (3) provide a choice of educational programs for public school students.

43
Regional Education Service Regional entity that provides educational CGS § 10-66a-p Center (RESC) services and programs to boards of education
so the boards do not have to provide them individually, including special education services; professional development, recruiting, and teacher and school employee fingerprinting and background checks; administrative and transportation services for the Open Choice program; and, in some cases, operation of interdistrict magnet schools. Must be run by boards of directors made up of at least one member representing and designated by each participating board of education.
School Performance Index Measure of a school's academic performance PA 12-116, § 18 (SPI) derived from its students' weighted performance
on statewide mastery tests in reading, writing, and mathematics given in grades three through eight and 10, and science in grades five, eight, and 10.
Sheff Magnet School An interdistrict magnet school that helps the CGS § 10-264l
state meet desegregation goals established as a result of the Sheff v. O'Neill decision. Located in Hartford or its surrounding region.