state and evolution of the african rainforests between...
TRANSCRIPT

on July 14, 2018http://rstb.royalsocietypublishing.org/Downloaded from
rstb.royalsocietypublishing.org
ResearchCite this article: Mayaux P, Pekel J-F, Desclee
B, Donnay F, Lupi A, Achard F, Clerici M, Bodart
C, Brink A, Nasi R, Belward A. 2013 State and
evolution of the African rainforests between
1990 and 2010. Phil Trans R Soc B 368:
20120300.
http://dx.doi.org/10.1098/rstb.2012.0300
One contribution of 18 to a Theme Issue
‘Change in African rainforests: past, present
and future’.
Subject Areas:environmental science
Keywords:deforestation, earth observation,
African rainforests
Author for correspondence:Philippe Mayaux
e-mail: [email protected]
& 2013 The Authors. Published by the Royal Society under the terms of the Creative Commons AttributionLicense http://creativecommons.org/licenses/by/3.0/, which permits unrestricted use, provided the originalauthor and source are credited.
State and evolution of the Africanrainforests between 1990 and 2010
Philippe Mayaux1, Jean-Francois Pekel1, Baudouin Desclee1, Francois Donnay1,Andrea Lupi1, Frederic Achard1, Marco Clerici1, Catherine Bodart1,2,3,Andreas Brink1, Robert Nasi4 and Alan Belward1
1Institute for Environment and Sustainability, Joint Research Centre of the European Commission, Ispra, Italy2Earth and Life Institute, Universite catholique de Louvain, Louvain-la-Neuve, Belgium3Food and Agriculture Organisation, Rome, Italy4Centre International for Forest Research, Bogor, Indonesia
This paper presents a map of Africa’s rainforests for 2005. Derived from mod-
erate resolution imaging spectroradiometer data at a spatial resolution of
250 m and with an overall accuracy of 84%, this map provides new levels of
spatial and thematic detail. The map is accompanied by measurements of
deforestation between 1990, 2000 and 2010 for West Africa, Central Africa
and Madagascar derived from a systematic sample of Landsat images—ima-
gery from equivalent platforms is used to fill gaps in the Landsat record.
Net deforestation is estimated at 0.28% yr21 for the period 1990–2000 and
0.14% yr21 for the period 2000–2010. West Africa and Madagascar exhibit a
much higher deforestation rate than the Congo Basin, for example, three
times higher for West Africa and nine times higher for Madagascar. Analysis
of variance over the Congo Basin is then used to show that expanding agricul-
ture and increasing fuelwood demands are key drivers of deforestation in the
region, whereas well-controlled timber exploitation programmes have little or
no direct influence on forest-cover reduction at present. Rural and urban popu-
lation concentrations and fluxes are also identified as strong underlying causes
of deforestation in this study.
1. IntroductionRainforests cover only 13% of Africa’s landmass [1], but they account for more
than 90% of the carbon stored in the continent’s terrestrial ecosystems [2,3], pro-
vide the habitat for many plant and animal species ([4]; table 1) and play a
significant role in the climate system [5]. Africa’s forests support the direct live-
lihood of 60 million rural people (providing food, medicine, fuel, fibre, non-
timber forest products as well as social and cultural functions) and less directly
support 40 million people living in urban centres in the forest domains [6]. Afri-
ca’s forests, which make up around 20% of the total global tropical rainforest
area [7], are mainly concentrated in the Congo Basin; after the Amazon basin,
this is the world’s second largest contiguous forest zone. The ecological zonation
proposed by the United Nations Educational, Scientific and Cultural Organiz-
ation [8] has three African ecoregions dominated by rainforests: Guineo-
Congolian (in West and Central Africa), East Malagasy (Madagascar) and
AfroMontane (Central and Eastern Africa).
Mapping the extent and monitoring the state of African rainforests is of
paramount importance because their location and condition affect the well-
being of millions of rural and urban people, affect the regional and global
climate, and have significant consequences for biodiversity. Accurate delinea-
tion of forest area and composition along with documentation of dynamics
(such as change in area, inter- and intra-annual seasonal patterns, carbon con-
tent and other geobiophysical variables) provides information for science (e.g.
reducing uncertainty in the carbon cycle) and for policy (e.g. formulation,

Table 1. Total number of species (mammals, birds, amphibians) and total carbon stock [2] in each of the three regions. The columns ‘threatened’ report thepercentage of species falling in the following categories of the IUCN Red list: Critically Endangered, Endangered, Vulnerable [4].
mammals birds amphibians carbon
totalthreatened(%) total
threatened(%) total
threatened(%)
total(GTonnes) % Africa
Central Africa 493 11.4 1100 1.4 288 15.3 39.2 78.5
West Africa 355 13.2 825 1 193 18.1 5.8 11.6
Madagascar 159 20.8 217 6 219 11.9 1.8 3.6
rstb.royalsocietypublishing.orgPhilTransR
SocB368:20120300
2
on July 14, 2018http://rstb.royalsocietypublishing.org/Downloaded from
implementation, monitoring, reporting and verification).
Forest area and condition information establishes the bound-
ary conditions for hydrological and geochemical cycle studies
and for climate models, yet policy users need the same infor-
mation to formulate and evaluate sustainable development
policies. This nexus is seen at local and global scales in multi-
lateral environmental agreements such as the United Nations
Framework Convention on Climate Change (UNFCCC),
where policies such as reducing emissions from deforestation
and degradation (REDDþ) recognize the role of forests in the
carbon cycle; and the convention on biological diversity
(CBD), which identifies forest habitat loss as a critical driver
of declining biological diversity. While global in scope, the
processes of reporting and verification of policy linked to
UNFCCC and CBD often require local information on land
cover and land-cover changes; in other words, we need to
monitor the forests on local scales globally.
Land-cover information is also needed to measure
the effectiveness of management associated with sustaina-
ble development. Addressing issues such as logging, forest
conservation and restoration, agricultural land expansion,
desertification or watershed degradation will all substantially
benefit from the availability of accurate baseline forest-cover
information. Indeed, the Observatory for Central African
Forests (OFAC), under the auspices of forest ministries in
the region, now report on the ‘state of the forest of the
Congo Basin’ every 2 years [9,10].
Baseline forest-cover information was originally derived
from a combination of aerial photography and field surveys.
The thematic descriptions attached to the resulting classifi-
cations were detailed, but the spatial output had limited
accuracy, especially when aggregated at the continental level
[8]. The advent of earth-observing satellites led to improve-
ments in the spatial integrity and detail of the maps while
retaining levels of thematic content [11]. Since the turn of the
twenty-first century, it has been possible to generate daily
images (albeit complete with clouds) of the entire continent
from satellite systems such as Vegetation (VGT, with 1 km res-
olution), the Medium Resolution Imaging Spectrometer
(MERIS, at 300 m) and Moderate Resolution Imaging Spectro-
radiometer (MODIS, at 1 km to 250 m). Global land cover
mapping exercises, such as the MERIS-based GlobCover
2005, include maps of Africa’s rainforests. But GlobCover’s
Central African mapping is compromised by a limited
number of cloud-free image acquisitions over the region.
More localized products including continental maps [1] and
regional products [12] are based on a greater number of satellite
overpasses, and therefore more opportunities for cloud-free
observation, but these data are still acquired at a coarse resol-
ution of 1 km. Access to higher-resolution satellite imagery
has improved since free and open access was provided to the
Landsat archives. Using these data, continental- and global-
scale sample-based surveys measuring forest cover [13] and
forest-cover change at resolutions of 30 m are now increasingly
undertaken. The European Commission’s Tropical Ecosystem
Environment observation by Satellite (TREES) project is one
example. This project, which has been funded since 1992,
uses Thematic Mapper (TM) and enhanced TM data from
Landsat satellites [14] to provide sample-based information
on changes in the state of the world’s tropical forests [15,16].
The TREES project currently addresses change over three
epochs, 1990, 2000 and 2010, and contributes to the remote sen-
sing survey of the Food and Agriculture Organisation’s Forest
Resource Assessment (FAO-FRA) for 2010 [17].
This paper presents a new wall-to-wall forest map covering
all three of Africa’s rainforest blocks at 250 m resolution using
daily observations from one single year, 2005. The new maps
are accompanied by measures of deforestation made at 30 m
resolution between 1990, 2000 and 2010. Regional drivers of
forest-cover change are also identified and attributed on the
basis of available geospatial data and statistics.
2. Material and methods(a) Wall-to-wall forest mappingUsing data from MODIS sensors on both the Terra and Aqua sat-
ellites, we assembled four MODIS daily products from collection
version 5 for surface reflectance at 250 and 500 m spatial resolution.
Three spectral bands were used: the red and the near-infrared
(NIR) at 250 m spatial resolution and the middle infrared (MIR)
at 500 m spatial resolution. The imagery covered the entire African
continent for the year 2005.
Production of cloud-free datasets is a significant challenge to
mapping land-cover types in this equatorial region. Quality flags
indicating cloud cover and missing data accompany the daily
MODIS surface reflectance images. Two satellites acquiring data
increase the chance of cloud-free imaging and so we used daily
data from both the Aqua and Terra missions. We then excluded
cloudy/bad data using the mean compositing strategy [18,19].
This averages cloud-free reflectance values [20] to create an annual
cloud-free composite image for 2005. This compositing method
reduces directional reflectance effects and limits any remaining
atmospheric perturbations and cloud contamination. The MIR chan-
nel was resampled using the nearest-neighbour rule to match the
250 m of the red and NIR channels to generate a final three-band
mosaic output.

rstb.royalsocietypublishing.orgPhilTransR
Soc
3
on July 14, 2018http://rstb.royalsocietypublishing.org/Downloaded from
As a first classification step, we used an empirically derived
Normalized Difference Vegetation Index (NDVI) threshold to
identify and exclude open dry forests, savannas, bare soils and
water surfaces. Then, an unsupervised classifier, ISODATA, was
run on the red, NIR and MIR bands of the remaining data. The
resulting classes were interpreted based on field knowledge, refer-
ence maps [1,21,22], high spatial resolution images (better than 5 m)
and temporal profiles from our 730 daily MODIS images from 2005.
These results were then clustered into four final classes: lowland
rainforest (more than 70% of tree cover on non-flooded soil),
swamp forest (flooded forests with more than 70% of tree cover),
rural complex (10–30% tree cover and more than 50% croplands)
and other land cover (any remaining savanna, croplands . . . ).
Classification accuracy was then assessed by an independent
expert, using high-resolution imagery (1–4 m) from Google Earth
as a surrogate for ground data [23]. In total, 320 points were
interpreted in the four land-cover classes.
B368:20120300
(b) Forest-cover change assessmentTo quantify changes in forest cover, we followed the TREES/
FAO-FRA approach [24]. This uses Landsat image extracts of
10 � 10 km from a systematic sample on each latitude/longitude
degree intersect over three epochs: 1990, 2000 and 2010. This
gave a total sample of 285 points systematically distributed
across Africa’s rainforests. Of these, 256 sites were covered by
good-quality image pairs between the various epochs: 173 over
Central Africa, 67 over West Africa and 16 over Madagascar. The
28 missing samples were mostly located in cloudy areas over
the coastal regions of Gabon, Equatorial Guinea and Cameroon.
While our target epochs were 1990, 2000 and 2010, persistent
cloud cover, limited data acquisitions and satellite failures required
each epoch to be constructed from imagery spanning some
years either side of the target year. The mean acquisition date and
range for the three epochs are respectively 11 August 1987
(1984–1994), 31 March 2001 (1996–2003) and 28 March 2010
(2008–2011). Image acquisition was particularly limited for the
2010 epoch following technical problems with Landsat 7 post-
2003. In consequence, the 2010 epoch was constructed using
Landsat plus additional satellite sources; Disaster Monitoring
Constellation (DMC) accounted for 43% of the images used,
SPOT-4 and 5 HRV (15%) and Landsat TM the remaining 42%.
Forest-cover changes over the period 1990–2000–2010 were
then estimated using the TREES object-based processing chain.
This includes different steps using multi-date Landsat imagery
[25,26]: visual screening of best available images from the entire
Landsat open archive, co-registration, calibration, cloud and
shadow masking, segmentation, change detection and classifi-
cation [25,27]. This processing chain was adapted for the DMC
and SPOT samples used in the 2010 epoch [28]. The minimum
mapping unit was 5 ha. The final legend used the following aggre-
gation rules: tree cover (at least 70% tree cover portion in segment),
tree cover mosaic (30–70% tree cover portion), other wooded land
(at least 70% shrubs, forest regrowth), other vegetation cover
(including croplands, herbaceous and bare lands) and water. We
defined deforestation as the conversion of tree cover and half of
the tree cover mosaic into one of the other land-cover classes:
reforestation and/or afforestation were defined as the opposite.
Experts from each region then checked the resulting land-cover
maps, and recoded classes wherever they encountered misclassifi-
cations from the automatic chain. Forest-cover change could then
be measured by comparing the quality-controlled image pairs
between 1990 and 2000 and between 2000 and 2010 at each
degree sample location.
Four correction steps were applied to give the same sampling
probability to each site and respect the reference dates. First, as
images were acquired at different dates around our epoch
target years, the land-cover changes matrices were linearly
adjusted to a common reference date of 30 June for 1990, 2000
and 2010. This is based on the assumption that land-cover
change rates are constant during any given period [16]. Second,
any remaining cloudy areas in a particular sample were considered
as an unbiased loss of data, and assumed to have the same pro-
portions of land cover as the non-cloudy areas within the same
site. This was achieved by converting the land-cover change
matrices to area proportions relative to the total cloud-free land
area of the sample site. Third, where sample sites were completely
missing, we used a local average from surrounding sample sites as
surrogate results. Fourth, we had to correct for changing sample
probability with latitude; our sample sites are taken at each
degree latitude/longitude intersection, and owing to the earth’s
curvature, the sampling probability increases with latitude,
which leads to higher-intensity sampling in higher latitudes.
To correct for such unequal sampling probability, sample sites
were given a weight equal to the cosine of the latitude for
producing the land-cover change matrix over the whole region.
For the study area, the total land-cover area can be extrapolated
from the average proportion using the Horvitz–Thompson direct
expansion [16,29,30]. The total class area Zc is obtained from:
Zc ¼ D�yc;
where D is the total area of the study region. The standard error
(s.e.) is then calculated as:
s.e. ¼ sffiffiffi
np ;
where n is the total number of available sample sites and s is an
estimator of the s.e. based on local variance estimation.
Finally, the annual change rates were calculated by dividing
the total change area by the time period and by the total cover
area averaged between the two dates.
(c) Deforestation drivers and underlying factorsTo assess the relative importance of drivers of deforestation
in Africa, we followed Geist & Lambin’s theoretical frame [31].
A series of geospatial datasets documenting recognized drivers
of deforestation (agricultural expansion, infrastructure deve-
lopment, timber extraction and fuelwood extraction) were used
along with evidence concerning underlying causes (demographic
pressure, economy, political instability and governance). We also
considered the efficiency of designated protected areas as pro-
tection against deforestation. Statistical analysis of these with
reference to the individual sample points used for the forest-
cover change assessment described above could then be carried
out. However, the paucity of reliable geospatial data associated
with the known drivers imposed some limitations to this.
Timber extraction statistics were available for logging con-
cessions reporting to OFAC [10], and official protected area
boundaries were available from IUCN [32]. However, too few of
our forest-cover sample points from the systematic sample grid
intersected with either logging concession or protected areas to com-
pute reliable statistics. In this case, we support our analysis using a
localized but more intensely sampled study in Central Africa [33].
More complete datasets could be obtained for agricultural
expansion, as gridded information on cropland proportions was
available [34]. Infrastructure development (principally road
networks and urban development) datasets were incomplete.
However, the spatial pattern of cropland areas in Central Africa
follows old road networks [11], and so the cropland analysis, in
part, integrates road density. This is particularly evident in the
Democratic Republic of Congo (DRC) where cropland mosaics
match road networks established in the colonial period. Infrastruc-
ture elements were also incorporated into our metric concerning
influence of urban populations, which we approximate through
the travel time to the closest city of more than 50 000 people [35].

lowland rain forests
swamp forests
rural complex
other land cover
water bodies
0 500 1000 km
Figure 1. Spatial distribution of the African rainforests derived from MODIS data.
Table 2. Forest area for the large forested African countries (and total areafor the main regions in italic), estimated from the MODIS-derived map.
country humid rainforests (31000 ha)
Democratic Republic of Congo 107 181
Gabon 22 416
Congo 20 932
Cameroon 20 037
Central African Republic 5833
Equatorial Guinea 2163
rstb.royalsocietypublishing.orgPhilTransR
SocB368:20120300
4
on July 14, 2018http://rstb.royalsocietypublishing.org/Downloaded from
Finally, we extracted the rural population from population
density maps [36].
To reduce the impact of pre-existing deforestation on sub-
sequent analysis, we first eliminated forest-cover sample points
with less than 20% forest cover. We then extracted the deforesta-
tion rate for each of the remaining 150 sample points and
combined this with the following metrics: area covered by crop-
lands, travel time to cities and population density. Then, we
conducted statistical analysis separately for each parameter. We
ranked the entire population of samples by increasing value of
each parameter and we divided the entire dataset into six homo-
geneous groups of 25 samples. An analysis of variance was then
conducted over the deforestation area observed in the six groups
separately for each parameter.
Central Africa 178 564Liberia 4552
Nigeria 3158
Cote d’Ivoire 1530
Ghana 1487
other countries 1273
West Africa 12 002
Madagascar 4385
Eastern Africa 4876
total Africa 199 829
3. Results(a) Forest mappingFigure 1 shows the spatial distribution of Africa’s rainforests.
Independent validation of the map indicates an overall
accuracy of 83.75%, with users’ and producers’ accuracies
of 87% and 85.2%, respectively, for the lowland rainforest,
and 81.6% and 98% for swamp forest. Table 2 provides the
forest-cover area by country. Central Africa accounts for
89% of Africa’s rainforests, and the DRC alone contains
some 53.6%. East African countries with Afromontane forests
(Ethiopia, Kenya, Tanzania and Uganda) represent only 2%
of the rainforests—though these countries do have large
areas of dry forest [1].
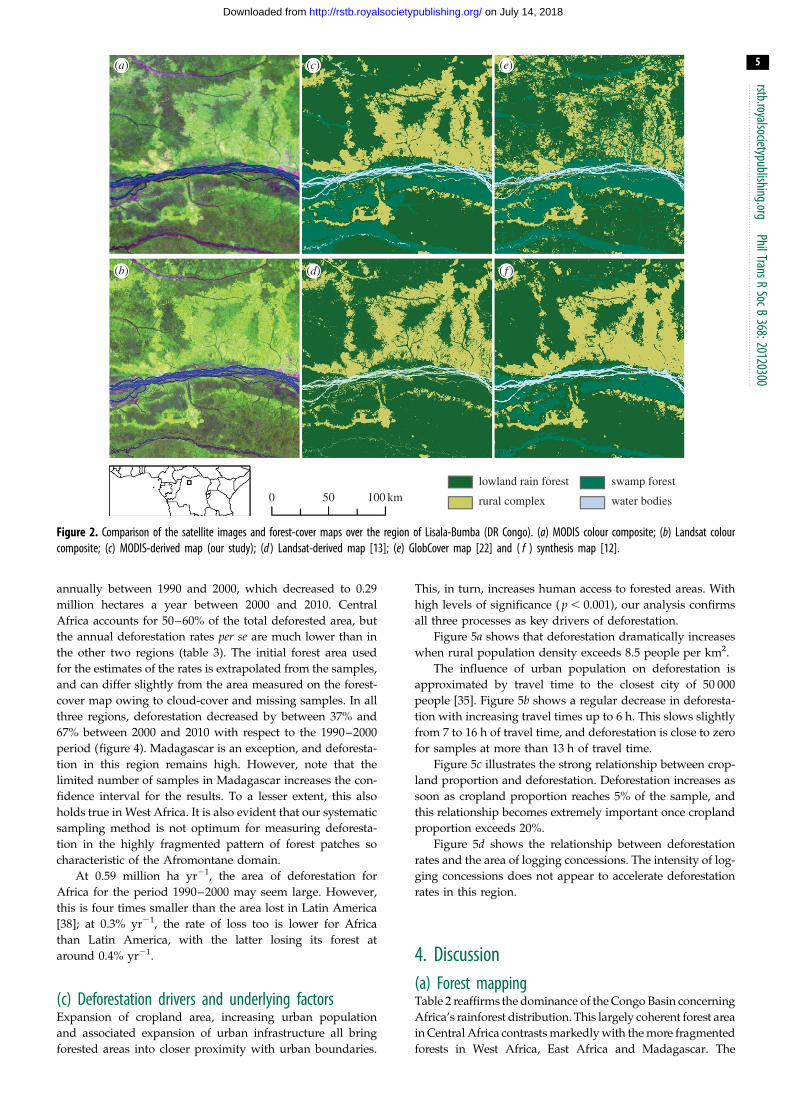
Results of our map’s thematic and spatial attributes are
also examined through visual comparison with previously
published maps [12,13,37], shown in figure 2. As expected,
the Landsat-derived map [13] shows finer spatial resolution
and depicts detailed linear features, but does not distinguish
swamp from lowland forests. Comparison with the MERIS-
based GlobCover 2005 highlights the benefit of our data
stream from two satellites’ overpasses per day in reducing
cloud contamination; the cloud-induced salt-and-pepper
effect evident in GlobCover 2005 is absent from our new map.
The synthesis map [12] is very similar to our product in this
region, whereas in coastal Cameroon and Congo the main
source of data used for the mapping had a 1 km resolution,
which clearly impairs the spatial quality of the map.
(b) Forest monitoringTable 3 shows estimates of net deforestation for Africa’s three
main rainforest regions. Figure 3 illustrates deforestation ‘hot
spots’ for West Africa, Madagascar and the fringes of the
Congo Basin. Africa lost 0.59 million hectares of rainforest
lowland rain forest swamp forest
rural complex water bodies0 50 100 km
(a)
(b)
(c)
(d)
(e)
( f )
Figure 2. Comparison of the satellite images and forest-cover maps over the region of Lisala-Bumba (DR Congo). (a) MODIS colour composite; (b) Landsat colourcomposite; (c) MODIS-derived map (our study); (d ) Landsat-derived map [13]; (e) GlobCover map [22] and ( f ) synthesis map [12].
rstb.royalsocietypublishing.orgPhilTransR
SocB368:20120300
5
on July 14, 2018http://rstb.royalsocietypublishing.org/Downloaded from
annually between 1990 and 2000, which decreased to 0.29
million hectares a year between 2000 and 2010. Central
Africa accounts for 50–60% of the total deforested area, but
the annual deforestation rates per se are much lower than in
the other two regions (table 3). The initial forest area used
for the estimates of the rates is extrapolated from the samples,
and can differ slightly from the area measured on the forest-
cover map owing to cloud-cover and missing samples. In all
three regions, deforestation decreased by between 37% and
67% between 2000 and 2010 with respect to the 1990–2000
period (figure 4). Madagascar is an exception, and deforesta-
tion in this region remains high. However, note that the
limited number of samples in Madagascar increases the con-
fidence interval for the results. To a lesser extent, this also
holds true in West Africa. It is also evident that our systematic
sampling method is not optimum for measuring deforesta-
tion in the highly fragmented pattern of forest patches so
characteristic of the Afromontane domain.
At 0.59 million ha yr21, the area of deforestation for
Africa for the period 1990–2000 may seem large. However,
this is four times smaller than the area lost in Latin America
[38]; at 0.3% yr21, the rate of loss too is lower for Africa
than Latin America, with the latter losing its forest at
around 0.4% yr21.
(c) Deforestation drivers and underlying factorsExpansion of cropland area, increasing urban population
and associated expansion of urban infrastructure all bring
forested areas into closer proximity with urban boundaries.
This, in turn, increases human access to forested areas. With
high levels of significance ( p , 0.001), our analysis confirms
all three processes as key drivers of deforestation.
Figure 5a shows that deforestation dramatically increases
when rural population density exceeds 8.5 people per km2.
The influence of urban population on deforestation is
approximated by travel time to the closest city of 50 000
people [35]. Figure 5b shows a regular decrease in deforesta-
tion with increasing travel times up to 6 h. This slows slightly
from 7 to 16 h of travel time, and deforestation is close to zero
for samples at more than 13 h of travel time.
Figure 5c illustrates the strong relationship between crop-
land proportion and deforestation. Deforestation increases as
soon as cropland proportion reaches 5% of the sample, and
this relationship becomes extremely important once cropland
proportion exceeds 20%.
Figure 5d shows the relationship between deforestation
rates and the area of logging concessions. The intensity of log-
ging concessions does not appear to accelerate deforestation
rates in this region.
4. Discussion(a) Forest mappingTable 2 reaffirms the dominance of the Congo Basin concerning
Africa’s rainforest distribution. This largely coherent forest area
in Central Africa contrasts markedly with the more fragmented
forests in West Africa, East Africa and Madagascar. The

Tabl
e3.
Gros
san
dne
tde
fore
statio
nar
eas
over
1990
–20
00an
d20
00–
2010
and
annu
alrat
esm
easu
red
from
the
sam
ple
ofsa
tellit
eim
ages
,for
the
thre
ere
gion
san
dth
etw
oep
ochs
(are
asin
1000
ha).
The
num
bers
inpa
rent
hese
sre
pres
entt
hesta
ndar
dde
viatio
nof
the
estim
ates
.
1990
–20
0020
00–
2010
gros
sde
fore
stat
ion
annu
alra
te(%
)ne
tde
fore
stat
ion
annu
alra
te(%
)gr
oss
defo
rest
atio
nan
nual
rate
(%)
net
defo
rest
atio
nan
nual
rate
(%)
Cent
ralA
frica
(n¼
173)
345.
9+54
0.19
285.
4+36
.50.
1618
7.6+
22.2
0.11
181.
5+39
.80.
10
Wes
tAfri
ca(n¼
67)
278.
7+77
.91.
0923
3.5+
108.
30.
9182
.1+
14.1
0.35
70.4+
23.9
0.30
Mad
agas
car
(n¼
16)
75.8+
25.8
1.69
728+
32.8
1.63
40.5+
18.2
1.08
36.4+
24.8
0.97
tota
lthr
eere
gion
s70
0.4
0.33
591.
90.
2831
0.2
0.15
288.
30.
14
rstb.royalsocietypublishing.orgPhilTransR
SocB368:20120300
6
on July 14, 2018http://rstb.royalsocietypublishing.org/Downloaded from
patterns of this fragmentation differ from region to region.
In East Africa, forest-cover fragmentation is linked to topogra-
phy; the dense humid forests follow the high ground in the
mountainous areas. In West Africa, the forest patches are the
remnants of a more massive block, which has been heavily
deforested since the middle of the twentieth century [39]. In
Madagascar, the linear pattern results from the conjunction
of topography and intense deforestation owing to agriculture
and mining.
(b) Forest monitoringOn the basis of our estimates, the Congo Basin shows a lower
deforestation rate than other tropical forest regions of the world
[15]. In consequence, the contribution of Africa to carbon dioxide
emissions owing to deforestation is limited with respect to
southeast Asia and Latin America, and the future REDDþmechanisms must take into account this particularity [40].
With rare exceptions in West Africa, we do not observe
massive deforestation over large contiguous areas planned
for huge agro-business plantations (oil palm, rubber).
The deforestation hot spots observed between 1990 and
2010 in this study, based on a systematic sample of satellite
images, correspond extremely closely to an earlier map of
hot spots based on experts’ opinion [41]. In all three African
regions, deforestation has slowed down post-2000, though
continues to remain higher in West Africa and Madagascar
than in Central Africa. These regional differences could, in
part, be explained by differential population pressure:
the population density in Central Africa for samples with
more than 20% forest cover is two times lower than in Mada-
gascar and eight times lower than in West Africa.
A comparison was conducted with results of Potapov
et al. [13] on DRC, where a deforestation of 0.25% yr21 was
measured between 2000 and 2010 for humid forests, which
is slightly higher than our estimates on the entire basin, but
other studies showed a higher deforestation rate in DRC
than in the other Congo Basin countries [42].
(c) Deforestation drivers and underlying factorsGeist & Lambin [31] considered three main causes of defores-
tation to be agricultural expansion, wood extraction and
infrastructure. Their results showed that expansion of agricul-
tural lands was the lead direct cause of deforestation but also
that no single cause ever operated alone, stating ‘it is a striking
feature of reported cases that no causation by single variables,
but rather synergistic factor combinations are important’ [31,
p. 23]. Their sample for the Congo Basin region was, however,
very limited (two cases in southeast Cameroon, one case in
northeast and one in southeast DRC). With our much larger
systematic sample, we can empirically identify the main drivers
of deforestation in our region. Our data allow us to highlight the
role, importance and thresholds of two major combinations: (i)
rural population, shifting agriculture and logging, and
(ii) urbanization and fuelwood extraction.
(i) Rural population, shifting agriculture and loggingAs shown in figure 5c, deforestation becomes significant once
croplands account for around 10% of the area in 2000 and
increases sharply above this threshold. Cultivation follows
two main patterns in the Congo Basin: ‘diffuse’ (characterized
by small, dispersed openings corresponding to traditional
shifting cultivation) and ‘corridor’ (small-to-medium

deforested areaper box (sq. km)
0 500
2–51–20.5–1.00.1–0.5<0.1 5–10
10–2020–4040–80
1000 km
Figure 3. Net deforestation between 1990 and 2000. The circle size is proportional to the surface affected by deforestation in each sample of 100 km2.
0
0.20
0.40
0.60
0.80
1.00
1.20
1.40
1.60
1.80
0
500
1000
1500
2000
2500
3000
1990–2000 2000–2010
area
(×
1000
ha)
rate
(%
yr–1
)
CAFR (area) WAFR (area) MADA (area)CAFR (rate) WAFR (rate) MADA (rate)
Figure 4. Evolution of the deforestation area and annual rate between thetwo epochs for the three regions (CAFR, Central Africa; WAFR, West Africa;MADA, Madagascar).
rstb.royalsocietypublishing.orgPhilTransR
SocB368:20120300
7
on July 14, 2018http://rstb.royalsocietypublishing.org/Downloaded from
contiguous openings, which follow the road network linking
villages and human settlements—a result of the policies from
colonial powers continued by independent states). We have
anecdotal evidence that the diffuse pattern is getting less and
less common, whereas corridor patterns now dominate. Pre-
vious work [31] has established that agriculture does not act
alone and that the ‘agriculture–population’ combination is a
prominent cause of deforestation. With a population growth
rate of between 1.8% yr21 in Central African Republic and
2.8% yr21 in DRC, the demand for agricultural land will dras-
tically increase in the next 20 years (unless technology for
agricultural intensification significantly improves) and,
unfortunately, agricultural land is likely to expand at the
expense of forest [43]. Our data show that deforestation drasti-
cally increases when rural population exceeds 8.5 people per
km2 (figure 5a). This result is consistent with earlier work in
Central Africa that identified a population density threshold
of eight people per km2 as a value above which deforestation
rates accelerated [33].
A population density of 10–15 persons km22 is reached in
many forested areas through the intrinsic increase in population
and because of the migration of rural populations towards
cities. People move closer to roads to benefit from improved
access to markets (as well as other elements of urban infrastruc-
ture such as schools and healthcare). This population density
increase is incompatible with traditional shifting cultivation
practices and long fallow periods. Reducing shifting cultiva-
tion theoretically reduces new clearings of primary forests,
but it also curtails regrowth on fallow land, because the land
is never left fallow. This, in turn, reduces soil fertility, which
leads to food insecurity [44]. But as population density con-
tinues to increase and agricultural intensification fails to take
hold, so actual deforestation and degradation will continue as
the need for more cropland rises [45]. In the near future, the
increasing international demand for commodities such as
coffee, cocoa, rubber or oil palm is also likely to increase the
demand for agricultural land. Given the evident dominance
of the corridor pattern of deforestation, we can reasonably con-
clude that road network density is an important factor. As the
presently limited road network expands (for whatever purpose,
be it logging, mining or linking settlements), this will render
large blocks of currently inaccessible forests accessible—and
access to forests has been identified as a key factor facilitating
deforestation [46]. In the Congo Basin, the most rapidly chan-
ging area has been northern Congo, where the rate of road
construction increased from 156 km yr21 for the period 1976–
1990 to over 660 km yr21 after 2000 [47], as shown in figure 3.
It is possible to control access to logging or mining roads and
to mitigate part of the threat but not to remove it comple-
tely—a complete ban on road building would significantly
reduce the development prospect of many remote areas.

0
0.4
0.8
1.2
1.6
2.0
<2 2–3.5 3.5–5 5–8.5 8.5–19 >19 <5 5–7 7–9 9–12 12–16 >17
population density (habitat km–2)
annu
al d
efor
esta
tion
area
(km
2 )an
nual
def
ores
tatio
n ar
ea (
km2 )
(a)
travel time to the closest city (h)
(b)
0
0.4
0.8
1.2
1.6
2.0
nil 0–1 1–5 5–11 11–21 >21
cropland proportion in the sample (%)
(c)
>95n = 64
50–95n = 59
10–50n = 48
<10n = 375
proportion of logging concessions (%)
(d)
Figure 5. Relationship between the deforestation observed by homogeneous group of samples according to the following parameters. (a) Population density [36];(b) travel time to closest city [35]; (c) area covered by croplands [34] and (d ) area covered by logging concession [33].
rstb.royalsocietypublishing.orgPhilTransR
SocB368:20120300
8
on July 14, 2018http://rstb.royalsocietypublishing.org/Downloaded from
We have shown that samples with a population reaching
a threshold of 8.5 people km22, and/or an area of agricultural
land above 10% associated with the road network were sig-
nificantly more deforested than samples below these
thresholds. We need to add wood extraction to these factors.
In rural areas, wood is extracted for construction and service
(poles) and for woodfuel (fuelwood usually, sometimes char-
coal)—neither are considered important deforestation factors
in the literature, yet logging is. This assertion is not supported
by our results. Figure 5d shows that for our samples defores-
tation does not vary as a function of the area of occupied by
logging concessions. This relatively low impact of logging
operations on deforestation can be due to the recent efforts
of the Congo Basin countries towards sustainable forest man-
agement [48], a view also confirmed by other studies [49].
The first of Central Africa’s forest management plans was
implemented by Cameroon in 2000, which currently has
over 14 million ha of forest concessions managed in accord-
ance with state-approved plans [6]. Certification has also
demonstrated significant progress in Gabon, Cameroon and
Congo, from zero certified forests in 1995 to 4.8 million hec-
tares in 2010 [10]. International initiatives promoting legal
exploitation also have a positive effect on forest management.
However, the opening of roads in a completely intact forest
area may provoke deforestation sometime in the future;
monitoring such ‘delayed deforestation’ requires datasets
spanning many years.
(ii) Urbanization, permanent agriculture and fuelwood extraction(charcoal)
We approximated the influence of urban populations using
travel time to the closest city of 50 000 people or more [35].
Figure 5b shows a clear pattern with two apparent inflexion
points: deforestation between 2000 and 2010 was very high
when less than 5 h from a city, almost nil when more than 12 h
from a city and stable in between. The curve illustrates the
‘island’ pattern of deforestation described by Mertens &
Lambin [50] for peri-urban areas. Five hours corresponds to a
daily return trip and could be considered as a permanently defor-
ested (either cultivated or extensively degraded) circle around the
city. The plateau between 5 and 12 h could be interpreted as a
combination of shifting agriculture and a provisioning area
that supplies woodfuel to the city. In sub-Saharan Africa,
wood remains the main source of domestic energy and meets
over 80% of needs across all countries [51]; in DRC, wood
energy constitutes more than 95% of total wood production,
with an annual consumption estimated to be 1 m3 per person
[52] and a total production higher than 70 million m3. Forests,
most notably peri-urban forests, play a key role in providing
woodfuel, with charcoal being the fuel of choice, given that it is
much easier to stock, transport and manipulate than fuelwood.
The consumption of charcoal for the city of Kinshasa is estimated
to be the equivalent of 4.8 million m3 of wood, which affects huge
forest areas up to a distance of 300 km from the city [52].

rstb.royalsocietypublishing
9
on July 14, 2018http://rstb.royalsocietypublishing.org/Downloaded from
We have shown the importance of travel time to urban
areas in determining deforestation rates, with thresholds at
5 and 12 h. Future development plans in the region are likely
to include improvements to road and transport infrastructure.
While laudable from many economic perspectives, such
improvements will reduce travel times to cities from surround-
ing regions. Given the pattern shown by our data, this implies a
much bigger threat to remaining forests than envisioned from
the prevailing corridor patterns alone.
.orgPhilTransR
SocB368:201203
5. ConclusionThe mapping and monitoring of Africa’s rainforests is an
ongoing process, where new techniques and new data continu-
ously improve our knowledge. Unfortunately, threats to these
precious and unique resources also appear equally ongoing. In
this paper, we exploit newly available images and advanced
image processing techniques to derive accurate forest cover
and forest-cover change estimates. However, sensors with
better radiometric quality (Landsat 8) and finer spatial resol-
ution (Sentinel-2) will soon be available, which will allow us
to further refine and improve both maps and measure-
ments. Acquiring data from as many satellite overpasses as
possible directly at African receiving stations should also
improve access to cloud-free images. Many initiatives collect
information on the ground, which can help improve our under-
standing of deforestation drivers. However, further effort is
needed to link spatial modelling with multivariate analysis
analysing deforestation and the different drivers.
African rainforests provide vital resources for local
populations. They support the national economies of many
countries and deliver key global ecosystem services, includ-
ing climate regulation and biodiversity. Future research
should aim at improving our understanding of the inter-
actions between the local, national and global scales and a
range of thematic issues. In the long term, the international
community has to build strong African capacities in order
to give the Continent all the winning cards for defining and
implementing sound forest management policies.
00
References
1. Mayaux P, Bartholome E, Fritz S, Belward A. 2004 Anew land-cover map of Africa for the year 2000.J. Biogeogr. 31, 861 – 877. (doi:10.1111/j.1365-2699.2004.01073.x)
2. Saatchi SS et al. 2011 Benchmark map of forestcarbon stocks in tropical regions across threecontinents. Proc. Natl Acad. Sci. USA 108,9899 – 9904. (doi:10.1073/pnas.1019576108)
3. Baccini A et al. 2012 Estimated carbon dioxideemissions from tropical deforestation improvedby carbon-density maps. Nat. Clim. Change 2,182 – 185. (doi:10.1038/nclimate1354)
4. IUCN. 2012 The IUCN red list of threatened species.Version 2012 2. IUCN.
5. Maynard K, Royer JF. 2004 Effects of ‘‘realistic’’ land-cover change on a greenhouse-warmed Africanclimate. Clim. Dyn. 22, 343 – 358. (doi:10.1007/s00382-003-0371-z)
6. Nasi R, Taber A, van Vliet N. 2011 Empty forests,empty stomachs: bushmeat and livelihoods inCongo and Amazon Basins. Int. Forestry Rev. 3,355 – 368. (doi:10.1505/146554811798293872)
7. FAO ITTO. 2011 The state of forests in theAmazon Basin, Congo Basin and Southeast Asia.Rome: FAO-ITTO.
8. White F. 1983 The vegetation of Africa: a descriptivememoir to accompany the UNESCO/AETFAT/UNSOvegetation map of Africa. Paris: UNESCO, Associationpour l’etude taxonomique de la flore d’Afriquetropicale.
9. de Wasseige C, Devers D, de Marcken P, Eba’a AtyiR, Nasi R, Mayaux P. 2009 The forests of the CongoBasin: state of the forest 2008. Luxembourg:Publications Office of the European Union.
10. de Wasseige C et al. 2012 The forests of the Congobasin: state of the forest 2010. Luxembourg:Publication Office of the European Commission.
11. Mayaux P, Richards T, Janodet E. 1999 A vegetationmap of Central Africa derived from satellite imagery.J. Biogeogr. 26, 353 – 366. (doi:10.1046/j.1365-2699.1999.00270.x)
12. Verheggen A, Mayaux P, de Wasseige C, Defourny P.2012 Mapping Congo Basin forest types from 300 mand 1 km multi-sensor time series for carbon stocksand forest areas estimation. Biogeosciences 9,7499 – 7553. (doi:10.5194/bgd-9-7499-2012)
13. Potapov PV, Turubanova SA, Hansen MC, Adusei B,Broich M, Altstatt A, Mane L, Justice CO. 2012Quantifying forest cover loss in Democratic Republicof the Congo, 2000 – 2010, with Landsat ETMþdata. Remote Sens. Environ. 122, 106 – 116. (doi:10.1016/j.rse.2011.08.027)
14. Beuchle R, Eva HD, Stibig HJ, Bodart C, Brink A,Mayaux P, Johansson D, Achard F, Belward A. 2011A satellite data set for tropical forest area changeassessment. Int. J. Remote Sens. 32, 7009 – 7031.(doi:10.1080/01431161.2011.611186)
15. Achard F, Eva HD, Stibig HJ, Mayaux PGJ, Richards T,Malingreau JP. 2002 Determination of deforestationrates of the world’s humid tropical forests. Science7, 999 – 1002. (doi:10.1126/science.1070656)
16. Eva HD, Carboni S, Achard F, Stach N, Durieux L,Faure JF, Mollicone D. 2010 Monitoring forest areasfrom continental to territorial levels using a sampleof medium spatial resolution satellite imagery.J. Photogramm. Remote Sens. 65, 191 – 197.(doi:10.1016/j.isprsjprs.2009.10.008)
17. FAO. 2012 FAO forest resources assessment 2010.FAO forestry paper. Rome: FAO.
18. Vancutsem C, Bicheron P, Cayrol P, Defourny P. 2007An assessment of three candidate compositingmethods for global MERIS time series.Can. J. Remote Sens. 33, 492 – 502. (doi:10.5589/m07-056)
19. Vancutsem C, Pekel JF, Bogaert P. 2007 Meancompositing, an alternative strategy for producingtemporal syntheses. Concepts and performanceassessment for SPOT VEGETATION time series.Int. J. Remote Sens. 28, 5123 – 5141. (doi:10.1080/01431160701253212)
20. Pekel JF, Vancutsem C, Cressman K, Vanbogaert E,Defoury P. 2011 Development and application ofmulti-temporal colorimetric transformation tomonitor vegetation in the desert locust habitat. IEEEJ. Selected Top. Appl. Earth Obs. Remote Sens. 4,318 – 326. (doi:10.1109/JSTARS.2010.2052591)
21. Vancutsem C et al. 2006 The land cover map of theDemocratic Republic of Congo, 1/3 000 000.Louvain-la-Neuve, Belgium: Presse universitaire deLouvain.
22. Bontemps S et al. 2012 Operational servicedemonstration for global land-cover mapping: theGlobCover and GlobCorine experiences for 2005and 2009. In Remote sensing of land use andland cover: principles and applications (ed. C Giri),pp. 243 – 264. Terre Haute, IN: CRC Press.
23. Strahler AH et al. 2006 Global land cover validation:Recommendations for evaluation and accuracyassessment of global land cover maps. Luxembourg:European Communities.
24. Mayaux P, Holmgren P, Achard F, Eva H, Stibig HJ,Branthomme A. 2005 Tropical forest cover change in the1990s and options for future monitoring. Phil. Trans.R. Soc. B 360, 373 – 384. (doi:10.1098/rstb.2004.1590)
25. Rasi R, Bodart C, Stibig HJ, Eva H, Beuchle R,Carboni S, Simonetti D, Achard F. 2011 Anautomated approach for segmenting and classifyinga large sample of multi-date Landsat imagery forpan-tropical forest monitoring. Remote Sens.Environ. 115, 3659 – 3669. (doi:10.1016/j.rse.2011.09.004)

rstb.royalsocietypublishing.orgPhilTransR
SocB368:20120300
10
on July 14, 2018http://rstb.royalsocietypublishing.org/Downloaded from
26. Rasi R, Beuchle R, Bodart C, Vollmar M, Seliger R, AchardF. 2012 Automatic updating of an object-based tropicalforest cover classification and change assessment. IEEEJ. Selected Top. Appl. Earth Obs. Remote Sens. 6, 66–73.(doi:10.1109/JSTARS.2012.2217733)
27. Bodart C, Eva H, Beuchle R, Rasi R, Simonetti D, StibigHJ, Brink A, Lindquist E, Achard F. 2011 Pre-processingof a sample of multi-scene and multi-date Landsatimagery used to monitor forest cover changes over thetropics. J. Photogramm. Remote Sens. 66, 555–563.(doi:10.1016/j.isprsjprs.2011.03.003)
28. Desclee B, Simonetti D, Mayaux P, Achard F. 2013Multi-sensor monitoring system for forest coverchange assessment in Central Africa. IEEE J. SelectedTop. Appl. Earth Obs. Remote Sens. 6, 110 – 120.(doi:10.1109/JSTARS.2013.2240263)
29. Gallego J, Bamps C. 2008 Using CORINE land coverand the point survey LUCAS for area estimation.Int. J. Appl. Earth Obs. Geoinformation 10,467 – 475. (doi:10.1016/j.jag.2007.11.001)
30. Brink A, Eva HD. 2009 Monitoring 25 years of landcover change dynamics in Africa: a sample basedremote sensing approach. Appl. Geogr. 29,501 – 512. (doi:10.1016/j.apgeog.2008.10.004)
31. Geist H, Lambin EJ. 2001 What drives tropicaldeforestation? A meta-analysis of proximate andunderlying causes of deforestation based onsubnational case study evidence. LUCC Report SeriesN. 4. Louvain-la-Neuve, Belgium: DiffusionUniversitaire CIACO.
32. IUCN. 2009 UNEP. the world database of protectedareas. Cambridge, UK: UNEP-WCMC.
33. Ernst C, Mayaux P, Musampa C, Verhegghen A,Bodart C, Defourny P. 2013 National forest cover changein Congo Basin: deforestation, reforestation andregeneration for the years 1990, 2000 and 2005. Glob.Change Biol. 19, 1173– 1187. (doi:10.1111/gcb.12092)
34. Vancutsem C, Marinho E, Kayitakire F, Linda S, FritzS. 2013 Harmonizing and combining existing landcover/use datasets for cropland areas monitoringat the African continental scale. Remote Sens. 5,19 – 41. (doi:10.3390/rs5010019)
35. Nelson A. 2008 Estimated travel time to the nearestcity of 50,000 or more people in year 2000. Ispra,Italy: Joint Research Centre of the EuropeanCommission.
36. Linard C, Gilbert M, Snow RW, Noor AM, Tatem AJ.2012 Population distribution, settlement patternsand accessibility across Africa in 2010. PLoS ONEe31743. (doi:10.1371/journal.pone.0031743)
37. Mayaux P, Vancutsem C, Pekel J-F, de Wasseige C,Defourney P, Hansen MC, Mane L. 2012 Acontinental and regional approach for improvingland-cover maps of Africa. In Remote sensing of landuse and land cover: principles and applications.(ed. C Giri), pp. 265 – 274. Boca Raton, FL: CRCPress.
38. Eva HD et al. 2012 Forest cover changes in tropicalsouth and Central America from 1990 to 2005 andrelated carbon emissions and removals. RemoteSens. 4, 1369 – 1391. (doi:10.3390/rs4051369)
39. FAO. 1993 Forest resources assessment 1990 —tropical countries. FAO forestry paper no. 112.Rome: FAO.
40. Bucki M, Cuypers D, Mayaux P, Achard F, Estreguil C,Grassi G. 2012 Assessing REDDC performance ofcountries with low monitoring capacities: the matrixapproach. Environ. Res. Lett. 7, 014031. (doi:10.1088/1748-9326/7/1/014031)
41. Achard F, Eva H, Glinni A, Mayaux P, Richards T,Stibig HJ. 1997 Identification of deforestationhot spot areas in the humid tropics. ResearchReport No 4. Report no.: EUR 18079. EuropeanCommission.
42. Duveiller G, Defourny P, Desclee B, Mayaux P. 2008Deforestation in Central Africa: estimates at regional,national and landscape levels by advancedprocessing of systematically-distributed Landsatextracts. Remote Sens. Environ. 112, 1969 – 1981.(doi:10.1016/j.rse.2007.07.026)
43. Alcamo J, Schaldach R, Koch J, Kolking C, Lapola D,Priess J. 2011 Evaluation of an integrated land usechange model including a scenario analysis of landuse change for continental Africa. Environ. Model.
Software 26, 1017 – 1027. (doi:10.1016/j.envsoft.2011.03.002)
44. Tollens E. 2010 Potential impact of agriculturaldevelopment on the forest cover in the Congo Basin.Washington, DC: The World Bank.
45. Fisher B. 2010 African exception to drivers ofdeforestation. Nat. Geosci. 3, 375 – 376. (doi:10.1038/ngeo873)
46. Wilkie D, Shaw E, Rotberg F, Morelli G, Auzel P.2000 Roads, development, and conservation in theCongo Basin. Conserv. Biol. 14, 1614 – 1622. (doi:10.1046/j.1523-1739.2000.99102.x)
47. Laporte N, Stabach J, Grosch R, Lin T, Goetz S.2007 Expansion of industrial logging in CentralAfrica. Science 316, 1451. (doi:10.1126/science.1141057)
48. Cerutti P, Tacconi L, Nasi R, Lescuyer G. 2011 Legalvs. certified timber: preliminary impacts of forestcertification in Cameroon. Forest Policy Econ. 13,184 – 190. (doi:10.1016/j.forpol.2010.11.005)
49. Laurance W et al. 2012 Averting biodiversitycollapse in tropical forest protected areas. Nature489, 290 – 294. (doi:10.1038/nature11318)
50. Mertens B, Lambin EF. 1997 Spatial modelling ofdeforestation in southern Cameroon: spatialdisaggregation of diverse deforestation processes.Appl. Geogr. 17, 143 – 162. (doi:10.1016/S0143-6228(97)00032-5)
51. Tutu K, Akol C. 2009 Reversing Africa’s deforestationfor sustainable development. In Appropriatetechnologies for environmental protection in thedeveloping world (ed. EK Yanful), pp. 25 – 34.Amsterdam, the Netherlands: Springer.
52. Schure J, Marien JN, de Wasseige C, Drigo R,Salbitano F, Dirou S, Nkoua M. 2012 Contribution ofwoodfuel to meet the energy needs of thepopulation of Central Africa: prospects forsustainable management of available resources. InThe State of the forests of the Congo Basin(COMIFAC) (eds C de Wasseige et al.), pp. 109 – 122.Luxembourg: Publication Office of the EuropeanCommunities.