stat 462 – computational data analysisnasser/teaching/stat462_862/stat_462-ch2p1.pdfstat 462 –...
TRANSCRIPT

STAT 462 – Computational Data AnalysisChapter 2-Part 1
Nasser Sadeghkhani
September 2017
1 / 21
Outline
Supervised Learning vs. Unsupervised LearningRegression
2 / 21
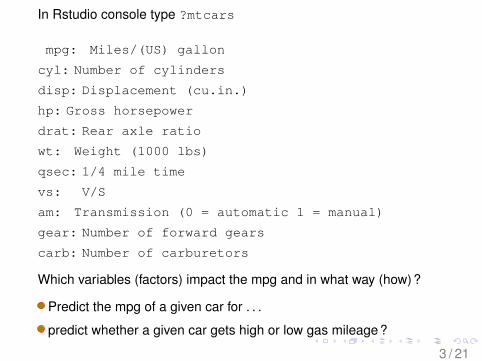
In Rstudio console type ?mtcars
mpg: Miles/(US) gallon
cyl: Number of cylinders
disp: Displacement (cu.in.)
hp: Gross horsepower
drat: Rear axle ratio
wt: Weight (1000 lbs)
qsec: 1/4 mile time
vs: V/S
am: Transmission (0 = automatic 1 = manual)
gear: Number of forward gears
carb: Number of carburetors
Which variables (factors) impact the mpg and in what way (how)?
Predict the mpg of a given car for . . .
predict whether a given car gets high or low gas mileage?
3 / 21

In Supervised learning there are input variables, and outputvariables.
Goal : Learning the model based on input and output data.
+ If the Output is quantitative : regression. problem.+ If the Output is qualitative : classification problem.
4 / 21

In Unsupervised learning there is only input variables.
Goal : Understand (learn) the relationships between variablesbased on input data.
+ If the Output is quantitative : Dimensional reduction (Selectthe relevant variables).Or Density estimation+ If the Output is qualitative : Clustering (Group data into sets)
5 / 21
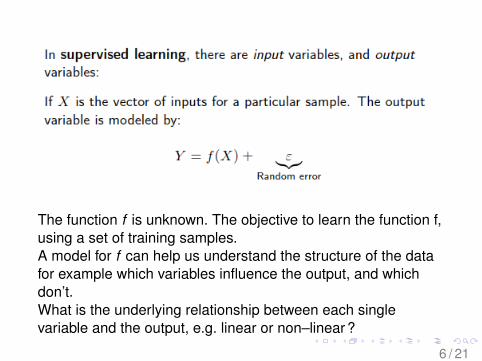
The function f is unknown. The objective to learn the function f,using a set of training samples.A model for f can help us understand the structure of the datafor example which variables influence the output, and whichdon’t.What is the underlying relationship between each singlevariable and the output, e.g. linear or non–linear?
6 / 21

Most of the time we can suppose two possibilities :1. Parametric models :
For example there exorcists a linear relation betweenX = (X1, . . .Xn) and Y . i.e. f (X ) = β0 + β1X1 + · · ·+ βpXp.Using training data we try to estimate the parametersβ = (β1, · · · , βp).
2. Nonparametric models :We have no clue what is the form of f , but we restrict how”wiggly” or ”rough” it could be.
7 / 21

One dimension
8 / 21

p–dimention
9 / 21

10 / 21

Outline
Supervised Learning vs. Unsupervised LearningRegression
11 / 21

Regression
Note : The response variable Y must be a continuous variablebut the predictors (independent variables, factors) can becontinuous, discrete or even categorical variables.
12 / 21
13 / 21
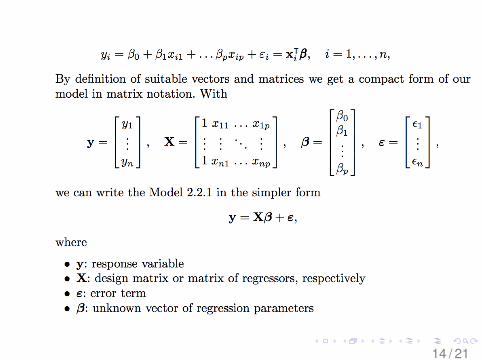
14 / 21
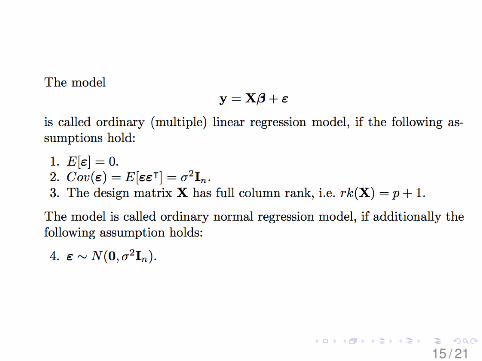
15 / 21
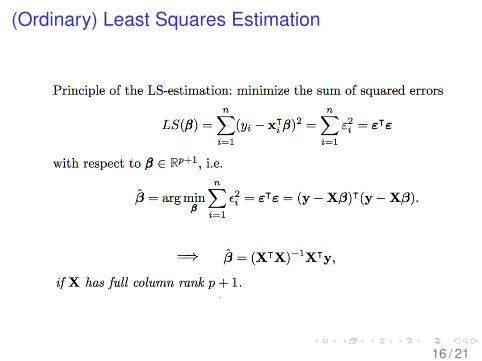
(Ordinary) Least Squares Estimation
16 / 21
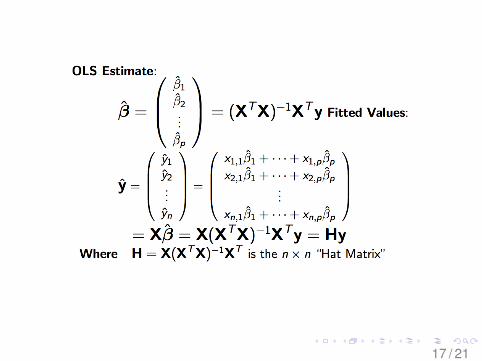
17 / 21

Exercise for STAT 862Show that H = (hij), for 1 ≤ i , j ≤ n meets the followingconditions.
18 / 21

19 / 21

20 / 21
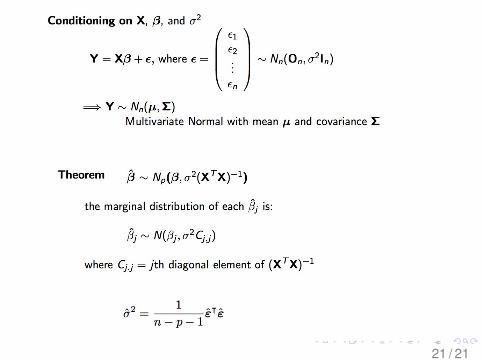
21 / 21