starting salaries of chemists and chemical engineers: 2014 · american chemical society starting...
TRANSCRIPT
American Chemical Society
Starting Salaries of Chemists And Chemical Engineers: 2014 Analysis of the American Chemical Society's Survey
Of New Graduates in Chemistry and Chemical Engineering
Steve and Clint Marchant Data Based Insights, Inc. on behalf of the ACS Department of Research & Market Insights March 5, 2015
i
© 2015 American Chemical Society
1115 Sixteenth Street, NW
Washington, DC 20036
800.227.5558
Available from the Department of Research and Market Insights
Starting Salaries of Chemists And Chemical Engineers: 2014
Analysis of the American Chemical Society's Survey
Of New Graduates in Chemistry and Chemical Engineering
ACS SURVEY OF NEW GRADUATES: 2014
ii
ACKNOWLEDGEMENTS
For more than four decades, the American Chemical Society has
prepared an annual survey of new graduates. This year, under the
direction of the ACS Committee on Economic and Professional Affairs,
the ACS conducted a survey to determine trends in starting salaries
and the employment status of chemists and chemical engineers. This
report presents the detailed results of the 2014 survey of new
graduates.
The survey was conducted and managed by Gareth Edwards, Senior
Research Associate in the ACS’s Department of Research and Market
Insights. Andrew Bell of Intelliscan, Inc. directed the data collection.
Steve and Clint Marchant of Data Based Insights, Inc. (an affiliate of
Intelliscan) analyzed the results of the survey and prepared this report.
Gareth Edwards
Senior Research Associate
Department of Research and Market Insights
ACS SURVEY OF NEW GRADUATES: 2014
iii
CONTENTS
Acknowledgements ii
Summary and Comments 1
Starting Salaries
Median Starting Salaries 2
Mean Starting Salaries 5
Salary Increases Over Time 8
Starting Salaries by Percentile 11
Salaries by Employment Sector 13
Equality of the Sexes 14
Plans for Advanced Study 17
Employment Status
Employment Status 19
Unemployment 19
Job Search 21
Job Satisfaction 22
Demographics
Demographics 23
Citizenship 24
Scope and Method
Purpose 25
Sampling and Data Collection 25
Technical Notes
Discrepancies among Tables 26
Estimates of Median Salaries 26
ACS SURVEY OF NEW GRADUATES: 2014
1
SUMMARY AND COMMENTS
he Starting Salaries of Chemists and Chemical Engineers:
2014 report examines new graduates from July 2013 to June
2014 and documents the starting salaries for those who
obtained a full-time job by the first Monday in October
(October 6, 2014). The report discusses median and mean
starting salaries, and summarizes how salaries have changed over time.
It presents current findings on salary ranges, employment sectors, and
salaries between genders. It assesses the proportion of graduates that
are going on to advanced studies. It covers employment status,
unemployment and job satisfaction.
The median full-time starting salary for inexperienced new
graduates is $42,000. By degree, newly graduated bachelor's
earned $40,000, master's $52,000 and PhD's $62,900 (Table 1a).
The median starting salary for new chemistry graduates with a
bachelor's degree improved +2.6% ahead of inflation. However,
salaries for new master's and doctorate degree holders lagged
behind inflation. (Table 1b).
Chemical engineering starting salaries for new graduates saw an
incremental increase of +1.2% in current dollars from 2013 to 2014
that almost keeps pace with 1.7% inflation (Table 1c).
Over the past 5 years (2010-2014), the government sector
provided new inexperienced chemistry graduates with the highest
median starting salary of $41,100, followed by academia at
$39,700 and industry at $39,000. A 5 year period was used to
increase the sample size for stability. (Table 5b)
With regard to chemical engineers, the highest and lowest paying
sectors for new graduates are reversed. The government is well
behind industry and academia in the median salaries it pays for
new chemical engineering graduates.
New female chemistry graduates earned a starting median salary -
7.3% less than their male counterparts. Among chemical engineers,
new female graduates earned a starting median salary +3.0%
higher than their male counterparts. (Table 7)
Unemployment rates for new graduates declined to 12.4% in 2014,
down from 14.9% last year. US government statistics forecast that
the trend of lowering unemployment rates to continue through
2015, which indicates that the employment the picture for
graduating chemists may further improve. (Figures 4 & 5)
T
ACS SURVEY OF NEW GRADUATES: 2014
2
STARTING SALARIES
MEDIAN STARTING
SALARIES
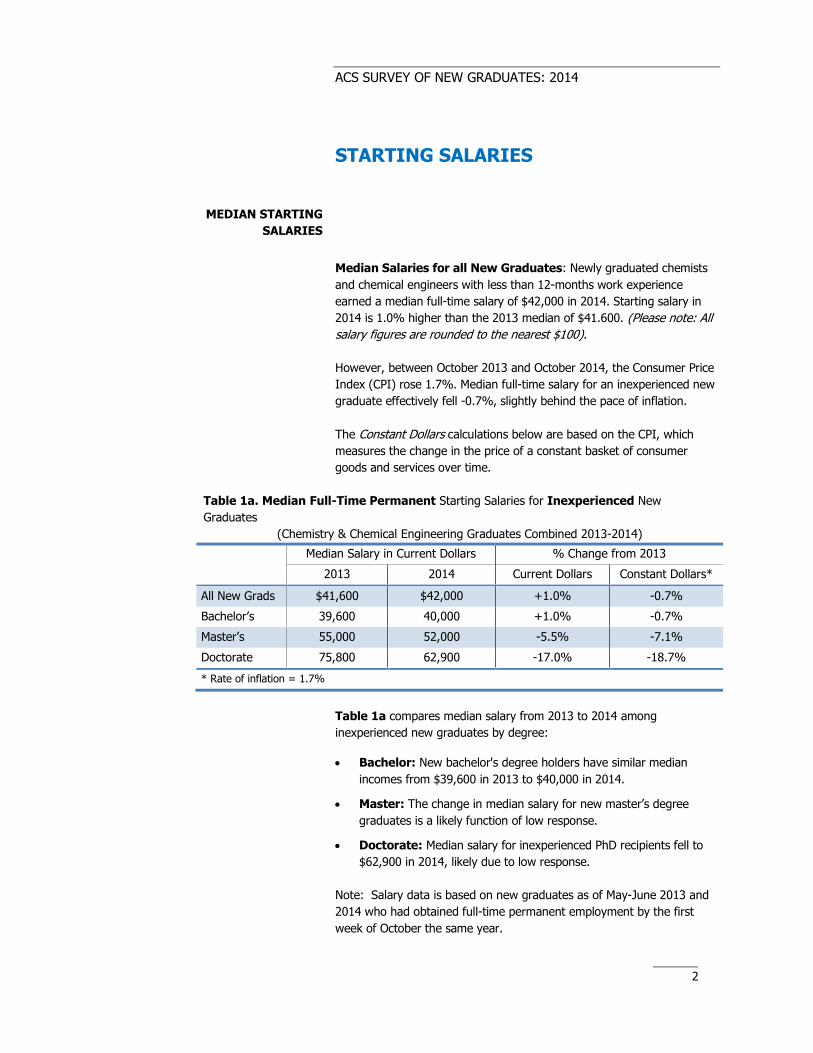
Median Salaries for all New Graduates: Newly graduated chemists
and chemical engineers with less than 12-months work experience
earned a median full-time salary of $42,000 in 2014. Starting salary in
2014 is 1.0% higher than the 2013 median of $41.600. (Please note: All
salary figures are rounded to the nearest $100).
However, between October 2013 and October 2014, the Consumer Price
Index (CPI) rose 1.7%. Median full-time salary for an inexperienced new
graduate effectively fell -0.7%, slightly behind the pace of inflation.
The Constant Dollars calculations below are based on the CPI, which
measures the change in the price of a constant basket of consumer
goods and services over time.
Table 1a. Median Full-Time Permanent Starting Salaries for Inexperienced New
Graduates
(Chemistry & Chemical Engineering Graduates Combined 2013-2014)
Median Salary in Current Dollars % Change from 2013
2013 2014 Current Dollars Constant Dollars*
All New Grads $41,600 $42,000 +1.0% -0.7%
Bachelor’s 39,600 40,000 +1.0% -0.7%
Master’s 55,000 52,000 -5.5% -7.1%
Doctorate 75,800 62,900 -17.0% -18.7%
* Rate of inflation = 1.7%
Table 1a compares median salary from 2013 to 2014 among
inexperienced new graduates by degree:
Bachelor: New bachelor's degree holders have similar median
incomes from $39,600 in 2013 to $40,000 in 2014.
Master: The change in median salary for new master’s degree
graduates is a likely function of low response.
Doctorate: Median salary for inexperienced PhD recipients fell to
$62,900 in 2014, likely due to low response.
Note: Salary data is based on new graduates as of May-June 2013 and
2014 who had obtained full-time permanent employment by the first
week of October the same year.
ACS SURVEY OF NEW GRADUATES: 2014
3
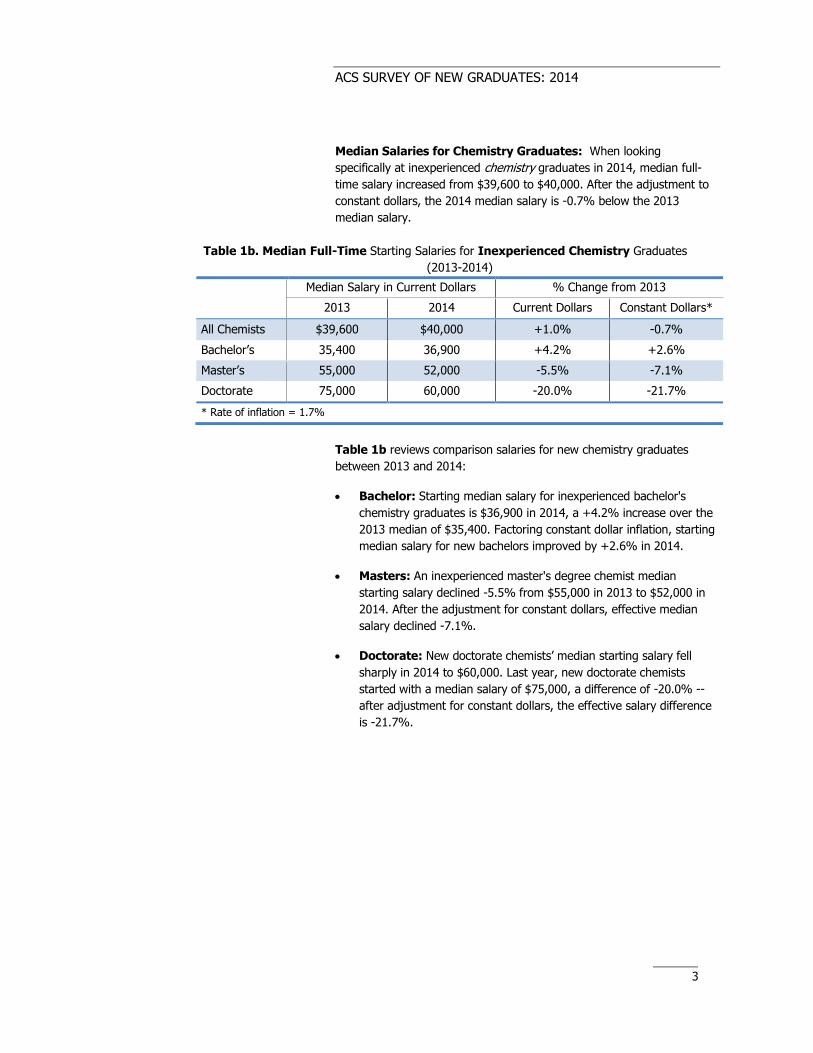
Median Salaries for Chemistry Graduates: When looking
specifically at inexperienced chemistry graduates in 2014, median full-
time salary increased from $39,600 to $40,000. After the adjustment to
constant dollars, the 2014 median salary is -0.7% below the 2013
median salary.
Table 1b. Median Full-Time Starting Salaries for Inexperienced Chemistry Graduates
(2013-2014)
Median Salary in Current Dollars % Change from 2013
2013 2014 Current Dollars Constant Dollars*
All Chemists $39,600 $40,000 +1.0% -0.7%
Bachelor’s 35,400 36,900 +4.2% +2.6%
Master’s 55,000 52,000 -5.5% -7.1%
Doctorate 75,000 60,000 -20.0% -21.7%
* Rate of inflation = 1.7%
Table 1b reviews comparison salaries for new chemistry graduates
between 2013 and 2014:
Bachelor: Starting median salary for inexperienced bachelor's
chemistry graduates is $36,900 in 2014, a +4.2% increase over the
2013 median of $35,400. Factoring constant dollar inflation, starting
median salary for new bachelors improved by +2.6% in 2014.
Masters: An inexperienced master's degree chemist median
starting salary declined -5.5% from $55,000 in 2013 to $52,000 in
2014. After the adjustment for constant dollars, effective median
salary declined -7.1%.
Doctorate: New doctorate chemists’ median starting salary fell
sharply in 2014 to $60,000. Last year, new doctorate chemists
started with a median salary of $75,000, a difference of -20.0% --
after adjustment for constant dollars, the effective salary difference
is -21.7%.
ACS SURVEY OF NEW GRADUATES: 2014
4
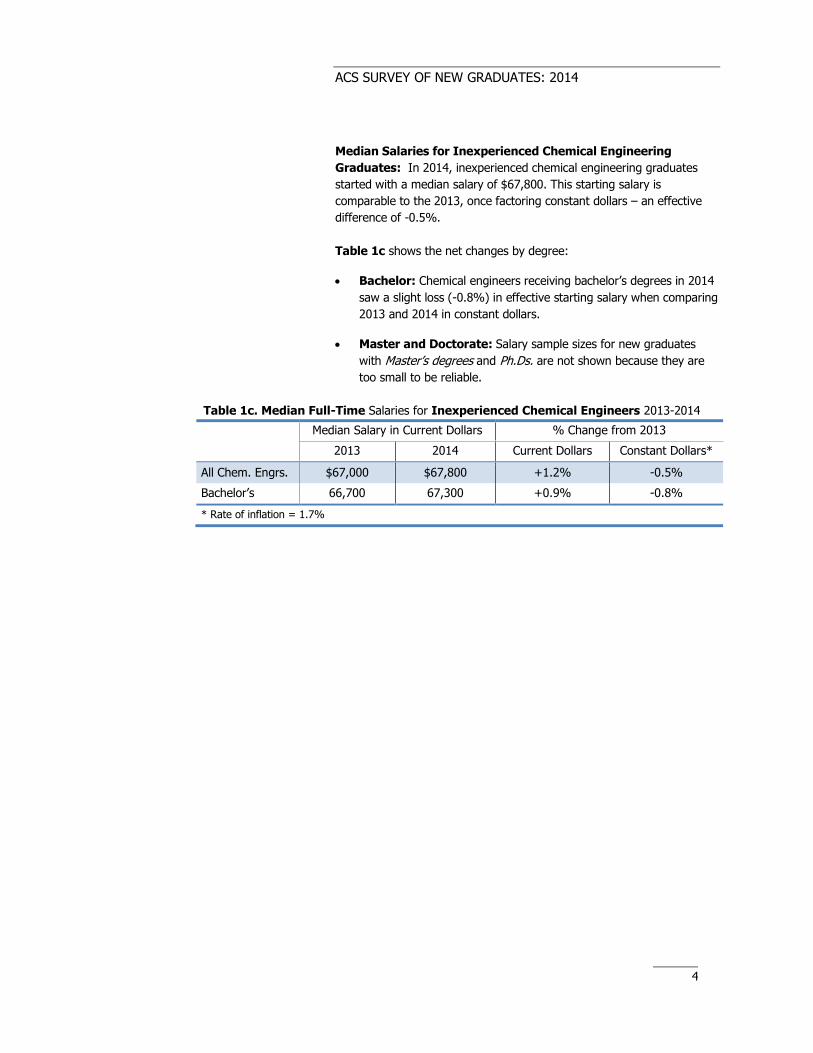
Median Salaries for Inexperienced Chemical Engineering
Graduates: In 2014, inexperienced chemical engineering graduates
started with a median salary of $67,800. This starting salary is
comparable to the 2013, once factoring constant dollars – an effective
difference of -0.5%.
Table 1c shows the net changes by degree:
Bachelor: Chemical engineers receiving bachelor’s degrees in 2014
saw a slight loss (-0.8%) in effective starting salary when comparing
2013 and 2014 in constant dollars.
Master and Doctorate: Salary sample sizes for new graduates
with Master’s degrees and Ph.Ds. are not shown because they are
too small to be reliable.
Table 1c. Median Full-Time Salaries for Inexperienced Chemical Engineers 2013-2014
Median Salary in Current Dollars % Change from 2013
2013 2014 Current Dollars Constant Dollars*
All Chem. Engrs. $67,000 $67,800 +1.2% -0.5%
Bachelor’s 66,700 67,300 +0.9% -0.8%
* Rate of inflation = 1.7%
ACS SURVEY OF NEW GRADUATES: 2014
5
MEAN STARTING
SALARIES
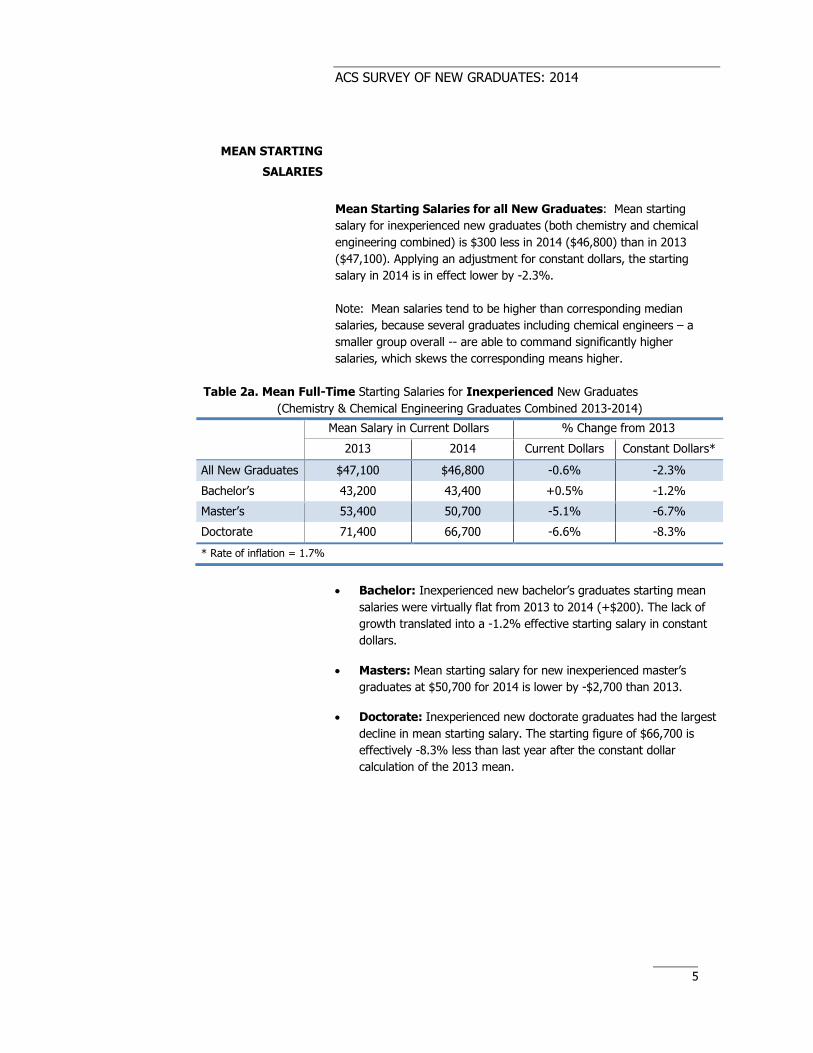
Mean Starting Salaries for all New Graduates: Mean starting
salary for inexperienced new graduates (both chemistry and chemical
engineering combined) is $300 less in 2014 ($46,800) than in 2013
($47,100). Applying an adjustment for constant dollars, the starting
salary in 2014 is in effect lower by -2.3%.
Note: Mean salaries tend to be higher than corresponding median
salaries, because several graduates including chemical engineers – a
smaller group overall -- are able to command significantly higher
salaries, which skews the corresponding means higher.
Table 2a. Mean Full-Time Starting Salaries for Inexperienced New Graduates
(Chemistry & Chemical Engineering Graduates Combined 2013-2014)
Mean Salary in Current Dollars % Change from 2013
2013 2014 Current Dollars Constant Dollars*
All New Graduates $47,100 $46,800 -0.6% -2.3%
Bachelor’s 43,200 43,400 +0.5% -1.2%
Master’s 53,400 50,700 -5.1% -6.7%
Doctorate 71,400 66,700 -6.6% -8.3%
* Rate of inflation = 1.7%
Bachelor: Inexperienced new bachelor’s graduates starting mean
salaries were virtually flat from 2013 to 2014 (+$200). The lack of
growth translated into a -1.2% effective starting salary in constant
dollars.
Masters: Mean starting salary for new inexperienced master’s
graduates at $50,700 for 2014 is lower by -$2,700 than 2013.
Doctorate: Inexperienced new doctorate graduates had the largest
decline in mean starting salary. The starting figure of $66,700 is
effectively -8.3% less than last year after the constant dollar
calculation of the 2013 mean.
ACS SURVEY OF NEW GRADUATES: 2014
6
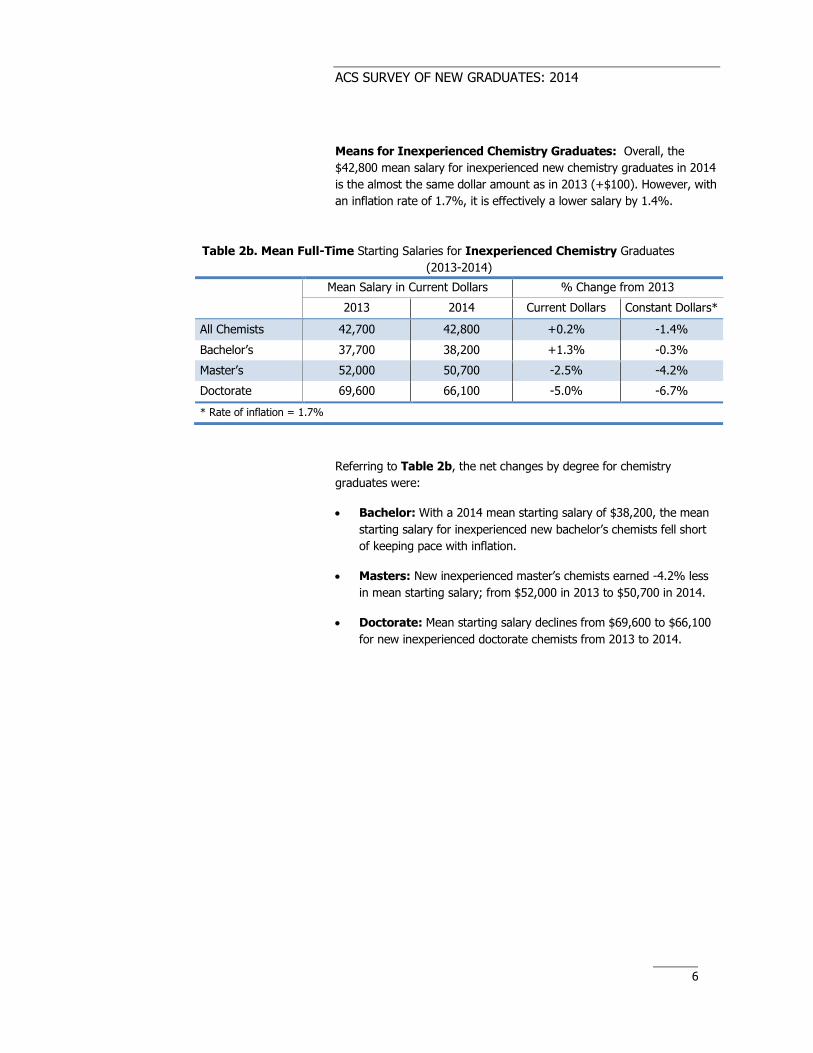
Means for Inexperienced Chemistry Graduates: Overall, the
$42,800 mean salary for inexperienced new chemistry graduates in 2014
is the almost the same dollar amount as in 2013 (+$100). However, with
an inflation rate of 1.7%, it is effectively a lower salary by 1.4%.
Table 2b. Mean Full-Time Starting Salaries for Inexperienced Chemistry Graduates
(2013-2014)
Mean Salary in Current Dollars % Change from 2013
2013 2014 Current Dollars Constant Dollars*
All Chemists 42,700 42,800 +0.2% -1.4%
Bachelor’s 37,700 38,200 +1.3% -0.3%
Master’s 52,000 50,700 -2.5% -4.2%
Doctorate 69,600 66,100 -5.0% -6.7%
* Rate of inflation = 1.7%
Referring to Table 2b, the net changes by degree for chemistry
graduates were:
Bachelor: With a 2014 mean starting salary of $38,200, the mean
starting salary for inexperienced new bachelor’s chemists fell short
of keeping pace with inflation.
Masters: New inexperienced master’s chemists earned -4.2% less
in mean starting salary; from $52,000 in 2013 to $50,700 in 2014.
Doctorate: Mean starting salary declines from $69,600 to $66,100
for new inexperienced doctorate chemists from 2013 to 2014.
ACS SURVEY OF NEW GRADUATES: 2014
7
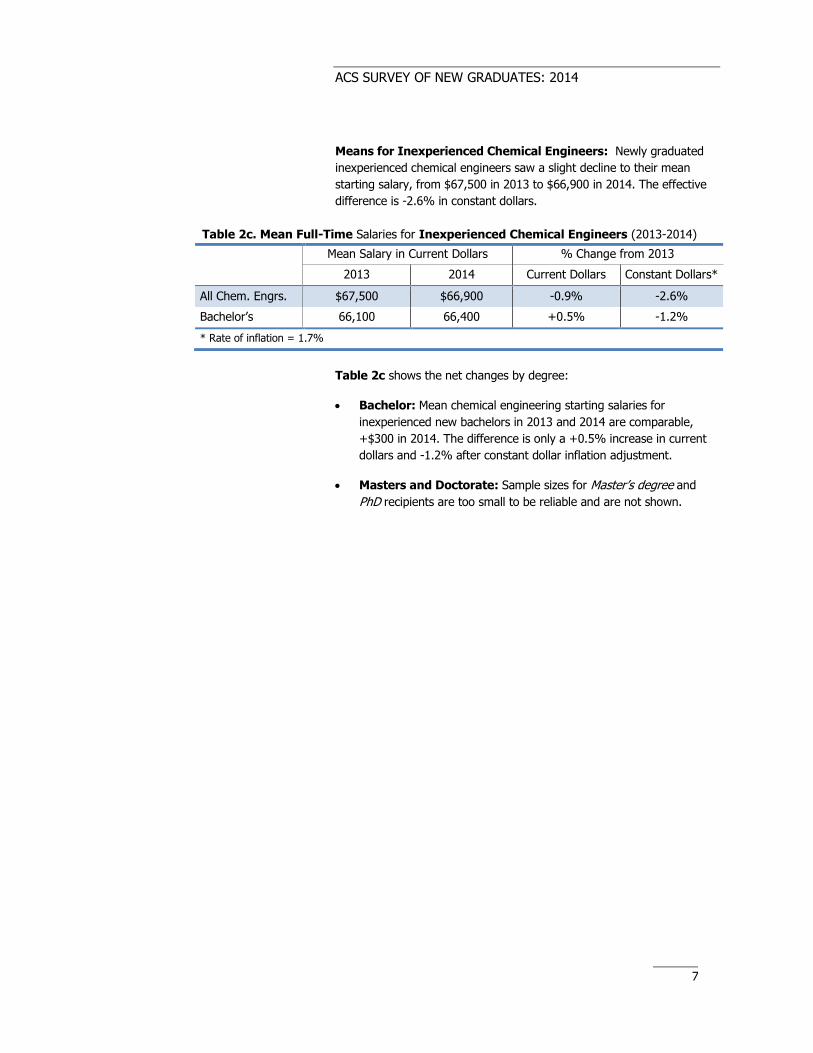
Means for Inexperienced Chemical Engineers: Newly graduated
inexperienced chemical engineers saw a slight decline to their mean
starting salary, from $67,500 in 2013 to $66,900 in 2014. The effective
difference is -2.6% in constant dollars.
Table 2c. Mean Full-Time Salaries for Inexperienced Chemical Engineers (2013-2014)
Mean Salary in Current Dollars % Change from 2013
2013 2014 Current Dollars Constant Dollars*
All Chem. Engrs. $67,500 $66,900 -0.9% -2.6%
Bachelor’s 66,100 66,400 +0.5% -1.2%
* Rate of inflation = 1.7%
Table 2c shows the net changes by degree:
Bachelor: Mean chemical engineering starting salaries for
inexperienced new bachelors in 2013 and 2014 are comparable,
+$300 in 2014. The difference is only a +0.5% increase in current
dollars and -1.2% after constant dollar inflation adjustment.
Masters and Doctorate: Sample sizes for Master’s degree and
PhD recipients are too small to be reliable and are not shown.
ACS SURVEY OF NEW GRADUATES: 2014
8
SALARY INCREASES
OVER TIME
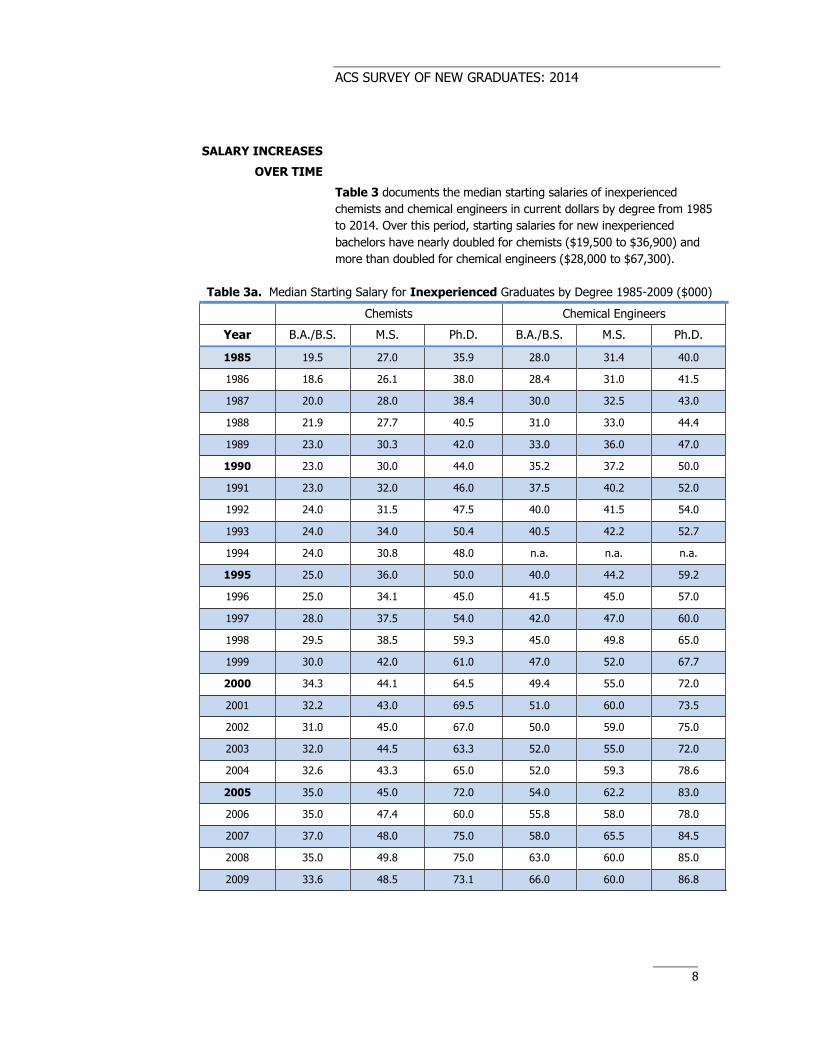
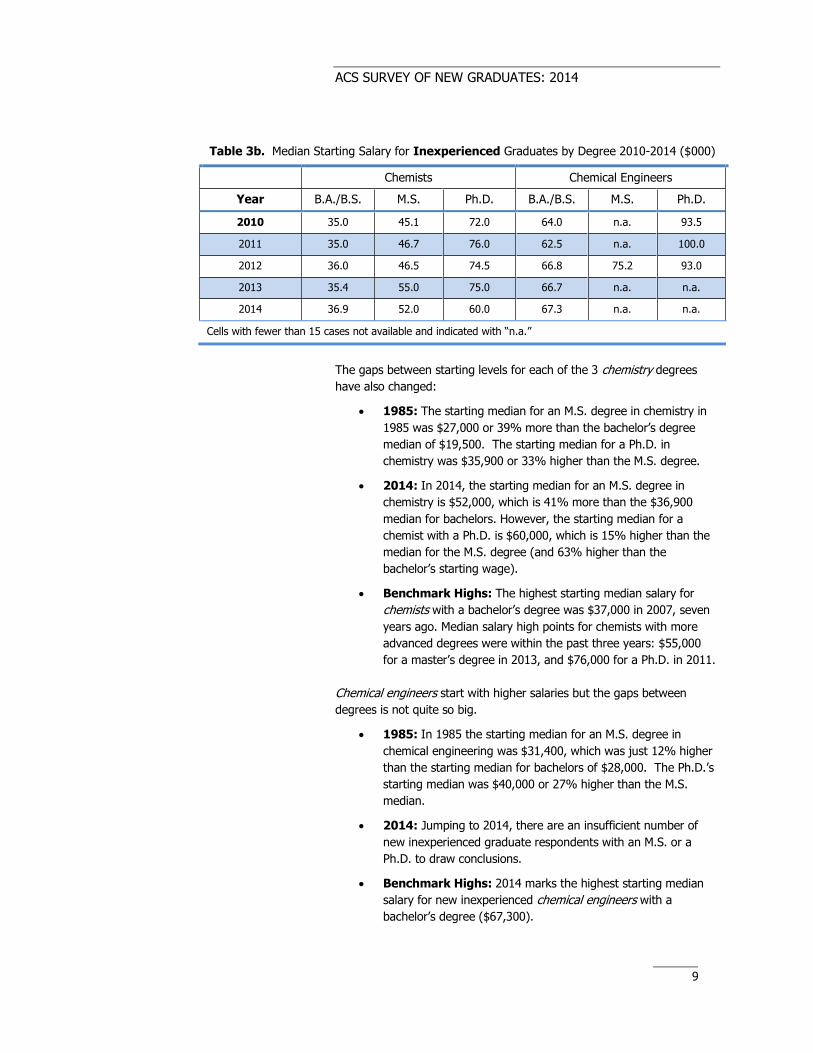
Table 3 documents the median starting salaries of inexperienced
chemists and chemical engineers in current dollars by degree from 1985
to 2014. Over this period, starting salaries for new inexperienced
bachelors have nearly doubled for chemists ($19,500 to $36,900) and
more than doubled for chemical engineers ($28,000 to $67,300).
Table 3a. Median Starting Salary for Inexperienced Graduates by Degree 1985-2009 ($000)
Chemists Chemical Engineers
Year B.A./B.S. M.S. Ph.D. B.A./B.S. M.S. Ph.D.
1985 19.5 27.0 35.9 28.0 31.4 40.0
1986 18.6 26.1 38.0 28.4 31.0 41.5
1987 20.0 28.0 38.4 30.0 32.5 43.0
1988 21.9 27.7 40.5 31.0 33.0 44.4
1989 23.0 30.3 42.0 33.0 36.0 47.0
1990 23.0 30.0 44.0 35.2 37.2 50.0
1991 23.0 32.0 46.0 37.5 40.2 52.0
1992 24.0 31.5 47.5 40.0 41.5 54.0
1993 24.0 34.0 50.4 40.5 42.2 52.7
1994 24.0 30.8 48.0 n.a. n.a. n.a.
1995 25.0 36.0 50.0 40.0 44.2 59.2
1996 25.0 34.1 45.0 41.5 45.0 57.0
1997 28.0 37.5 54.0 42.0 47.0 60.0
1998 29.5 38.5 59.3 45.0 49.8 65.0
1999 30.0 42.0 61.0 47.0 52.0 67.7
2000 34.3 44.1 64.5 49.4 55.0 72.0
2001 32.2 43.0 69.5 51.0 60.0 73.5
2002 31.0 45.0 67.0 50.0 59.0 75.0
2003 32.0 44.5 63.3 52.0 55.0 72.0
2004 32.6 43.3 65.0 52.0 59.3 78.6
2005 35.0 45.0 72.0 54.0 62.2 83.0
2006 35.0 47.4 60.0 55.8 58.0 78.0
2007 37.0 48.0 75.0 58.0 65.5 84.5
2008 35.0 49.8 75.0 63.0 60.0 85.0
2009 33.6 48.5 73.1 66.0 60.0 86.8
ACS SURVEY OF NEW GRADUATES: 2014
9
Table 3b. Median Starting Salary for Inexperienced Graduates by Degree 2010-2014 ($000)
Chemists Chemical Engineers
Year B.A./B.S. M.S. Ph.D. B.A./B.S. M.S. Ph.D.
2010 35.0 45.1 72.0 64.0 n.a. 93.5
2011 35.0 46.7 76.0 62.5 n.a. 100.0
2012 36.0 46.5 74.5 66.8 75.2 93.0
2013 35.4 55.0 75.0 66.7 n.a. n.a.
2014 36.9 52.0 60.0 67.3 n.a. n.a.
Cells with fewer than 15 cases not available and indicated with “n.a.”
The gaps between starting levels for each of the 3 chemistry degrees
have also changed:
1985: The starting median for an M.S. degree in chemistry in
1985 was $27,000 or 39% more than the bachelor’s degree
median of $19,500. The starting median for a Ph.D. in
chemistry was $35,900 or 33% higher than the M.S. degree.
2014: In 2014, the starting median for an M.S. degree in
chemistry is $52,000, which is 41% more than the $36,900
median for bachelors. However, the starting median for a
chemist with a Ph.D. is $60,000, which is 15% higher than the
median for the M.S. degree (and 63% higher than the
bachelor’s starting wage).
Benchmark Highs: The highest starting median salary for
chemists with a bachelor’s degree was $37,000 in 2007, seven
years ago. Median salary high points for chemists with more
advanced degrees were within the past three years: $55,000
for a master’s degree in 2013, and $76,000 for a Ph.D. in 2011.
Chemical engineers start with higher salaries but the gaps between
degrees is not quite so big.
1985: In 1985 the starting median for an M.S. degree in
chemical engineering was $31,400, which was just 12% higher
than the starting median for bachelors of $28,000. The Ph.D.’s
starting median was $40,000 or 27% higher than the M.S.
median.
2014: Jumping to 2014, there are an insufficient number of
new inexperienced graduate respondents with an M.S. or a
Ph.D. to draw conclusions.
Benchmark Highs: 2014 marks the highest starting median
salary for new inexperienced chemical engineers with a
bachelor’s degree ($67,300).
ACS SURVEY OF NEW GRADUATES: 2014
10
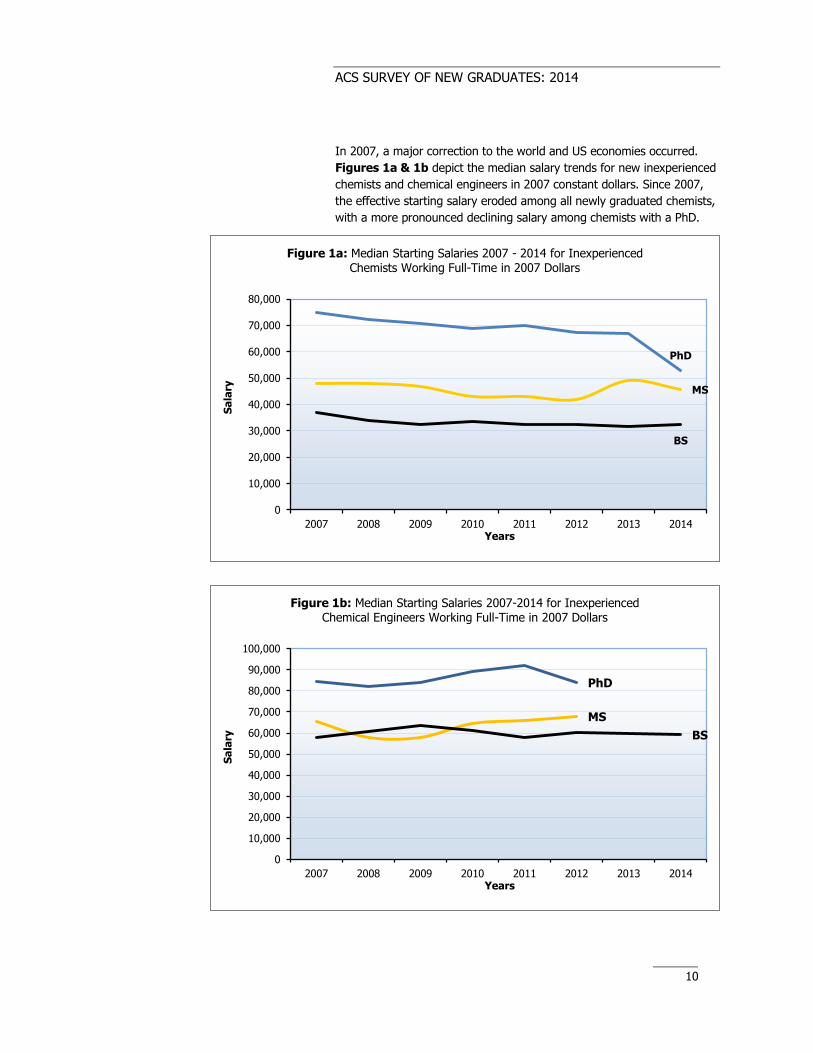
In 2007, a major correction to the world and US economies occurred.
Figures 1a & 1b depict the median salary trends for new inexperienced
chemists and chemical engineers in 2007 constant dollars. Since 2007,
the effective starting salary eroded among all newly graduated chemists,
with a more pronounced declining salary among chemists with a PhD.
PhD
MS
BS
0
10,000
20,000
30,000
40,000
50,000
60,000
70,000
80,000
2007 2008 2009 2010 2011 2012 2013 2014
Sa
lary
Years
Figure 1a: Median Starting Salaries 2007 - 2014 for Inexperienced Chemists Working Full-Time in 2007 Dollars
PhD
MS
BS
0
10,000
20,000
30,000
40,000
50,000
60,000
70,000
80,000
90,000
100,000
2007 2008 2009 2010 2011 2012 2013 2014
Sa
lary
Years
Figure 1b: Median Starting Salaries 2007-2014 for Inexperienced Chemical Engineers Working Full-Time in 2007 Dollars
ACS SURVEY OF NEW GRADUATES: 2014
11
STARTING SALARIES
BY PERCENTILE
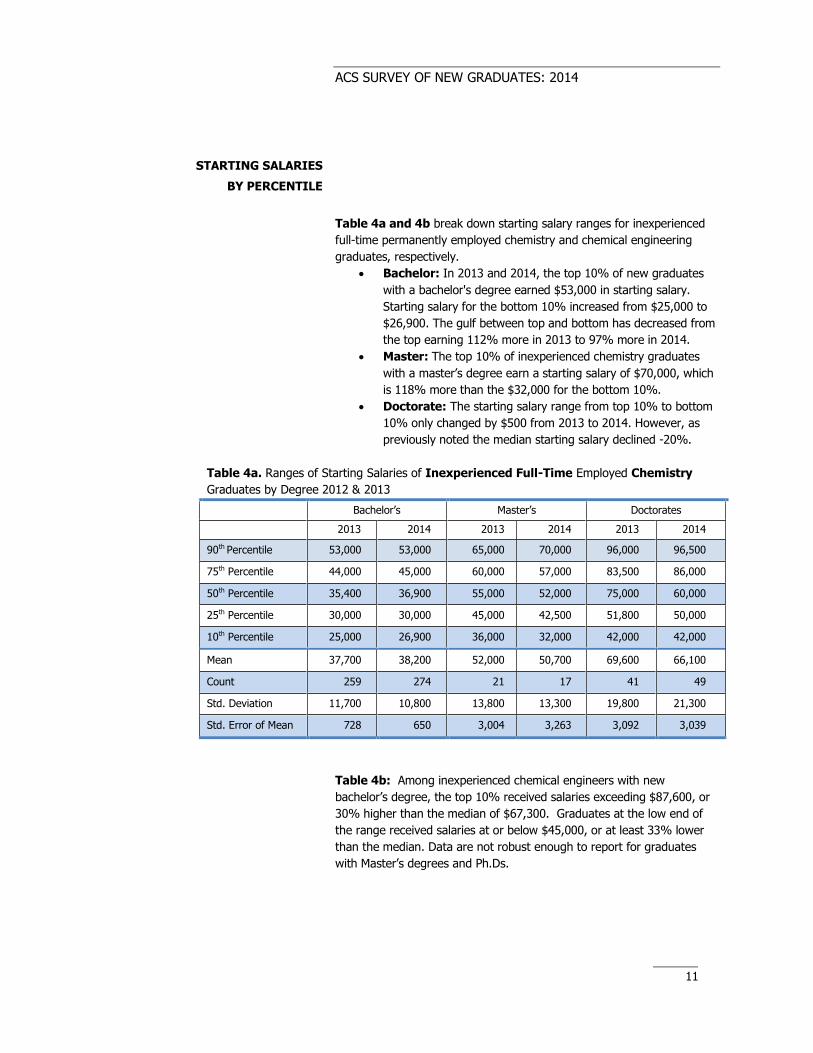
Table 4a and 4b break down starting salary ranges for inexperienced
full-time permanently employed chemistry and chemical engineering
graduates, respectively.
Bachelor: In 2013 and 2014, the top 10% of new graduates
with a bachelor's degree earned $53,000 in starting salary.
Starting salary for the bottom 10% increased from $25,000 to
$26,900. The gulf between top and bottom has decreased from
the top earning 112% more in 2013 to 97% more in 2014.
Master: The top 10% of inexperienced chemistry graduates
with a master’s degree earn a starting salary of $70,000, which
is 118% more than the $32,000 for the bottom 10%.
Doctorate: The starting salary range from top 10% to bottom
10% only changed by $500 from 2013 to 2014. However, as
previously noted the median starting salary declined -20%.
Table 4a. Ranges of Starting Salaries of Inexperienced Full-Time Employed Chemistry
Graduates by Degree 2012 & 2013
Bachelor’s Master’s Doctorates
2013 2014 2013 2014 2013 2014
90th Percentile 53,000 53,000 65,000 70,000 96,000 96,500
75th Percentile 44,000 45,000 60,000 57,000 83,500 86,000
50th Percentile 35,400 36,900 55,000 52,000 75,000 60,000
25th Percentile 30,000 30,000 45,000 42,500 51,800 50,000
10th Percentile 25,000 26,900 36,000 32,000 42,000 42,000
Mean 37,700 38,200 52,000 50,700 69,600 66,100
Count 259 274 21 17 41 49
Std. Deviation 11,700 10,800 13,800 13,300 19,800 21,300
Std. Error of Mean 728 650 3,004 3,263 3,092 3,039
Table 4b: Among inexperienced chemical engineers with new
bachelor’s degree, the top 10% received salaries exceeding $87,600, or
30% higher than the median of $67,300. Graduates at the low end of
the range received salaries at or below $45,000, or at least 33% lower
than the median. Data are not robust enough to report for graduates
with Master’s degrees and Ph.Ds.
ACS SURVEY OF NEW GRADUATES: 2014
12
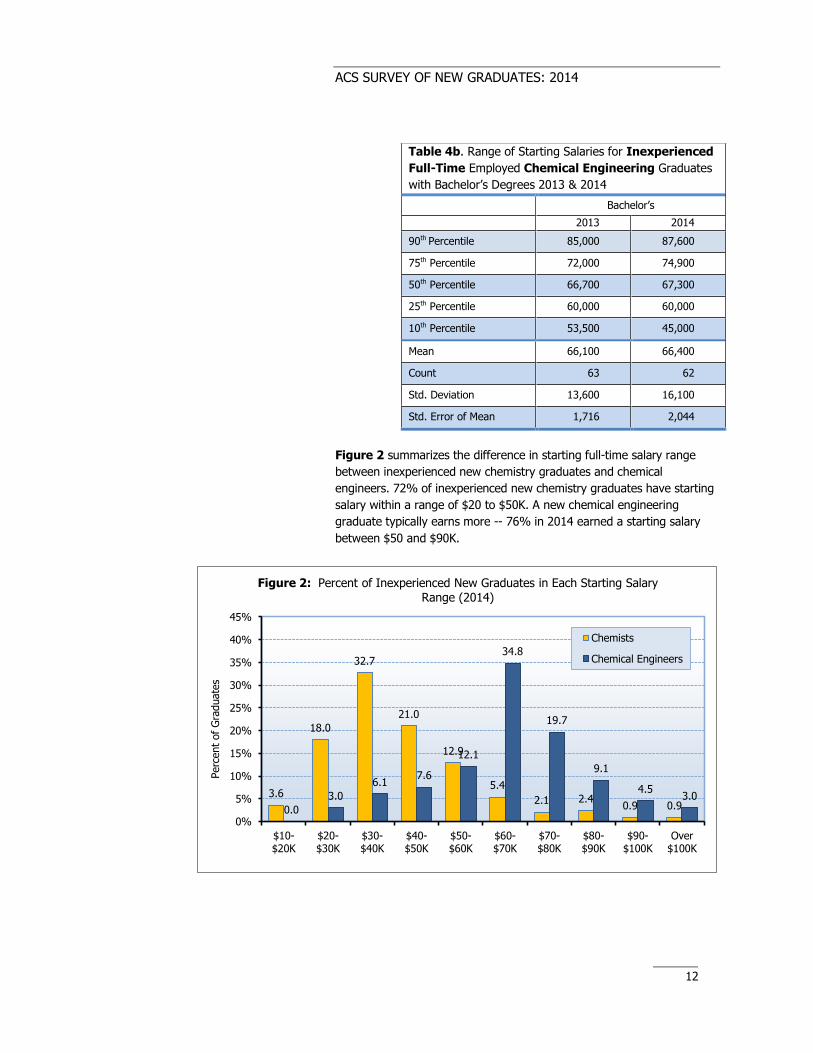
Table 4b. Range of Starting Salaries for Inexperienced
Full-Time Employed Chemical Engineering Graduates
with Bachelor’s Degrees 2013 & 2014
Bachelor’s
2013 2014
90th Percentile 85,000 87,600
75th Percentile 72,000 74,900
50th Percentile 66,700 67,300
25th Percentile 60,000 60,000
10th Percentile 53,500 45,000
Mean 66,100 66,400
Count 63 62
Std. Deviation 13,600 16,100
Std. Error of Mean 1,716 2,044
Figure 2 summarizes the difference in starting full-time salary range
between inexperienced new chemistry graduates and chemical
engineers. 72% of inexperienced new chemistry graduates have starting
salary within a range of $20 to $50K. A new chemical engineering
graduate typically earns more -- 76% in 2014 earned a starting salary
between $50 and $90K.
3.6
18.0
32.7
21.0
12.9
5.4
2.1 2.4 0.9 0.9 0.0
3.0
6.1 7.6
12.1
34.8
19.7
9.1
4.5 3.0
0%
5%
10%
15%
20%
25%
30%
35%
40%
45%
$10-$20K
$20-$30K
$30-$40K
$40-$50K
$50-$60K
$60-$70K
$70-$80K
$80-$90K
$90-$100K
Over$100K
Perc
ent
of
Gra
duate
s
Figure 2: Percent of Inexperienced New Graduates in Each Starting Salary Range (2014)
Chemists
Chemical Engineers
ACS SURVEY OF NEW GRADUATES: 2014
13
SALARIES BY
EMPLOYMENT SECTOR
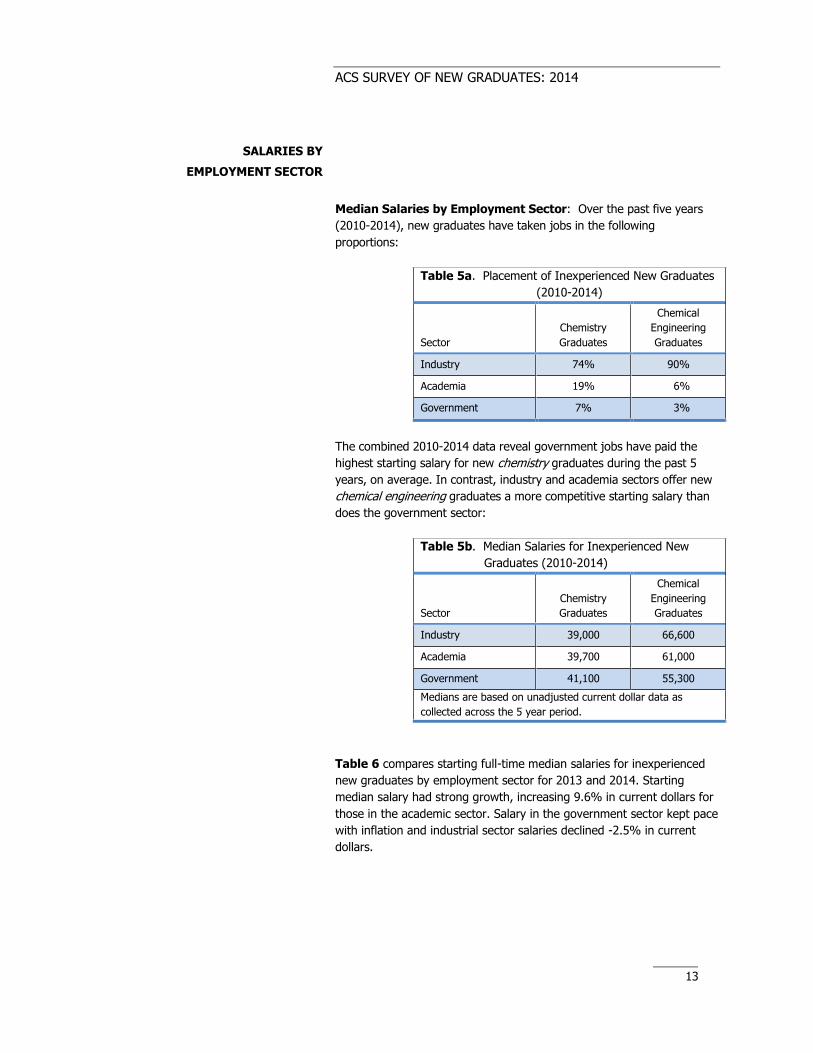
Median Salaries by Employment Sector: Over the past five years
(2010-2014), new graduates have taken jobs in the following
proportions:
Table 5a. Placement of Inexperienced New Graduates
(2010-2014)
Sector
Chemistry
Graduates
Chemical
Engineering
Graduates
Industry 74% 90%
Academia 19% 6%
Government 7% 3%
The combined 2010-2014 data reveal government jobs have paid the
highest starting salary for new chemistry graduates during the past 5
years, on average. In contrast, industry and academia sectors offer new
chemical engineering graduates a more competitive starting salary than
does the government sector:
Table 5b. Median Salaries for Inexperienced New
Graduates (2010-2014)
Sector
Chemistry
Graduates
Chemical
Engineering
Graduates
Industry 39,000 66,600
Academia 39,700 61,000
Government 41,100 55,300
Medians are based on unadjusted current dollar data as
collected across the 5 year period.
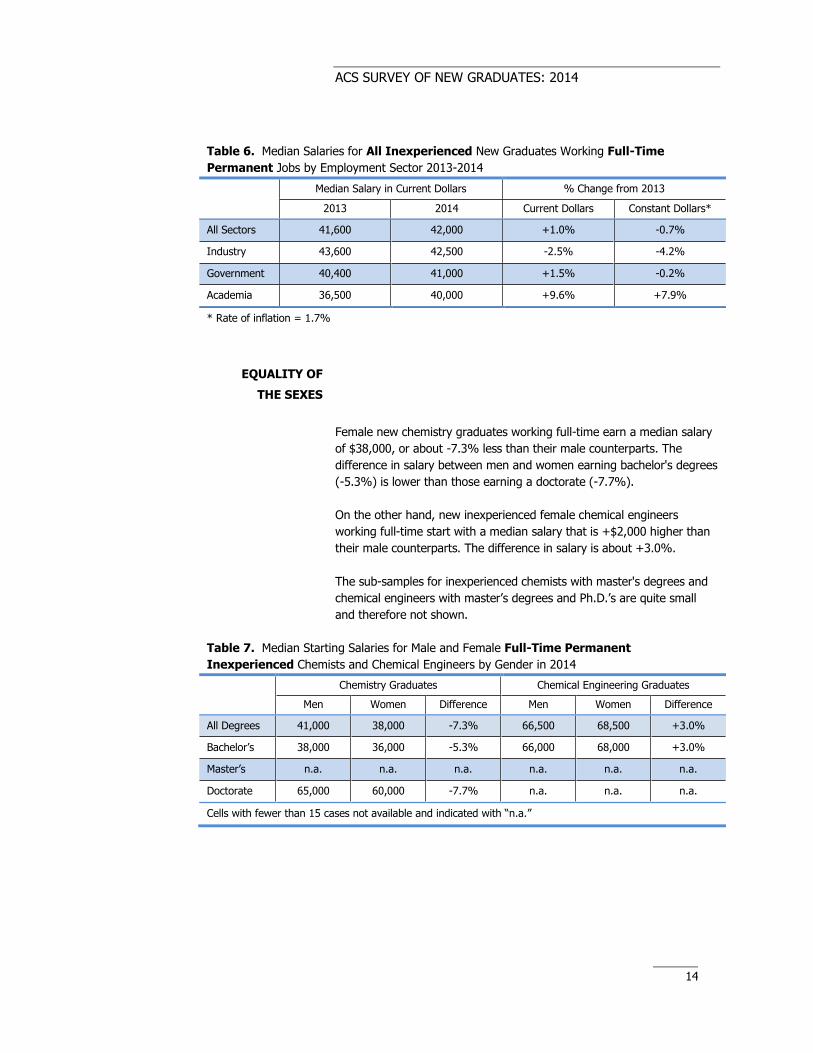
Table 6 compares starting full-time median salaries for inexperienced
new graduates by employment sector for 2013 and 2014. Starting
median salary had strong growth, increasing 9.6% in current dollars for
those in the academic sector. Salary in the government sector kept pace
with inflation and industrial sector salaries declined -2.5% in current
dollars.
ACS SURVEY OF NEW GRADUATES: 2014
14
Table 6. Median Salaries for All Inexperienced New Graduates Working Full-Time
Permanent Jobs by Employment Sector 2013-2014
Median Salary in Current Dollars % Change from 2013
2013 2014 Current Dollars Constant Dollars*
All Sectors 41,600 42,000 +1.0% -0.7%
Industry 43,600 42,500 -2.5% -4.2%
Government 40,400 41,000 +1.5% -0.2%
Academia 36,500 40,000 +9.6% +7.9%
* Rate of inflation = 1.7%
EQUALITY OF
THE SEXES
Female new chemistry graduates working full-time earn a median salary
of $38,000, or about -7.3% less than their male counterparts. The
difference in salary between men and women earning bachelor's degrees
(-5.3%) is lower than those earning a doctorate (-7.7%).
On the other hand, new inexperienced female chemical engineers
working full-time start with a median salary that is +$2,000 higher than
their male counterparts. The difference in salary is about +3.0%.
The sub-samples for inexperienced chemists with master's degrees and
chemical engineers with master’s degrees and Ph.D.’s are quite small
and therefore not shown.
Table 7. Median Starting Salaries for Male and Female Full-Time Permanent
Inexperienced Chemists and Chemical Engineers by Gender in 2014
Chemistry Graduates Chemical Engineering Graduates
Men Women Difference Men Women Difference
All Degrees 41,000 38,000 -7.3% 66,500 68,500 +3.0%
Bachelor’s 38,000 36,000 -5.3% 66,000 68,000 +3.0%
Master’s n.a. n.a. n.a. n.a. n.a. n.a.
Doctorate 65,000 60,000 -7.7% n.a. n.a. n.a.
Cells with fewer than 15 cases not available and indicated with “n.a.”
ACS SURVEY OF NEW GRADUATES: 2014
15
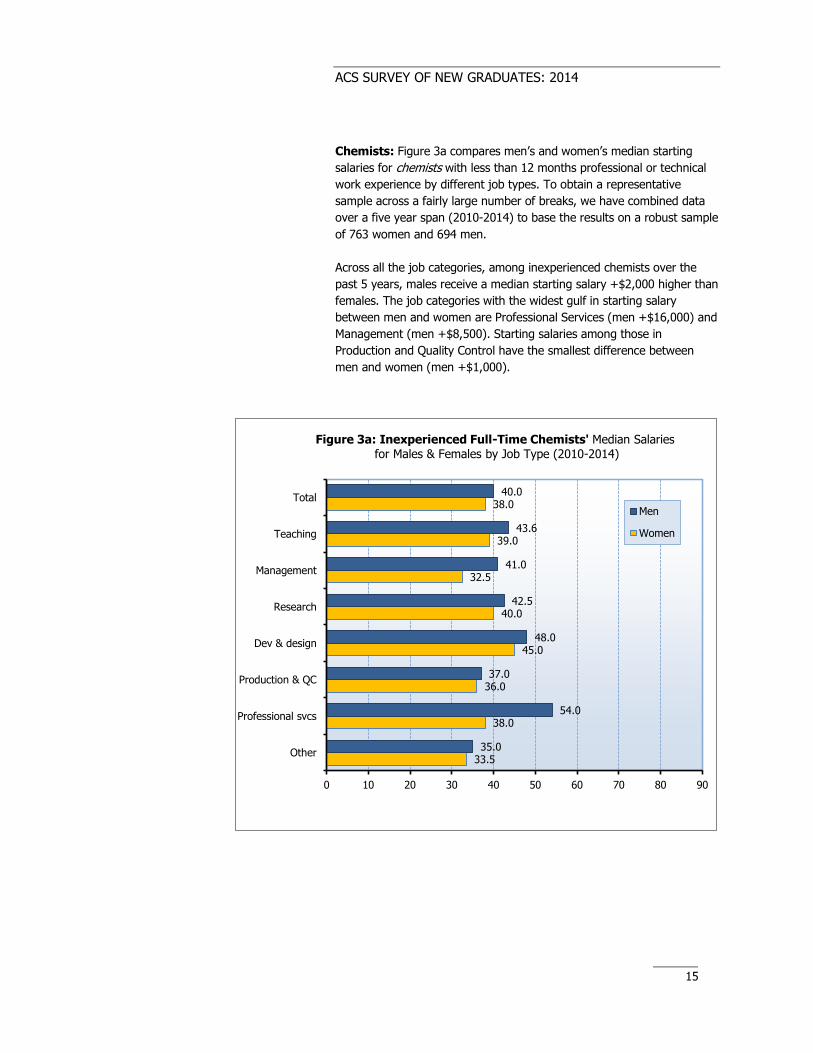
Chemists: Figure 3a compares men’s and women’s median starting
salaries for chemists with less than 12 months professional or technical
work experience by different job types. To obtain a representative
sample across a fairly large number of breaks, we have combined data
over a five year span (2010-2014) to base the results on a robust sample
of 763 women and 694 men.
Across all the job categories, among inexperienced chemists over the
past 5 years, males receive a median starting salary +$2,000 higher than
females. The job categories with the widest gulf in starting salary
between men and women are Professional Services (men +$16,000) and
Management (men +$8,500). Starting salaries among those in
Production and Quality Control have the smallest difference between
men and women (men +$1,000).
33.5
38.0
36.0
45.0
40.0
32.5
39.0
38.0
35.0
54.0
37.0
48.0
42.5
41.0
43.6
40.0
0 10 20 30 40 50 60 70 80 90
Other
Professional svcs
Production & QC
Dev & design
Research
Management
Teaching
Total
Figure 3a: Inexperienced Full-Time Chemists' Median Salaries for Males & Females by Job Type (2010-2014)
Men
Women
ACS SURVEY OF NEW GRADUATES: 2014
16
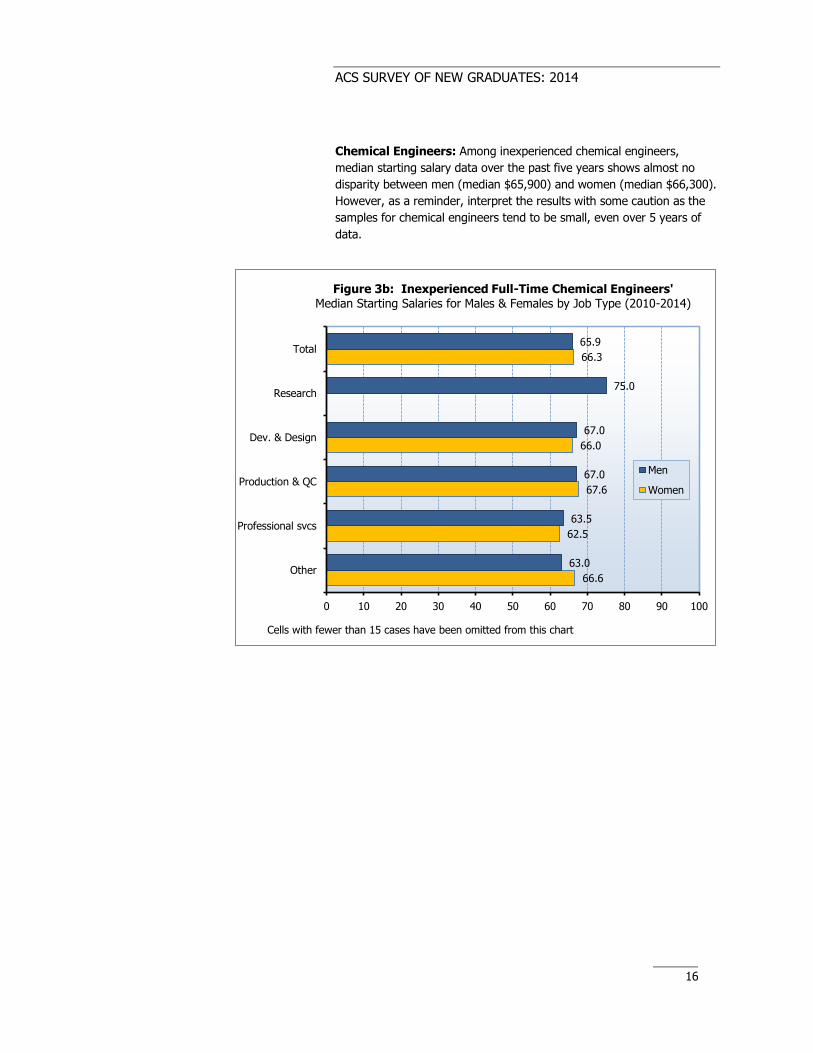
Chemical Engineers: Among inexperienced chemical engineers,
median starting salary data over the past five years shows almost no
disparity between men (median $65,900) and women (median $66,300).
However, as a reminder, interpret the results with some caution as the
samples for chemical engineers tend to be small, even over 5 years of
data.
66.6
62.5
67.6
66.0
66.3
63.0
63.5
67.0
67.0
75.0
65.9
0 10 20 30 40 50 60 70 80 90 100
Other
Professional svcs
Production & QC
Dev. & Design
Research
Total
Figure 3b: Inexperienced Full-Time Chemical Engineers' Median Starting Salaries for Males & Females by Job Type (2010-2014)
Men
Women
Cells with fewer than 15 cases have been omitted from this chart
ACS SURVEY OF NEW GRADUATES: 2014
17
PLANS FOR ADVANCED STUDY
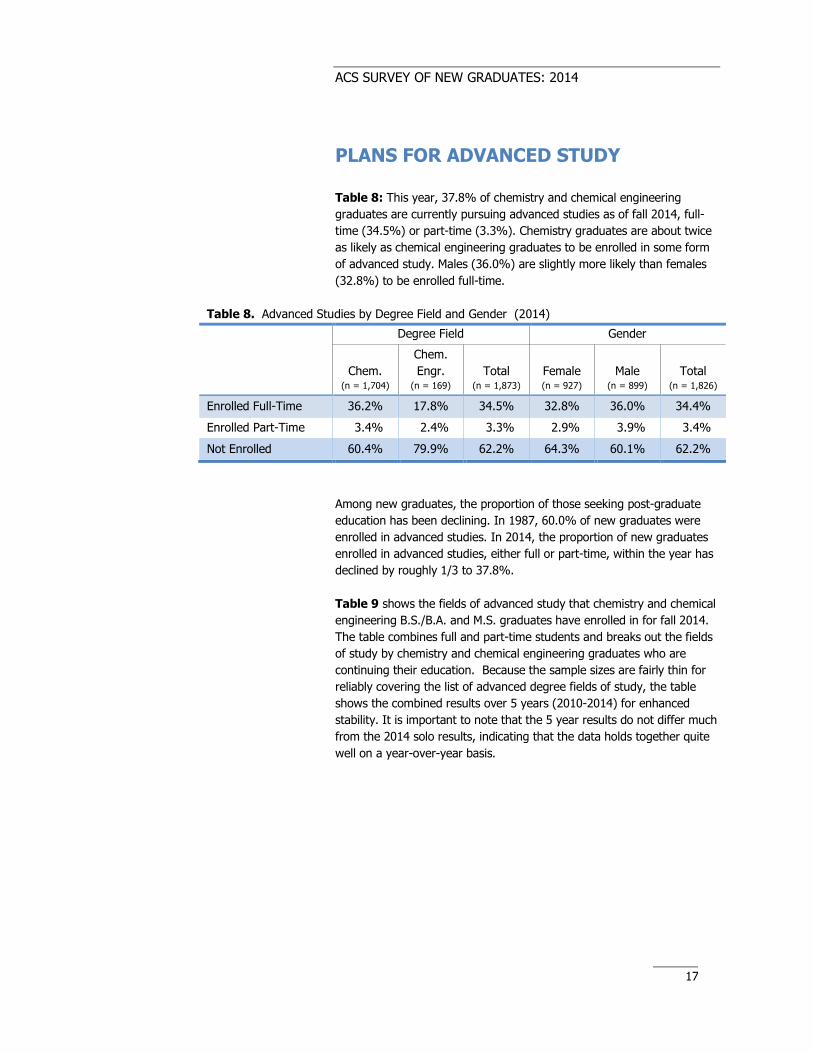
Table 8: This year, 37.8% of chemistry and chemical engineering
graduates are currently pursuing advanced studies as of fall 2014, full-
time (34.5%) or part-time (3.3%). Chemistry graduates are about twice
as likely as chemical engineering graduates to be enrolled in some form
of advanced study. Males (36.0%) are slightly more likely than females
(32.8%) to be enrolled full-time.
Table 8. Advanced Studies by Degree Field and Gender (2014)
Degree Field Gender
Chem. (n = 1,704)
Chem.
Engr. (n = 169)
Total (n = 1,873)
Female (n = 927)
Male (n = 899)
Total (n = 1,826)
Enrolled Full-Time 36.2% 17.8% 34.5% 32.8% 36.0% 34.4%
Enrolled Part-Time 3.4% 2.4% 3.3% 2.9% 3.9% 3.4%
Not Enrolled 60.4% 79.9% 62.2% 64.3% 60.1% 62.2%
Among new graduates, the proportion of those seeking post-graduate
education has been declining. In 1987, 60.0% of new graduates were
enrolled in advanced studies. In 2014, the proportion of new graduates
enrolled in advanced studies, either full or part-time, within the year has
declined by roughly 1/3 to 37.8%.
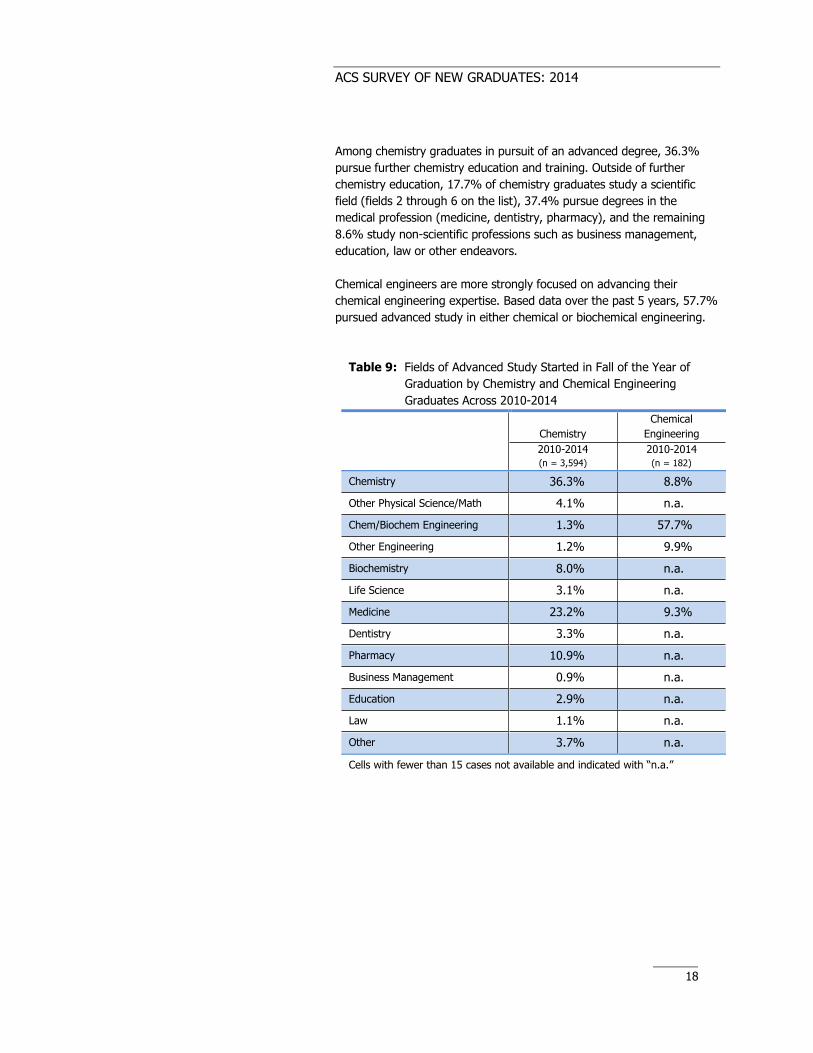
Table 9 shows the fields of advanced study that chemistry and chemical
engineering B.S./B.A. and M.S. graduates have enrolled in for fall 2014.
The table combines full and part-time students and breaks out the fields
of study by chemistry and chemical engineering graduates who are
continuing their education. Because the sample sizes are fairly thin for
reliably covering the list of advanced degree fields of study, the table
shows the combined results over 5 years (2010-2014) for enhanced
stability. It is important to note that the 5 year results do not differ much
from the 2014 solo results, indicating that the data holds together quite
well on a year-over-year basis.
ACS SURVEY OF NEW GRADUATES: 2014
18
Among chemistry graduates in pursuit of an advanced degree, 36.3%
pursue further chemistry education and training. Outside of further
chemistry education, 17.7% of chemistry graduates study a scientific
field (fields 2 through 6 on the list), 37.4% pursue degrees in the
medical profession (medicine, dentistry, pharmacy), and the remaining
8.6% study non-scientific professions such as business management,
education, law or other endeavors.
Chemical engineers are more strongly focused on advancing their
chemical engineering expertise. Based data over the past 5 years, 57.7%
pursued advanced study in either chemical or biochemical engineering.
Table 9: Fields of Advanced Study Started in Fall of the Year of
Graduation by Chemistry and Chemical Engineering
Graduates Across 2010-2014
Chemistry
Chemical
Engineering
2010-2014
(n = 3,594)
2010-2014
(n = 182)
Chemistry 36.3% 8.8%
Other Physical Science/Math 4.1% n.a.
Chem/Biochem Engineering 1.3% 57.7%
Other Engineering 1.2% 9.9%
Biochemistry 8.0% n.a.
Life Science 3.1% n.a.
Medicine 23.2% 9.3%
Dentistry 3.3% n.a.
Pharmacy 10.9% n.a.
Business Management 0.9% n.a.
Education 2.9% n.a.
Law 1.1% n.a.
Other 3.7% n.a.
Cells with fewer than 15 cases not available and indicated with “n.a.”
ACS SURVEY OF NEW GRADUATES: 2014
19
EMPLOYMENT STATUS
EMPLOYMENT STATUS
Table 10 below brings all employment variables tracked by the new
graduate study together in a single summary table for all 2014
graduates:
Table 10. Summary of Employment Status for
All New Graduates 2014
Employment Status
Respondent
Counts Percent
Full-Time Permanent 599 29.7%
Full-Time Temporary 195 9.7%
Part-Time Permanent 56 2.8%
Part-Time Temporary 128 6.4%
Graduate Student/Postdoc 706 35.0%
Not Employed/but Seeking 250 12.4%
Not Employed/not Seeking 81 4.0%
TOTAL 2,015 100.0%
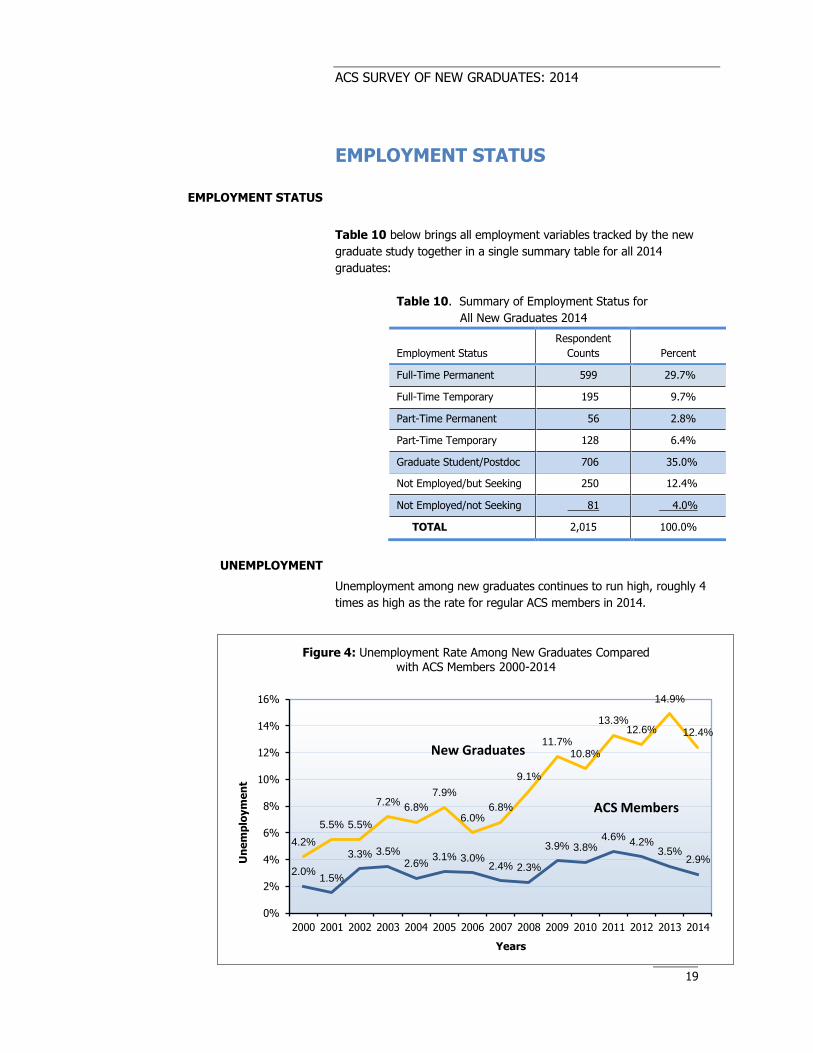
UNEMPLOYMENT
Unemployment among new graduates continues to run high, roughly 4
times as high as the rate for regular ACS members in 2014.
4.2%
5.5% 5.5%
7.2% 6.8%
7.9%
6.0% 6.8%
9.1%
11.7% 10.8%
13.3% 12.6%
14.9%
12.4%
2.0% 1.5%
3.3% 3.5% 2.6%
3.1% 3.0% 2.4% 2.3%
3.9% 3.8% 4.6%
4.2% 3.5%
2.9%
0%
2%
4%
6%
8%
10%
12%
14%
16%
2000 2001 2002 2003 2004 2005 2006 2007 2008 2009 2010 2011 2012 2013 2014
Un
em
plo
ym
en
t
Years
Figure 4: Unemployment Rate Among New Graduates Compared with ACS Members 2000-2014
New Graduates
ACS Members
ACS SURVEY OF NEW GRADUATES: 2014
20
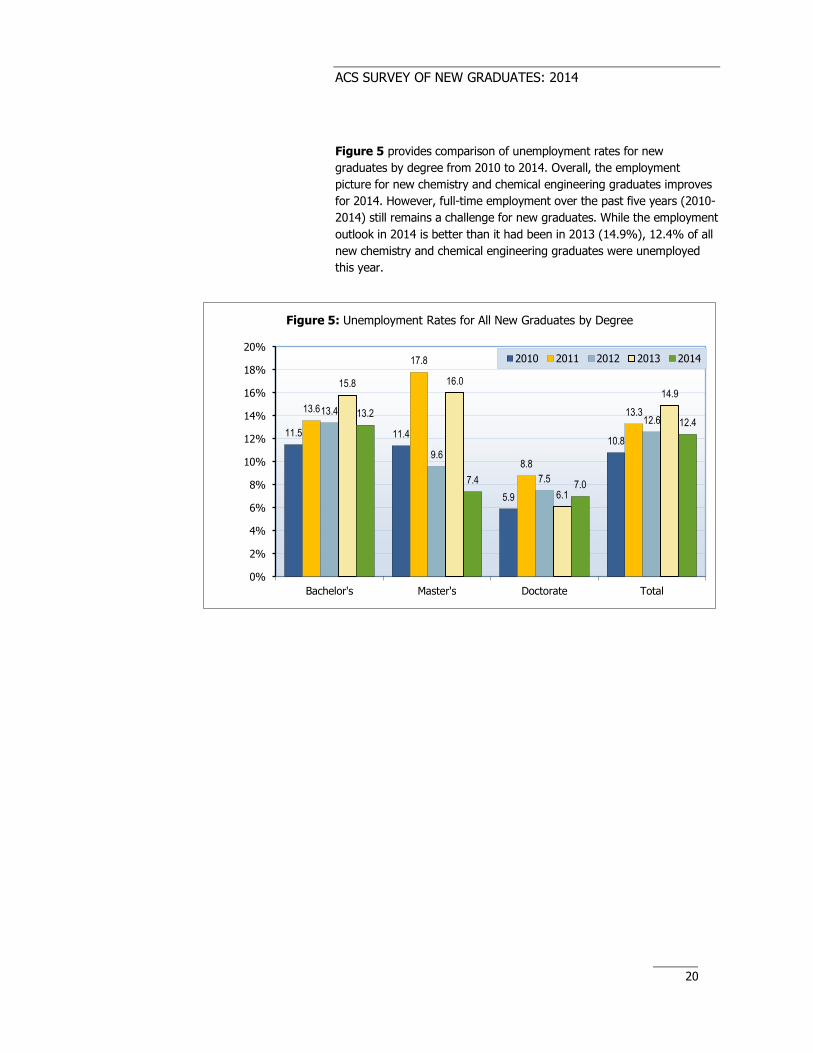
Figure 5 provides comparison of unemployment rates for new
graduates by degree from 2010 to 2014. Overall, the employment
picture for new chemistry and chemical engineering graduates improves
for 2014. However, full-time employment over the past five years (2010-
2014) still remains a challenge for new graduates. While the employment
outlook in 2014 is better than it had been in 2013 (14.9%), 12.4% of all
new chemistry and chemical engineering graduates were unemployed
this year.
11.5 11.4
5.9
10.8
13.6
17.8
8.8
13.3 13.4
9.6
7.5
12.6
15.8 16.0
6.1
14.9
13.2
7.4 7.0
12.4
0%
2%
4%
6%
8%
10%
12%
14%
16%
18%
20%
Bachelor's Master's Doctorate Total
Figure 5: Unemployment Rates for All New Graduates by Degree
2010 2011 2012 2013 2014
ACS SURVEY OF NEW GRADUATES: 2014
21
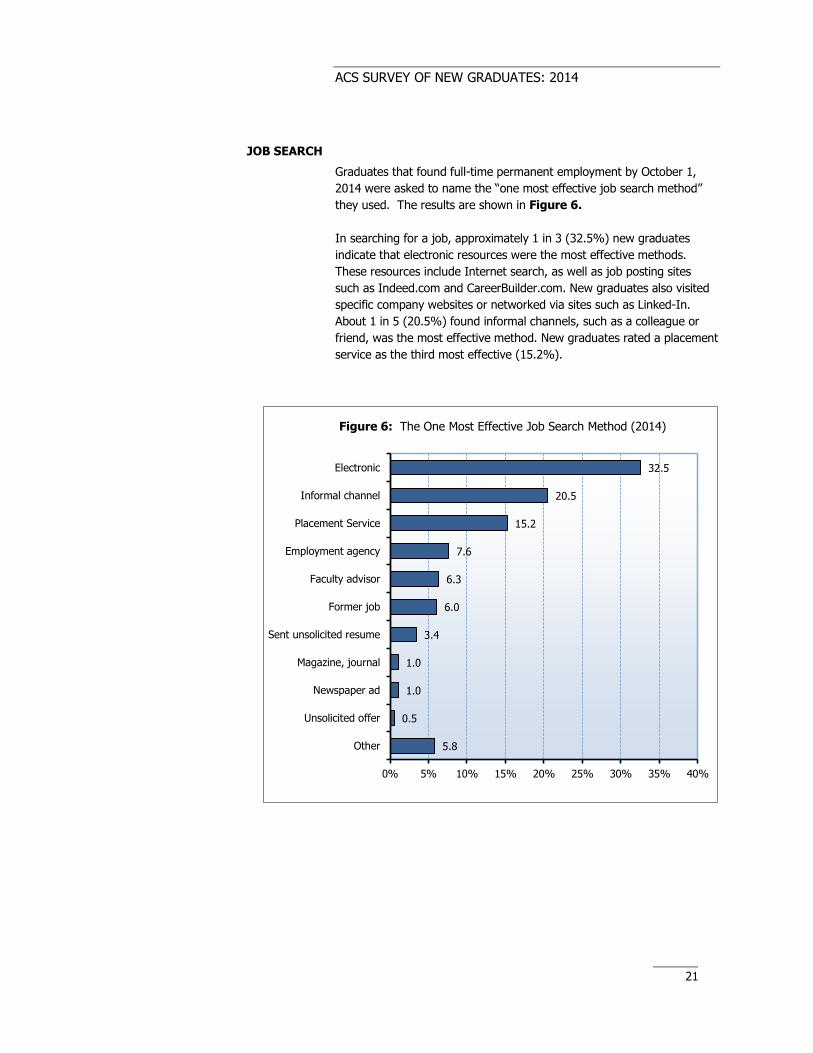
JOB SEARCH
Graduates that found full-time permanent employment by October 1,
2014 were asked to name the “one most effective job search method”
they used. The results are shown in Figure 6.
In searching for a job, approximately 1 in 3 (32.5%) new graduates
indicate that electronic resources were the most effective methods.
These resources include Internet search, as well as job posting sites
such as Indeed.com and CareerBuilder.com. New graduates also visited
specific company websites or networked via sites such as Linked-In.
About 1 in 5 (20.5%) found informal channels, such as a colleague or
friend, was the most effective method. New graduates rated a placement
service as the third most effective (15.2%).
5.8
0.5
1.0
1.0
3.4
6.0
6.3
7.6
15.2
20.5
32.5
0% 5% 10% 15% 20% 25% 30% 35% 40%
Other
Unsolicited offer
Newspaper ad
Magazine, journal
Sent unsolicited resume
Former job
Faculty advisor
Employment agency
Placement Service
Informal channel
Electronic
Figure 6: The One Most Effective Job Search Method (2014)
ACS SURVEY OF NEW GRADUATES: 2014
22
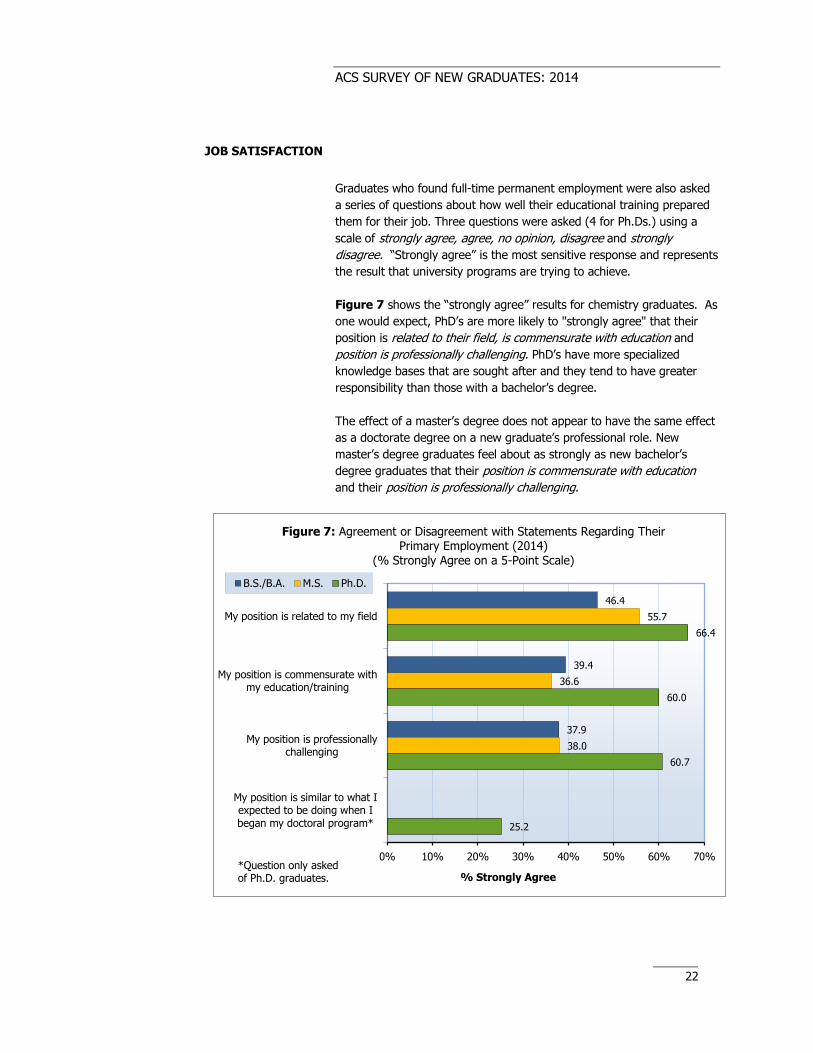
JOB SATISFACTION
Graduates who found full-time permanent employment were also asked
a series of questions about how well their educational training prepared
them for their job. Three questions were asked (4 for Ph.Ds.) using a
scale of strongly agree, agree, no opinion, disagree and strongly
disagree. “Strongly agree” is the most sensitive response and represents
the result that university programs are trying to achieve.
Figure 7 shows the “strongly agree” results for chemistry graduates. As
one would expect, PhD’s are more likely to "strongly agree" that their
position is related to their field, is commensurate with education and
position is professionally challenging. PhD’s have more specialized
knowledge bases that are sought after and they tend to have greater
responsibility than those with a bachelor’s degree.
The effect of a master’s degree does not appear to have the same effect
as a doctorate degree on a new graduate’s professional role. New
master’s degree graduates feel about as strongly as new bachelor’s
degree graduates that their position is commensurate with education
and their position is professionally challenging.
46.4
39.4
37.9
55.7
36.6
38.0
66.4
60.0
60.7
25.2
0% 10% 20% 30% 40% 50% 60% 70%
My position is related to my field
My position is commensurate withmy education/training
My position is professionallychallenging
My position is similar to what Iexpected to be doing when Ibegan my doctoral program*
% Strongly Agree
Figure 7: Agreement or Disagreement with Statements Regarding Their Primary Employment (2014)
(% Strongly Agree on a 5-Point Scale)
B.S./B.A. M.S. Ph.D.
*Question only asked of Ph.D. graduates.
ACS SURVEY OF NEW GRADUATES: 2014
23
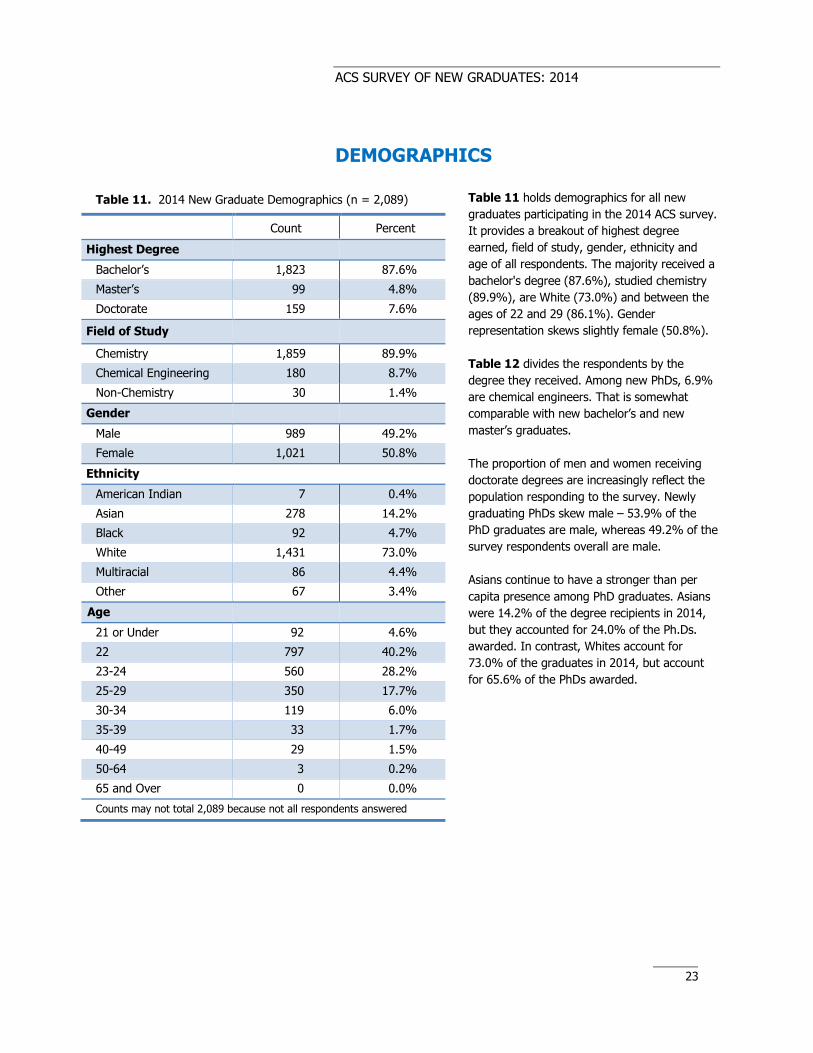
DEMOGRAPHICS
Table 11 holds demographics for all new
graduates participating in the 2014 ACS survey.
It provides a breakout of highest degree
earned, field of study, gender, ethnicity and
age of all respondents. The majority received a
bachelor's degree (87.6%), studied chemistry
(89.9%), are White (73.0%) and between the
ages of 22 and 29 (86.1%). Gender
representation skews slightly female (50.8%).
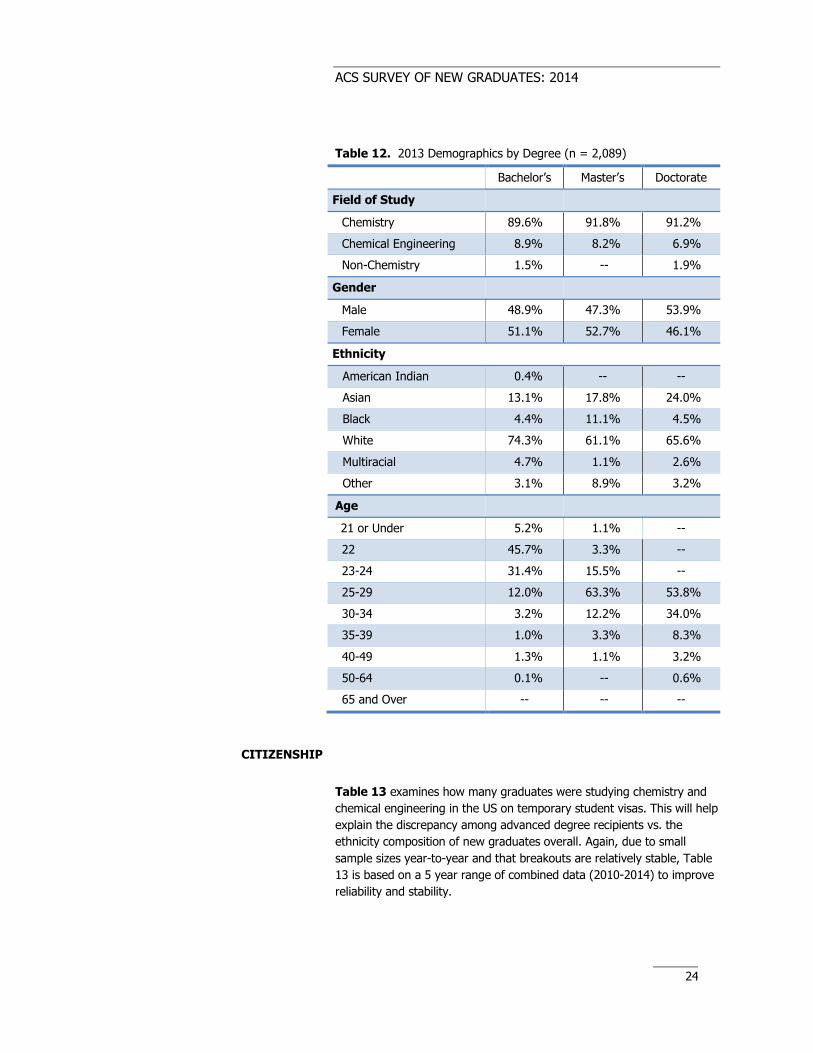
Table 12 divides the respondents by the
degree they received. Among new PhDs, 6.9%
are chemical engineers. That is somewhat
comparable with new bachelor’s and new
master’s graduates.
The proportion of men and women receiving
doctorate degrees are increasingly reflect the
population responding to the survey. Newly
graduating PhDs skew male – 53.9% of the
PhD graduates are male, whereas 49.2% of the
survey respondents overall are male.
Asians continue to have a stronger than per
capita presence among PhD graduates. Asians
were 14.2% of the degree recipients in 2014,
but they accounted for 24.0% of the Ph.Ds.
awarded. In contrast, Whites account for
73.0% of the graduates in 2014, but account
for 65.6% of the PhDs awarded.
Table 11. 2014 New Graduate Demographics (n = 2,089)
Count Percent
Highest Degree
Bachelor’s 1,823 87.6%
Master’s 99 4.8%
Doctorate 159 7.6%
Field of Study
Chemistry 1,859 89.9%
Chemical Engineering 180 8.7%
Non-Chemistry 30 1.4%
Gender
Male 989 49.2%
Female 1,021 50.8%
Ethnicity
American Indian 7 0.4%
Asian 278 14.2%
Black 92 4.7%
White 1,431 73.0%
Multiracial 86 4.4%
Other 67 3.4%
Age
21 or Under 92 4.6%
22 797 40.2%
23-24 560 28.2%
25-29 350 17.7%
30-34 119 6.0%
35-39 33 1.7%
40-49 29 1.5%
50-64 3 0.2%
65 and Over 0 0.0%
Counts may not total 2,089 because not all respondents answered
ACS SURVEY OF NEW GRADUATES: 2014
24
Table 12. 2013 Demographics by Degree (n = 2,089)
Bachelor’s Master’s Doctorate
Field of Study
Chemistry 89.6% 91.8% 91.2%
Chemical Engineering 8.9% 8.2% 6.9%
Non-Chemistry 1.5% -- 1.9%
Gender
Male 48.9% 47.3% 53.9%
Female 51.1% 52.7% 46.1%
Ethnicity
American Indian 0.4% -- --
Asian 13.1% 17.8% 24.0%
Black 4.4% 11.1% 4.5%
White 74.3% 61.1% 65.6%
Multiracial 4.7% 1.1% 2.6%
Other 3.1% 8.9% 3.2%
Age
21 or Under 5.2% 1.1% --
22 45.7% 3.3% --
23-24 31.4% 15.5% --
25-29 12.0% 63.3% 53.8%
30-34 3.2% 12.2% 34.0%
35-39 1.0% 3.3% 8.3%
40-49 1.3% 1.1% 3.2%
50-64 0.1% -- 0.6%
65 and Over -- -- --
CITIZENSHIP
Table 13 examines how many graduates were studying chemistry and
chemical engineering in the US on temporary student visas. This will help
explain the discrepancy among advanced degree recipients vs. the
ethnicity composition of new graduates overall. Again, due to small
sample sizes year-to-year and that breakouts are relatively stable, Table
13 is based on a 5 year range of combined data (2010-2014) to improve
reliability and stability.
ACS SURVEY OF NEW GRADUATES: 2014
25
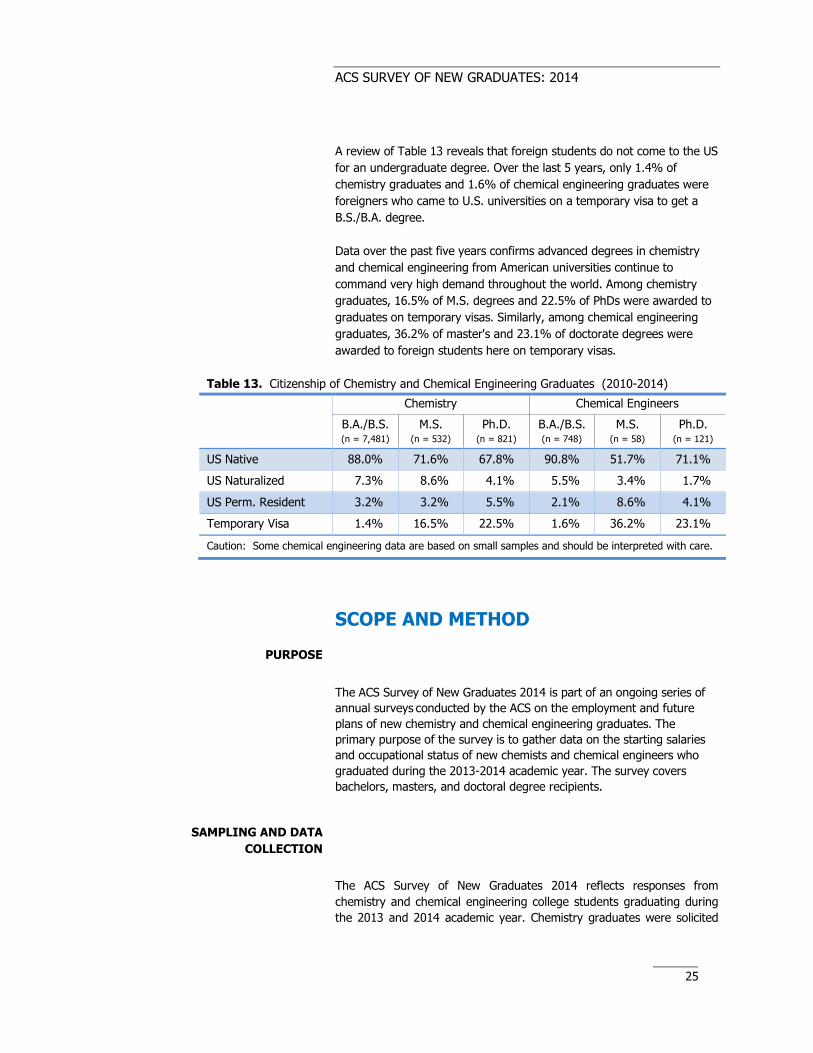
A review of Table 13 reveals that foreign students do not come to the US
for an undergraduate degree. Over the last 5 years, only 1.4% of
chemistry graduates and 1.6% of chemical engineering graduates were
foreigners who came to U.S. universities on a temporary visa to get a
B.S./B.A. degree.
Data over the past five years confirms advanced degrees in chemistry
and chemical engineering from American universities continue to
command very high demand throughout the world. Among chemistry
graduates, 16.5% of M.S. degrees and 22.5% of PhDs were awarded to
graduates on temporary visas. Similarly, among chemical engineering
graduates, 36.2% of master's and 23.1% of doctorate degrees were
awarded to foreign students here on temporary visas.
Table 13. Citizenship of Chemistry and Chemical Engineering Graduates (2010-2014)
Chemistry Chemical Engineers
B.A./B.S. (n = 7,481)
M.S. (n = 532)
Ph.D. (n = 821)
B.A./B.S. (n = 748)
M.S. (n = 58)
Ph.D. (n = 121)
US Native 88.0% 71.6% 67.8% 90.8% 51.7% 71.1%
US Naturalized 7.3% 8.6% 4.1% 5.5% 3.4% 1.7%
US Perm. Resident 3.2% 3.2% 5.5% 2.1% 8.6% 4.1%
Temporary Visa 1.4% 16.5% 22.5% 1.6% 36.2% 23.1%
Caution: Some chemical engineering data are based on small samples and should be interpreted with care.
SCOPE AND METHOD
PURPOSE
The ACS Survey of New Graduates 2014 is part of an ongoing series of
annual surveys conducted by the ACS on the employment and future
plans of new chemistry and chemical engineering graduates. The
primary purpose of the survey is to gather data on the starting salaries
and occupational status of new chemists and chemical engineers who
graduated during the 2013-2014 academic year. The survey covers
bachelors, masters, and doctoral degree recipients.
SAMPLING AND DATA
COLLECTION
The ACS Survey of New Graduates 2014 reflects responses from
chemistry and chemical engineering college students graduating during
the 2013 and 2014 academic year. Chemistry graduates were solicited
ACS SURVEY OF NEW GRADUATES: 2014
26
from universities containing ACS approved chemistry programs, while
chemical engineering graduates were solicited from universities with
ABET accredited chemical engineering programs.
Responses were solicited from n graduates having full U.S. mailing
addresses, to complete either the paper or online version of the New
Graduate Survey in 2014. Of those graduates that had valid addresses,
and 2,089 usable responses were received. The ACS Department of
Research and Market Insights identified potential participants for this
study by requesting the names and addresses of recent graduates from
the Office on Professional Training (OPT), an internal department of
ACS.
Survey questionnaires were mailed by first class mail in October and
November 2014. Two reminder postcards were also mailed. Data
collection concluded early January 2015. Of the 12,771 successfully
contacted, a total of 2,089 usable responses were received, resulting in a
16.4% response rate. Respondents could complete the survey by mail
(n=445) or online (n=1,644). The margin of error at 95% confidence is
+/-2.0%.
TECHNICAL NOTES
DISCREPANCIES AMONG
TABLES
Because not all individuals responded to all of the survey items, some
pairs of tables contain totals that should be identical but are not. For
example, one table may group Ph.Ds. by gender and another by
employer. The totals will differ unless the number who did not indicate
their gender is the same as the number who did not indicate their
employer.
ESTIMATES OF MEDIAN
SALARIES
Some median salary data presented in salary tables are based on small
samples and subject to sampling error. As a precaution, median salary
results in all table cells with fewer than 15 respondents are suspect to
being unreliable and are not shown in this report. Instead “n.a.” has
been posted to these data cells and other tabled cells with fewer than 15
respondents.
In some instances this report uses multi-year samples to improve the
validity and reliability of the sample data being reported. Nevertheless,
caution should be used in interpreting results of any findings based on
small samples.