salaries 2014 - american chemical society · salaries 2014 analysis of the ... summary and comments...
TRANSCRIPT
Prepared by:
Steve and Clint Marchant
Data Based Insights, Inc. on behalf of the
ACS Department of Research and Brand Strategy June, 2014
Salaries 2014 Analysis of the American Chemical Society's 2014 Comprehensive Salary and Employment Status Survey
American Chemical Society
i
Salaries 2014 ANALYSIS OF THE AMERICAN CHEMICAL
SOCIETY’S 2014 COMPREHENSIVE
SALARY AND EMPLOYMENT STATUS
SURVEY
© 2014 American Chemical Society
1115 Sixteenth Street, NW
Washington, DC 20036
800.227.5558
Available from the Department of Research and Brand Strategy

COMPREHENSIVE SALARY SURVEY: 2014
ii
COMPREHENSIVE SALARY SURVEY: 2014
iii
CONTENTS
Acknowledgements iv
Perspective 1
Summary and Comments 2
Salaries
All Chemists 2
Salaries for Chemists and Chemical Engineers 3
Salaries by Employment Sector 4
Industrial/Private Sector Chemists 4
Government Chemists 7
Academic Chemists 8
Other Factors Influencing Salary 9
Trends in Chemists’ Salaries 9
Non Salary Income
Consulting 11
Bonuses 12
Stock as part of Professional Income 14
Employment and Unemployment
Employment Status 16
Unemployment Trends 17
Healthcare
Coverage Type 18
Coverage Offered by Employer 19
Insurance 20
Benefits Training 20
Impact of Government Legislation 21
Change in Cost as a Result of Legislation 21
Change in Coverage as a Result of Legislation 22
Health Insurance Marketplace 22
Expected Change to Healthcare Coverage 23
Monthly Premium Costs 24
Satisfaction with Coverage 25
Medicare Coverage 25
Technical Notes
The Sample 26
Definitions 27
Discrepancies among Tables 28
COMPREHENSIVE SALARY SURVEY: 2014
iv
ACKNOWLEDGEMENTS
This report presents detailed results of the 2014 ACS Comprehensive
Salary and Employment Status Survey. The ACS Committee on
Economic and Professional Affairs and its Subcommittee on Surveys
planned and provided general oversight of the survey and its analysis.
The committee extends its heartfelt appreciation to those who agreed
to participate in this survey. The committee would also like to extend its
appreciation to the development team. Gareth Edwards, senior research
associate in ACS’s Department of Research managed the survey.
Andrew Bell at Intelliscan, Inc. performed the data collection. Steve and
Clint Marchant of Data Based Insights, Inc. (an affiliate of Intelliscan)
analyzed the results of the survey and prepared this report.
Gareth Edwards
Senior Research Associate
Department of Research and Brand
Strategy

COMPREHENSIVE SALARY SURVEY: 2014
1
PERSPECTIVE
An American chemists' median salary from 2010 to 2014 increased from
$89,000 to $93,000 (rounded to nearest $100). Figure 1 compares the
actual median salary for each year (gold colored bars) with what salary
would need to be each year to keep pace with inflation and match the
buying power of $89,000 in 2010. As Figure 1 shows, inflation outpaces
salary increases.
Excluding 2010 and looking at median salary from 2011 to 2014,
chemists’ median salary is flat (-$300). Median income among the three
degree strata in 2011 vs. 2014 is identical (Figure 2): $72,000 for
bachelor's degrees, $85,000 for master's degrees and $102,000 for
those with a doctorate. With zero salary growth, chemist salaries have
lost value each year. Inflation was 2.7% from 2011 to 2012 and 1.5%
from 2012 to 2013 and 1.5% in 2013 to 2014.
69.8 72.0 73.9 72.0 72.0 80.0
85.0 85.0 85.0 85.0
98.0 102.0 100.6 102.0 102.0
0
20
40
60
80
100
120
2010 2011 2012 2013 2014
Sa
lary
in
Th
ou
sa
nd
s
Figure 2: All Full-Time Chemists' Median Salaries by Degree (2010-2014)
Bachelor's Master's Doctorate
89.0
93.3 92.0
94.0 93.0
89.0
91.3
93.8 95.1
96.6
80
84
88
92
96
100
104
2010 2011 2012 2013 2014
Sa
lary
in
Th
ou
sa
nd
s
Figure 1: All Chemists' Median Salaries vs. the 2009 Median times Inflation in Dollars (2010-2014)
Median Salaries Salary Needed to Maintain Buying Power
COMPREHENSIVE SALARY SURVEY: 2014
2
SUMMARY AND COMMENTS
alaries for chemists did not grow in 2014, remaining close to
median salary levels for 2013 and overall falling about $1,000 to
a median of $93,000 for all chemists. The 1.5% rate of inflation
from March 2013 to 2014, adds some weight to the slight decline in
salary.
As far as other methods of compensation and professional income,
bonus eligibility and amounts stood still or lost some value. The $8,800
median bonus in 2014 is -$200 lower than 2013. With regard to receipt
of stock as part of professional income, chemists appear to follow the
general trend in the workplace of rethinking the role of stock (and the
type of stock offered) as part of a compensation strategy.
From the perspective of the unemployment rate, which is 2.9% for ACS
members, the employment picture for chemists is a good one. In
particular, chemists with a PhD continue to be in demand -- only 2.2%
report being unemployed. Chemists have an unemployment rate half
that of the general population and a slight edge when compared with
other workers who have earned a bachelor's degree or higher.
Most ACS members employed full-time take the medical coverage that
their employers offered (90.2%). In spite of the rising cost of monthly
premiums over the past five years, 86.0% remain satisfied with their
coverage and 88.0% feel they have competitive health coverage.
SALARIES
ALL CHEMISTS
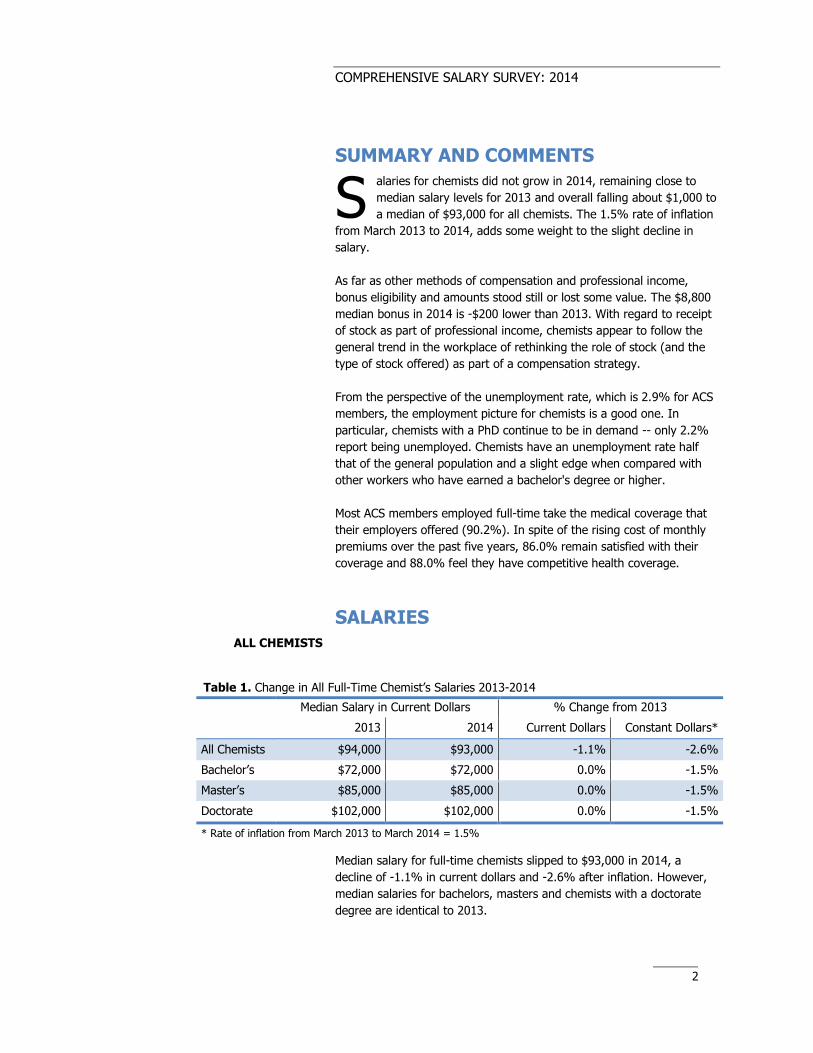
Median salary for full-time chemists slipped to $93,000 in 2014, a
decline of -1.1% in current dollars and -2.6% after inflation. However,
median salaries for bachelors, masters and chemists with a doctorate
degree are identical to 2013.
S
Table 1. Change in All Full-Time Chemist’s Salaries 2013-2014
Median Salary in Current Dollars % Change from 2013
2013 2014 Current Dollars Constant Dollars*
All Chemists $94,000 $93,000 -1.1% -2.6%
Bachelor’s $72,000 $72,000 0.0% -1.5%
Master’s $85,000 $85,000 0.0% -1.5%
Doctorate $102,000 $102,000 0.0% -1.5%
* Rate of inflation from March 2013 to March 2014 = 1.5%
COMPREHENSIVE SALARY SURVEY: 2014
3
SALARIES FOR CHEMISTS
AND CHEMICAL ENGINEERS
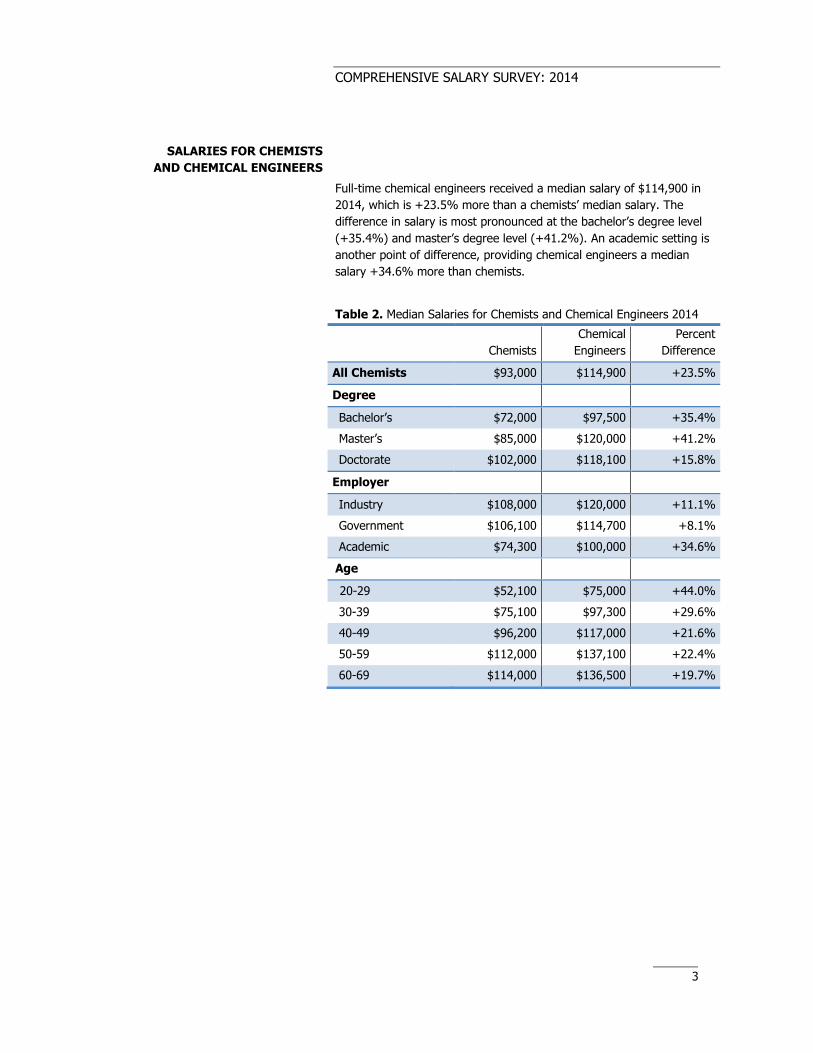
Full-time chemical engineers received a median salary of $114,900 in
2014, which is +23.5% more than a chemists’ median salary. The
difference in salary is most pronounced at the bachelor’s degree level
(+35.4%) and master’s degree level (+41.2%). An academic setting is
another point of difference, providing chemical engineers a median
salary +34.6% more than chemists.
Table 2. Median Salaries for Chemists and Chemical Engineers 2014
Chemists
Chemical
Engineers
Percent
Difference
All Chemists $93,000 $114,900 +23.5%
Degree
Bachelor’s $72,000 $97,500 +35.4%
Master’s $85,000 $120,000 +41.2%
Doctorate $102,000 $118,100 +15.8%
Employer
Industry $108,000 $120,000 +11.1%
Government $106,100 $114,700 +8.1%
Academic $74,300 $100,000 +34.6%
Age
20-29 $52,100 $75,000 +44.0%
30-39 $75,100 $97,300 +29.6%
40-49 $96,200 $117,000 +21.6%
50-59 $112,000 $137,100 +22.4%
60-69 $114,000 $136,500 +19.7%
COMPREHENSIVE SALARY SURVEY: 2014
4
CHEMISTS BY EMPLOYMENT
SECTOR
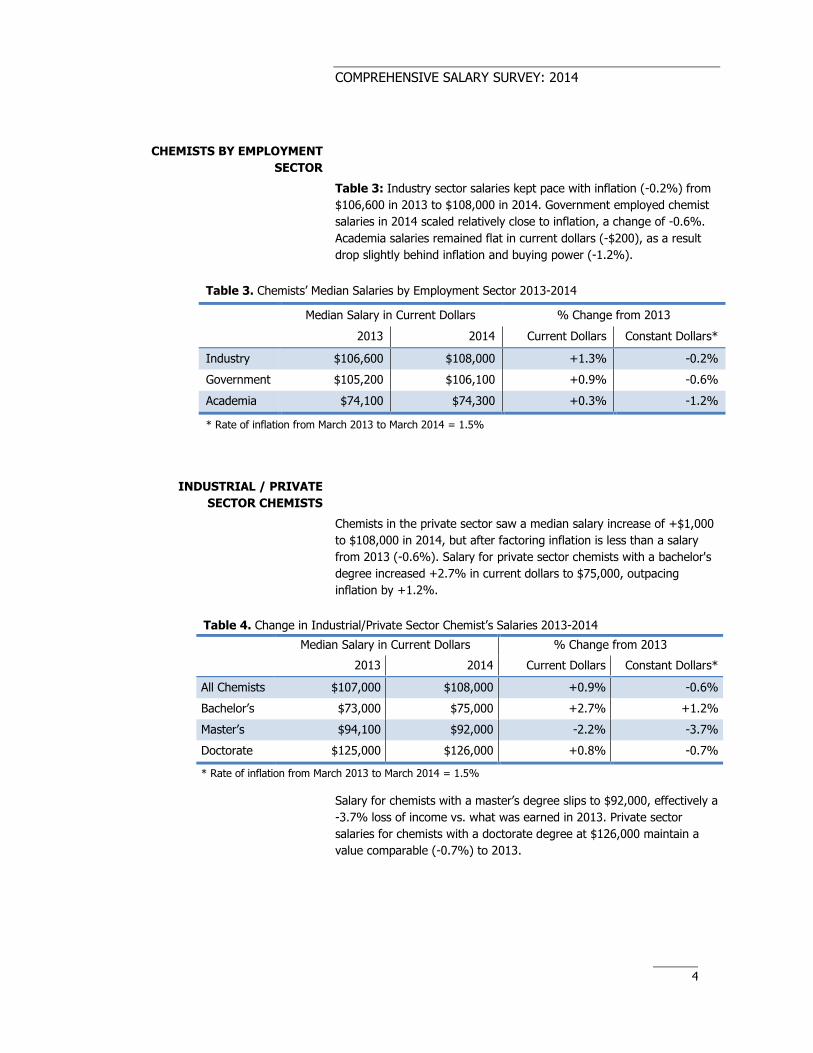
Table 3: Industry sector salaries kept pace with inflation (-0.2%) from
$106,600 in 2013 to $108,000 in 2014. Government employed chemist
salaries in 2014 scaled relatively close to inflation, a change of -0.6%.
Academia salaries remained flat in current dollars (-$200), as a result
drop slightly behind inflation and buying power (-1.2%).
INDUSTRIAL / PRIVATE
SECTOR CHEMISTS
Chemists in the private sector saw a median salary increase of +$1,000
to $108,000 in 2014, but after factoring inflation is less than a salary
from 2013 (-0.6%). Salary for private sector chemists with a bachelor's
degree increased +2.7% in current dollars to $75,000, outpacing
inflation by +1.2%.
Salary for chemists with a master’s degree slips to $92,000, effectively a
-3.7% loss of income vs. what was earned in 2013. Private sector
salaries for chemists with a doctorate degree at $126,000 maintain a
value comparable (-0.7%) to 2013.
Table 3. Chemists’ Median Salaries by Employment Sector 2013-2014
Median Salary in Current Dollars % Change from 2013
2013 2014 Current Dollars Constant Dollars*
Industry $106,600 $108,000 +1.3% -0.2%
Government $105,200 $106,100 +0.9% -0.6%
Academia $74,100 $74,300 +0.3% -1.2%
* Rate of inflation from March 2013 to March 2014 = 1.5%
Table 4. Change in Industrial/Private Sector Chemist’s Salaries 2013-2014
Median Salary in Current Dollars % Change from 2013
2013 2014 Current Dollars Constant Dollars*
All Chemists $107,000 $108,000 +0.9% -0.6%
Bachelor’s $73,000 $75,000 +2.7% +1.2%
Master’s $94,100 $92,000 -2.2% -3.7%
Doctorate $125,000 $126,000 +0.8% -0.7%
* Rate of inflation from March 2013 to March 2014 = 1.5%
COMPREHENSIVE SALARY SURVEY: 2014
5
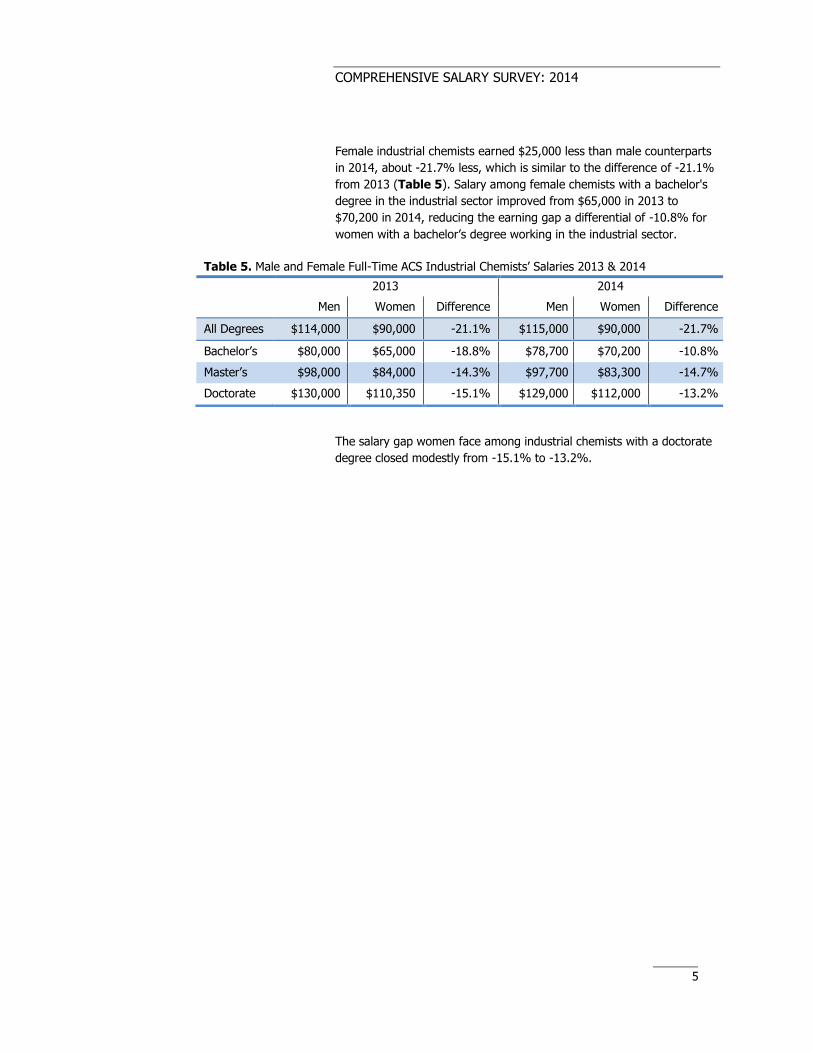
Female industrial chemists earned $25,000 less than male counterparts
in 2014, about -21.7% less, which is similar to the difference of -21.1%
from 2013 (Table 5). Salary among female chemists with a bachelor's
degree in the industrial sector improved from $65,000 in 2013 to
$70,200 in 2014, reducing the earning gap a differential of -10.8% for
women with a bachelor’s degree working in the industrial sector.
The salary gap women face among industrial chemists with a doctorate
degree closed modestly from -15.1% to -13.2%.
Table 5. Male and Female Full-Time ACS Industrial Chemists’ Salaries 2013 & 2014
2013 2014
Men Women Difference Men Women Difference
All Degrees $114,000 $90,000 -21.1% $115,000 $90,000 -21.7%
Bachelor’s $80,000 $65,000 -18.8% $78,700 $70,200 -10.8%
Master’s $98,000 $84,000 -14.3% $97,700 $83,300 -14.7%
Doctorate $130,000 $110,350 -15.1% $129,000 $112,000 -13.2%
COMPREHENSIVE SALARY SURVEY: 2014
6
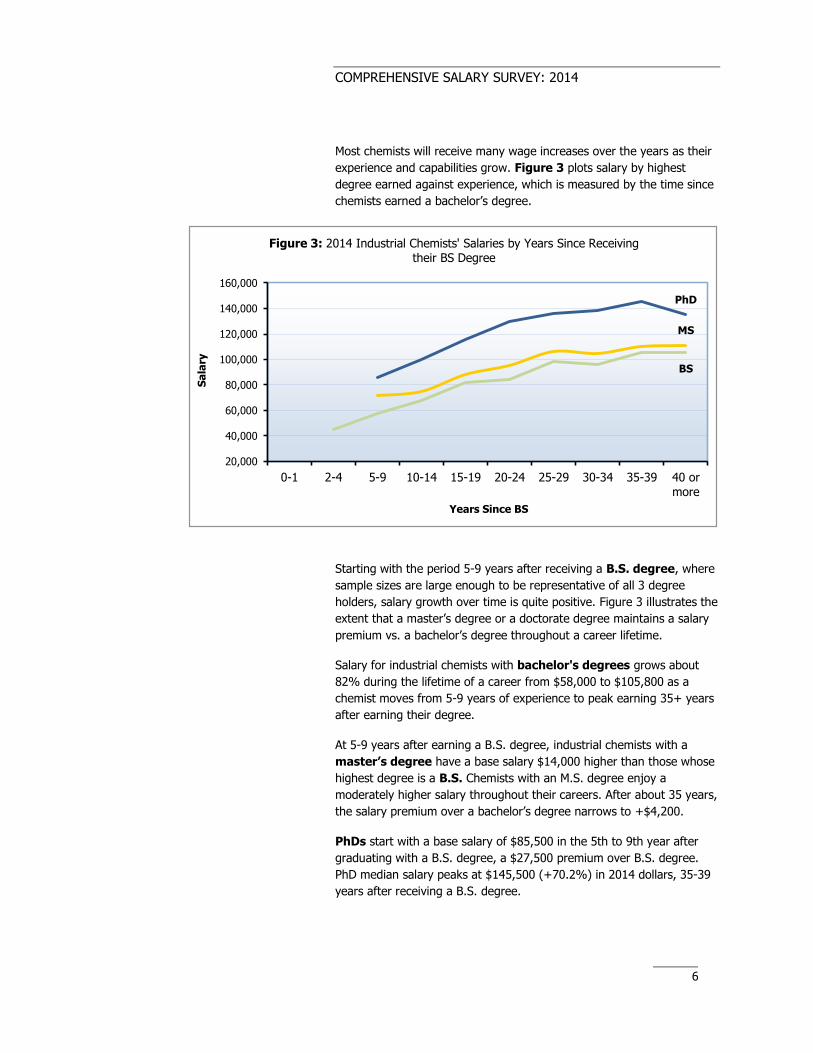
Most chemists will receive many wage increases over the years as their
experience and capabilities grow. Figure 3 plots salary by highest
degree earned against experience, which is measured by the time since
chemists earned a bachelor’s degree.
Starting with the period 5-9 years after receiving a B.S. degree, where
sample sizes are large enough to be representative of all 3 degree
holders, salary growth over time is quite positive. Figure 3 illustrates the
extent that a master’s degree or a doctorate degree maintains a salary
premium vs. a bachelor’s degree throughout a career lifetime.
Salary for industrial chemists with bachelor's degrees grows about
82% during the lifetime of a career from $58,000 to $105,800 as a
chemist moves from 5-9 years of experience to peak earning 35+ years
after earning their degree.
At 5-9 years after earning a B.S. degree, industrial chemists with a
master’s degree have a base salary $14,000 higher than those whose
highest degree is a B.S. Chemists with an M.S. degree enjoy a
moderately higher salary throughout their careers. After about 35 years,
the salary premium over a bachelor’s degree narrows to +$4,200.
PhDs start with a base salary of $85,500 in the 5th to 9th year after
graduating with a B.S. degree, a $27,500 premium over B.S. degree.
PhD median salary peaks at $145,500 (+70.2%) in 2014 dollars, 35-39
years after receiving a B.S. degree.
BS
MS
PhD
20,000
40,000
60,000
80,000
100,000
120,000
140,000
160,000
0-1 2-4 5-9 10-14 15-19 20-24 25-29 30-34 35-39 40 ormore
Sa
lary
Years Since BS
Figure 3: 2014 Industrial Chemists' Salaries by Years Since Receiving their BS Degree
COMPREHENSIVE SALARY SURVEY: 2014
7
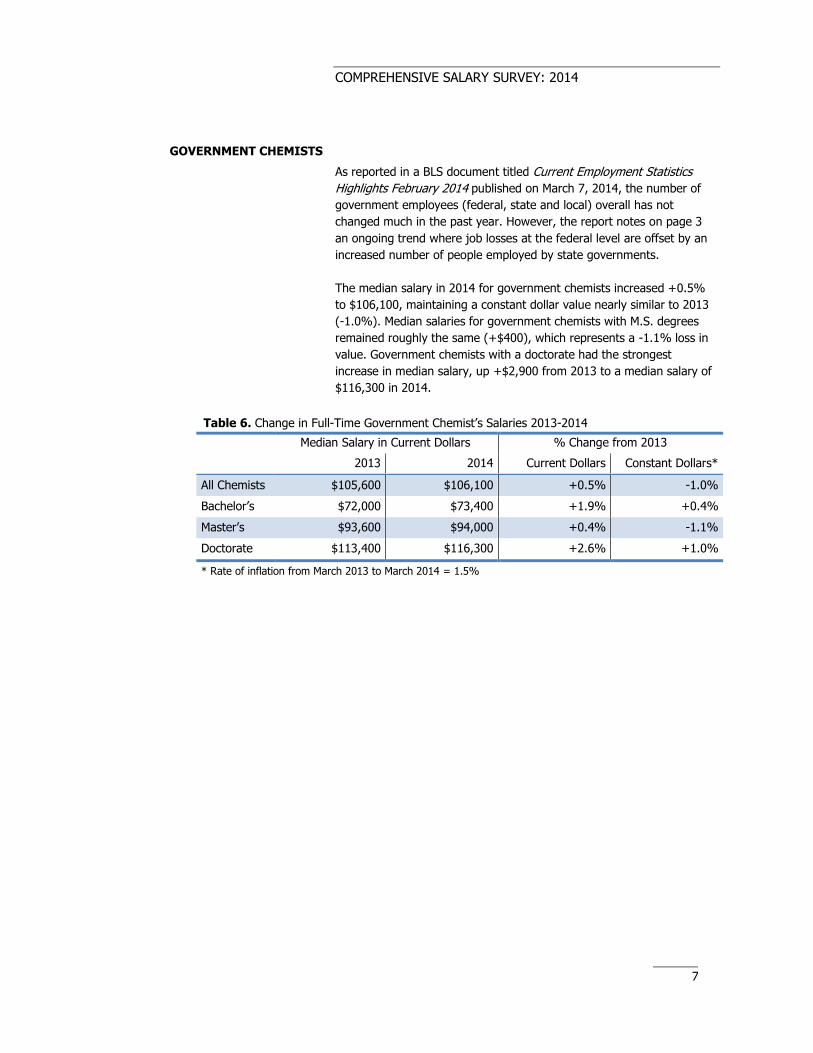
GOVERNMENT CHEMISTS
As reported in a BLS document titled Current Employment Statistics
Highlights February 2014 published on March 7, 2014, the number of
government employees (federal, state and local) overall has not
changed much in the past year. However, the report notes on page 3
an ongoing trend where job losses at the federal level are offset by an
increased number of people employed by state governments.
The median salary in 2014 for government chemists increased +0.5%
to $106,100, maintaining a constant dollar value nearly similar to 2013
(-1.0%). Median salaries for government chemists with M.S. degrees
remained roughly the same (+$400), which represents a -1.1% loss in
value. Government chemists with a doctorate had the strongest
increase in median salary, up +$2,900 from 2013 to a median salary of
$116,300 in 2014.
Table 6. Change in Full-Time Government Chemist’s Salaries 2013-2014
Median Salary in Current Dollars % Change from 2013
2013 2014 Current Dollars Constant Dollars*
All Chemists $105,600 $106,100 +0.5% -1.0%
Bachelor’s $72,000 $73,400 +1.9% +0.4%
Master’s $93,600 $94,000 +0.4% -1.1%
Doctorate $113,400 $116,300 +2.6% +1.0%
* Rate of inflation from March 2013 to March 2014 = 1.5%
COMPREHENSIVE SALARY SURVEY: 2014
8
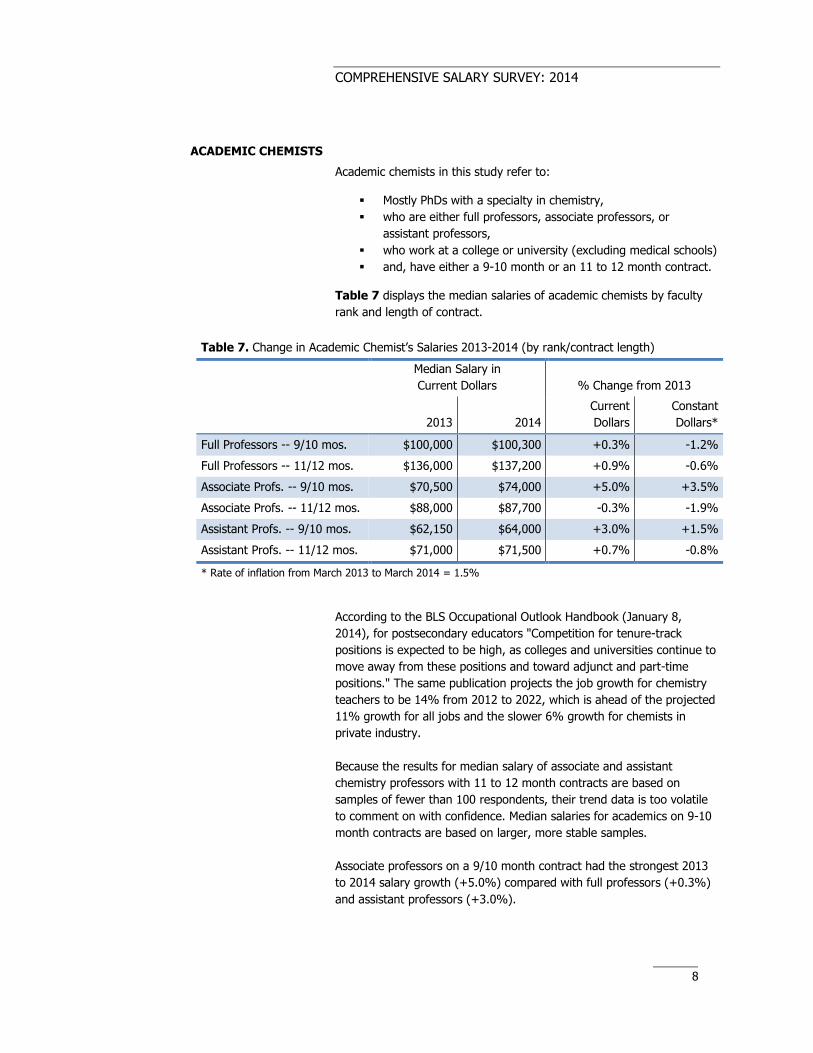
ACADEMIC CHEMISTS
Academic chemists in this study refer to:
Mostly PhDs with a specialty in chemistry,
who are either full professors, associate professors, or
assistant professors,
who work at a college or university (excluding medical schools)
and, have either a 9-10 month or an 11 to 12 month contract.
Table 7 displays the median salaries of academic chemists by faculty
rank and length of contract.
According to the BLS Occupational Outlook Handbook (January 8,
2014), for postsecondary educators "Competition for tenure-track
positions is expected to be high, as colleges and universities continue to
move away from these positions and toward adjunct and part-time
positions." The same publication projects the job growth for chemistry
teachers to be 14% from 2012 to 2022, which is ahead of the projected
11% growth for all jobs and the slower 6% growth for chemists in
private industry.
Because the results for median salary of associate and assistant
chemistry professors with 11 to 12 month contracts are based on
samples of fewer than 100 respondents, their trend data is too volatile
to comment on with confidence. Median salaries for academics on 9-10
month contracts are based on larger, more stable samples.
Associate professors on a 9/10 month contract had the strongest 2013
to 2014 salary growth (+5.0%) compared with full professors (+0.3%)
and assistant professors (+3.0%).
Table 7. Change in Academic Chemist’s Salaries 2013-2014 (by rank/contract length)
Median Salary in
Current Dollars % Change from 2013
2013 2014
Current
Dollars
Constant
Dollars*
Full Professors -- 9/10 mos. $100,000 $100,300 +0.3% -1.2%
Full Professors -- 11/12 mos. $136,000 $137,200 +0.9% -0.6%
Associate Profs. -- 9/10 mos. $70,500 $74,000 +5.0% +3.5%
Associate Profs. -- 11/12 mos. $88,000 $87,700 -0.3% -1.9%
Assistant Profs. -- 9/10 mos. $62,150 $64,000 +3.0% +1.5%
Assistant Profs. -- 11/12 mos. $71,000 $71,500 +0.7% -0.8%
* Rate of inflation from March 2013 to March 2014 = 1.5%
COMPREHENSIVE SALARY SURVEY: 2014
9
OTHER FACTORS
INFLUENCING SALARY
Although the level of education, employment sector, and length of
experience may be the most influential correlates of salary, there are a
variety of other factors that one should also consider. Some other
factors influencing salary are type of work, work specialty, geographic
region, and gender.
TRENDS IN CHEMISTS’
SALARIES
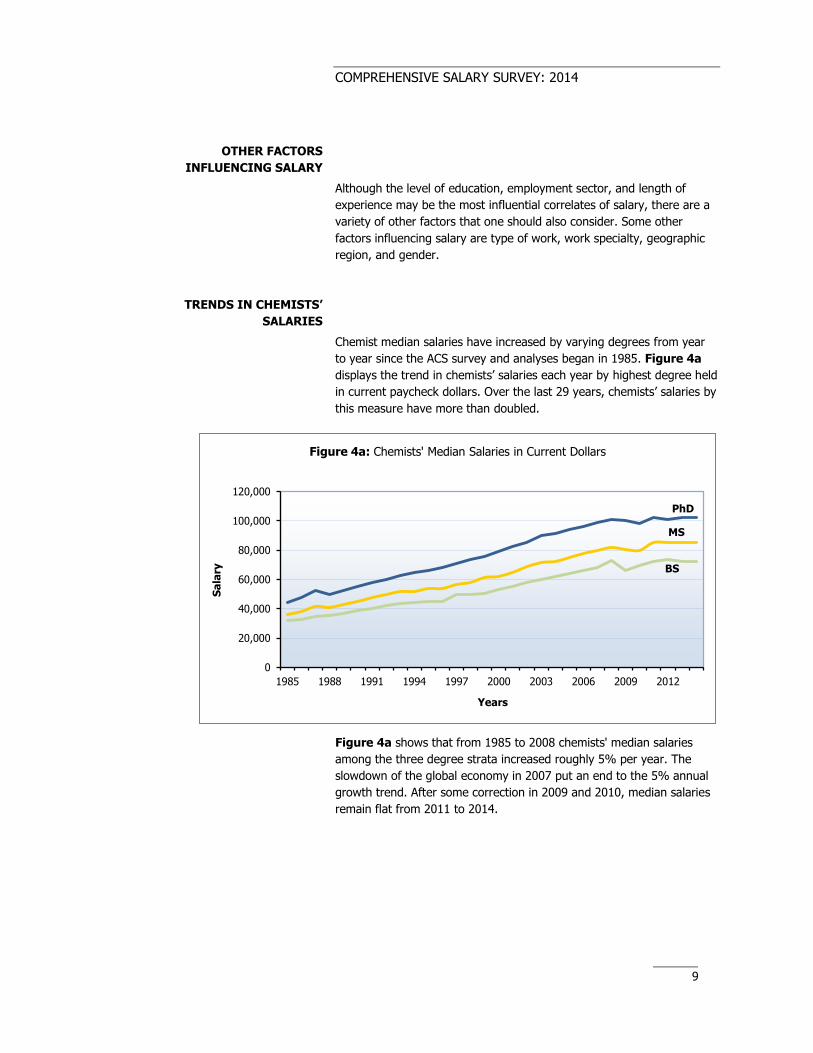
Chemist median salaries have increased by varying degrees from year
to year since the ACS survey and analyses began in 1985. Figure 4a
displays the trend in chemists’ salaries each year by highest degree held
in current paycheck dollars. Over the last 29 years, chemists’ salaries by
this measure have more than doubled.
Figure 4a shows that from 1985 to 2008 chemists' median salaries
among the three degree strata increased roughly 5% per year. The
slowdown of the global economy in 2007 put an end to the 5% annual
growth trend. After some correction in 2009 and 2010, median salaries
remain flat from 2011 to 2014.
BS
MS
PhD
0
20,000
40,000
60,000
80,000
100,000
120,000
1985 1988 1991 1994 1997 2000 2003 2006 2009 2012
Sa
lary
Years
Figure 4a: Chemists' Median Salaries in Current Dollars

COMPREHENSIVE SALARY SURVEY: 2014
10
By converting salaries to constant 1984 dollars as a measure of the
value or buying power of salaries, figure 4b shows that the value of a
chemist’s median salary had not changed much in terms of what you
can buy for your money as measured by the Consumer Price Index
(CPI). Salary maintaining a consistent value was largely the case until
2000 when chemists’ median salaries started gaining value over
inflation. In 1985 the median salary for a chemist with a bachelor’s
degree was $30,100 in 1995 it was $29,900. By 2008, the median
salary was $34,000, a gain of +$3,900. The same trend holds for
chemists with master’s (+$4,600) and doctorate (+$5,900) degrees.
However, as salaries remained static since 2011 and inflation continues
to rise, median salary value is returning to 1985 constant dollar levels.
The median salaries 1985 vs. 2014: +$400 in constant dollars for those
with a bachelor’s; +$2,000 for master’s degree holders; and, +$800 for
doctorate degree holders.
Keep in mind that the median represents the salary in the middle of the
range. Most chemists reading this who were working in 1985 were
probably just starting out and were most likely making a salary in the
bottom quartile. Today, those same chemists are likely to be making
salaries in the top quartile and they have accumulated a substantial
gain in buying power even in 1984 constant dollar terms.
BS
MS
PhD
0
10,000
20,000
30,000
40,000
50,000
60,000
1985 1988 1991 1994 1997 2000 2003 2006 2009 2012
Sa
lary
Years
Figure 4b: Chemists' Median Salaries in Constant (1984) Dollars

COMPREHENSIVE SALARY SURVEY: 2014
11
NON-SALARY INCOME
Salaries alone do not provide the total picture of the earning potential
for chemists. This section examines additional income, such as
consulting, bonuses, and company stock received by chemists. That is,
some chemists earn additional money by engaging in consulting work
outside of their primary employment. Meanwhile, there are a substantial
number of employers providing yearly bonuses and/or company stock in
order to supplement their chemists’ salaries.
CONSULTING
In 2014, approximately 12.1% of ACS members responded that they did
consulting work in 2013, earning a $5,000 median consulting income.
Looking at all members overall, the
proportion of ACS chemists who did
any consulting, the hourly rate and
the median income has been stable
for the past few years.
Approximately 14.2% of PhDs do
consulting, which is higher than
chemists with a master’s degree
(8.8%) or bachelor’s degree (5.5%).
PhDs command the highest hourly
rate, a median of $125, earning
$4,000 in 2013, which is a median
consulting income below chemists
with a Masters ($7,500) or a
Bachelors ($18,000) degree.
By employer, academic chemists
had the highest consultancy rate at
19.2% for 2013. However, academic
chemists report lower median
consulting income at $3,000 than
those employed by the government
($3,500) and in private industry
($10,000).
Opportunities for consulting work
increases as a chemist ages, they
have the expertise, contacts and professional networks. Only 3.1% of
younger chemists (age 20-29) found the opportunity to do any
consulting. In contrast, 18.4% of chemists age 60-69 found consulting
opportunities.
Table 8. Consulting by ACS Chemists (Amounts received in 2013)
% Any
Consulting
Median
Hourly Rate
Median
Income
All Members 12.1% $120 $5,000
Degree
Bachelor’s 5.5% $100 $18,000
Master’s 8.8% $80 $7,500
PhDs 14.2% $125 $4,000
Employer
Industry 6.5% $125 $10,000
Government 4.9% $100 $3,500
College or University 19.2% $100 $3,000
Gender
Male 13.1% $125 $5,000
Female 9.5% $100 $2,500
Age
20-29 3.1% $25 $6,500
30-39 7.8% $100 $3,000
40-49 12.6% $100 $3,500
50-59 13.4% $125 $5,000
60-69 18.4% $150 $7,500

COMPREHENSIVE SALARY SURVEY: 2014
12
BONUSES
44.7% of all chemists were eligible to receive a bonus in 2013. Of those
eligible, 91.1% received a median bonus of $8,800, about -$200 less
than the median bonus of $9,000
during the previous year.
The majority of chemists with a
bachelor's degree (64.4%) or a
master's degree (52.2%) were
eligible for a bonus for 2013. On
the other hand, chemists with a
PhD who were eligible for a bonus
were in the minority (39.3%).
The median bonus received in 2013
by chemists with a bachelor's
degree is $5,000, the same amount
received in 2012. Chemists with a
master's degree received a median
bonus of $7,500, a decline of -$500
vs. last year. The median bonus for
PhD chemists also declined -$500 to
a bonus of $11,000.
Bonus eligibility for government
chemists declined from 43.4%
eligible in 2012 to 35.4% bonus
eligible in 2013. Furthermore, the
median bonus received by
government chemists is down
almost -10% from $1,650 received
in 2012 to $1,500 received in 2013.
Furthermore, this year’s median
bonus is down -25% from the $2,000 median bonus that government
chemists received in 2011.
Male chemists tend to do better with bonus eligibility and the dollar
amount of the bonus received. Setting aside issues of bias and pay
inequality, female chemists are less likely to be employed in the
industrial sector than men (46.6% vs. 55.2%) and more likely to be
employed in the academic sector (44.3% vs. 36.1%) than male
chemists, where both bonus eligibility and bonus size are substantially
lower than the industry sector. However, looking bonus amounts
received each year since 2011; male chemists consistently received a
median bonus of $10,000 whereas for female chemists the median
bonus went from $7,000 to $6,000 to $5,000 in the same three years.
Table 9. Chemist Only Bonuses in 2014 (Amounts received in 2013)
% Eligible for
Bonus
% of Eligible
Receiving Bonus Median Bonus
All Chemists 44.7% 91.1% $8,800
Degree
Bachelor’s 64.4% 93.6% $5,000
Master’s 52.2% 93.0% $7,500
PhD 39.3% 89.8% $11,000
Employer
Industry 75.8% 94.6% $10,000
Government 35.4% 68.2% $1,500
College or University 9.5% 75.6% $2,000
Gender
Male 47.0% 91.0% $10,000
Female 39.7% 91.3% $5,000
Age
20-29 46.3% 91.8% $2,000
30-39 38.9% 92.6% $5,600
40-49 44.9% 91.9% $10,000
50-59 50.4% 91.7% $12,000
60-69 41.7% 86.9% $10,500
Note: This year’s respondents were asked for previous year’s bonuses.

COMPREHENSIVE SALARY SURVEY: 2014
13
STOCK AS PART OF
PROFESSIONAL INCOME
In 2002, ACS began asking members to report on the role of stock as
part of chemists’ overall compensation. Between 2002 and 2010, the
percentage of chemists reporting that stock as part of their professional
income fluctuated in the range of 15.1% to 18.0%. Skip ahead to 2014
following four consecutive declines, 12.3% of chemists report receiving
stocks as a portion of their annual professional income.
Figure 5 shows a clear trend that since 2010 stocks are becoming less
prevalent in overall compensation structures. A number of factors have
created the trend away from stock, which include new accounting rules,
tax law changes and investor concerns over stock options. The general
employment market trends toward offering increasingly diverse ways to
compensate their employees, which include different strategies using
stocks as part of compensation beyond traditional stock options.
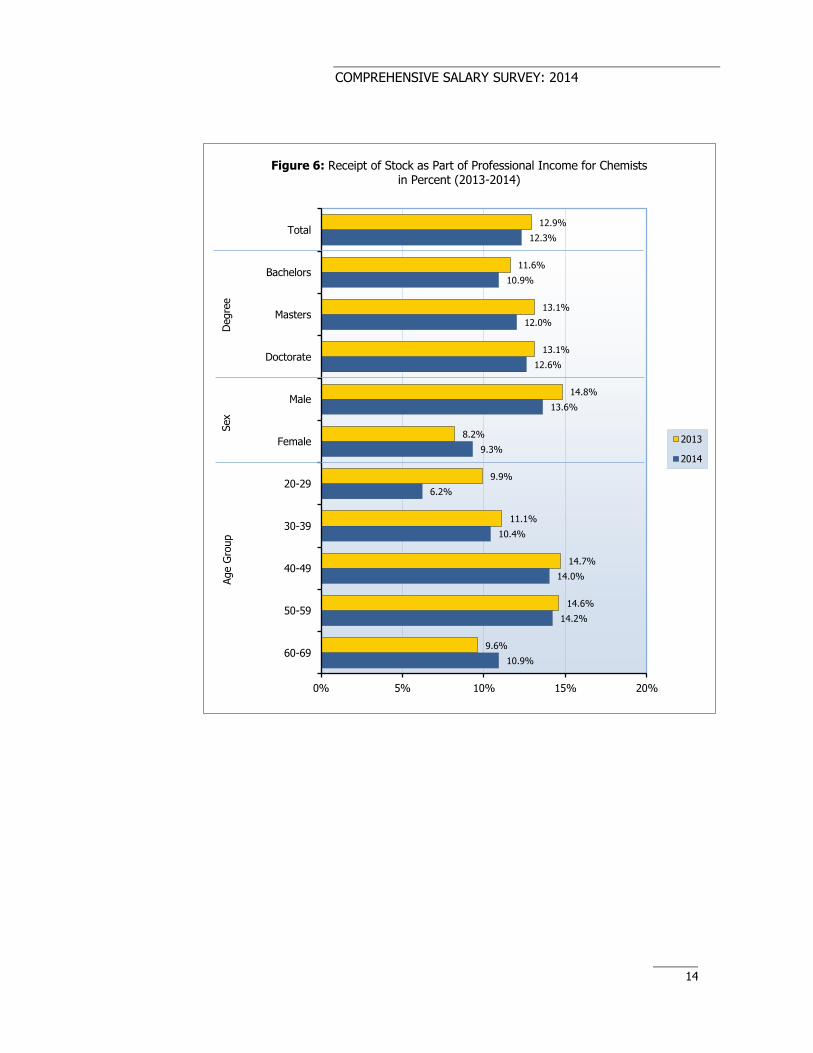
Figure 6 shows the percentage of chemists who received stock as part
of their professional income in 2013 and 2014 by highest degree, sector
of employment, gender and age group. For almost every comparison
group, 2014 sees a smaller percent of chemists receiving stock than in
2013. The most substantial difference between 2013 and 2014 is
among chemists aged 20-29. In 2014, 6.2% received stock as part of
their professional income, down from 9.9% last year.
17.1%
16.5%
15.3% 15.2% 16.1%
15.3%
16.9%
15.1%
18.0%
15.1%
13.6%
12.9%
12.3%
12
13
14
15
16
17
18
19
2002 2003 2004 2005 2006 2007 2008 2009 2010 2011 2012 2013 2014
Pe
rce
nt
Year
Figure 5: Percentage of Chemists Reporting Stock Compensation
COMPREHENSIVE SALARY SURVEY: 2014
14
12.9%
11.6%
13.1%
13.1%
14.8%
8.2%
9.9%
11.1%
14.7%
14.6%
9.6%
12.3%
10.9%
12.0%
12.6%
13.6%
9.3%
6.2%
10.4%
14.0%
14.2%
10.9%
0% 5% 10% 15% 20%
Total
Bachelors
Masters
Doctorate
Male
Female
20-29
30-39
40-49
50-59
60-69
Figure 6: Receipt of Stock as Part of Professional Income for Chemists in Percent (2013-2014)
2013
2014
Age G
roup
Sex
D
egre
e
COMPREHENSIVE SALARY SURVEY: 2014
15
EMPLOYMENT AND UNEMPLOYMENT
EMPLOYMENT STATUS
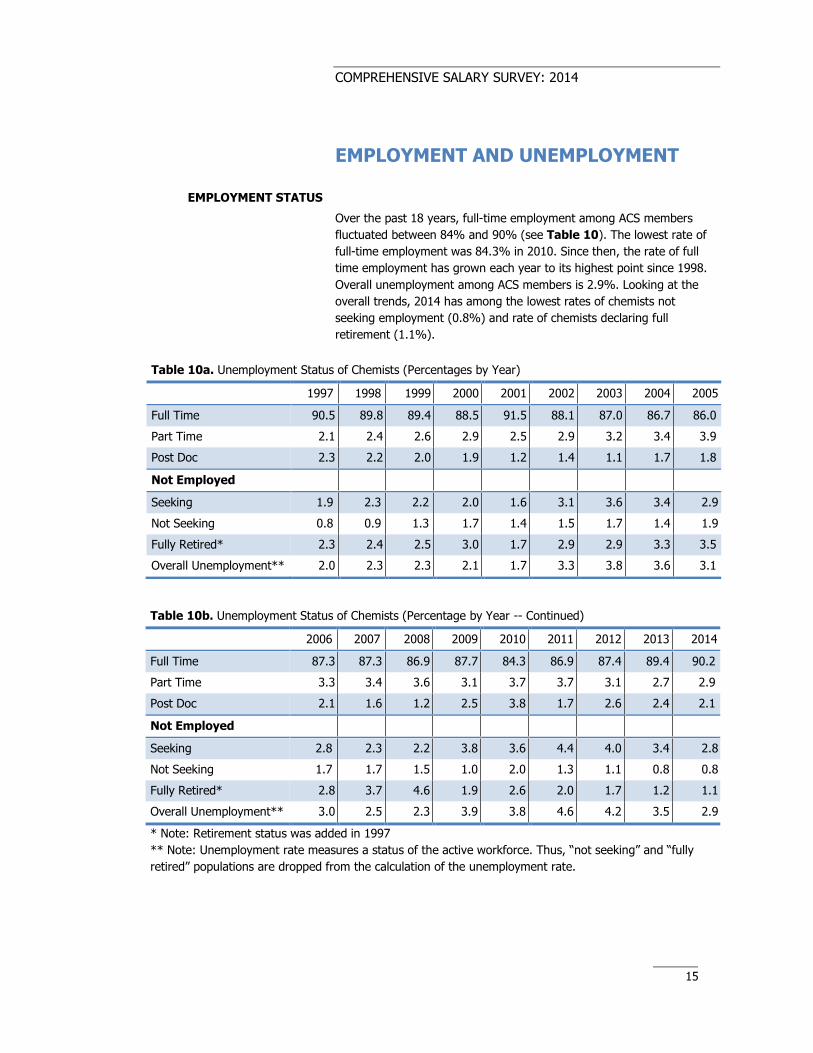
Over the past 18 years, full-time employment among ACS members
fluctuated between 84% and 90% (see Table 10). The lowest rate of
full-time employment was 84.3% in 2010. Since then, the rate of full
time employment has grown each year to its highest point since 1998.
Overall unemployment among ACS members is 2.9%. Looking at the
overall trends, 2014 has among the lowest rates of chemists not
seeking employment (0.8%) and rate of chemists declaring full
retirement (1.1%).
Table 10a. Unemployment Status of Chemists (Percentages by Year)
1997 1998 1999 2000 2001 2002 2003 2004 2005
Full Time 90.5 89.8 89.4 88.5 91.5 88.1 87.0 86.7 86.0
Part Time 2.1 2.4 2.6 2.9 2.5 2.9 3.2 3.4 3.9
Post Doc 2.3 2.2 2.0 1.9 1.2 1.4 1.1 1.7 1.8
Not Employed
Seeking 1.9 2.3 2.2 2.0 1.6 3.1 3.6 3.4 2.9
Not Seeking 0.8 0.9 1.3 1.7 1.4 1.5 1.7 1.4 1.9
Fully Retired* 2.3 2.4 2.5 3.0 1.7 2.9 2.9 3.3 3.5
Overall Unemployment** 2.0 2.3 2.3 2.1 1.7 3.3 3.8 3.6 3.1
Table 10b. Unemployment Status of Chemists (Percentage by Year -- Continued)
2006 2007 2008 2009 2010 2011 2012 2013 2014
Full Time 87.3 87.3 86.9 87.7 84.3 86.9 87.4 89.4 90.2
Part Time 3.3 3.4 3.6 3.1 3.7 3.7 3.1 2.7 2.9
Post Doc 2.1 1.6 1.2 2.5 3.8 1.7 2.6 2.4 2.1
Not Employed
Seeking 2.8 2.3 2.2 3.8 3.6 4.4 4.0 3.4 2.8
Not Seeking 1.7 1.7 1.5 1.0 2.0 1.3 1.1 0.8 0.8
Fully Retired* 2.8 3.7 4.6 1.9 2.6 2.0 1.7 1.2 1.1
Overall Unemployment** 3.0 2.5 2.3 3.9 3.8 4.6 4.2 3.5 2.9
* Note: Retirement status was added in 1997
** Note: Unemployment rate measures a status of the active workforce. Thus, “not seeking” and “fully
retired” populations are dropped from the calculation of the unemployment rate.
COMPREHENSIVE SALARY SURVEY: 2014
16
UNEMPLOYMENT STATUS
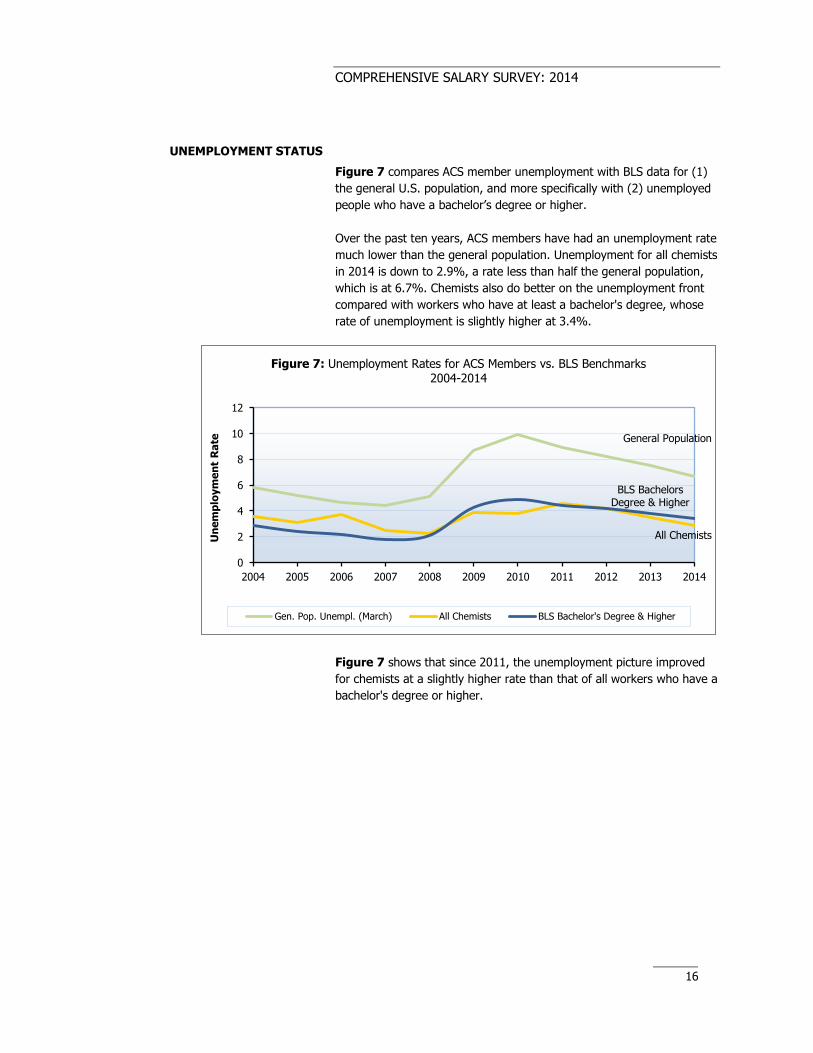
Figure 7 compares ACS member unemployment with BLS data for (1)
the general U.S. population, and more specifically with (2) unemployed
people who have a bachelor’s degree or higher.
Over the past ten years, ACS members have had an unemployment rate
much lower than the general population. Unemployment for all chemists
in 2014 is down to 2.9%, a rate less than half the general population,
which is at 6.7%. Chemists also do better on the unemployment front
compared with workers who have at least a bachelor's degree, whose
rate of unemployment is slightly higher at 3.4%.
Figure 7 shows that since 2011, the unemployment picture improved
for chemists at a slightly higher rate than that of all workers who have a
bachelor's degree or higher.
General Population
BLS Bachelors Degree & Higher
All Chemists
0
2
4
6
8
10
12
2004 2005 2006 2007 2008 2009 2010 2011 2012 2013 2014
Un
em
plo
ym
en
t R
ate
Figure 7: Unemployment Rates for ACS Members vs. BLS Benchmarks 2004-2014
Gen. Pop. Unempl. (March) All Chemists BLS Bachelor's Degree & Higher
COMPREHENSIVE SALARY SURVEY: 2014
17
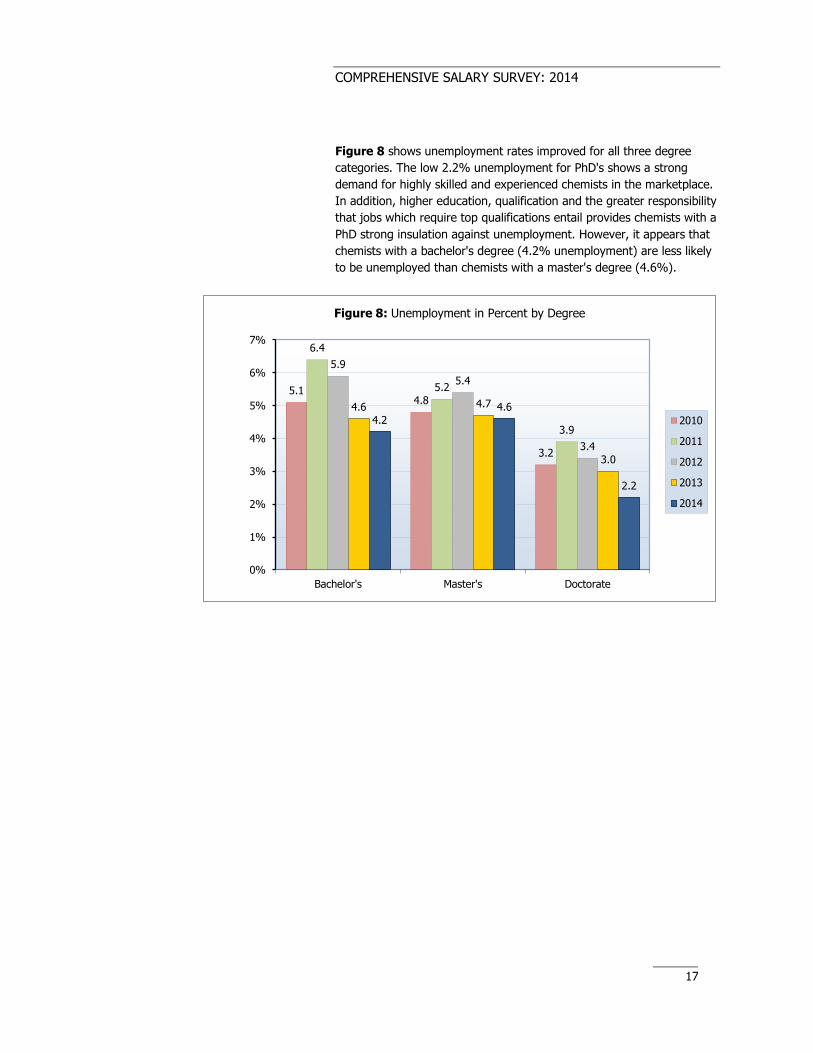
Figure 8 shows unemployment rates improved for all three degree
categories. The low 2.2% unemployment for PhD's shows a strong
demand for highly skilled and experienced chemists in the marketplace.
In addition, higher education, qualification and the greater responsibility
that jobs which require top qualifications entail provides chemists with a
PhD strong insulation against unemployment. However, it appears that
chemists with a bachelor's degree (4.2% unemployment) are less likely
to be unemployed than chemists with a master's degree (4.6%).
5.1 4.8
3.2
6.4
5.2
3.9
5.9
5.4
3.4
4.6 4.7
3.0
4.2
4.6
2.2
0%
1%
2%
3%
4%
5%
6%
7%
Bachelor's Master's Doctorate
Figure 8: Unemployment in Percent by Degree
2010
2011
2012
2013
2014
COMPREHENSIVE SALARY SURVEY: 2014
18
HEALTHCARE
Each year the ACS salary survey explores an ad hoc topic. The 2014
survey examines the healthcare options employers have made available
to employees and what the impact was, if any, of the Affordable Care
Act on premiums and coverage. These results focus on ACS members
employed full-time.
Of full-time employers, 98.3% offer medical coverage to their employed
ACS members and 90.2% enroll in the medical coverage offered by
their employers. Most employers also offer family medical coverage
(97.4%). ACS members typically belong to a PPO plan (67.0%).
In spite of seeing their monthly premiums increase over the past five
years and potential changes in cost and coverage as a result of
government legislation, 86.0% of full-time employed ACS members say
they are satisfied with their current health coverage and 88.0% believe
that their current coverage and benefits are competitive.
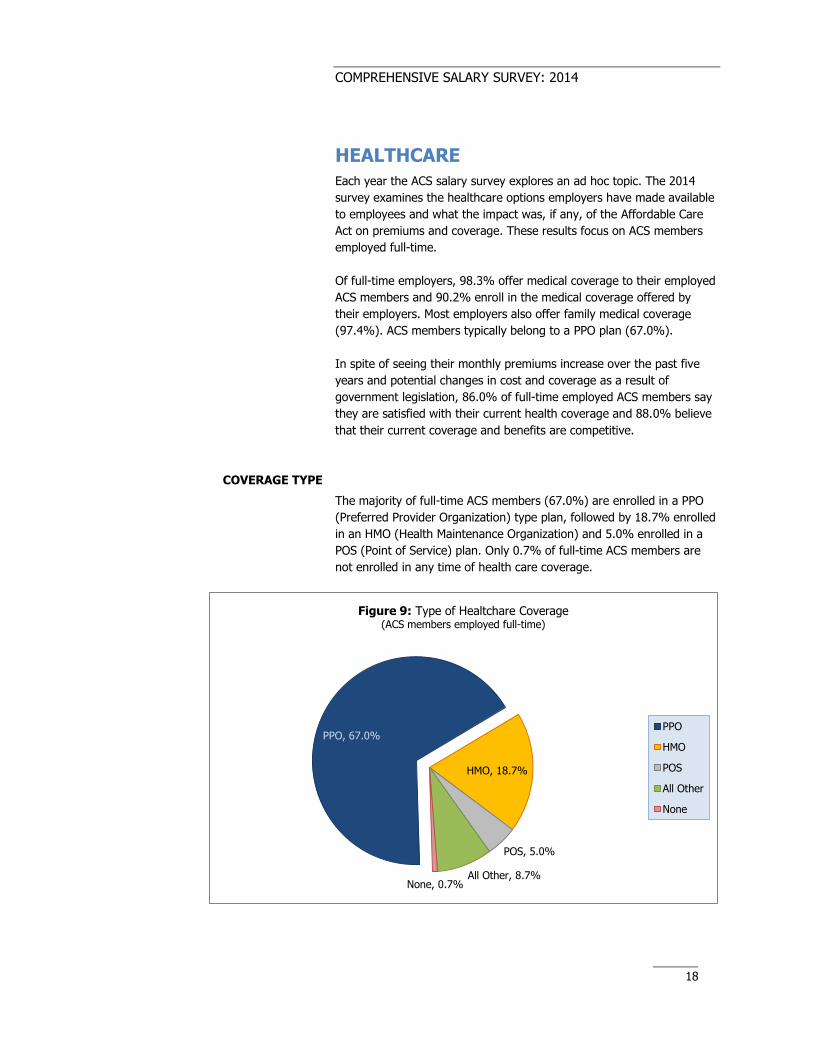
COVERAGE TYPE
The majority of full-time ACS members (67.0%) are enrolled in a PPO
(Preferred Provider Organization) type plan, followed by 18.7% enrolled
in an HMO (Health Maintenance Organization) and 5.0% enrolled in a
POS (Point of Service) plan. Only 0.7% of full-time ACS members are
not enrolled in any time of health care coverage.
PPO, 67.0%
HMO, 18.7%
POS, 5.0%
All Other, 8.7% None, 0.7%
Figure 9: Type of Healtchare Coverage (ACS members employed full-time)
PPO
HMO
POS
All Other
None

COMPREHENSIVE SALARY SURVEY: 2014
19
COVERAGE OFFERED BY
EMPLOYERS
The vast majority, greater than 90%, of employers offer ACS members
and their family’s medical and dental coverage. At least 85% or more
say that their employer also covers vision for the employee and their
family. Some 78.6% of employers cover an annual physical and 70.9%
cover wellness and fitness programs.
When employers offer full-time employees medical coverage, 86.5% of
ACS members indicate their employer pays part of their premium,
requiring employees to contribute. According the BLS’s National
Compensation Survey results published March 2013, 81% of employers
ask full-time employees to contribute to their single coverage premiums
and 19% do not. Among ACS members, 11.7% are not required to
contribute; the employer pays the entire premium. For 1.8% of ACS
members, their full-time employer pays none of the employee medical
premium.
Employers show greater willingness to pay all premium costs for the
annual physical (41.4%) and wellness or fitness programs (33.2%) than
other benefits. Increasing employee participation in annual physicals
and fitness programs are seen as a way of controlling healthcare costs
down the road.
Of the full-time ACS members whose employers offered medical
coverage for the employee, 90.2% enrolled in the offered coverage and
70.2% who are able to enroll their family in employer offered medical
coverage do so.
Table 11. Coverage Offered by Full-Time Employers
Coverage Type
% Yes,
Coverage
Offered
% Employer
Pays Entire
Premium*
% Employer
Pays Part of
the Premium*
% Enrolled in
Offered
Coverage*
Employee medical 98.3% 11.7% 86.5% 90.2%
Family medical 97.4% 4.6% 89.5% 70.2%
Employee dental 95.7% 11.8% 80.1% 87.7%
Family dental 94.5% 7.2% 82.1% 69.7%
Employee vision 88.3% 11.1% 77.9% 75.7%
Family vision 86.9% 6.8% 79.7% 60.3%
Prescription drug program 91.4% 10.2% 85.7% 87.5%
Annual physical 78.6% 41.4% 55.5% 88.3%
Wellness/fitness program 70.9% 33.2% 59.3% 70.7%
Other medical 31.5% 10.5% 77.4% 63.0%
*Among respondents whose employer offered this type of coverage
COMPREHENSIVE SALARY SURVEY: 2014
20
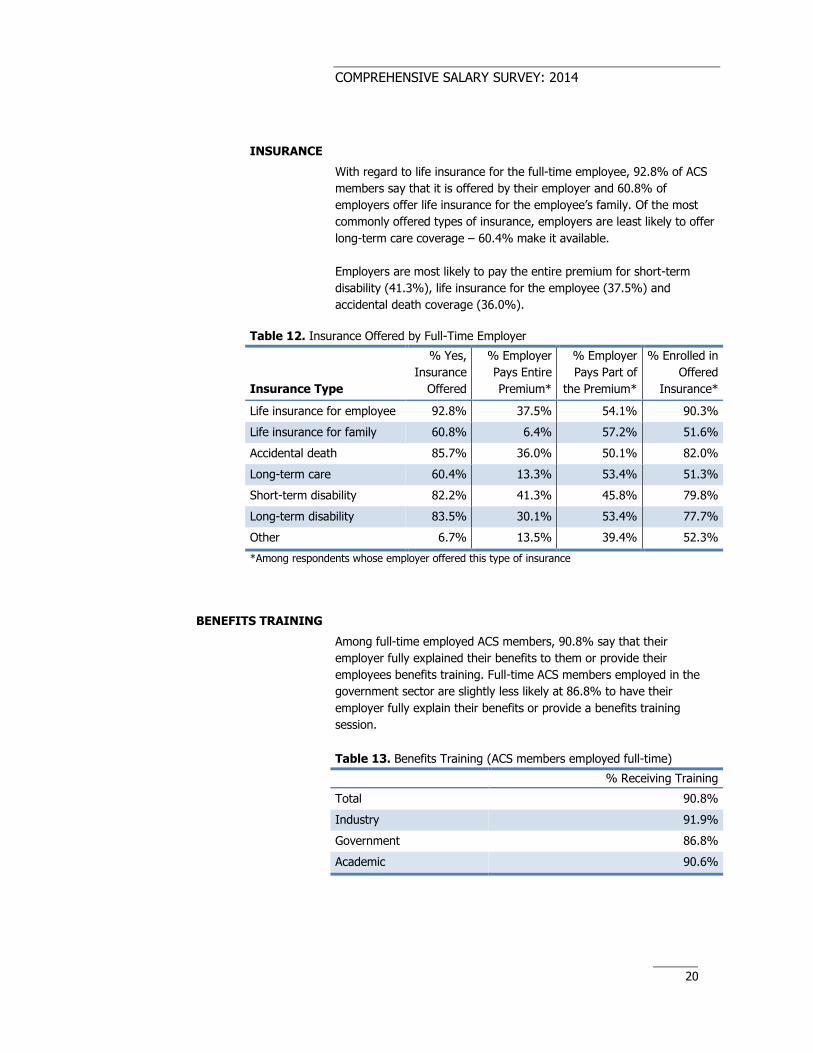
INSURANCE
With regard to life insurance for the full-time employee, 92.8% of ACS
members say that it is offered by their employer and 60.8% of
employers offer life insurance for the employee’s family. Of the most
commonly offered types of insurance, employers are least likely to offer
long-term care coverage – 60.4% make it available.
Employers are most likely to pay the entire premium for short-term
disability (41.3%), life insurance for the employee (37.5%) and
accidental death coverage (36.0%).
BENEFITS TRAINING
Among full-time employed ACS members, 90.8% say that their
employer fully explained their benefits to them or provide their
employees benefits training. Full-time ACS members employed in the
government sector are slightly less likely at 86.8% to have their
employer fully explain their benefits or provide a benefits training
session.
Table 12. Insurance Offered by Full-Time Employer
Insurance Type
% Yes,
Insurance
Offered
% Employer
Pays Entire
Premium*
% Employer
Pays Part of
the Premium*
% Enrolled in
Offered
Insurance*
Life insurance for employee 92.8% 37.5% 54.1% 90.3%
Life insurance for family 60.8% 6.4% 57.2% 51.6%
Accidental death 85.7% 36.0% 50.1% 82.0%
Long-term care 60.4% 13.3% 53.4% 51.3%
Short-term disability 82.2% 41.3% 45.8% 79.8%
Long-term disability 83.5% 30.1% 53.4% 77.7%
Other 6.7% 13.5% 39.4% 52.3%
*Among respondents whose employer offered this type of insurance
Table 13. Benefits Training (ACS members employed full-time)
% Receiving Training
Total 90.8%
Industry 91.9%
Government 86.8%
Academic 90.6%

COMPREHENSIVE SALARY SURVEY: 2014
21
IMPACT OF GOVERNMENT
LEGISLATION
About a third, 32.1%, of ACS members
employed full-time believe that in the last
five years, government legislation
changed their healthcare coverage. On
the other hand, 47.4% experienced no
change and 20.5% don’t know if their
healthcare changed in the past 5 years as
a result of legislation.
There is some correlation between a full-
time employed ACS member’s highest
degree attained and attributing changes in
their healthcare to government legislation.
Full-time employed ACS members whose
highest degree attained is a bachelor’s
degree are the most likely, at 40.9%, to
believe that government legislation impacted their healthcare. Those
with a PhD are less likely to believe government legislation impacted
their healthcare (28.8%).
CHANGE IN COST AS A
RESULT OF LEGISLATION
Among ACS members employed full-time who say their healthcare
changed in the past five years as a result of government legislation, an
overwhelming majority, 85.8%, say that government legislation
increased the cost of their healthcare. Only 4.4% say that government
legislation decreased the cost of their healthcare.
Full-time employed ACS members who
attained a bachelor’s degree have a lower
median income than those whose highest
degree is a master’s or PhD. With a
smaller median income, members with a
bachelor’s degree are likely more sensitive
to any increase in healthcare costs.
Figure 11 tends to bear this out, where
members with a bachelor’s degree are
about half as likely as members with a
PhD to say that the cost stayed the same
– 5.9% vs. 11.2%, respectively.
The proportion of those who say costs
decreased is similar across the three
degree types: 3.9% for those with a
32.1%
40.9%
38.4%
28.8%
47.4%
42.2%
43.3%
49.4%
20.5%
16.9%
18.3%
21.8%
Total
Bachelor's
Master's
PhD
0% 20% 40% 60% 80% 100%
Figure 10: In the past 5 years, has your healtchare changed as a result of government legislation?
(ACS members employed full-time)
Yes No I don't know
85.8%
90.2%
86.8%
84.3%
9.8%
5.9%
9.0%
11.2%
Total
Bachelor's
Master's
PhD
0% 20% 40% 60% 80% 100%
Figure 11: Legislation Impact on Cost (ACS members employed full-time)
Increased Stayed the same Decreased

COMPREHENSIVE SALARY SURVEY: 2014
22
bachelor’s degree; 4.1% for master’s degree holders; and, 4.5% among
those with a PhD.
CHANGE IN COVERAGE AS A
RESULT OF LEGISLATION
While the overwhelming majority of full-time employed ACS members
indicate that the cost of healthcare increased during the past five years
as a result of government legislation
(85.8%, see Figure 11), only 16.3% say
that their healthcare coverage expanded
as a result of legislation.
Almost half of all full-time employed ACS
members (49.4%, see Figure 12) say
that government legislation decreased
their healthcare coverage during the past
five years. A sentiment of paying more for
less is prevalent in the current economic
climate with regard to healthcare.
The majority of full-time employed ACS
members with a bachelor’s degree
(58.1%) say that they get less coverage
as a result of legislation. As a group, bachelor’s degree holders feel
more affected by the increased cost and decrease in service compared
with master’s degree holders and PhDs who earn higher median
incomes.
HEALTH INSURANCE
MARKETPLACE
Very few, about 1.6% of full-time employed ACS members, were
enrolled in a health plan from The Health Insurance Marketplace
(healthcare.gov) in 2013 or 2014.
Problems with the rollout of the
healthcare.gov website likely impacted
ACS member enrollment rates.
In addition to the plans offered in the
Health Insurance Marketplace
(healthcare.gov), an emerging trend born
out of the Affordable Care Act and the
Health Insurance Marketplace are private
exchanges. With a private exchange,
employers eschew offering health plans to
employees and instead provide employees
a stipend to select and purchase their own
16.3%
13.0%
11.8%
18.6%
34.3%
28.9%
34.3%
36.3%
49.4%
58.1%
53.9%
45.1%
Total
Bachelor's
Master's
PhD
0% 20% 40% 60% 80% 100%
Figure 12: Legislation Impact on Coverage (ACS members employed full-time)
Increased Stayed the same Decreased
Yes, 1.6%
No, 98.4%
Figure 13: Health Insurace Marketplace (healthcare.gov) Plan Enrollment (ACS members employed full-time)
Yes
No
COMPREHENSIVE SALARY SURVEY: 2014
23
health plan from a privately operated exchange.
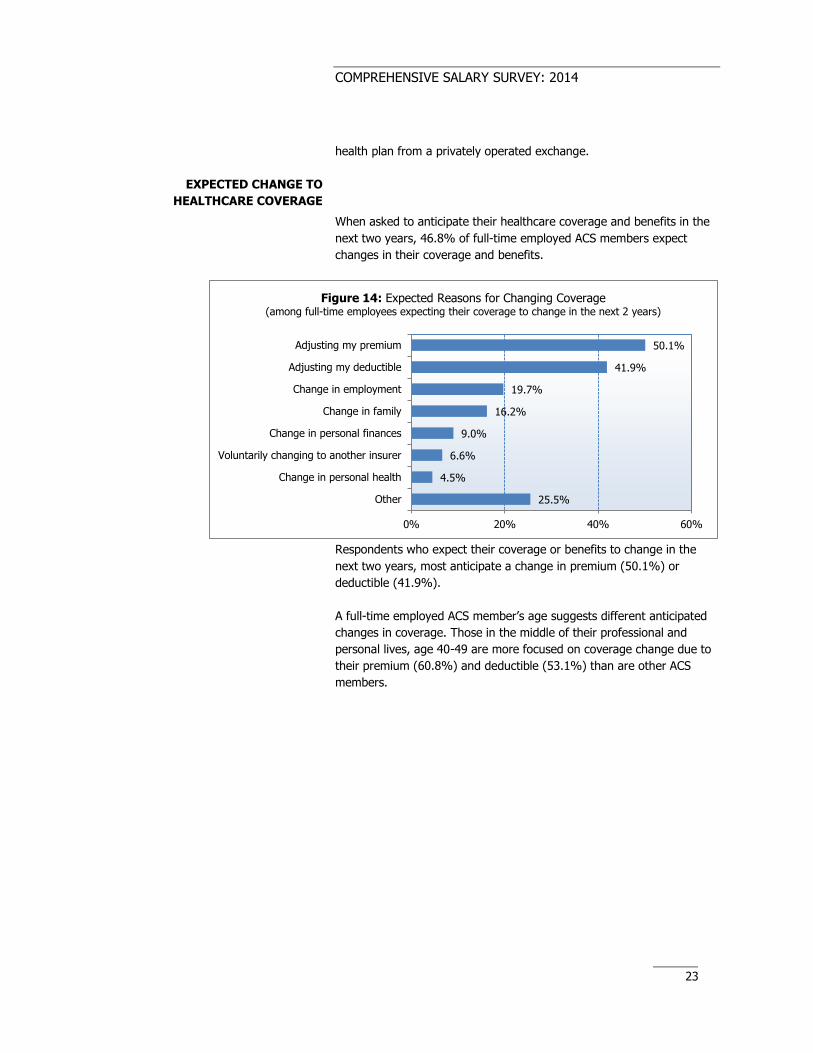
EXPECTED CHANGE TO
HEALTHCARE COVERAGE
When asked to anticipate their healthcare coverage and benefits in the
next two years, 46.8% of full-time employed ACS members expect
changes in their coverage and benefits.
Respondents who expect their coverage or benefits to change in the
next two years, most anticipate a change in premium (50.1%) or
deductible (41.9%).
A full-time employed ACS member’s age suggests different anticipated
changes in coverage. Those in the middle of their professional and
personal lives, age 40-49 are more focused on coverage change due to
their premium (60.8%) and deductible (53.1%) than are other ACS
members.
50.1%
41.9%
19.7%
16.2%
9.0%
6.6%
4.5%
25.5%
0% 20% 40% 60%
Adjusting my premium
Adjusting my deductible
Change in employment
Change in family
Change in personal finances
Voluntarily changing to another insurer
Change in personal health
Other
Figure 14: Expected Reasons for Changing Coverage (among full-time employees expecting their coverage to change in the next 2 years)

COMPREHENSIVE SALARY SURVEY: 2014
24
Change in employment is more strongly anticipated as a reason for
change in coverage by those age 20-39 (22.9%) and age 60+ (34.7%).
Full-time employed ACS members age 20-39 have a greater focus on
change in family (28.6%).
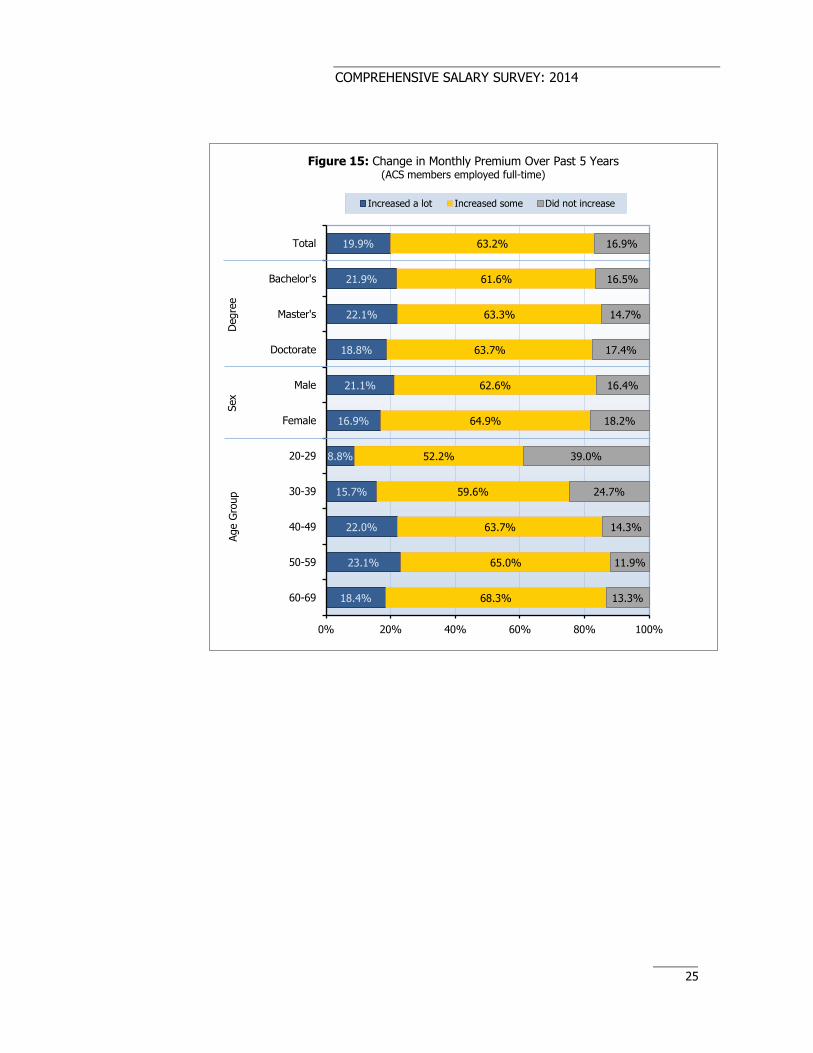
MONTHLY PREMIUMS
One-in-five (19.9%) of full-time employed ACS members say that their
monthly premiums have increased a lot over the past five years and
another 63.2% say premiums have increased some, leaving 16.9% of
ACS members who report that premiums did not increase. Given that
rising premiums are well documented and an impetus for healthcare
reform these results are expected. Increases in monthly premiums are
more strongly felt by those between the ages of 40 and 59.
Table 14. Anticipated Reasons for Change in Coverage Within the Next Two Years
Age 20-39 Age 40-49 Age 50-59 Age 60+
Adjust my premium 44.7% 60.8% 52.1% 38.7%
Adjust my deductible 39.4% 53.1% 40.9% 31.5%
Change in employment 22.9% 13.6% 14.4% 34.7%
Change in family 28.6% 9.6% 16.1% 9.3%
Change in personal finances 11.5% 6.3% 8.7% 10.4%
Change to another insurer 8.2% 6.5% 5.7% 6.5%
Personal health 4.6% 3.2% 4.3% 6.3%
Other 16.9% 25.6% 27.5% 33.1%
COMPREHENSIVE SALARY SURVEY: 2014
25
19.9%
21.9%
22.1%
18.8%
21.1%
16.9%
8.8%
15.7%
22.0%
23.1%
18.4%
63.2%
61.6%
63.3%
63.7%
62.6%
64.9%
52.2%
59.6%
63.7%
65.0%
68.3%
16.9%
16.5%
14.7%
17.4%
16.4%
18.2%
39.0%
24.7%
14.3%
11.9%
13.3%
0% 20% 40% 60% 80% 100%
Total
Bachelor's
Master's
Doctorate
Male
Female
20-29
30-39
40-49
50-59
60-69
Figure 15: Change in Monthly Premium Over Past 5 Years (ACS members employed full-time)
Increased a lot Increased some Did not increase
Age G
roup
Sex
D
egre
e
COMPREHENSIVE SALARY SURVEY: 2014
26
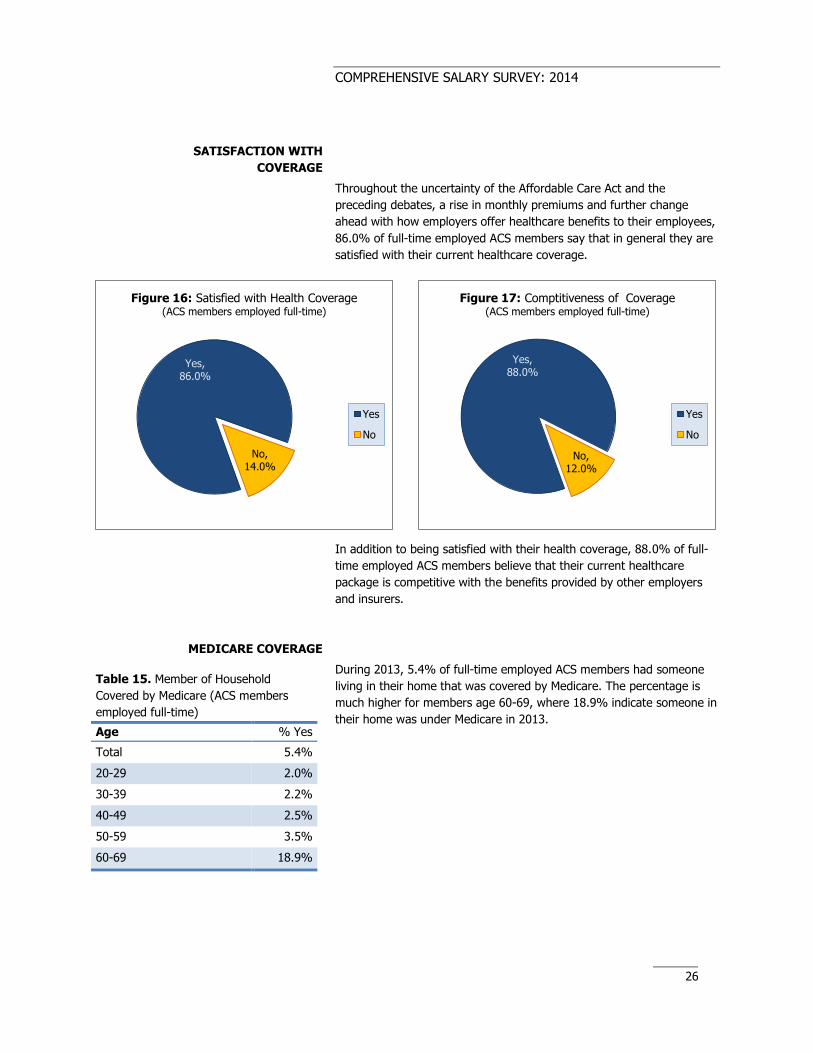
SATISFACTION WITH
COVERAGE
Throughout the uncertainty of the Affordable Care Act and the
preceding debates, a rise in monthly premiums and further change
ahead with how employers offer healthcare benefits to their employees,
86.0% of full-time employed ACS members say that in general they are
satisfied with their current healthcare coverage.
In addition to being satisfied with their health coverage, 88.0% of full-
time employed ACS members believe that their current healthcare
package is competitive with the benefits provided by other employers
and insurers.
MEDICARE COVERAGE
During 2013, 5.4% of full-time employed ACS members had someone
living in their home that was covered by Medicare. The percentage is
much higher for members age 60-69, where 18.9% indicate someone in
their home was under Medicare in 2013.
Table 15. Member of Household
Covered by Medicare (ACS members
employed full-time)
Age % Yes
Total 5.4%
20-29 2.0%
30-39 2.2%
40-49 2.5%
50-59 3.5%
60-69 18.9%
Yes, 86.0%
No, 14.0%
Figure 16: Satisfied with Health Coverage (ACS members employed full-time)
Yes
No
Yes, 88.0%
No, 12.0%
Figure 17: Comptitiveness of Coverage (ACS members employed full-time)
Yes
No
COMPREHENSIVE SALARY SURVEY: 2014
27
TECHNICAL NOTES
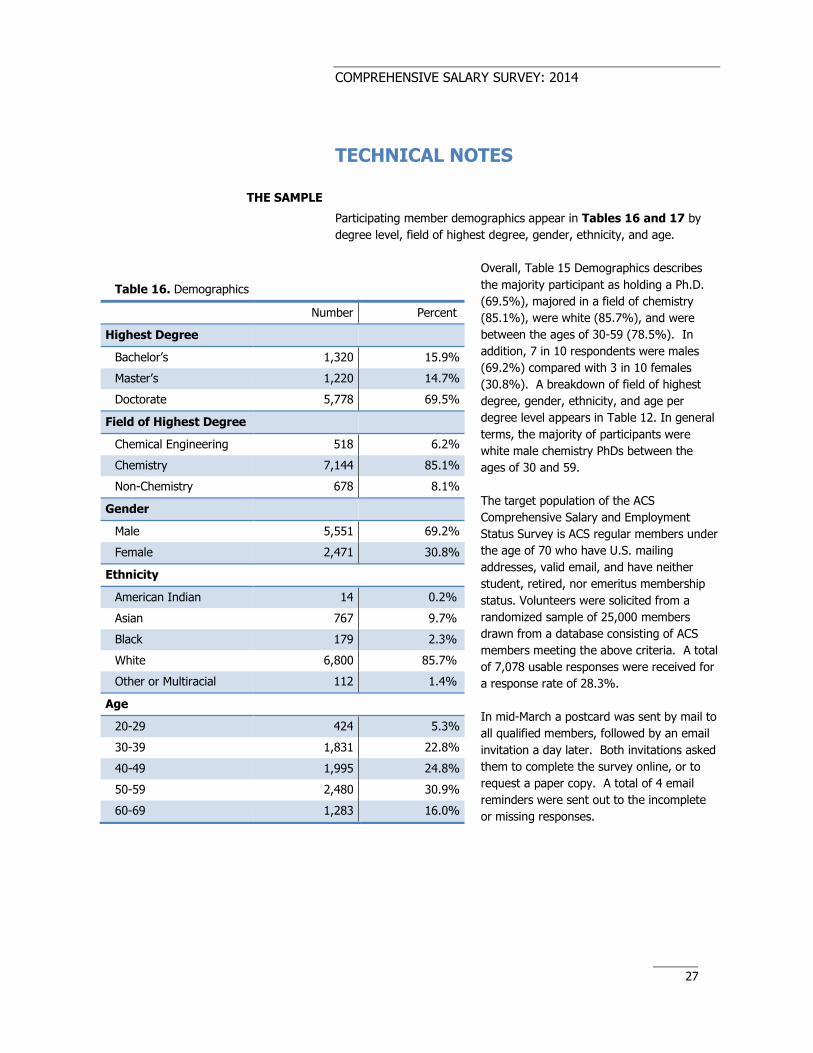
THE SAMPLE
Participating member demographics appear in Tables 16 and 17 by
degree level, field of highest degree, gender, ethnicity, and age.
Overall, Table 15 Demographics describes
the majority participant as holding a Ph.D.
(69.5%), majored in a field of chemistry
(85.1%), were white (85.7%), and were
between the ages of 30-59 (78.5%). In
addition, 7 in 10 respondents were males
(69.2%) compared with 3 in 10 females
(30.8%). A breakdown of field of highest
degree, gender, ethnicity, and age per
degree level appears in Table 12. In general
terms, the majority of participants were
white male chemistry PhDs between the
ages of 30 and 59.
The target population of the ACS
Comprehensive Salary and Employment
Status Survey is ACS regular members under
the age of 70 who have U.S. mailing
addresses, valid email, and have neither
student, retired, nor emeritus membership
status. Volunteers were solicited from a
randomized sample of 25,000 members
drawn from a database consisting of ACS
members meeting the above criteria. A total
of 7,078 usable responses were received for
a response rate of 28.3%.
In mid-March a postcard was sent by mail to
all qualified members, followed by an email
invitation a day later. Both invitations asked
them to complete the survey online, or to
request a paper copy. A total of 4 email
reminders were sent out to the incomplete
or missing responses.
Table 16. Demographics
Number Percent
Highest Degree
Bachelor’s 1,320 15.9%
Master’s 1,220 14.7%
Doctorate 5,778 69.5%
Field of Highest Degree
Chemical Engineering 518 6.2%
Chemistry 7,144 85.1%
Non-Chemistry 678 8.1%
Gender
Male 5,551 69.2%
Female 2,471 30.8%
Ethnicity
American Indian 14 0.2%
Asian 767 9.7%
Black 179 2.3%
White 6,800 85.7%
Other or Multiracial 112 1.4%
Age
20-29 424 5.3%
30-39 1,831 22.8%
40-49 1,995 24.8%
50-59 2,480 30.9%
60-69 1,283 16.0%

COMPREHENSIVE SALARY SURVEY: 2014
28
Table 17. Demographics by Degree
Bachelors Masters Doctorate
Field of Highest Degree
Chemical Engineering 8.2% 5.8% 5.9%
Chemistry 82.7% 73.3% 88.9%
Non-Chemistry 9.2% 20.9% 5.2%
Gender
Male 64.2% 59.5% 72.4%
Female 35.8% 40.5% 27.6%
Ethnicity
American Indian 0.3% 0.3% 0.1%
Asian 2.6% 5.9% 12.1%
Black 2.8% 2.6% 2.0%
White 91.0% 88.4% 83.8%
Other 1.2% 1.0% 0.7%
Age
20-29 20.0% 5.2% 1.8%
30-39 19.4% 19.7% 24.4%
40-49 18.9% 20.9% 27.0%
50-59 29.1% 35.7% 30.1%
60-69 12.5% 16.9% 16.4%
DEFINITIONS
For the purposes of the survey analysis, the following definitions were
used:
Chemist: A respondent who indicated a work specialty of chemistry
or biochemistry (categories 2 through 17 of Part 1, Question 3 of
the questionnaire) or if a non-chemistry work specialty (categories
18 through 21 of the same question), a degree field of chemistry or
biochemistry.
Chemical Engineer: A respondent who indicated a work specialty of
chemical engineering (category 1 of Part 1, Question 3 of the
questionnaire).
Non‐chemist: A respondent whose work specialty category was
other than chemistry or chemical engineering or if non‐chemistry
work specialty, no degree field of chemistry or biochemistry.
COMPREHENSIVE SALARY SURVEY: 2014
29
Academic: Pertaining to a Ph.D. working in a college or university
(i.e., a private or public institution that awards a degree of associate
or higher).
Unemployed: A respondent who was not employed and was seeking
employment (category 4 of Part 1, Question 4 of the questionnaire).
The unemployment rate was calculated to compare with the national
rate by dropping those “not seeking” or “fully retired” from the labor
force.
Respondents indicated their employment status, base annual salaries,
and ages as of March 1, 2014. Each respondent’s place of employment
(current or most recent) determines his or her geographic region. The
listing of states by geographic regions follows this section.
ROUNDING
Comprehensive Salary Survey results are rounded to the nearest $100
for dollar amounts and to one decimal point for percent figures.
DISCREPANCIES AMONG
TABLES
Some pairs of tables contain totals that should be identical but are not.
For example, two tables that represent information about Ph.D.
respondents should show the same total number of PhDs, but for
various reasons might not. Missing response items in individual surveys
generally causes this phenomenon. Not every respondent answers all
questions all of the time. To illustrate, if one table groups the PhDs
according to specialty and another groups them according to work
function, the totals will differ unless the number who did not indicate
their specialty is the same number as those who did not indicate their
work function.