stanford menlo p c utea - nasa · _ii 3.5.1 detailed tree diagram ... 5.1 a framework for mssr...
TRANSCRIPT
.STANFORD RESEARCH INSTITUTEMenlo Park, California 94025 • US A
Final Report April 1977
JBI_ t |1E1
METHODOLOGY FOR BACK-CONTAMINATIONRISK ASSESSMENTFOR A MARSSAMPLE RETURNMISSION
(NASA-CR-153251) METHODOLOGY FOb N77-25799BACK-CONT_flI_ITION RISK ASSESSMENT FOR
MARS SAMPLE B_TUB,N MISSION Final Report(Stanford Research Inst.) 121 p HC AO6/SF Unclas
A01 CSCi 03B G3/55 29046
Preparedfor:
JET PROPULSION LABORATORYPASADENA, CALIFORNIA 91103
CONTRACT 954546 UNDERNASA CONTRACT NAST-100 T
TASK ORDER NO, RD-4
SRI Project Number5534
1977018855
https://ntrs.nasa.gov/search.jsp?R=19770018855 2018-07-26T19:55:16+00:00Z
Final Report April 1977
METHODOLOGY FOR BACK-CONTAMINATIONRISK ASSESSMENTFOR A MARSSAMPLE RETURNMISSION
1 By: M.W. MERKHOFER._ . D.J. QUINN
Prepared for:
JET PROPULSION LABORATORYPASADENA, CALIFORNIA 91103
CONTRACT 954546 UNDERNASA CONTRACT NAS7-100TASK ORDER NO. RD-4
SRI Project Number 5534
iiI
1977018855-002
., TT"TF
ABSTRACT
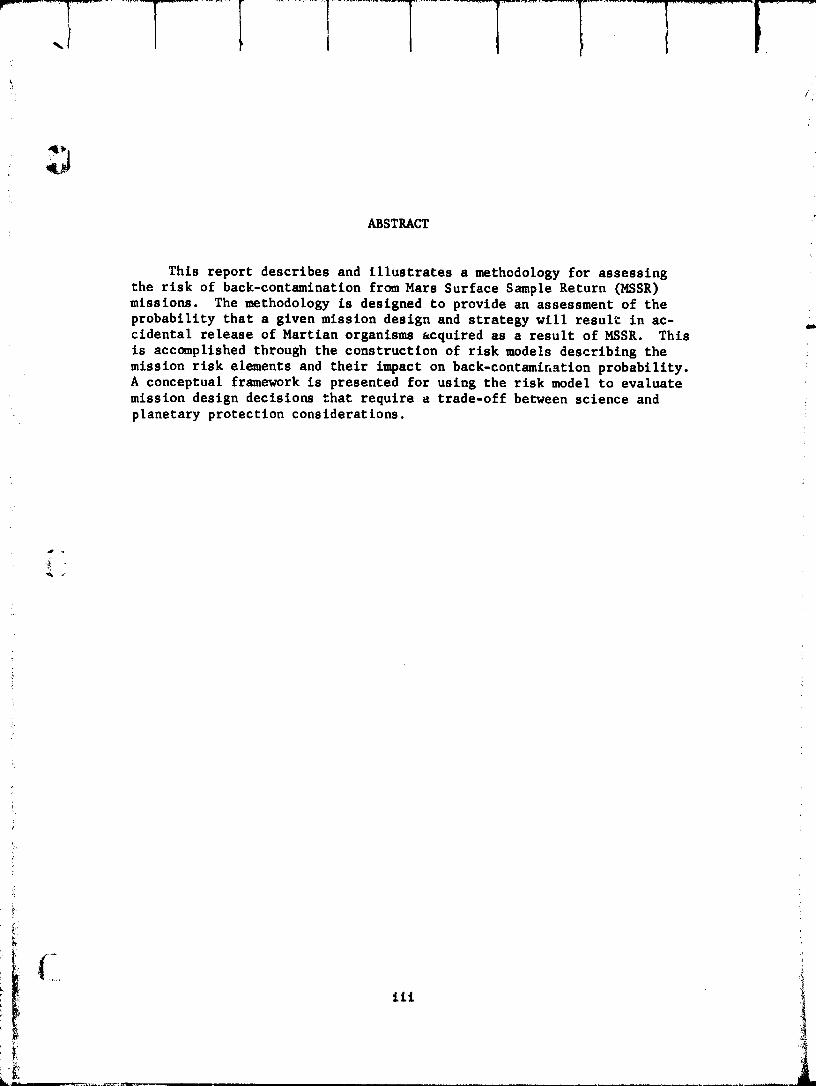
This report describes and illustrates a methodology for assessingthe risk of back-contamlnatlon from Mars Surface Sample Return (MSSR)missions. The methodology is designed to provide an assessment of theprobability that a given mission design and strategy will result in ac-cidental release of Martian organisms acquired as a result of MSSR. Thisis accomplished through the construction of risk models describing themission risk elements and their impact on back-contaminatlonprobability.A conceptual framework is presented for using the risk model to evaluatemission design decisions that require a trade-off between science andplanetary protection considerations.
a.,
!:
_L
iii
1977018855-003
CONTENTS
ABSTRACT ............................. lii
LIST OF ILLUSTRATIONS ....................... ix
LIST OF TABLES .......................... xi
i
; FOREWORD ............................ xiii
ACKNOWLEDGMENTS .......................... xv
_ I SUMMARY .......................... i
i.I Objectives and Scope ................. I
i : 1.2 Methodology .................... 2
1.3 Major Findings .................... 2
1.4 Methodological Findings ................ 3
1.5 Recommendations .................. 3
} II METHODOLOGY ........................ 52.1 Definition of "Actual Back-Contamination" ....... 5
2.2 Actual Back-Contamination Compared to"Potential Back-Contaminatlon" ............ 5
2.3 Mission Phases .................... 7
_ 2.4 Proposed Methodology ................. 8
2.5 A Comparison with Earlier Work ........... I0
III ANALYSIS OF THE REFERENCE MISSION ............. ii
3.1 Definition of the Reference Mission .......... IIji!
3.2 Assumed Numbers and Locations of Martiani 12Organisms ......................
3.3 Risk Elements .................. 14
.... 14
._: 3.4 Modes of Back-Contaminatlon .............
iii 3.5 Major Equipment Failure .............. 14
_ii 3.5.1 Detailed Tree Diagram ............. 173.5.2 Conditional Probabilities of Contamination . . . 19
3.5.3 Event Probabilities .............. 23
V
FRI_O PAGF, I_T,AN*KNO_ _WW_
1977018855-004
|I 3.5.4 Computation of the Probability of
Back-Contamination ............... 25
3.5.6 Identifying Major Sources of Risk ....... 28
3.6 Leakage ........................ 30
3.7 Surface Contaminants ................. 31
3.7.1 Number of Organisms Transferredto the Earth-Return Vehicle .......... 33
3.7.2 Paths Followed by Surface Contaminants ..... 353.7.3 Summary of Results--Surface Contaminants .... 36
3.8 Summary of Results of the Analysis ofthe Reference Mission ................. 36
IV SENSITIVITY ANALYSIS OF THE REFERENCE MISSION ....... 39
4.1 Individual and Joint Sensitivities .......... 39
4.2 Major Equipment Failure ................ 40
4.3 Leakage ........................ 49
4.4 Surface Contaminants ................. 49
4.5 Conclusions ...................... 49
V MAKING DECISIONS ABOUT ALTERNATE MISSION PLANS--
- THE USE OF A CONTAMINATION PENALTY ............. 55
- , 5.1 A Framework for MSSR Mission Decision Making ..... 56
5.2 A Simple Example ................... 58
VI THE CONTAMINATION PENALTY ................. 65
6.1 Definition of the Contamination Penalty ........ 65
6.2 The Contamination Penalty Versus theCost of Contamination ................. 67
6.3 Determination of an Appropriate Value
for the Contamination Penalty ........... 68
6.4 Alternatives to Using an Explicit Assessmentof the Trade-Off Between Mission Value and
Probability of Back-Contamlnatlon ........... 70
VII TOPICS FOR FURTHER RESEARCH ................ 73
7.1 Application and Extension of Assessment
Methodology .................... 73
7.2 Development of Models for the Consequences ofReleasing Martian Organisms on Earth ......... 74
7.3 Methodology for Assessing and OperationalizingContamination Penalties ................ 74
vi
g
"_i:!' _
1977018855-005
F-...................i.........................I.............._.................-T--_.....l-.....................I............-.........l........
APPENDICES
_,. A SOURCES OF NUMBERS FOR INITIAL BIOLOAD ....... A-I
: B PROBABILITY TREE--MAJOR EQUIPMENT FAILURE ...... B-I
C PROBABILITY TREE--LEAKAGE .............. C- Ii
D PROBABILITY TREE--SURFACE CONTAMINANTS ....... D-I
E A PRELIMINARY ANALYSIS OF AN ORBITAL
_i RECOVERY OPTION ................... E- I
REFERENCES ..................... • .... R-I
.I
ILLUSTRATIONS
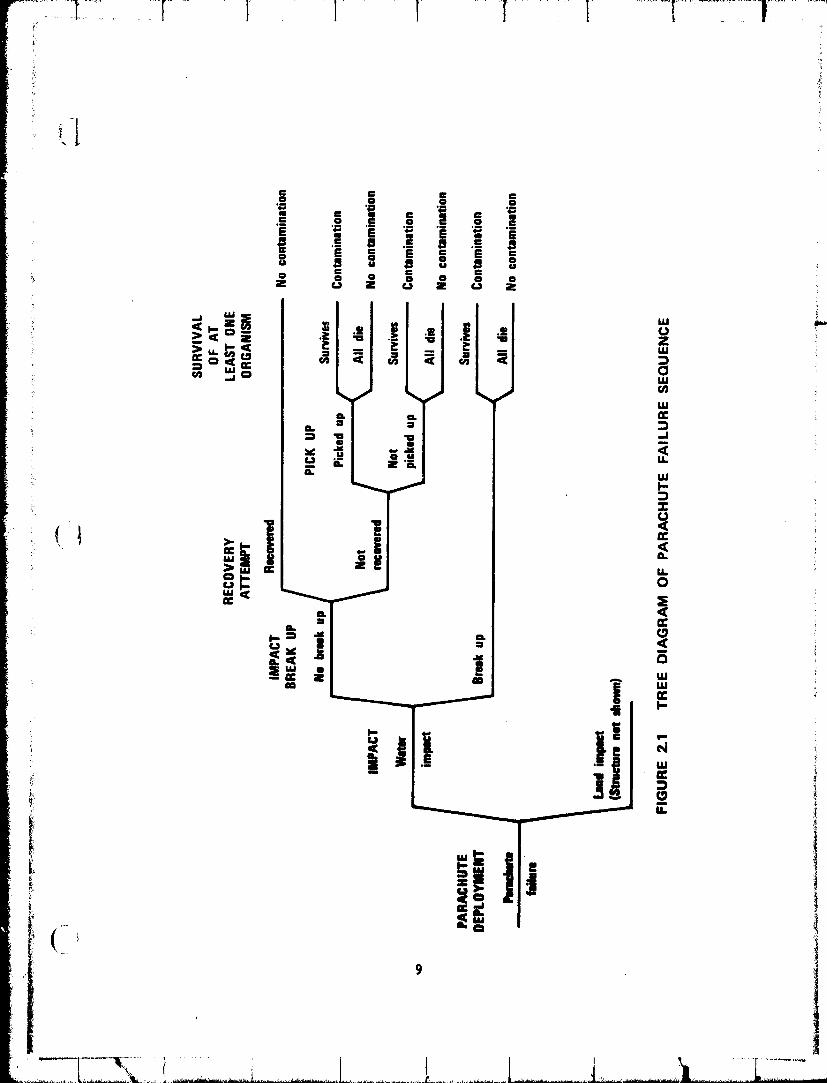
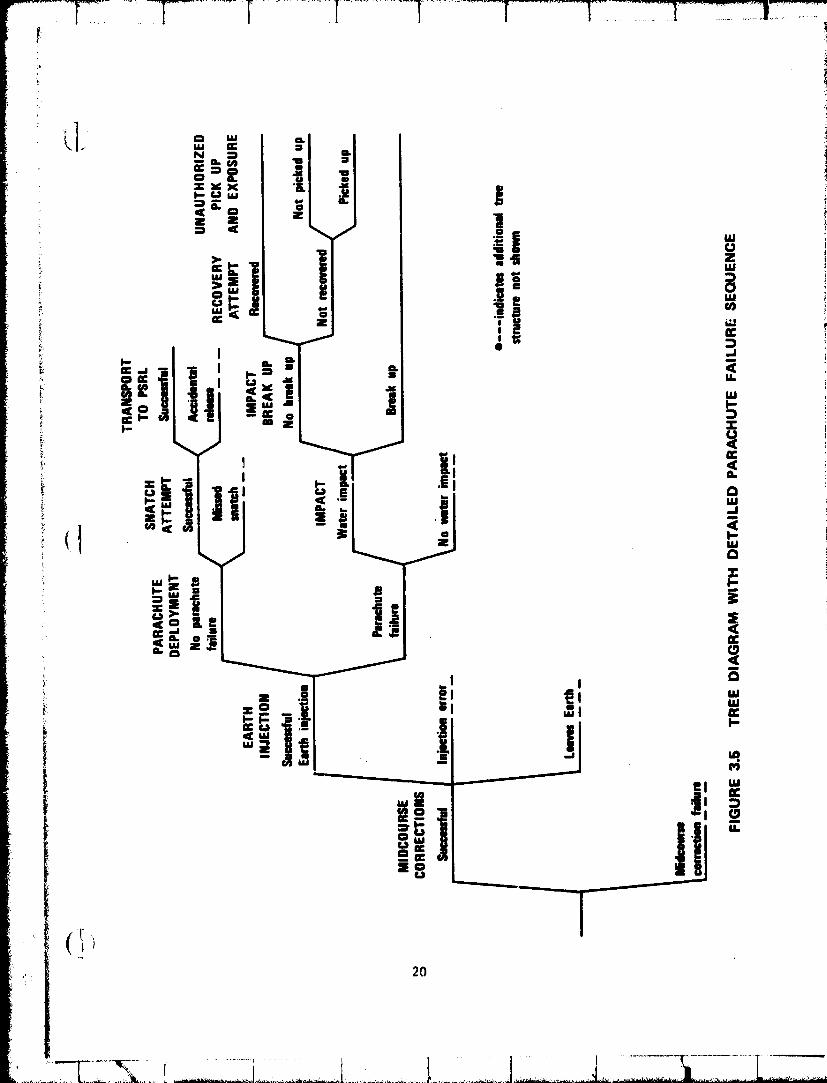
2.1 Tree Diagram of Parachute Failure Sequence ......... 9
3.1 Assumed Organisms on R_turn Vehicle ............ 13
3.2 Sequence of Mission Risk Elements ............. 15
3.3 Tree Diagram of Major Equipment Failure Risk Events .... 16p.
3.4 Detailed Tree Diagram of Parachute Failure Sequence
Showing Events Leading to Possible Contamination ...... 18
3.5 Tree Diagram with Detailed Parachute Failure Sequence 20
3.6 Illustrative Probability Distribution for Fraction
of Surviving Martian Organisms ............... 22
3.7 Tree Diagram with Conditional Probabilities of Survival 24
3.8 Probability Tree for Major Equipment Failure ........ 26
3.9 Probability Tree with Roll-Back Results .......... 27
3.i0 Probability Tree with Roll-Back Resultsand Risk Contributions ................... 29
' 3.11 Probability Tree for Leakage During Earth Entry ...... 32
3.12 Docking Geometry ..................... 34
3.13 Assumed Paths for Martian Organisms on the Earth-
Return Vehicle Exterior .................. 35
4.1 Probability of Back-Contamination Sensitivity to
Number of Martian Organisms in the Sample ......... 41
4.2 Sensitivities to Parachute Reliability and Probability
of Earth Capture in the Event of Midcourse Failure ..... 42
4.3 Sensitivities to Probabilities of Snatch Failure ...... 44
4.4 Sensitivity to Probability of Non-Nominal
Earth Injection ...................... 45
4.5 Sensitivity to Probability of No Recovery in theEvent of Parachute Failure ................ 46
4.6 Sensitivity to Assumed Survival Probability
of Each Martian Organism .................. 47
4.7 Cumulative Sensitivity Results ............... 48
4.8 Probability of Back-Contamination Due to Leakage
Sensitivity to Numbers of Martian OrganismsAssumed in Various Locations ............... 50
• }
ix
_ED_G PAG_ BLANK NOT
1977018855-007
4.9 Sensitivities to Seal Rellabillties ............ 51
4.10 Sensitivities to the Number of Martian Organisms on the
Earth-Entry Capsule Exterior and to the Probability of
Earth Capture of Dislodged Organisms ............ 52
5.1 Decision Framework for MSSR Planning ........... 57
5,2 Effect on Back-Contamination Probability of System for
Incinerating Sample in the Event of Parachute Failure . . 60
5.3 Planetary Protection Versus Science Trade-Offs ....... 63
6.1 Graphical Interpretation of the ContamLnatlon Penalty . . 66
A.I Numbers and Locations of Martian Organisms Assumed
for Numerical Example ................. A-4
A.2 Docking Sequence ...................... A-6
B.I Complete Probability Tree for Major Equipment Failure . B-5
C.l Probability Tree for Leakage During Heliocentric
Transfer C-5,,j,eJJmeeoeoe oi,,,,a.,oo
C.2 Probability Tree for Leakage During Earth Entry ...... C-6
D.I Probability Trees for Contamination Due to
Surface Contaminants ..................... D-4
E.I Probability Tree for Major Equipment Failure for an
• , Orbital Recovery Option ................. E-5
E.2 Sensitivity to Probability of Sterilization by
Entry Heatup ........................ E-9
1977018855-008
TABLES
3.1 Basic Risk Element Probabilities ............. 28
3.2 Leakage Risk Element Probabilities ............ 33
3.3 Surface Organism Risk Element Probabilities ....... 36 "_
3.4 Sun_nary of Back-Contamination Probabilitiesfor Reference Mission .................. 37
B.I Probabilities for Major Equipment Failure Events ..... B-7
C.I Probabilities for Leakage Events ............. C-4
D.I Probabilities for Surface-Centamln_nt-Related Events . D-5
E.I Probabilities of Major E_uIpm_nt Failure Events--
Orbital Recovery .................... E-7
E.2 Back-Contamination Probabilities for Orbital
Recovery Option ..................... E-IO
E.3 Preliminary Estimate of Additional Costs of Direct
Orbital Recovery by the Space Shuttle over the
I Reference Mission (Direct Earth Entry) .......... E-II
E.4 Comparison of Nominal Mission with Two OptionsInvolving Orbital Recovery .............. E-12
_r
1977018855-009

FOREWORD
One source of critical concern in the exploration of space is the
potential for planetary rontamination. On the one hand, there is the
risk of contaminating other planets through inadvertently transporting
chemical and biological pollutants from Earth. Contamination of another
planet could greatly impede subsequent research and could result in an -_irrevocable loss of scientific knowledge. Now that the technology exists
for returning soll samples from another planet using unmanned spacecraft,
a new, potentially dangerous prospect exists: the remote chance of inad-
vertently "back-contaminating" the Earth with extraterrestrial organisms.
Although there is currently no U.S. or international planetary pro-
tection policy for the return of extraterrestrial samples, an accepted
policy concerning the contamination of other planets does exist. In 1966the Committee of Space Research (COSPAR) of the International Council of
Scientific Unions achieved an international agreement on quantitative ob-
jectives for probabilities of events that may contribute to planetary
contamination. An upper limit on the probability of contm_ination of
other planets was recon_ended. Planetary protection restraints for each
_ NASA mission are established in such a way as to ensure conformance withthe COSPAR standard.
i
Establishing a planetary protection _olicy for the return of samples
I from other planets will require deciding what is an acceptable level ofback-contamination risk. The acceptable risk level is obviously extremely
small, but it makes little sense to demand that only a zero level of riskbe tolerated. Even meteors that enter the Earth's atmosphere carry withthem some chance of contamination from extraterrestrial life forms. Send-
ing astronauts to the moon and bringing back lunar samples presented somesmall risk of back-contamination.
The appropriate level of risk for a sample return mission can be
established only through a recognitlon of the trade-offs between the po-tential costs of contamination and the value of the scientific achieve-
ment and information to be gained from space exploration. The costs of
decontamination, sterilization, and other planetary protection measures
may be significant, not only in terms of dollars but also In terms of de-lays, reduccd system reliability, and limitations on mission capabilities.
A framework must accordingly be developed to assist mission planners in
evaluating sample return mission strategies. In particular, methodologies
are needed for the accurate assessment of the probabilities and consequen-
ces of planetary contamination and of the value derived by society fromthe return to Earth of extraterrestrial soil samples.
lr....................r--...........r .... I..........1 1 1 f 1
I Our central focus is on the decision framework needed by individualsand agencies responsible for decisions relating to the risk of back-
contamination from Mars Surface Sample Return (MSSR) missions.
The framework we propose is a logical decision structure for inte-
grating the factors that affect the decision: available alternatives,available information_ and the preferences of society. The appropriate
method for representing incomplete information is the language of prob-
ability theory. Preferences may be represented as trade-offs among
science, economic costs, and the probabilities of contamination. The de-
cision structure may then be used to determine the policies, strategies,
and decisions that are consistent with the available alternatives, infor-mation, and preferences.
Development of some of the components of this framework is relativelystcaightforward. In particular, assessing the probability of a given
mission design resulting in accidental release of Martian organisms is a
well-defined problem. The major portion of this report is devoted to the
description and illustration of a method for making this assessment. Other
components are much more difficult to provide. For example, modeling the
preferences of society for the trade-off between scientific objectives
and the probabilities of back-contamination is a very difficult task.
Although a brief discussion of how the trade-off preferences of societymay be represented in the decision-maklng process appears in the report,
additional research in this area is required.
Once a decision framework is established, the guidance required for
decisions relating to sample return comes from inputs to the decisionframework. Establishing these inputs, in particular, societal preferences
for trade-offs, will not be an easy job_ but the alternative approachesappear even less favorable. To quote Marvin Chri_tensen et al._ of theJet Propulsion Laboratory:
Most knowledgeable engineers and scientist, feel that the
back-contamination problem should not be _reated on a numeri-cal basis as was the outbound program, at COSPAR's behest.
Furthermore, indications are that the approach -- at leastinitially -- must be very stringent. The manner of defining
how stringently quarantine should be treated, without express-
ing the degree of concern or caution needed by a single numer-
ical constraint is very nebulous...In general, what is needed
is a governing philosophy that is adhered to, and supported by,all levels cf organizations involved.
We believe that a well-organized framework for decision making, together
with an explicit and quantitative expression of the willingness of society
to trade off risk against the benefits of space exploration, can provide
the appropriate governing philosophy for MSSR mission planning.

ACKNOWLEDGMENTS
The authors wish to thank the many individuals at the Jet Propulsion
Laboratory (JPL) who contributed time and effort to assist us in this re-search. We are especially grateful to Mr. Alan R. Hoffman for his aid
and assistance throughout the project 3 to Mr. Harry N. Norton for infor-
mation on and understanding of MSSR mission design_ to Dr. Jack Barengoltz
for help in assessing and understanding the problem of partiule transfer
during space vehicle rendezvous_ and to Dr. Charles W. Craven who_ as
Project Manager of Planetary Quarantine at JPLj sponsored this research.
Dr. C. L. Yen of the Advanced Projects Group_ JPL 3 earlier conducted
a systems analysis of back-contamination risk frcm MSSR missions. Weacknc_!edge wholeheartedly that her analysis was of considerable help toour own work.
We would like to acknowledge the contributions of SRI co!leagues_
especially Dr. D. Warner North who_ as project supervlsor_ provided ad-vice throughout the study and carefully re_ awed t_is report; Dr. Stephen
M. Barrager for discussions concerning the use and assessment of a con-
i tam,nation penalty; and Mr. Robert Korsan for his helpful contributionsin the early phases of this effort.
Finally_ we are grateful to members of the American Institute of
Biological Sciences Planetary Biology and Quarantine Panel_ who offeredconstructive criticism _uring a presentation of this research at the
JPL Planetary Quarantine Program Review held January 18_ 1977.
XV
1977018855-012
I SU_MARY
This report describes and illustrat_ a methodology for assessingthe risk of back-contamination from Mars Surface Sample Ret,rn (MSSR)
missions. In addition_ a decision framework is described for assistingmi=slon planners in _akin_ decisions that trade-off increased mission
costs or decreased science capability for a lower risk of back-
contamination.
1.1 Objectives and Scope
A complete assessment of the ri '_of back-contamination from anMSSR mission would require probability estimates for all elements in the
risk chain_ including the existence of life on Mars and the ability ofMartian life forms to survive transport to Earth and to propagate in the
Earth's biosphere. These issues were not addressed by the research de-
scribed in this report_ Rather_ they are assumed to be true_ and back-contamination is more narrowly defined. The methodology described is de-
signed to a_sess the probability that Martian organisms collected andreturned alive by an MSSR mission would_ prior to their delivery to a
Planetary Sample _eceiving Lab (PSRL)3 be inadvertently released into the
Farth's biospher_ and would survive the release. Thus_ probabilities of
back-contamination computed using the methods described in th_s report
are based on the assumption that viable Martian organisms are contained
in the return spacecraft. These probabilities do not include the risk o_back-contamination that might exi=t following transfer of the sealed _ample_
and associated responsibility_ to the £SRL. To avoid misinterpretation_we refer to the me_hodoJogy of this report as producing an assessmen_ e_
the probability of "potential back-informatlon" rather than an assessment
of the probability of "aceual back-contamlnatlon."
To illustraLe the methodology_ an analysis has been conducted of the
risk of potential back-contamination for a "reference mission." This
is a conceptual MSSR mission designed to return multiple unsterilized
soil samples via a Mars orbit rendezvous with direct Earth entry. £incethe reference mission has not been designedj the detailed numerical as-
sumptions of mission design are purely hypothetical; however_ an effortwas made to obtain r_presentative assumptions 3 subject to _he time and
budget constraints of the project. Consequentl_j the resu!_ may be
viewed as providing a preliminary evaluation of the potential back-contamination risk of a MSSR.
b
I
1977018855-013

1.2 Methodology
• The proposed methodology for assessing the risk of back-contamination
consists of the procedures and methods generally used by decision analysts
for determining the probability of a rare event. The rare event, back-
contamination in this case, is separated into the sequences of events thatdetermine whether or not contamination occurs. Each event in the sequence
is well defined and of sufficient probability to be comprehended without
difficulty. The event sequences are represented as tree structures.Probabilities are assessed for each of the events in the tree structure,
and the laws of probability theory are used in combining these probabili-
ties to obtain the overall probability of back-contamination.
The tree structures represent systems models that capture for a par-
ticular mission design the available information and uncertainties that
determine the probability of back-contamination. Additional models con-
structed to represent mission outcomes, in particular the scientificbenefits of an MSSR mission and the consequences of contamination, may
be combined to vroduce a framework for decision making. The usefulness
of t a decision framework is that it serves to organize and clarify issues i
aff_ _ing a decision relating to an MSSR mission by providing a means for
modeling complex causal sequences, for dealing with uncertainties, and forcharacterizing the trade-offs among conflicting objectives that the de-
cision may entail.
I 1.3 FindingsMajor
A probability of potential back-contamination of approximately I
chance in 6,000 was obtained for the reference mission. Nearly all ofthe contamination risk is due to events occurring during Earth entry, and
most of this is due to the risk of failure of the parachute system designed
to slow the Earth-entry capsule. A number of essentially independent
sources of risk contribute probability in the range of 10-6 to 10-5 .
As a consequence, it is difficult to reduce the probability of potential
back-contamlnation for the reference mission below about I in 100,000
without simultaneously improving or eliminating a large number of risksources.
A preliminary analysis indicates that a lower probability of potential
back-contamination, about 1 in I million, can be obtained if the entrymode chosen is orbital recovery rather than direct entry. The strategy
would be to recover the sample in Earth orbit with the space shuttle,
place it in a strong leakproof container, and then return it directly to
an Earth-based PSRL. A somewhat higher m!s,lon cost may result for thisalternative due to added complexity and the fact that a large velocityiichange would be required to put the capsule into a n_ar-Earth orbit ac-
! cessible to the space shuttle.
, t
2
1977018855-014
1.4 Methodological Findings
Analysis by tree structures is a flexible and efficient method for
evaluating the risk of back-contaminatlon from MSSR missions. In addition
to providing a quantitative assessment of contamination probability
prior to mission launch 3 the method of evaluation shows how this probabil-ity should be updated as information arrives during the course of themission.
Sensitivity studies performed on the systems models constructed
using this methodology may be used to identify areas of critical uncer-
tainty. Sensitivity study results may also be used to suggest missiondesign changes for reducing back-contamination risk. Evaluation of the
impact of proposed mission design changes may be easily accomplished by
an appropriate expansion of the tree structures to account for the changesin effectiveness and reliability of the altered systems.
1.5 Reconm_ndations
The primary emphasis of this report is on a methodology for construct-
ing a systems model to assess the probability of potential back-
contamination for a specified MSSR mission design, but attention is also
given to the role of this model within a framework for making decisionsi relating to sample return. Our major recommendation is that the method-
ology for assessing contamination risk be extended and that additional
I methodologies be develope_ to provide the other components necessary forthe realization of the decision framework.
The probability of back-contamination cannot be accurately determineduntil an assessment is made of the elements of the risk chain not consid-
ered in this report. Thus 3 Viking results should be used to develop mod-els for the biological characteristics of potential Martian life. This
work would require an interdisciplinary team including both qualifipd
biologists and systems modelers.
The methodology for assessing contamination risk should be extended
to permit the identification of a "best" mission design. This extension
would be relatively straightforward. Finally 3 a methodology should be
developed for assessing and operationalizing contamination penalties.
The concept of a contamination penalty provides a logical means for con-
sistently making trade-off decisions. However, additional research isneeded to determine efficient methods for its assessment and use within
a large technological project, such as an MSSR mission.
{
!,
1977018855-01.r-,
I
II METHODOLOGY
In this chapter we define the distinction between "actual back-
contamination" of Earth by Martian organisms and the issue of "potential
back-contaminations" which is studied in this report. The chapter con-cludes with a description of a methodology for calculating the probability
of potential back-contamination. An ilTustr_tive application of the meth-odology is presented in Chapter III.
2.1 Definition of "Actual Back-Contamina_-n"
For this study_ we define "actual back-contamination" of Earth by
Martian organisms to have occurred when at least one Martian organismis released from controlled contairh_ent and reproduces in the Earth's
biosphere using nutrients found on Earth for growth. For an MSSR missionto cause actual back-contamination of Earth by Martian organisms_ the
following must occur :
(i) Living organisms are found on Mars.
i I (2) Living Martian organisms are transferred to the return
spacecraft.
(3) At least one organism survives the return trip to Earth.
[4) A surviving organism escapes the spacecraft (or receiving
laboratory) confinement.
(5) It survives the escape.
(6) It is transferred to the Earth's ecosphere.
(7) It survives the transfer.
(8) It finds a niche in the Earth's ecosystem where itreproduces.
"Harmful contamination" implies two additional conditions:
(9) The contaminating organism '.,"-san undesirable effect onman or his environment.
(I0) It is hard to combat.
2.2 Actual Back-Contamination Compared to "Potential Back-Contamination" !
Rather than attempt to cover all of the issues listed above_ this _
report addresses only issues 3j 4j 5_ 6_ and 7. Thus_ the methodology
.i 5
1977018855-016
/i'
./
is contingent upon certain assumptions about the existence and biological
properties of Martian organisms. It could be extended to relax theseassumptions_ but the extension would require considerable assi_tance
from qualified exobiologists. Since this work could profitably wait un-til the results of the Viking mission have been used to update the current
understanding of the Martian environmentj detailed modeling of the p>io-
logical properties of Martian organisms (assuming they exist) was not in-cluded in this research. Instead_ these conservative simplifying assump-
tions were made for assessment of the probability of back-contamination:
(i) Living organisms exist on Mars.
(2) Specific numbers of living Martian organisms are depositedin various areas of the return spacecraft. Chapter III and
Appendix A give the detailed assumptions used in our illus-trative calculation. (Our base calculation assumes 104
Martian organisms are contained in the return sa_.ple. The
sensitivity of our results to changes in this assumption
is explored in Chapter IV.)
(3) Organisms contained in sample canisters remain viable onthe return trip to Earth. Specific assumptions are made
about the viability of organisms that may be accidentally
present in other locations_ such as on the exterior of thespacecraft.
(4) Under all specified manners of release_ the probability' that any given Martian organism is able to find conditions
sufficient for survival is independent of whether or not
other released organisms survive. Given survivalj the
probability of growth is assumed to he unity. (These arevery conservative assumptions. Using a survival probability
for each organism of i0-3_ contamination is virtually as-sured if I0_ or more Martian organisms are released to the
biosphere.)*
In view of the conservative nature of these assumptions_ we refer to
the methodology as being designed to assess the probability of "potentialback-contamination." The assumptions above imply that the probability
A relatively easy method for improving the growth model would be to notethat there are certain overall generic traits that Martian organisms
must have before they can survive on Earth; for instance_ the ability i
to withstand Earth's temperature_ pressure_ and partial pressures of i
• free oxygen_ nitrogen and water vapor_ as well as the ability to sur-
vive without ozone_ ultraviolet radiation_ and the uncommon chemical i! compounds found in abundance on Mars. The approach would be to assess
the probability that organisms adapted for life on Mars would possess .,_those traits. If the organisms did not possess those traits_ they could
not grow on Earth. No contamination would result_ independent of the
i"_ { I_ number of Martian organisms released to the Earth's biosphere.
1977018855-017

estimate will be an upper bound for the probability of actual back-
contamination. A more accurate assessment of the probability of actual
back-contamination would take into account the probability of each of the
conditions I, 2, and 3 above, and a more realistic representation of thesurvival mechanism, which is very conservatively represented by condi-tion 4.*
2.3 Mission Phases
i i .For purposes of developing planetary protection policy_ the MSSR
iI has been described as consisting of three distinct phases.I Phase 1 con-
_ sists of the trip from Earth to Mars and the landing of a descent vehicle. on the Martian surface. Phase 2 begins with sample acquisition, includesy
transporting the sample from the Martian surface to Earth's vicinity,
atmospheric entry of tllecapsule, recovery of the sample_ and transporta-
I tion to a PSRL. Phase 3 includes the initial quarantine and sciuntificinvestigation of the sample in the PSRL and ends with either certification
! that the sample is safe for release or, in the event that it is not re-
! leased, with its sterilization.
i The illustrative application of the methodology presented in ChapterIII considers the risk of back-contamination due to Mission Phase 2;
i that is, events up to the recovery and transport of the sample to the
1 PSRL. The method of analysis, however, is equally applicable to the risksof contamination following quarantine within the PSRL.
This refinement can be accomplished in a straightforward manner. The
probability of actual back-contamination is approximately given by
P(AC) = P(L) × P(S) × P(C) × P(G) ,
where P(AC) = probability of actual ba=k-contamination,
P(L) = probability life exists on Mars_
P(S) = probability s_ples contain Martian organisms that
_i survive return to Earth,P(C) = probability of potential contamination computed by
_ the methods described in this report,P(G) = probability returned Martian organism would reproduce
_ on Earth.
A more accurate formula would allow P(G) to depend on the mode and loca-
tion of release of Martian organisms. One may even want to recognize
_ various levels of contamination.
A number of biologists hold that the probability of there being life on
Mars that can survive in the Earth's biosphere is very small. Thus, the
!i probability of actual contamination may be many orders of magnitude be-
low the results computed in this report.Ill7
1977018855-018
/
I 2.4 Proposed Methodology
Our procedure for assessing the risk of contamination from MSSR mls-
sions is a variation of the procedure generally advocated for determining
the probability of rare events. The probability of a rare event is dlf-
ficult to assess for two reasons. First, because the event is rare, in-
dividuals responsible for the assessment typlcally have little or no per-
sonal experience with the event. Second, there is a basic difficulty in
distinguishing small probabilities. If an event is very unlikely, is itsprobability 1 in I0,000 or 1 in I00,000? If the consequences of the event
are sufficiently important, such a distinction may be crucial.
The procedure generally used is designed to alleviate these two dif-ficulties. Essentially, it involves breaking the rare event down into
more familiar events whose probabilities can be evaluated more easily.
The analysis is accomplished by identifying a set of mutually exclusiveinitiating events and the possible sequences of events that might follow
each initiating event.
For the present problem, the rare event is back-contamlnation froman MSSR mission. A pertinent example of an initiatinR event is failure
of a parachute system designed to slow Earth entry o_ the capsule contain-
ing the Mars sample. Parachute failure may initiate contamination through
a number of event sequences, two examples of which are: (i) water impact,followed by capsule breakup, followed by survival of at least one organism;
and (2) water impact, followed by no breakup, followed by capsule loss,
followed by pickup and sample exposure by an unauthorized individua].
Figure 2.1 is an illustration of this approach as a tree structure.The far-left branch in the diagram represents the initiating event (para-
chute failure). Each branch point, or node, in the tree represents an
event that may or may not occur following parachute failure. Each path
through the tree represents a sequence of events. Some of the paths lead
to a condition of contamination, and some do not. (Chapter III containsa detailed discussion of this figure.)
When the event is broken down in this way into sequences of more
familiar events, the attention of the assessor can be directed toward theprobabilities for each event in the sequence. The laws of probability
theory may then be used to combine these probabilities to yield the prob-
ability of the rare event as a whole.
Analyzing back-contamlnatlon in this manner has several advantages:
* It allows the systematic elucidation of all possible Occur-rences relevant to back-contamlnation.
• The individual contingent events are much easier to imagine
than one complex sequence of events taken together, and the
!! contingent probabilities of simple events are easier to assess
_' _, than an overall probability of occurrence of a complex series
_ of events.
1977018855-019
19770188_-020

"-]-,T-[........................................................................I........................l.......................T..................................IT----T"....................... ......_i̧ o
t k • One can integrate the knowledge of different experts in differ-ent fields.
• One can combine probability estimates of various types,based on historical failure rates, trajectory calculations
given uncertainty in command and control operations, oran expert's subjective Judgment.
2.5 A Comparison with Earlier Work
The methodology proposed in this report is essentially the same as
tha' described in a previous report by Yen.s Yen's approach, like ours, m-is to break down the event of back-contamlnation into risk elements Initi-
• atlng sequences of events that may lead to the release of Martian organ-
isms into the Earth's ecosystem. Most of the risk elements and many ofthe estimated event probabilities used in the example application in
Chapter III are, in fact, taken directly from Yen's work.
_' The principal difference between the present approach and the approach
followed by Yen is in application. As will be illustrated in Chapter III,our approach relies heavily on the graphical aid of tree representation
to clarify and organize the assumptions made in the analysis. Representa-tion of the possible sequences of events as a tree structure makes it
easier to determine whether events may be treated as probabilistically
-_ independent, or whether the dependency among these events must be explic-Itly represented in the analysis. In particular, this approach makes it!clear that the approximation often referred to as the Sagan-Colman form-ulas cannot be used to evaluate the risk due to equipment failures that
result in large numbers of organisms being released into the Earth's en-
viromnent, even if the probability of the release event is very small.Chapter III discusses this issue further.
In addition to our reliance on tree representation, the present ap-proach emphasizes the use of sensitivity studies to indicate the areas
for which extension of the analysis is most important. Chooter IV lllus-5
trates the use of sensitivity studies as part of the methodology for ana-
lyzing the risk of back-contamlnatlon. It is also shown that sensitivity
studies may be used to identify the impact that improvements In reliabilityand other design changes can be expected to have on contamination risk.
,. _ 10 :;
I :iJ! t
1977018855-021
III ANALYSIS OF THE REFERENCE MISSION
As described in Section 2.4, the methodology for assessing back-
contamination proDabillties requires: (i) identification of the possiblesequences of events leading to potential back-contamlnation and theirrepresentation as tree structures, (2) assessment of the conditional ,_
probabilities of each of these events, and (3) use of the laws of prob-
ability to combine these probabilities to obtain the overal _ probabilityof back-contamlnatlon. This chapter illustrates the application of the
methodology to a reference MSSR mission. Although we refer to the analysisas yielding a "probability of back-contamlnation," the reader should bear
in mind that the quantity calculated is actually the probability of
potential back-contamlnatlon, as defined in Sect_o[ 2.2.
3.1 Definition of the Reference Mission
The reference mission is a conceptual MSSR mission; its basic
structure was provided by Mr. Alan R. Hoffman of JPL, the technical mon-itor for this project. However, many of the mission details have been
_ filled in by the authors. Since the risk of back-contamination is found
to be quite sensitive to several of the detailed assumptions of missiondesign, specific analysis results must be considered illustrative rather
than definitive. A more careful numerical evaluation, using the methodsdemonstrated in this chapter, should be performed for the actual missiondesign effort.
The reference mission is an unmanned Mars mission designed to returnmultiple unsterilized samples via a Mars orbit rendezvous with directEarth entry. Choice of the rendezvous mode for sample return requirestwo different vehicles at Mars: an orbit vehicle inserted into orbit at
arrival and a lander. While on Mars, surface samples collected by thelander are individually sealed inside sample canisters, which in turn
are sealed inside a single sample container. The seals are designed to begas-tlght (brazed, for example). Following ascent and during docking,the sample container is passed to the Mars orbit vehicle and sealed in-
side the sample compartment on board the Earth-return vehicle. This sealis also deslgned to be gas-tight.
The return flight takes 340 days. The trajectory of the returnvehicle is assumed to be biased away from Earth to reduce the risk ofaccidental impact, and four midcourse corrections are assumed to berequired.
At Earth arrival, the Earth-entry capsule separates from the
return vehicle and puts itself on the desired entry trajectory. After
1977018855-022
........._- _,,._ .......,rr,,,-_,_-v,_,,.r_-.....''_--_';<'_'_'_" ,r'_,_r"_ -_r _:' •
separation and deflection, the Earth-entry capsule is decelerated by the :_i atmosphere to subsonic velocity. At an altitude of about 20 km. a parachute
is deployed to further decelerate the capsule to terminal velocity. To!! improve reliability, two redundant parachute systems are used Parachute
deployment is based on static pressure. The capsule is recovered by an air
, snatch at an altitude of about 1.5 km. To reduce the likelihood of capsule
;; loss in the event of a missed snatch, the capsule is equipped with a
beacon, is designed to float, and will release a highly visible dye on !_< high-velocity impact. Once recovered, the capsule is transferred to a PSRL.!i_
_ Additional mission details are assumed as needed for the calcula- _
teens and are noted in the following pages. In particular, Appendices
_il A through D contain more detailed quantitative assumptions about mission
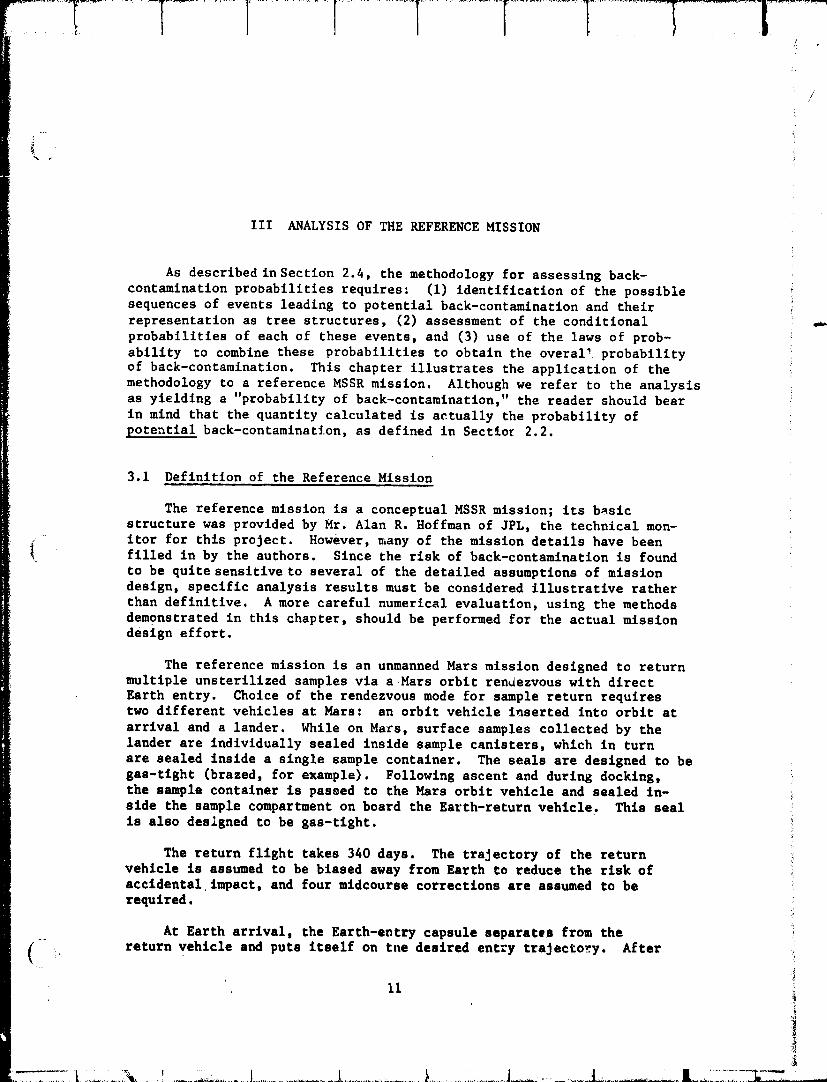
i_i. design and the reliability of various mission components, systems, andoperations. ._
il 3.2 Assumed Numbers and Locations of Martian OrBanismsil
7 As stated in Chapter II, assumptions are made concerning the numbers
i_ and locations of Martian organism on the return vehicle. The reason-i
ing that led to specific assumptions is presented in Appendix A.
!i_: Figure 3.1 illustrates these assumptions. It is assumed that thesample canisters contain a total of i0_ Martian organisms. It is also
,_ assumed that the process of sealing the canisters inside the sample con-tainer encloses an additional I00 organisms inside the container. The
i! assumed presence of organisms on the outside of the container during!.
_ rendezvous accounts for the contamination of the sample compartment on
board the Earth-entry capsule by an addltlonal I0 organisms. Finally, it is!
assumed that the exterior of the return vehicle may be contemlnated due to
i_i transfer of organisms from the Mars ascent vehicle. However, it is: assumed that this probability is sufficiently small, due to docking
geometry, so that after ejection of the docking cone the expected number, of organisms on the exterior of the return vehicle is assumed to be 0.02.
Based on relative surface areas, 107o (0.002) of the expected surface or-! ganlsms are assumed on the Earth-entry capsule.* "_
iii
!_ *Mathematically, the "expected number of Martian organisms" is defined
as follows. Suppose that with probability Po there are no organisms
present, with probability PI there is one organism, with probability _P2 there are two organisms, and so forth. The expected number of or-
ganisms, n, is then, ,I
ip i <!t
..... An expected number of organisms less than one implies that most likely( ) no organisms will be present.
1977018855-023
I The sensitivity of the results of the analysis to these assumptions!,_ is investigated in Chapter IV. .;
3.3 Risk Elements
The first step in assessing the probability of back-contamination
for the reference missl .n is to idenrify the mission events that ini-
tiate back-contamination risk and the resulting sequences of events
that could lead to contamination. In all cases the possiblity of contamina-
tion can be traced to some initiating risk event• Por example, faulty
sealing of a sample canister may ultimately result in contamination through
leakage of organisms into the Earth's environment. Or, transfer of sur-
face organisms from the Mars ascent vehicle to the Earth-return vehicle
during rendezvous may ultimately result in contamination from organisms
brought to Earth on the suzface of the entry capsule.
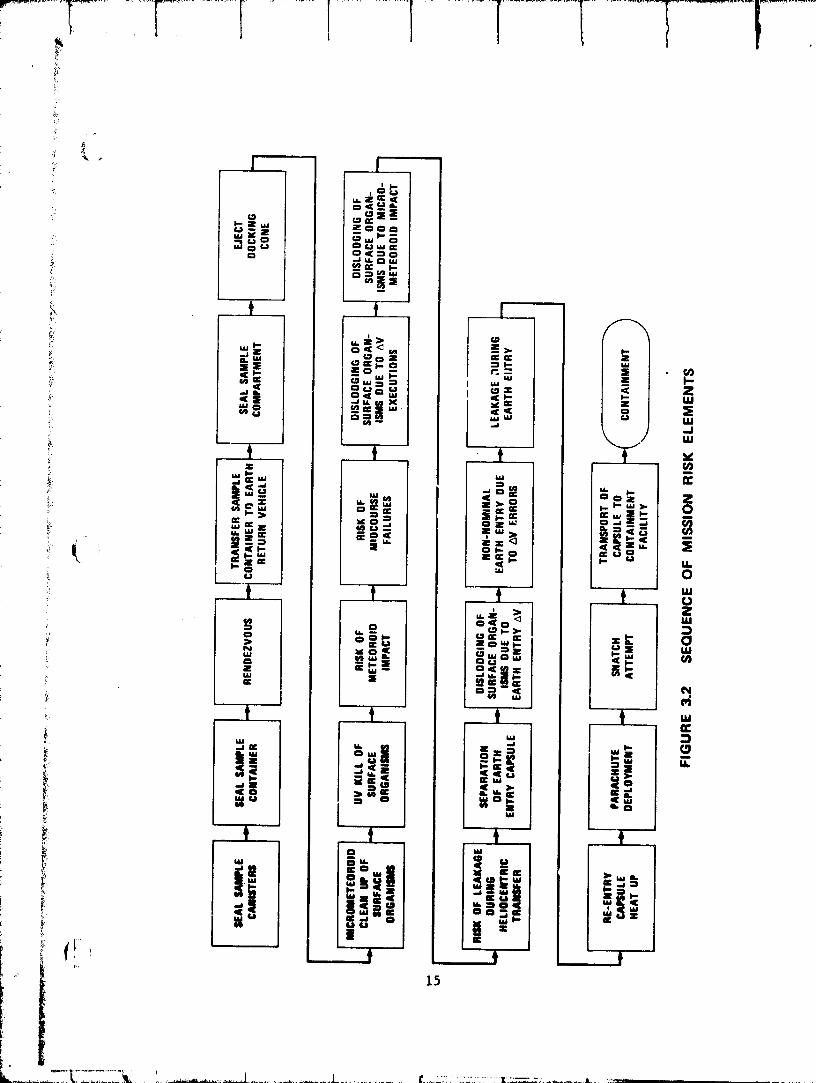
The reference mission was analyzed to identify the major risk
events that may initiate a sequence of events leading to back-contamination(see Fi-ure 3.2). The events depicted initiate a risk of back-contamination
_ either because they influence the numbers and locations of Martian organ-_ isms on or inside the Earth-return vehicle, or because they are events for° which a non-nomlnal outcome would increase the likelihood of the release
i of organisms. An example of the latter is parachute deployment If
i_: the parachute system fails, the risk of contamination due to containment_ failure is increased substantially.!!
,5
3.4 Modes of Back-Contamination
Contamination can occur by three distinct modes as a result of the
referenc_ mission. First, contamination can result from a major equip-_ merit failure causing the release of al! or a substantial part of the
sample into the Earth's biosphere. Failure of the parachute systemfollowed by capsule breakup at impact is one example. Second, contami-
_: nation may result from leakage of one or more of the biological seals.
Third, contamination might result from surface contaminants_ that is,
: organisms located on the exterior of the Earth-return vehicle.
i; To simplify the development of a tree diagram for the various se- iquences of events that potentially lead to back-contamination, each of i
._ these three modes of contamination was considered separately, i
3.5 Major Equipment Failure
i Figure 3.3 shows a gross tree diagram of the sequeutial and logical
i. relationships the most significant risk elements for major equipmentamongfailure. The first element is midcourse corrections. As noted in the
_:" description of the reference mission, the spacecraft return trajectory
! {i z4
|' 1 i / ..... ilL............
1977018855-025
g770_8855-028

1977018855-027
[ will be initially biased away from Earth to reduce the chance of acclden-J
tal collision. To obtain Earth capture_ a series of velocity changes(AV corrections) are applied. These are considered a risk element be-
cause an incorrect midcourse correction (Includlng loss of spacecraft
: control) may InltJ_te a sequence of events leading to contamination. For
example, Earth capture might be followed by uncontrolled atmospheric entry,capsule breakup, and survival of at least one organism.
The next risk element of major equipment failure is Earth injection.
i_ Earth injection occurs when a course correction causes the capsule to enter
Earth's atmosphere at a velocity and angle that permit sati_factozy oper-
_ ation of its hea_ shield and parachute system. Unsuccessful Earth injec- o,-
tlon will either result in no Earth capture of the capsule or atmosphericentry in a manner that is beyond the design limits of the capsule entry
systems. The latter, of course, poses a risk of contamination.
: Given successful Earth injection, the next risk element is parachute_ deployment. Recall that the design of the reference mission calls for
two parachute systems for increased reliability. Assuming successfuli
parachute deployment, the next risk element is the snatch attempt. Failure
of the snatch attempt can result in contamination, for example, throughbreakage of the capsule upon surface impact. Finally, there is a contaml-
nation risk of accidental release during transportation of the sample tothe PSRL.
"- One additional risk element shown in Figure 3.2 falls into the cate-
i _. _ gory of major equipment failure (i.e._ a risk element that potentially in-
itiates a sequence of events leading to contamination through uniutentional
release of all or a major portion of the sample into Earth's environment).
This is the risk of meteoroid impact. The risk of meteoroid impact was not
included in the gross tree structure of Figure 3.3 because the probabilityof this event was judged to be small relative to the other risks consid-ered.*
f
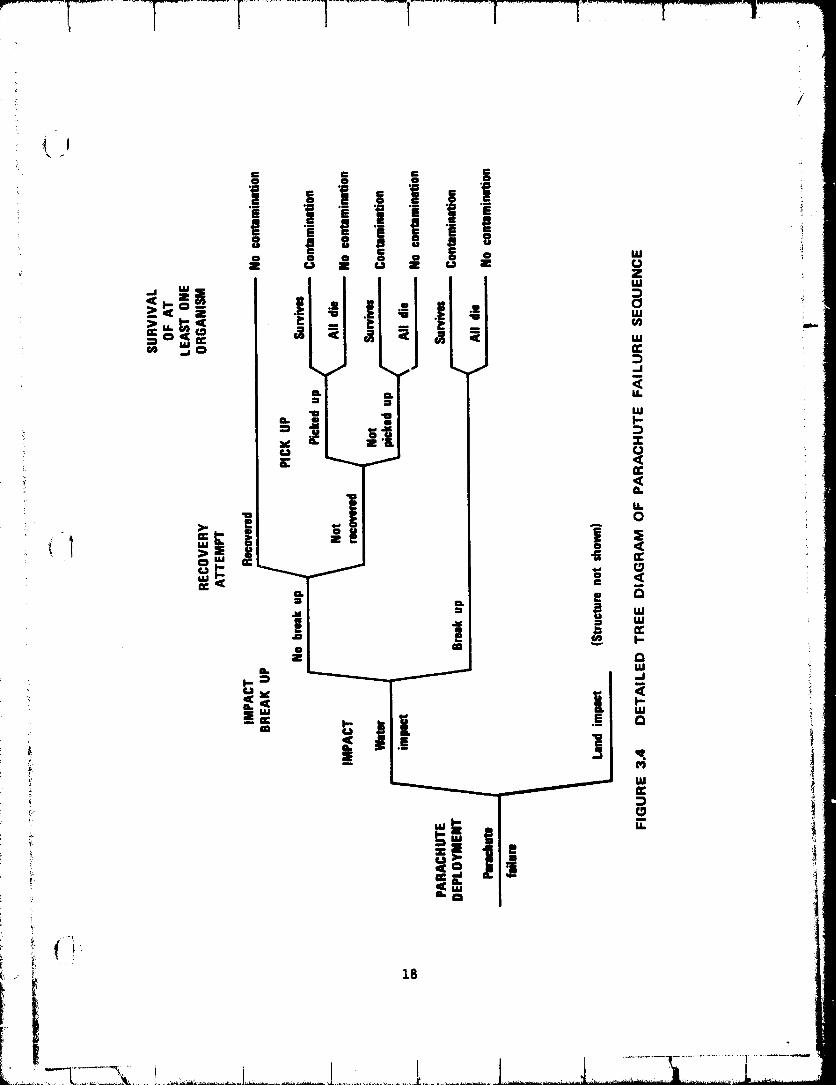
! 3.5.1 Detailad Tree Diasram
?
!, Non-nomlnal outcomes for each of the risk elements (indicated by the
L dashed lines in Figure 3.3) would result in some probability of back-
_ contamlnatton. To determine the probability o_ contamlnatlon associatedwith each of the risk elements, the sequences of events that determine
whether or not contamination occurs were identified and represented asdetailed tree structure.
Figure 3.4 shows the detailed tree diagram developed for parachutefailure. The tree structure simply lays out each possibility for each
*Yen2 estimates the probability of meteoroid puncture of the spacecraft_i! to be on the order of 10 -7 .
17 :i
i,i
] 9770] 8855-028
/
_._.........._7._._-_,,,._..,._ _ I I
1977018855-029
\ event relevant to contamination that would follow failure of the parachute.If the parachute fails, the first pertinent event is whether the capsule
hits water or land (land is defined as including all hard or soft nonliquldsurfaces). This event is important because it influences the likelihood
that the capsule and sample will break up and the likelihood that any
released organisms will survive. (In Figure 3.4, only the detailed struc-
ture following watez impact is shown; a similar structure, not shown,
follows land impact).
If the capsule hits water, it either remains intact or breaks up.If it breaks up, then either all of the organisms die, or at least one
survives. For the analysis, contamination was defined as the survival
of at least one Martian organism, If all the organisms die, there is nocontamination.
The sequence of e_ents Just descrlbed--water impact, followed byimpact breakup, followed by survival of at least one organism--is onepossible sequence of events that might follow parachute failure. This
sequence corresponds to one path through the tree structure. Another
posslbl{lity is water impact with the capsule remalnlng intact. At this
point the tree shows that there are two possibilities: The capsule mayor may not be recovered. If it is not recovered, contamlna_ion can result
from pick up of the capsule and exposure of the sample by an unauthorizedindividual. If the capsule is not picked up, contamination can result
from sample release due to the natural deterioration and physlcal decay
{ 1 of the.capsule and sample container.
detailed tree structure was constructed for the non-nominal out-
comes for each of the risk elements in _he category of major equipment
failure. These detailed tree structures were then appended to the grosstree structure of Figure 3.3. Figure 3.5 shown the generic tree structure
together with the detailed tree structure for the risk element parachute
failure. The complete tree structure is shown in Appendix B.
/
3.5.2 Conditlonal Probabilities of Contamination
i_: The various paths through the tree structure of Figure 3.5 represent!,
_ a decomposition of the risk of contamination from major equipment failure• _nto particular risk elements and sequences of events that may or may not
lead to contamination. The next step in the analysis is to assess the
_, probability of contamination associated with each of these possible!_ sequences of events; that is, to assess the probabilities of contamination
that should be associated with the end points of the tree structure. We_, refer to these probabilities as conditional probabilities of contamination.
The rules of probability theory will then be used to combine the condl-
i! tional probabilities into an overall probability of contamination.
i As an illustration of how the conditional probabilities of contamina-tion may be determined, consider one path through the tree structure ot
• Figure 3.5: Suppose that midcourse corrections are successful, earth
(.I19
|
1977018855-030
1977018855-031
" k
' : - ! injection is successful, the parachute system fails, and the capsule hits :water and breaks up. Capsule break-up is defined as an event duringwhich all of the seals guarding at least one of the sample canisters are
i broken. Under these circumstances an appreciable fraction of the bloload
of the capsule, assumed to be 104 Martian organisms, will be released.The conditional probability of contamination associated with this sequence
_! is the probability that at least one of the organisms thus released will
I !i survive.
ii The probability that at least one of N organisms survives dependsi_ on the probability distribution describing the fraction f of Martiani organisms that are able to survive on Earth under the given eondltlons
of release. Assessment of this distribution is not an easy matter since
:_ it requires answers to questions of the following form: If a large ._I _ number of Martian organisms were released on Earth in the manner described
!.: above, what is the probability that not more than 0.1% of those organismswould survive? Figure 3.6 shows the form of cumulative distribution that
[ : might be constructed from judgments of this type. It can be shown math-
[ _ ematlcally that this distribution is consistent with an expected fraction_- of surviving organisms of approximately 10-3 and a probability of roughly
i _ I0"'2 that at least one organism survives.* Therefore, assuming the distri-;_ ! butlon of Figure 3.6, the conditional probabllltyof contamination given
i _ successful mldcourse corrections, successful earth injection, parachute
i failure, and water impact with break up is 0.01. "":t
_ - Application of this method for assessing the conditional probabilities
il i (- I of contamination would require the assessment of distributions for the- fraction of sur_iving organisms for each path through the tree structure.
i { Such assessments could be _acilitated by the development of biologicalmodels for Martian organisms that reflect post-Vlking knowledge of thei i Martian environment.r
_: The computation of the probability that at least one out of a number!_ of organisms survives can be simplified greatly if an assumption is made_: that the life or death of each organism is statlsti:ally independent of
the llfe or death of any other organism. With this assumption, the only
assessment that must be provided is the probability that any given
organism survives. If this probability is p, then the probability thatat least one out of N released organisms survives, denoted PC, is givenby the Bernoulli model:
Pc 1 - (I - p)N
I If we assume that any given organism released into the Earth's environment
in the manner described above has a probability of survival of 10-3, then
_: *For further discussions and an illustration of how this calculation is
] performed, see Harrison and North. 4)
!i_ 21
: .............L...._t 1 J............1.q77n1RRKK_no

,!
/
_| if 104 organisms are released, the Bernoulli model gives a probability
i _ of 1-(4.5 x 10⁻⁵) that at least one of those organisms survives. Thus,
for this example the independence assumption yields a computed conditional
_ probability of contamination for the given path that is roughly i00 times as
large as that cPlculated using the more general model (i compared to 10-2).A consequence of the Bernoulli model is that if the number of organisms
exceeds the reciprocal of the probability of survival by an order of mag-i_ nitude or more, then the probability of contamination is nearly unity.I5 Clearly, the assumption of independence is a very conservative one.*
An even simpler model that has been used2 is the approximation tot.
the Bernoulli model,
_ PC " i - (i - p)N _ P × N for p × N << i .
• _ This approximation is sometimes referred to as the Sagan-Coleman formula_Since for this example p X N = l0 >I, the approximation is obviously
_i not valid in the analysis of the probability of back-contamlnation from
major equipment failure.
i Since data from the Viking mission were still accumulating at thetime of this analysis, and since the development of biological modelsdescrlbing the possible survlval mechanisms of Martian organisms on
i_ Earth was outside the scope of this study, the simplifying assumption
iI of statlstical Independence was made for the analysis of the reference! mission. However, note that a reduction in the calculated probabilityi would be expected if more detailed calculations of the distributions
for the fractions of organisms surviving were carried out.
! Figure 3.7 shows the tree structure for major equipment failure with
the conditional probabilities of contamination for several paths through
' the tree computed using the Bernoulli model. The complete tree structure
i with all of the conditional probabilities of contamination is given inAppendix B.
v
3.5.3 Event Probabilities
t We have already assessed the probability of contamination associated
with each the tree for failure. Thepath through diagram major equipment
_i next step is to determine the relative likelihood of the paths. A typi=ali assessment required is the following: Suppose midcourse corrections are
accomplished as planned and Earth injection is within the nominal cone
*It can be shown that the probability computed from the Bernoulli modelwill always be equal to or greater than the probability that would becomputed from an equivalenu model that assumes sume degree of dependence.
.... 23
1977018855-034
!i
iL
I, i f !! .|., i 7, T, % J -_ ; !
•"::J -- i ->' i!_J ,, I , I -_ -!z_x . "1 :i
i _ --, - I _/ / I is '" i
"IYI..:, '" ! ili _ • II '!
_ E_ E
"'--L_J !-, i, _ iILl _' z IEl '- I 13 I
! ;I II _ i- 'L_ _J _= I
_-,. B I . I _ a
i>>._ : i ,,I . I_ i--- -I i!il I : I
" ! I,I Ii. :il J l, ,,', . !
"--_--""L _'J
" - illi! .
(
10770"18855-035
................. •t..........¸
il i of entry, what is the probability that the parachute will fail? Naturally, i_.. the answer to such a question requires that details of the mission design
_._ be specified. The reliability of the parachute system depends, for example,_ on specific details of the Earth-entry trajectory, including the velocity
and altitude at the time of parachute deployment, as well as details of the_i parachute and deployment systems, _ncluding the extent to which redundancy _
is used to improve reliability.
_ The authors worked with various individuals at JPL to specify the
details of the reference mission and to estimate reasonable probabilities_ for each of the outcomes of each of the events shown as branches in the
!_ tree structure. The assumptions made and probabilities agreed upon aresummarized in Appendix B. Figure 3.8 shows some of these probabilities.
'_ The estimated probabilities for the outcomes for each of the events are
i noted under the corresponding branches in the tree. A tree structure with
event probabilities represented "in this way is called a probability tree.
_i The event probabilities shown under the branches are conditionedon the paths leading to the branches. For example, the probability underthe branch labeled IMPACT BREAKUP is 0.3. This means that the assessed
!_ probability that the capsule and sample container will break up on impact_ is 0.3 assuming successful mldcourse corrections and nominal Earth injec-
tion with parachute failure followed by water impact.. Any changes inthese assumptions would result in assignment of a different probability of
impact breakup. For example, successful Earth injection followed by para-
{ chute failure followed by impact with a hard (nonliquid) surface (asequence not represented in Figure 3.8) is assessed to have probability
_ of 0.99 of impact breakup.
3.5.4 Computation of the Probability of Back-Contamination
_ The probability tree provides a graphical aid for combining event prob-_ abilities with conditional probabilities to obtain the overall probability_ of back-contamination. The method of computation uses what is commonly
'_ called a "tree roll-back procedure," which is based on the expansion prin- _'_
i ciple of probability theory: The conditional probability of back- !
._ contamination associated with any node in the'tree is found by multlplyin_
the probability of each branch emanating from that node times the condi-
tional contamination probability associated with the subseqent node on_, "' that branch and then adding the products for all branches leading from
that node. Using this rule, the conditional contamination probabilityassociated with each node in the tree can be computed starting first with
the right-most nodes and using the results from these calculations towork back through the tree.
i
Appendix B reports the detailed results of applying the roll-back iiprocedure to the probability tree; Figure 3.9 summarizes some of theseresults. The reader may verify that the conditlona: contamination prob- _!iabilities# shown in boxes under nodes in the tree, equal the sum of the _
" products of the branch probabilities times the conditional contamination _!.... probabilities of subsequent nodes, i
9770 8855-036

_._: _ - ._-i; ,-ii_! i_ _L| s _ ... ... ._ |, = Z II: o. 5
_, ,-._:. I "_IS._
Ill.& I ,.. ,.. ,- u Z III
: . - :,'.t:uJ iv. IS. lip ._.. IIIN.o I -I_.i i -,__.,
"' __:_ I I1_i :1. I .s.!! |,!_
_r _ " " I .I. _1 I ..J:.:_= =" I ,-.ll_ it_1 I E "So E .____'4C CI_ 0 ,t _. m_' , .. I ,,I -I I -.z|,_ =" I Y I "" !
!
i: ='_"-'L'_ .._• . |
*' " N |"_!I=-
"e t!1_ _i
27 ,
i
]
$
L__.:I[12-.,,.......!,....L.....i............................._.........................t ......±............:_..__........................_-7-,4
1977018855-0:38
Each of the conditional contamination probabilities is the proba-
bility of back-contamination, given that the events leading up to that
node have occurred. In particular, the numbe_ in the box under the left-most node at the trunk of the tree, 1.6 X I0 -_, is the overall (prior)probability of contamination for the risk category major equipment failure.The conditional probabilities in the boxes under the o_her nodes In the
tree show how the probability of contamination would change, given theoccurrence of various events. For example, the box uvder the node "impact"leading from the branch "parachute failure" contains the number 0.67.
This indicates that if the mission proceeds in such a way that midco_rse a-corrections are successful, Earth injection is successful, and then theparachute system falls, at the instant Just prior to impact the probabil-ity of contamination is 0.67, or 2 chances out of 3.
3.5.6 Identifying Major Sources of Risk
The contribution of the risks associated with any node in the proba-bility tree to the total probability of contamination can be obtained
by multiplying the conditional probability at that node by the productof the probabilities along the path leading to the node. Probabilities
obtained in this way are shown in the ovals in Figure 3.10. The results
show that the basic risk elements in the category of major equipmentfailure contribute to the probability of contamination as follows:
Table 3.1
BASIC RISK ELEMENT PROBABILITIES
Contributed ProbabilityRisk Element of Back Contamination
Midcourse failure 9 X 10 -7
Earth injection 9 X 10⁻⁶
Parachute failure 1.3 X 10⁻⁴
Snatch failure 1.7 × 10⁻⁵
Transportation accident 2.9 X 10⁻⁶
Total 1.6 × 10⁻⁴
Of the total 1.6 × 10⁻⁴ probability, 1.3 × 10⁻⁴ is due to sequencesof events involving parachute failure. Thus, parachute failure is thesingle most important risk element in the category of major equipment
i_ failure. This contribution is due to the assessed probability of 2 x I0 -4
( of failure of the parachute system and the fact Chat contamination follows
ii "_; ,
llml--_--l""kl :..:........ _ ...... ' ...... 1...... L_ ..................... [ ................. _......._ ...... _ .. :.:':::r_:_--.Z-- i ....... lII [i '
1977018855-039
7 ;i'
_<,
7_
-ill,.. _, 7: _, _"'II _ _
i I il I I _.i| t I '<'al_"= I -ll :='1 I .i..l_ll° ': I .i_11".1%I _"iil!il I.l ,,
= =ll=II ,ti
L' • • • ;J
_!_ ,_ .
_-_ _rl _ _1 _,,"
.,<.- ,.N l_,tN
"_ ',.Hi
' !l"-i l|i' I"-"l/"]| |[_L__C_._ : _"_ "• |
f i,,I ill II
"7 i I "
:i !
r, .i( ,.= !
'!!
1077010055-040

i
/
- parachute failurewi_h a probabillty of 0.67. As described in Appendix B,the probability 2 X 10 -4 of parachute failure is based on an assumption of
_ two redundant parachute systems.
3.6 Leakage
This s_:ction describes the analysis of the probability of back-contamination due to leakage of one or more of the reference missionts
biological seals. As described previously, the reference mission relieson triple seals to contalnMartlan organisms: a sample canister seal, "a sample container seal, and a sample compartment seal. Thus, leakage
of organisms from the sample requires failure of not one but three bio-
loglcal seals.
The r_,_ of contamination through leakage, however, is not llm:ted
'_,_ to leakage of organisms from the sample. Both the interior of the
sample compartment and the interior of the sample container may becontaminated with Martian organisms. Therefore, in addition to consld-
i ering the risk of leakage of organisms from the sample, the analysis
also considers the risk that seal failure may lead to release of viable
i organisms that contaminate the interior of the sample compartment andsample container.
The nominal assumptions for the numbers and locations of Martian
1 i organisms were depicted in Figure 3.1. The assumed total number of Martianorganisms in the sampl_ is lO_. It i_ assumed that the interior of the
sample container is contaminated with an additional i00 organisms and
that the sample rompartment becomes contaminated during rendezvous with
an additional ]0 organisms. Appendix A contains a discussion of consid-
erations that led to these assumptions. In Sectlon 4.3, the sensitivityof analysis results to the assumptions is checked.
In Figure 3.22 two risk elements in the category of leakage areshown: The risk of leakage during heliocentric transfer of the Earth-
return vehicle and the risk of leakage during entry of the Earth-entry
capsule. For an organism leaked during heliocentric transfer to cause
contamination, it not only must survive atmospheric entry, it must alsosurvive ultraviolet radiation during transfer and be captured by Earth.
Thus, organisms leaked during heliocentric transfer are less likely to
result in back-contamlnatlon than organisms leaked during atmospheric
entry. If a faulty seal results in leakage during heliocentric transfer,
additional leakage during Earth entry is, of course, highly llt.ely; how-ever, the pressure difference during entry will make particle escape moredifficult.
_ Since there are three sources of leakage (sample compartment,_ sample container, and sample canister) and two mission phases during
!_ which leakage may occur (heliocentric transfer and Earth entry), thereare six leakage modes to consider, With the exception of canister leak-
_ age during heliocentric transfer and compartment leakage during heliocentric
30
'I9770'I8855-04'I
!
t transfer, each of the leakage modes is assumed to result in the releaseof l_ of the exposed organisms. In the other two case_ 10% of the organ-isms within the sample are assumed eJ_:cted since the pressure differeuceunder these failure modes will favor _.eakage.
Figure 3.11 shows the probability tree constructed for analyzingthe probability of back-contaminat_en due to tilerisl;of leakage during
Earth entry. A similar tree for leakage during helior-ntric transfer is
given in Appendix C. The conditional probabilities of b_-contamination
associated with the various paths through the tree are computed using the /
Bernoulli model as was done for the risk category of major equipmentfailure. Notice that for each leakage mode, the number of exposed organ-
isms is small compared to the reciprocal of the assumed probability of
survival per organism, 10"2. In this case the Sagan-Coleman approxima-
tion applies -- the probability that at least one organism survives is
very nearly the product of the number of organisms released and th_ prob-ability of s_rvival per organism. ::
The probabilities under the branches of the tree in Figure 3.11 are
the probabilities assessed for the leakage events. The failure probabilityof the seal on the sample compartment is assumed to be i chance in I00.
If the sample compartment seal fails, the sample container seal is assumed
to fail with probability i in I00. Similarly, failure of both the com-
partment and container seals will be followed by failure of a canister
seal with probability I in i00. An explanation for these assumptions is
t given in Appendix C.
Conditional probabilities of contamination obtained using the roll-
back procedure are shown in the boxes under the nodes of the tree. Thetotal probability of contamination shown in the box under the initial nodeis 1.3 X 10⁻⁶• Table 3.2 summarizes the contributions from the various
risk elements. Also included in the table are the results oL_ the analysisof heliocentric leakage. One may observe from these numbers that the lar-
gest component of the risk during Earth entry is due to the risk of com-
partment leakage. Leakage during heliocentric transfer contributes an in-
significant risk compared to leakage during Earth entry.
3.7 Surface Contaminants
This section summarizes the analysis used to obtain the contribu-
tion to the probability of back-contamlnatlon due to organisms that maybe located on the exterior of the Earth-return vehicle. Bccause the
mission design calls for a Mars-orblt rendezvous, the return vehicle_. does not come into direct contact with either the Martian surface or
atmusphere. However, organisms may be transferred to the return vehicle
:,:: during the docking maneuver with the Mars-ascent vehicle.
!i
1977018855-042

:+
1977018855-043

_ Table 3.2 i_:LEAKAGE RISK ELEMENT PROBABILITIES
Risk Element IProbability of Back-Contamination
Organis-.- leaked during iheliocentric transfer--
Compartment leakage 2.7 x I0"I0
Container leakage 1.7 x 10⁻¹o
Canister leakage 6.3 x I0-II
Organisms leaked during
Earth entry--
Compartment leakage 1.2 X 10⁻⁶ !
Container leakage 2.0 X 10⁻⁷ i
Canister leakage l.l X 10-7 !
3.7.1 Number of Organisms Transferred to the Earth-Return Vehicle !i
As shown in Figure 3.1, the expected number of organisms assumedto be tr&nsferred to the Earth-return vehicle during rendezvous is 0.02.
This number depends critically on docking geometry. Figure 3.12 showsthe orientation assumed for the ascent vehicle and the orbit vehicle _ust
before docking. The orbit vehicle will approach the ascent vehicle andorient itself so as to accept transfer of the sample container. The two
vehicles may keep station in this orientation for several days. Then theorbit vehicle will move forward and latch itself to the ascent vehicle.
The sample container will be transferred to the sample compartment insidethe Earth-entry capsule. Finally, the orbit vehicle and Mar_-ascent
vehicle will disengage with the docking cone remaining attached to theMars-ascent vehicle.
Transfer of surface organisms can happen when particles are dislodged
from the ascent vehicle by the slight bump that may occur when the ascentvehicle and orbit vehicle make contact. Most Of the particle transfer
that occurs in this way will depend on a llne-of-sight path to the Earth-
return vehicle. In this respect, the docking con= functions as a blo-shield.
Transfer may also occur during the statlon-keeplng phase. There will
be no llne of sight then, but particle transfer may result from the inter-
play of solar radiation and electrostatic forces.
With this geometry, and assuming worse case conditions, the expectednumber of organisms transferred was calculated to be 0.02. The detailed i
assumptions behind this estimate appear %n Appendix C. i!
v_
• 33 _
1
1977018855-044
!:
1977018855-045
_.r_ _ -.....:,_._ , :°-._-,_.r-_̧' _,,.-T....... T- r ..............1........................T.....................l TT__._ ---_t
!_ (_) 3.7.2 Paths Followed by ,SurfaceContaminants :_
if Organisms located on the exterior of the Earth-return vehicle may i_ enter the Earth's environment either on the surface of the Earth-entryi capsule or because they are dlslodged prior to capsule recovery and fol- _ :
low a trajectory that results in Earth capture. Figure 3.13 summarizes _ ..:the assumptions made concerning the expected fraction of surface organ- ;
' isms that would follow various paths that may or may not lead to con-_ tamlnatlon. Since the numbers of organisms are less than one, these may
be interpreted as probabilities that a given organism would follow eachof the posslble paths.
0.02 "*"
_ EXPECTEDi NUMBEROF ORGANISMS!( ON EXTERIOROF_: EARTHRETURN
VEHICLEFOLLOWING Meteoroidejection!!_ DOCKING
_ 6.Sxlr 3
!:_ 30
_ 340
. ' 5,3x10.,4
i:i 3rd Midcoum cermction
, :, 1.4x10"4
i {: 4th Midcoumcorrection
i_ EEC Separation 1.4x10.4
i t'hlr2
_: _ injution
Nominal 1.4x10"iinlNvofy
' 1.4xl0"3
i FIGURE 3.13 ASSUMED PATHS FOR MARTIAN ORGANISMS ION THE EARTH-RETURN VEHICLE EXTERIOR
35
1977018855-046
i:
'_ As indicated by the figure, 30 percent of the surface organisms are.I'
assumed to be ejected by vibrations caused by mlcrometeorold impact The
_ ejection is assumed to be roughly uniform over time. Those organisms that
are ejected during the last 30 days of the 340-day return trip are assumedaccessibTe to possible Earth capture. Organisms dislodged by the last itwo mldcourse corrections are also assumed to be available for Earth
capture. Of _he remaining organisms, I percent are assumed dislodged
i:_ during each of the last two mldcourse maneuvers. Of the organisms thatare not dislodged, 10 percent are assumed to be located on the Earth-
il entry capsule; all others remain on the discarded return vehicle. Of the
organisms on the entry c_psule, i percent are assumed to be dlslodged by! Earth injection.
i!
i 3.7.3 Summary of Results--Surface Contaminants[
For a dislodged organism to cause contamination, it must surviveheliocentric transfer, be captured by Earth, and survive once it enters
_ Earth's atmosphere. An organism that remains on the entry capsule may
:_ cause contamination only if it survives heliocentric transfer and capsuleheatup during entry. The tree structures that represent these seouences
of events are given in Appendlx C together with the results of the treeroll-back. The table below summarizes the contamination probabilities
i contributed by each of the risk elements"i
Table 3.3
SURFACE ORGANISM RISK ELEMENT PROBABILITIES
Risk Element Probabilit y of Back-Contamination
_. Organisms dlslodged by
Third midcourse correction 4.2 X 10"12
: Fourth mldcourse correction 2 1 X I0 "11
Micrometeoroid impact 2.1 X 10 "10
i Earth injection 1.4 X 10 "9
_ Organisms on capsule:_
_t_ exterior at Earth entry 1.4 X 10 "8
_ Total probability due to_:i surface organlsms: 1.6 X 1O-8
i3.8 Suwry of Results of the Analysis of the Reference Mission
Table 3.4 summarizes the probabilities of back-contaminatlon foreach of the three risk categories analyzed. The total probability isdue almost entlrely to the risk of major equipment failure. Most of the
C,36
1977018855-047
o
_" Table 3.4
SUMMARYOF BACK-CONTAMINATIONPROBABILITIESFOR REFERENCE MISSION
Probability of Major Source: Risk Category Back-Contaminatlon of Risk
Major equipment failure 1.6 X 10 -4 Parachute failure
Leakage 1.2 × 10 -6 Leakage of sample com-partment seal during EarthEntry "
Surface contaminants 1.6 × 10 -8 Organisms located on EarthEntry capsule at time ofEarth Entry
Total 1.6 × 10 -4
i probability of back-contamlnatlon associated wlthmaJor equipment failurei is due to the risk of parachute failure and the fact that parachute failure" leads to contamination with rather high probability. The rlsk of contamin-
ation due to leakage is two orders of magnitude lower, and the probabilltyof contamination due to surface contaminants is smaller still. In the
category of leakage, the major source of risk is leakage of the compart-• ment seal during Earth entry. In the case of surface contaminants, the
1 major source of risk is organisms Chat remain on the Earth-entry capsulethrough Earth entry. Surface organisms dislodged by vibration are oflittle importance.
Note that the extension of the analysis to include a model for thesurvival of released Martian organisms may indicate that the risk ofcontamination due to major equipment failure is less important relativeto the other two categories than is Indicated here. As discussed in
Section 3.5.2, the conservative assumption that each Martian organismlives or dies with independent probability has the effect of virtuallyguaranteeing survival of at least one organism if a large enough numberof organisms are released. Since major equipment failure is the onlyrisk category that may result in a large number of organisms beingreleased, more detailed modeling of the generic capability of Martianorganisms to survive on Earth will affect the risk assessment for majorequipment failure more severely than the other two categories. If, forexample, a model for survival such as that showu in FiKure 3.6 were usedInstead of the independence assumption, the assessment for the probabilityof back-contamination due to major eq,lipment failure would be reduced byabout two orders of magnitude. The assessments for the other two care-
, gortaavould be Insignificantly affected.
_ Since the major risk sources Identified occur during the Earth-entryphase of the mission, It may be useful to consider alternative ways of
37 _i
1977018855-048

i CJ) _ retrieving the sample that bypass direct Earth entry of the capsule. Forexample,AppendixE discussesorbitalrecovery,in which the capsuleis re-!i trleved in Earth orbit, sealed in a protective box, and then returned with
! the shuttle for analysis in an Earth-based receiving laboratory. The pre-!_ limlnary analysis in Appendix E shows that thls approach has the potential
_ for a significant reduction in the probability of back-contamlnatlon at asomewhat higher mission dollar cost.
5
_, The next chapter investigates the sensitivity of the results of this
i chapter to the detailed numerical assumptions made in the construction ofthe probability trees.
k
}? 1
f i
i i1
£.
k- :
(,.
g ( "
?
ii '
i il _il
i
! i
3_
' 1 ........ r .......... I
1977018855-049
i: IV SENSITIVITY ANALYSIS OF THE REFERENCE MISSION
i, Many ad hoc assumptions were made in arriving at the probability ofback-contamination for the reference mission of 1.6 X 10"4. * Although the
method of analysis -- probability theory and the principle of decomposi-
tion -- is perfectly general, the particular probability trees that were
i:_ developed to model the reference mission embody many assumptions that
could be relaxed through more detailed modeling. _"
_ For example, an assumption is made throughout the analysis that the
_ sample canisters contain a total of 104 organisms. Instead, additionalnodes and branches could be added to the tree structures to represent other
possibilities. One branch could be added to indicate an outcome of the
!_ sampling that resulted in no organisms being contained in the samples,i another to indicate an outcome in whichonly a very small number of viable
organisms were obtained, and a third to represent a situation in which a
_ very large number of organisms were obtained. Another mathematically
equivalent approach would be to compute the probability of contaminationfor all possible numbers of organisms in the sample. A probability dis-.
tribution for the number of organisms in the sample could then be devel-
- oped, and the probability of contamination w(uld be obtained by integrat-
i b ing the result over this distribution.
Clearly, the analysis could be improved in many such areas. Fre-
quently, though, it is most efficient to construct a relatively simple
probability tree model, as we have done here, before attempting to cap-
ture all of the available knowledge relevant to the problem with a more
complicated model. This is because the simple model can be used as abasis for sensitivity studies that identify those aspects of the initial
analysis whose refinement is most likely to influence analysis results.This chapter describes sensitivity studies conducte _ on the analysis of ithe reference mission and the implications of the results of these studies.
4.1 Individual and Joint Sensitivities
Two kinds of sensitivity studies were performed on the probability _tree models developed for the reference mission: single variable sensi- i
_ tivities and cumulative sensitivities. In a single variable sensitivity, analysis of a model, one of the inputs to the model is varied over a range_ of values while the other inputs are held constant. This determines the
Again the reader is reminded that this is the probability of "potential 1back-contamination," not the probability of "actual back-contamination."...... See Section 2.2 and the comment at the beginning of Chapter III.
1,.. ...... 39 1
N
1977018855-050
_ _1_ ............... _ ............. _ ...... _ _ _ _ ..... _ ...... _ _ __ _ ......... ___ _ q_ i _T_ _ _ _ ......... _ _ _ _Ir E" t_ _ ............... "_ ......
f_" ii
_ sensitivity of the model to that input. In a cumulative sensi- +outputs
+. tivity analysis, two or more inputs are simultaneously varied by propor-tional amounts while observing the effect on the outputs.
_ For the analysis of the probability of back-contamination from the_ reference mission_ the model consists of probability tre_, The inputs
+_ to the model are the various assumptions that are either exp|.icitly or
implicitly embodied in the tree_ such as the event probabilities noted
_ under the tree branches and the numbers and locations o_ Martlan organ-isms assumed for the computation of the conditional contamination prob-_: abilities at the ends of the tree, The outputs of th_ model are the_! probabilities of back-contamination produced by the roll-back procedure_ _--
_ in particular the overall probability of back-contamination associated+. with the initial node of the tree,
Thus_ single variable sensitivities were obtained for the reference!! mission analysis by individually varying each assumption and recomputing_ the tree roll-back values. Cumulative sensitivities were obtained by
_ simultaneously varying several assumptions. The following sections sum-
marize the results. The work is organized by risk element category.
_ _.2 Major Equipment Failure
• Figure 4.1 is a sensitivity result showing how the probability of
r_ contamination by major equipment failure depends on the number of organ-.,.. isms assumed in the sample. Specifically_ the figure shows the probabil-
ity of back-contamination plotted as a function of a factor by which thenominal assumption is multiplied. If the factor is unity_ one has the
original assumption of 104 organisms in the sample_ which gives thepreviously obtained probability of contamination of 1.6 X I0 "_. If the
_ assumed number of organisms is decreased by a factor of 0.I_ to I03_
then the probability of contamination drops slightly_ to about l X 10 -4 •i
As illustrated by Figure 4.1, as long as there are 10 3 or more organ-isms in the sample_ the probability of contamination is about 10-4. Ifthe number is dropped below 103_ then the probability of contamination
ii' drops almost proportionally.
i!:! Figure 4.2 shows two more sensitivity results in the category of
fi major equipment failure. One curve shows how the probability of con-_+ tamination depends on the assumed probability of Earth capture of the _
capsule in the event of midcourse failure. Interestingly_ it shows thatthe risk of back-contamlnation is rather insensitive to the Earth-capture
probability. For the reference misslon_ the bias of the return traJec-
tory away from Earth could be relaxed so that probability of Earth cap-ture in the event of midcourse failure was increased by a factor of 100_
to 10-2; this would have an insignificant effect on the total probabilityof contamination from the mission.
The second curve in Figure 4.2 shows the sensitivity of the probe-
(., bility of back-contamination to the probability of parachute failure. I
+ i
1977018855-051
_.._ 10"I
! I I I I
.
i!: 10"2--
"_ 1040
.[
i:
',0o'0::'}!: .... 1o-5 ) -{ I:::
i:
f, IO4 -
' C
i am 10.7 _ -- :
Ii_: 10-1 l I I I
0,001 0,01 0,1 1 10 100FACTORBY WHICHNOMINAL VALUE I$ MULTIPLIED
]
FIGURE 4.1 PROBABILITY OF BACK-CONTAMINATION SENSITIVITYTO NUMBER OF MARTIAN ORGANISMS IN THE SAMPLE
_: 41 i,
1
1977018855-052
Io-, I I I I0,001 0,01 0,1 I 10 I00
FACTORBYWHICHNOMINALVALUEIS MULTIPLIED
FIGURE 4.2 SENSITIVITIES TO PARACHUTERELIABILITY AND PROBABILITY_], OF EARTH CAPTURE IN THE EVENT OF MIDt:OURSE FAILURE
! ,
: ' _, 42 ,i •
I
1977018855-053
I..............................T.................................................r.......................-V-T
ii_ |_ Parachute failure is the dominant risk element in the category of major!::_ equipment failure; even allowing for two redundant parachutes, the
il_ probability of parachute failure contributes 1.3 X I0-4 out of the total_ probability of 1.6 × 10⁻⁴. As illustrated in Figure 4.2, if the proba-
billty of parachute failure is higher than assumed, the p=obability of
_ contamination increases rapidly. On the other hand_ the maximum reduction
_ in the probability of contamination that can be obtained by improving
_ the reliability of the parachute alone is less than one order of magnitude.
Because the parachute system contributes such a large proportion of_: the total back-contamlnatlon risk, little would be gained by decreasingi!_ the contribution of other risk elements. On the other hand, the overall_ contamination probability will be increased if one increases the risk from
_i other risk elements to a level commensurate with She risk from parachute
_: failure. Figure 4.3 illustrates this point with sensitivity results toi_ the probability of missing the snatch and the probability that the cap-_ sule will be broken apart during the snatch attempt, perhaps by collision
with the airplane attempting the snatch Figure 4.4 shows the sensitivityi_i_:_ to the chance of non-nominal Earth injection (which could be caused by
_,_ the solid fueled rocket failing to burn completely). A drastic reductionin any of thes_ probabilities does not materially reduce the overall
_ probability of back-contamination; a large increase is eventually reflectedin the overall probability.
Figure 4.5 shows the sensitivity of back-contamination probability
_ to the probability that the capsule would fail to be recovered _ the• _ event of parachute failure. (The chances of recovering the capsule de-
pend on the nature of tne surface it hits -- water, land, etc. -- and on
whether or not it breaks up on impact. Recovery of the capsule in the
event it has broken up implies the recovery of the major part of the sam-
ple.and the initiation of efforts to sterilize the area.) If recovery isassumed, the probability of contamination is reduced by about a factorof three from the nominal case.
Figure 4.6 shows the sensitivity of the probability of back-
contamination to the probability o£ survival of a single organism. This
calculation has been performed using the assumption of independence dis-.: cussed in Section 3.5.2, which provides a very conservative estimate for
the probability of contamination under a glvenmethod or ,ample release._ The contamination probability is insensitive to increases in the survival
_: probability assumed for an individual organism. This is because the in-
,_ dependence assumption virtually guarantees contamination for most pathsthrough the major equipment failure probability tree that result in _am-
!_ ple release.
_ Figurs 4.7 shows a series of cumulative sensitivities. Curve a,I reproduced from Figurs 4.2, shuws the sensitivity of contmination
probability to the probability of parachute failure. As the probabilityI of parachute failure is reduced by about an order of magnitude, the
effect on back-contamination risk lavals off. At this point, the other
_i _, risk elements begin to make major contributions_ and reducing the chance
1977018855-054
10-1• I ] I I
_ ] 10-2 --
_ .i " Probabilitycapsulebreaks I
10.3 i o,duringsnatchattempt.. J
i!.
Probabilityof missed..J
snatch(nominal= 10-2)
(] .=lo-_-
10-o _
_ lo-7_
lo-a I I I Io.ool o.ol o.1 1 lo loo
FACTORBYWHICHNOMINALVALUEIS MULTIPLIEB
FIGURE 4.3 SENSITIVITIES TO SNATCH FAILURE PROBABILITIES
1977018855-055
10.-1I I I 1
10-2 --
10. Probabilityo non-nominalEarth" injection(nominal= 10"6).5El__10.4_)-
_J
_- 10-5 _
l0iI.-
Zi
a; 10_6I-,"ZO&,,)
¢,J
10.7 -
10-1 I I I I0.001 0.01 0.1 1 10 100
FACTORBY WHICHNOMINALVALUE iS MULTIPLIED
FIGURE 4.4 SENSITIVITY TO PROBABiLiTY OF NON-NOMINALEARTH INJECTION
1977018855-056

.]
10-1 I i | I
f"
10.2 _
I :• Probabilityof no recovery _;10-3 - in the eventof parachute _ ..!i
o failure(nominal= 0.4 to 0.el :._r
Alwaysrecovered
n,, 10.5 - -"
_ ,
Z
_10 4 -
o!
Un_
10-_ - _,I
i'
] 1
I: lo-o I I I I ....o.oos o.ot o4 t so loo
FACTORBY WHICHNOMINAL VALUE IS MULTIPLIED
FIGURE 4.5 SENSITIVITY TO PROBABILITY OF NO RECOVERY iN THEEVENT OF PARACHUTE FAILURE
1977018855-057
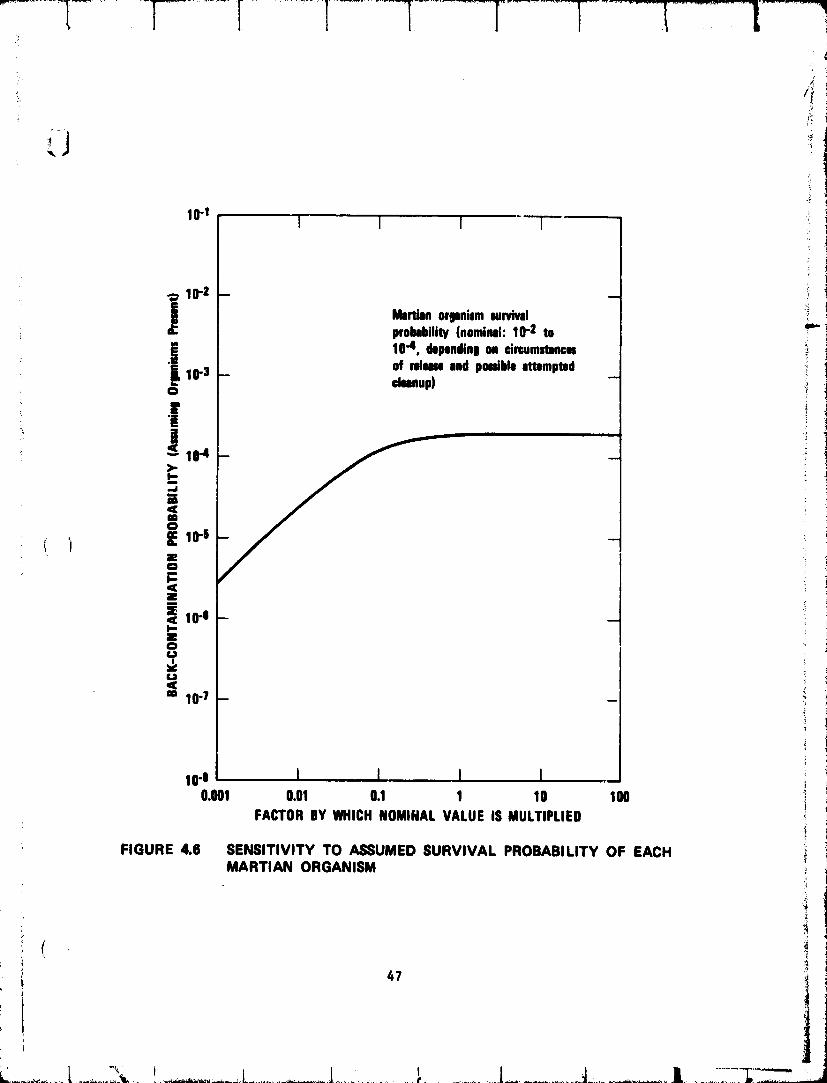
10.1 .,I I I U
10-2 -
Mortmnorganismmurvivll '): probability(nominal:10"2 to 'r'"
10"4, kpondin! on drr.ummnm i
• of ndmmandpotableattempted -_10"3 -- cleanup) --
1 10"1
< 10"0 -X
? iU
m 10.7 _ _ ._
104 I I I I0,001 0.01 0.1 1 10 100
FACTOR DY MILCHNOMINALVALUEIS MULTIPLIED _ IFIGURE 4.6 SENSITIVITY TO ASSUMED SURVIVAL PROBABILITY OF EACH
MARTIAN ORGANISM
( i
47 i
1977018855-058

• ]
t
10.1 I I I I
I f _..o Nominalvalues
.: ',,>. a
.J
1 onc10-5 co.z Cumulativesensitivitiesto variationso in probabilitiesof:n
z.- dae a. Parachutefailurei b. "a" pluscapsulebreakupduring< 10"6 eo,- snatchzo c. "b" plusmissamat_b
d. "c" plusnon-_ominalEarthXu injectionf
.m 10.7 e. "d" plusuecidentel.dime during -transportto PSRL
f. Simulteneoudyvary probabilities _iof ell riskdements
lO-I I I I I0.001 0.01 0.1 I 10 100
FACTOROY WHICH NOMINALVALUE IS MULTIPLIED
i, FIGURE 4.7 CUMULATIVE • SENSITIVITY RESULTS
i
'*i 48
III
] 9770] 8855-059
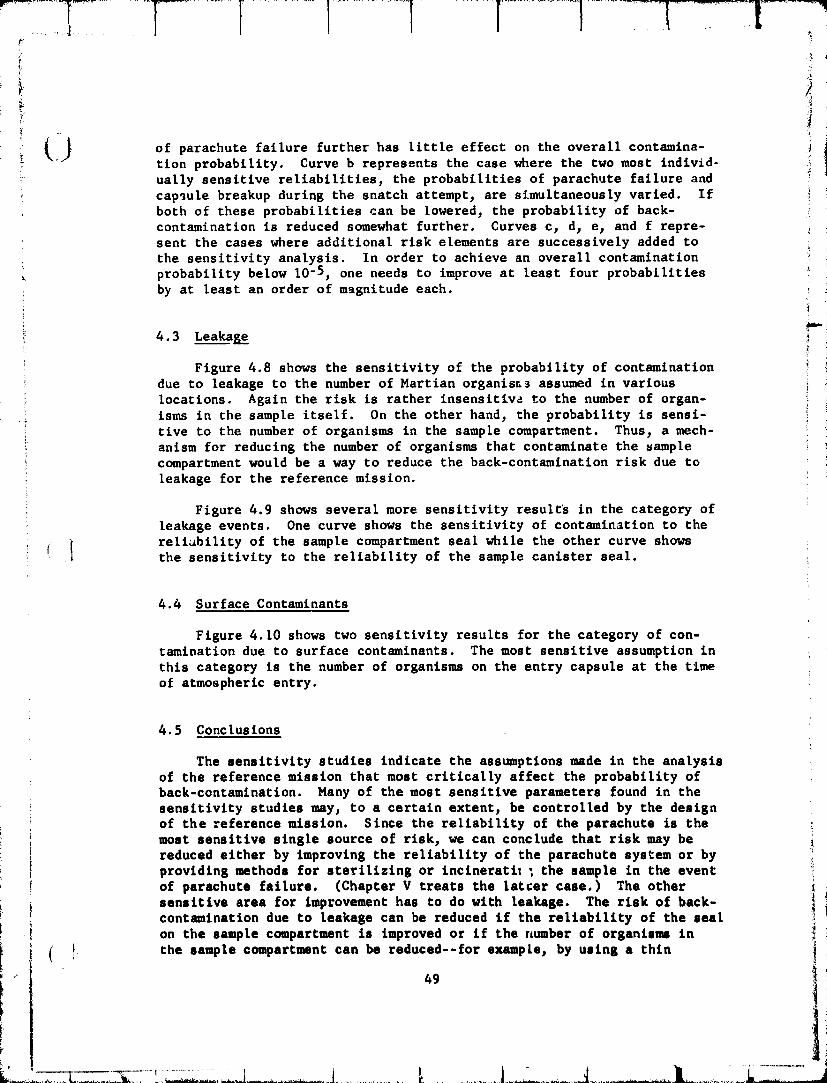
-T-I ......T- ........[ I r I--T L
, _2 .!
£} of parachute failure further has little effect on the overall contamina- if
tion probability. Curve b represents the case where the two most individ-ually sensitive reliabilities, the probabilities of parachute failure andcapsule breakup during the snatch attempt, are simultaneously varied. If iboth of these probabilities can be lowered, the probability of back-
contamination is reduced somewhat further. Curves c, d, e, and f repre-
sent the cases where additional risk elements are successively added to
the sensitivity analysis. In order to achieve an overall contamination _
probability below 10-5, one needs to improve at least four probabilities _ :i
by at least an order of m_gnitude each.
! 4.3 Leakage
Figure 4.8 shows the sensitivity of the probability of contamination !
_ due to leakage to the number of Martian organis_3 assumed in various i
i locations Again the risk is rather insensitiv_ to the number of organ-
. isms in the sample itself. On the other hand, the probability is sensi-tive to the number of organisms in the sample compartment. Thus, a mech-anism for reducing the number of organisms that contaminate the sample
compartment would be a way to reduce the back-contamination risk due to
leakage for the reference mission.
Figure 4.9 shows several more sensitivity results in the category of
leakage events. One curve shows the sensitivity of contamination to the
i reliability of the sample compartment seal while the other curve showsthe sensitivity to the reliability of the sample canister seal.
4.4 Surface Contaminants
Figure 4.10 shows two sensitivity results for the category of con-tamination due to surface contaminants. The most sensitive assumption in
this category is the number of organisms on the entry capsule at the timeof atmospheric entry.
4.5 Conclusions
The sensitivity studies indicate the assumptions made in the analystsof the reference mission that most critically affect the probability ofback-contamination. Many of the most sensitive parameters found in thesensitivity studies may, to a certain extent, be controlled by the designof the reference mission. Since the reliability of the parachute is the i
most sensitive single source of risk, we can conclude that risk may be ireduced either by improving the reliability of the parachute system or by iproviding methods for sterilizing or inctneratit _ the sample in the eventof parachute failure. (Chapter V treats the latter case.) The other _
sensitive area for improvement has to do with leakage. The risk of back- t! contamination due to leakage can be reduced if the reliability of the seal _
on the sample compartment is improved or if the number of organisms in i
the sample compartment can be reduced--for example_ by using a thin t
' 49
i I
1977018855-060
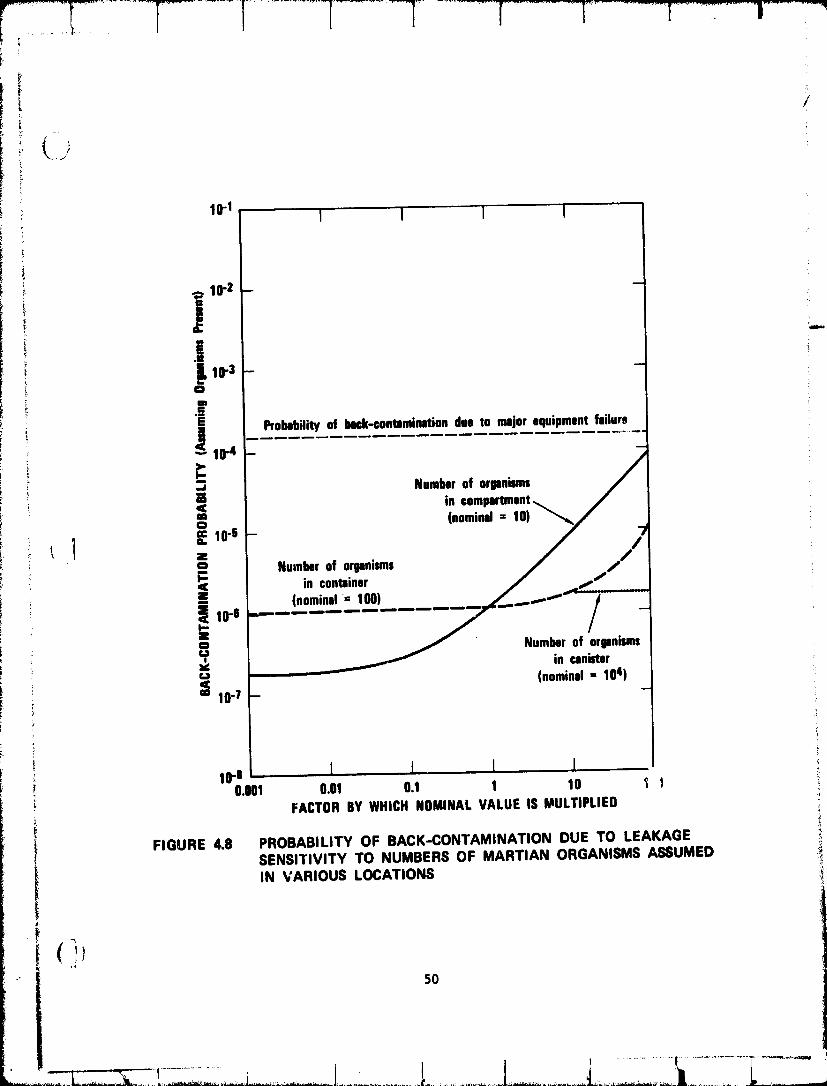
10-II I I I
_ _ IO'Z --
J
i104
Probabilityof buk-contaminationdueto majorequipmentfailure
ANumberof organisms
| in comp.rtment_ / I
i [ , _ (nominal=10) y ,/__'_ ? 1O'S
/ Numbero,orp.i._. / _t" I_' | in ©onminer / _4"_ I
[ (nominal= 100) ,_dr _,'"'--'_-"-'_
,I '°"F ............. ----7_ Num !r__,o, .ni,min canister
(nominal-- 104)m 10.7 _
" i
_, lo-' I I I I ,.0.001 0.01 0.1 1 10 _ 1
_' FACTORBY WHICHNOMINALVALUE IS MULTIPLIEO
FIGURE 4.8 PROBABILITY OF BACK-CONTAMINATION DUE TO LEAKAGE;i
SENSITIVITY TO NUMBERS OF MARTIAN ORGANISMS ASSUMED ,i_i
IN VARIOUS LOCATIONS _*i
.4
5O
1977018855-NR1
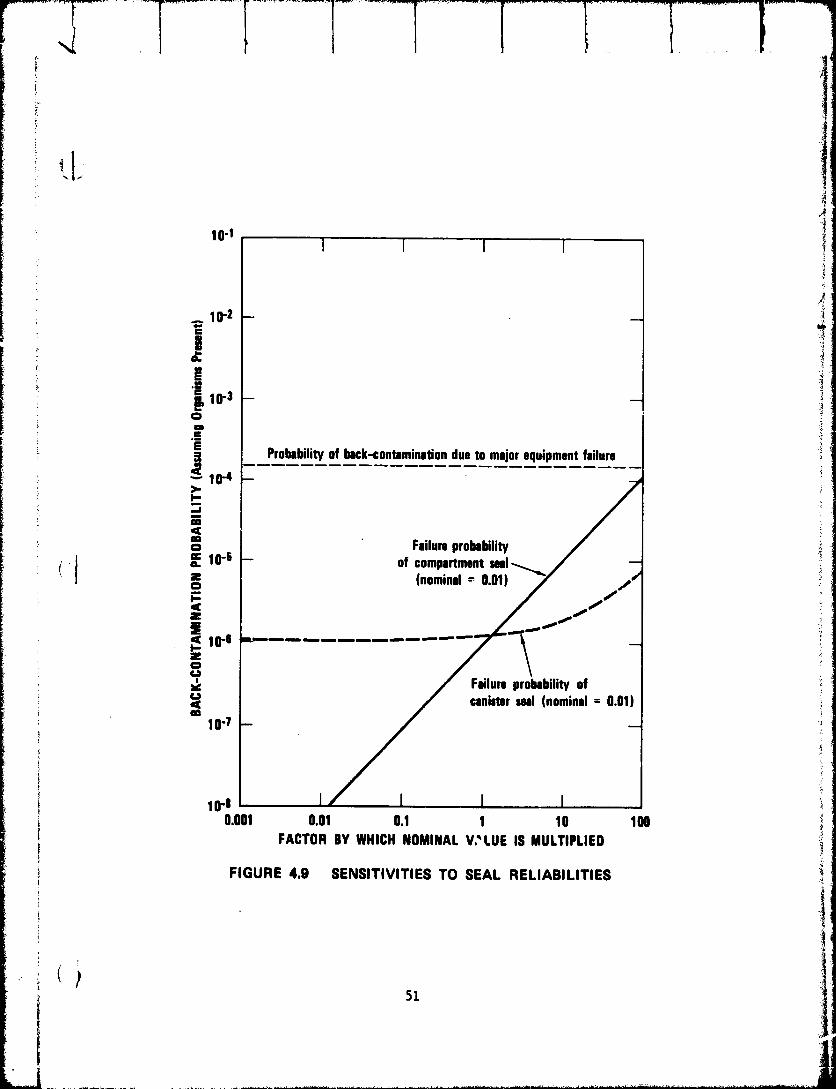
,4
!lo-I I I I 1 i
_ 111.2-
10-3 --O
.__
Probabilityof back-contaminationdueto majorequipmentfailure '_10.4 -- !
< i: Failureprobability _
t cc 10.5 of compartment• O.
ae (nominal = 0.01)oI.-
10-8 \zO _
Failure probability of ::CA !< canisterseal (nominal = 0.01) IOO
10.7 -- '
i lo-_ I i I :_ii 0.001 0.01 0.1 1 10 100[ FACTOR BY WHICH NOMINAL V;LUE IS MULTIPLIED
,7
FIGURE 4.9 SENSITIVITIES TO SEAL RELIABILITIESi
.. /_ _
51
J i
1977018855-062
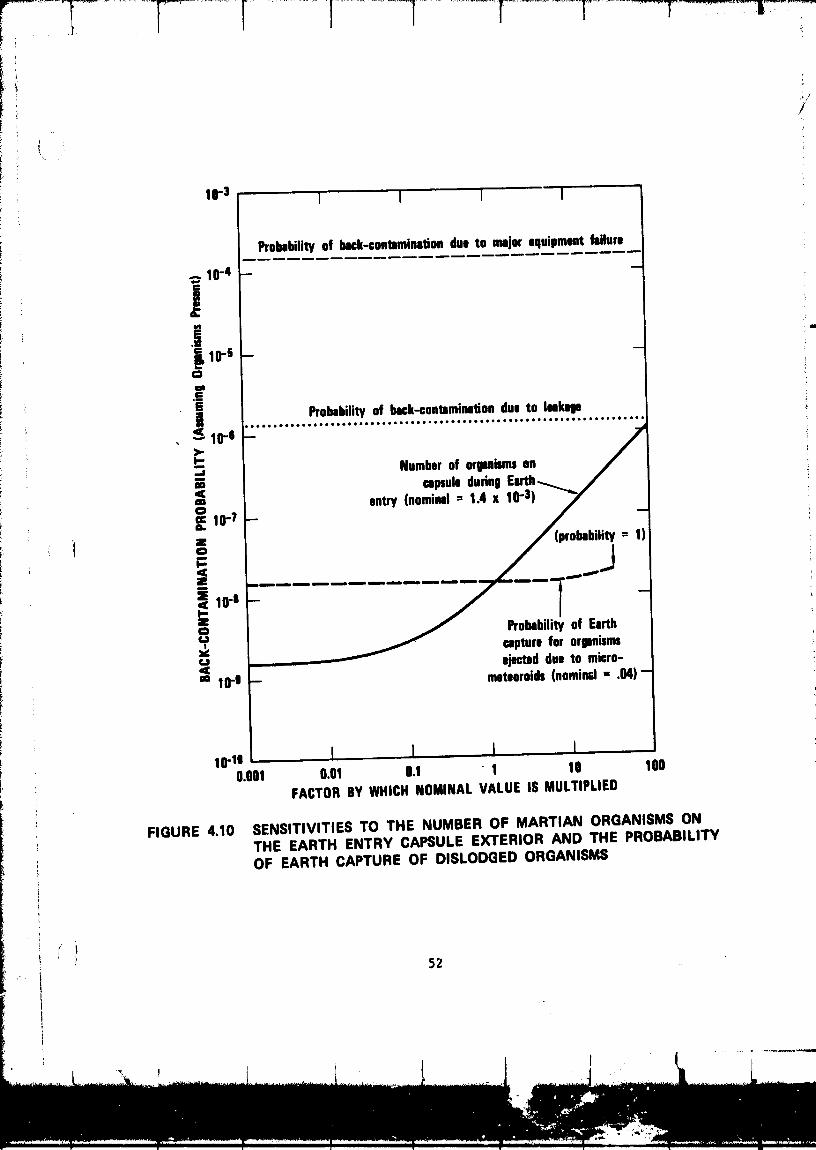
i .i
i _ 10"3 1 I 1 I
Probability of back-contamination due to majm equipmentfailure
10-4 --
i_' 10"5
Probability of back-contaminationdue to leakageg: _ 10-0
Numberof organismson
• = l =p,ul.do.qE,_,...._/ I
i '1 c_ - i
" capture for organisms,_ ejected due to micro-Do 10.9 _ meteoroids(nominml,, .04)-
10-1o I I l Io.oo1 o.oi o.s 1 lO 1DO
FACTORDYWHICHNOMINALVALUEISMULTIPLIED
FIGURE 4.10 SENSITIVITIES TO THE NUMBER OF MARTIAN ORGANISMS ONTHE EARTH ENTRY CAPSULE EXTERIOR AND THE PROBABILITYOF EARTH CAPTURE OF DISLODGED ORGANISMS
197701££55-(qR.q
! exothermic coating that is ignited Just prior to the sealing of the sam-
" pie compartment.* It is difficult to reduce the probability of back-contamination by more than about an order of magnitude because this wouldrequire simultaneous attention to several factors.
The most sensitive assumptions of all, of course, are the assumptionsabout the existence and viability of life on Mars. The analysis describedin Chapter II! not only assumes that life exists, it &ssumes that organ-isms will be transferred to the spacecraft and that the organisms in the
i samp}es will survive the return trip to Earth. A very conservative assump-!,
_. tion is made concerning the survivability of Martian organisms on Earth.
i_ The assumption is that each released organism independently survives ori dies with the same probability, depending on the manner of release. As
described earlier, this has the effect of virtually guaranteeing that at, least one Martian organism will survive if a large enough number are re-
leased.
To obtain the actual probability of back-contamination, the proba-bility of contamination computed for the reference mission must be reducedby consideration of the probabilities that (1) life exists on Mars, (2)living organisms w_ll be transferred to the spacecraft and survive the
! return trip to Earth, and (3) Martian organisms will be capable of sur-_ viving on Earth. Therefore, the computed probability of back-contaminationi,
is most sensitive to the conservative assumptions made'concerning Martian
i biology. We must conclude that an analysis designed to assess the proba-
,, _ bilities of possible characteristics of Martian organisms is essentiali ( [ for an improved estimate of the actual risk of back-contamination.
i
s*As mentioned in a report by Jaffe et al., the risk due to leakage could
also be reduced by installing one or more transducers to detect pressurechanges in either the sample compartment or sample container. Signift-
: cant pressure changes would indicate seal failures that may be sufficient
(*T cause for a mission abort., ii53
I
L....................L i...........................; ' ' .....
1977018855064
V MAKING DECISIONS ABOUT ALTERNATE MISSION PLANS--
_ THE USE OF A CONTAMINATION PENALTY
_' In the previous chapters we described and illustrated a methodology
_ii for assessing the probability of potential back-contamlnation for MSSR
_ missions. The real power of the methodology, however, is that it pro-ivldes a framework for making decisions among various mission designs.
_' One of the most basic mission decisions is the means of bringing the
sample to Earth (e.g., direct Earth entry versus orbital recovery versus
analysis in an orbiting laboratory). Other decisions are in the context iof the overall mission plan chosen; assuming direct Earth entry, a deci-
sion must be made whether to have the capsule enter Earth over land or
over the ocean, and whether or not to attempt an airborne snatch of the
sample. In addition, decisions must be made about what, if any, systems
should be installed for aborting the mission or sterilizing the sample
in the event of deviations from the mission plan.
It is doubtful that decisions such as these can be made in a logical
and consistent manner unless criteria for decision making are established.
What criteria should be used? The simplest answer is, "Choose that mis-
sion design which gives the lowest probability of back-contamination."!
i 1 However, a little thought will convince us that this criterion is inade-
' I quate, for among the range of possible mission designs is always the
alternative of flying no sample return mission at all. This alternative
has a probability of back-contaminatlon equal to zero, and so the simple
criterion above would always lead to no mission being flown, regardless
of the scientific value of the mission or the extent to which improved
understanding and mission planning could be used to reduce the risk ofcontamination.
Actually, the probability of back-contamlnatlon is but one criterion
for determining mission desirability. Others include:
• The value of the mission (both direct benefits, such as
improved science and technology, as well as indirect
social benefits, such as enhancing U.S. prestige).
• The probability of back-contaminatlng Earth with Martian
organisms.
• The probability of contaminating Mars with Earth organisms.
• The economic cost of the mission.
I
1977018855-065
i /
\ 5.1 A Framework for MSSR Mission Decision Making
To make intelligent choices among mission designs, responsibledecision-making agencies must consider the information and uncertainty
surrounding the decision and carefully weigh the relative importance of
each of the attributes characterizing mission desirability. The princi-
pal difficulty here is that interested parties to whom the decision-
making agencies are responsible often have widely differing states of
information and uncertainty, differing preferences, and even differingi models of the way events are related. For example, some scientists
! believe that the probability of life on Mars is insignificant. Others5 believe that this probability is quite high. Likewise, some scientists _"
would argue that the scientific value of returning a Martian sample to
E_rth would be enormous_ even if it were found to contain no llfe.
Others might feel this value to be debatable. The role of quantitative
analysis in social decision making is to facilitate the decision-makingprocess. It accomplishes this by organizing the factors relevant to the
decision so that speciflr areas of disagreement can be identified and the
implications of the disagreement can be measured.
Quantitative analysis is more likely to fulfill this role success-
fully if a well-organized framework for decision making is established
first. Figure 5.1 shows a decision framework for sample return mission
planning. The framework graphically illustrates the relationships amongthe three fundamental considerations that have a bearing on the decision-
Ii I making process: alternatives, information, and preferences.
The alternatives include mission design and containment policies
(including, of course, whether or not to conduct the sample return mis-
sion at all). The outcomes to the mission are some level of scientific
achievement and information, a possible effect on the Earth's ecosystem,
a possible effect on Mars, and a mission economic cost. For the pur-
poses of identification, key influential but uncontrollable factors areidentified as "state variables": these i_clude such things as whether
llfe exists on Mars_ the contents of the sample, the nature and timing
of accidents, the adaptability of Martian organisms to Earth enviromnent,and so on. Information enters the decision in two places: in a system
model that describes what is known about the relation among decision I
state_ and outcome variables_ and in describing our knowledge or lack of
knowledge about the probable values of the state variables. Preferences
are represented on the rlght-hand side of Figure 5.1 as a "value model."The value model includes an explicit expression of the decision-making
body's willingness to make trade-offs between outcome measures.
Used properly, a well-organized quantitative model such as thatschemtically represented in Figure 5.1 can serve several importantfunctions in social decision analysis. First, it can be used to identifythose state variables and model elements that significantl7 influence thedecision. We saw an example of this use in the sensitivity studies ofthe last chapter. Public review can then be focused on the issues that
uatter. Second, the model organizes the information in a concrete form
"' 56 _
1977018855-066
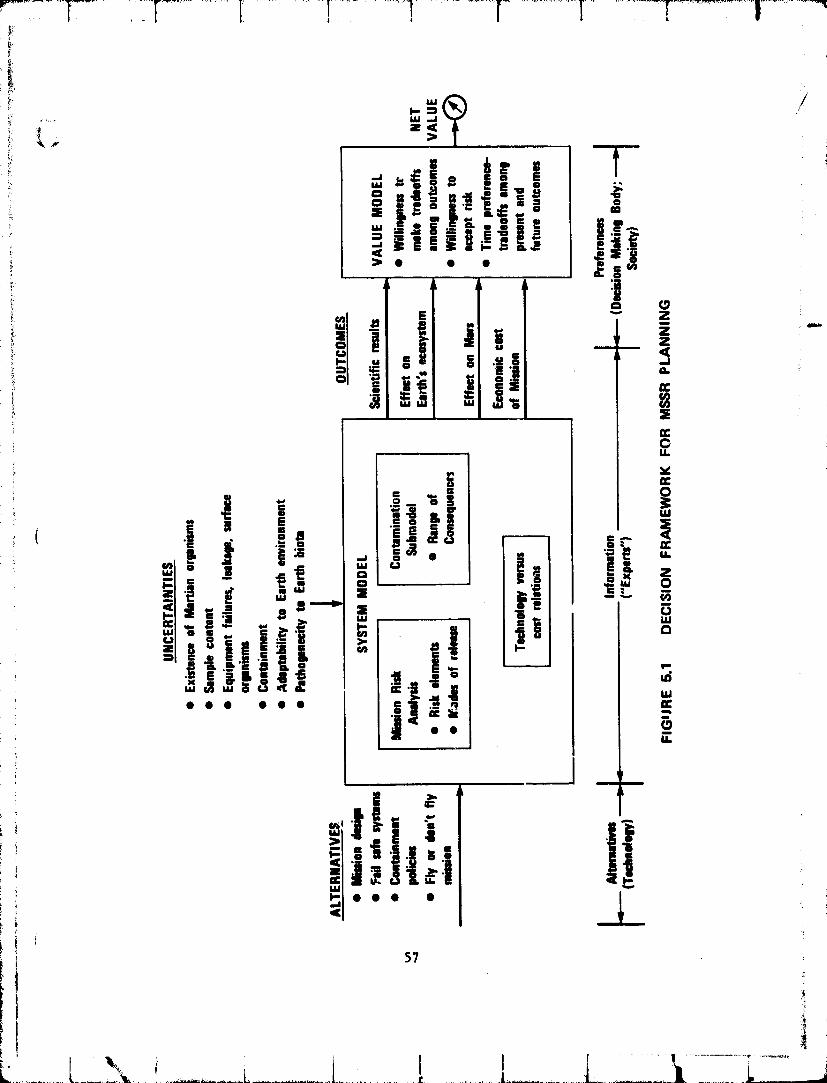
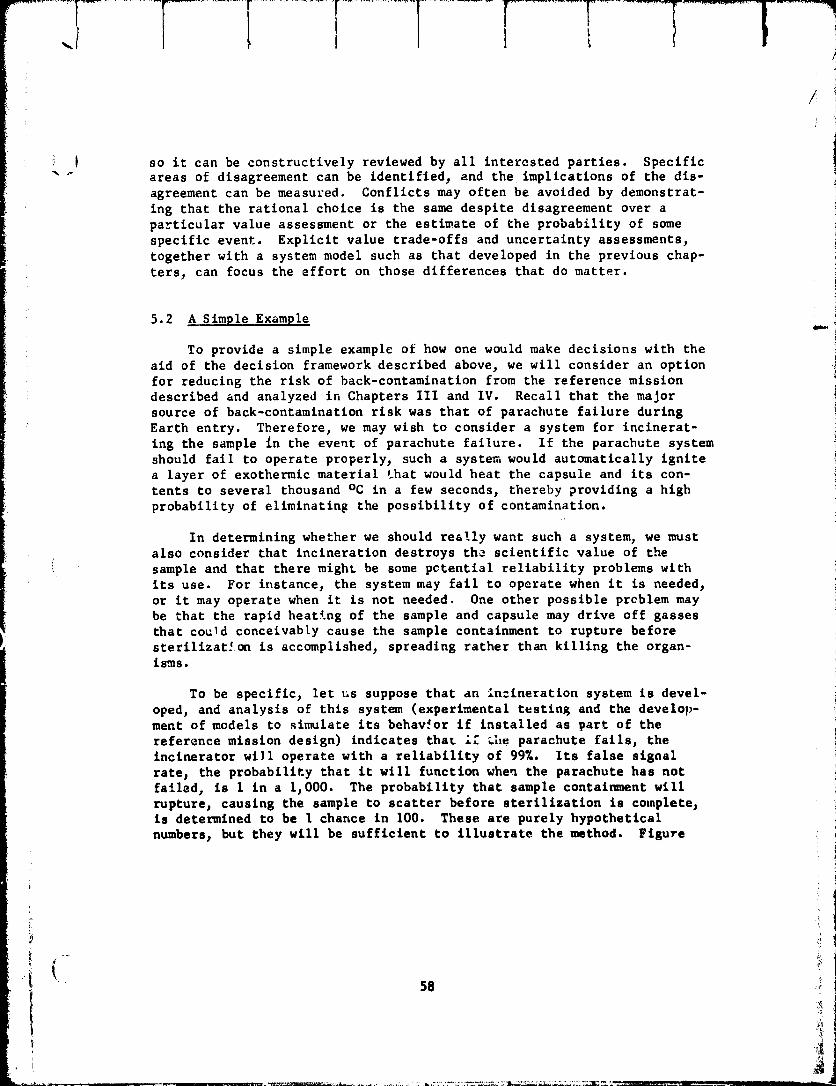
!
/!J
i I so it can be constructively reviewed by all interested parties. Specific" areas of disagreement can be identified, and the implications of the dis-
agreement can be measured. Conflicts may often be avoided by demonstrat-
ing that the rational choice is the same despite disagreement over a
particular value assessment or the estimate of the probability of some
specific event. Explicit value trade-offs and uncertainty assessments,
together with a system model such as that developed in the previous chap-
ters, can focus the effort on those differences that do matter.
5.2 A Simple Example _-
To provide a simple example of how one would make decisions with the
aid of the decision framework described above, we will consider an option
for reducing the risk of back-contamlnatlon from the reference missiondescribed and analyzed in Chapters III and IV. Recall that the major
source of back-contamlnation risk was that of parachute failure during
Earth entry. Therefore, we may wish to consider a system for incinerat-
ing the sample in the event of parachute failure. If the parachute system
should fall to operate properly, such a system would automatically ignite
a layer of exothermic material that would heat the capsule and its con-tents to several thousand °C in a few seconds, thereby providing a high
probability of eliminating the possibility of contamination.
In determining whether we should really want such a system, we must
also consider that incineration destroys the scientific value of the
( sample and that there might be some potential reliability problems with
its use. For instance, the system may fall to operate when it is needed,
or it may operate when it is not needed. One other possible preblem maybe that the rapid heating of the sample and capsule may drive off gasses
that could conceivably cause the sample containment to rupture before
sterilization is accomplished, spreading rather than killing the organ-isms.
To be specific, let us suppose that an incineration system is devel-
oped, and analysis of this system (experimental testing and the develop-ment of models to simulate its behavior if installed as part of thereference mission design) indicates that 12 _;,e parachute fails, theincinerator wi]l operate with a reliability of 99%. Its false signal
rate, the probability that it will function when the parachute has notfailed_ is 1 in a 1,000. The probability that sample containment willrupture, causing the sample to scatter before sterilization is complete,is determined to be I chance in 100. These are purely hypotheticalnumbers, but they will be sufficient to illustrate the method. Figure _
.. t !i..... 58
] 9770] 8855-068
_ - _- 5.2 shows the modification of the tree structure for the probability of
ii_ back-contamination from major equipment failure that is needed to account_ for the addition of the system ft. incinerating the sample. In this
i_ illustrative example, we see t_a< he probability of potential contamina-_i_ tion is reduced from 1.6 X I0"" to 4 X 10⁻⁵, a reduction of a factor of
!! four.It is easy to understand the reasons for the magnitude of reduction
obtained. In Chapter IV the sensitivity of the probability of potential
contamination to the probability of parachute failure was computed (Fig-ure 4.2). Even though parachute failure was the single m'st critical
risk element for the reference mission, the sensitivity analysis showedthat the contamination probability could be reduced only by about an order
of magnitude by eliminating the probability of parachute failure. Since
the i_cineratlon system reduces but does not eliminate the contribution of
parachute failure to potential contamination (and, in fact, adds the riskof explosive containment rupture) the factor-of-four red._tion obtained
above is understandable. Unfortunately, a fail-safe system that eliminatesor substantially reduces the risk associated with one risk element has a
relatively small impact on the overall risk because that overall r_sk
arises from a large number of factors.
This leads to what may be a difficult decision for mission designers.
Suppose the incineration system cannot be installed without reducing the
mission science payload in some way. For example, the system may renderi monitoring and control of sample environmental conditions (e.g., tempera-
ture) more difficult and add weight and complexity, thus using resources
that might utherwlse be devoted to scientific aims. The question is,
"Should the incineration system be installed, given that it reduces theontaminatlon probability by a factor of four but also reduces the sci-
entific value of the mission by a certain (kllown) amount?" The decision
to install the system requires a Judgment of the relative value of reduc-ing the contamination risk versus the cost of reducing the scientific
payoff of the mission.
=he decision framework of Figure 5.1 suggests that this question is
best answered by separating the value issues from the engineering and
technological ones. The value issue is:
• How much reduction in the scientific value of the mission
(or increase in mission cost) should be accepted in orderto reduce the probability of contamination by a givenamount?
The answer to this question iq conveniently expressed by specifying theappropriate value for a "contamination penalty." Suppose we define v d to
i_ be the value of a mission with a particular design d. This value takesinto account both the scientific benefits of the mission and its economic
i costs but does not include the cost of potential back-contamination.
I
i 59I'
Loi_
'"' - ' ' ......._'_' ......._: ........... _ ......................1 I__I'_.S\_.--qT_ ....... t ................._17-_
1Q77n1Re a_n n
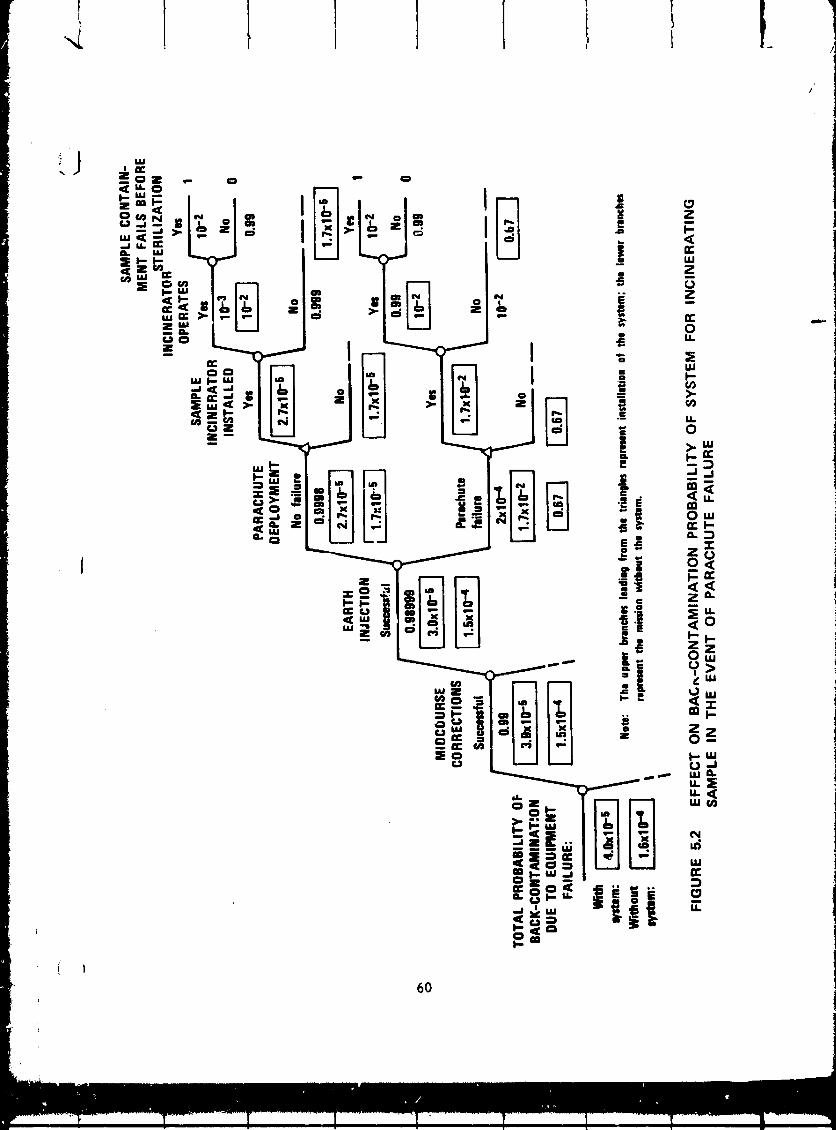
1977018855-070
.I Let Pd be the back-contamination probability for the mi3sion. The choiceof an optimal mission design may be expressed mathematically as the maxi-
mization of the expected net value of the missionj defined as
Expected net
value of mission = E(v d) - PdK 3 (5.1)
with design d
where E(wd) is the expected mission value and K is a contamination
penalty.* The contamination penalty K is expressed in the same units as ,=-
mission value and determines the weight we assign to the risk of back-
contamination in assessing the net value of a mission. The higher the
value we assign to K, the lower the net value of the mission and the more
inclined we are to trade off mission scientific value and increased eco-
nomic costs in order to obtain a lower probability of contamination.
To illustrate 3 let us return to our example decision of whether to
install an incineration system in the reference mission. To simplify, we
will assume that the additional economic cost of installing the inciner-
ator is negligible, but that its installation will result in a definite
reduction in scientific value by a fraction 6. We will define a con-
tamination penalty for the decision in units of the expected scientific
value of the nominal mission design. Let the expected scientific value
of the reference mission without the incinerator system be
E(v) = i .
Then the expected scientific value with the incinerator is
E(v') = Z - 6
An expanded discussion of this approach (in the context of integrating
outbound planetary quarantine requirements into mission planning) is
contained in a previous SRI report, s Hirschleifer v and Howard e have
pointed out the need to address directly the trade-off between incre-
ments of probability of a catastrophic outcome and a decision maker's
willingness to pay (or accept payment). More complex formulations are
possible. For example_ more sophisticated calculations may employ yonNeumann-Morgenstern utility to include the eff=ct of risk aversion.For a discussion of the issues of ri3k aversion see yon Neumann and
Morgenstern _ and Luce and Raiffa. lo
61
1977018855-071

! I I I I l 1 I I
/
.JThe probability of back-contamination without the incinerator is 1.6 ×
10 -4. Wi_h the incinerator the probability of back-contamination is4 × 10 "5. Following Equation 5.1, the expected net value of the missionwithout the incineration system is
Expected net value
without incineration = I - (1.6 X 10⁻⁴)K ,
system
and the expected net value with the incineration system is
Expected net valuewith incineration = 1 - 6 - (4 X 10"5)K .
system
If the mission is not flown, no scientific value will be produced and norisk of back-contamination will be taken. Thus the expected net value
of the alternative of not flying the mission is zero.
The best alternative among the three choices (fly the mission with-
out the system, fly the mission with the system, or don't fly the mission)I is that with the highest expected net mission value.
Figure 5.3 shows the optimal choice for this example as a function
of 5 and K. Regardless of 5, if the contamination penalty is high enough,the alternative of not flying the mission is optimal -- the mission results
simply aren't worth the _isks of contamination. For a given contamina-tion penalty (say K = I0 ), the incineration system should be installed
as long as the cost to the scientific investigations is less than a cer-tain amount (5 = 0.I if K = I0_) -- otherwise, the mission should be flown
without the system. As the contamination penalty increases, the break-even 5 (the amount of scientific value we are willing to give up to re-duce the back-contamination risk) increases also.
Figure 5.3 illustrates that a given contamination penalty implies acertain optimal decision among the choices. Conversely, were the deci-sion to be made without the use of a contamination penalty, it would beconsistent with only a certain range of contamination penalty values.For instance, if installation of the incineration system results in a 1%
*Actually, as discussed in Chapter II, these probabilities should beattenuated by the probability that life exists on Mars, the probabilitythat suE;, life would be returned by the spacecraft, and the probabilitythat released Martian organisms would reproduce on Earth. We ignorethis for simplicity.
62
1977018855-072
I I t I i l I!
) loss in science value (5 = 17.), the decision to install the system and :
-_. _01_ the mission is optimal only for contamination penalties between aboutand 2 X 10⁴.
There are many decisions in designing a mission in which a trade-offbetween scientific value and probability of back-contamination must bemade. These include the number and types of samples to gather on Mars 3the choice of recovery method at Earth (e.g._ direct Earth entryj orbitalrecovery with Earth analysisj or analysis in orbit)_ and whether toinclude various backup and fail-safe systems. Each of these decisionsmay be formulated as a trade-off between science valuesj economic cost 3
10s l iDon't
FlyMission
FlyMission
_' syWiste_m ,/ II
- lZ
Z_oI--
: J f102
I--Z0
Fly Mission I101 WithoutSystem I
IIII
1 I I J0.001 0.01 0.1 1 :'
5.75FRACTIONOF MISSIONSCIENCEVALUEWHICHIS LOSTWHEN
INCINERATIONSYSTEMIS INCLUDED,6
FIGURE 5.3 QUARANTINE VERSUS SCIENCETRADEOFFS
63
i i
i !I ii
1977018855-073
and reduced risk of back-contamination. If each of these decisions is%f
made without explicit reference to a contamination penalty, each mayimply a different range of contamination penalties. If these ranges donot overlap, there will be no single contamination penalty for which thegiven decisions are optimal, and, therefore, the decisions will implyChat inconsistent trade-offs are being made. On the ocher hand, if the
contamination penalty is established at the outset, then the decisionframework can be used to obtain decisions that consistently reflect the
explicit Crade-offs imptied by that penalty.
Obviously, specifying the appropriate values for K and 6 is a diffi-cult task. However, it may not be necessary to specify the contamination
penalty with great precision. The precise value of K will not affect thedecisions to be made unless the specified point in the (K, 6) plane hap-
pevq to be close to the boundary between two optimum alternatives. If itis close to the boundary, then the second best alternative is close in
preference to the optimum, and a small error in K will not be of greatimportance.
This chapter has shown how a contamination penalty can be used inthe context of a decision framework to clarify the decisions requiringtrade-offs among different HSSR mission attributes. The following chap-ter discusses how one could go about determining a contamination penaltyfor an MSSR mission.
_ 64
1977018855-074
[ I 1 I I ! 1 I
VI THE CONTAMINATION PENALTY
This chapter explores In more detail the concept of a contamination
penalty and its application to sample return mission design decisions
for which the risk of hack-contamlnatlon is a consideration. We begin
by defining more carefully the concept of a contamination penalty. Next
we discuss the issues that should be considered in determining an appro-
priate value for the contamination penalty. Finally, we discuss the
advantages and disadvantages of the use of a contamination penalty com-
pared to other methods of providing guidance for decisions relating toback-contamlnation.
6.1 Definition of the Contamination Penalty
The definition of a contamination penalty may be inferred from the
example of the last chapter. The contamination penalty, multiplied by
the probability of contamination, gives the amount by which the value of
a particular mission design should be penalized in the comparison with
other mission designs to account for that particular mission's probability
of back-contamlnation. Thus, the contamination penalty is the cost to be
assigned per unit increase in the probability of contamination.
This may be clarified by a graphical illustration. The simple mis-
sion design problem considered in Chapter V required a decision to bemade between three mission alternatives: the reference mission without
a system to incinerate the sample in the event of parachute failure, the
reference mission with the incineration system, and the alternative of
not flying the mission at all. To facilitate decision making, each
strategy can he characterized by two numbers: a probability of back-
contamination and the expected scientific value of the mission. # Figure
6.1 illustrates these three alternatives on a graph whose horizontal axis
measures probability of contamination and whose vertical axis measures
expected mission value. A 6 (fraction of the mission value lost if theincinerator is installed) of 0.25 is assumed for the figure.
In general, many mission design alternatives will have varying
levels of probability of back-contamination and expected mission value.
A similar graphical illustration is presented in a previous SRI repor_
dealing with outbound planetary contamination.
#Scientific value is defined here as the value of the benefits derived
from the mission minus economic costs.
1977018855-075
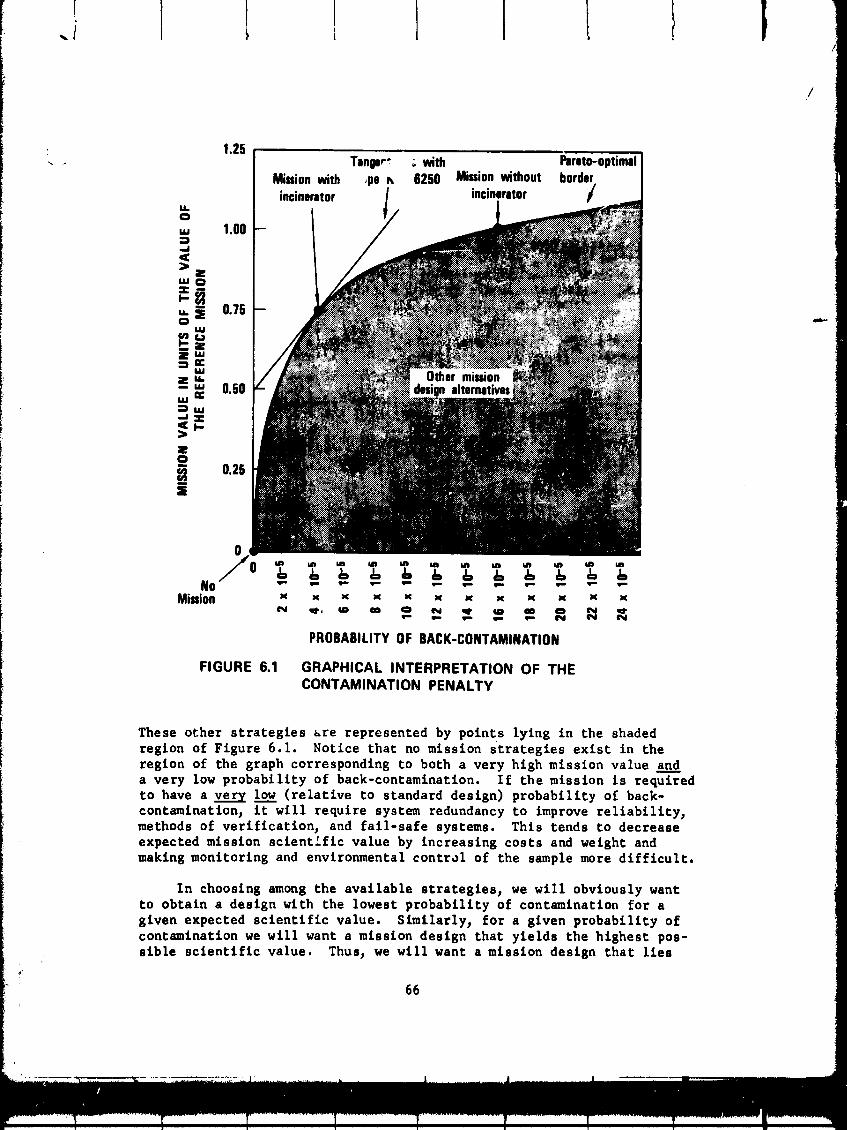
0
NoMission x x x K x x x x x x x x
PROBABILITYOF SACK-CONTAMINATION
FIGURE 6.1 GRAPHICAL INTERPRETATION OF THECONTAMINATION PENALTY
These other strategies are represented by points lying in the shadedregion of Figure 6.1. Notice that no mission strategies exist in theregion of the graph corresponding to both a very high mission value an___dda very low probability of back-contamination. If the mission is requiredto have avery lo_.xw(relative to standard design) probability of back-contaminatio% it will require system redundancy to improve reliability,methods of verification, and fail-safe systems. This tends to decreaseexpected mission scientific value by increasing costs and weight andmaking monitoring and environmental control of the sample more difficult.
In choosing among the available strategies, we will obviously wantto obtain a design with the lowest probability of contamination for agiven expected scientific value. Similarly, for a given probability ofcontamination we will want a mission design that yields the highest pos-sible scientific value. Thus, we will want a mission design that lies
66
1977018855-076
t
on the border of the region characterizing the set of possible strategies.
" This border, which is widely known in economic theory that deals with
trade-offs amon_ different objectives, is referred to as the Pareto-optimal border.
A choice among strategies lying along the Pareto-optimal border
requires that a trade-off be made between increments of expected valueon the vertical scale and increments of probability on the horizontal
scale. The ratio of these increments is the slope of the tangent line
to the Pareto-optimal border. The slope of the tangent line that passes
through the optimal mission design defines the contamination penalty.
Suppose the contamination penalty is K = 6250. The line with this
slope is shown in Figure 6.1 to be tangent to the Pareto-optimal border
at the mission design representing the reference mission with the incin-
eration system. (The reader may verify from Chapter V that for a 5 0.25,K = 6250 is within the range of values for which this choice was shown
to be superior to either the reference mission without the incineration
system or that of not flying the mission.) If the contamination penaltyis increased, the slope of the line increases and it will be tangent to
a point with a lower probability of contamination and a lower expectedscientific value. If the contamination penalty is decreased, the slope
of the line decreases and tangency occurs for a point with a higher prob-
ability of contamination and a higher mission scientific value. Thus,the contamination penalty defines a trade-off between contamination prob-
i ability and expected scientific value 3 and this trade-off implies apreference for a particular mission design.
6.2 The Contamination Penalty Versus the Cost of Contamination
Since the product PdK of the probability of contamination Pd andhe contamination penalty K is the reduction in expected mission value
necessary to account for the risk of contamination, it is tempting toconclude that the contamination penalty is the reduction in value (cost)
that should be assigned if the probability of contamination is one. If
this is the case, then the contamination penalty should be the cost to
society of back-contamination. This is not the case. Interpretation of
the product PdK as the reduction in mission value to account for the pro-bability of contamination is only valid for small probabilities of con-
tamination Pd" The contamination penalty is simply a number assignedfor making trade-offs in a consistent way between small probabilities ofcontamination.
1977018855-077
I r'
t I i I I [ I I I
I
The situation is, in many respects, analogous to that of assigninga value to a human life in the context of decisions on automobile or
_ aircraft safety. In this context, values of life such as $200,000 to
_: $5003000 have been used.I_ It would b_ improper to assert that the
value of llfe used in this context represents an amount an individual
would pay to avoid certain death. Similarly, It would be improper toassert that the contamination penalty used in the context of a back-
contamination analysis represents an amount society would pay to avoidcertain contamination.
6.3 Determination of an Appropriate Value for the Contamination Penalty
Like the social "value of llfe," the contamination penalty should
be representative of the values of society as a whole. The contamination
penalty is society's way to tell mission designers of society's willing-ness to accept hack-contamlnatlon risk in order to obtain the benefits
of space exploration. As suchj it should properly be set by a body
_. responsible to the electorate. Howeverj declslon analysts 3 biologists,
and other specialists should provide guidance in their areas of expertise.i
To assess a contamination penalty, it will be necessary to know the
probability distribution over the range of possible consequences of con-tamination: Will actual back-contaminatlon be a major ecological disas-
i_ ter comparable to the return of a great ice age, will it be a minor incon-! venlence, or might it even be beneficial?
Some conceivable effects of the contamination of the Earth with
Martian organisms are:
• A Martian llfe form occupies a new ecological niche, and
affects other llfe forms minimally, for example, by turn-
ing the Antarctic dry valleys red.
• It competes with or harms some forms of life relatively
inessential to humanity, comparable to the loss of the
great whales, or the replacement of one species of plank-ton by another.
• It hurts a plant or animal on which man depends, as doescorn blight.
• It harms an activity, such as rendering cold storage inef-
fectual in preventing bacterial growth.
• It causes a new form of cancer.
• It causes a pandemic that kills the entire population ofEarth.
,_ *For a discussion of the differing roles of experts and society as a!i whole in matters of this kind, see Barrager and North._8
68
1977018855-078
I I 1 I T f I ....... I ............... |
Analysis should be initiated to model the range of conceivable
effects of contamination and their relative likelihoods. Obviously,the present state of knowledge is such that there will be a tremendous
amount c,f uncertainty in the assessment of the potential consequences ofback-contamination. Nevertheless, available knowledge and information
can and should be represented in the decision-making process. Methodologydeveloped to model the consequences of disasters (including accidentalrelease of radioactivity from nuclear power plants it and hurricanes 15 may _be helpful to this effort. !
At least two approaches can be used to determine a contamination !
penalty for sample return missions: ,
(I) Set a maximum probability of back-contamination for a
nominal _ission and use this to infer a contaminationpenalty.
Z
! (2) Directly assesc a contamination penalty through trade- _!off Judgments.
ii The principal difficulty with the first approach is the determination
_ of a rational method for establishing a maximum probability. One approachthat has been advocated for establishing acceptable risk levels is tolimit the probability of the event under consideration to some small frac-
tion of the already existing probability of adverse effects of 1:hesame
( I magnitude from other sources._
For a discussion of how a contamination penalty may be inferred from a
maximum allowable probability of contamination, see Howard, North, andPezier. 6
tStarr, Rudman, and Whipple Is introduce the notion of a "risk uncertaintyprinciple," risks due to risk modes not previously considered. For risks
to Ea-th, they use the example of "a giant meteor destroys Earth." Using
the observation that such events have not occurred in the existence ofEarth, they find a minimum risk of 2.5 × 10 "'_ per year. They conclude"i! -- "
...risks or system failure probabilities of less than 2.5 X 10 "10 arenot really worth considering as an unremovable risk threshold of 2.5 X
10 "10 has been defined." Since this is a number with dimension (years) "1,one needs a characteristic time for the risk in order to define the riskthreshold. Assuming a characteristic time for back-contamination risk of20 years, we find that the risk thresh i for planetary contamination is20 × (2.5 × 10 "10) = 10 -9 probability. One may want to set the maximum
probability of plantetary contamination to be, say, IX of this for conser- ,vatism and because this risk is introduced by man. This leads to a
contamination penalty K = 2 X 10¹⁰ (in units of the expected scientific ivalue of the nominal mission). Unfortunately, as discussed in the text, _
there are serious problems to using such an approach, i]
[t
69
1977018855-079
" [ l I t T [ I I !
/
{ | For comparison, one might wish to consider the probabilities of natural/
catastrophies 3 such as earthquakes and long-termweather changes, andpotential man-made disasters, such as a massive nuclear exchange betweenthe United States and Russia. Unfortunately, this approach fails to pro-vide a logical method for taking into account the benefits that areexpected from the decision that carries with it a risk. Intuitively, weshould be more willing as a society to accept additional risk for largerpotential gains.
_ The second approach, direct assessment of the contamination penalty,may be accomplished by breaking down the trade-off decision between risk
and value into more fundamental trade-off decisions. Howar_ proposesi_ such an approach for the assessment of a value of llfe. Each of the _"
possible consequences of contamination and their probabilities would bei assessed; then individual trade-off decisions would be established to
reflect the degree to which society is (or should be) willing to tradeoff those attributes it values (such as standard of living) in order toreduce the probabilities of the various consequences of contamination.The logic behind this approach is similar to the logic behind the analysisof the probability of rare events. It is easier to make each individualtrade-off decision and infer the global trade-off than it would be to makethe global trade-off between back-contaminatlon risk and value directly.
Obviously, establishment of a contamination penal£y will not be aneasy task, regardless of the method chosen. However, it should be reem-
phasized that it may not be necessary to determine the appropriate con-1 tamlnation penalty to a high accuracy. If analysis of alternative MSSR
mission designs in the declslon-theoretlc framework presented in Chapter
V indicates that this is the case, very crude methods for estimating acontamination penalty may be adequate.
6.4 Alternatives to Using an Explicit Assessment of the Trade-off
Between Mission Value and Probability of Back-Contamination
The alternative to using a contamination penalty as an explicitassessment of the trade-off between mission value and probability ofback-contamination entails using such criteria as "best practical tech-nology," or probability constraints that must be met irrespective ofeconomics. The weakness of probability constraints is that they give noincentive to reduce a probability below the constraint threshold, andthey may result in information that could show the constraint to beviolated having a negative value. A_ a hypothetical example, on might"rather not kno_' whether a biolog|cal seal on a sample canister hasleaked if in this case a constratut on back-contamination probabilitywould be violated. Examples and further discussion of the weaknesses of
a constraint formulation are found in Howard, North, and Pezier. e
Such qualifiers as "ae low as practical," "safe enough," and "ade-quate safety" avoid the difficulty of assessing _rade-offs, but theysuffer from the same problems as do probability constraints, as well as
/ /70
i
" t i I !
1977018855-080
_!: iI
_ _ v ambiguity. Unless a balance is struck between the probability of reledseand the economics and science value of the miseion_ a negative incentiv_
i
exists for the development of new technologies for reducing contaminationrisk and for obtaining more information about the effectiveness of the
approaches for guaranteeing contairanent. In most cases only the costs ofimprovements will be reflected in the mission program. Any new technologythat appears sa£er may be mandated; any new information showing a tech-nology is lees _afe than previously supposed may result in rejection of
that technology. Explicit trade-offs may be difficult to establish 3 but _they provide a means for clarifying objectives and thereby ensuring thatdecisions are_ in the broadest sense_ cost-efgective. "
1977018855-081
VII TOPICS FOR FURTI_R RESEARCH
During the preraration of this report_ consideration was given toadditional research that would contribute to the development of a method-
ology needed to support decisions involving the risk of back-contamina _on
from MSSR missio_. The purpose of this chapter is to note briefly th_further research work that has beeu identified. ""
7.1 Application and Extension of Assessme,t Methodology
a. An interesting and useful application of the methodology devel-
oped in this report would be aninvestlgation of the alternative strate-
gies that have been proposed for bringing a Mars sample to Earth. Three
fundamentally different strategies that have been suggested are:
(i) Direct Earth entry (the reference mission for this
study).
(2) Orbital recovery with analysis in an Earth-based
sample receiving lab (Appendix E).
(3) Orbital recovery with preliminary analysis in orbit.
The methods described in Chapters II, III, and IV could be used directlyto provide estimates of the risk of back-contaminatlon from nominal mis-
sion designs based on each of these strategies. The results would indi-
cate which risk elements associated with each mission strategy contributemost to contamination risk.
b. Given a specific strategy for sample return (e.g., direct Earth
entry)_ an extension of the decision framework described in Chapter V couldbe used to determine a "best" mission design. The objective of this re-search would be to develop and illustrate a process for consistentlymaking decisions regarding redundancy and the use of fail-safe systemsto obtain a desired trade-off between back-contamination risk, missioncost, and expected mission scientific value. Since design decisions de-pend on the contamination penalty used_ this research should show theimpact on mission design of assuming different contamination penalties.An important result would be the insight this research would provide intothe degree of precision necessary for establishing guidelines forM SSRmission planning (regardless of whether the guidelines are in the formof contamination penalties, probability constraints, or the like).
73
1977018855-082
_ j 7.2 Development of Models for the Consequences of Releasing MartianOrganisms on Earth
An obvious extension of current methodology is the development of
models for estimating the consequences of releasing Max tian organisms into
Earth's biosphere. As explained in Chapter II, no attempt was made in
this research to assess the probability of growth for Martian organismsreleased on Earth. Similarly, no attempt was made to quantify the rangeof possible consequences of back-contamination. An assessment of the prob-abilities of various consequences of contamination will be necessary be-
fore the probability of release computed for various sample return missiondesigns can be put in proper perspective. .=-
While it is recognized that the limited extent >f available infor-
mation would constrain an analysis of the consequences of contamination,
even a preliminary analysis, would be of value. For example, even a sim-ple analysis would permit a computation of the value of resolving uncer-tainty. Identifying uncertainties with a high value of resolution _ay
suggest specific experimental questions that could be answered by Viking,
by experiments performed during possible future Mars missions cond_ted
before a sample return mission, or by experiments performed during a sam-
ple return mission.
7.3 Methodology for Assessing and Operationalizing ContaminationPenalties
Decisions about sample return imply a trade-off between the proba-
bility of contamination and the scientific value of the mission. Trade-
offs made should reflect the values of society as a whole. However, as
a practical matter, this decision may well be made in the legislativeand executive branches of government in much the same way as decisions
are made on other trade-off issuesl such as emissions controls (trading
off permissible pollution levels versus economic issues)_ nuclear safety(trading off the probability of accidental radiation release against thecost and supply of electricity), and recombinant DNA research.
The concept of a contamination penalty provides a logical means forconsistently making trade-off decisions. So_.e of the issues surrounding
the assessment and use of contamination peo_Ities have been discussed in
this report and elsewhere, s Much additional research needs to be done.
Principal areas of research include determining the accuracy with whicha contamination penalty must be specified and determining methods forobtaining assessments of contamination penalties to the required degreeof accuracy. Clearly, the operational aspects of usin 8 a contaminationpenalty should be investigated. Specifically, a procedure should be de-signed for proceeding from a contamination penalty, such as that specifiedby a policymaking body, to the level of numerical specifications for in-dividual components and processes (and methods of validation) that w_vld
be required for the efficient management of a large technological project,such as an MSSR mission.
, _ 74 i' ! 1
................t..........".............t ..................; ..... ,
1977018855-083
Appendix A
SOURCES OF NUMBERS FOR INITIAL BIOLOAD..
.I
L l , I Ii
1977018855-084
! Appendix A
SOURCES OF NUMBERS FOR INITIAL BIOLOAD
Figure A.I shows the numbers and locations of Martian organisms as-
sumed in the analysis of the reference mission. A discussion of each of
these assumptions is presented below. The discussions are net meant to
be justifications for the assumptions. Indeed, the uncertainty in the
numbers of Martian organism that would be present is such that no single
number can be justified. The judgments are purely subjective estimates.The discussion is merely meant to indicate considerations that may be ofrelevance.
A.I 104 Martian Organisms (MO_ in Sample Canisters
The basis of this assumption is an analogy with the biological con-
tent of Antarctic soil, which has been measured to contain between 1 to 2
organisms per gram on the north sJae of the "Last Mountain on Earth" (thesouthernmost mountain) and less than I00 organisms per gram in the
sparsely inhabited dry valleys. _7 Assuming a density of between I and I00
MO/g implies 103 to I00 MO in a I- to lO-kg sample. A middle value of104 MO was chosen as the base case.
A.2 lO0 MO Inside the Sample Container
The container will be sealed on Mars' surface. The interior surface
of the container and the outside of the canisters will have an area of
about I m2.
Data exist regarding the surface density of Earth organisms on the
Viking lander bioshield, the Viking orbiters, and the launch-vehicleshroud. These were assembled in a clean room. The canisters will be
loaded on Mars under more difficult conditions but without the presence
of people to cause bioloads. As a very crude analogy we consider Vikingnumbers that indicate fo. Viking between 102 to 104 aerobic bacteriaand between I0 to 103 spores per m2 surface densities on the lander blo-
shield, orblter_ and launch-vehicle shroud. A nominal assumption of 102 MOper m2 for the MSSR mission lander yields the assumption of i00 organisms.
A.3 I0 MO Inside the Compartment
The container is passed to the Earth-return vehicle (ERV) In Marsorbit and sealed inside the compartment at that time. The exterior sur-
face area of the container _ about 0.5 m2. An assumption of !02 MO per m2
A-3
.... • ] iI
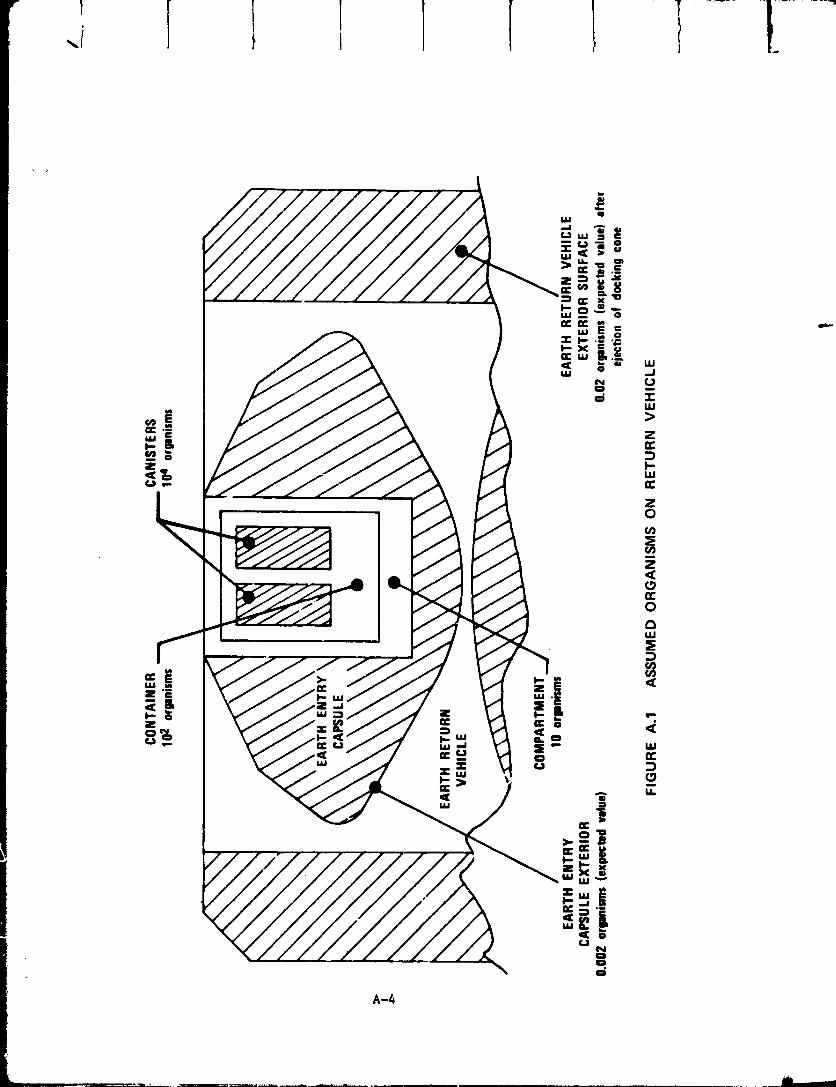
r .... _i_ ....... [ I I "ll t -'
1977018855-086
_. would imply 50 MO in the sample compartment. However, a smaller number_10 organisms 3 is assumed because the btoload of the compartment could bereduced in a m,mber of ways:
• When the compartment is sealed (brazed shut), its insidesurface and the outside surface of the container could beheated briefly to partially sterilize it. One would
have to take care not to heat the samples.
• A bioshield could be placed around the container on Earth,left in place on Mars' surface, and removed Just beforetransfer of the container to the ERV. The _rea aroundthe container seal could be sterilized with heat.
Reduction by an even larger factor should be possible. It is worth
attempting, since, as shown in Chapter III and Appendix C, these organ-isms are the most likely source of contamination via leakage.
A.4 Expected 0.02 MO on the Outside of the ERV*
The ERV does not travel to Mars' surface. The only way MO can geton the surface of the ERV is from leakage of the sample or from transfer
of surface organisms from the Mars-ascent vehicle (MAV) during rendezvousand sample transfer. We evaluate here the expected number of MO trans-ferred from the MAV.
iThe MAV will be launched from the surface of Mars and be placed in
Mars orbit, oriented with respect to the sun as shown in Figure A.2. TheMars-orbit vehicle (MOV), containing the ERV_ will then maneuver and ef-
fect linkup. After the sample is transferred to the ERV, the MAV willseparate from the MOV, taking the docking cone with it.
MO may be transferred to the ERV either generally during the period
of station-keeping, when the MAV and MOV are in proximity 3 or specificallydue to the acceleration of the linkup itself. The reasoning behind theassumed number of MO transferred is shown below.
(I) Transfer due to acceleration during linkup:
(a) MO on MAV exterior: 104 organisms (106 soll particles).
Area: about 20 m2 (500 MO per m2--hlgher density because
of greater duration of exposure).
(b) Worse-case acceleration during docking: I00 g. Largeraccelerations are assumed to lead to mission abort dueto damage. (Note: the nominal accelerationwould be
much lr_er, perhaps a few g.) Fraction of MO shaken offMAV during docking: lO -3.
Dr. Jack B. Barengoltz of JPL was very helpful in providing the estl-) mates for this assessment.
A-5
1977018855-087
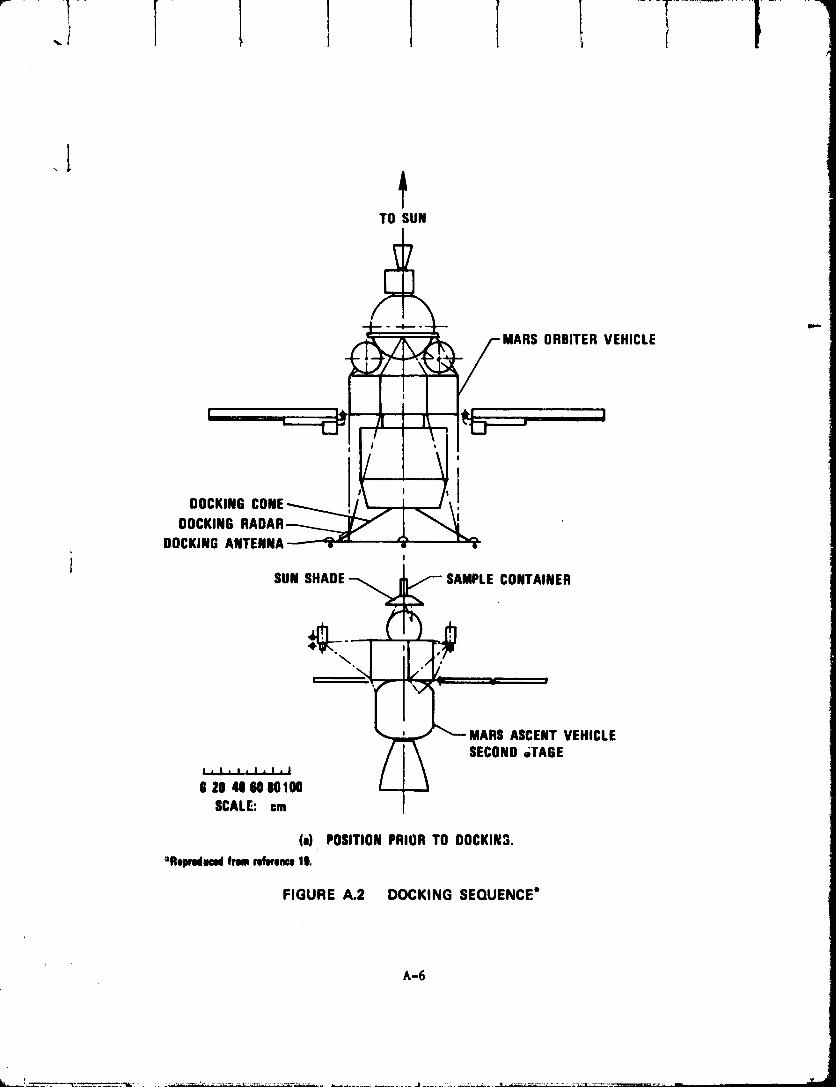
TO SUN
__ MARS ORBITER VEHICLE
i
I
iI
Ii
OOCKIN6CONE
OOCKING
OOCKINGANTENNA
i i
SUN SHAOE __,_"_ SAMPLE CONTAINER
'__ MARS ASCENTVEHICLE
(a) POSITIONPRIORTO DOCKINg.
°lloimidmmlfromndmlnU19.
FIGURE A.2 DOCKING SEQUENCE"
A-5
J
1977018855-088

I 1 I [ [ [ [ ! !
TO SUN
j--MARS ORBITERVEHICLE
| iEARTH RETURNVEHICLE
DOCKING DOCKINGCONE
!
MARS ASCENTVEHICLESECONDSTAGE
I, I , I , I , I, I
O 20 40 60 B0100
SCALE: ©m(b) DOCKEDPOSITION.
FIGURE A.2 DOCKING SEQUENCE (Continued)
A-7
1977018855-089
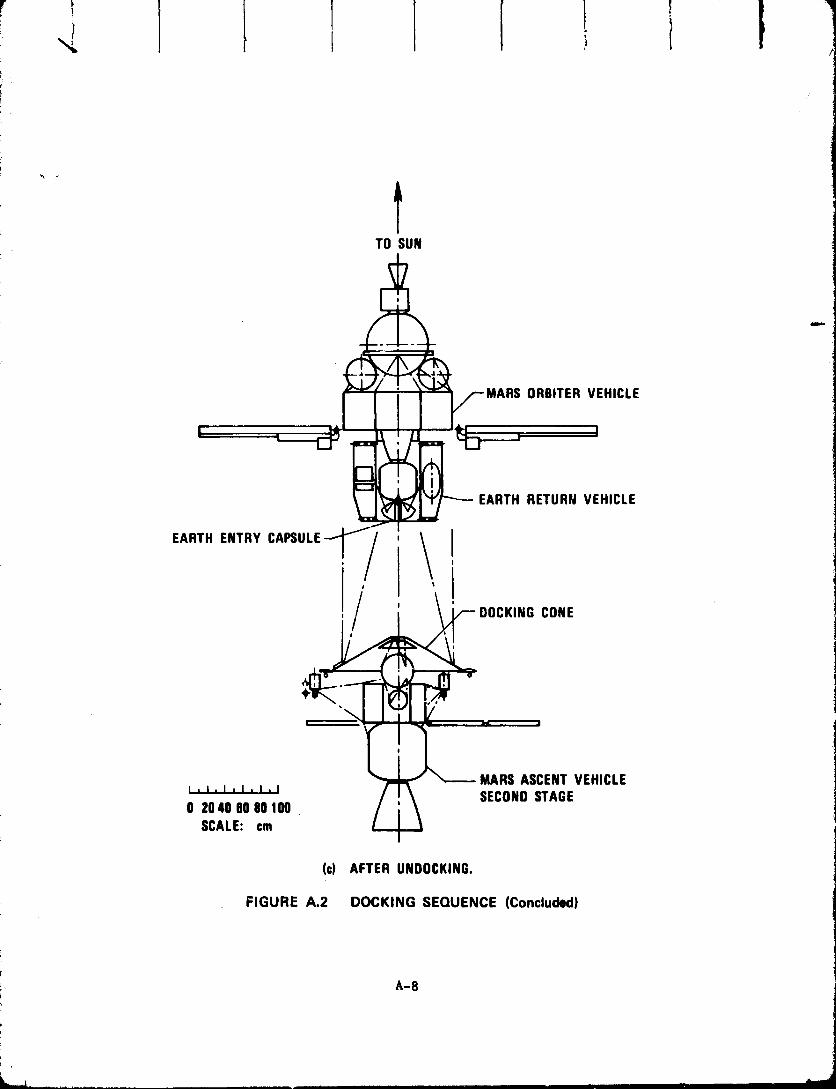
i f t
tTO SUN
a
EARTH RETURNVEHICLE
,=ART.E.T.YCA_""=_J/ ! li
/ ;, DOCKINGCONE
_q"J _-_ MARSASCENTVEHICLEi . ,, I , I, I. I SECONDSTAGE0 20 40 60 80 100
SCALE: cm
(c) AFTER UNDOCKING.
FIGURE A.2 DOCKING SEQUENCE (Concluded)
1977018855-090
I
(c) Fraction of organisms shaken off that land on the ERV:
i0-3. This number is strongly dependent on the geometry,, of the spacecraft. Most of the transfer is by direct
llne of sight. The docking cone (see Figure A.2) willshield most of the ERV from line of sight with the MAV.
Most particles will be shaken off the MAV near the dock-
ing cone 3 since this area experiences the largest accel-erations during docking.
(d) Expected number of organisms transferred during the dock-
ing acceleration: 104 X 10-3 X 10-3 = 0.01.
(2) Transfer during station-keeping:
In addition to transfer of particles during the actual dock ng,
transfer may occur during the station-keeplng phase. There
will be no line of sight then, and this transfer will depend
on the interplay of solar rsdlatlon pressure and electro-static forces. Anything shaded and ungrounded (as parts of
the ERV will be) w_ll tend to accumulate a negative change
because solar wind electrons go in all directions while heavier
protons in the solar wind travel in a straight line away from
the sun. Shaded areas may have a potential up to three times
the electron temperature_ or -60 V. Areas in the sun will tend
to get a positive potential due to the photoelectric effect.Particles coming off of the MAV solar panel_ may have a chargeof +I/2 to +I V.
I For Viking, an expected 33 particles was computed to be trans-ferred from the nonsterilized parts to the sterile landers dur-
ing the one-year journey to Mars. The MAV and MOV will keepstation for 3 or 4 days, or 1 percent of one year. However,
there may be an enhancement over the Viking results by roughlya factor of I0 due to the larger turning radius of the particle
trajectories allowed for transfer. On the other hand, there
may be a factor of 3 reduction compared to Viking due to parti-
cle dispersal by the solar wind. (The MOV will be between the
MAV and the sun_ and particles will be emitted perpendicular to
the MAV surfaces.) Thus_ the expected number of particlestransferred during statlon-keeplng is roughly estimated to be
l I-- - _ I soil particle.33 X I00 x I0 x 3
(Viking) (Time (Turning (SolarRatio) Radius) Wind)
Assuming the conjectured 10.2 MO per Martian soll particle, this
' implies a transfer of 0.01MO.
A-9
1977018855-091
• /
/
The fraction of MO transferred from the MAY to the ERV is strongly
dependent on the geometry assumed. Careful design of the docking cone,
- used perhaps in conjunction with a _imple bioshleld, _ould possibly re-
duce this fraction substantially. On the other hand, if the dockingcone were not installed, Lhis number could increase by a factor of I0 to
I00. Under the assumptions of this reportj biological contamination on
the spacecraft exterior surface is unimportant compared to the othersources of potential contamination.
A._ A_sssumedPaths Followed by MO on the ERV
A discussion of the fraction of MO dislc_ged due to mlcrometeoroid
impact, th_ fraction dislodged due to AV corrections, and the fraction
that remain on the Earth-entry capsule (EEC) is given in Section 3.7.2.
_. A-IO
1977018855-092
Appendix B
PROBABILITY TREE--NAJOR EQUIPMENT FAILURE
i
1977018855-093
Appendix B
PROBABILITY TREE--MAJOR EQUIPMENT FAILURE
Figure B.I displays the complete probability tree for computing the
probability of potential back-contamlnat_on due to major equipment fail-ure. The numbers under the branches of the tree not enclosed in boxes
are the event probabilities assumed for the reference mission. Table B.Idefines the events and comments on the numerical values a_sumed for the
event probabilities.
The numbers in squ_Le boxes in the figure are prebabilities of po-tential back-contamination_ conditioned on the events leading to that
pclnt in the tree. They are obtained by "rolling bac_' the tree -- mul-
tiplying the probability of each branch by the conditional probability ofcontamination on that branch and adding.
The numbers in ovals are the contributions to the contamination
probability that come from all paths ("scenarios") leading through that
point on the tree. They are obtained by multiplying the conditional
' I probability of contamination at that point (square boxes) by the proba-bility of reaching that point in the tree (the product of the even_ prob-abilities along the branches leading to that point). TheGe numbers show
the major factors co,ltributing to the probability of back-contamination.
B-3
1977018855-094

" !1
...................... __ ..................... -_,,- , ......., .... i i I I i ii
1977018855-095

B-7
1977018855-097

1_77018855-0_8

1977018855-1C}C_
1977018855-101
L
[: _¢
.i
Appendix C
PROBABILITY TREE--LEAKAGE
i:
0 'o. .,_
l
1977018855-102
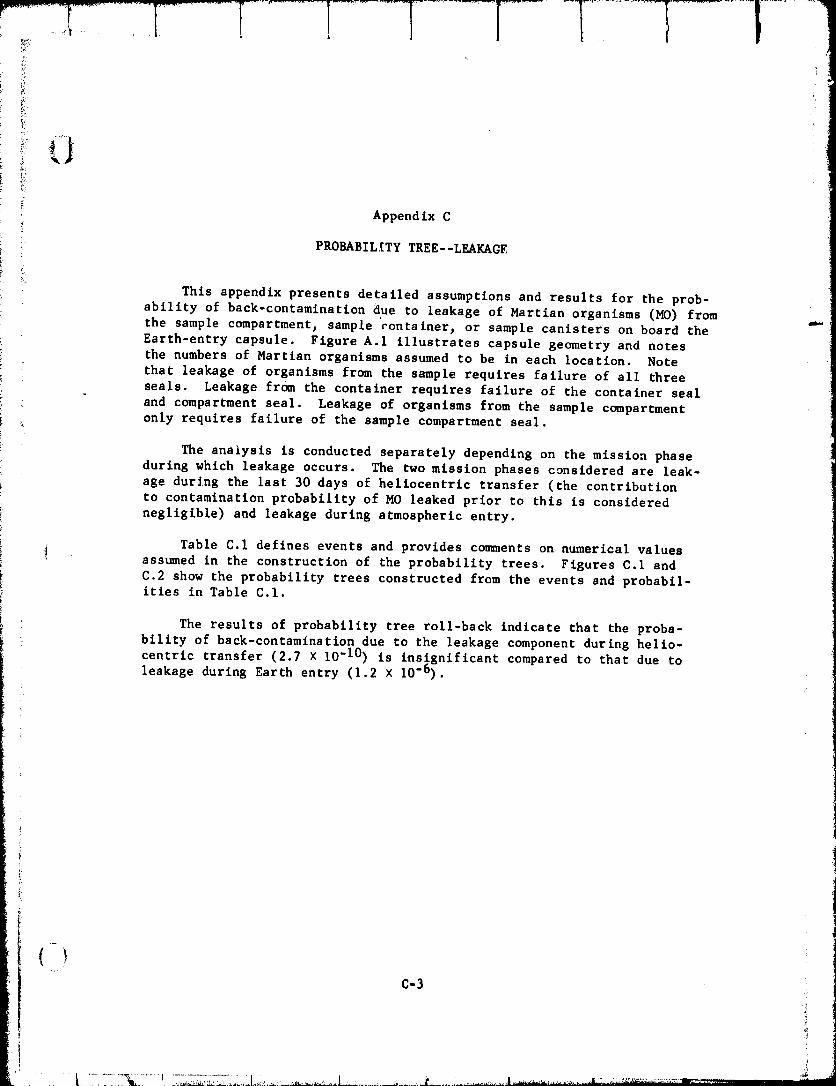
_ Appendix C:i
i PROBABILITY TREE--LEAKAGE
: This appendix presents detailed assumptions and results for the prob-
ability of back-contamination due to leakage of Martian organisms (MO) fromthe sample compartmentj sample container_ or sample canisters on board the
Earth-entry capsule. Figure A.I illustrates capsule geometry and notes
i the numbers of Martian organisms assumed to be in each location. Note
that leakage of organisms from the sample requires failure of all three! seals. Leakage from the container requires failure of the container seal
and compartment seal. Leakage of organisms from the sample compartmentonly requires failure of the sample compartment seal.
! The analysis is conducted separately depending on the mission phase
during which leakage occurs. The two mission phases considered are leak-
i age during the last 30 days of heliocentric transfer (the contributionto contamination probability of MO leaked prior to this is considered
negligible) and leakage during atmospheric entry.
! Table C.l defines events and provides comments on numerical values
i ! assumed in the construction of the probability trees. Figures C.I and
i C.2 show the probability trees constructed from the events and probabil-i itles in Table C.I.
t The results of probability tree roll-back indicate that the proba-
bility of back-contamlnation due to the leakage component during helio-centric transfer (2.7 x I0"I0) is insignificant compared to that due to
leakage during Earth entry (1.2 X 10"6).
.... C-3 _i
!:i
1977018855-103


4/
i; Appendix D
PROBABILITY TREE--SURFACE CONTAMINANTS
!/
1977018855-107
l!
il,
Append ix D
PROBABILITY TREE--SURFACE CONTAMINANTS
Thls appendix summarizes the analysis of the probability of back-contamination due to Martian organisms (MO) located on the exterior ofthe Earth-return vehicle (ERV). MO Initially located on the ERV may be
brought into the Earth's environment either on the surface of the Earth-
entry capsule (EEC) or because they are dislodged prior to EEC recovery, and follow a trajectory that results in Earth capture. Section 3.7.2!_: discusses the assumptions made concerning _he expected fraction of sur-
face MO that would follow various paths that may or may not lead to in-troduction into the Earth's ecosystem. Separate probability trees were
_ constructed to analyze the risk from dislodged HO as opposed to that
i from MO that remain lodged to the EEC.
: For a dislodged MO to result In contamination, it must survive he-
ili liocentric transfer, be captured by Earth, and survive once it enters
Earth's atmosphere. For an organism that remains on the EEC to cause
contamination, it must survive heliocentric transfer and capsule heat-upduring entry. Simple probability trees representing these events fori:
each of the five risk elewents in the surface contaminants risk category:i { 1 are shown in Figure D.I. The results of the tree roll-back calculations:_ are also shown. Table V.l presents some conments on the probabilities-_ assumed for the tree structures.
i
[
; D-3 _i
t
.................................t_........................l ........L. IL:: ....,1977018855-108
/
E_PECTED_ _° NUMBEROF PROBABILITY
PROBABILITY ORGANISMS AT LEASTONEPROBABILITYOF SURVIVES OF SURVIVAL RELEASED ORGANISM
BACK-CONTAMINATION HELIOCENTRIC EARTH FOR EACH INTO EARTH'S SURVIVESDUE TO: TRANSFER CAPTURE ORGANISM ENVIRONMENT 1-(1-p)n
Yes P n
10.3 5.3x10⁻⁴ 5.3x10.-7
ejectionMicr°mete°r°idi2"1x10.10_ N_.._ ,,-0.99
YN
Yes
, ( O.O03No 10.3 1.4xl0".4 1.4xl0.7[ 0.01Thirdmidcourse '!
,,on I,.'x'O"'-----"l\ o..0.99
Yes
/-_L"---" 10.3 1.4x10.4 1.4x10,,.7Yes
\ Noi t Fourthmidcourse_ 0.01
I I-- I
0.99
Yos
Earth entry 0.1 10.3 1,4x10.5 1.4x10.1Z%Vejection [1.4x10"0 NoL 0.9
Yes
Orpnismslodged ..._.....,._!_
to entryupmlo|, 1.4x10,,4"J No_.No._ 10"4 1'4x10"3 1"4x10"7O.ti
FIGURE D.1 PROBABILITY TREES FOR CONTAMINATION DUE TO SURFACECONTAMINANTS
i , i
)D-4
D-5
1977018855-110

:
, ,_ Appendix E i
A PRELIMINARY ANALYSIS !" OF AN ORBITAL RECOVERY OPTION :_
L_
( :
1977018855-111
[
i Appendix Ei A PRELIMINARY ANALYSISOF AN ORBITAL RECOVERY OPTION
As noted in Chapter Ill, the largest source of back-contamlnation_ risk for the reference mission comes from events associated with the
_i Earth-entry phase of the mission A strategy of placing the sample in &"
Earth orbit and recovering it by means of a space vehicle sent from Earth
eliminates the principal Earth-entry-phase risk elements The sample !• Iwould not be opened or analyzed until it reached the planetary sample re- :celving laboratory (PSRL), located on Earth. This strategy thus differs
essentially from that of analyzing the sample in an orbiting receivinglaboratory based on the space shuttle. A brief preliminary analysis of
the risk of back-contamlnatlon from an MSSR mission assuminE orbital re-
covery is presented in this appendix.
i! Orbital recovery has the following advantages over direct Earth
. entry :
• With direct Earth entry, the date and rough location of theentry have to be _pecifled about a year in advance, at the
{ time the Earth return vehicle leaves Mars orbit. By put-ting the sample into Earth orbit, return to the Zarth'ssurface can be scheduled to avoid bad weather or other
short-term risks.
• With direct Earth entry, the Earth-entry capsule flit 3 toMars orbit and back, carrying all subsystems needed for
Earth entry, such as heat shield, parachutes_ flotation de-
il vice, and padding in case of rough landing. By recovering
the capsule in a space shuttle, one could obtain greaterassurance of a safe Earth entry by enclosing the entire
Earth-orbit capsule (EOC) in a bi$_ strong, leakproof ,i steriltzable box. This box could also support maintenance
of proper conditions for the sample during Earth entry(e.g., temperature).
i • Shuttle recovery would ameliorate the problem of contami-t nation from organisms located on the capsule surface. The
capsule would be contained in a sealed box_ which wouldonly be opened at the PSRL. Any possible Martian organ-isms shaken o_f the EOC by the final orbital insertionmaneuver would either settle back on the surface or dis-
perse far from the EOC, assuming the EOC was allowed tostay in Earth orbit for some time before recovery.
,r.,; E'3
........................... ................. ..........................' 1977018855-112
..........ql..................[ ...................i .....riiIil ....i!
ii _'| We thus see that orbital recovery has potential advantages over
_,_ direct Earth entry, in terms of both the problem, of back-contamlnatlon
: and the preservation of the environment of the sample. !
There are two options for recovery of the EOC from orbit:
_ A. Direct recovery by the space shuttle. This would make use !: of the manned, routine, shuttle-entry mode. The EOC would; be required to put itpelf into a near-Earth orbit a_ces-
_i sible to the shuttle. Thi_l wo:,Id require a large velocity iil change and conaequentty a ,_rge amount of propulsion car-
rled to blars orbit and L=:,_.t !
B. Recovery from a 24-hou, aLliptical orbit. This recovery _could be made by a vohicle constructed especially for the !
_ purpose, presumably an unmanned vehicle. The vehicle couldlaunch from a shuttle in orbit or from the ground_ capture i
the EOC, and transport it either to an orbiting shuttle or ..
i__ to the Earth. Alternatively, one would have to find a way
_ to boost the shuttle into this difficult orbit. The EOC_ would be about the same mass as the Earth-entry capsule in
I the case of direct Earth entry--the extra propulsion re-t quired for orbit injection would balance off the weight[ savins due to removal of the unnecessary heat shield and
!_ parachute. _
_ A preliminary analysls of Option A is presented below. The analysis_ (j ! serves as another example application of the methodology developed in this
report.!
i E.1 Probability Tree Constructed for Analysis
Figure E.I shows the probability tree for major equipment failurefor orbital recovery option A. The event probabilities shown in the fig-ure were assessed with the help of Dr. Harry N. Norton of JPL and are
_i discussed briefly in Table E.1. The conditional probabilities of con-tamination are displayed in the figure in square boxes and the total con-tamination probabilities due to all possible scenarios containing a givennode in the tree (risk contributions) are shown in the ovals. A majorsource of risk is the probability that accidental atmospheric entry willfail to sterilise the sample through heatup. Figure E.2 shows the sen-sttivity of the probability of back-contamination to this quantity.
We would like to thank Dr. Harry N. Norton of JPL for an informativediscussion on this topic.
tSee Figure 45 and page 118 in Weaver, Norton_ and Darnell. Is
_Based on a comparison of Tables XXIII and XXIV in Reference 19./-%
t,__ Z-4
1977018855-113
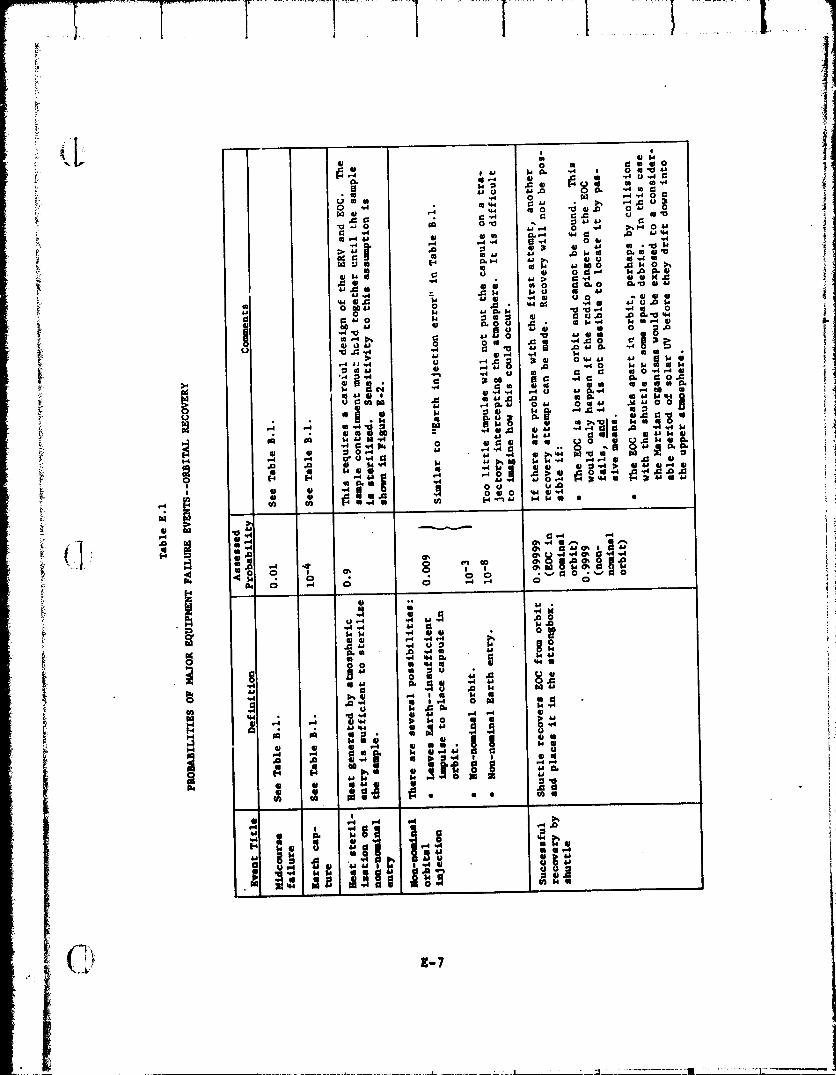
1977018855-114
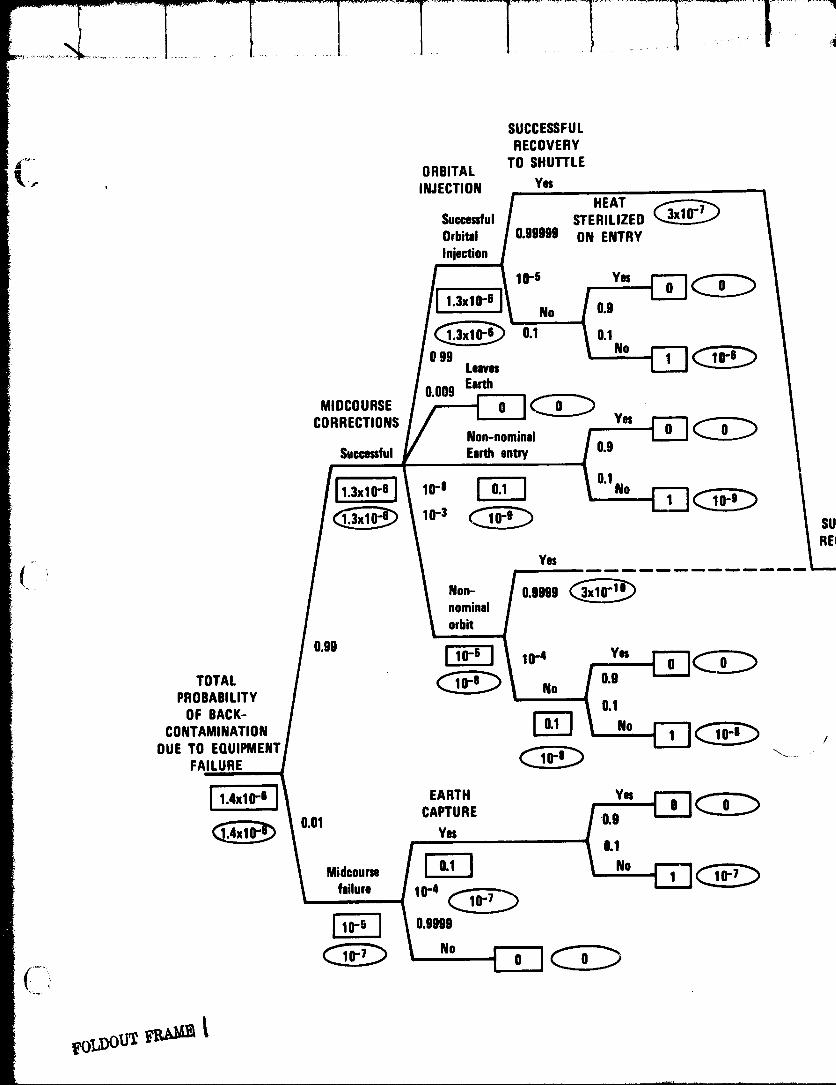
SUCCESSFUL
RECOVERY
_.... ORBITAL TO SHUTTLE_" ' INJECTION Yes
HEATSuccessful STERILIZED _Orbital 0.99999 ON ENTRYInjection
10-5 Yes1.3x10-6
No 0.9
0.1 0.1
[}99 Leaves NoEarth
0.009MIDCOURSE
CORRECTIONS YesNon-nominal / __
0.9Successful Earthentry ]
10-3 SURE(
Yes __.
Non- 0.9999 _'_irl °-_nominalorbit
0,99 _ 10.4 yes
TOTAL No 0,9PROBABILITY 0.1
OF BACK-
CONTAMINATION _ No _ /DUE TO EQUIPMENT
FAILURE
0.01 CAPTUREYes0,1
.d°o,.,failure 10-4
0,9999
_o_ _a_
1977018855-115
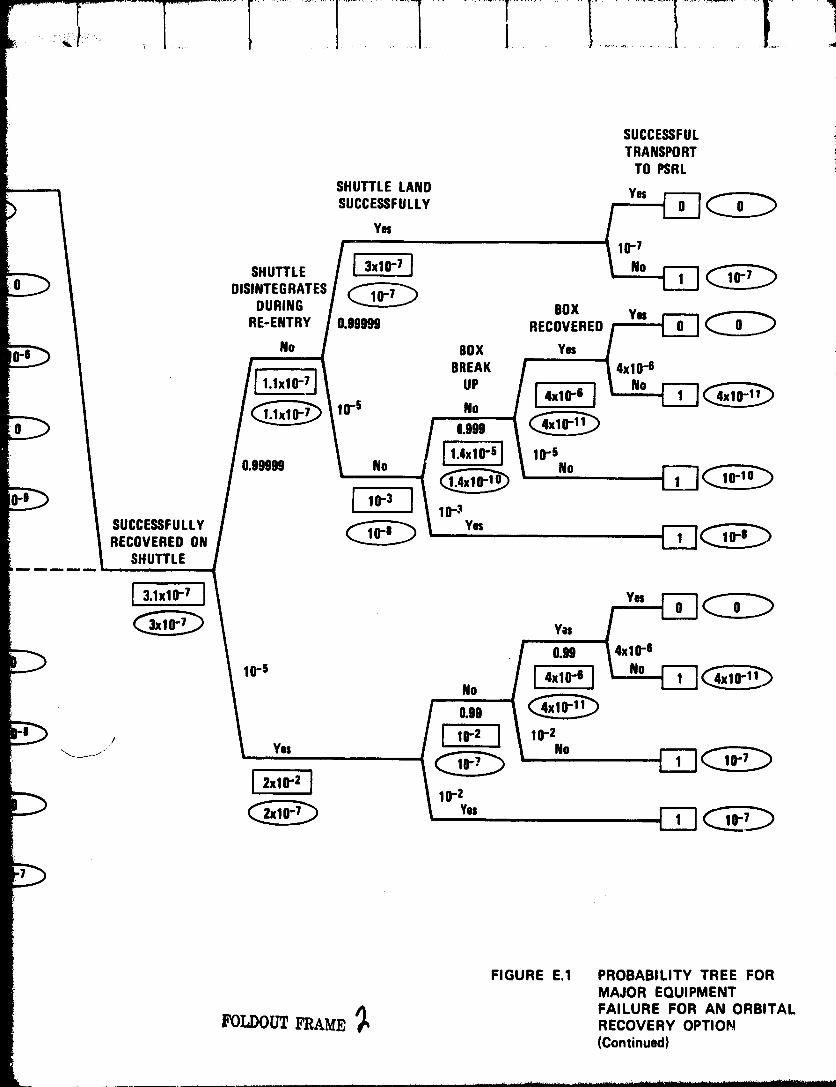
SUCCESSFULTRANSPORT i
TO PSRL
SHUTTLELAND Yes _--_j_
s,,cc.ss,,,..,,.. (DURING BOX
RE-ENTRY 0.99999 RECOVERED
No BOX YesBREAK 4x1Q-6
L 1.1x10⁻⁷ UPlr 5 No I 4x11_6 I
0.999
0.99999 No [1.4sirS] lrSNo
SUCCESSFULLY _ YmRECOVEREDON "__SHUTTLE
I :.,xlo-,J ,,.vo,0.g 4x10⁻⁸
0.99
__j/ Yes i l_z I 11_2
11_2
FIGURE E.1 PROBABILITY TREE FORMAJOR EQUIPMENT
FAILURE FOR AN ORBITALI_'_OI.=DO[.,I__Al_E RECOVERY OPTION(Continued)
1977018855-116

1977018855-117
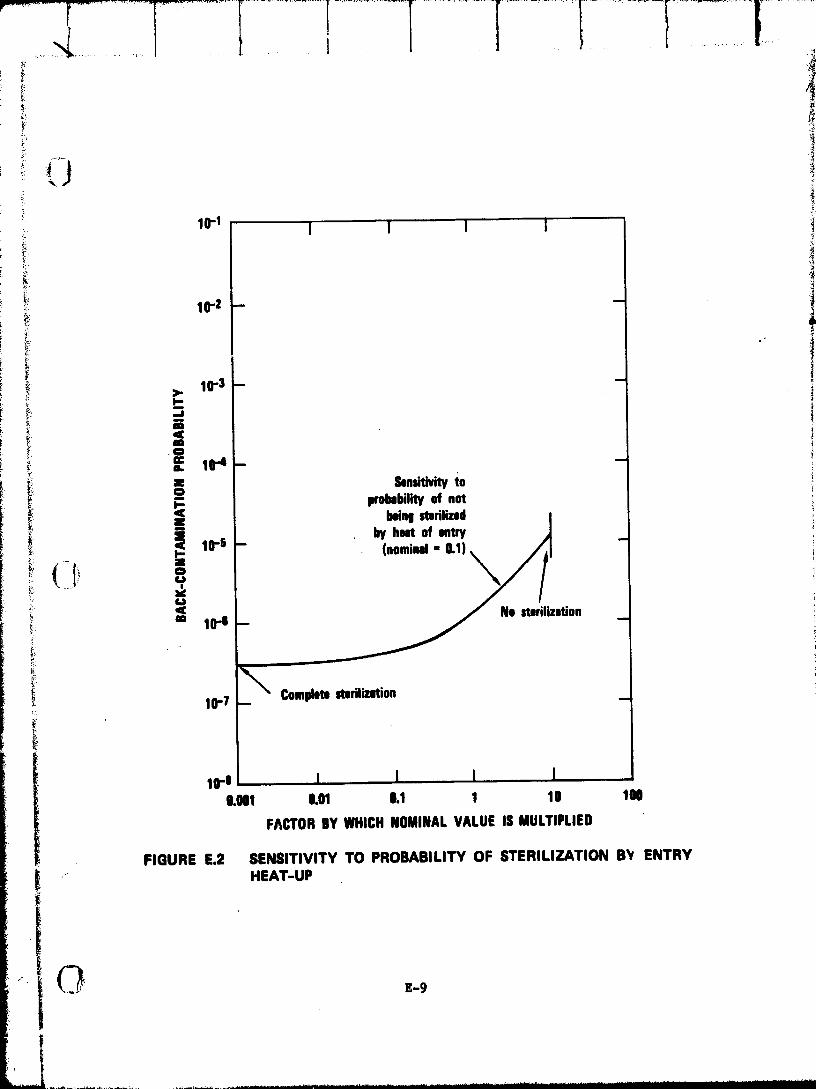
* I
10-I', I I I I
10-2 -
_ _ 104-
!¢
_: _ 10-4
_! _ -- Sensitivityio- I probabilityof not_ _ I Iminl mdlized I-,.-* |
_ _ 10.5 I by heat of .try J
_ __ NO sterilization!i io-,
t 10-7 __ _ Completemfilizaition
I -i
1o-o I I I Io.ool o.ol o.1 1 lo 1oo
FACTORBYWHICHNOMINALVALUEIS MULTIPLIED
FIGURE E.2 SENSITIVITY TO PROBABILITYOF STERILIZATION B_ ENTRY
| ...._ HEAT-UP
............................... _ .... -................ '........................... i,.i ....... lilli'irl iiiiii.......... IIIII......... III ........Ill II ....... II Illll...... II.................................................... i
1977018855-118
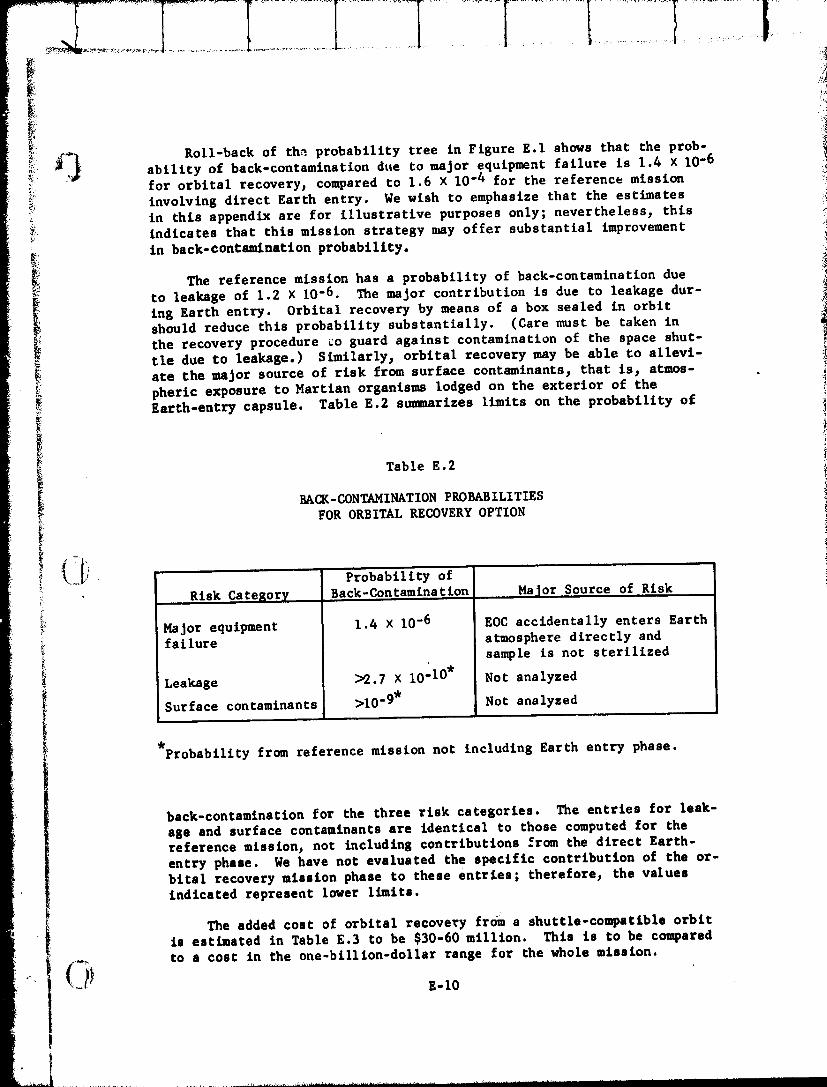
i iiiiiiiiii11 iiiiIiiiiii i..........i....ii iiiI....................................,.....
_i Roll-back of the. probability tree in Figure E.1 shows that the prob-
_j_l ability of back-contamlnation due to major equipment failure is 1.4 x I0-6! for orbital recovery, compared to 1.6 X 10⁻⁴ for the reference mission_ involving direct Earth entry. We wish to emphasize that the estimates
_i in chls appendix are for illustrative purposes only; nevertheless, thisi: indicates that this mission strategy may offer substantial improvement
in back-contamlnatlon probability.
The reference mission has a probability of back-contamination dueto leakage of 1.2 X 10⁻⁶. The major contribution is due to leakage dur-ing Earth entry. Orbital recovery by means of a box sealed in orbitshould reduce this probability substantially. (Care must be taken in
the recovery procedure co guard against contamination of the space shut-tle due to leakage.) Similarly 3 orbital recovery may be able to allevi-
ate the major source of risk from surface contaminants_ that is 2 atmos-pheric exposure to Martian organisms lodged on the exterior of the
_ Earth-entry capsule. Table E.2 summarizes limits on the probability of
Table E.2
BACK-CONTAMINATION PROBABILITIES
FOR ORBITAL RECOVERY OPTION
Probability of
Risk Category Back-Contamination HaJor Source of.Risk
Major equipment 1.4 X 10⁻⁶ EOC accldentally enters Earthfailure atmosphere directly and
sample is not sterilized
Leakage :>2.7 X 10 -10. Not analyzed
Surface contaminants >10 -9. Not analyzed--=
Probability from reference mission not including Earth entry phase.
back-contamination for the three risk categories. The entries for leak-
age and surface contaminants are identicel to those computed for thereference missionj not including contributions _rom the direct Earth-entry phase. We have not evaluated the specific contribution of the or-bital recovery mission phase to these entries; therefore_ the valuesindicated represent lower limits.
The added cost of orbital recovery fr0m a shuttle-compatible orbitis estimated in Table E.3 to be $30-60 million. This is to be compared
(-_ to a cost in the one-billlon-dollar range for the .hole mission._P- Z-lO
d ................................
1977018855-119
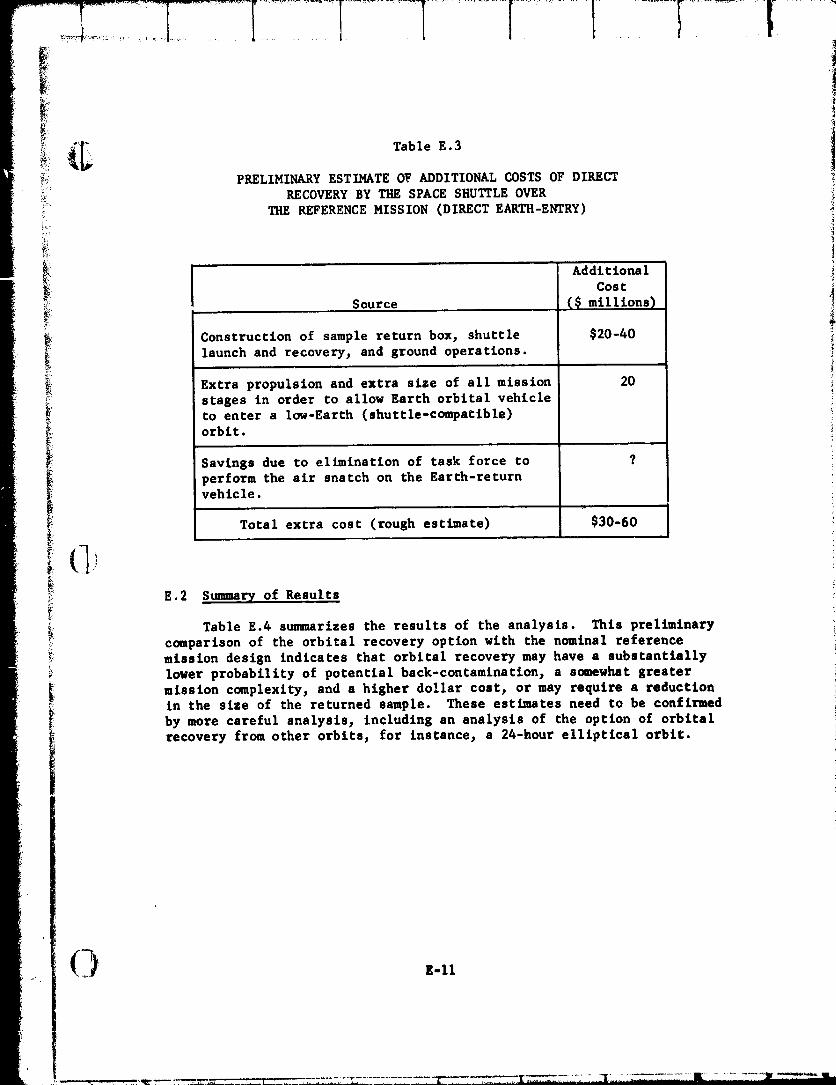
..................... ........................[.......................I ..................I..........................t ..........4
_._ PRELIMINARY ESTIMATE OF ADDITIONAL COSTS OF DIRECT !!_._ RECOVERY BY THE SPACE SHUTTLE OVER;: THE REFERENCE MISSION (DIRECT EARTH-ENTRY)
_ i_._:
Addi tionaI i
Cost i
i source (_millions)Construction of sample return box, shuttle $20-40
• launch and recovery_ and ground operations.
Extra propulsion and extra size of all mission 20 i
_ stages in order to allow Earth orbital vehicle_ to enter a low-Earth (shuttle-compatlble) !
_:i orbit, iSavings due to elimination of task force to ?perform the air snatch on the Earth-return ivehicle.
Total extra cost (rough estimate) $30-60
E.2 Summary of Results :
Table E.4 summarizes the results of the analysis. This preliminary ii comparison of the orbital recovery option with the nominal reference i_: mission design indicates that orbital recovery may have a substantiallyi_ lower probability of potential back-contamination_ a somewhat greater !
mission complexity_ and a higher dollar cost_ or may require a reduction iin the size of the returned sample. These estimates need to be confirmed i
by more careful analysis 3 including an analysis of the option of orbitalrecovery from other orbits_ for instance3 a 24-hour elliptical orbit.
(7_ E.II_L
1977018855-120

_i̧
'_ Table E.4
COMPARISON OF NOMINAL MISSION WITH i_TWO OPTIONS INVOLVING ORBITAL RECOVERY
4!
_'_ Cost Differ-
_i_. Total entlal Above _'!
_ Probabllity Nominal i ,_
_, of Back- Mission Scientific i! Mission Contamination ($ millions) Value I
_ 10-4_ Reference mission 1.6 X 0 Nominal
_ (direct Earth entry) i
_ Orbital recovery-- Not assessed. Not tnvestI- Nominal
24-hour elliptical Possibly gated
orbit somewhat_ above I.4 ×
10 .6 due to:_: extra com-
plex£ty ofmission.
• Orbital recovery-- 1.4 X 10 .6 $30-60 Nominal :low orbit (shuttle- {
compatible)
!
"" E-12
".... -•_......' ........................i ! _____I ! k_l "........._
]977018855-]2]
-++_T+........_ ........T .̧...............!
i! REFERENCES
!_ I. M.R. Chrlstensen, J. L. Bagby, D. L. DeVincenzl, G. V. Levln,_:i P.D. Stebells, R. P. Wolfson, and M. D. Wardle, "Mars Surface Sam-
pie Return Quarantine Planning Study" (preliminary version), Jet
_ Propulsion Laboratory, Pasadena 3 California (December 3, 1976).
_i_ 2. C.L. Yen, "Systems Analysis for the Problem of Back-Contamlnatlon_i Associated with Mars Surface Sample Return Missions," Jet Propulsion
ii Laboratory Engineering Memorandum, Pasadena_ California (November I_
_i+ 1974) •
3. C. Sagan and S. Coleman, "Spacecraft Sterilization Standards andContamination of Mars," Astronautics a.nd Aeronautics, Vol. 3_
pp. 22-27 (May 1965).
4. J.M. Harrison and D. W. North, "Probabilistic Models of Planetary
Contamination," Stanford Research Institute, Menlo Park, California
_ (April 1973).
_i_ _ 5. L.D. Jaf£e, R. E. Csmiron_ R. Choate, F. P. Fanale, E. Halne%
_ C.L. Hobby_ J. S. Hubbard, R. J. Mackln_ Jr., R. S. Saunders, and_ A.B. Whitehead, '_larsSurface Sample Return Science Requirements
_ and Contamination of Earth," Jet Propulsion Laboratory, Pasadena,
Californla (May 28, 1974).
6. R.A. Howard, D. W. North_ and J. P. Pezier, "A New Methodology to
Integrate Planetary Quarantine Requirements into Mission Planning,
with Applicstlon to a Jupiter Orbiter," Stanford Research Institute,
Menlo Park, California (August 1975).
7. J. Hirshleifer, "The Economic Approach to Risk-Benefit Analysis/'
pp. 141-154 in Risk-Benefit Methodology and Application: Some
Papers Presented at the Engineering Foundatlort Workshop_ Sep-t__,_ber 22-26 n 1976 n Asilomarn California, D. Okrent_ ed._ prepared
++ for National Science Poundation_ Energy and Kinetics Departlnent,,_+ School of Engineering and Applied Science, University of California_
Los Angeles, California.
8. R.A. Howard, "Life an_ Death Decision Analysis" (paper to be pub- :i! llshed).
! 9. J. von Neumann and O. Morgenetern, T_heor_ of Gm_s and Economic
i Behavior (Second Edition_ Princeton University Press_ Princeton_
N.J., 1947),
t
9770 8855- 22
10. D. R. Luce and H. Raiffa, Games and Decisions (John Wiley and Sons,
I New York, 1965).k b
II. V. C. Walsh, Introduction to Contemporary Microeconomics (McGraw-
Hill, New York, 1970).
12. J. Linnerooth, "The Evstuation of Life-Savlng: A Survey," IIASARR-
75-21, International Institute for Applied Systems Analysis,
Laxenburg, Austria (1975).
13. S.M. Barrager and D. W. North, "Analyzing the Decision on Radio-
active Waste Management," paper for the EPA Workshop, Stanford
Research Institute, Menlo Park, California (February 1977).
14. AEC "Potential Containment Failure Mechanisms and Their Consequences
at a Radioactive Waste Repository in Bedded Salt in New Mexico,"
ORNL-TM-4639, U.S. AEC, NTIS, Washington, D.C. (October 1974).
15. R. A. Howard, J. E. Matheson, and D. W. North, "The Declsion to
Seed Hurricanes," Sclence, Vol. 176, pp. 1191-1202 (16 June 1972).
16. C. Start, R. L. Rudman, and C. G. Whipple, "Philosophical Basis for
Risk Analysis," pp. 629-662 in Annual Review of Energy, Vol. I,J. M. Hollander and M. K. Simmons, eds., Annual Reviews, Palo Alto,
California (1976).
17. Mr. Frank Morelli, Jet Propulsion Laboratory, private communication.!
i 18. U.S. Nuclear Regulatory Commission, "Reactor Safety Study," pp. IX 19-3
WASH-1400, The Commission, NTIS, Washington, D.C. (October 1975).
19. W. L. Weaver, H. N. Norton, and W. L. Darnell, "Aut_ated Mars
Surface Sample Return Mission Concepts for Achievement of EssentialScientific Objectives," NASA TMX-3184, National Aeronautics and
Space Administ:ation, Washington, D.C. (June 1975).
i i t-2
1977018855-123