standard report on methods and quality (v1) for · pdf fileon a calendar quarter basis...
TRANSCRIPT
1
Standard Report
on
Methods and Quality (v1)
for
QNHS
This documentation applies to the current reporting period:
2016 – Quarter 3
Last edited: <17 November 2016>
CENTRAL STATISTICS OFFICE
Skehard Road, Cork
021 4535000
www.cso.ie

2
Table of Contents
1 Overview
2 General Information
2.1 Statistical Category
2.2 Area of Activity
2.3 Organisational Unit Responsible, Persons to Contact
2.4 Objectives and Purpose; History
2.5 Periodicity
2.6 Client
2.7 Users
2.8 Legal basis
3 Statistical Concepts, Methods
3.1 Subject of the Statistics
3.2 Units of Observation/Collection Units/Units of Presentation
3.3 Data Sources
3.4 Reporting Unit/Respondents
3.5 Type of Survey/Process
3.6 Characteristics of the Sample/Process
3.6.1 Population and Sampling Frame
3.6.2 Sampling Design
3.7 Survey Technique/Data Transfer
3.8 Questionnaire (including explanations)
3.9 Participation in the Survey
3.10 Characteristics of the Survey/Process and its Results
3.11 Classifications used
3.12 Regional Breakdown of Results
4 Production of the Statistics, Data Processing, Quality Assurance
4.1 Data Capture
4.2 Coding
4.3 Data Editing
4.4 Imputation (for Non-Response or Incomplete Data Sets)
4.5 Grossing and Weighting
4.6 Computation of Outputs, Estimation Methods Used
4.7 Other Quality Assurance Techniques Used
5 Quality
5.1 Relevance
5.2 Accuracy and Reliability
5.2.1. Sampling Effects, Representativity
5.2.2. Non-Sampling Effects
5.2.2.1 Quality of the Data Sources used
5.2.2.2 Register Coverage
5.2.2.3 Non-response (Unit and Item)
5.2.2.4 Measurement Errors
5.2.2.5 Processing Errors
3
5.2.2.6 Model-related Effects
5.3 Timeliness and Punctuality
5.3.1 Provisional Results
5.3.2 Final Results
5.4 Coherence
5.5 Comparability
5.6 Accessibility and Clarity
5.6.1 Assistance to Users, Special Analyses
5.6.2 Revisions
5.6.3 Publications
5.6.3.1 Releases, Regular Publications
5.6.3.2 Statistical Reports
5.6.3.3 Internet
5.6.4 Confidentiality
6 Additional documentation and publications
4
1 Overview
The Quarterly National Household Survey (QNHS) began in September 1997, replacing
the annual April Labour Force Survey (LFS). The survey meets the requirements of
Council Regulation (EC) No.577/98, adopted in March 1998, which requires the
introduction of quarterly labour force surveys in EU Member States. Outputs are
primarily used to produce quarterly labour force, employment and unemployment
estimates for Ireland. In addition to meeting EU requirements, the QNHS is also used as a
means of collecting data on important social topics, included as modules in the survey,
either for EU requirements or to meet national data needs. Outputs are also supplied to
other internal users such as National Accounts, Tourism and Earnings.
Information is collected in the field by a team of face-to-face interviewers using
Computer Assisted Personal Interviewing (CAPI) on laptop computers (using a Blaise
application). Information is collected continuously throughout the year from households
surveyed each week in each quarter. The total quarterly sample is designed to be 26,000
households. The actual achieved sample varies over time depending on the level of
response. The achieved sample can be seen in section 5.2.2.3.
5
2 General Information
2.1 Statistical Category
Primary Statistical survey
2.2 Area of Activity
Labour Market
2.3 Organisational Unit Responsible, Persons to Contact
The relevant sections are part of the Social and Demographic Statistics Directorate.
The work of QNHS section is largely divided into two areas – a Household Survey
Collection Unit (HSCU) and a Labour Market Analysis publication unit. Each unit is
headed by a Senior Statistician who also has responsibility for other survey areas.
Labour Market Analysis queries
Jim Dalton Tel: +353 021 453 5093 Email: [email protected]
Martina O’Callaghan Tel: +353 021 453 5491 Email: [email protected]
Household Survey Collection Unit queries
Breda Fallon Tel: +353 021 453 5431 Email: [email protected]
2.4 Objectives and Purpose; History
The QNHS has been in operation since September 1997, replacing the annual labour
force survey. The primary purpose of the survey is to collect information on the Irish
labour market (collected via what is known as the “CORE” questionnaire). It also collects
information on a wide range of social topics (generally via what is known as “MODULE”
questionnaires).
2.5 Periodicity
Information is collected continuously throughout the year. The sample is designed to be
representative on a quarterly basis with a target of 2,000 households to be surveyed each
week. This results in a total design sample of 26,000 households in each quarter. The
reference quarters for survey results are: Q1- January to March, Q2- April to June, Q3-
July to September and Q4- October to December. (i.e. calendar quarters).
The QNHS changed from seasonal quarters to calendar quarters in Q1 2009. Previously,
the QNHS operated on a seasonal quarter basis. (Q1- December to February, Q2- March
to May, Q3- June to August, Q4- September to November) For further information on the
changeover to calendar quarters, see the supplementary note linked below.
http://www.cso.ie/en/media/csoie/qnhs/documents/calendar/supplementarynote.pdf

6
Results previously published on a seasonal quarter basis have been revised and reissued
on a calendar quarter basis covering the periods Q1 1998 to Q4 2008.
2.6 Client
Each Member State in the EU must undertake a Labour Force Survey (LFS) to provide
information on key labour market indicators. The QNHS is the Irish implementation of
the EU-LFS. The QNHS also provides important inputs to national policy makers.
2.7 Users
European Union/Eurostat
Government departments (Department of the Taoiseach, Department of Finance,
Department of Jobs, Enterprise and Innovation, Department of Social Protection,
Department of Education etc)
FAS/SOLAS – National Skills Training Agency
Other research centres and universities involved in labour market research
National media
The general public
2.8 Legal basis
The QNHS is carried out under EU Council Regulation No 577/98. There are also a
number of implementing regulations which outline various aspects of the survey, how
data should be coded for transmitting to Eurostat, the topics for pan European ad-hoc
modules etc.
http://epp.eurostat.ec.europa.eu/portal/page/portal/employment_unemployment_lfs/docu
ments/DS_LFS_EN_6_subdoc_regulation.pdf
While Ireland as a member state is obliged to undertake the QNHS, participation in the
survey is voluntary for respondents.
7
3 Statistical Concepts, Methods
3.1 Subject of the Statistics
Labour market statistics.
3.2 Units of Observation/Collection Units/Units of Presentation
The survey population is individuals living in private households. It therefore excludes
individuals living in institutions or communal accommodation and persons of no fixed
abode. The collection units are households containing at least one individual aged 15
years or over for whom it is the main residence. Information is collected on each
individual within a surveyed household.
The main units of presentation are:
Demographic variables such as Sex, Age, Nationality
Other personal characteristics such as Regional classification NUTS 2 & 3
(Nomenclature of Territorial Units), Highest level of education attained etc.
International Labour Office labour force classification (ILO Status)
Industrial activity classification NACE Rev.2 (Nomenclature des Activités de la
Communauté Européenne)
Occupation
Employment status
While the above are the primary presentation units for regular publication the QNHS can
present data according to a wide variety of classifications based on the comprehensive
range of questions asked in the survey. Such analysis is often provided on an ad hoc basis
following user requests.
3.3 Data Sources
For the QNHS core publication and modules, information is collected from individuals in
households.
3.4 Reporting Unit/Respondents
All ‘usual residents1' in responding households are surveyed. Where a particular
individual is not available for interview, information can be provided by another member
of the household in most circumstances via a proxy interview. A proxy interview refers to
1A person is defined as a "Usual Resident" of a private household if he or she
(i) Lives regularly at the dwelling in question
and
(ii) Shares the main living accommodation (i.e. kitchen, living room or bathroom) with the
other members of the household.
8
data which is collected from another member of the household due to the unavailability
of the specific respondent at the time of the interview.
3.5 Type of Survey/Process
Sample survey.
3.6 Characteristics of the Sample/Process
3.6.1 Population and Sampling Frame
The reference population is all individuals living in private households in Ireland. It
therefore excludes persons with no usual address or those with a usual residence in a
public institution, such as hospitals, nursing homes etc. All usual residents in each
household are included. The sampling frame is all private households in Ireland.
Beginning in Q4 2012, a new sample based on the 2011 Census of Population was
introduced incrementally and this sample was fully in effect as of Q4 2013. An additional
sample also based on the 2011 Census of Population will be introduced incrementally
from Q3 2016.
3.6.2 Sample Design
Sample size and design was determined after consultation with relevant experts23
who
considered a mix of factors including cost, levels of precision of estimates etc. A new
approach was introduced in Q4 2012 based on the review by Haase Pratschke.
With this new design, a two-stage sample design is used. The sample frame of
households is clustered into blocks (small areas) with each block containing a minimum
of 60 occupied households on the night of the 2011 Census of Population. In the case of
the sample introduced in 2012 the sample frame is stratified using administrative county
and population density while the sample introduced in 2016 is stratified using
administrative county and the Pobal HP (Haase and Pratschke) Deprivation Index. In the
first stage 1,300 blocks are selected using Probability Proportional to Size (PPS)
sampling and in the second stage 20 households are selected using Simple Random
Sampling (SRS). This ensures that each household in the sample frame has an equal
probability of selection and results in a total quarterly sample of 26,000 households. The
actual achieved sample varies over time depending on the level of response.
2 Steel report, http://www.cso.ie/en/media/csoie/qnhs/documents/steel_report_qnhs_sample_design.pdf
3 Haase Pratschke Report on Optimising the Sampling Methodology for CSO Household Surveys
http://www.cso.ie/en/media/csoie/surveysandmethodologies/documents/pdfdocs/Haase,Pratschke,Report,on
,Optimising,the,Sampling,Methodology,for,CSO,Household,Surveys.pdf
9
Households are asked to take part in the survey for five consecutive quarters and are then
replaced by other households in the same block. Thus, one fifth of the households in the
survey are replaced each quarter and the QNHS sample involves an overlap of 80%
between consecutive quarters and 20% between the same quarters in consecutive years.
As the new sample based on the 2011 Census of Population was introduced incrementally
across each quarter from Q4 2012 to Q4 2013, this new sample and new sample design is
fully effective from Q4 2013.
3.7 Survey Technique/Data Transfer
QNHS interviewers visit each household and ask the residents to voluntarily participate
in the survey. Data are collected on encrypted laptop computers using CAPI (Computer
Assisted Personal Interviewing). Every week the survey interviewer transmits the weekly
data collected from households to head office using a secure encrypted data tunnel.
3.8 Questionnaire (including explanations)
The QNHS questionnaire contains approximately 200 questions on a range of topics
including the respondents economic status (i.e. employed, unemployed, not in the labour
force), industry of employment, nationality, employment status, occupation, education
level, length of time unemployed etc. It can be noted that not all questions are asked of all
respondents as questions are filtered based on the responses given by the interviewee.
Additional questions on a particular topic are included for modules which are run in
individual quarters.
The QNHS and module questionnaires are available on the CSO website:
http://www.cso.ie/en/qnhs/qnhsmethodology/
3.9 Participation in the Survey
Participation in the survey is voluntary.
3.10 Characteristics of the Survey/Process and its Results
The survey is designed to produce Labour Force estimates for the State.
The data which are published in the main quarterly release refer to the estimated number
of persons aged 15 years or over in the state classified by various characteristics
including economic status (e.g. employed, unemployed, not in the labour force) in
accordance with the ILO (International Labour Organisation) definition. Three key rates
are also produced from the survey: the participation rate (the proportion of all persons
aged 15 or more who are in the Labour Force), the employment rate (the proportion of all
persons aged 15-64 who are in employment) and the unemployment rate (the proportion
of all persons aged 15-74 in the Labour Force who are unemployed. The calculation of
the unemployment rate has been revised slightly as of Q2 2015 to ensure coherence with
10
Eurostat. Economic status is in turn classified by various characteristics such as age, sex,
region, educational level, etc.
Some of the key indicators produced are estimates of those in employment by occupation
and industry and estimates of those unemployed by duration of unemployment.
For full details of published indicators please see the latest QNHS release on www.cso.ie.
3.11 Classifications used
There are a number of different classifications used in the QNHS:
The main classifications of economic activity are the standard ILO definitions of
persons in employment, unemployment (which are summed to derive the labour
force total) and persons not in labour force.
Industry is published by the NACE Rev 2 classification.
Occupation is primarily published using the UK SOC 2010 classification for
national purposes and is also coded to ISCO-08 classification for EU purposes.
Education details are coded to ISCED 1997 (International Standard Classification
of Education) for EU purposes and to a national classification for Irish purposes.
Field of education is likewise coded. In 2014 a new updated ISECD 2011
classification will be used.
Regional data is coded to NUTS3 as described in Section 3.12
Detailed data is collected through the interview to allow outputs to be produced
according to all the relevant classifications.
3.12 Regional Breakdown of Results
The regional classifications used are based on the NUTS (Nomenclature of Territorial
Units) classification used by Eurostat. The NUTS3 regions correspond to the eight
Regional Authorities established under the Local Government Act, 1991 (Regional
Authorities) (Establishment) Order, 1993, which came into operation on 1 January 1994.
The NUTS2 regions, which were proposed by Government and agreed by Eurostat in
1999, are groupings of the NUTS3 regions. The sample itself is designed to be
representative at NUTS3 level although some results may be repressed depending on the
number of observations in the particular cell. The composition of the regions is set out
below:
NUTS2: Border, Midlands and Western Southern and Eastern
NUTS3: Border Cavan Dublin Dublin
Donegal Dún Laoghaire-Rathdown

11
Leitrim Fingal
Louth South Dublin
Monaghan
Sligo Mid-East Kildare
Meath
Midlands Laoighis Wicklow
Longford
Offaly Mid-West Clare
Westmeath Limerick City
Limerick County
West Galway City North Tipperary
Galway County
Mayo South-East Carlow
Roscommon Kilkenny
South Tipperary
Waterford City
Waterford County
Wexford
South-West Cork City
Cork County
Kerry
12
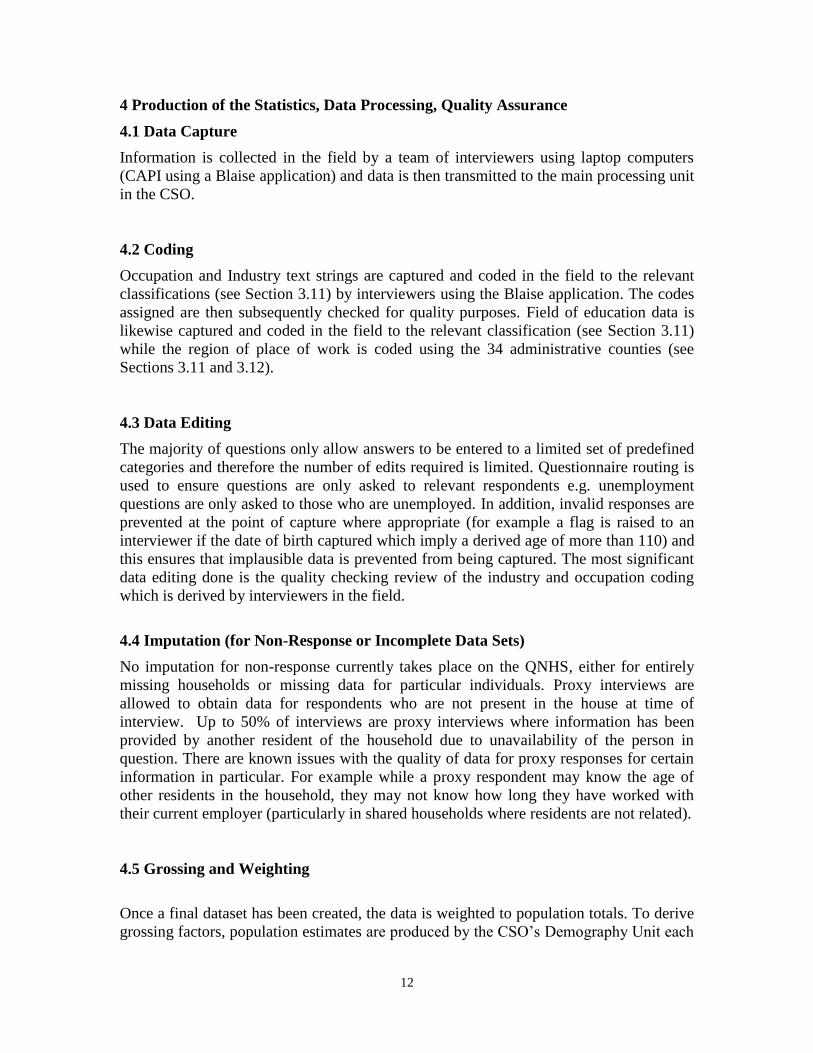
4 Production of the Statistics, Data Processing, Quality Assurance
4.1 Data Capture
Information is collected in the field by a team of interviewers using laptop computers
(CAPI using a Blaise application) and data is then transmitted to the main processing unit
in the CSO.
4.2 Coding
Occupation and Industry text strings are captured and coded in the field to the relevant
classifications (see Section 3.11) by interviewers using the Blaise application. The codes
assigned are then subsequently checked for quality purposes. Field of education data is
likewise captured and coded in the field to the relevant classification (see Section 3.11)
while the region of place of work is coded using the 34 administrative counties (see
Sections 3.11 and 3.12).
4.3 Data Editing
The majority of questions only allow answers to be entered to a limited set of predefined
categories and therefore the number of edits required is limited. Questionnaire routing is
used to ensure questions are only asked to relevant respondents e.g. unemployment
questions are only asked to those who are unemployed. In addition, invalid responses are
prevented at the point of capture where appropriate (for example a flag is raised to an
interviewer if the date of birth captured which imply a derived age of more than 110) and
this ensures that implausible data is prevented from being captured. The most significant
data editing done is the quality checking review of the industry and occupation coding
which is derived by interviewers in the field.
4.4 Imputation (for Non-Response or Incomplete Data Sets)
No imputation for non-response currently takes place on the QNHS, either for entirely
missing households or missing data for particular individuals. Proxy interviews are
allowed to obtain data for respondents who are not present in the house at time of
interview. Up to 50% of interviews are proxy interviews where information has been
provided by another resident of the household due to unavailability of the person in
question. There are known issues with the quality of data for proxy responses for certain
information in particular. For example while a proxy respondent may know the age of
other residents in the household, they may not know how long they have worked with
their current employer (particularly in shared households where residents are not related).
4.5 Grossing and Weighting
Once a final dataset has been created, the data is weighted to population totals. To derive
grossing factors, population estimates are produced by the CSO’s Demography Unit each
13
quarter by sex, age (5 year age groups) and region (8 NUTS 3 regions). In addition, the
Demography unit produce estimates of population for each quarter by sex, broad age (less
than 15 and 15 or more) and nationality (5 nationality groups including Ireland, UK,
EU13, EU13 (the EU excluding the EU15) and Rest of World). The individual returns are
matched to these population estimates and the grossing factor is calculated by dividing
the total estimates population in a given cell by the number of valid responses in that cell
- i.e. if there are 1,000 respondents from the sample in a given cell and an estimated
population of 40,000 then each of the respondents in this cell will have a grossing factor
of 40. The grossing procedure is carried out using the SAS CALMAR statistical software
routine which was developed by the French National Statistical Institute, INSEE.
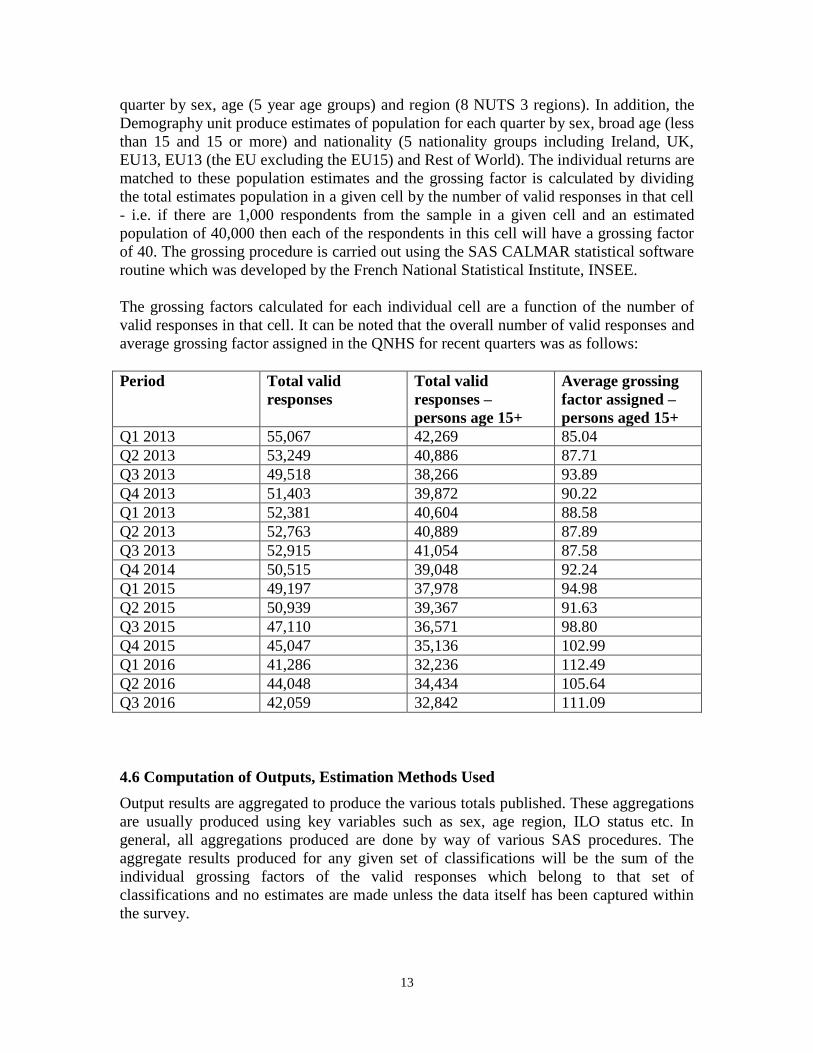
The grossing factors calculated for each individual cell are a function of the number of
valid responses in that cell. It can be noted that the overall number of valid responses and
average grossing factor assigned in the QNHS for recent quarters was as follows:
Period Total valid
responses
Total valid
responses –
persons age 15+
Average grossing
factor assigned –
persons aged 15+
Q1 2013 55,067 42,269 85.04
Q2 2013 53,249 40,886 87.71
Q3 2013 49,518 38,266 93.89
Q4 2013 51,403 39,872 90.22
Q1 2013 52,381 40,604 88.58
Q2 2013 52,763 40,889 87.89
Q3 2013 52,915 41,054 87.58
Q4 2014 50,515 39,048 92.24
Q1 2015 49,197 37,978 94.98
Q2 2015 50,939 39,367 91.63
Q3 2015 47,110 36,571 98.80
Q4 2015 45,047 35,136 102.99
Q1 2016 41,286 32,236 112.49
Q2 2016 44,048 34,434 105.64
Q3 2016 42,059 32,842 111.09
4.6 Computation of Outputs, Estimation Methods Used
Output results are aggregated to produce the various totals published. These aggregations
are usually produced using key variables such as sex, age region, ILO status etc. In
general, all aggregations produced are done by way of various SAS procedures. The
aggregate results produced for any given set of classifications will be the sum of the
individual grossing factors of the valid responses which belong to that set of
classifications and no estimates are made unless the data itself has been captured within
the survey.

14
4.7 Other Quality Assurance Techniques Used
A series of field audits are carried out each quarter to verify the quality of the individual
data being collected. Interviewers receive regular feedback on the quality of the data they
are producing and any unusual trends are highlighted and followed-up. Interviewers
undergo training when first employed and regular meetings are held with field co-
ordinators to ensure standards are maintained. Further training is also provided to
interviewers where appropriate.
At an aggregate level, account is taken of other national economic indicators (e.g. Live
Register trends, taxation trends) when quality checking the data produced from the
QNHS.
15
5 Quality
5.1 Relevance
The data is required under EU Council Regulation No 577/98. The QNHS is the primary
source of a number of key national indicators including official estimates of employment
and unemployment. In addition to the main labour market estimates published on a
quarterly basis, QNHS data are used in a number of other reports and publications
produced by the CSO. In the period between each Census of Population, the QNHS
provides estimates of various demographic and other social indicators such as levels of
educational attainment. Given the critical nature of estimates produced the relevance of
the QNHS can be taken as very high.
Other CSO sections which make use of QNHS data include:
National accounts
Construction
Earnings and employment
Tourism
External users who make significant use of QNHS data include, but is not limited to:
ESRI
Central Bank
SOLAS
Health and Safety Authority
The Oireachtas
Department of Finance
Department of Enterprise, Jobs and Innovation
Department of Education and Skills
Department of Health and Children
Department of Social Protection
National media organisations
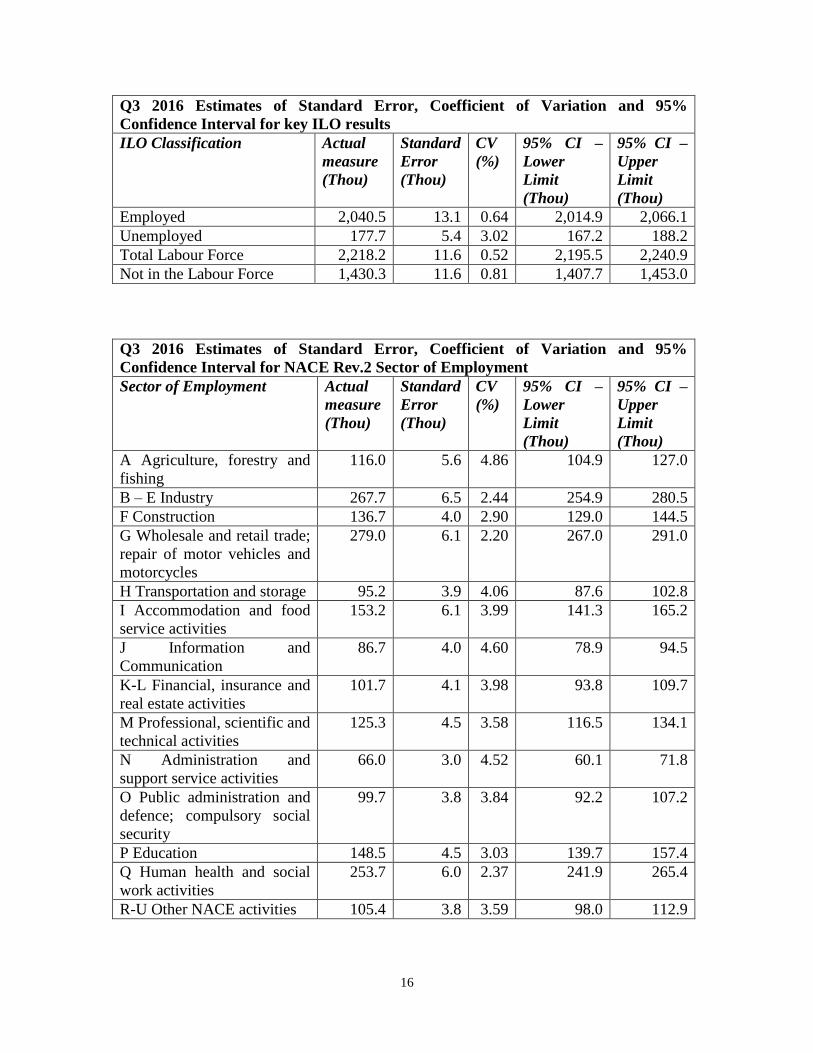
5.2 Accuracy and Reliability
5.2.1. Sampling Effect & representativeness
As QNHS is a sample survey it is subject to sampling error. Precision estimates are
calculated using Jackknife replication for key variables. The table below shows estimated
standard errors and confidence intervals for some of the QNHS’s key estimates for the
most recent quarter, Q1 2015. The 95% confidence intervals indicate the range within
which we can be 95% confident the true value of the estimate in question will lie based
on measurable sampling error.
16
Q3 2016 Estimates of Standard Error, Coefficient of Variation and 95%
Confidence Interval for key ILO results
ILO Classification Actual
measure
(Thou)
Standard
Error
(Thou)
CV
(%)
95% CI –
Lower
Limit
(Thou)
95% CI –
Upper
Limit
(Thou)
Employed 2,040.5 13.1 0.64 2,014.9 2,066.1
Unemployed 177.7 5.4 3.02 167.2 188.2
Total Labour Force 2,218.2 11.6 0.52 2,195.5 2,240.9
Not in the Labour Force 1,430.3 11.6 0.81 1,407.7 1,453.0
Q3 2016 Estimates of Standard Error, Coefficient of Variation and 95%
Confidence Interval for NACE Rev.2 Sector of Employment
Sector of Employment Actual
measure
(Thou)
Standard
Error
(Thou)
CV
(%)
95% CI –
Lower
Limit
(Thou)
95% CI –
Upper
Limit
(Thou)
A Agriculture, forestry and
fishing
116.0 5.6 4.86 104.9 127.0
B – E Industry 267.7 6.5 2.44 254.9 280.5
F Construction 136.7 4.0 2.90 129.0 144.5
G Wholesale and retail trade;
repair of motor vehicles and
motorcycles
279.0 6.1 2.20 267.0 291.0
H Transportation and storage 95.2 3.9 4.06 87.6 102.8
I Accommodation and food
service activities
153.2 6.1 3.99 141.3 165.2
J Information and
Communication
86.7 4.0 4.60 78.9 94.5
K-L Financial, insurance and
real estate activities
101.7 4.1 3.98 93.8 109.7
M Professional, scientific and
technical activities
125.3 4.5 3.58 116.5 134.1
N Administration and
support service activities
66.0 3.0 4.52 60.1 71.8
O Public administration and
defence; compulsory social
security
99.7 3.8 3.84 92.2 107.2
P Education 148.5 4.5 3.03 139.7 157.4
Q Human health and social
work activities
253.7 6.0 2.37 241.9 265.4
R-U Other NACE activities 105.4 3.8 3.59 98.0 112.9
17
Variance estimation for stratified household surveys is complex and there are a number
of different methods. Further information is also available from the following links
regarding variance analysis. It can also be noted that CSO continues to examine
alternative methods of estimation and will expand the availability of measures for which
such data is produced.
http://epp.eurostat.ec.europa.eu/cache/ITY_OFFPUB/KS-RA-13-029/EN/KS-RA-13-
029-EN.PDF
http://epp.eurostat.ec.europa.eu/portal/page/portal/quality/documents/MOS%20VARIAN
CE%20ESTIMATION%202002.pdf
5.2.2. Non-Sampling Effects
In addition to known sampling errors, any survey will be subject to other non-sampling
errors (for example measurement errors arising from questions not capturing the desired
information accurately). Non-sampling error is far more difficult to measure than
sampling error and no formal estimate of non-sampling error is available in the QNHS.
Information on the interviews is collected and analysed to help minimise non-sampling
effects (including, for example, when interviews were conducted and their duration). This
information is compared across the interview team to ensure no unusual variation in
interviewer performance exists. Co-ordinators, as an additional check on the quality of
the interviewer's work, call back to around 2% of households to check the quality of the
collected data.
5.2.2.1 Quality of the Data Sources used (other than survey register)
Not applicable.
5.2.2.2 Register Coverage
The entire stock of private households at the time of the most recent Census of
Population in the country represents the full sampling frame for the QNHS. The sample
based on the 2011 Census was begun to be introduced on a wave by wave basis in Q4
2012 and was fully in effect as of Q4 2013.
To reduce response burden old samples are examined so as to avoid an overlap, i.e.
blocks in the old sample were deliberately excluded from the new sample to avoid
response burden for included households.
18
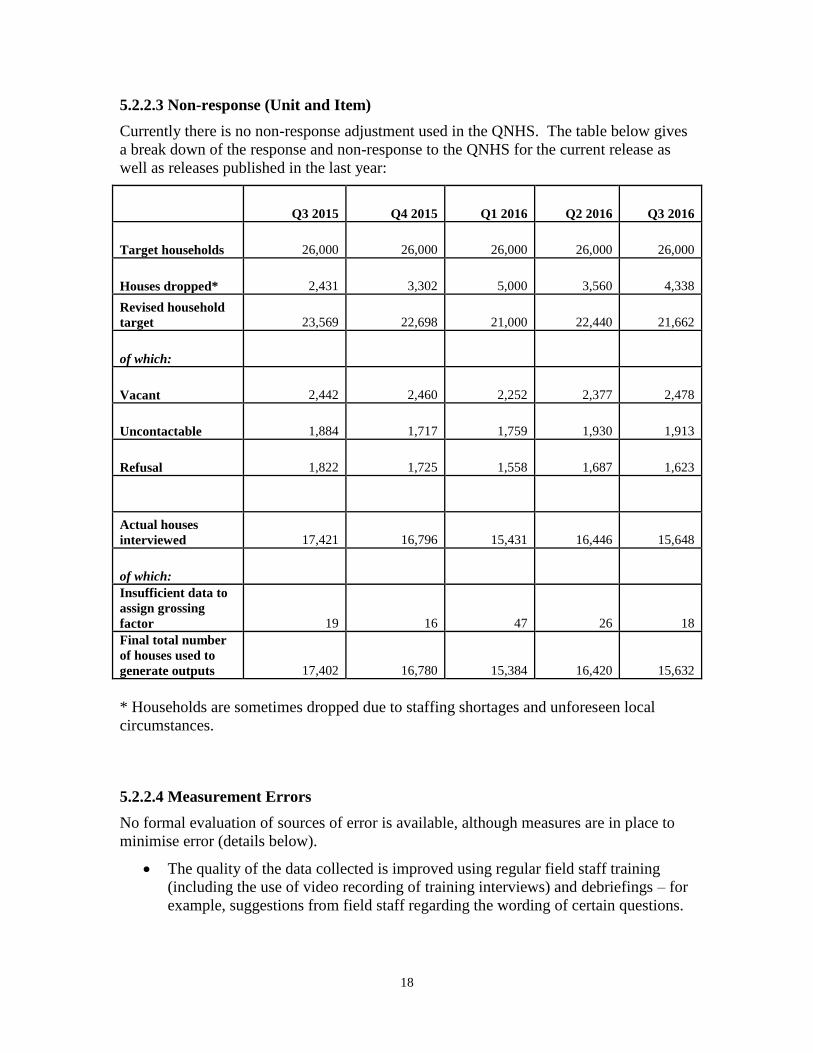
5.2.2.3 Non-response (Unit and Item)
Currently there is no non-response adjustment used in the QNHS. The table below gives
a break down of the response and non-response to the QNHS for the current release as
well as releases published in the last year:
Q3 2015 Q4 2015 Q1 2016 Q2 2016 Q3 2016
Target households 26,000 26,000 26,000 26,000 26,000
Houses dropped* 2,431 3,302 5,000 3,560 4,338
Revised household
target 23,569 22,698 21,000 22,440 21,662
of which:
Vacant 2,442 2,460 2,252 2,377 2,478
Uncontactable 1,884 1,717 1,759 1,930 1,913
Refusal 1,822 1,725 1,558 1,687 1,623
Actual houses
interviewed 17,421 16,796 15,431 16,446 15,648
of which:
Insufficient data to
assign grossing
factor 19 16 47 26 18
Final total number
of houses used to
generate outputs 17,402 16,780 15,384 16,420 15,632
* Households are sometimes dropped due to staffing shortages and unforeseen local
circumstances.
5.2.2.4 Measurement Errors
No formal evaluation of sources of error is available, although measures are in place to
minimise error (details below).
The quality of the data collected is improved using regular field staff training
(including the use of video recording of training interviews) and debriefings – for
example, suggestions from field staff regarding the wording of certain questions.
19
Respondent effects - most of the requested information is readily available to
respondents. Proxy responses are not allowed for certain questions (for example
income). A lot of the national modules only allow direct responses to improve
data quality.
Comprehension errors - most of the terms used by the survey are readily
understood, although some issues occasionally arise.
5.2.2.5 Processing Errors
a. Data capture errors: These errors are minimised by logic checks and limits on values
that can be keyed for each question in the electronic questionnaire at the data
collection point.
b. Coding error: Checks are in place to minimise this risk, particularly with respect to
occupational coding. The coding is initially performed in the field (interviewers using
the Blaise application) with checks on this work then performed in the survey area.
5.2.2.6 Model-related Effects
Not applicable.
5.3 Timeliness and Punctuality
5.3.1 Provisional Results
No provisional outputs are published.
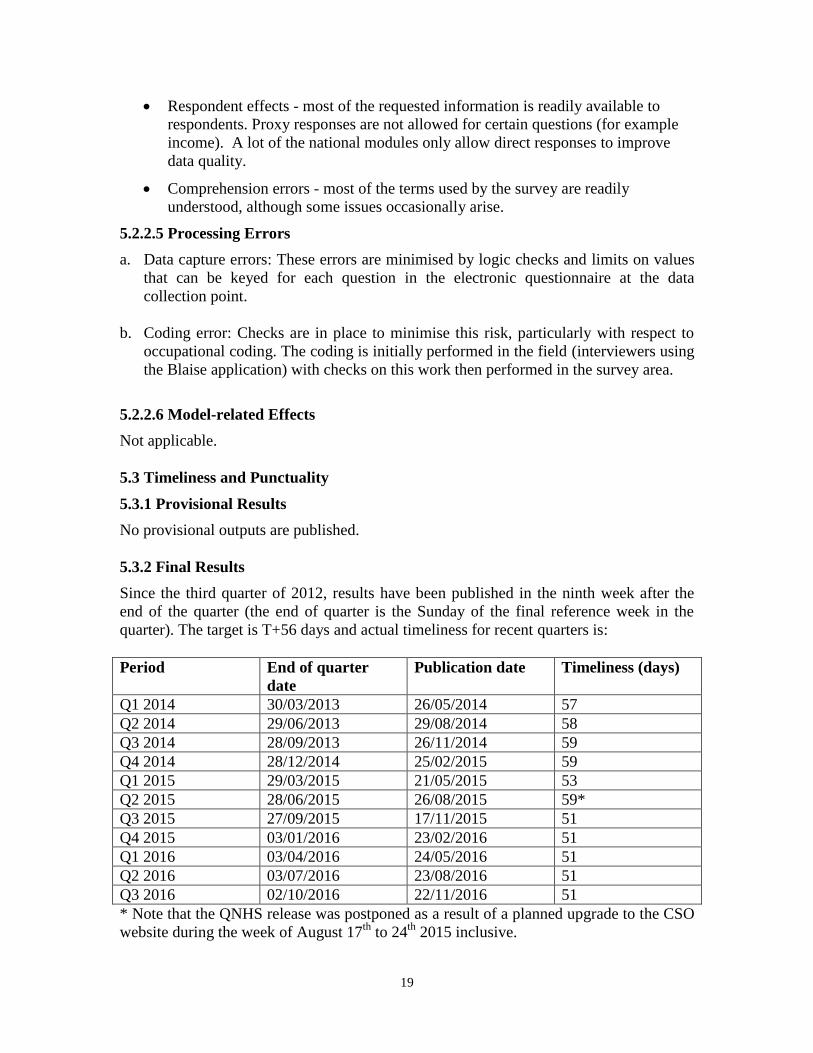
5.3.2 Final Results
Since the third quarter of 2012, results have been published in the ninth week after the
end of the quarter (the end of quarter is the Sunday of the final reference week in the
quarter). The target is T+56 days and actual timeliness for recent quarters is:
Period End of quarter
date
Publication date Timeliness (days)
Q1 2014 30/03/2013 26/05/2014 57
Q2 2014 29/06/2013 29/08/2014 58
Q3 2014 28/09/2013 26/11/2014 59
Q4 2014 28/12/2014 25/02/2015 59
Q1 2015 29/03/2015 21/05/2015 53
Q2 2015 28/06/2015 26/08/2015 59*
Q3 2015 27/09/2015 17/11/2015 51
Q4 2015 03/01/2016 23/02/2016 51
Q1 2016 03/04/2016 24/05/2016 51
Q2 2016 03/07/2016 23/08/2016 51
Q3 2016 02/10/2016 22/11/2016 51
* Note that the QNHS release was postponed as a result of a planned upgrade to the CSO
website during the week of August 17th
to 24th
2015 inclusive.

20
The main indicators which are published in the core release are ILO status (employed,
unemployed etc.), industry of employment, occupation of employment, status of
employment, duration of unemployment etc. Indicators are published by a range of
classifications including sex, age, nationality, region of residence and highest level of
education attained although not all indicators are published by each classification due to
small cell sizes.
The primary classification used for the QNHS results is the ILO (International Labour
Office) labour force classification. Labour Force Survey data on this basis have been
published since 1988. The ILO classification distinguishes the following main subgroups
of the population aged 15 or over:
In Employment: Persons who worked in the week before the survey for one hour
or more for payment or profit, including work on the family farm or business and
all persons who had a job but were not at work because of illness, holidays etc. in
the week.
Unemployed: Persons aged 15-74 who, in the week before the survey, were
without work and available for work within the next two weeks, and had taken
specific steps, in the preceding four weeks, to find work.
Inactive Population (not in labour force): All other persons.
The labour force comprises persons employed plus unemployed.
Variables which are not published but required by Eurostat include for example work
patterns, methods used in search for employment and current education involvement.
Unpublished variables are often used in the calculation of European indicators such as
life long learning and other education related matters. Such additional variables are
provided by the Labour Market Analysis unit in ad-hoc data requests etc.
The QNHS publications can be found on the CSO website
http://www.cso.ie/en/qnhs/
5.4 Coherence
Coherence checks are regularly carried out with auxiliary sources – for example other
CSO releases such as Live Register, Retail Sales and external sources such as taxation
trends, redundancy information etc. In particular the trend of the Live Register going up
or down is used to coherence check QNHS results.
21
5.5 Comparability
To ensure comparability with other official statistics standard classifications are used for
QNHS estimates (e.g. NACE Rev 2 for industry, UK SOC 2010 for occupation). The
classifications used are in the main set by EU regulation.
Two major changes in recent times were the change of industrial activity classification
from NACE Rev 1.1 to NACE Rev 2 and the change of occupation coding from UK SOC
90 to UK SOC 2010. In the main these changes were required due to changes in the
applicable EU regulation. To facilitate users, the CSO backcast industrial coding data to
Q1 1998 and backcast occupation coding data to Q1 2007.
Also in Q1 2009 the QNHS changed over to a calendar quarter basis as described under
section 2.5 above and section 5.6.2 below. All data from Q4 1997 onwards was revised
to calendar quarter data and results are available on the website. Again this ensures
greater comparability with other quarterly data which is typically compiled on a calendar
quarter basis (for example quarterly national accounts). A note on the changeover to
NACE Rev. 2 and the introduction of calendar quarters is available on the CSO website
in the labour market releases and publications section.
http://www.cso.ie/en/media/csoie/qnhs/documents/calendar/supplementarynote.pdf
Up to and including Q1 2006 the annual population estimates have been calculated using
the de facto definition of population (i.e. all persons present in the state). From Q2 2006
onwards a new concept of usual residence was implemented, i.e. all persons usually
resident and present in the state plus absent persons who are usually resident in Ireland
but temporarily away from home and outside the state. This again ensures comparability
with other demographic statistics where usual residence is taken as the most appropriate
population definition. In 2008 revisions were produced to implement this change in
methodology (see section 5.6.2).
5.6 Accessibility and Clarity
5.6.1 Assistance to Users, Special Analyses
All publications are available on the CSO website. Information on methodology is also
available on the website. The background notes on the publication provide some detail on
the survey.
For the core QNHS publication a press conference is held every quarter to enable users
and commentators to fully understand the data or seek further clarification.
Ad-hoc analysis can also be produced on request.
22
Anonymised microdata (for Q2 and Q4 of each year) is made available to researchers via
the Irish Social Science Data Archive (ISSDA). Such data is accessible by researchers
applying directly to the ISSDA.
For further information see:
http://issda.ucd.ie/webview/
Access to a Research Microdata Files (RMFs) can be requested from the CSO under the
CSO’s microdata access policy. Extensive use is made of this facility by the research
community.
For further information see:
http://www.cso.ie/en/aboutus/dissemination/accesstomicrodatarulespoliciesandprocedure
s/
5.6.2 Revisions
The most recent revisions to the QNHS data series were scheduled revisions arising as a
result of the 2011 Census of Population. As a result of the Census, new population
estimates were calculated on a quarterly basis using the 2011 Census of Population
figures as a base. These new population estimates were then used as a new grossing
frame for the quarterly QNHS data and as a result, the estimates previously published
were revised to take account of these new grossing frames for each quarter. This work
was completed in 2012 and results for the entire new set of data were issued on
November 29 2012 with the publication of result for Q3 2012.
Inter-censal revisions of the type described above will be completed every 5 years after
each Census of Population.
5.6.3 Publications
5.6.3.1 Releases, Regular Publications
QNHS main labour market estimates are published every quarter with a target release
data of T+56 days. In addition to QNHS quarterly releases, modules are published on an
ad hoc basis. Further information regarding these modules is available from this link:
http://www.cso.ie/en/qnhs/releasesandpublications/qnhs-specialmodules/
5.6.3.2 Statistical Reports
QNHS contributes data to a number of statistical releases in the office such as Men and
Women in Ireland, Measuring Ireland’s Progress, the CSO Yearbook etc.
5.6.3.3 Internet
All QNHS publications are available on the CSO website in publication format. In
addition data is made available via the CSO’s main databank dissemination tool and is
also hosted on the CSO website in Excel format:
http://www.cso.ie/en/qnhs/releasesandpublications/qnhs-calendarquarters/
23
5.6.4 Confidentiality
The confidentiality of all information provided to the CSO by individual respondents is
guaranteed by law under the 1993 Statistics Acts. All CSO office and field personnel
become "Officers of Statistics" on appointment and are liable to penalties under this Act
if they divulge confidential information to any outside person or body. Extreme
precautions are taken to ensure that there are no violations of this principle throughout the
survey process. The laptops on which the data was collected are encrypted and contain
several layers of password protection. Data are only published in aggregate form and
care is taken to ensure that the data are aggregated to avoid the indirect identification of
respondents. Confidentiality is also ensured within the anonymised microdata by using
coded variables instead of original values for key characteristics. For example, age
groupings are provided instead of single year of age.
24
6 Additional documentation and publications
The main CSO QNHS homepage can be found at the following link:
http://www.cso.ie/en/statistics/labourmarket/
Statcentral – Ireland’s portal to official statistics:
http://www.statcentral.ie/viewstats.asp?type=Labour Market
Eurostat issue many releases which use QNHS data and the central repository for such
data can be found as below:
http://epp.eurostat.ec.europa.eu/portal/page/portal/labour_market/introduction