staffing and services 2009 survey - willis - global … · staffing and services 2009 survey. ......
TRANSCRIPT
STAFFINGAND SERVICES2009 SURVEY
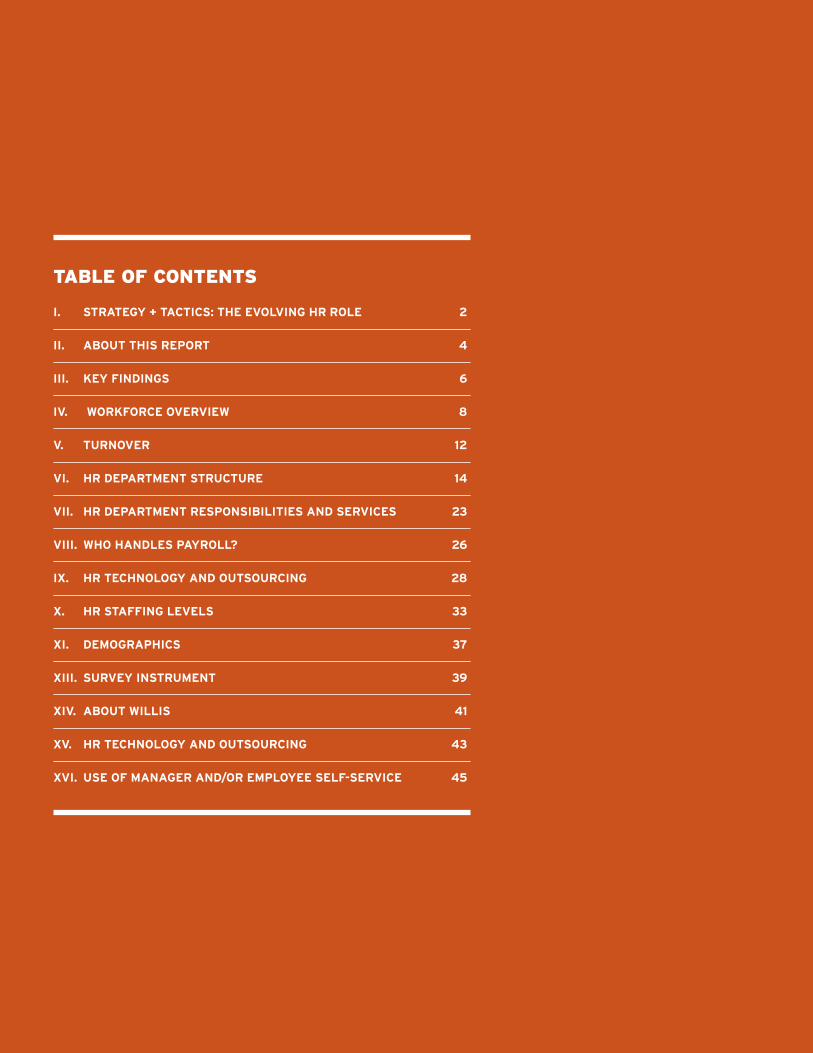
TABLE OF CONTENTS
I. strategy + tactIcs: the evolvIng hr role 2
II. about thIs report 4
III. Key FIndIngs 6
Iv. worKForce overvIew 8
v. turnover 12
vI. hr department structure 14
vII. hr department responsIbIlItIes and servIces 23
vIII. who handles payroll? 26
IX. hr technology and outsourcIng 28
X. hr staFFIng levels 33
XI. demographIcs 37
XIII. survey Instrument 39
XIv. about wIllIs 41
Xv. hr technology and outsourcIng 43
XvI. use oF manager and/or employee selF-servIce 45
STRATEGY +TACTICS: THE EVOLVING HR ROLE
Staffing and Services 2009 Survey
Willis North America n 3
STRATEGY + TACTICS: THE EVOLVING HR ROLE
It’s been said many times and for good reason: employees are an organization’s greatestasset. Their skills, time and talents underpin and drive organizational success across allareas, so the ability to attract, motivate and retain the most qualified and productiveemployees is a critical factor in the survival of any organization. Successful organizationsdevelop a human capital strategy aligned to overall business objectives, and many HRdepartments have evolved over the past couple of decades to become strategic businesspartners in that effort.
At forward-thinking organizations, HR is being tasked with:
n Leadership and organizational developmentn Developing and deploying a powerful employee value proposition that enables the
company to better attract and retain the necessary workforcen Providing a clear line of sight to business goals and objectives by tying pay to
performancen Being involved at the start of major organizational changes, such as mergers and
acquisitionsn Proactively partnering with line management
At the same time, most HR teams remain responsible for traditional transactional andoperational responsibilities, such as recruitment and selection, employee relations, trainingand development, and compensation and benefits. Increasingly, much of this transactionalwork is being outsourced completely, or handled in-house more effectively through technologyand shared service centers, allowing human resource professionals to focus on more strategicinitiatives. But with all this talk of delivering strategic human resource management, HRprofessionals must remember their chief customers may be top management, but HR mustbe an advocate for the employees as well. HR professionals face a broad challenge: effectivelyplaying a strategic role while ensuring tactical needs are met.
The HR role has never been more central to organizational success. It has also never been socomplicated.
ABOUT THISREPORT
Staffing and Services 2009 Survey
ABOUT THIS REPORT
HR Partner, the HR Consulting arm of Willis, conducted a survey in late 2009 about HRstaffing and how HR responsibilities and functions are handled. We contacted subscribers toWillis’ HR Focus online newsletter. A web-based platform was utilized to collect, measureand analyze data.
Complete responses were received from 708 organizations of varying sizes, industries andgeographic locations: 58% of survey respondents represented companies with 249 or feweremployees; 26% represented employers with 250 to 999 employees; and 16% representedthose employers with 1,000 or more employees. The survey captured an often overlookedgroup – small to mid-size organizations – as 243 respondents came from companies withfewer than 100 employees.
The objective of this survey is to provide a better understanding of how HR is structured andhow it contributes to the organization. We examined four key issues:
n Organizational workforce and turnovern HR department structuren HR department responsibilities and servicen HR technology and outsourcing
We also asked how HR departments are staffed to handle these issues.
This report analyzes the survey results. In most cases percentages have been rounded towhole numbers. The confidence interval is 95% +/- 10%.
Willis North America n 5
KEY FINDINGS
Staffing and Services 2009 Survey
KEY FINDINGS
ORGANIZATIONAL WORKFORCE AND TURNOVER
n The use of part-time employees was not prevalent among survey respondents, with only11% of the total workforce being considered part time.
n Voluntary turnover (10.9%) remains slightly higher than involuntary turnover (9.1%),even though the current state of the economy would suggest otherwise.
HR DEPARTMENT STRUCTURE
n More organizations appear to understand the strategic importance of HR and includeHR as part of top management: 76% of all respondents stated that the top HRprofessional at their organization reports into the C-Suite, with 56% reporting directlyto the CEO or president.
n Organizations have shifted to a centralized HR function, with 77% of all respondentsreporting this type of HR structure.
n The use of HR specialists is prevalent in organizations with 500 or more employees,while smaller organizations are dependent on HR generalists that can handle amultitude of HR responsibilities.
n The majority of HR specialists work in positions that are administrative/clerical orprofessional. They mostly specialize in benefits, recruitment or training anddevelopment. Generalists hold the majority of managerial and HR executive positions.
HR DEPARTMENT RESPONSIBILITIES AND SERVICES
n HR still seems to play a limited role in strategic planning, with only 45% of respondentsreporting this as an activity HR performs for the organization.
n HR generalists spend only 3% of their time on strategic planning activities.
HR TECHNOLOGY AND OUTSOURCING
n With the exception of payroll, HRIS (basic demographic and employee information),time and attendance and HR reporting, many HR activities are still handled manuallyin-house.
n The use of employee and manager self-service systems continues to be limited to largerorganizations and even among them is not widespread.
Willis North America n 7
hr staFFIngratIos
the old standard of one
hr employee for every
100 total employees has
long been outdated. In
fact, organizations with
100 or more employees
report on average one
hr Fte for every 144
employees.
WORKFORCEOVERVIEW
Staffing and Services 2009 Survey
WORKFORCE OVERVIEW
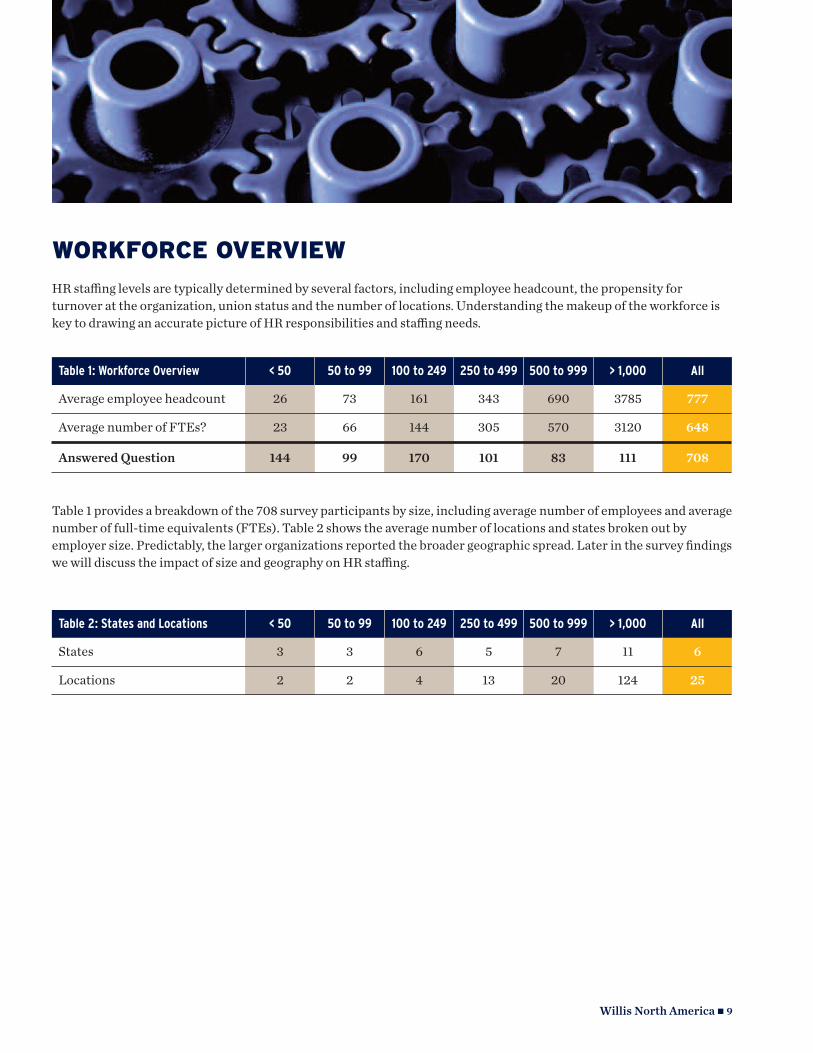
HR staffing levels are typically determined by several factors, including employee headcount, the propensity forturnover at the organization, union status and the number of locations. Understanding the makeup of the workforce iskey to drawing an accurate picture of HR responsibilities and staffing needs.
Willis North America n 9
Table 1 provides a breakdown of the 708 survey participants by size, including average number of employees and averagenumber of full-time equivalents (FTEs). Table 2 shows the average number of locations and states broken out byemployer size. Predictably, the larger organizations reported the broader geographic spread. Later in the survey findingswe will discuss the impact of size and geography on HR staffing.
Table 1: Workforce Overview < 50 50 to 99 100 to 249 250 to 499 500 to 999 > 1,000 All
Average employee headcount 26 73 161 343 690 3785 777
Average number of FTEs? 23 66 144 305 570 3120 648
Answered Question 144 99 170 101 83 111 708
Table 2: States and Locations < 50 50 to 99 100 to 249 250 to 499 500 to 999 > 1,000 All
States 3 3 6 5 7 11 6
Locations 2 2 4 13 20 124 25
Willis North America n 10
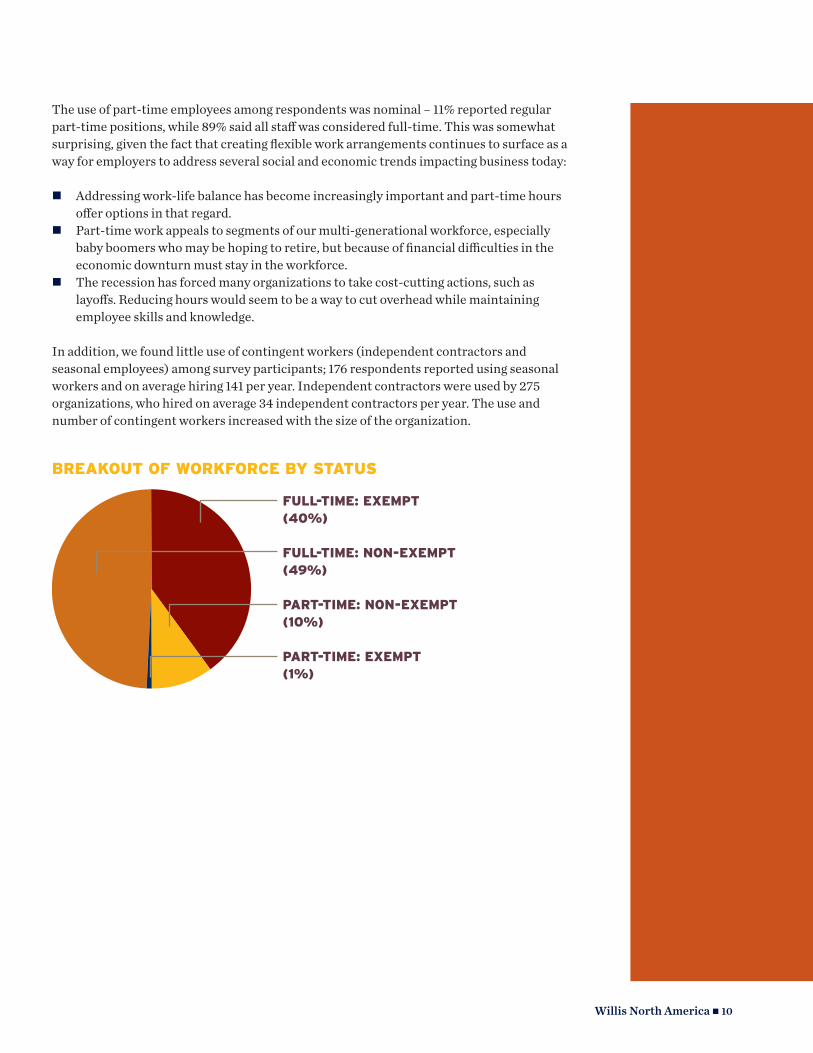
The use of part-time employees among respondents was nominal – 11% reported regularpart-time positions, while 89% said all staff was considered full-time. This was somewhatsurprising, given the fact that creating flexible work arrangements continues to surface as away for employers to address several social and economic trends impacting business today:
n Addressing work-life balance has become increasingly important and part-time hoursoffer options in that regard.
n Part-time work appeals to segments of our multi-generational workforce, especiallybaby boomers who may be hoping to retire, but because of financial difficulties in theeconomic downturn must stay in the workforce.
n The recession has forced many organizations to take cost-cutting actions, such aslayoffs. Reducing hours would seem to be a way to cut overhead while maintainingemployee skills and knowledge.
In addition, we found little use of contingent workers (independent contractors andseasonal employees) among survey participants; 176 respondents reported using seasonalworkers and on average hiring 141 per year. Independent contractors were used by 275organizations, who hired on average 34 independent contractors per year. The use andnumber of contingent workers increased with the size of the organization.
BREAKOUT OF WORKFORCE BY STATUS
FULL-TIME: EXEMPT(40%)
FULL-TIME: NON-EXEMPT(49%)
PART-TIME: NON-EXEMPT(10%)
PART-TIME: EXEMPT(1%)
Willis North America n 11
Table 3: Union Representation < 50 50 to 99 100 to 249 250 to 499 500 to 999 > 1,000 All
No employees are unionized 94% 86% 89% 80% 78% 73% 85%
5% or less 1% 1% 1% 1% 4% 5% 2%
5% to 9% 0% 0% 1% 2% 0% 2% 1%
10% to 24% 0% 2% 3% 4% 4% 6% 3%
25% to 49% 1% 3% 1% 0% 2% 5% 2%
50% to 74% 1% 8% 4% 10% 6% 4% 5%
75% to 100% 3% 0% 2% 3% 6% 5% 3%
Answered Question 144 99 170 101 83 111 708
Most of the participating organizations (85%), as indicated in Table 3, reported they did not have a union environment,meaning one less responsibility for the HR Department.
TURNOVER
Staffing and Services 2009 Survey
TURNOVER
Turnover refers to employees' permanent separation from anorganization. Involuntary separations or discharges are employer-initiated and can occur for reasons ranging from employee misconduct orperformance to economic conditions. Voluntary separations areemployee-initiated and fall into two categories: unavoidable or avoidable.Unavoidable separations occur, for example, when an employee resigns toretire or take care of family obligations. Avoidable separations result froman employee's dissatisfaction with management philosophy,compensation, the job itself or the work environment.
Turnover can never be eliminated. In fact some degree of turnover ishelpful because it opens up opportunities for new workers and internalpromotions. The shedding of disengaged, poor performers can beespecially beneficial. Turnover of course can be costly, as it may mean anincrease in recruitment and training costs and lost productivity andknowledge.
In part, turnover reflects economic conditions. When the economy ishealthy, voluntary turnover tends to rise, as employees are enticed by anactive job market. In tougher times, we see an increase in involuntaryturnover. For example 7.6 million people have lost their jobs since therecession started in December 2007, according to the January 8, 2010 BLSEmployment Situation Summary.
Not all respondents answered our questions about annual turnover. Of the565 that did, 34 companies reported zero turnover and the remainingcompanies reported an average turnover of 20%.
Among the respondents that noted both voluntary and involuntaryturnover, 54.5% was attributable to voluntary turnover (average voluntaryrate of 10.9%) and 45.5% to involuntary (average involuntary turnover rateof 9.1%). We expected to see a higher number of involuntary separations,given the number of layoffs that have occurred over the last two years.However, the higher percentage of voluntary turnover could reflect theefforts of organizations taking advantage of the recession to pursue toptalent at a lower cost.
Turnover cannot be eliminated entirely, but it can be controlled and tothat end, tracking turnover is critical to the early discovery of trends.Understanding “leaver” behavior is critical for organizations as they lookto make adjustments in management strategies or total reward offerings.Once controllable causes are identified, more concrete steps can be takento lower turnover and its resulting costs.
Willis North America n 13
addressIng causes oF turnover
turnover rates usually decrease during
times of high unemployment, but hr
departments should be proactive in
preparing for a turn in the economic
climate. addressing retention issues
now will help companies maintain
valuable employees later. while it is
impossible to control all the factors
contributing to employee turnover, hr
can take steps to reduce it.
n track reasons for turnover in order
to target strategies for lowering
voluntary turnover.
n conduct exit interviews following all
voluntary terminations to better
understand why employees are
leaving.
n create an effective and well
communicated employee value
proposition that includes
competitive compensation and
benefits, as well as recognition
and rewards, timely performance
appraisals and opportunities for
professional growth.
n ensure two-way communication:
managers should be encouraged to
get to know their employees, listen
to employees and encourage upward
communication.
n develop and deploy a comprehensive
on-boarding process to ensure
employees understand the
organization and the value
they bring.
HR DEPARTMENTSTRUCTURE
Staffing and Services 2009 Survey
HR DEPARTMENT STRUCTURE
No two human resource departments are structured exactly the same. They range from single personneladministrators in small companies to teams of specialists at larger firms. Functions range from primarilyadministrative work to participation in all aspects of corporate decision making.
The reporting structure and location of HR staff is greatly influenced by the size of the organization, the number oflocations and the company’s overall business strategy. Organizations should understand that no matter the numberand location of HR staff, their HR resources must be structured in a way that allows HR to deliver on actionable andmeasurable HR goals that are aligned to the company’s strategy.
WHO DOES HR REPORT TO? At top performing organizations, HR has a seat at the executive table. HR is viewed as a critical function and reportsdirectly into the organization’s top executive. However, reporting lines are not the only factor involved in makingsure that HR has the support needed to do its job. For HR to be effective in a strategic role, the person to whom theHR leader reports should:
n Support and help to drive HR initiativesn Partner strategically with HR by involving them in critical business decisions n Ensure effective two-way communication n See the importance of aligning HR strategies with business objectivesn Understand the human capital practices necessary to drive superior performance
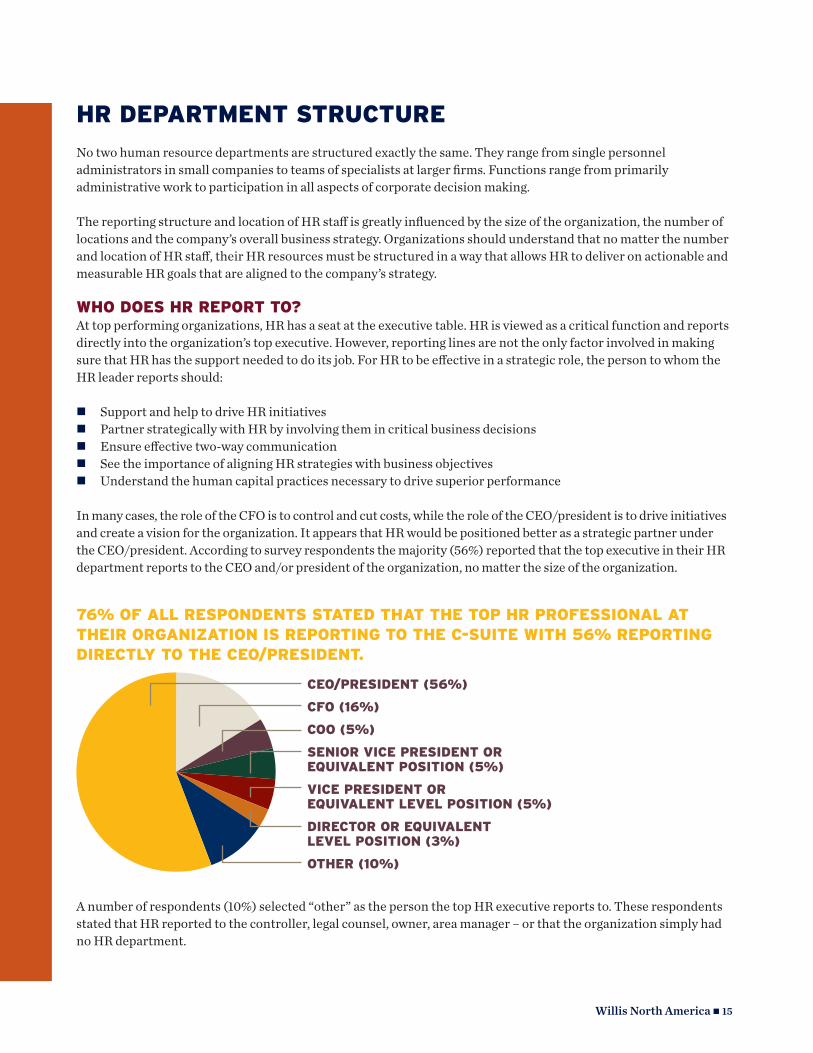
In many cases, the role of the CFO is to control and cut costs, while the role of the CEO/president is to drive initiativesand create a vision for the organization. It appears that HR would be positioned better as a strategic partner underthe CEO/president. According to survey respondents the majority (56%) reported that the top executive in their HRdepartment reports to the CEO and/or president of the organization, no matter the size of the organization.
Willis North America n 15
CEO/PRESIDENT (56%)
CFO (16%)
COO (5%)
SENIOR VICE PRESIDENT OREQUIVALENT POSITION (5%)
VICE PRESIDENT OREQUIVALENT LEVEL POSITION (5%)
DIRECTOR OR EQUIVALENTLEVEL POSITION (3%)
OTHER (10%)
A number of respondents (10%) selected “other” as the person the top HR executive reports to. These respondentsstated that HR reported to the controller, legal counsel, owner, area manager – or that the organization simply hadno HR department.
76% OF ALL RESPONDENTS STATED THAT THE TOP HR PROFESSIONAL ATTHEIR ORGANIZATION IS REPORTING TO THE C-SUITE WITH 56% REPORTINGDIRECTLY TO THE CEO/PRESIDENT.
CENTRALIZATION VS. DECENTRALIZATION
In a typical centralized HR structure, corporate headquarters setsthe HR strategic direction, establishes policies and procedures, anduses the collective group for purchasing power. In a decentralizedoperation, HR reports into the local/regional management and mayor may not have a dotted line to a corporate HR department. Somecompanies combine the two in a hybrid or matrix organization,where HR has a dual rather than single chain of command, reportinginto both the local/regional operations and to corporate HR. Somelarge organizations use a shared-services unit located in thecorporate headquarters or other centralized location.
Historically we have seen organizations shift back and forth betweencentralization and decentralization in regard to many functions,including HR. A centralized approach offers cost savings by reducingheadcount and duplication of effort in the field. However, some HRleaders find they lose touch with employees when HR staff is not inthe field, and HR cannot work as strategically with line managerswhen they are not in the mix every day.
In today’s economy, we see an expected shift toward centralization,as organizations look for ways to cut headcount. In addition, withadvancements in collaborative technology, such as instant messaging,video conferencing and application sharing, many feel that HR’s physicallocation matters less. Location is less of a consideration in hiring ingeneral, as organizations seek out top talent regardless of address.
Willis North America n 16
shared servIces
although we did not address shared
services in this survey, increasing
numbers of organizations are
establishing hr service centers.
primarily used in larger organizations
or those organizations with multiple
locations, these centers consolidate
transactional functions such as
benefits administration, payroll
processing and leave administration at
a centralized location. organizations
that have set up hr service centers
report several benefits:
n lower transactional cost
n Improved operating efficiency
n hr professionals have more time
to provide more strategic support
n higher comfort level than if the
services were outsourced
n better customer service with a
team of professionals that are
experts in employee matters
Field hr may be resistant to the
centralization of these functions, but
in many cases these changes open
opportunities for hr professionals
to take on a more proactive role as
strategic business partners. by
eliminating the transactional work,
the hr professional is better positioned
to work on strategic initiatives and
focus on talent management.
Willis North America n 17
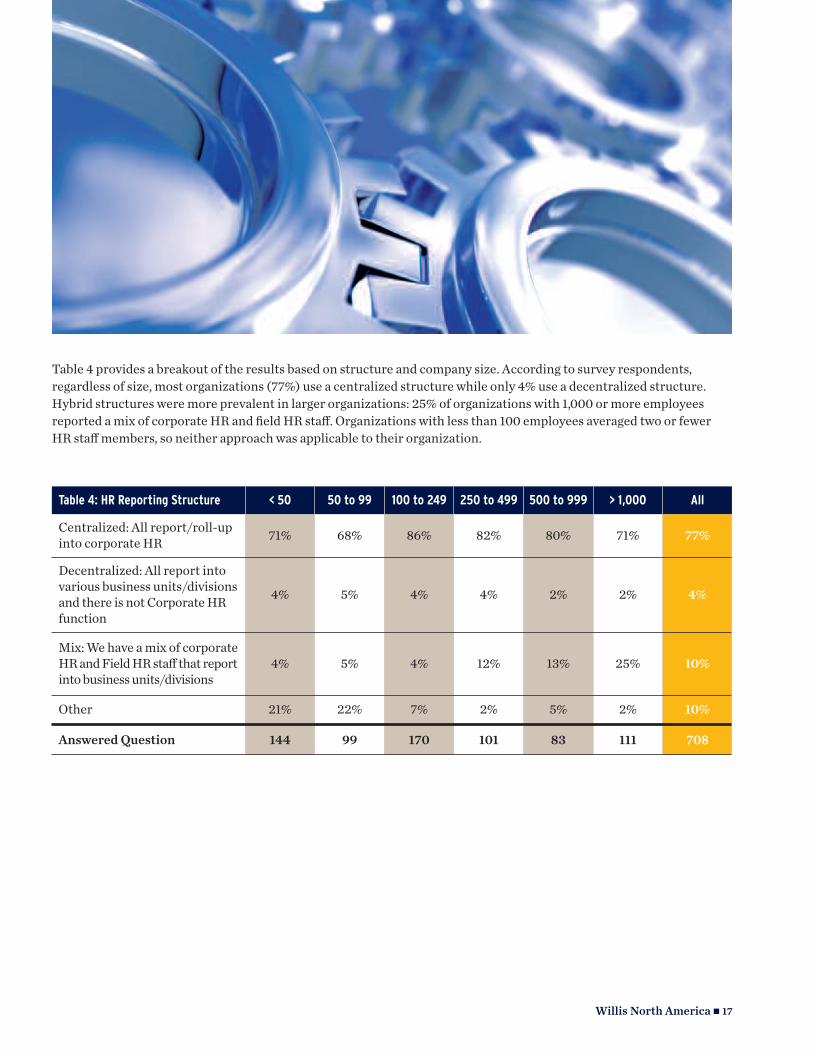
Table 4: HR Reporting Structure < 50 50 to 99 100 to 249 250 to 499 500 to 999 > 1,000 All
Centralized: All report/roll-upinto corporate HR 71% 68% 86% 82% 80% 71% 77%
Decentralized: All report intovarious business units/divisionsand there is not Corporate HRfunction
4% 5% 4% 4% 2% 2% 4%
Mix: We have a mix of corporateHR and Field HR staff that reportinto business units/divisions
4% 5% 4% 12% 13% 25% 10%
Other 21% 22% 7% 2% 5% 2% 10%
Answered Question 144 99 170 101 83 111 708
Table 4 provides a breakout of the results based on structure and company size. According to survey respondents,regardless of size, most organizations (77%) use a centralized structure while only 4% use a decentralized structure.Hybrid structures were more prevalent in larger organizations: 25% of organizations with 1,000 or more employeesreported a mix of corporate HR and field HR staff. Organizations with less than 100 employees averaged two or fewerHR staff members, so neither approach was applicable to their organization.
Willis North America n 18
HR GENERALIST ANDSPECIALIST
As organizations ask more of their HR staff,they need to make sure their HR team has theright competencies and capabilities to deliveron their strategy. This begs the question: HRgeneralist vs. HR specialist?
An HR specialist typically focuses on one ortwo key functional HR responsibilities, suchas recruitment, benefits, compensation orlabor. A generalist may focus on the biggerpicture or juggles all HR functions.
With so many organizations moving tocentralizing and outsourcing certain HRfunctions, we have seen a reduction in thenumber of HR specialists and a rise in thenumber of generalists. The recession has alsopushed HR departments in that direction.When HR teams are thinned in cost-cuttingmoves, organizations tend to retain HRemployees who can handle diverse HRresponsibilities. When specialized needsarise, they may be more likely to hireconsultants rather than add HR specialists tothe payroll.
The size of the organization also plays a rolein determining the number of generalists andspecialists. Smaller companies rely on smallerHR staffs, creating a greater need forgeneralized knowledge of various HRfunctions. Not surprisingly, in organizationswith 250 employees or less, HR generalistsprevail. Among organizations with 500 ormore employees, 74% report a mix ofgeneralists and specialist. See Table 5.
hr generalIst or specIalIst: who has thegreatest Impact and opportunIty?
the answer lies in whether you would rather navigate the
battleship or build and maintain the engine turbines. both are
vital and crucial tasks for smooth sailing.
my experience has revealed that hr generalists typically prefer
to see the big picture throughout an organization, with a variety
of touch points lending to the personalization of hr. In today’s
workforce, where everyone is pressured to do more with less,
generalists possess greater employability due to their
interpersonal connections and prowess to touch areas outside
of hr such as labor, policy and public relations.
hr specialists, where I have spent most of my career, are
thought to be more siloed in their approach and focused on
the intersecting pieces. they are valued by larger employers,
especially in a shared services environment. their career
opportunities are much more limited as companies streamline
or even outsource their hr processes. however, specialization
can also be part of a natural progression in career advancement
to the generalist/manager level, as specialization leads to
attainment of subject matter expertise.
Greg LohamnDirector of Benefits and Compensation Stein Mart
JOB LEVELS
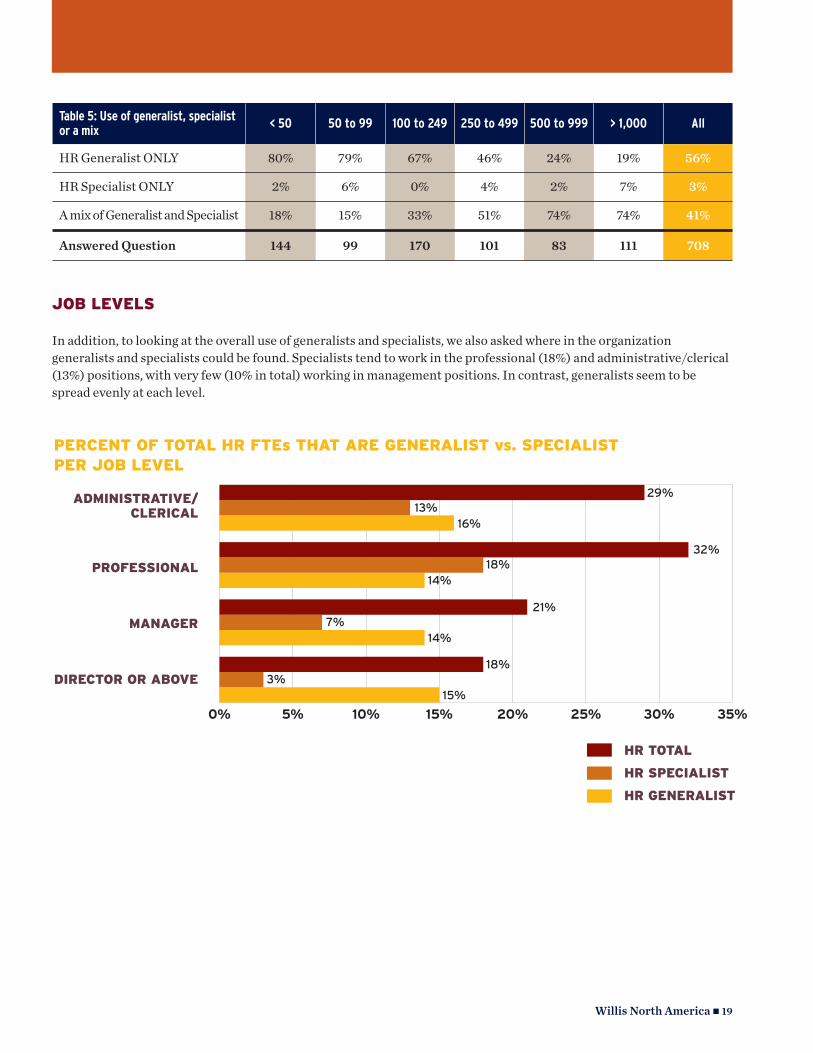
In addition, to looking at the overall use of generalists and specialists, we also asked where in the organizationgeneralists and specialists could be found. Specialists tend to work in the professional (18%) and administrative/clerical(13%) positions, with very few (10% in total) working in management positions. In contrast, generalists seem to bespread evenly at each level.
Willis North America n 19
PERCENT OF TOTAL HR FTEs THAT ARE GENERALIST vs. SPECIALIST PER JOB LEVEL
ADMINISTRATIVE/CLERICAL
PROFESSIONAL
MANAGER
DIRECTOR OR ABOVE
0% 5% 10% 15% 20% 25% 30% 35%
HR TOTAL
HR SPECIALIST
HR GENERALIST
29%13%
16%
32%18%
14%
21%7%
14%
18%3%
15%
Table 5: Use of generalist, specialistor a mix
< 50 50 to 99 100 to 249 250 to 499 500 to 999 > 1,000 All
HR Generalist ONLY 80% 79% 67% 46% 24% 19% 56%
HR Specialist ONLY 2% 6% 0% 4% 2% 7% 3%
A mix of Generalist and Specialist 18% 15% 33% 51% 74% 74% 41%
Answered Question 144 99 170 101 83 111 708
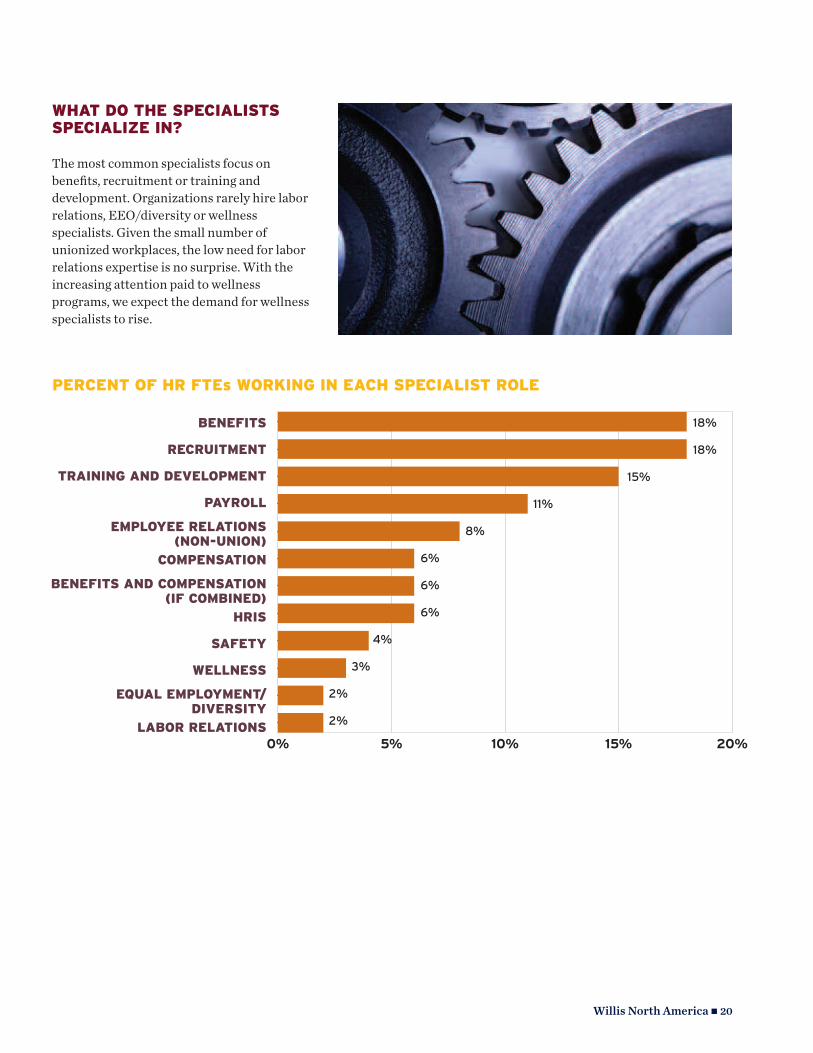
WHAT DO THE SPECIALISTSSPECIALIZE IN?
The most common specialists focus onbenefits, recruitment or training anddevelopment. Organizations rarely hire laborrelations, EEO/diversity or wellnessspecialists. Given the small number ofunionized workplaces, the low need for laborrelations expertise is no surprise. With theincreasing attention paid to wellnessprograms, we expect the demand for wellnessspecialists to rise.
Willis North America n 20
PERCENT OF HR FTEs WORKING IN EACH SPECIALIST ROLE
BENEFITS
RECRUITMENT
TRAINING AND DEVELOPMENT
PAYROLL
EMPLOYEE RELATIONS(NON-UNION)
COMPENSATION
BENEFITS AND COMPENSATION(IF COMBINED)
HRIS
SAFETY
WELLNESS
EQUAL EMPLOYMENT/DIVERSITY
LABOR RELATIONS
18%
0% 5% 10% 15% 20%
18%
15%
8%
6%
11%
6%
6%
4%
3%
2%
2%
Willis North America n 21
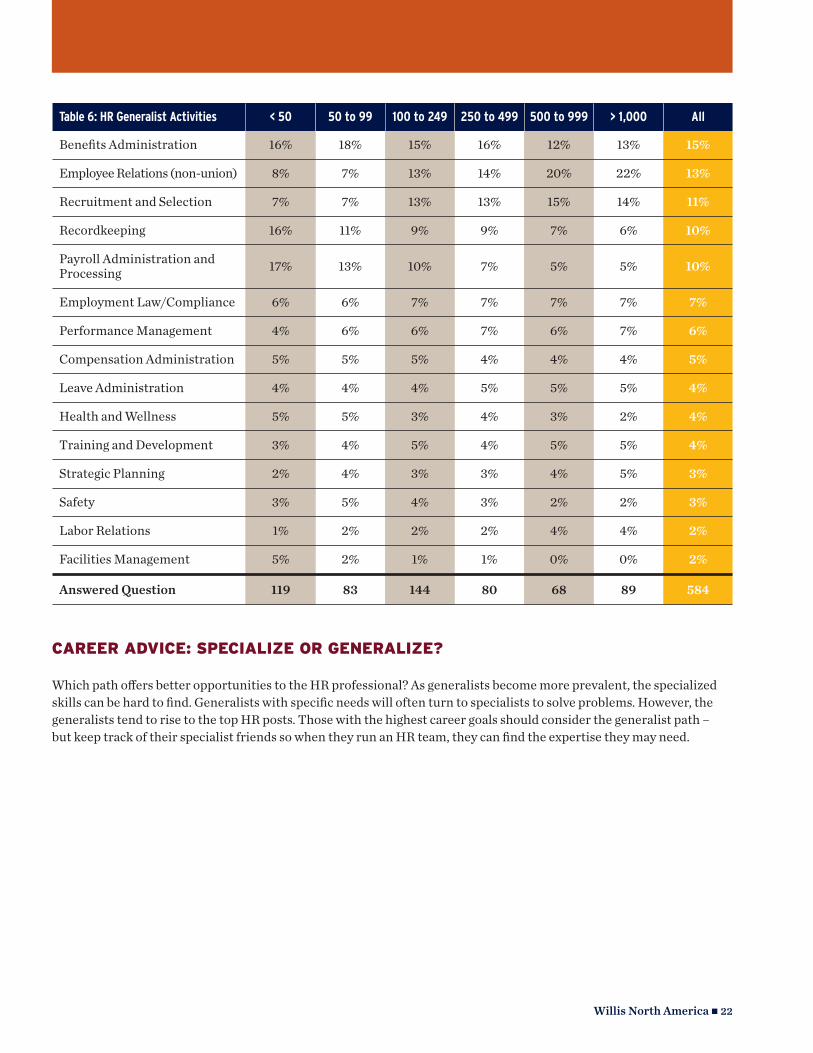
HOW DO THE HR GENERALISTSSPEND THEIR TIME?
According to Table 6, regardless of companysize, HR generalists focus mostly on benefitsadministration, employee relations andrecruitment. Not surprisingly, for smallerorganizations, those with less than 100employees, HR generalists spend the largestamount of their time on transactionalactivities, such as payroll, benefitsadministration and recordkeeping. This is notsurprising, given that in small organizations,there is often only one HR professionalhandling both HR and payroll.
In large organizations, where transactionalwork is often outsourced, handled byspecialists or by a payroll staff, generaliststend to focus more on employee relations andon recruitment and selection.
Generalists spend little time on strategicplanning activities – only 3% of HR generalisttime is spent on this essential task. Why? Thelikely answers are lack of time in the day,insufficient support from senior managementand inexperience on the part of the HR staff.In some cases, HR generalists may needsimply to explain the importance of bringingHR into strategic discussions.
hr as a strategIc partner
For hr professionals looking to offer more as a strategic
partner, the key challenge may be making others aware of
the value hr brings to the organization. they can start by
remembering how hr can affect profits, earnings and growth
by influencing employee performance. strategic hr
professionals should be able to:
n understand and communicate their personal and
departmental value proposition
n understand the health of the company (revenues,
expenses, net income, earnings per share, etc.)
n understand the perceptions of their constituents
n define what success will look like and how it will
be measured
n design an hr business plan and obtain buy-in from
senior management
n execute the business plan and measure results by
reporting on key hr metrics
n express passion, energy and excitement
n be passionate about sales, profits and financial results
n act as the voice of the company to their constituents
Willis North America n 22
Table 6: HR Generalist Activities < 50 50 to 99 100 to 249 250 to 499 500 to 999 > 1,000 All
Benefits Administration 16% 18% 15% 16% 12% 13% 15%
Employee Relations (non-union) 8% 7% 13% 14% 20% 22% 13%
Recruitment and Selection 7% 7% 13% 13% 15% 14% 11%
Recordkeeping 16% 11% 9% 9% 7% 6% 10%
Payroll Administration andProcessing 17% 13% 10% 7% 5% 5% 10%
Employment Law/Compliance 6% 6% 7% 7% 7% 7% 7%
Performance Management 4% 6% 6% 7% 6% 7% 6%
Compensation Administration 5% 5% 5% 4% 4% 4% 5%
Leave Administration 4% 4% 4% 5% 5% 5% 4%
Health and Wellness 5% 5% 3% 4% 3% 2% 4%
Training and Development 3% 4% 5% 4% 5% 5% 4%
Strategic Planning 2% 4% 3% 3% 4% 5% 3%
Safety 3% 5% 4% 3% 2% 2% 3%
Labor Relations 1% 2% 2% 2% 4% 4% 2%
Facilities Management 5% 2% 1% 1% 0% 0% 2%
Answered Question 119 83 144 80 68 89 584
CAREER ADVICE: SPECIALIZE OR GENERALIZE?
Which path offers better opportunities to the HR professional? As generalists become more prevalent, the specializedskills can be hard to find. Generalists with specific needs will often turn to specialists to solve problems. However, thegeneralists tend to rise to the top HR posts. Those with the highest career goals should consider the generalist path – but keep track of their specialist friends so when they run an HR team, they can find the expertise they may need.
HR DEPARTMENTRESPONSIBILITIESAND SERVICES
Staffing and Services 2009 Survey
HR DEPARTMENT RESPONSIBILITIES AND SERVICES
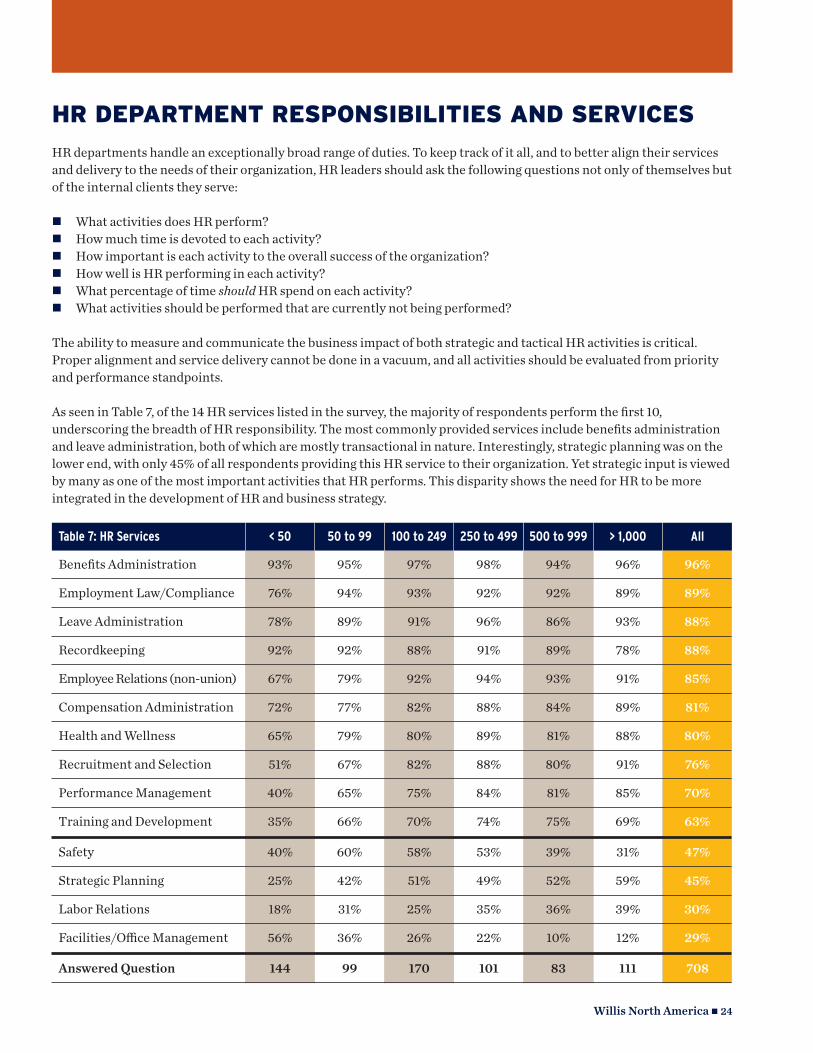
HR departments handle an exceptionally broad range of duties. To keep track of it all, and to better align their servicesand delivery to the needs of their organization, HR leaders should ask the following questions not only of themselves butof the internal clients they serve:
n What activities does HR perform? n How much time is devoted to each activity? n How important is each activity to the overall success of the organization? n How well is HR performing in each activity? n What percentage of time should HR spend on each activity?n What activities should be performed that are currently not being performed?
The ability to measure and communicate the business impact of both strategic and tactical HR activities is critical.Proper alignment and service delivery cannot be done in a vacuum, and all activities should be evaluated from priorityand performance standpoints.
As seen in Table 7, of the 14 HR services listed in the survey, the majority of respondents perform the first 10,underscoring the breadth of HR responsibility. The most commonly provided services include benefits administrationand leave administration, both of which are mostly transactional in nature. Interestingly, strategic planning was on thelower end, with only 45% of all respondents providing this HR service to their organization. Yet strategic input is viewedby many as one of the most important activities that HR performs. This disparity shows the need for HR to be moreintegrated in the development of HR and business strategy.
Willis North America n 24
Table 7: HR Services < 50 50 to 99 100 to 249 250 to 499 500 to 999 > 1,000 All
Benefits Administration 93% 95% 97% 98% 94% 96% 96%
Employment Law/Compliance 76% 94% 93% 92% 92% 89% 89%
Leave Administration 78% 89% 91% 96% 86% 93% 88%
Recordkeeping 92% 92% 88% 91% 89% 78% 88%
Employee Relations (non-union) 67% 79% 92% 94% 93% 91% 85%
Compensation Administration 72% 77% 82% 88% 84% 89% 81%
Health and Wellness 65% 79% 80% 89% 81% 88% 80%
Recruitment and Selection 51% 67% 82% 88% 80% 91% 76%
Performance Management 40% 65% 75% 84% 81% 85% 70%
Training and Development 35% 66% 70% 74% 75% 69% 63%
Safety 40% 60% 58% 53% 39% 31% 47%
Strategic Planning 25% 42% 51% 49% 52% 59% 45%
Labor Relations 18% 31% 25% 35% 36% 39% 30%
Facilities/Office Management 56% 36% 26% 22% 10% 12% 29%
Answered Question 144 99 170 101 83 111 708

WHO HANDLESPAYROLL
Staffing and Services 2009 Survey
WHO HANDLES PAYROLL?
Should payroll report into HR or Finance/Accounting? The answer to this age-old HRquestion is still a blur. It is also still crucial. Payroll is usually an organization's largestexpense and it directly impacts the organization's most valuable asset, its employees.
HR professionals will argue that because HR facilitates activities such as new hires, salaryincreases, terminations, leaves of absence, and benefits deductions, payroll should fall underHR. Being on the front lines, HR has the data needed to run payroll, and keeping it underHR’s umbrella can eliminate duplication of work.
Finance and accounting professionals may counter that due to the financial impact ofpayroll on the company's books, auditing and tax situations, the payroll function shouldreside with them.
Many organizations in fact employ a hybrid approach, which reflects the need for regulatorycompliance (from Sarbanes-Oxley, for example), the increased sophistication ofHRIS/HRMS systems, and the outsourcing of payroll processing. In hybrid approaches, HRtakes responsibility for the front-end input of employee data into the HRMS system, withprocessing/administration of payroll going through either an in-house system or vendoroutsourcing. Once processing is complete, the responsibility is handed off to Finance so thatjournal entries can be made, taxes can be paid, payroll data can be audited and informationcan be uploaded and populated in the company’s financial systems for month-end reporting.
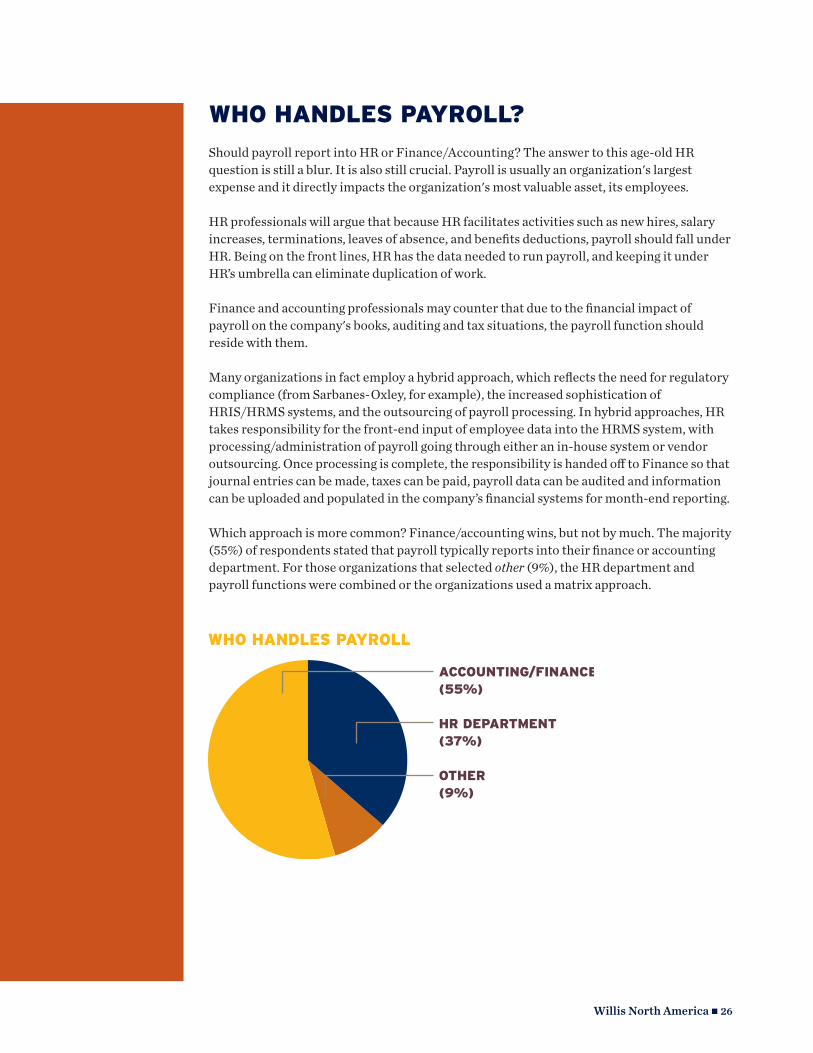
Which approach is more common? Finance/accounting wins, but not by much. The majority(55%) of respondents stated that payroll typically reports into their finance or accountingdepartment. For those organizations that selected other (9%), the HR department andpayroll functions were combined or the organizations used a matrix approach.
Willis North America n 26
WHO HANDLES PAYROLL
ACCOUNTING/FINANCE(55%)
HR DEPARTMENT(37%)
OTHER(9%)

HR TECHNOLOGYANDOUTSOURCING
Staffing and Services 2009 Survey
HR TECHNOLOGY AND OUTSOURCING
HR TECHNOLOGY USE AND OUTSOURCING
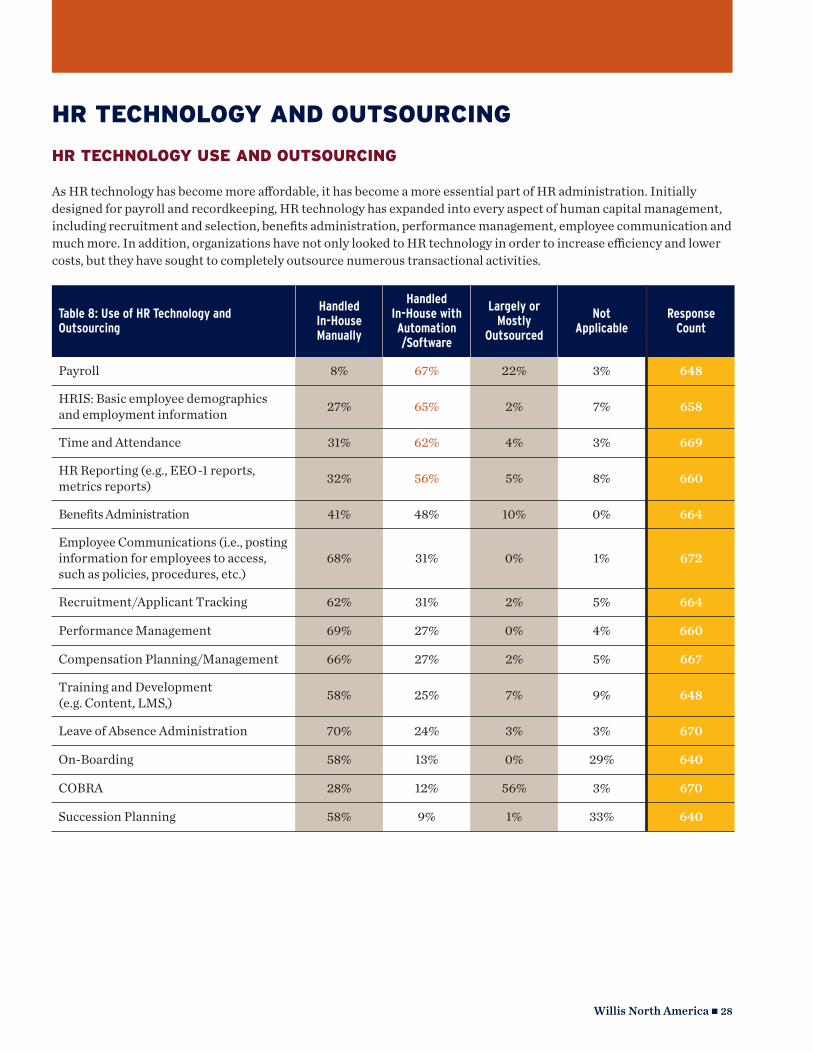
As HR technology has become more affordable, it has become a more essential part of HR administration. Initiallydesigned for payroll and recordkeeping, HR technology has expanded into every aspect of human capital management,including recruitment and selection, benefits administration, performance management, employee communication andmuch more. In addition, organizations have not only looked to HR technology in order to increase efficiency and lowercosts, but they have sought to completely outsource numerous transactional activities.
Willis North America n 28
Table 8: Use of HR Technology and Outsourcing
Handled In-House Manually
Handled In-House withAutomation/Software
Largely orMostly
Outsourced
Not Applicable
Response Count
Payroll 8% 67% 22% 3% 648
HRIS: Basic employee demographicsand employment information 27% 65% 2% 7% 658
Time and Attendance 31% 62% 4% 3% 669
HR Reporting (e.g., EEO-1 reports, metrics reports) 32% 56% 5% 8% 660
Benefits Administration 41% 48% 10% 0% 664
Employee Communications (i.e., postinginformation for employees to access,such as policies, procedures, etc.)
68% 31% 0% 1% 672
Recruitment/Applicant Tracking 62% 31% 2% 5% 664
Performance Management 69% 27% 0% 4% 660
Compensation Planning/Management 66% 27% 2% 5% 667
Training and Development (e.g. Content, LMS,) 58% 25% 7% 9% 648
Leave of Absence Administration 70% 24% 3% 3% 670
On-Boarding 58% 13% 0% 29% 640
COBRA 28% 12% 56% 3% 670
Succession Planning 58% 9% 1% 33% 640
Willis North America n 29
We asked participants to indicate how HR functions are handled intheir organization. The results, as seen in Table 8, showed thattechnology or outsourcing is used for payroll processing by most(89%) organizations. Following closely behind were HRIS, time andattendance and HR reporting.
A surprisingly small percentage of organizations use talentmanagement software, which can be used for applicant tracking,performance management, training and development, compensationadministration and succession planning. With so much talk abouttalent management, and so many applications available, we expectedmore usage of software designed to help ensure effective alignment ofhuman capital to organizational goals and objectives.
In a similar surprise, administration of leaves of absences, which isone of the more transactional HR activities, is handled manually bythe majority (70%) of respondents. Federal and in some cases stateand local requirements for administering leave can be time-consuming and challenging. Again, we were surprised we did not findmore organizations outsourcing or using technology to support thisactivity.
In regard to total outsourcing, the most likely function to beoutsourced is COBRA administration. Next was payrolladministration. The majority of the organizations that outsourcetheir payroll function are on the small side – with fewer than 250employees.
Willis North America n 30
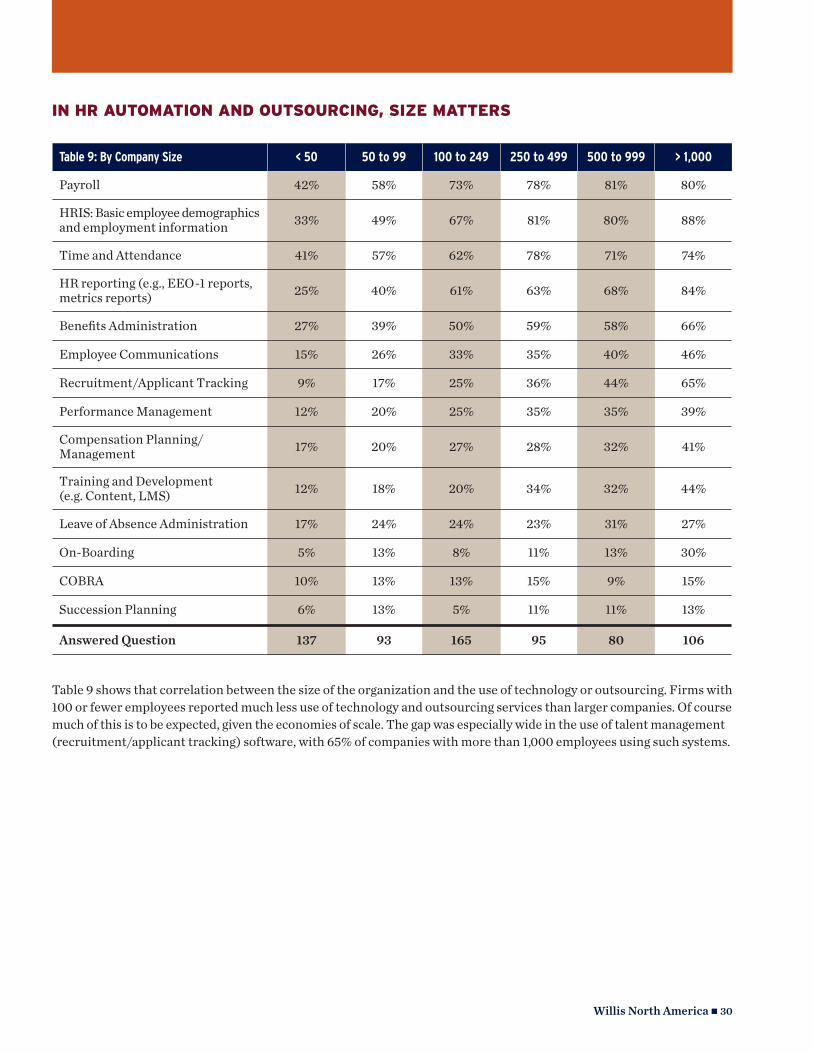
Table 9 shows that correlation between the size of the organization and the use of technology or outsourcing. Firms with100 or fewer employees reported much less use of technology and outsourcing services than larger companies. Of coursemuch of this is to be expected, given the economies of scale. The gap was especially wide in the use of talent management(recruitment/applicant tracking) software, with 65% of companies with more than 1,000 employees using such systems.
Table 9: By Company Size < 50 50 to 99 100 to 249 250 to 499 500 to 999 > 1,000
Payroll 42% 58% 73% 78% 81% 80%
HRIS: Basic employee demographicsand employment information 33% 49% 67% 81% 80% 88%
Time and Attendance 41% 57% 62% 78% 71% 74%
HR reporting (e.g., EEO-1 reports,metrics reports) 25% 40% 61% 63% 68% 84%
Benefits Administration 27% 39% 50% 59% 58% 66%
Employee Communications 15% 26% 33% 35% 40% 46%
Recruitment/Applicant Tracking 9% 17% 25% 36% 44% 65%
Performance Management 12% 20% 25% 35% 35% 39%
Compensation Planning/Management 17% 20% 27% 28% 32% 41%
Training and Development (e.g. Content, LMS) 12% 18% 20% 34% 32% 44%
Leave of Absence Administration 17% 24% 24% 23% 31% 27%
On-Boarding 5% 13% 8% 11% 13% 30%
COBRA 10% 13% 13% 15% 9% 15%
Succession Planning 6% 13% 5% 11% 11% 13%
Answered Question 137 93 165 95 80 106
IN HR AUTOMATION AND OUTSOURCING, SIZE MATTERS
Willis North America n 31
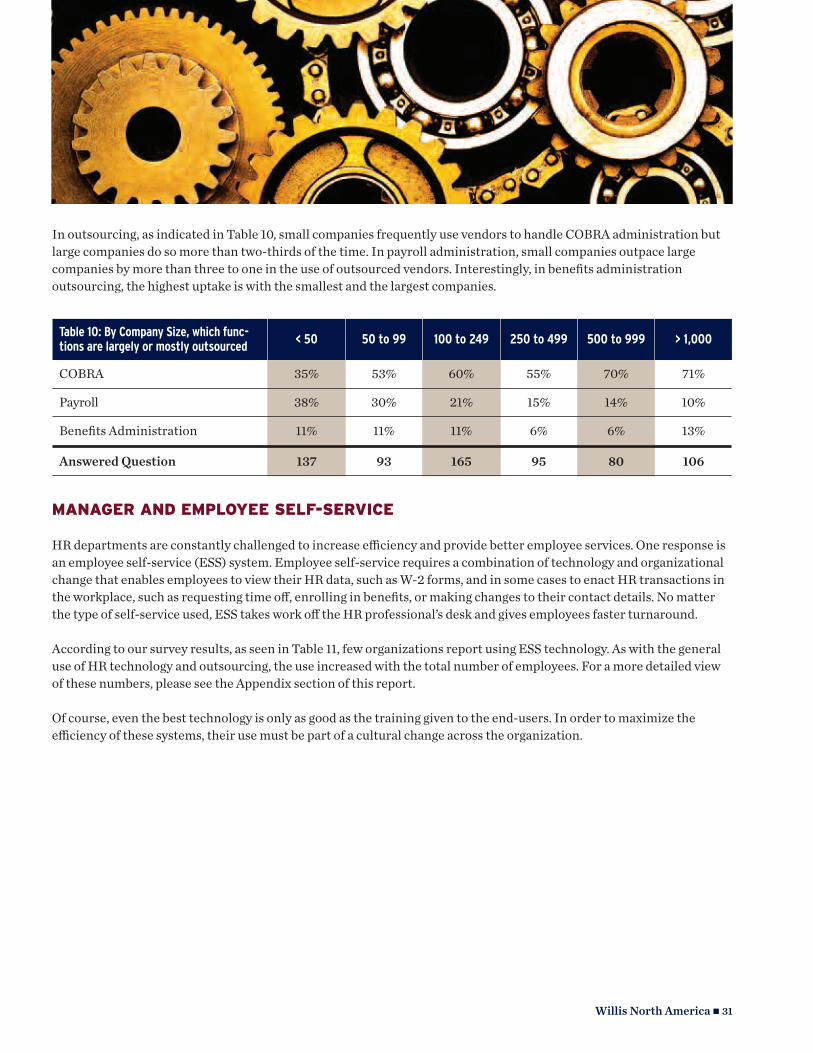
MANAGER AND EMPLOYEE SELF-SERVICE
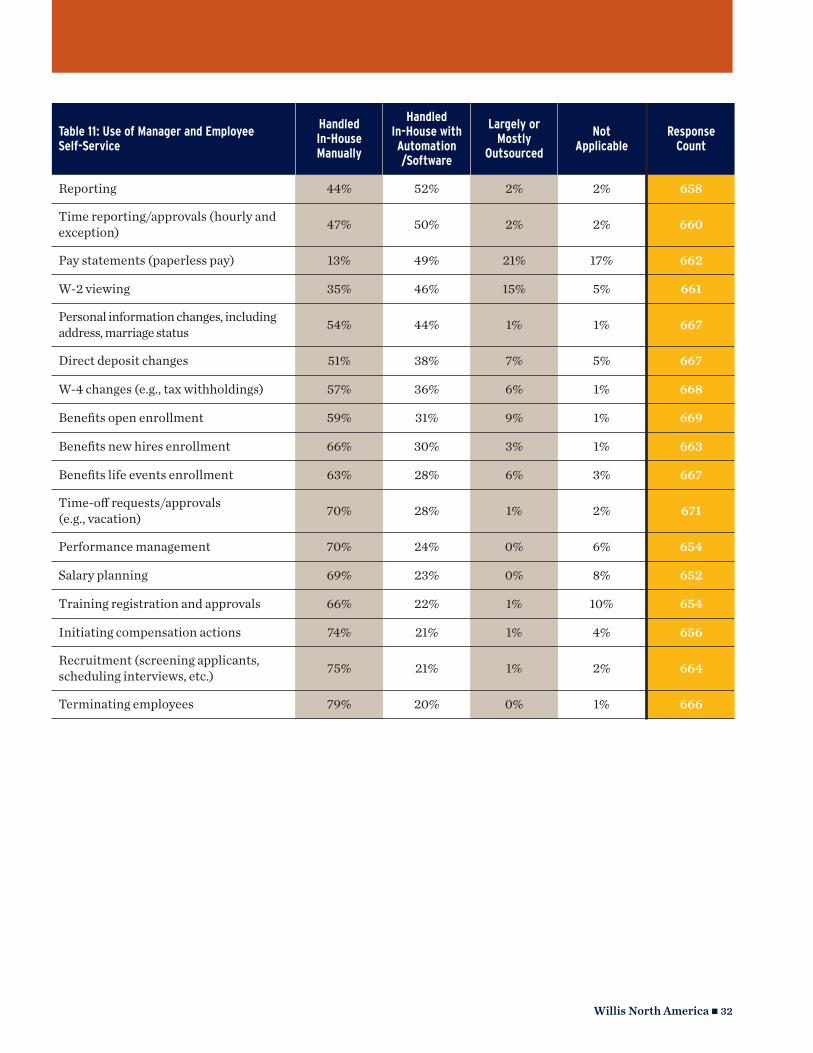
HR departments are constantly challenged to increase efficiency and provide better employee services. One response isan employee self-service (ESS) system. Employee self-service requires a combination of technology and organizationalchange that enables employees to view their HR data, such as W-2 forms, and in some cases to enact HR transactions inthe workplace, such as requesting time off, enrolling in benefits, or making changes to their contact details. No matterthe type of self-service used, ESS takes work off the HR professional’s desk and gives employees faster turnaround.
According to our survey results, as seen in Table 11, few organizations report using ESS technology. As with the generaluse of HR technology and outsourcing, the use increased with the total number of employees. For a more detailed viewof these numbers, please see the Appendix section of this report.
Of course, even the best technology is only as good as the training given to the end-users. In order to maximize theefficiency of these systems, their use must be part of a cultural change across the organization.
Table 10: By Company Size, which func-tions are largely or mostly outsourced
< 50 50 to 99 100 to 249 250 to 499 500 to 999 > 1,000
COBRA 35% 53% 60% 55% 70% 71%
Payroll 38% 30% 21% 15% 14% 10%
Benefits Administration 11% 11% 11% 6% 6% 13%
Answered Question 137 93 165 95 80 106
In outsourcing, as indicated in Table 10, small companies frequently use vendors to handle COBRA administration butlarge companies do so more than two-thirds of the time. In payroll administration, small companies outpace largecompanies by more than three to one in the use of outsourced vendors. Interestingly, in benefits administrationoutsourcing, the highest uptake is with the smallest and the largest companies.
Willis North America n 32
Table 11: Use of Manager and Employee Self-Service
Handled In-House Manually
Handled In-House withAutomation/Software
Largely orMostly
Outsourced
Not Applicable
Response Count
Reporting 44% 52% 2% 2% 658
Time reporting/approvals (hourly andexception) 47% 50% 2% 2% 660
Pay statements (paperless pay) 13% 49% 21% 17% 662
W-2 viewing 35% 46% 15% 5% 661
Personal information changes, includingaddress, marriage status 54% 44% 1% 1% 667
Direct deposit changes 51% 38% 7% 5% 667
W-4 changes (e.g., tax withholdings) 57% 36% 6% 1% 668
Benefits o pen enrollment 59% 31% 9% 1% 669
Benefits new hires enrollment 66% 30% 3% 1% 663
Benefits life events enrollment 63% 28% 6% 3% 667
Time-off requests/approvals (e.g., vacation) 70% 28% 1% 2% 671
Performance management 70% 24% 0% 6% 654
Salary planning 69% 23% 0% 8% 652
Training registration and approvals 66% 22% 1% 10% 654
Initiating compensation actions 74% 21% 1% 4% 656
Recruitment (screening applicants,scheduling interviews, etc.) 75% 21% 1% 2% 664
Terminating employees 79% 20% 0% 1% 666
HR STAFFINGLEVELS
Staffing and Services 2009 Survey
Willis North America n 34
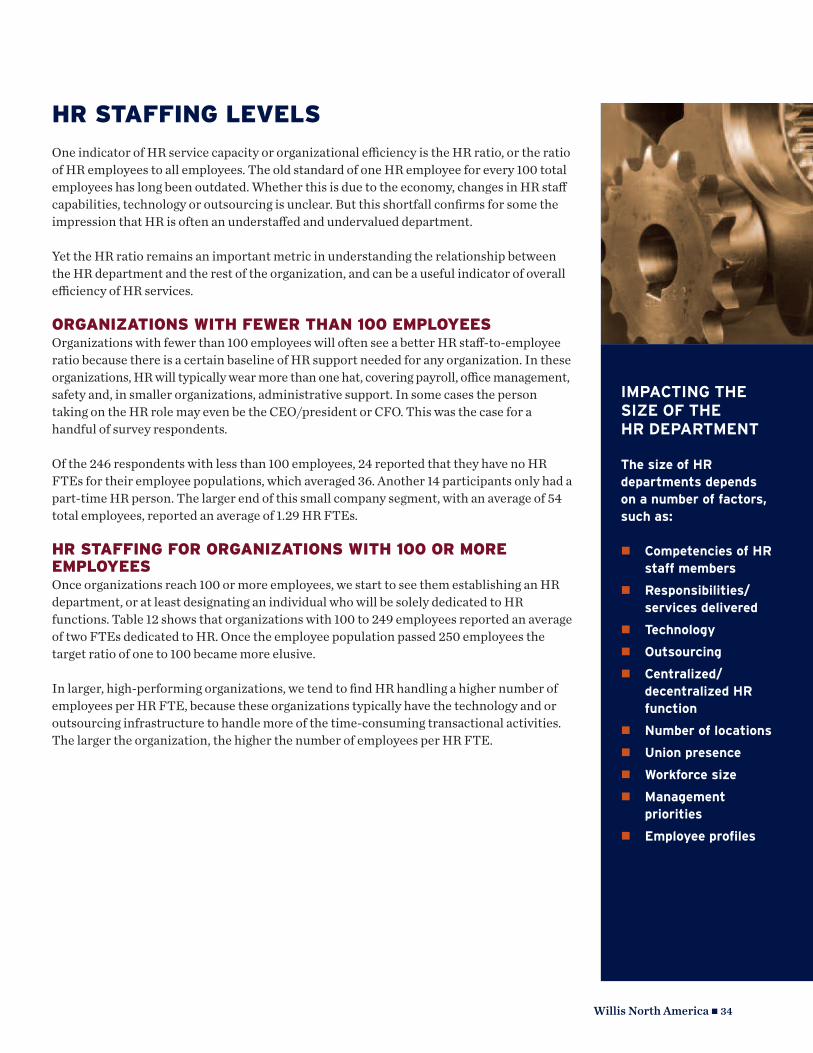
HR STAFFING LEVELS
One indicator of HR service capacity or organizational efficiency is the HR ratio, or the ratioof HR employees to all employees. The old standard of one HR employee for every 100 totalemployees has long been outdated. Whether this is due to the economy, changes in HR staffcapabilities, technology or outsourcing is unclear. But this shortfall confirms for some theimpression that HR is often an understaffed and undervalued department.
Yet the HR ratio remains an important metric in understanding the relationship betweenthe HR department and the rest of the organization, and can be a useful indicator of overallefficiency of HR services.
ORGANIZATIONS WITH FEWER THAN 100 EMPLOYEESOrganizations with fewer than 100 employees will often see a better HR staff-to-employeeratio because there is a certain baseline of HR support needed for any organization. In theseorganizations, HR will typically wear more than one hat, covering payroll, office management,safety and, in smaller organizations, administrative support. In some cases the persontaking on the HR role may even be the CEO/president or CFO. This was the case for ahandful of survey respondents.
Of the 246 respondents with less than 100 employees, 24 reported that they have no HRFTEs for their employee populations, which averaged 36. Another 14 participants only had apart-time HR person. The larger end of this small company segment, with an average of 54total employees, reported an average of 1.29 HR FTEs.
HR STAFFING FOR ORGANIZATIONS WITH 100 OR MOREEMPLOYEESOnce organizations reach 100 or more employees, we start to see them establishing an HRdepartment, or at least designating an individual who will be solely dedicated to HRfunctions. Table 12 shows that organizations with 100 to 249 employees reported an averageof two FTEs dedicated to HR. Once the employee population passed 250 employees thetarget ratio of one to 100 became more elusive.
In larger, high-performing organizations, we tend to find HR handling a higher number ofemployees per HR FTE, because these organizations typically have the technology and oroutsourcing infrastructure to handle more of the time-consuming transactional activities.The larger the organization, the higher the number of employees per HR FTE.
ImpactIng thesIZe oF the hr department
the size of hr
departments depends
on a number of factors,
such as:
n competencies of hr
staff members
n responsibilities/
services delivered
n technology
n outsourcing
n centralized/
decentralized hr
function
n number of locations
n union presence
n workforce size
n management
priorities
n employee profiles
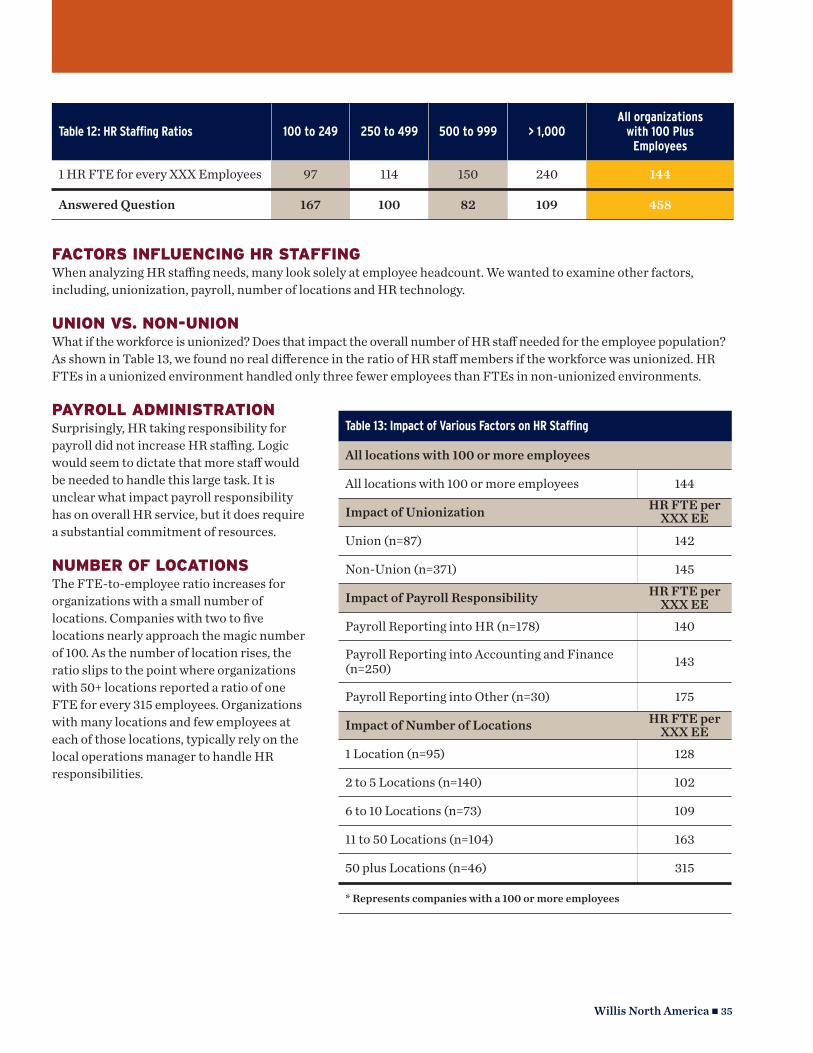
FACTORS INFLUENCING HR STAFFINGWhen analyzing HR staffing needs, many look solely at employee headcount. We wanted to examine other factors,including, unionization, payroll, number of locations and HR technology.
UNION VS. NON-UNIONWhat if the workforce is unionized? Does that impact the overall number of HR staff needed for the employee population?As shown in Table 13, we found no real difference in the ratio of HR staff members if the workforce was unionized. HRFTEs in a unionized environment handled only three fewer employees than FTEs in non-unionized environments.
PAYROLL ADMINISTRATIONSurprisingly, HR taking responsibility forpayroll did not increase HR staffing. Logicwould seem to dictate that more staff wouldbe needed to handle this large task. It isunclear what impact payroll responsibilityhas on overall HR service, but it does requirea substantial commitment of resources.
NUMBER OF LOCATIONSThe FTE-to-employee ratio increases fororganizations with a small number oflocations. Companies with two to fivelocations nearly approach the magic numberof 100. As the number of location rises, theratio slips to the point where organizationswith 50+ locations reported a ratio of oneFTE for every 315 employees. Organizationswith many locations and few employees ateach of those locations, typically rely on thelocal operations manager to handle HRresponsibilities.
Willis North America n 35
Table 12: HR Staffing Ratios 100 to 249 250 to 499 500 to 999 > 1,000All organizations
with 100 Plus Employees
1 HR FTE for every XXX Employees 97 114 150 240 144
Answered Question 167 100 82 109 458
Table 13: Impact of Various Factors on HR Staffing
All locations with 100 or more employees
All locations with 100 or more employees 144
Impact of Unionization HR FTE perXXX EE
Union (n=87) 142
Non-Union (n=371) 145
Impact of Payroll Responsibility HR FTE perXXX EE
Payroll Reporting into HR (n=178) 140
Payroll Reporting into Accounting and Finance(n=250) 143
Payroll Reporting into Other (n=30) 175
Impact of Number of Locations HR FTE perXXX EE
1 Location (n=95) 128
2 to 5 Locations (n=140) 102
6 to 10 Locations (n=73) 109
11 to 50 Locations (n=104) 163
50 plus Locations (n=46) 315
* Represents companies with a 100 or more employees

THE IMPACT OF HR TECHNOLOGY ON HRSTAFFING RATIOSThe impact of HR technology and outsourcing on HR staffing ratiosproved to be surprisingly ambiguous.
To assess the impact of HR technology and outsourcing on HRstaffing, we examined the 14 activities listed in question 25 of thesurvey. We assigned a value of one point for anything that theorganization handled through technology/automation or outscoringand a zero for anything the company handled manually or did nothandle at all. A company using software or outsourcing to handle allof the listed HR activities would receive a score of 14.
Willis North America n 36
14 hr actIvItIes lIst
1. payroll
2. hrIs: basic employee
demographics and employment
Information
3. hr reporting (e.g., eeo-1 reports,
metrics reports)
4. time and attendance
5. benefits administration
6. employee communications (i.e.,
posting information for employees
to access, such as policies,
procedures, etc.)
7. recruitment/applicant tracking
8. performance management
9. compensation
planning/management
10. training and development
(e.g. content, lms,)
11. leave of absence administration
12. on-boarding
13. cobra
14. succession planning
Table 14: Impact of HR Staffing as a result ofTechnology and Outsourcing
HR FTE per XXX Employee
3 or Fewer Applications (n=64) 145
3 or Fewer Applications (n=64) 160
3 or Fewer Applications (n=64) 130
10 Plus Applications (n=87) 138
Table 15: Impact of HR Staffing as a result of theUse of Employee and Manager Self-Service
HR FTE per XXX Employee
4 or Fewer Applications (n=159) 151
5 to 8 Applications (n=131) 143
9 to 12 Applications (n=83) 141
13 Plus Applications (n=66) 131
We expected to find that high scoring organizations would also have ahigher number of employees per HR FTEs, because HR would needfewer people to handle the administrative transactions. However, thenumbers did not bear this assumption. The results, as shown in Table14, seemed to follow no clear pattern. Organizations with low tomiddle scores of four to six had the strongest staff-to-employee ratios.
In attempting to measure the impact of self-service applications, wedid see what we expected: a small decline in HR FTEs per employeewhen companies used more employee and manager self-serviceapplications.

DEMOGRAPHICS
Staffing and Services 2009 Survey
Willis North America n 38
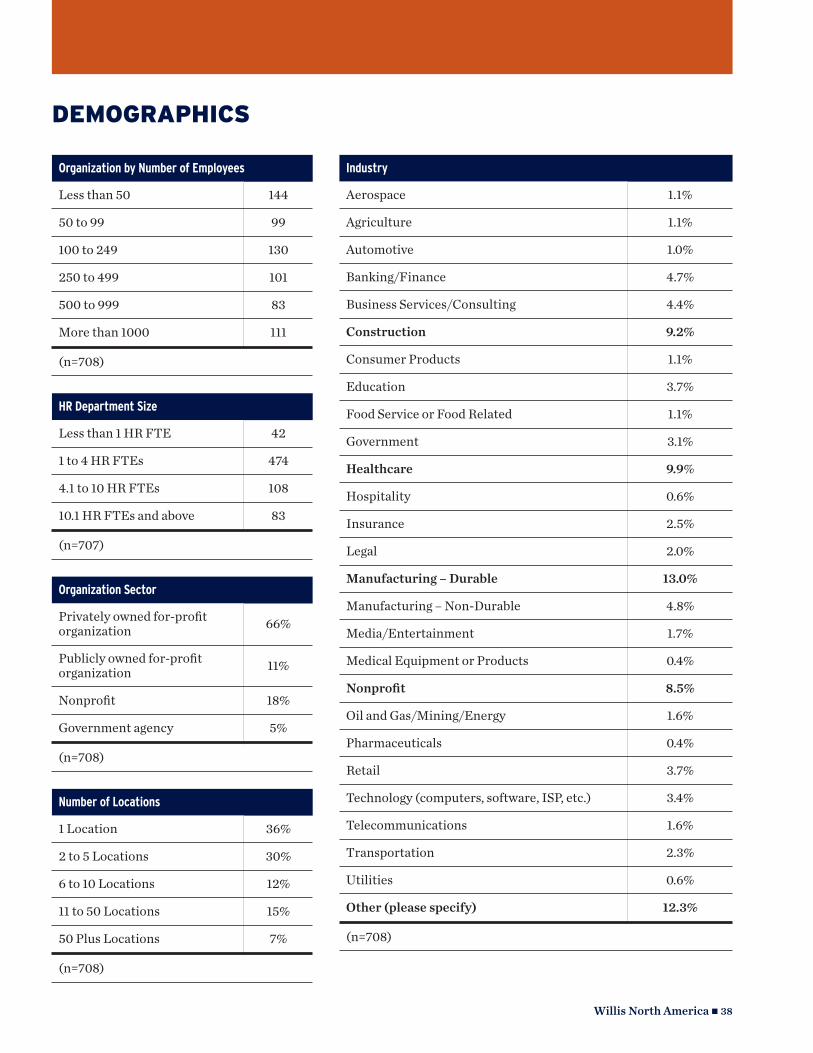
Organization by Number of Employees
Less than 50 144
50 to 99 99
100 to 249 130
250 to 499 101
500 to 999 83
More than 1000 111
(n=708)
HR Department Size
Less than 1 HR FTE 42
1 to 4 HR FTEs 474
4.1 to 10 HR FTEs 108
10.1 HR FTEs and above 83
(n=707)
Number of Locations
1 Location 36%
2 to 5 Locations 30%
6 to 10 Locations 12%
11 to 50 Locations 15%
50 Plus Locations 7%
(n=708)
Organization Sector
Privately owned for-profit organization 66%
Publicly owned for-profit organization 11%
Nonprofit 18%
Government agency 5%
(n=708)
Industry
Aerospace 1.1%
Agriculture 1.1%
Automotive 1.0%
Banking/Finance 4.7%
Business Services/Consulting 4.4%
Construction 9.2%
Consumer Products 1.1%
Education 3.7%
Food Service or Food Related 1.1%
Government 3.1%
Healthcare 9.9%
Hospitality 0.6%
Insurance 2.5%
Legal 2.0%
Manufacturing – Durable 13.0%
Manufacturing – Non-Durable 4.8%
Media/Entertainment 1.7%
Medical Equipment or Products 0.4%
Nonprofit 8.5%
Oil and Gas/Mining/Energy 1.6%
Pharmaceuticals 0.4%
Retail 3.7%
Technology (computers, software, ISP, etc.) 3.4%
Telecommunications 1.6%
Transportation 2.3%
Utilities 0.6%
Other (please specify) 12.3%
(n=708)
DEMOGRAPHICS
SURVEYINSTRUMENT
Staffing and Services 2009 Survey
SURVEY INSTRUMENT
1. Which of the following most closely represents your industry?
2. Which of the following most closely represents your sector?
3. Please provide the estimated total annual revenue for yourorganization.
4. Please provide the estimated total expenses for yourorganization.
5. How many states does your organization operate in?
6. How many total locations does your organization have?
7. What is your organization's (Please do not count Contractors orSeasonal Workers in these numbers)n Total employee headcount?n Total number of FTEs (Full Time Equivalent)?
8. Based on your total headcount above, please tell us whatpercentage is full time or part time based on each employeegroup. (Rounding to the nearest whole number the sum of allboxes should equal 100%, but do not include the % sign in yourresponse.)
9. If used, on average per year how many of the following positionsdoes the organization have:n Seasonal Workersn Independent Contractors
10. What percentage of total employees is represented by a union?(Check One)
11. For the last rolling 12 months how many total new hires has theorganization made?
12. What is the annual turnover percentage rate for the followcategories? (Please use whole numbers without % sign)
13. If known, please provide the following information about theorganization's total annual spend for salaries and benefits.
14. To whom does the top executive in your HR department directlyreport?
15. Which best describes the HR Staff members for yourorganization?
16. Which of the following functions are primarily handled by theHR Department at your organization. (Check all that apply)
17. Which department is responsible for payroll administration andprocessing?
18. What is your total compensation and benefits spend for ALL HRStaff?
Willis North America n 40
19. How many FTEs in TOTAL, does theorganization have working in an HRcapacity?
20. Of the people working in a HRCapacity, how many FTEs are a:
21. Of the people working in an HRCapacity, how many FTEs work at then Corporate Leveln Division, Region, Group or Unit
Leveln Local, Facility, or Plat Level
22. Does your organization haven HR Generalist Onlyn HR Specialist Onlyn A mix of Generalist and Specialist
23. Of the people working in an HRCapacity, how many work in any ofthe following “Specialist” roles,please provide the total FTEs perspecialty.
24. In total, what percent of time do youHR Generalist spend in each of thefollowing activities.
25. For each of the following areas of HRtechnology/outsourcing, pleaseindicate which approach BESTdescribes how this function is handled.
26. For each of the following areas ofmanager/employee self-service,please indicate which approachBEST describes how this function ishandled.
27. If you would like to receive a copy ofthis survey results, please provideyour contact information below. Yourresponses will remain completelyanonymous and your name will notbe given to any external parties.
28. Is there any feedback or commentsyou would like to provide us on thissurvey? We appreciate your input.

ABOUT WILLIS
Staffing and Services 2009 Survey
ABOUT WILLIS
The Willis Human Capital Practice offers a comprehensive suite of brokerage and consulting services to proactivelywork with your organization to design and deploy human resources initiatives. We have decades of experience workingwith companies of every type and size, customizing solutions for each organization’s unique challenges. Below are areaswhere we offer especially strong expertise:
n Employee communicationsn Compliancen Employee engagementn Managing the rising cost of health caren Engaging employees in healthy behaviorn Recruitment and retentionn Vendor managementn Benefits administrationn Reducing absenteeism/presenteeismn Increasing productivityn Adjusting to changing workforce demographics
Our approach is unique: Willis combines the best qualities of a true broker with the tools and resources of a pureconsulting firm to offer a full array of services at competitive prices.
Willis North America n 42
HR TECHNOLOGYANDOUTSOURCING
Staffing and Services 2009 Survey
Willis North America n 44
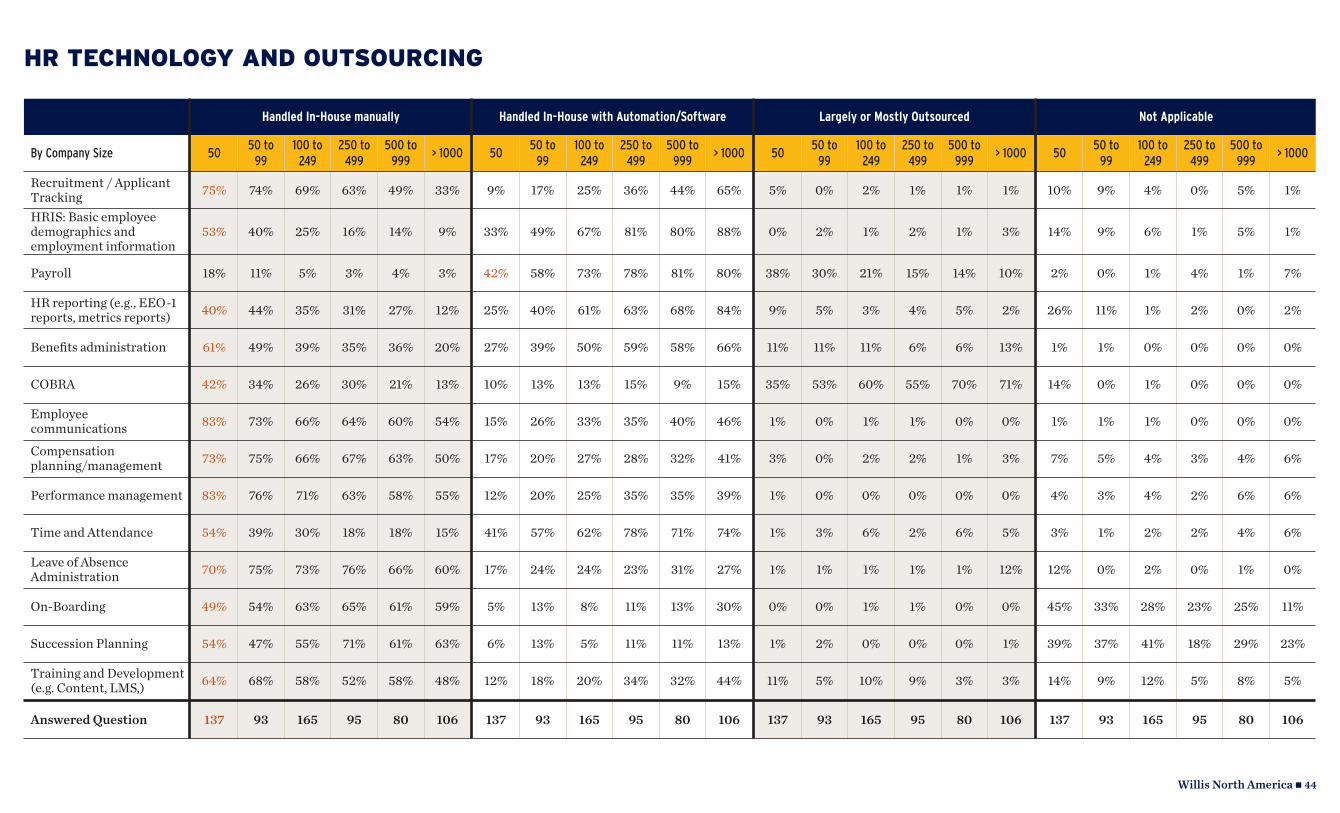
HR TECHNOLOGY AND OUTSOURCING
Handled In-House manually Handled In-House with Automation/Software Largely or Mostly Outsourced Not Applicable
By Company Size 5050 to
99
100 to
249
250 to
499
500 to
999> 1000 50
50 to
99
100 to
249
250 to
499
500 to
999> 1000 50
50 to
99
100 to
249
250 to
499
500 to
999> 1000 50
50 to
99
100 to
249
250 to
499
500 to
999> 1000
Recruitment / ApplicantTracking 75% 74% 69% 63% 49% 33% 9% 17% 25% 36% 44% 65% 5% 0% 2% 1% 1% 1% 10% 9% 4% 0% 5% 1%
HRIS: Basic employeedemographics andemployment information
53% 40% 25% 16% 14% 9% 33% 49% 67% 81% 80% 88% 0% 2% 1% 2% 1% 3% 14% 9% 6% 1% 5% 1%
Payroll 18% 11% 5% 3% 4% 3% 42% 58% 73% 78% 81% 80% 38% 30% 21% 15% 14% 10% 2% 0% 1% 4% 1% 7%
HR reporting (e.g., EEO-1reports, metrics reports) 40% 44% 35% 31% 27% 12% 25% 40% 61% 63% 68% 84% 9% 5% 3% 4% 5% 2% 26% 11% 1% 2% 0% 2%
Benefits administration 61% 49% 39% 35% 36% 20% 27% 39% 50% 59% 58% 66% 11% 11% 11% 6% 6% 13% 1% 1% 0% 0% 0% 0%
COBRA 42% 34% 26% 30% 21% 13% 10% 13% 13% 15% 9% 15% 35% 53% 60% 55% 70% 71% 14% 0% 1% 0% 0% 0%
Employeecommunications 83% 73% 66% 64% 60% 54% 15% 26% 33% 35% 40% 46% 1% 0% 1% 1% 0% 0% 1% 1% 1% 0% 0% 0%
Compensationplanning/management 73% 75% 66% 67% 63% 50% 17% 20% 27% 28% 32% 41% 3% 0% 2% 2% 1% 3% 7% 5% 4% 3% 4% 6%
Performance management 83% 76% 71% 63% 58% 55% 12% 20% 25% 35% 35% 39% 1% 0% 0% 0% 0% 0% 4% 3% 4% 2% 6% 6%
Time and Attendance 54% 39% 30% 18% 18% 15% 41% 57% 62% 78% 71% 74% 1% 3% 6% 2% 6% 5% 3% 1% 2% 2% 4% 6%
Leave of AbsenceAdministration 70% 75% 73% 76% 66% 60% 17% 24% 24% 23% 31% 27% 1% 1% 1% 1% 1% 12% 12% 0% 2% 0% 1% 0%
On-Boarding 49% 54% 63% 65% 61% 59% 5% 13% 8% 11% 13% 30% 0% 0% 1% 1% 0% 0% 45% 33% 28% 23% 25% 11%
Succession Planning 54% 47% 55% 71% 61% 63% 6% 13% 5% 11% 11% 13% 1% 2% 0% 0% 0% 1% 39% 37% 41% 18% 29% 23%
Training and Development(e.g. Content, LMS,) 64% 68% 58% 52% 58% 48% 12% 18% 20% 34% 32% 44% 11% 5% 10% 9% 3% 3% 14% 9% 12% 5% 8% 5%
Answered Question 137 93 165 95 80 106 137 93 165 95 80 106 137 93 165 95 80 106 137 93 165 95 80 106
USE OF MANAGERAND/OREMPLOYEESELF-SERVICE
Staffing and Services 2009 Survey
Willis North America n 46
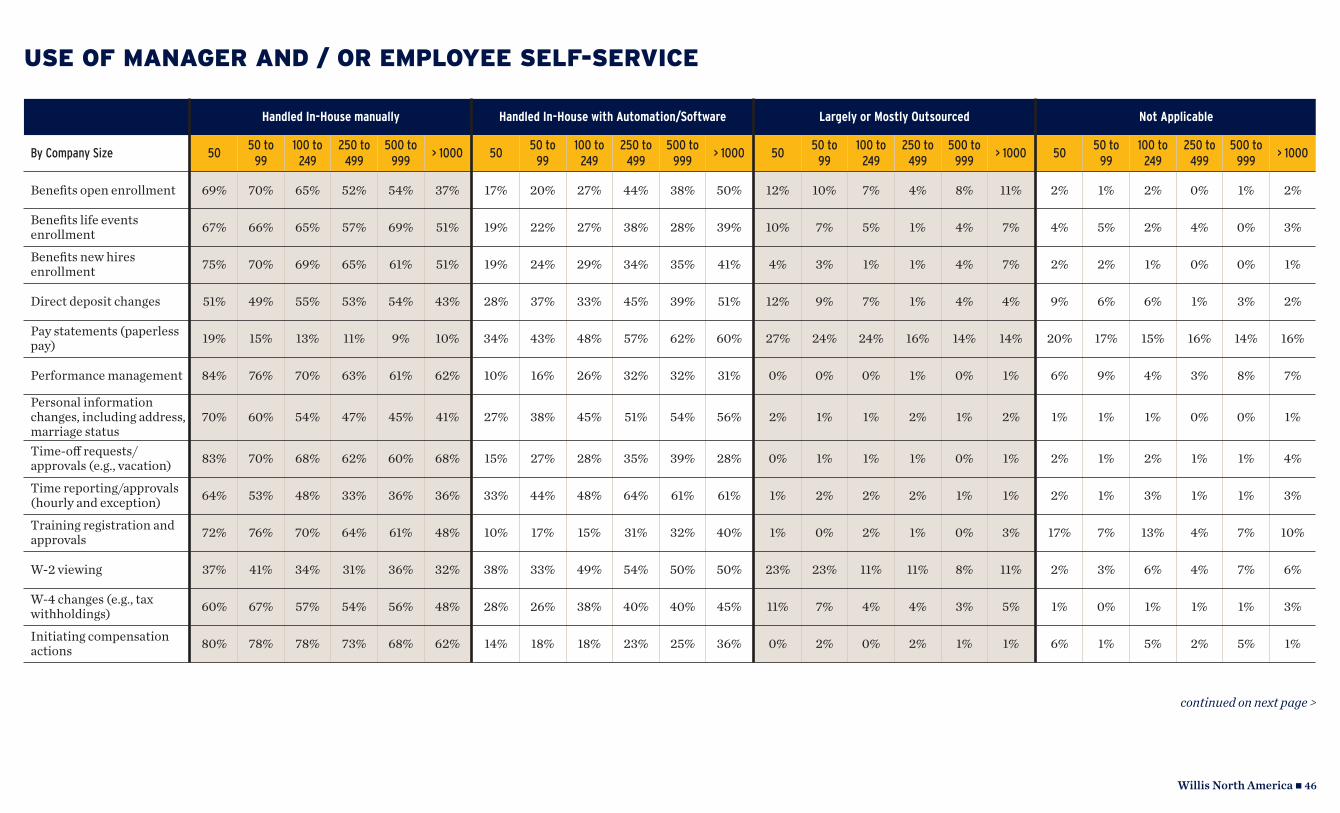
USE OF MANAGER AND / OR EMPLOYEE SELF-SERVICE
Handled In-House manually Handled In-House with Automation/Software Largely or Mostly Outsourced Not Applicable
By Company Size 5050 to
99
100 to
249
250 to
499
500 to
999> 1000 50
50 to
99
100 to
249
250 to
499
500 to
999> 1000 50
50 to
99
100 to
249
250 to
499
500 to
999> 1000 50
50 to
99
100 to
249
250 to
499
500 to
999> 1000
Benefits open enrollment 69% 70% 65% 52% 54% 37% 17% 20% 27% 44% 38% 50% 12% 10% 7% 4% 8% 11% 2% 1% 2% 0% 1% 2%
Benefits life events enrollment 67% 66% 65% 57% 69% 51% 19% 22% 27% 38% 28% 39% 10% 7% 5% 1% 4% 7% 4% 5% 2% 4% 0% 3%
Benefits new hires enrollment 75% 70% 69% 65% 61% 51% 19% 24% 29% 34% 35% 41% 4% 3% 1% 1% 4% 7% 2% 2% 1% 0% 0% 1%
Direct deposit changes 51% 49% 55% 53% 54% 43% 28% 37% 33% 45% 39% 51% 12% 9% 7% 1% 4% 4% 9% 6% 6% 1% 3% 2%
Pay statements (paperlesspay) 19% 15% 13% 11% 9% 10% 34% 43% 48% 57% 62% 60% 27% 24% 24% 16% 14% 14% 20% 17% 15% 16% 14% 16%
Performance management 84% 76% 70% 63% 61% 62% 10% 16% 26% 32% 32% 31% 0% 0% 0% 1% 0% 1% 6% 9% 4% 3% 8% 7%
Personal informationchanges, including address,marriage status
70% 60% 54% 47% 45% 41% 27% 38% 45% 51% 54% 56% 2% 1% 1% 2% 1% 2% 1% 1% 1% 0% 0% 1%
Time-off requests/approvals (e.g., vacation) 83% 70% 68% 62% 60% 68% 15% 27% 28% 35% 39% 28% 0% 1% 1% 1% 0% 1% 2% 1% 2% 1% 1% 4%
Time reporting/approvals(hourly and exception) 64% 53% 48% 33% 36% 36% 33% 44% 48% 64% 61% 61% 1% 2% 2% 2% 1% 1% 2% 1% 3% 1% 1% 3%
Training registration andapprovals 72% 76% 70% 64% 61% 48% 10% 17% 15% 31% 32% 40% 1% 0% 2% 1% 0% 3% 17% 7% 13% 4% 7% 10%
W-2 viewing 37% 41% 34% 31% 36% 32% 38% 33% 49% 54% 50% 50% 23% 23% 11% 11% 8% 11% 2% 3% 6% 4% 7% 6%
W-4 changes (e.g., tax withholdings) 60% 67% 57% 54% 56% 48% 28% 26% 38% 40% 40% 45% 11% 7% 4% 4% 3% 5% 1% 0% 1% 1% 1% 3%
Initiating compensation actions 80% 78% 78% 73% 68% 62% 14% 18% 18% 23% 25% 36% 0% 2% 0% 2% 1% 1% 6% 1% 5% 2% 5% 1%
continued on next page >
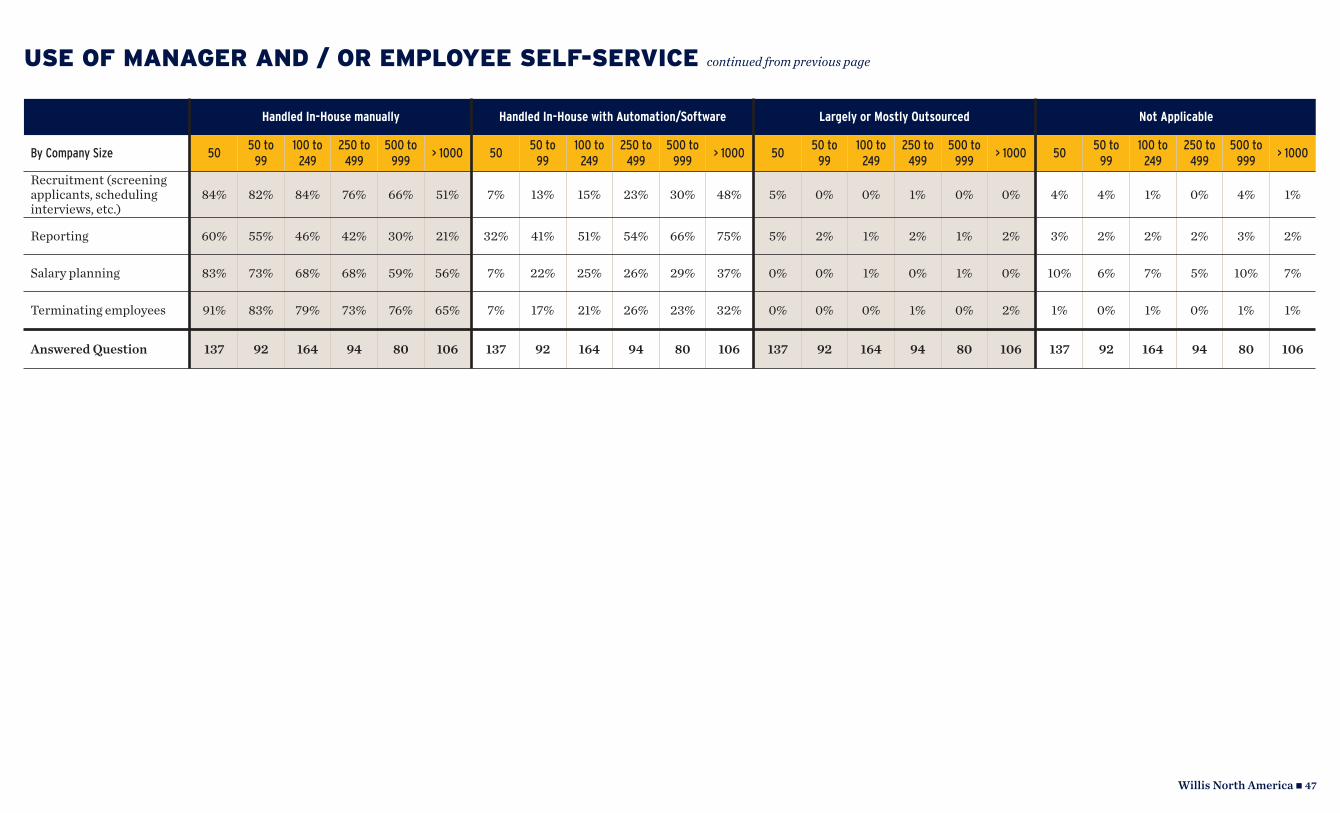
USE OF MANAGER AND / OR EMPLOYEE SELF-SERVICE continued from previous page
Handled In-House manually Handled In-House with Automation/Software Largely or Mostly Outsourced Not Applicable
By Company Size 5050 to
99
100 to
249
250 to
499
500 to
999> 1000 50
50 to
99
100 to
249
250 to
499
500 to
999> 1000 50
50 to
99
100 to
249
250 to
499
500 to
999> 1000 50
50 to
99
100 to
249
250 to
499
500 to
999> 1000
Recruitment (screening applicants, scheduling interviews, etc.)
84% 82% 84% 76% 66% 51% 7% 13% 15% 23% 30% 48% 5% 0% 0% 1% 0% 0% 4% 4% 1% 0% 4% 1%
Reporting 60% 55% 46% 42% 30% 21% 32% 41% 51% 54% 66% 75% 5% 2% 1% 2% 1% 2% 3% 2% 2% 2% 3% 2%
Salary planning 83% 73% 68% 68% 59% 56% 7% 22% 25% 26% 29% 37% 0% 0% 1% 0% 1% 0% 10% 6% 7% 5% 10% 7%
Terminating employees 91% 83% 79% 73% 76% 65% 7% 17% 21% 26% 23% 32% 0% 0% 0% 1% 0% 2% 1% 0% 1% 0% 1% 1%
Answered Question 137 92 164 94 80 106 137 92 164 94 80 106 137 92 164 94 80 106 137 92 164 94 80 106
Willis North America n 47