staff pall er - agecon searchageconsearch.umn.edu/record/201214/files/agecon-msu-97-15.pdf · staff...
TRANSCRIPT

378 . 77427 D34 S73 97- 15
Staff Pall_er Waite Ubrar'J . d Economics oept o~ ,t..pp\l~innesota Uni'\/ersit'i oi ,t._'\/e - 232 C\aOff '\994 sutord i;510B-6040 USA St. pau\ MN ~
CONTRACT FINISHING FOR NEW ENTRANTS IN PORK PRODUCTION
By
Laura L. Martin, Dale Rozeboom and Gerry Schwab
AEC Staff Paper #97-15 March 1997
With assistance from :
Ron Hayden Former District Livestock Agent
Howard Person Agricultural Engineer
MSU Extension Specialist
Lee Jacobs Crop and Soil Science Department
MSU Extension Specialist
Tim Johnson Area Livestock Agent
.......... Department of Agricultural Economics MICHIGAN STATE UNIVERSITY
East Lansing , Michigan MSU is an Affirmative Action/Equal Opportunity Institution

Ag. Econ Staff Paper 3/97
Contract Finishing 31 ( , Ill/ ::l)
D34 s13 '17 - (.5
For New Entrants in Pork Production
Prepared by:
Laura Martin Agricultural Economist MSU Extension Specialist
With assistance from:
Ron Hayden District Livestock Agent
Tim Johnson Area Livestock Agent
Dale Rozeboom Animal Scientist MSU Extension Specialist
Howard Person Agricultural Engineer MSU Extension Specialist
Gerry Schwab Agricultural Economist MSU Extension Specialist
Lee Jacobs Crop and Soil Science Dept. MSU Extension Specialist

Contract Finishing for New Entrants in Pork Production
INTRODUCTION
The pork production industry is a far different industry today than it was fifty, twenty, or even five years ago. On diversified Midwestern farms during the mid-to-late 201h century, the swine enterprise was labeled "the mortgage lifter" . The hogs added value to homeproduced feedstuffs such as corn and increased the income from a given acreage base. As farm mechanization and technology rapidly developed, farms became larger and less divers~ed as livestock disappeared from many farmsteads .
In this paper, we address the question whether swine units can be introduced to nonlivestoc farms via a coordinated agreement for the grower-finisher phase and make these farms more profitable. To do this, we first describe some of the changes that have taken place in the pork industry . Second, production contracts and grower payments are introduced. Next, we move on to issues of manure management and the value of manure to non-livestock farms . Finally, in the Appendix, financial analyses for sample contract finishing contracts ~ laid out to help farmers determine if contract finishing could benefit their farming operationsj
CHANGES IN THE PORK INDUSTRY
Why the changes in pork production? Changes have occurred not only in response to the consumer's demand for lean, high quality pork, but also because of competition -competition among pork producers, as well as competition between pork, poultry and other livestock commodities. Leaner pork is made possible with improved genetics whereby pigs are bred for improved performance in indoor or "confinement" facilities. These same pigs are produced more efficiently using new technologies which often are adopted most easily in larger-scaled operations. The most efficient farmers also are the most competitive, emphasizing that pork production is very much a business.
Has hog farming become so intensely competitive now that there is no more opportunity to get into raising hogs? Definitely not! As long as one understands the new technologies and the coordinated production systems now being used in the pork industry, there certainly is opportunity for individuals to raise hogs and make a profit doing so.
What are some of the changes, the new technologies and terminology occurring in the coordinated systems? A number of them are described below:
Larger farms: This development has come about because of the economies of scale, both technological and pecuniary . Large volume can result in lower prices for input purchases and higher prices for product sales. Also, labor is more specialized and more efficient when workers are given a smaller range of responsibilities in a single phase of production. Some technology has not been size neutral and has encouraged larger farms.
The movement toward larger farms was led by nontraditional hog producing states

like North Carolina. Changing social and economic conditions in this state facilitated the rapid adoption of the newest technologies available. The need for economic development from a dwindling tobacco industry and available labor contributed to the movement coward highly efficient mega-farms that could compete effectively with farms in the traditional bog states.
Production phases: There are three phases of production, each with several names: (1) breeding herd, sow herd, gestation-farrowing, or just farrowing.; (2) nursery, feeder pig, or weaner; and, (3) finishing, finisher, grow-finisher or grower.
rlldustry Structure: Highly-skilled labor working on farms or "units " specializing in one phase of production has encouraged the development of a coordinated industry structure. Oftentimes the coordination occurs as a contractual relationship. Owners of breeding herds and facilities (referred to as contractors or integrators) enter into contractual agreements to have other producers (called growers or farmers) care for and feed their animals. Ownership of the growing pigs is retained by the contractor, who also supplies the feed. and management expertise. The contract grower provides the land, buildings, and labor and assumes the responsibility for manure management and disposal.
Such arrangements, known as production contracts, exist throughout the agricultural sector and have been around for quite some time. Most of the processing fruits and vegetables are produced under production contracts. Contract production is also very common in the broiler and turkey industries and is becoming increasingly important in the swine industry, currently accounting for approximately 16-183 of all hogs marketed and expected to increase.
All-In-All-Out (AIAO): Rooms, whole buildings or complete sites are completely filled or emptied at one time (or over a short time interval) . Pigs of similar weight and age (or farrowing date in the case of sows) are placed and removed together. Groups are not mixed in an effort to prevent disease transmission from one group to another. Pigs raised in AIAO settings grow about 5-103 faster, and use about 5-103 less feed to do so.
Multi-site production: Different phases of production are kept in unique, separate locations or sites. Distance between sites can range from a few hundred yards to hundreds of miles. There may be one or more buildings on each site. Multi-site production makes the implementation of AIAO management practices easier.
Split-sex and phase feeding: These technologies involve matching nutritional needs with the growth of the pig. Gilts are leaner than barrows, eat less than barrows and thus require different amounts of daily nutrients . AIAO by sex allows us to feed gilts and barrows most appropriately and efficiently.
2
..

The rates at which lean muscle and fat are deposited vary over the time period from birth to market. This entire period has been broken down and described as phases (i.e., 40-80 lb., 80-120 lb., 120-160 lb., 160-200 lb. , 200 lb.- market weight) . Since the nutrient requirements of the pigs vary with age and weight, a particular diet is fed during each growth phase. Supplying the correct amount of nutrients for each growth phase of the growing pig improves the efficiency of growth and profitability. AIAO by age and weight (or growth phase) allows the growing pig to be fed most appropriately and efficiently.
Carcass-merit buying: Encouraging the implementation of AIAO and feeding for lean growth technologies has been the use of a carcass-merit buying program by packers. Producers now are being paid for the amount of lean pork they produce. Packers are monitoring the amount of fat and lean in each carcass and paying premiums for less fat and more lean.
Segregated Early Weaning (SEW): Traditionally, pigs have been weaned at about three to six weeks of age. However, techniques have recently been developed for weaning pigs at 10-14 days of age. "Early weaning" takes advantage of the high level of immunity to disease which the pigs possess at that young age. At that age, antibodies received in the colostrum or sow's milk early in lactation are still effective in preventing disease infection. By three to four weeks of age however, this immunity has diminished and the chance of disease has increased. To maximize the health benefits of early weaning, it is important to move early-weaned pigs to another site (segregate), thus the name SEW. The combination of SEW and AIAO results in pigs that use more of their feed for growth and less to fight disease.
Given the changing nature of the pork industry, farmers who understand the new technologies and terminology will be better positioned to compete in the industry and be profitable. In addition, determining how one can best fit into the emerging coordinated production systems may be a question producers want to consider. One of the ways in which a farmer can be linked is by producing market hogs under contract.
PRODUCTION CONTRACTS - How DO THEY WORK?
There is no one "standard" hog finishing contract in the industry . Contracts can be as varied as the people involved and may easily be altered at the start of the business relationship to better meet the needs of the grower and contractor. To provide a background as to how many contracts share the responsibilities and inputs in pork production, Table 1 lays out a typical arrangement.
3
- -- - -- ---------i

TABLE 1. GENERAL BREAKDOWN OF CONTRACTOR AND GROWER RESPONSIBILITIES
ITEM CONTRACTOR GROWER
Land, access road, buildings, equipment and water x Manure handling, storage, and disposal capacity x Feeder Pigs x Feed ingredients, processing and delivery x Veterinary services and medication x Fuel, electricity, and telephone x Facility Repairs and supplies x Marketing and transportation of all swine x Labor: Production and maintenance x Labor: Supervisory and specialists x
How IS GROWER PAYMENT DETERMINED?
When evaluating payments, farmers should recognize that most contracts end up having close to the same average payment per hog. In Michigan, this payment is typically between $10 and $13 per hog. The important thing to keep in mind is bow much variability there may be from one payment to the other, whether or not above-standard labor and management are rewarded, and the potential risk-sharing involved due to uncertainty in pounds gained, head delivered or pigs per space. Although individual contracts will vary, three representative contracts found in Michigan will now be discussed.
1. Payment Per Pound Gain + Potential Bonus:
Grower Payment = $0. 05 x (pounds gained) + feed conversion bonus + mortality bonus
2. Payment Per Hog Marketed + Potential Bonus:
Grower Payment = $10. 00 x (head marketed) + feed conversion bonus + mortality bonus
3. Payment Per Square Foot or Per Pig Space:
Grower Payment = $4. 00 x (square feet available in barn) + any potential bonuses
or, Grower Payment = $32. 00 per pig space per year + any potential bonuses
4

Feed conversion bonuses are used to encourage growers to monitor and adjust feed distributions , climate controls and other production features under the day-to-day management of the grower. As feed is the largest cost to the contractor, bonuses paid to a grower for feed savings can be a win-win situation. One example of a feed conversion (pounds of feed/pound of gain) bonus would be $0.50 for each one-tenth improvement between a standard feed conversion ratio and the grower 's actual feed conversion ratio multiplied by the number of animals marketed. Standard ratios may be anywhere from 3.0 to 3.4. Likewise, the incremental value may be less than or greater than $0.50. For example, if the standard feed conversion ratio in the contract is 3.2, but your herd had a 2.9 feed conversion, then you would earn a $1.50 bonus (50 cents for each 1110 point difference) on each animal marketed. In the same way, you may be penalized for feed conversion performance worse than a standard.
Mortality bonuses may be earned if the death loss is less than expected. A 2 3 death loss appears to be standard in the industry. Bonuses may be paid based on all animals in the group, on only a certain number of animals, or on pounds gained. For example, a mortality bonus may increase the payment on only those "extra" animals which were expected to be lost, but instead survived. Using this scenario, in a 1000-head finishing barn with 1020 pigs placed, and an expected death loss of 2 3, one would expect about 20 hogs to die . If instead, only 12 did (mortality = 1.23), then a mortality bonus would be earned on the eight "extra" hogs. The additional per head payment for these animals could range from $10.00 to $50.00.
Alternatively, a mortality bonus may be determined by the pounds gained by all animals in the barn. For instance, a 13 death loss would get an extra $0.01 per pound produced, a 1.5 3 death loss would result in a $0.005 per pound bonus and a 23 death loss would mean no bonus. Again using a 1000-head finishing barn and assuming 1020 feeder pigs are initially placed, a 1 3 death loss in this example means the grower earns an additional $0.01 for every pound of pork gained, or approximately $2,020 [(1010 head) x (200 lb./head) x ($0.01/lb.)].
Bonuses or performance incentives are an important feature of contracts for both sides involved in the agreement. Without them, the contractor is exposed to the risk that the farmer has no incentive to do the best job possible. Likewise, without bonuses, the contract farmer is not encouraged nor rewarded for doing the best he or she can. On the flip side, bonuses do expose the grower to some potential income variability.
There are a number of incidences when the third type of contract, based on square feet or pig space, may be more attractive to the contractor and/or grower. Contractors may prefer to use this type of agreement if they are less concerned with performance incentives and when flexibility to use the finishing facility at less than capacity is important. Growers also may prefer this type of contract if they prefer a more certain income and/or feel there is very little they can do to affect herd performance. Bear in mind, however, that the grower will likely be accepting a lower , but more certain income. In other words, the farmer will have less risk, but also less income.
5
l

MANURE MANAGEME!'.'T AND THE VALUE OF MANURE NUTRIENTS
As mentioned earlier, one of the important questions to ask in evaluating a hog finishing contract is "Who holds title to the manure?" In most every contractual arrangement the grower or farmer has ownership of the manure. Most contractors do not own the land surrounding the hog facility and have no use for the manure. Manure is a cost and potential liability to these small acreage enterprises. Should a farmer be very concerned about disposing of the manure? Yes, manure management is a critical point in the contract arrangement for a couple of reasons.
First, the profitability of a contract arrangement to the grower can be enhanced by considering the value of manure nutrients as a fertilizer for growing crops. In this case, the manure nutrients should be viewed as an asset. The value of these nutrients is discussed later.
Second, the Michigan Right-to-Farm Guidelines state that fertilizer application (N , P, and K) must be based on nutrient concentrations and nutrient removal rates by growing crops. The greatest concern is with phosphorus. The goal is to maintain nutrient balance between the two and prevent excesses of nutrients which can lead to environmental problems relative to water quality and the pollution of lakes and streams . If current Bray P 1 soil tests are less than 150 pounds/ A then manure can be applied in excess of agronomic rates (crop removal). If the current test is 150 to 300 pounds/A then manure must be applied at agronomic rates. Producers can apply two years' worth of manure phosphorus on a field every other year. If the Bray P1 test is more than 300 pounds/A, no phosphorus fertilizer (manure) can be applied .
The nutrient content of manure is a variable that is quite important in evaluating the economic and environmental impact of a livestock facility . The amount and value of swine manure can vary with: size of animals , nutrient concentrations in the diet, amount of feed waste , animal feed intakes, animal feed efficiencies, animal growth rates , water intake, bedding, manure handling and storage system. There is no one set of manure value data that is generally accepted and applicable to all situations.
Alternative sources of planning data for nutrients excreted in swine manure include the Midwest Planning Service (MWPS) and observations from various research studies (Table 2). A range of nutrient values is obtained whenever manure is collected from different sources and tested. A manure nutrient analysis provides the best farm-specific information for proper management of nutrients. In evaluating a potential finishing contract arrangement, it may be useful to request from the contractor/owner written results of several nutrient analyses the owner has completed on manure samples taken from the grow-finish units already in production.
MWPS data are cited in the current version of "Generally Accepted Agricultural and Management Practices for Manure Management and Utilization". This document has been adopted by the Michigan Agriculture Commission and included in Michigan's Right-to-Farm Guidelines . In developing enterprise budgets for this bulletin, MWPS data are used. As indicated in Table 2, other researchers have documented less nutrient excretion than MWPS, therefore providing a more conservative economic credit or value for manure. Likewise, land requirements for manure utilization will be lower as well when based on other nutrient production values .
6

TABLE 2. NUTRIENT PRODUCTION ON A PER MARKET HOG BASIS
GROWTH FROM 50 TO 250 POUNDS LIVE WEIGHT
Pounds
Total Nitrogen P20 s
MWPS-18, 1985a 8.26 5.90
Minnesota, 1994b 6.42 3.74
Tengman and coworkers, 1994c 7.32 6.14
Purkhiser (Unpublished)d 6.73 6.61
Pork Industry Handbookc 4.80 3.60
Cromwell and Coffey, 1994r 5.46 3.43
K20
6.37
2.81
Not provided
3.17
2.94
Not provided
•Midwest Plan Service. 1985. Livestock Waste Facilities Handbook. 2nd Edition. MWPS-18. bWagnar, T ., M. Schmitt, C . Clanton, and F . Bergsrud. 1994. "Livestock Manure Sampling
and Testing." Minnesota Extension Service Bulletin F0-6423-B. C'fengman, C.L., H .L. Person, and D.W. Rozeboom. 1994. "On-site Separation of Liquids
and Solids: Technology to Concentrate Swine Manure Phosphorus ." J . Anim. Sci. 73(Suppl. 1):58.
dPurkhiser, E.D. Informal on-farm survey conducted in the 1980's by MSU District Swine Extension Agent.
esutton, A.L., D.H. Vanderholm, and S.W. Melvin. 1979. "Fertilizer Value of Swine Manure ." Pork Industry Handbook. Michigan State University Extension Bulletin E-1128.
'Cromwell, G . and R.D. Coffey. 1994. "Future Strategies to Diminish Nitrogen and Phosphorus in Swine Manure." Proceedings of the 1994 North Central Regional Animal Science Extension Specialists Workshop, University of Missouri, Columbia.
A third and final manure management topic deserving consideration by potential contract growers is correctly estimating total manure volume produced in a finishing building each year. This estimation is critical for sizing manure storage facilities and for calculating an accurate enterprise budget. Like manure nutrient production, total volume of manure produced varies from farm to farm. For a 1000 head finisher, estimates can vary from 400,000 to 750,000 gallons per year, depending on: the amount of water used to clean buildings between groups, feeder type (wet-dry feeders decrease water waste), number of waterers per pen, type of waterers, drinking water delivery pressure and volume. In developing enterprise budgets for this bulletin, the total manure volume estimate provided in the Pork Industry Handbook is used.
7

TABLE 3.
TOTAL VOLUME OF MANURE PRODUCED PER DAY FOR A FINISHING HOG
AVERAGING 150 POUNDS LIVEWEIGHT
Information source Gallons/hd/d Noces
:tvf\VPS-18, 19858 1.13 Urine and feces only, no waste water
Pork Industry Handbookb 1.50 Urine + feces + waste water
Schmitt, (Unpublished), 1996c 1.40 Urine + feces + waste water
ASAE Standard D384.1 , 1992d 1.20 Exact sources not stated
Rozeboom (Unpublished), 1996c 1.35 Urine + feces + waste water
North Carolina Extensionr 2.13 Urine + feces + waste water
•Midwest Plan Service. 1985. Livestock Waste Facilities Handbook. 2nd Edition. MWPS-18. bMelvin, S.W., F.J . Humenik, and R.K. White. 1987. "Swine Waste Management Alternatives ."
Pork Industry Handbook. Michigan State University Extension Bulletin E-1399. cschmitt, M.A. 1996. Personal communication. University of Minnesota Extension Soil Scientist. dASAE. 1992. Manure Production and Characteristics. ASAE Data: ASAE 0384.1. J .R. Hahn
and E.E. Rosentreter, Eds . American Society of Agricultural Engineers. St. Joeseph, MI. cRozeboom, D.W. 1996. Unofficial survey. Michigan State University Extension Swine
Specialist. 'North Carolina Cooperative Extension Service. 1996. Certification Trajnini: fQr Operators Qf
Animal~ Manai:emeot Systems. Publication AG-538. North Carolina State University .
NlITRIENT BALANCE - AN EXAMPLE1
Producer Jones has just built a new 1000 head finishing barn. He recognizes that in anticipation of some pigs dying, it is an industry standard to place more than 1000 feeder pigs in the barn to ensure that the number of hogs, after accounting for death loss , will approximate capacity . In fact , he plans on an initial placement of 1020 feeder pigs. Based on a 2 .0 % mortality or death loss and just over 2.94 turns per year, he estimates he will raise approximately 2942 pigs per year. A turn is the 124-day period required for growing the pigs to market weight (118 days) and for cleaning the building before the next group of pigs enters (six days). Pigs will weigh an average of 150 pounds. In one year, Producer Jones ' pigs will produce about 520,000 gallons of manure (420,000 gallons of urine and
1This example of manure nutrient balance is based on data from MWPS-18 and coincides with the production figures used in Example 1 in the Appendix.
8

feces plus 100,000 gallons waste water) . Total nutrient production for the year would be:
Tutal Nutrient Production
8.26 # Total Nitrogen per pig x 2942 pigs per year = 24,301 #
5.90 # P20 5 per pig x 2942 pigs per year = 17,358 #
6.37 # K20 per pig x 2942 pigs per year = 18,741 #
These are the total nutrient amounts that would be applied to the field . Only 55 % of the total nitrogen produced is available to the first year's crop. The remainder of the nitrogen will be used by the crops grown in subsequent years. The amount of N, P , and K available for use by the crop also will be less if Producer Jones does not "knife-in" the manure. More nutrients are lost with the various methods of surface application.
Approximate nutrient removal2 on a per acre (A) basis by a 110 bushel/ A com crop (Michigan average) would be:
Pounds~
. 9 # N /bu x 110 bu/ A com = 99 # I A
.37 # P20 5 /bu x 110 bu/A com = 40.7 # IA
.27 # K20 /bu x 110 bu/A com = 29.7 #IA
To achieve nutrient balance, we can determine how many acres of corn we need in order to use the manure nutrients produced . This is calculated as follows :
Pounds Available Pounds ~ &ru Required
24,301 # Total N 99 # IA = 245 A
13,366 # Available (553) N 99 # IA = 135 A
17 ,358 # P20 5
18,741 # K20 5
40. 7 # I A = 426 A
29. 7 # I A = 631 A
Since potassium is fixed in the soil and does not leach, it is not considered a potential water quality problem. This is not true of phosphorus. Therefore, based on phosphorus, Producer Jones will need about 426 acres of com ground in order to manage the manure produced by his new contract finishing unit.
So what is the value of these nutrients to Producer Jones? Roughly , the value (before assessing pumping and hauling charges) is estimated to be about:
24,301 # Total N x $0.25/# = $6,075.25
17 ,358 # P20 5
18,741 # K20
x $0.25/# = $4,339.50
x $0.11/# = $2,061.51
This means that the total annual value of manure nutrients from Producer Jones' hog finishing unit is approximately $12,476.
2Vitosh, M.L. , J.W. Johnson, and D.B. Mengel. 1995. "Tri-State Fertilizer Recommendations for Com, Soybeans, Wheat & Alfalfa. " Michigan State University Extension Bulletin E-2567 .
9

QUESTIONS TO Ev ALUA TE IF You ARE CONSIDERING
A HOG FINISHING CONTRACT 3
1. What is the length of the contract and how can it be terminated?
2. Who holds title to the manure?
3. Who is responsible for dead animal disposal?
4. Do you have to accept all animals, or can you reject those feeder pigs that you feel are unhealthy?
5. Do you respect the knowledge and experience of the company's field representative who supervises your farm?
6. What is the reputation of the company or individual offering the contract?
7. If you produce grain, will the contractor purchase any of it to use as feed?
8. Do you fully understand how your contract payment is calculated?
9. How variable will your payments be?
10. When will you be paid and by whom?
11. Will you be penalized if you have less than "average" or "standard" productivity measures (i.e .• feed conversion or death loss)?
12. Who provides labor for loading and unloading animals?
13. Does the contract clearly state how many animals are in the agreement, when the animals will be delivered and marketed?
14. Will the manure nutrients be a benefit or a cost to you?
15. How much control do you have over the animals performance (feed efficiency, mortality)?
16. Does the contract clearly state the weight of the feeder pig (or a weight range) at time of placement and weight (or range) at time of removal? For contracts based on pounds gained this is critical.
17. Can other hogs be raised by the grower?
18. What happens if the owner or integrator exits from the pork production business?
19. Who provides for insurance on animals?
20. Does the contract offer you a reasonable return on your labor and management?
3lndividuals who wish to learn more about production contracts may find these two sources useful : "A Farmer's Legal Guide to Production Contracts" by NeiJ D. Hamilton, January 1995, Farm JournaJ Jnc., and "Guide to Contracting" by the National Pork Producers Council , JuJy 1996.
10

APPENDIX - FINANCIAL ANALYSIS
The following section provides financial analysis for examples of possible contract finishing arrangements. Example Enterprise Budgets for the first year are given for six alternative contract payments. Using the enterprise budget from the first example, a Net Present Value Analysis is provided for two different tax rates, both with and without manure credit.
The first and second example budgets (B-1 , B-2) are based on a contract that determines grower payment by pounds gained, with bonuses earned for better than standard feed efficiency and mortality . The difference in these two budgets arises from differences in performance and investment financing . Likewise, the third and fourth budgets show the effects of different performance and investment financing , but base payment on the number of animals marketed. The fifth enterprise budget considers a contract where grower payment is made per pig space per year. This example considers a value of $32.00 per pig space per year. Lastly, budget number six illustrates how the value of manure nutrients can influence profitability. It is the same as the first budget except Pork Industry Handbook nutrient production data is used instead of MWPS-18 (see Table 2.) These budgets provide financial analysis for the first year.
The occurrence of the per head contract in Example 4 offering the highest payment per hog is merely due to the high performance. It is not meant to imply that per head contracts result in higher grower payments. Rather, the alternative enterprise budgets and the range in per hog payment are provided to show: 1) how grower payment can vary with performance (i.e., feed conversion and mortality), 2) how grower returns can vary with value given to manure nutrients, and 3) the effect of financing on rate of return. To evaluate the investment in a finishing facility beyond the first year, the Net Present Value of the investment is considered.
Net Present Value (NPV) is a very descriptive term for an analytical process used to evaluate the profitability of investments that produce income and cost streams over some future period of time. The term "NET" in financial jargon suggests that which is left over from the gross income after subtracting out the expenses of doing business. The term "Present Value" is intended to convey the need to convert the worth or value of dollars handled in future time periods back to an equivalent monetary amount in terms of today's dollars - its "present value". The fundamental concept is that time is money. A dollar received in the future does not have the same value as a dollar received today because of the lost opportunity for the dollar to earn income in the interim time period between today and the future .
The NPV analysis contained in the Appendix evaluates the investment in a swine finishing facility and the received contract payments for the situation described in Example 1. An expected useful lifetime of 10 years is used in conjunction with a 12 % opportunity cost of money. The question boils down to how much money in today's dollars - the NPV - would be equivalent to the stream of future income and expenses from the proposed investment.
Before diving into the financial analyses provided in the following pages, it is worth describing important factors considered in developing the budgets.
11

Custom Manure Application Rates: custom manure application rates vary around the U.S. from $0.005 to 0.015 per gallon of manure, and depend on the total volume of manure removed, hauling or pumping distance, and application method. In the following budgets, a rate of $0.0075 is used . It is further assumed that the manure from a single finishing unit is hauled a maximum of one mile and "knifed" into the soil. This custom application rate is consistent with recent quotes received in Michigan, Minnesota, Illinois, and Indiana (Rozeboom, 1996; unofficial survey).
Labor: the value of the grower's labor and management depends on total hours of labor, which in turn depends on the tasks performed. Labor provided by the grower may include:
• Daily observation of feeders, waterers and ventilation equipment. • Daily observation of animals for health problems; treating animals appropriately with
medications. • Power wash and disinfect facility and feeders prior to receiving a new group (turn; 10
to 14 hours/ 1000 head unit). • Maintain facility equipment, roads , and utilities. • Implement odor, rodent, fly , and animal control measures. • Maintain boot wash pans at building entries. • Shower-in/shower-out. • Dead animal disposal . • Unloading feeder pigs at arrival (8 hours). • Loading market hogs (8 hours) .
The hours of labor to operate a 1000 head finisher facility is estimated to average 1.5 hours/day for each day the barn is filled (University of Minnesota, 19964
; Rozeboom, 1996; unofficial survey).5 Twenty additional labor hours also are included in the budget to account for the time involved in loading/unloading animals and preparing the facility between turns . This implies an estimate of 550 annual labor hours .
**FOR MORE INFORMATION REGARDING OPPORTUNITIES IN CONTRACT SWINE PRODUCTION,
PLEASE CONTACT YOUR LOCAL AREA OF EXPERTISE SWINE AGENT,
ANY OF THE AUTHORS OF THIS PAPER, OR ANY MEMBER OF THE
MICHIGAN STATE UNIVERSITY EXTENSION PORK INDUSTRY TEAM.
4Koehler, B., B. Lazarus, and B. Buhr. 1996. " Swine Production Nerworks in Minnesota: Resources for Decision Making." Department of Applied Economics Staff Paper P96-6.
sNew contract growers may temporarily experience additional labor time when first starting in production due to the "newness". As individuals become more experienced, one would expect the average time spent per day to be closer to one and one-half hours.
12

Enterprise Budget for a Sample Contract Finisher -- Base Payment per Pound Gained (Ex. 1: Base Payment $0.05/lb, FC = 2.9, Mortality = 2.0%, 80% of Investment Financed)
Sample Contract: $0.05 per Pound Gained + Potential Bonuses Feed Conversion Bonus: {IO* (3.2 - FC) * (0.50)} * Hogs Finished Mortality Bonus: $25.00 head for each additional hog above 983 livability
Assumptions: Building Capacity Pigs placed per Group: Percent Mortality: Average Weight at Placement: Average Market Weight: Interest Rate: Property Tax Rate (mill per thousand) Property Insurance Rate:
Calculated Values: Hogs Finished per Group: Groups per Year: Ave. Payment per Hog:
1000 1020 Average Feed Conversion:
2.003 Base Payment per Pound Produced($ per lb): 50 Maximum Feed Conversion for Bonus:
250 Feed Conversion Bonus ($ per tenth)/head 9.50 % Days from first Placed to Last Removed:
20 Days Empty Between Groups: 0.50% Average Daily Gain (ADG)
999.6 2.94
$11.45
2.90 0 .05 3.20 0 .50 I 18
6 1.69
PROFITABILITY LIQUIDITY
Income: Quantity Unit Price/unit Annual Amount Cash Flow Live Market Hogs 2942 hogs $11.45 $33 ,686 $33,686 Value of Manure (Nutrient Cost Savings)
Nitrogen (Total) (8.26#@ $0.25/lb) 2942 hogs 2.065 6,075 ? Phosphorus (1003 utilized) (5 .'XJ#@ $0.25/lb) 2942 hogs 1.475 4,339 ? Potash (1003 utilized) (6.37#@ $0. 11/lb) 2942 hogs 0.701 2,061 ?
-----·-------- ------------- -------·---- ------·------ -------------Total Income 2942 hogs $15.69 $46, 161 $33,686
Operating Costs: Electricity ($100/mo) 12 months $100.00 $1,200 $1 ,200 LP Gas 750 gaJlons $0.75 $563 $563 Repairs: Bldg. & Equipment 2942 hog $0.80 $2,354 $2,354 Supplies & Misc. 2,942 hogs $0.40 $1, 177 $1,177 Custom Manure Injection 520,000 gallons $0.0075 $3,900 $3,900
Total Operating Expenses $9, 193 $9,193
B-1

Facility Ownership Costs: Interest
Interest payment Operating Loan
Property Taxes @ 20 mill Farm Insurance: insure@ .53
Total Facility Ownership Cost
Total Cash Fann Expense:
Net Cash Fann Income: Less Depreciation
Net Farm Income
$125,600 loan amount
$75,000 assessed $157,000 invested
Total Farm Net Worth (Assets - Liabilities) Value of Operators Labor and Management (550 hours @ $10/br)
Rate of Return on Fann Assets: Rate of Return on Fann Equity:
Investment Assumptions: Building Capacity Interest Rate: Percent Financed: Years of Loan:
Item
Building Site Preparation Well
Total:
11.973 21.873
1000 head 9.503
80.003 10
Initial Investment
$150,000 $2,000 $5 ,000
$157,000
Expected Years of Life
15 15 20
PROFITABILITY
9.503
20 0.005
Annual Depreciation
$10,000 $133 $250
--------------$10,383
$11,932
$1,500 $785
$14,217
$23,410
$22,751 ($10,383)
$12,367
$31,400 $5,500
Annual P& I
Payment
$19,112 $255 $637
--------------$20,004
Annual Interest Payment
$11,400 $152 $380
--------------$11 ,932
Principal & interest Payment
Cash Surplus or Deficit
Annual Principal Payment
$7,712 $103 $257
--------------$8 ,072
LIQUIDITY
$20,004
$1,500 $785
$22 ,289
$3 1,482
$2,204
Note: Please remember that these are estimated values based on a "typical • contract --- individual performance, costs and contract payments will vary.
8-1

Enterprise Budget for a Sample Contract Finisher -- Base Payment per Pound Gained (Ex. 2: Base Payment $0.05/lb, FC = 2.8, Mortality = 1.4%, 80% of Investment Financed)
Sample Contract: $0.05 per Pound Gained + Potential Bonuses Feed Conversion Bonus: {10 * (3.2 - FC) * (0.50)} *Hogs Finished Mortality Bonus: $25.00 bead for each addi tional hog above 98 % livability
Assumptions: Building Capacity Pigs placed per Group: Percent Mortality: Average Weight at Placement: Average Market Weight: Interest Rate: Property Tax Rate (mill per thousand) Property Insurance Rate:
Calculated Values: Hogs Finished per Group: Groups per Year: Ave. Payment per Hog:
1000 1020 Average Feed Conversion:
1.40% Base Payment per Pound Produced ($ per lb): 50 Maximum Feed Conversion for Bonus:
250 Feed Conversion Bonus ($ per tenth)/head 9.50% Days from first Placed to Last Removed:
20 Days Empty Between Groups: 0.50% Average Daily Gain (ADG)
1005.7 2.94
$12. 12
2.80 0 .05 3.20 0.50
11 8 6
l.69
PROFITABILITY LIQUIDITY
Income: Quantity Unit Price/unit Annual Amount Cash Flow Live Market Hogs 2960 hogs $12. 12 $35,875 $35,875 Value of Manure (Nutrient Cost Savings)
Nitrogen (Total) (8.26#@ $0.25/lb) 2960 hogs 2.07 6,112 ? Phosphorus (100% utilized) (5.90#@ $0.25/lb) 2960 hogs 1.48 4,366 ? Potash (100% utilized) (6.37#@ $0.11/lb) 2960 hogs 0.70 2,074 ?
-------------- ------------- ------------ ------------- -------------Total Income 2960 hogs $16.36 $48,428 $35,875
Operating Costs: Electricity ($100/mo) 12 months $100.00 $1,200 $1,200
LP Gas 750 gallons $0.75 $563 $563
Repairs: Bldg. & Equipment 2960 hog $0.80 $2,368 $2,368
Supplies & Misc. 2,960 hogs $0.40 $1,184 $1, 184
Custom Manure Injection 520,000 gallons $0.0075 $3,900 $3,900
Total Operating Expenses $9,215 $9,215
B-2

Facility Ownership Costs: Interest
Interest payment Operating Loan
Property Taxes @ 20 mill Farm Insurance: insure@ .53
Total Facility Ownership Cost
Total Cash Farm Expense:
Net Cash Farm Income: Less Depreciation
Net Farm Income
Total Farm Net Worth (Assets - Liabilities)
$125,600 loan amount
$75,000 assessed $157,000 invested
Value of Operators Labor and Management (550 hours@ $10/hr)
Rate of Return on Farm Assets: Rate of Return on Farm Equity:
Investment Assumptions: Building Capacity Interest Rate: Percent Financed: Years of Loan:
Item
Building Site Preparation Well
Total:
13.403 29.023
1000 9.503
80.003 IO
head
Expected Initial Years
Investment of Life
$150,000 15 $2,000 15 $5 ,000 20
-------------$157,000
PROFITABILITY
9.503
20 0.005
Annual Depreciation
$10,000 $ 133 $250
--------------$10,383
$11 ,932
$1,500 $785
$14,217
$23,432
$24,996 ($10,383)
$14,613
$31,400 $5,500
Annual P&I
Payment
$19,112 $255 $637
--------------$20,004
Annual Interest
Payment
$11,400 $152 $380
----·---------$11,932
Principal & Interest Payment
Cash Surplus or Deficit
Annual Principal Payment
$7,712 $103 $257
.......... ________
$8,072
LIQUIDITY
$20,004
$1 ,500 $785
$22,289
$31 ,504
$4,371
Note: Please remember thaJ these are estimated values based on a "typical" contract --- individual performance, costs and contract paymenJs will vary.
B-2

Enterprise Budget for a Sample Contract Finisher -- Base Payment per Head Marketed (Ex. 3: Base Payment = $10/hd, FC = 3.0, Mortality = 1.6%, 80% of Investment Financed)
Sample Contract: $10.00 per Head Marketed + Potential Bonuses Feed Conversion Bonus: {10 * (3 .2 - FC) * (0 .50)} * Hogs Finished Mortality Bonus: $25.00 head for each additional hog above 983 livability
Assumptions: Building Capacity Pigs placed per Group: Percent Mortality: Average Weight at Placement: Average Market Weight: Interest Rate: Property Tax Rate (mill per thousand) Property Insurance Rate:
Calculated Values: Hogs Finished per Group: Groups per Year: Ave. Payment per Hog:
1000 1020 Average Feed Conversion:
1.603 Base Payment per Head Marketed ($/hog): 50 Maximum Feed Conversion for Bonus:
250 Feed Conversion Bonus ($ per tenth)/head 9.503 Days from first Placed to Last Removed:
2.0 Days Empty Between Groups: 0.503 Average Daily Gain (ADG)
1003.7 2 .944
$11. 10
3.00 10.00 3.20 0.50
11 8 6
1.69
PROFITABILITY LIQUIDITY
Income: Live Market Hogs Value of Manure (Nutrient Cost Savings)
Nitrogen (Total) (8.26# @ $0.25/lb) Phosphorus (1003 utilized) (5 .90# @ $0.25/lb) Potash (100 3 utilized) (6.37# @ $0.11 / lb)
Total Income
Operating Costs: Electricity ($100/mo) LP Gas Repairs: Bldg. & Equipment Supplies & Misc. Custom Manure Injection
Total Operating Expenses
B-3
Quantity 2954
2954 2954 2954
------·------2954
12 750
2954 2,954
520,000
Unit hogs
hogs hogs hogs
hogs
months gallons hog hogs gallons
Price/unit Annual Amount $11.10 $32, 789
$2.065 $1.475 $0.701
$15.34
$100.00 $0.75 $0.80 $0.40
$0.0075
$6, 100 $4 ,357 $2,070
$45,3 16
$1 ,200 $563
$2,364 $1 , 182 $3 ,900
$9,208
Cash Flow $32,789
? ? ?
$32,789
$1,200 $563
$2,364 $ 1, 182 $3,900
$9,208

Facility Ownership Costs: Interest
Interest payment Operating Loan
Property Taxes @ 20 mill Farm Insurance: insure @ .5 3
Total Facility Ownership Cost
Total Cash Farm Expense:
Net Cash Fann Income: Less Depreciation
Net Farm Income
Total Farm Net Worth (Assets - Liabilities)
$125,600 loan amount
$75,000 assessed $157 ,000 invested
Value of Operators Labor and Management (550 hours@ $10/hr)
Rate of Return on Farm Assets: Rate of Return on Farm Equity:
Investment Assumptions: Building Capacity Interest Rate: Percent Financed: Years of Loan:
Item
Building Site Preparation Well
Total:
1 l.43 3 19.143
1000 9.503
80.003 10
head
Expected Initial Years
Investment of Life
$150,000 15 $2,000 15 $5 ,000 20
--------------$157 ,000
PROFITABILITY
9.503
20 0 .005
Annual Depreciation
$10,000 $133 $250
--------------$10,383
$11,932
$1,500 $785
$14,217
$23,425
$21,892 ($10,383)
$11,508
$31,400 $5,500
Annual P& I
Payment
$ 19,112 $255 $637
--------------$20,004
Annual Interest Payment
$11 ,400 $152 $380
--------------$1 1,932
Principal & Interest Payment
Cash Surplus or Deficit
Annual Principal Payment
$7,712 $103 $257
--------------$8,072
LIQUIDITY
$20,004
$1,500 $785
$22,289
$31,497
$1 ,293
Note: Please remember that these are estimated values based on a "typical" contract --- individual performance, costs and contract payments will vary.
B-3
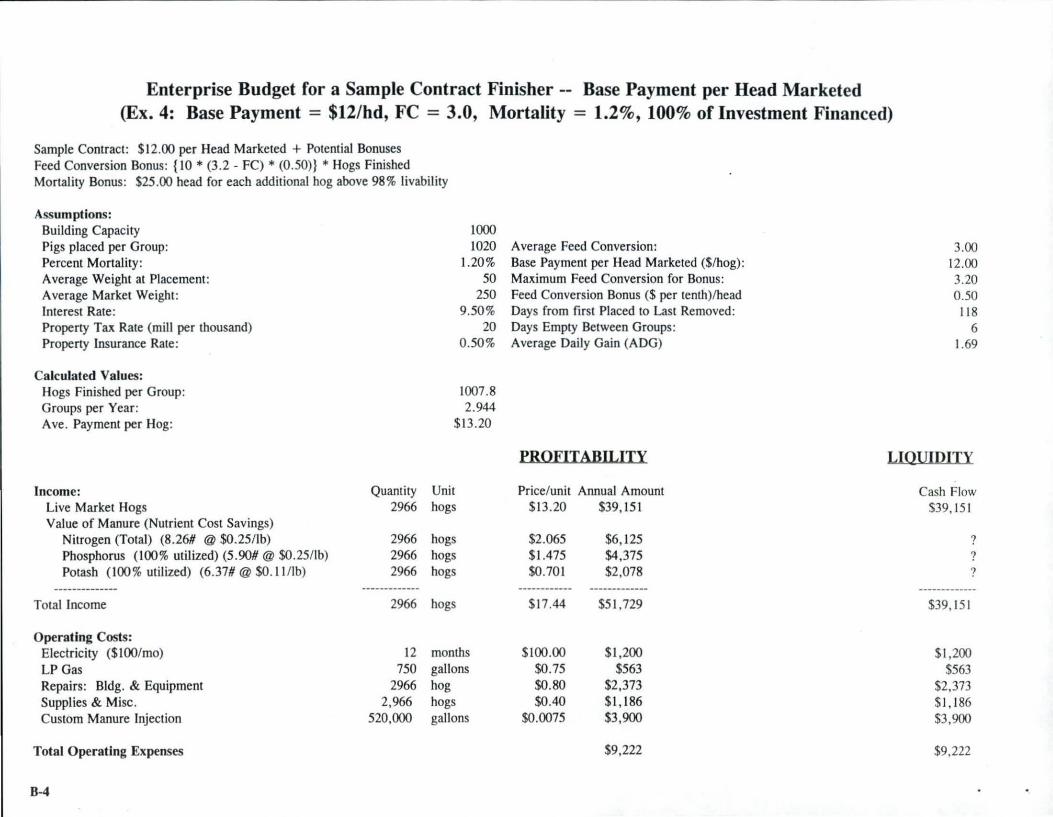
Enterprise Budget for a Sample Contract Finisher -- Base Payment per Head Marketed (Ex. 4: Base Payment = $12/hd, FC = 3.0, Mortality = 1.2%, 100% of Investment Financed)
Sample Contract: $12.00 per Head Marketed + Potential Bonuses Feed Conversion Bonus: {10 * (3 .2 - FC) * (0.50)} * Hogs Finished Mortality Bonus: $25.00 head for each additional hog above 983 livability
Assumptions: Building Capacity Pigs placed per Group: Percent Mortality : Average Weight at Placement : Average Market Weight: Interest Rate: Property Tax Rate (mill per thousand) Property Insurance Rate:
Calculated Values: Hogs Finished per Group: Groups per Year: Ave. Payment per Hog:
1000 1020 Average Feed Conversion:
1.203 Base Payment per Head Marketed ($/hog) : 50 Maximum Feed Conversion for Bonus:
250 Feed Conversion Bonus ($ per tenth)/head 9.503 Days from first Placed to Last Removed:
20 Days Empty Between Groups : 0.503 Average Daily Gain (ADG)
1007.8 2.944
$13.20
3.00 12.00 3.20 0.50
118 6
1.69
PROFITABILITY LIQUIDITY
Income: Live Market Hogs Value of Manure (Nutrient Cost Savings)
Nitrogen (Total) (8 .26# @ $0.25/lb) Phosphorus (1003 utilized) (5 .90#@ $0.25/lb) Potash (1003 utilized) (6.37# @ $0. 11/lb)
Total Income
Operating Costs: Electricity ($100/mo) LP Gas Repairs: Bldg. & Equipment Supplies & Misc. Custom Manure Injection
Total Operating Expenses
B-4
Quantity 2966
2966 2966 2966
-·---------·-2966
12 750
2966 2,966
520,000
Unit hogs
hogs hogs hogs
hogs
months gallons hog hogs gallons
Price/unit Annual Amount $13 .20 $39, 15 l
$2.065 $1.475 $0.701
$17 .44
$100.00 $0.75 $0.80 $0.40
$0.0075
$6, 125 $4,375 $2 ,078
$51 ,729
$1,200 $563
$2,373 $1 , 186 $3,900
$9,222
Cash Flow $39, 151
$39, 151
? ? ?
$1,200 $563
$2,373 $1,186 $3,900
$9,222

~ROEITABILITY LIQUIDITY Facility Ownership Costs:
Interest Interest payment $157,000 Joan amount 9.50% $14,915 Principal & $25 ,005 Operating Loan Interest Payment
Property Taxes @ 20 mill $75,000 assessed 20 $1 ,500 $ 1,500 Fann Insurance: insure@ .5% $157,000 invested 0 .005 $785 $785
Total Facility Ownership Cost $17 ,200 $27,290 --------------- ---------------,
Total Cash Farm Expense: $26,422 $36,5 12
Net Cash Farm Income: $25,307 Cash Surplus or Deficit $2,639 Less Depreciation ($10,383)
Net Farm Income $14,924
Total Farm Net Worth (Assets - Liabilities) $0 Value of Operators Labor and Management (550 hours@ $10/hr) $5,500
Rate of Return on Farm Assets: 15.50% Rate of Return on Farm Equity: 0.00%
-·- -------·-------·-··--------·----·-----------·------·--·-·-Investment Assumptions:
Building Capacity 1000 head Interest Rate: 9 .50% Percent Financed: 100.00% Years of Loan: 10
Expected Annual Annual Annual Initial Years Annual P&I Interest Principal
Item Investment of Life Depreciation Payment Payment Payment
Building $150,000 15 $10,000 $23,890 $ 14,250 $9 ,640 Site Preparation $2,000 15 $ 133 $3 19 $190 $1 29 Well $5 ,000 20 $250 $796 $475 $321 ____________ ..,_
-------------- -------------- -------------- --------------Total: $157,000 $ 10,383 $25,005 $ 14,9 15 $10,090
Nore: Please remember that these are estimated values based on a "typical" contract --- individual performance, costs and contract paymems will vary.
B-4
L__ - -

Enterprise Budget for a Sample Contract Finisher -- Base Payment per Pig Space (Ex. 5: Payment = $32 per pig space per year, Mortality = 1.8%, 80% of Investment Financed)
Sample Contract: $$32.00 per pig space per year + Potential Bonuses Mortality Bonus: $50.00 head for each additional hog above 983 livability
Assumptions: Building Capacity : Pigs placed per Group: Percent Mortality : Average Weight at Placement: Aver:ige Market Weight: Interest Rate: Property Tax Rate (mill per thousand): Property Insurance Rate :
Calculated Values: Hogs Finished per Group: Groups per Year: Annual payment:
Payment per hog
Income: Quantity Live Market Hogs: 2945 Value of Manure (Nutrient Cost Savings):
Nitrogen (Total) (8.26# @ $0.25/Jb): 2945 Phosphorus (100% utilized) (5 .90# @ $0.25/lb): 2945 Potash (100 3 utilized) (6.37#@ $0. I 1/Jb): 2945 __ .,.. _________
Total Income: 2945
Operating Costs: Electricity ($100/mo) : 12 LP Gas: 750 Repairs - Bldg. & Equipment: 2945 Supplies & Misc .: 2945 Custom Manure Injection: 520,000
Total Operating Expenses:
B-5
1000 Payment per pig space per year: 1020 Average Feed Conversion:
1.80% Maximum Feed Conversion for Bonus: 50 Feed Conversion Bonus ($per tcnth)/heacl:
250 M:iximum Mort:i lity for Bonus: 9.50% Mort:ility Bonus (per "extra" hog):
20 Days from first Placed to Last Removed: 0 .50% Days Empty Between Groups:
Average Daily Gain (ADG):
1001.6 2.94
$32,294.00 10.97
Unit hog
hog hog hog
hog
month gallon hog hog gallon
PROFITABILITY
Price/unit Annual Amount $32,294
$2 .065 $1.475 $0.701
$15 .21
$100.00 $0.75 $0.80 $0.40
$0.0075
$6,081 $4,344 $2,064
$44,783
$1,200 $563
$2,356 $1, 178 $3,900
$9,196
32.00 2 .90
n/a n/a
2.003 50.00
118 6
1.69
LIQUIDITY
Cash Flow $32 ,294
? ? ?
$32,294
$ 1,200 $563
$2,356 $1, 178 $3 ,900
$9, 196

Facility Ownership Costs: Interest:
Interest payment: Operating Loan :
Property Taxes@ 20 mill: Farm Insurance: insure @ .5 3 :
Total Facility Ownership Cost:
Total Cash Farm Expense:
Net Cash Farm Income·: Less Depreciation
Net Fann Income:
Total Farm Net Worth (Assets - Liabil ities):
$125,600 loan amount
$75,000 assessed $ 157 ,000 invested
Value of Operators Labor and Management (550 hours @ $10/hr):
Rate of Return on Farm Assets: Rate of Return on Farm Equity:
11.093 17.473
-------------------·----·-----------------Investment Assumptions:
Building Capacity: 1000 head Interest Rate: 9.503 Percent Financed: 80.003 Years of Loan: JO
Initial Item Investment
Building $150,000 Site Preparation $2,000 Well $5,000
·-------------Total: $157,000
Expected Years of Life
15 15 20
PROFITABILITY
9.503
20 0.005
Annual Depreciation
$10,000 $133 $250
--------------$10,383
$ 11,932
$1,500 $785
$14,217
$23,413
$21,370 ($10,383)
$10,986
$31,400 $5,500
Annual p & I
Payment
$19, 112 $255 $637
---------·----$20,004
Principal & Interest Payment
Cash Surplus or Deficit
Annual Annual Interest Principal Payment Payment
$11,400 $7,712 $152 $103 $380 $257
-------------- --------------$11,932 $8,072
Note: Please remember that these are estimated values based on a "typical" contract --- individual performance, costs and contract payments will vary.
B-5
LIQUIDITY
$20,004
$1,500 $785
$22,289
$31,485
$809
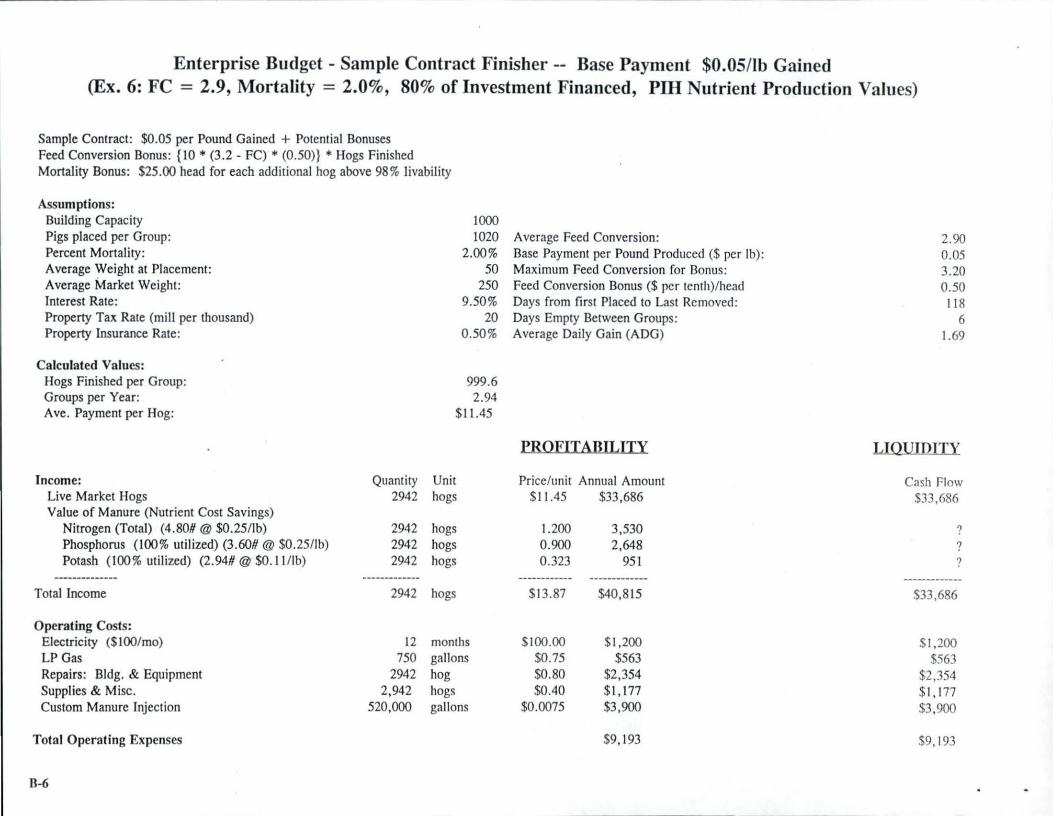
Enterprise Budget - Sample Contract Finisher -- Base Payment $0.05/lb Gained (Ex. 6: FC = 2.9, Mortality = 2.0%, 80% of Investment Financed, Pill Nutrient Production Values)
Sample Contract: $0.05 per Pound Gained + Potential Bonuses Feed Conversion Bonus: {10 * (3.2 - FC) * (0.50)} *Hogs Finished Mortality Bonus: $25.00 head for each additional hog above 983 livability
Assumptions: Building Capacity Pigs placed per Group: Percent Mortality: Average Weight at Placement: Average Market Weight: Interest Rate: Property Tax Rate (mill per thousand) Property Insurance Rate:
Calculated Values: Hogs Finished per Group: Groups per Year: Ave. Payment per Hog:
Income: Live Market Hogs Value of Manure (Nutrient Cost Savings)
Nitrogen (Total) (4.80#@ $0.25/ lb) Phosphorus (1003 utilized) (3.60# @ $0.25/lb) Potash (1003 utilized) (2.94#@ $0.11/lb)
-------------Total Income
Operating Costs: Electricity ($100/mo) LP Gas Repairs: Bldg. & Equipment Supplies & Misc. Custom Manure Injection
Total Operating Expenses
B-6
Quantity 2942
2942 2942 2942
-------------2942
12 750
2942 2,942
520,000
1000 1020 Average Feed Conversion:
2.003 Base Payment per Pound Produced ($per lb): 50 Maximum Feed Conversion for Bonus:
250 Feed Conversion Bonus ($ per tenth)/head 9.503 Days from first Placed to Last Removed:
20 Days Empty Between Groups: 0.503 Average Daily Gain (ADG)
999.6 2.94
$11.45
PROFITABILITY
Unit Price/unit Annual Amount hogs $1 1.45 $33,686
hogs 1.200 3,530 hogs 0.900 2,648 hogs 0.323 951
------------ ___ ,.. _________
hogs $13.87 $40,815
months $100.00 $1,200 gallons $0.75 $563 hog $0.80 $2,354 hogs $0.40 $1, 177 gallons $0.0075 $3,900
$9,193
2.90 0.05 3.20 0.50
11 8 6
1.69
LIQUIDITY
Cash Flow $33,686
? ? ?
-------------$33,686
$ 1,200 $563
$2 ,354 $ 1,177 $3,900
$9, 193

Facility Ownership Costs: Interest
Interest payment Operating Loan
Property Taxes @ 20 mill Farm Insurance: insure@ .53
Total Facility Ownership Cost
Total Cash Farm Expense:
Net Cash Fann Income: Less Depreciation
Net Farm Income
Total Farm Net Worth (Assets - Liabilities)
$125,600 loan amount
$75,000 assessed $157 ,000 invested
Value of Operators Labor and Management (550 hours@ $10/hr)
Rate of Return on Farm Assets: Rate of Return on Farm Equity:
Investment Assumptions: Building Capacity Interest Rate: Percent Financed: Years of Loan:
Item
Building Site Preparation Well
Total:
8.573 4.85 3
1000 9.503
80.00% 10
head
Expected Initial Years
Investment of Life
$150,000 15 $2,000 15 $5,000 20
--------------$157,000
PROFITABILITY
9.503
20 0 .005
Annual Depreciation
$10,000 $133 $250
--------------$10,383
$11,932
$1 ,500 $785
$14,217
$23,410
$17,405 ($10,383)
$7,021
$31,400 $5,500
Annual p & I
Payment
$19,112 $255 $637
--------------$20,004
Annual Interest
Payment
$11 ,400 $152 $380 ________ ,.. _____
$11,932
Principal & Interest Payment
Cash Surplus or Deficit
Annual Principal Payment
$7,712 $103 $257
--------------$8,072
LIQUIDITY
$20,004
$1 ,500 $785
$22,289
$31 ,482
$2,204
Note: Please remember that these are estimated values based on a Htypical H contract --- individual performance, costs and contract payments will vary.
8-6

APPENDIX: NET PRESENT VALUE ANALYSIS
FOR INvESTMENT IN A 1,000 HEAD CONTRACT FINISHING UNIT
- INDEX OF TABLES -
Page
CONTRACT FINISHING NET PRESENT VALUE SUMMARY . . . . . . . . . . . . . . . . . . . . NPV-2
Net Present Value Analysis Tables for Individual Series . ............. .. ...... :
SERIESA1
Table .. (Page#)
Before Tax Income 1.A .... (NPV-3)
Before Tax Expenses 2.A .... (NPV-3)
After Tax Net Income 3.A .... (NPV.-4)
Investment-Principal Payment 4 .A ... . (NPV-4)
Tax Savings-Depreciation 5.A .. . . (NPV-5)
Series Summary - (NPV) 6.A .. . . (NPV-5)
1) SERIES A: NPV Analysis Using:
15 3 Marginal Tax Rate
No Manure Credit
2) SERIES B: NPV Analysis Using:
15 % Marginal Tax Rate
Manure Credit = $4.24/pig
ASSUMPTIONS COMMON TO ALL SERIES:
$11.45/pig Contract Payment 2,942 Pigs Per Year
SERIES B2 SERIES C3
Table .. (Page #) Table . . (Page #)
1.B .... (NPV-6) l.C .. .. (NPV-3)
2.B .... (NPV-3) 2.C. .. . (NPV-3)
3.B .... (NPV-6) 3.C .... (NPV-7)
4 .B .. .. (NPV-4) 4.C .. . . (NPV-4)
5.B ... . (NPV-5) 5.C .... (NPV-8)
6.B .. .. (NPV-7) 6. C .. . . (NPV-8)
3) SERIES C: NPV Analysis Using:
30 3 Marginal Tax Rate
No Manure Credit
SERIESD4
Table .. (Page #)
1. D .... (NPV-6)
2.D .... (NPV-3)
3.D .... (NPV-9)
4.D .... (NPV-4)
5.D .. .. (NPV-8)
6.D .. . . (NPV-9)
4) SERIES D: NPV Analysis Using:
30 % Margin~! Tax Rate
Manure Credit = $4.24/pig
$157 ,000 Investment for 1,000 Head Grow-Finish Facility 10-Year Useful Lifetime
These are the same assumptions used in the first example of an Enterprise Budget Analysis presented on page B-1 .
NPV-1

NET PRESENT VALUE ANALYSIS
FOR I NVESTMENT IN A 1,000 HEAD CONTRACT FINISHING UNIT
-SUMMARY -
DISCOUNTED@ U %/YEAR
MARGINAL No MANURE CREDITA MANURE CREDIT =$4.24/PIG TAX RATE
15% Series A: $ -12,022 Series B: $47,888
30% Series C: $ -11,580 Series D: $37,757
a With no manure credit, $12.30/pig is required to break even.
NPV-2

Table 1.A/C: CONTRACT FINISHING -1,000 HEAD FACILITY
BEFORE TAX INCOME OR COST SA VIN GS WITH No MANuRE CREDIT 1
YEAR PRIMARY INCOME
MANuRE CREDIT TOTAL OR COST REDUCTION
1 $ 33,686 0 $ 33,686 2 33,686 0 33,686 3 33,686 0 33,686 4 33,686 0 33,686 5 33,686 0 33,686 6 33,686 0 33,686 7 33,686 0 33,686 8 33,686 0 33,686 9 33 ,686 0 33,686
10 33,686 0 33,686
Total $ 336,860 0 $336,860 1 Assumptions:
Produc1ion: $11.45/Pig Payment Financial: 153 Marginal Tax Rate 2,942 Pigs Per Year No Manure Credit 10 Year Useful Life 12 3 Discount Rate
TABLE 2.A/B/C/D: CONTRACT FINISHING - 1,000 HEAD FACILITY
BEFORE TAX CASH EXPENSES
YEAR INTEREST REPAIRS ELECTRIC MANuRE
SUPPLIES PR TAX&
TOTAL ANDL.P. CUSTOM HIRE INSUR.
1 11,932 928 1,765 3,913 1,177 2,324 22,039 2 11 , 165 1,522 1,765 3,913 1,177 2,324 21 ,866 3 10,326 1,872 1,765 3,913 1,177 2,324 21,377 4 9,406 2,144 1,765 3,913 1,177 2,324 20,729 5 8,399 2,371 1,765 3,913 1,177 - 2,324 19,949 6 7,297 2,570 1,765 3,913 1,177 2 ,324 19,046 7 6,090 2,747 1,765 3,913 1,177 2,324 18,016 8 4 ,768 2,909 1,765 3,913 1,177 2,324 16,856 9 3,320 3,059 1,765 3,913 1,177 2 ,324 15,558
10 1,735 3,198 1,765 3,913 1,177 2,324 14, 112
Total $74,438 $23,320 $17,650 $39,130 $11,770 $23,240 $189,548
NPV-3

YEAR
1 2 3 4 5 6 7 8 9 10
TOTAL
TABLE 3.A: CONTRACT FINISHING - 1,000 HEAD FACILITY
B EFORE TAX S UMMARY AND AFfER TAX NET INCOME
WITH 15% MARGINAL TAX RATE & NO MANURE CREDIT
BEFORE-T AX BEFORE-TAX BEFORE-TAX T AX AFrER-TAX T OT AL INCOME TOT AL Ex:PENSES NET INCOME RATE NET INCOME
$33,686 $22,039 $ 11,647 15 $ 9,900 33,686 21,866 11 ,820 15 10,047 33,686 21,377 12,309 15 10,463 33,686 20,729 12,957 15 11,013 33,686 19,949 13 ,737 15 11,676 33,686 19,046 14,640 15 12,444 33,686 18,016 15,670 15 13,319 33,686 16,856 16,830 15 14,305 33,686 15,558 18, 128 15 15,409 33,686 14,112 19,574 15 16,637
$336,860 $189,_548 $147,312 $125,213
TABLE 4.A/B: CONTRACT FlNISlllNG - 1,000 HEAD FACILITY
CASH FLows REsULTING FROM DOWNPAYMENT OR SALVAGE v ALUE,
PRINCIPAL PAYMENTS, AND INvEsTMENT CREDIT RECAP.
Year DOWNPA YMENT
PRINCIPAL TOTAL OR SALVAGE VALUE
0 $31 ,400 $ 0 $ 31,400 1 0 8,072 8,072 2 0 8,839 8,839 3 0 9,678 9,678 4 0 10,598 10,598 5 0 11,605 11,605 6 0 12,707 12,707 7 0 13,914 13,914 8 0 15,236 15,236 9 0 16,683 16,683 10 -16,858 18,268 -1,410
TOTAL $14,542 $125,600 $140,142
NPV-4

TABLE 5.A/B: CONTRACT FINISHING - 1,000 HEAD FACILITY
TAX SAVINGS D UE TO D EPRECIATION AND SECTION 179 DEDUCTION
WITH 15% MARGINAL TAX RATE
YEAR DEPRECIATION SEC 179 DEDUCT TAX RATE TAX SAVINGS
1 $ 7,850 0 15 $1,178 2 15,700 0 15 2,355 3 15 ,700 0 15 2,355 4 15 ,700 0 15 2,355 5 15 ,700 0 15 2,355 6 15 ,700 0 15 2,355 7 15,700 0 15 2,355 8 15,700 0 15 2,355 9 15 ,700 0 15 2,355
10 15 ,700 0 15 2,355
TOTAL $149,150 0 $22,373
TABLE 6.A: CONTRACT FINISHING - 1,000 HEAD FACILITY
DISCOUNTED ANALYSIS OF INVESTMENT WITH 15% MARGINAL TAX RATE
SERIES A SUMMARY
AFI'ER-TAX AFI'ER-TAX INvEsrMENT TAX AFrER-TAX DISCOUNT DISCOUNTED
Year NET INCOME CASH FLOW SAVINGS TOTAL RATE VALUES (A) (B) (C) (D) (E) (F)
0 $ 0 $31,400 $ 0 $ -31,400 1.0000 $ -31,400 I 9,900 8,072 1,178 3,006 .8929 2,684 2 10,047 8,839 2,355 3,563 .7972 2,840 3 10,463 9,678 2,355 3,140 .711 8 2,235 4 11 ,013 10,598 2,355 2,770 .6355 1,760 5 11,676 11,605 2 ,355 2 ,426 .5674 1,377 6 12,444 12,707 2,355 2,092 .5066 1,060 7 13,319 13,914 2,355 1,760 .4523 796 8 14,305 15,236 2,355 1,424 .4039 575 9 15,409 16,683 2,355 1,081 .3606 390 10 16,637 1,410 2,355 17,582 .3220 5,661
TOTAL $125,213 $140,142 $22,373 $ 7,444 $ -12,022
NPV-5

. .
YEAR
1 2 3 4 5 6 7 8 9 10
TOTAL
1 Assumptions:
Production:
TABLE 1.B /D: CONTRACT FINISHING 1,000 HEAD FACILITY
BEFORE TAX INCOME OR COST SAVINGS WITH MANURE CREDIT1
PRIMARY INCOME OR Cosr REDUCTION
$ 33,686 33,686 33,686 33,686 33,686 33,686 33,686 33,686 33,686 33,686
$ 336,860
$11 .45/Pig Payment 2,942 Pigs Per Year 10 Year Useful Life
SECONDARY INCOME OR Cosr REDUCTION FROM
MANuRE NurRIENTS
$12,474 12,474 12,474 12,474 12,474 12,474 12,474 12,474 12,474 12,474
$124,740
TOTAL
$ 46,160 46,160 46,160 46,160 46,160 46,160 46,160 46,160 46,160 46,160
$461,600
Financial: 15 % Marginal Tax Rate Manure Credit = $4.24/pig 12% Discount Rate
TABLE 3.B: CONTRACT FlNisHING 1,000 HEAD FACILITY
B EFORE TAX SUMMARY & AFfER TAX NET INCOME
WITH 15% TAX RATE & MANURE CREDIT
BEFORE-TAX BEFORE-TAX BEFORE-TAX TAX AFTER-TAX YEAR
TOTAL INCOME TOT AL EXPENSES NET INCOME RATE NET INCOME
1 $46,160 $22,039 $ 24, 121 15 $ 20,503 2 46,160 21,866 24,294 15 20,650 3 46,160 21,377 24,783 15 21,066 4 46,160 20,729 25,431 15 21,616 5 46,160 19,949 26,211 15 22,279 6 46,160 19,046 27,1 14 15 23,047 7 46,160 18,016 28,144 15 23,922 8 46,160 16,856 29,304 15 24,908 9 46,160 15,553 30,602 15 26,012 10 46,160 14 ,112 32,048 15 27,240
TOTAL $461,600 $189,548 $272,052 $231,243
NPV-6

TABLE 6.B: CONTRACT FINISHING-1,000 HEAD FACILITY
DISCOUNTED ANALYSIS OF lNvESTMENT
WITH 15% MARGINAL TAX RATE & MANuRE CREDIT
SERIES B SUMMARY
AFrER-TAX
.AFrER-TAX lNVESTMENT TAX .AFrER-TAX DISCOUNT DISCOUNTED YEAR NET INCOME CASH ELow SAVINGS TOTAL RATE VALUES
(A) (B) (C) (D) (E) (F)
0 $ 0 $ 31,400 $ 0 $ -31,400 1.0000 $-31,400 1 20,503 8,072 1,178 13,609 .8929 12,151 2 20,650 8,839 2,355 14, 166 .7972 11,293 3 21,066 9,678 2,355 13,743 .7118 9,782 4 21,616 10,598 2,355 13,373 .6355 8,499 5 22,279 11 ,605 2,355 13,029 .5674 7,393 6 23,047 12,707 2,355 12,695 .5066 6,432 7 23,922 13,914 2,355 12,363 .4523 5,592 8 24,908 15,236 2,355 12,027 .4039 4,858 9 26,012 16,683 2,355 11 ,684 .3606 4,213
10 27,240 -1,410 2,355 28,185 .3220 9,075
TOTAL $231,243 $140,142 $22,373 $113,474 $47,888
TABLE 3.C: CONTRACT FINISHING - 1,000 HEAD FACILITY
·BEFORE TAX SUMMARY AND AFTER TAX NET INCOME
WITH 30% MARGINAL TAX RA TE & MANuRE CREDIT
YEAR BEFORE-TAX BEFORE-TAX BEFORE-TAX TAX AFTER-TAX
TOT AL INCOME TOTAL EXPENSES NET INCOME RATE NET INCOME
1 $33,686 $22,039 $11 ,647 30 $ 8,153 2 33,686 21,866 11,820 30 8,274 3 33,686 21,377 12,309 30 8,616 4 33 ,686 20,729 12,957 30 9,070 5 33,686 19,949 13,737 30 9,616 6 33,686 19,046 14,640 30 10,248 7 33,686 18,016 15,670 30 10,969 8 33,686 16,856 16,830 30 11,781 9 33,686 15,558 18,128 30 12,690 10 33,686 14, 112 19,574 30 13,701
TOTAL $336,860 $189,548 $147,312 $103,118
NPV-7
; .
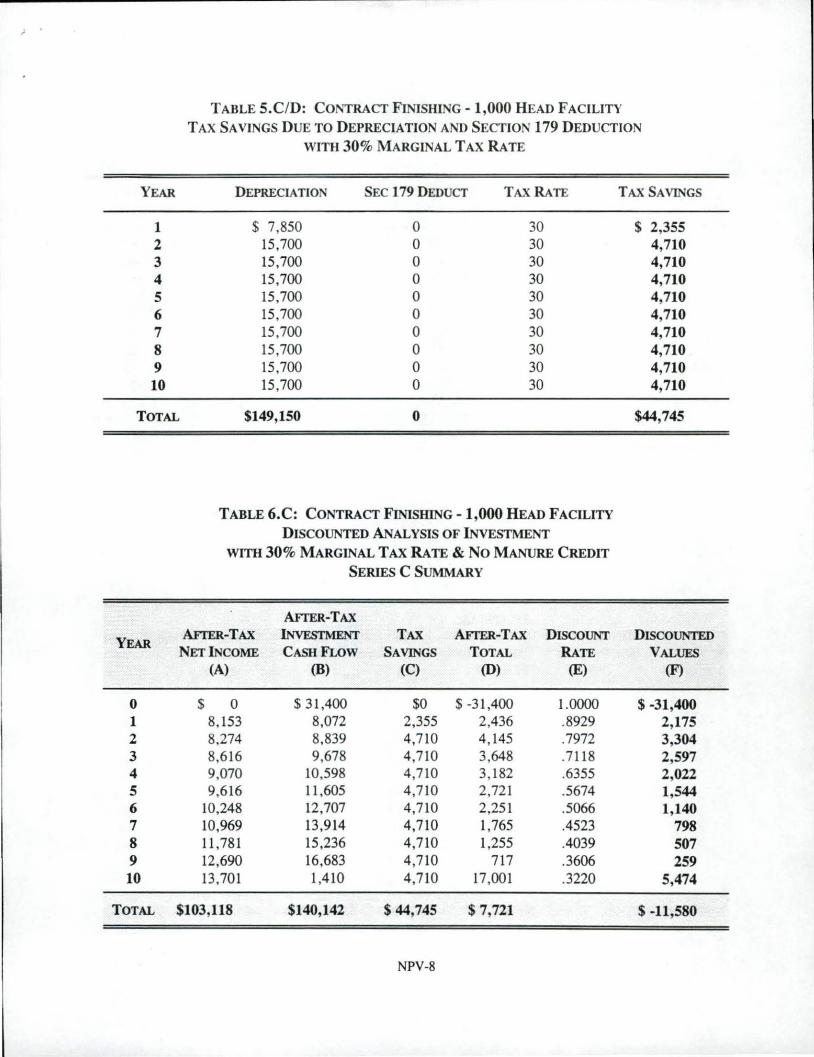
TABLE 5 .C/D: CONTRACT FINISHING -1,000 HEAD FACILITY
TAX SAVINGS D UE TO D EPRECIATION AND SECTION 179 DEDUCTION
WITH 30% MARGINAL TAX RATE
YEAR DEPRECIATION SEC 179 D EDUCT TAX RATE TAX SAVINGS
1 $ 7,850 0 30 $ 2,355 2 15,700 0 30 4,710 3 15,700 0 30 4,710 4 15,700 0 30 4,710 5 15,700 0 30 4,710 6 15,700 0 30 4,710 7 15,700 0 30 4,710 8 15,700 0 30 4,710 9 15,700 0 30 4,710 10 15,700 0 30 4,710
TOTAL $149,150 0 $44,745
TABLE 6.C: C ONTRACT FlNisHING -1,000 HEAD FACILITY
DISCOUNTED ANALYSIS OF INVEsTMENT
WITH 30% M ARGINAL T AX RA TE & N O MANuR.E CREDIT
SERIES C SUMMARY
AFTER-TAX
YEAR AFrER-TAX INvFsrMENT TAX AFrER-TAX DISCOUNT DISCOUN'IED
NET INCOME CASHFLow SAVINGS T OTAL RATE VALUF.S (A) (B) (C) (D) (E) (F)
0 $ 0 $ 31,400 $0 $ -31,400 1.0000 $ -31,400 1 8, 153 8,072 2,355 2,436 .8929 2,175 2 8,274 8,839 4,710 4,145 .7972 3,304 3 8,616 9,678 4,710 3,648 .7118 2,597 4 9,070 10,598 4,710 3,182 .6355 2,022 5 9,616 11,605 4,710 2,721 .5674 1,544 6 10,248 12,707 4,710 2,251 .5066 1,140 7 10,969 13,914 4,710 1,765 .4523 798 8 11,781 15,236 4,710 1,255 .4039 507 9 12,690 16,683 4,710 717 .3606 259 10 13,701 1,410 4,710 17,001 .3220 5,474
TOTAL $103,118 $140,142 $ 44,745 $ 7,721 $ -11,580
NPV-8

TABLE 3.D: CONTRACT FINISHING -1,000 HEAD FACILITY
BEFORE TAX SUMMARY AND AFTER TAX NET INCOME
WITH 30% MARGINAL TAX RA TE & MANURE CREDIT
YEAR BEFORE-TAX B EFORE-TAX B EFORE-TAX TAX AFI'ER-TAX
TOTAL INCOME TOTAL EXPENSES NETlNCOME RATE NET INCOME
1 $ 46,160 $ 22,039 $ 24, 121 30 $ 16,885 2 46,160 21,866 24,294 30 17,006 3 46,160 21,377 24,783 30 17,348 4 46,160 20,729 25,431 30 17,802 5 46,160 19,949 26,211 30 18,348 6 46,160 19,046 27,114 30 18,980 7 46,160 18,016 28,144 30 19,701 8 46,160 16,856 29,304 30 20,513 9 46,160 15,558 30,602 30 21,421 10 46,160 14, 112 32,048 30 22,433
TOTAL $461,600 $189,548 $272,052 $190,437
TABLE 6.D: CONTRACT FINISHING - 1,000 HEAD FACILITY
DISCOUNTED ANALYSIS OF INvESTMENT
WITH 30% MARGINAL TAX RATE & MANURE CREDIT
SERIES D SUMMARY
AFTER-TAX
YEAR AFTER-TAX lNvFsrMENT TAX AFTER-TAX DISCOUNT DISCOUNTED
NET INCOME CASHFLoW SAVINGS TOTAL RATE VALUES (A) (B) (C) (D) (E) (F)
0 $ 0 $31,400 $ 0 $-31,400 1.0000 $-31,400 1 16,885 8,072 2,355 11 ,168 .8929 9,971 2 17,006 8,839 4,710 12,877 .7972 10,265 3 17,348 9,678 4,710 12,380 .7118 8,8U 4 17,802 10,598 4,710 11 ,914 .6355 7,572 5 18,348 11,605 4 ,710 11 ,453 .5674 6,499 6 18,980 12,707 4 ,710 10,983 .5066 5,564 7 19,701 13,914 4,710 10,497 .4523 4,748 8 20,513 15,236 4,710 9,987 .4039 4,034 9 21,421 16,683 4 ,710 9,448 .3606 3,407 10 22,433 1,410 4 ,710 25,733 .3220 8,285
TOTAL $190,437 $140,142 $44,745 $95,040 $37,757
NPV-9