staff papers series - agecon searchageconsearch.umn.edu/bitstream/13541/1/p83-05.pdf · p83-5 staff...
TRANSCRIPT
P83-5
Staff Papers Series
February 1983
.
MINNESOTA’S ECONOMIC GROWTH IN RECESSION AND RECOVERY: PART II
Wilbur R, Maki and Patricia Dalton
University of Minnesota
Institute of Agriculture,Forestryand Home Economics
St. Paul, Minnesota 55108
TABLE OF CONTENTS4
Page
Acknowledgements .....................................................
Abstract ................................● .......................● *...
Summary and Conclusions ............,.,,,..● , . . ● . . . . . . . . . . 0 $ . . . . ● . . . . .
INTRODUCTION ..............*..................e.......................
General Economic Outlook ........................................Industry Employment .............................................
Economic Scenarios ...................................................Cyclical vs. Structural Changes ......................................Focusing on Key Sectors ..............................................
AGRICULTUREAND AGRIBUSINESS .0..,...● ...*...● *.......................
Cyclical and StructuralChanges ......................................Capital Spending ....● .............● ........,● .............,..● *....● *
MANUFACTURINGAND SERVICES .......*.....*...*.........................
Cyclical and Structural Changes ......................................Capital Spending .....................................................
MINING AND TOURISM ....e..............................................
Cyclical and Structural Changes ......................................Capital Spending .....................................................
STATE AND LOCAL GOVERNMENT ............,.......*........0...● .......● .
Cyclical and Structural Changes
Revenue Sources ..........ExpenditurePatterns .....
Capital Spending ..*....● ......
. . . . . . . . . . . . . . . . . . . . . . . . . .+ . . . . . . . . . . .
. . . . . . . . ● ● ✎ ✎ ✎ ✎ ✎ ● ✎ ✎ ✎ ✎ ✎ ✎ ✎ ✎ ✎ ✎ ✎ ● $ . . . . . . . .*
,. 0 ● , . ● ● . . .* . ● . . . . . . . . . . . . 0 . . . . . ● . . . . ●
. . . . . . . . . . . . . . . . . . . . . . . . . . . . . . . . . . . . . .
. . . . . . . . . . . 0 . . . . . . . ● . . . . . . ● . . . . ● . ● ● . . . . ..* . . . ● . ● . . . . . . ● . $ . . . ●
i
i
ii
I
12
4611
13
1317
19
1921
25
2527
28
28
3035
41
44
-i-
Acknowledgements
We are grateful for the use of the many timely statistical series prepared in
the research divisions of various Minnesota state agencies, including the
Departmentsof Economic Security, Finance, and Revenue. The funding for this
study comes from the Minnesota Agricultural Experiment Station.
Abstract
This report presents statisticalreference series for the study and projection
of Minnesota’seconomic outlook in the 1980’s, with special emphasis on four major
sectors -- agriculture and agribusiness,manufacturingand services, mining and
tourism, and government spending. The reference series serve as baseline
forecasts for the assessment of Minnesota’s job and income prospects in Its major
sectors. In Part I, two sets of baseline forecasts were presented, namely,
short-term quarter-yearand long-term five-year forecasts of industry employment
and personal earnings and income. A description and an explanation of the
underlying rationale of the baseline forecast series were included, also. In Part
II, the earlier statistical series are updated and expanded with the inclusion of
historical and projected series on state and local government revenues.

-ii-
Summary and Conclusions
Minnesota industry has consistentlyoutpaced U.S. industry in employmentand
income growth. In 1970, total nonagriculturalwage and salary employment was
nearly 1.3 million. It peaked at 1.5 million in 1974,dropped slightly in 1975,
and then quickly regained these losses to reach its new peak of nearly 1.8 million
in 1980. Net new jobs totaled 213 thousand in the 1970-74 period and 285 thousand
in the 1975-80period. Minnesota employment is expected to resume these trends by
exceeding U.S. employment increases,once U.S. economic recovery begins,
Correspondingincreases are expected also in industry earnings and personal income
payments.
● Largest employment increases are expected in Minnesota industry areservices -- professional,personal, and business. Wage and salary jobs areexpected to increase from 384 thousand in 1982 to 443 thousand in 1985 and542 thousand in 1990 -- an increase of 158 thousand. Much of this increaseis due to growth in medical, and social services, non-profit organizations,and business and personal services in the Minneapolis-St.Paul Metropolitanarea.
● Employmentin retail and wholesale trade is expected to grow from 427thousand in 1982 to 470 thousand in 1985 and to 510 thousand in 1990 -- anet increase of 83 thousand. Eating and drinking places account for muchof this growth, with a major concentrationin the Minneapolis-St.PaulMetropolitanarea, but with widely dispersed growth, also, In outatateservice centers.
● Durable goods manufacturingemployment (includingstone, clay, and glassproducts as well as professionaland scientificinstruments) is expected todecline slightly from 206 thousand in 1982 to 193 thousand in 1983 and thento increase sharply to 228 thousand in 1985 and 273 thousand in 1990 -- anincrease of more than 80 thousand from its low level in 1983. This group, .which includes high technologyindustry, is also concentratedin theMinneapolis-St.Paul Metropolitanarea.
● Finance, insurance, and real estate employmentis expected to increase from99 thousand in 1982 to 113 thousand in 1985 and 132 thousand in 1990 -- anincrease of 38 thousand. Most of this increaseis, again, localizedin theMinneapolis-St.Paul Metropolitanarea.
● Nondurablegoods manufacturingemployment,whichincludes food productsaswell as pulp and paper, petroleum, and rubber products, is expected toincrease less sharply than durable goods manufacturing from 138 thousand in1982 to 151 thousand in 1985 and 162 thousand in 1990 -- an increase of

-iii-
nearly 24 thousand. This increase isand publishing and the pulp and paper
attributed largely to the printingproducts industries.
t Constructionemployment is expected to increase from 63 thousand in 1982 to71 thousand in 1985 and 85 thousand in 1990 -- an increase of 22 thousan(~,largely in residential and commercial development in the Minnesotaheartlandand the core metropolitan area.
● Transportation,communication,and utilities employment is expected todecline slightly from 94 thousand in 1982 to 91 thousand in 1983,and thenslowly increase to 92 thousand in 1985 and 97 thousand in 1990.
● Farming is expected to decline in total employmentin the 1980’s,but at arate less than the U.S. average because of the preference forsmall-to-mediumsize farms in areas where off-farm employment is readilyavailable.
● Mining employment is expected to decline slightly in wage and salaryemployment from 10 thousand in 1982 to 8 thousand In 1983, then increasegradually with U.S. economic recovery, but declining, again, to 8 thousandin 1990 because of structuralchanges in the U.S. steel industry.
. Government employment,which declined from 257 thousand in 1981 to 247thousand in 1982, is expected to remain at this level in 1983 and 1984, ‘butthen gradually increase to 250 thousand in the 1985-90 period.
Minnesota industry tracks U.S. industry in both recession and recovery. Wh:[le
U.S. nonagriculturalemployment declined nearly 1.5 million in 1981 and 1982,
Minnesota employment declined by more than 100 thousand to roughly its 1977 level
of less than 1.7 million. Thus, the 1980 and the 1981-82recession reduced
nonagriculturalemployment by 1.7 percent in the U.S. and 3.7 percent in
Minnesota. By mid-1983, however, nonagriculturalemployment is expected to start
its climb back to earlier peak levels, reaching 1.8 million in 1985 and 2.1
million in 1990.
Like other Midwest states, Minnesota’s economy is closely linked to the U.S.
and world economies. It absorbs the shock of recession by lowering levels of
employment in basic industries. It also responds sharply to economic recovery.
Employment losses of the recession
periods of economic upturn. Thus,
become leading industries.
downturn are regained in the early and middle
lagging industries, with only a few exceptions,

-iv-
Leading Minnesota’s economic recovery in the 1980’s are retail trade,
services, and manufacturing - first, nondurable and, later, durables.
● Lower levels of inflation and unemployment trigger a return of consumerconfidenceand a willingnessto shift householdincome from paying olddebts and even savings to buying big ticket items like housing, autos,kitchen appliances, and furniture. Spendingon personal and professionalservices also goes up with economic recovery.
. Business spending on output-increasingand cost-reducinginvestmentistriggered as the economy improves and industry output approaches itsearlier peak levels. While capital goods-producingindustries initiallylag, consumer goods-producingindustriesin Minnesota’s economic outlook isokay, they too eventuallypick up the pace of economic recovery.
t Capital goods-producingindustries,such as computers and office equipment,service and other industrymachinery, communicationsequipment, andscientific and professionalinstruments, are becoming an increasinglyimportant part of the economic base of Minnesotaand its substateregions.The long-awaitedshift in GNP to proportionatelyless consumer spending andproportionatelymore capital spending would strengthen these basicindustries as sources of state economic growth.
Lagging sectors in the Minnesota economy are
areas of manufacturing,such as textile products
and employmentare declining in these industries
sensitivitiesand structural change.
its metal mining and certain
and apparel. Total production
which suffer both cyclical
● In agriculture and agribusiness,as well as in lumber and wood products,and pulp and paper products, total employmentis declining slightly, butoutput is increasing. Year-to-year improvementsin output per workeroutpace the growth in market demand. Both industry groups, however,dependheavily on general economic recovery. In addition, agriculturalprospectsare improved with a less inflated U.S. dollar in world trade and pricestability in farm markets.
Q Industry projections show lagging employment and income growth inMinnesota’s traditional basic industries -- mining, forest products,agriculture and agribusiness,and certain areas of manufacturing.Above-averageemploymentgrowth is expected in most manufacturing,including high technology products and other durable goods. Above-averagegrowth is expected also in services -- financial,business, professional,and personal -- and in retail and wholesale trade.
Substateregions exhibitingmore rapidly growing industry employmentare
within 100 miles of downtown Minneapolisand St. Paul. Besides the Twin Cities
MetropolitanCouncil Region, this includes most of Southeasternand South Central

-v-
Minnesota, and East Central and Central Minnesota -- a total of 40 counties (in
five substate planning regions). Total 1980 resident population in this Minnesota
heartland was 2.9 million. Total employmentwas slightly more than 1.6 million.
Beyond the Minnesota heartland lies much of the state’s agriculturalproductivityand natural amenities. Wheat, corn, soybeans, beef cattle,and hogs are produced in the state’s western counties on farms typicallylarger than the state average in acreage and earnings. Regional prosperityin these areas depends largely on farm production,income, and purchases.Here population is declining although total employment is increasingslightly.
Natural amenities and associated values of rural life attract residents toNorthern Minnesota counties. Population growth in these counties leadsemployment growth. In the 1980-82 period, for example, total populationand labor force actually increased in Cook and Itasca Counties in NortheastMinnesota, while total employment declined. However, the northern countiesare part of a declining region because of their declining basic employment,particularlyin mining.
Of primary importance to Minnesota’s long-term economic viability is thegrowth of its core metropolitan-industrialregion focused on the TwinCities of Minneapolis-St.Paul. Here resides half of the state’spopulation,more than half of its employmentand income, major educationalinstitutions,and most of its private research and developmentlaboratories. It serves, also, as regional and national headquartersformany large businesses. Because of high social investment in past years, anextensive entrepreneurial,financial, and service infrastructureexists forthe growing numbers of new businesses started in this area.
Core metropolitan area business growth is representedin the increase intotal nonfarm business establishmentsfrom 28.6 thousand in 1970 to 41.9thousand in 1980. Statewidethe total nonfarm business establishmentsincreased from 64.9 thousand in 1970 to 85.5 thousand in 1980. Thus, muchof the new business growth -- 65 percent in the 1970-80 period -- wasconcentratedin the seven county core metropolitanarea. Also, much of thenew business generation is in the large, growing high technologyindustrialcomplex based on the manufacturingof computers and office equipment,communicationsequipment,scientific and professionalinstruments,enginesand turbines, aerospace, ordnance and drugs, and related business services.
A distinguishingcharacteristicof a high technology-basedurban-industrial
complex is its capacity for generating new firms and, also, new products and
processes,which, in part, are produced and sold by the new firms. Each product
or process has its own cycle of development,production, promotion, and
‘utilization,starting with the expectation of a high return on investment. In

-vi-
later stages of the product or process cycle, success in cost-reducingefforts are
critical for business survival. Thus, some businessesmust seek low-cost sites
outside the metropolitan area. These “spillover”effects of new product and
process developmentare characteristicof high technology-basedurban-industrial
complexes, like the Minneapolis-St.Paul Metropolitanarea. Nonetheless,the
economic viability of such complexesis sustained by their ever-presentcapacity
for generating new products, new proceses, and new firms.
The “spillover”effects of metropolitan-industrialgrowth have a two-fold
impact on business expansion in Minnesota’s heartland and in the North and the
Northeast. Future industry expansionmay occur outside the metropolitancore
area, but in Minnesota. In addition, industry in the metropolitancore area may
seek future production inputs from suppliers in the same outstate regions.
Candidate regions for the two types of business expansion include Northeast and
Northern Minnesota and Southeasternand South Central Minnesota.

-1-
MINNESOTA’S ECONOMIC GROWTH IN RECESSION AND RECOVERY: PART II
Wilbur R. Maki and Patricia Dalton
INTRODUCTION
The Minnesota economy is closely linked to the U.S. and world economies
through its trade and financial linkages, Minnesota’s economic baae is its
traditionalnatural resource-based,export-producingindustry -- agricultureand
food products manufacturing,forestry and forest products manufacturing,and
mining -- and, also, its durable goods manufacturingand services. Each of these
basic industries depends on sales to export markets, that is, on out-of-state
shipments to non-resident buyers of its goods and services. When the U.S. and
world economies prosper, so do Minnesota’sbasic industries and, eventually, the
residentiaryindustries which cater to the needs of Minnesota’s primary economic
units -- its resident households,businesses,and governments.
General Economic Outlook
Minnesota’s economic dependence on out-of-statemarkets points to the
importance of the general economic outlook in accounting for Minnesota’seconomic
prospects in the 1980’s. The general economic outlook is represented, of course,
by such common economic
data, we turn to recent
projectionsof the U.S.
indicatorsas real GNP and industry employment. For these
reports of the U.S. Bureau of Labor Statistics (BLS) on
economy through 1990*
Two different sets of U.S. economic projectionsfor the 1980’s provide a range
within which U.S. economic growth will most likely occur. The low-trend
projection compares most closely to the 1973-80 period when real GNP increased 2.4

-2-
percent per year, while the high-trend projection compares most closely with the
1955-68 period when GNP grew at annual rate of 3.7 percent. The high-trend
projectionassume marked improvementsin both inflation and productivityover the
1980-90 period.
The BLS projection series was prepared in 1981 just prior to the start of the
1981-82 recession. While the inflation-reducingeffects of post-1980 U.S.
monetary policies were not anticipatedin the BLS projection series, they
nonetheless compare closely with the most recently published Wharton and Data
Resources control projectionsto 1985.
The low-trend projection series is extended from 1985 to 1990 on the
assumption that a third recession in the 1980’s is likely and, indeed, its
occurrencemust be taken into account in the preparationof the Minnesota baseline
projection series to 1990. Thus, the low-trend U.S. projection series is used in
the preparationof correspondingMinnesota projection series. It represents
long-term moving averges rather than the exact levels of Minnesota industry
employment which are consistentwith the general business cycle.
Industry Employment
The BLS projectionsof the U.S. economy to 1990 also provide a detailed
breakdown of industry employment,both wage and salary employment and total
employment (which includes self-employedpersons). Nonagriculturalwage and
salary employment,rather than total employment, is projected because of the
earlier availabilityof this employment series, All agriculturalemployment and
nonfarm self-employedpersons are projected separatelyas the differencebetween
total employment and nonagriculturalemployment.
Total nonagriculturalwage and salary employmentin Minnesota climbed
-3-
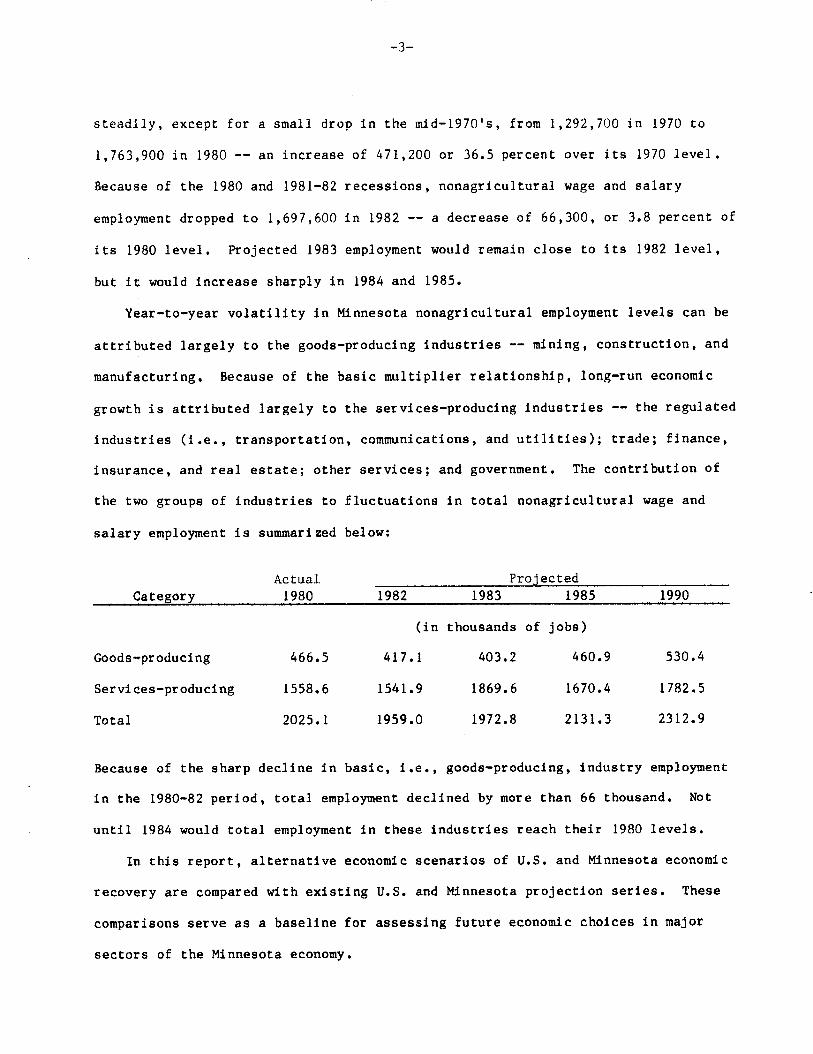
steadily, except for a small drop in the mid-1970’s, from 1,292,700in 1970 to
1,763,900in 1980 -- an increase of 471,200 or 36.5 percent over its 1970 level.
Because of the 1980 and 1981-82 recessions, nonagriculturalwage and salary
employment dropped to 1,697,600in 1982 -- a decrease of 66,300, or 3.8 percent of
its 1980 level. Projected 1983 employment would remain close to its 1982 level,
but it would increase sharply in 1984 and 1985.
Year-to-year volatility in Minnesota nonagriculturalemployment levels can be
attributed largely to the goods-producingindustries-- mining, construction,and
manufacturing. Because of the basic multiplier relationship, long-run economic
growth is attributed largely to the services-producingindustries -- the regulated
industries (i.e., transportation,communications,and utilities); trade; finance,
insurance, and real estate; other services; and government. The contributionof
the two groups of
salary employment
industries to
is summarized
fluctuationsin total nonagriculturalwage and
below:
Actual ProjectedCategory 1980 1982 1983 1985 1990
(in thousands of jobs)
Goods-producing 466.5 417.1 403.2 460.9 530.4
Services-producing 1558.6 1541.9 1869.6 1670.4 1782.5
Total 2025.1 1959.0 1972.8 2131.3 2312.9
Because of the sharp decline in basic, i.e., goods-producing,industry employment
in the 1980-82period, total employment declined by more than 66 thousand. Not
until 1984 would total employment in these industries reach their 1980 levels.
In this report, alternativeeconomic scenarios of U.S. and Minnesota economic
recovery are compared with existing
comparisonsserve as a baseline for
sectors of the Minnesota economy.
U.S. and Minnesota projection series. These
assessing future economic choices in major
-h-
Economic Scenarios
In a January 1983 survey of the Minnesota Bankers Association, three U.S.
economic scenarios were described, as represented in Table 1. Senior bank
officers responding to this survey selected the one depicting slow business
recovery and high unemployment as most likely. The average of all responses shows
a 60 percent probability of occurrence for the slow recovery scenario. This
compares with a 30 percent probabilityfor the continuingrecession scenario and
10 percent probability for rapid recovery as summarizedin Table 1. Individual
responses, however, varied widely around their mean values, especially for
Scenarios 1 and 2. The findings thus provide:
● a concensus on slow, but steady growth in GNP;● an alternative,less optimistic view of aborted recovery; and● an alternative, less widely bald view of accelerated expansion.
U.S. economic recovery is expected to start in the third quarter, 1983.
Respondentsin Northeast Minnesota expect a later recovery than their counterparts
elsewhere in the state, especially those located in Southern Minnesota. ThiS
group thus differs in its views of:
● U.S. economic scenarios;and, also,● Minnesota industry recovery and expansion.
Minnesota economic recovery is expected to start about one quarter later than
U.S. economic recovery. Again regional differencesare evident in the survey
results. Respondentsin the Northeast and Northweston the average expect a
Minnesota recovery to start in 1984.
Industry differences also are noted in recovery expectations. The
constructionindustry is viewed leading the industry turn-around. Except for the
Northwest respondents, the constructionindustry turn-aroundis
-5-
Table 1. Probabilityof Occurrence of Three Scenarios for the 1983 U.S. Economy:MBA Outlook Survey
Change in EmploymentEconomic Scenario Real GNP Rate Probability
(%) (%) (%)
1. Recession negative more than 10 30
2. Slow recovery o-3 more than 10 60
3. Rapid recovery more than 3 less than 8 10
expected in Ouarter III, 1983. Manufacturingis also expected to turn-aroundin
1983,
start
least
most likely in Quarter IV. Tourism, mining, and farming, are expected to
expanding in total business activity in late 1983 and 1984. Farming is the
likely, of the five industries,to experience economic recovery in 1983,
according to the survey results.
Industry employment statistics show that Minnesota has gained in the U.S.
after each recession ...
Q especially in manufacturingand services,● total industry employment,
Minnesota industry trends are represented by
civilian employment and nonagriculturalwage and
... andin
two employment series -- total
salary employment. The two
series have differed by more than 300,000 since 1975. This is a larger difference
than for the nation as a whole because of Minnesota’slarger proportionof farm
employment. Total civilian employment is now slightly more than 2 million while
nonagriculturalwage and salary employment is slightly less than 1.7 million.
The nonagriculturalemployment is further disaggregatedinto two categories --
goods-producingand services-producing,including government. Other employment ‘-
the difference between nonagriculturalwage and salary and total civilian
employment -- includes farm and nonfarm proprietors,and farm and householdwage
and salary workers.

-6-
Cyclical vs. Structural Change
The MBA membership survey asked additional questionson capital spendingand
the extent to which the lack of full economic recovery in specific industries can
be attributed to structural, rather than cyclical, factors. Structuralchanges
include the changing competitive position and geographical location of the steel
industry due to long-term changes in its cost structuresand access to production
inputs, and export markets. On both questions, member opinions varied widely, but
without significantregional differences. Respondentsbelieved capital spending
would range from slight, if any, increases in mining and farming, to increases of
10 to 20 percent in construction, manufacturing,and tourism industries.
Structural changes were viewed as accounting for roughly one-fourth of the
less-than full recovery in 1983,except in mining where structural change was
believed to account for nearly 40 percent of the less-than-fullrecovery.
Expected increases in capital spending generally correlate with expected
industry recovery. Views on capital spending in the constructionindustry,
however, are compounded by expected increases in constructionactivity and
expansion of the industry itself. Similarly,perceived effects of structural
changed are colored by the exceptionallylrge negative cyclical effects on
Minnesota industry sales and employment over the current business cycle. For the
Us., non-residentialcapital spending is expected to increase four to six percent
in the second half of 1983, which is much less than the expected increases
reported in the MBA survey.Seventypercent of the U.S.
to structural changes.
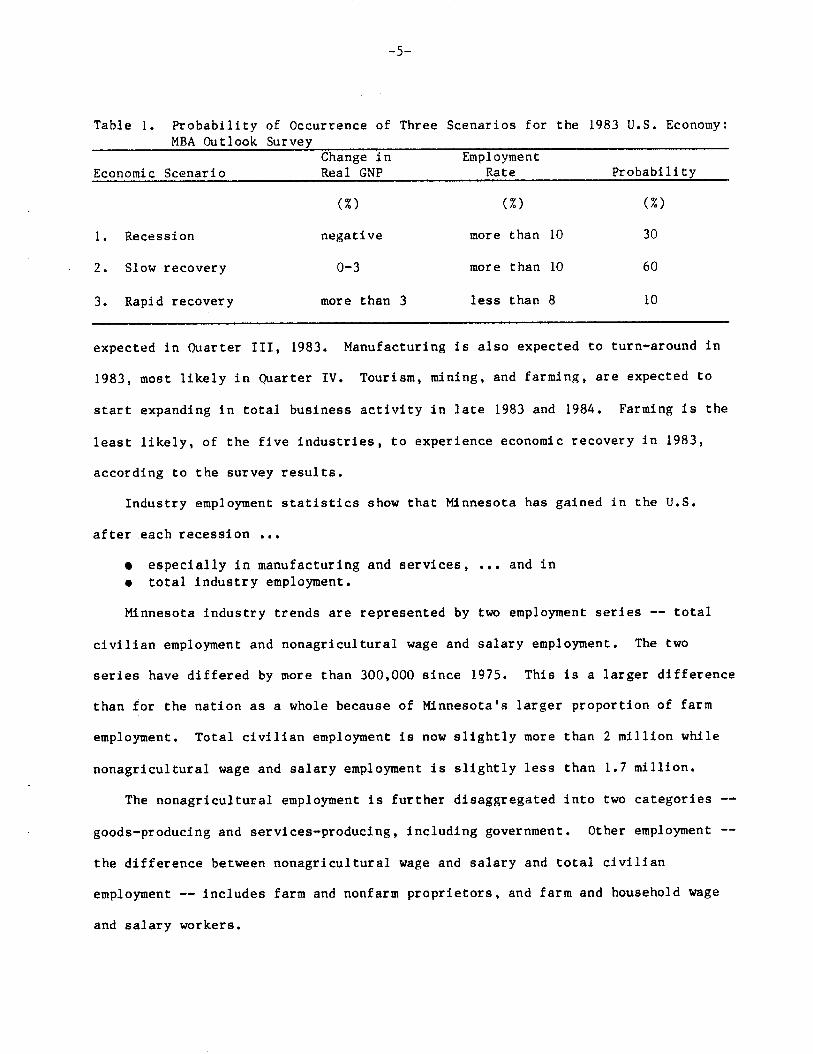
These survey results are generally consistentwith
projection series presented in this report (Figure 1).
unemployment is attributed
the Minnesota baseline
This series was prepared
-7-
6
“1(.\
....
I
.7-. -
. ---
-8-
in conjunctionwith the evaluation of state revenue and related economic
projections. This baseline series is linked to a U.S. forecast which is slightly,
but only slightly, higher than the U.S. forecast used in the preparationof the
January 1983 Minnesota revenue forecasts.l
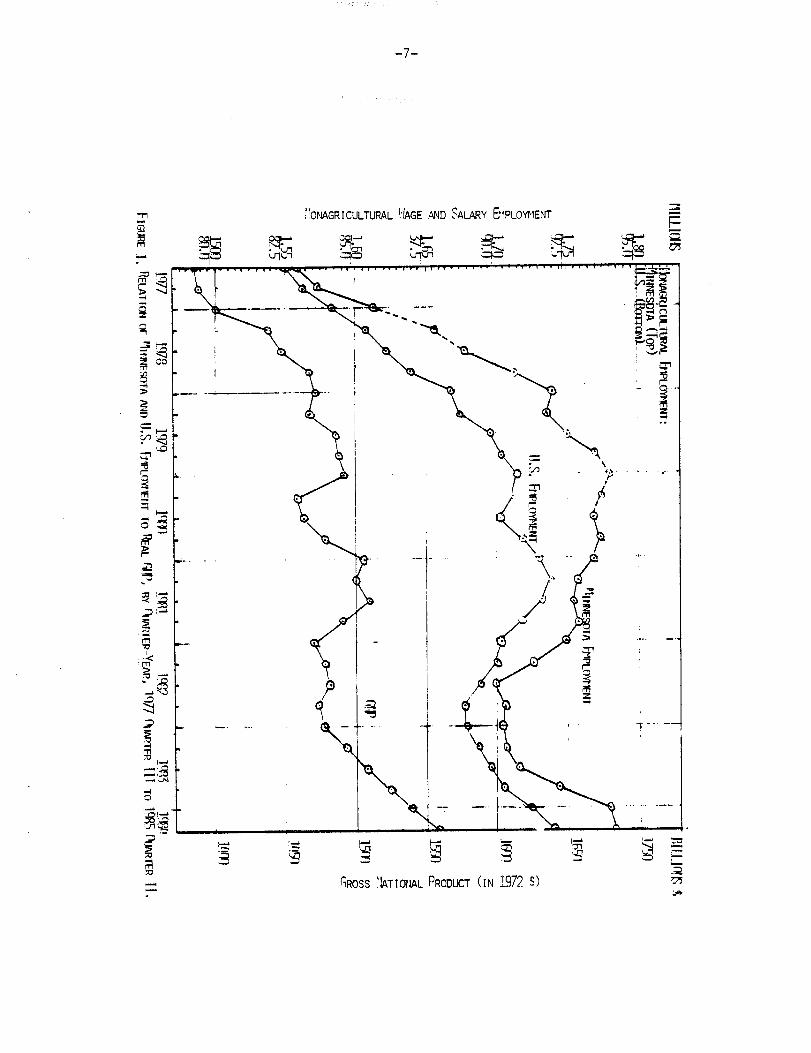
The baseline projections provide annual and quarterly measures of both
economy-wideand industry-specificrecovery. For example, nonagriculturalwage
and salary employment is projected to start the recovery phase of the current
business cycle in @arter II, 1983 (Figure 2). (For the alternative projection
series used in forecastingMinnesota state revenues, the increase would occur
somewhat later in the year for most industries). The constructionindustry is
projected to turn around in Quarter III. Mining and manufacturingemployment is
also projected to turn around by Fall, 1983, The trade and services account for
the early upturn in total employment in the baseline projection series.
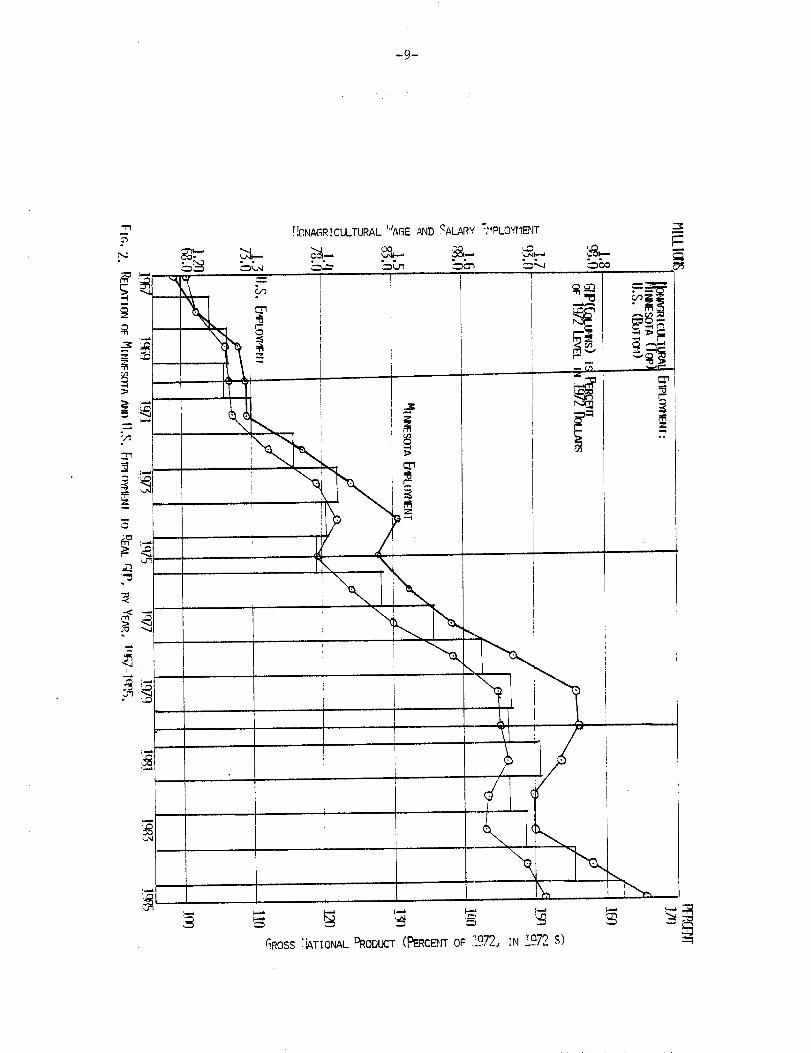
The relation of Minnesota and U.S. employment trends to real GNP also is
illustratedin Figure 2, Quarter-yearchanges in Minnesota employment typically
lag correspondingchanges in U.S. employment. Moreover, the above-average
cyclical sensitivityof the Minnesota nonagriculturaleconomy for the large
decline in total Minnesota employmentsince Quarter 1, 1980. C@arterlyemployment
levels are not expected to reach their 1980 levels until 1984. Total U.S.
employmnt, on the other hand, reached its peak levels in mid-1981.
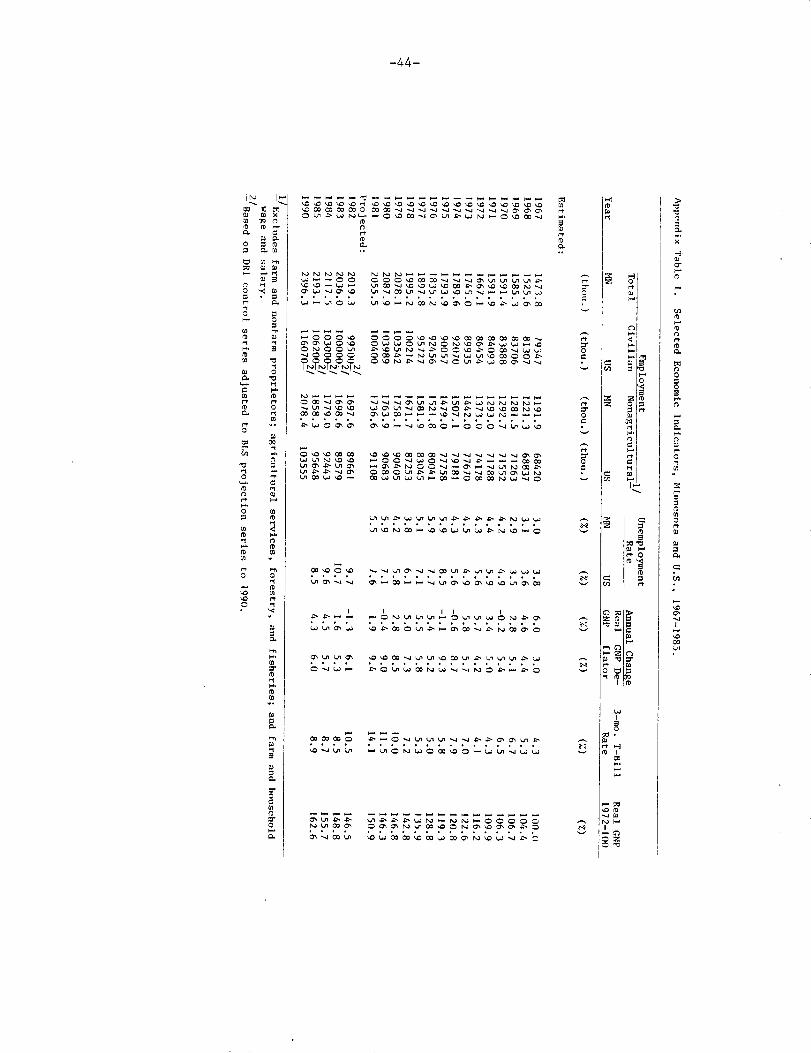
1The underlying assumptions of the Minnesota baseline projectionsare summarizedin Appendix Table 1. These assumptions are comparablewith those underlying themost likely economic scenario. For example, the 1983 U.S. unemploymentrate isprojected at 10.7 percent with growth in real GNP at 1.6 percent, whichcorresponds to scenario of modest economic recovery in 1983. The U.S. economicassumptionswere used in the preparationof the Minnesota projectionsseries.
-9-
-n!!13NAGRIcuLTURAL “’AGE AND SALARY %-omwr
(
-
..
---1-1
GROSS ‘bTIONALPRODIKT (FERCENTOF 1972, IN W? $)
-1o-
The decline in total Minnesota’employment since 1980 can be attributed largely
to three industry groups -- durable goods manufacturing,construction,and mining.
Even by mid-1984, the projected employment in the three industry groups would
fall short of their peak levels by 16 to 45 percent.2 However, the annual
employment series sho,wprojected total employment levels in 1984 surpassing the
peak 1980 levels in four of the nine industry groups, nmely, nondurable goods
manufactureng; trade; finance, insurance, and real estate; and services.
Minnesota’sabove-averagegrowth in job creation over the 12-year period from
1967 to 1979 period is shown in the gradually increasingMinneota total employment
relative to correspondingU.S. employment levels. In contrast, the 1980-82period
is marked by a more rapid decline in Minnesota than U.S. employment. The period
of recovery, starting in 1983, is perceived as being comparable to the early
period of faster employment growth in Minnesota than in the U.S. Thus, despite
lagging rates of growth in mining, construction,and manufacturing, total
employment in Minnesota is expected to grow at above-averagerates, once economic
recovery starts. The lagging sectors are experiencingthe consequencesof
structural,rather than simply changes in industry performance.
2 The quarterly baseline forecasts are presented in Appendix Table 2. This seriesshows a very slight upturn in total employment from 1982 to 1983. The projectedincreases in following years are larger than the projected increase in 1982.

-11-
Focusing on Key Sectors
To separate cyclical from structural forces shaping Minnesota futures and to
show the importance of each, we focus on economic choices facing four areas of the
Minnesota economy:
● Agriculture and related agribusinessindustries in southern and westernMinnesota;
● Manufacturingand services in the Twin Cities Metropolitan area;● Mining and tourism in northern Minnesota; andc Local (and, also, state) government spending in all areas of ~nn@sota*
Employment and economic activity in each of these four sectors has been affected
by the general business cycle and, also, by structural change within each sector.
Agriculturalincome and investment has been severely affected in the past two
years by low farm prices and high interest rates. Agriculture-relatedindustries
also have been affected by the general business cycle, but
especially agriculturalprocessing,are affected, in part,
in manufacturing.
these industries,
by structural changes
Manufacturingand service industries in the Twin Cities Metropolitanarea
account for most of Minnesota’seconomic growth in the 1970’s. They also account
for its highly favorable growth prospects in the 1980’s. Manufacturing,however,
includes the cyclically sensitive industries contributingto the sharp decline in
manufacturingemployment in the period from 1980 to ’92.
Mining and tourism suffer from seasonality in employment levels as well as .
being cyclically sensitive industries. They also face important structural
changes affecting their potentialsfor profitable growth and developmentin
northern Minnesota.
Finally, state and local government spending is being constrained by reduced
levels of intergovernmentaltransfers,both federal and state. Tough choices lie
ahead for Minnesota local governments particularlyas they are confronted by

-12-
reduced revenues without commensurateacross-the-boardreductions in the demands
for state and local government services.
Plan of approach is to relate changes in industry activity in each sector to
(a) the general business cycle and (b) the long-termeconomic prospects facing
each sector. Economic options in each sector will be viewed with reference to
these changes and, also, public and private goals and objectives affecting future
economic choices. Questions addressed are the following:
● What are the alternative economic futures for each sector and how are thesefutures affected by the general business cycle and the changing of the U.S.and the world economy?
● What economic options are available for strengtheningthe competitiveposition of private business enterprise in each sector?
● And, finally, what is the role of state and local government in affectingthe level and location of capital spending in each sector?

-13-
AGRICULTURE AND AGRIBUSINESS
Agricultureand agriculture-relatedindustries in Minnesota
important basic industry group. Roughly a fourth to a third of
are still the most
the entire
Minnesota economy is dependent on agriculture and agriculture-relatedindustry as
shown in Figure 3.3 The agriculture dependency of the Minnesota economy was
reduced sharply in the 1970’s because of the rapid growth of cyclically-sensitive
durable goods manufacturing,largely in Minneapolis-St.Paul Metropolitanarea.
Cyclical and Structural Change
Agricultural product cycles are affected by the vagaries of weather, trade,
and world economic conditions. Because of the
Minnesota, the sharp expansion in U.S. foreign
resulted in correspondinglysharp increases in
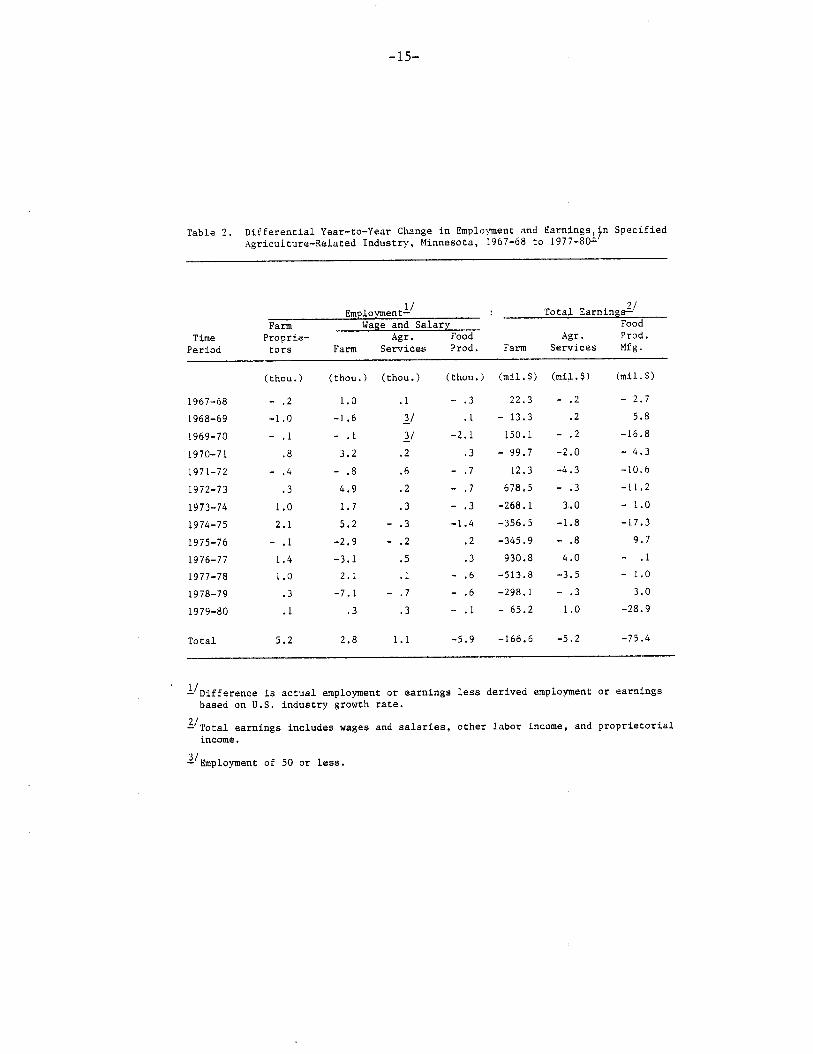
employment, as shown in Table 2. Differential
importanceof crop productionin
agricultural trade in 1973 and 1977
net farm income and, also, in farm
year-to-yearchanges in employment
and earnings are presented for farm and food productsmanufacturing industriesfor
the purpose of showing above-averageand below-averagerates of change in two sets
of industry indictors. For example, during the 1967-1980period, farm
proprietorialemployment in Minnesota increased relative to farm proprietorial
employment in the U.S., as indicated by the positive differential change in
Minnesota farm proprietorialemployment. Wage and salary employment in farm
production and agricultural services also increasedrelative to U.S. employment
changes. However, wage and salary employment in food products manufacturing
declined in the same period.
3 Appendix Table 3 provides the statistical series on basic employment inagricultureand food products manufacturing.

-14-
OF TOTAL 2ASIC
3
EMpLCWMENT
I—.
.
I
-t-
. I
1
%__Ln
?ij
—
I! .’.I r
\
-15-
Table2. DifferentialYear-to-YearChangein Employmentand Earningsl}nSpecifiedAgriculture-RelatedIndustry,Minnesota,1967-68to 1977-80-
~m lo entg TotalEarning#’Farm Wageand Salary Food
Time Proprie- Agr. Food .lgr. Prod,Period tors Farm Services Prod, Farm Services Mfg.
1967-68
1968-69
1969-70
1970-71
1971-72
1972-73
1973-74
1974-75
1975-76
1976-77
1977-78
1978-79
1979-80
Total
(thou.) (thou.) (thou.) (thou.) (roil.$)
-. 2
-1.0
- ,1
.8
- .4
.3
1.0
2.1
- .1
1.4
1.0
.3
.1
5.2
1.0
-1.6
-. 1
3.2
- .8
4.9
1.7
5.2
-2,9
-3.1
2.1
-7.1
.3
2.8
.1
~1
~i
.2
.6
.2
.3
-. 3
-. 2
.5
,1
-. 7
.3
1.1
-. 3
.1
-2.1
.3
-. 7
-, 7
-. 3
-1.4
.2
.3
-. 6
-. 6
-, 1
-5.9
22.3
- 13.3
150.1
- 99.7
12.3
678.5
-268.1
-356.5
-345.9
930.8
-513.8
-298.1
- 65.2
-166.6
(roil.$) (roil.$)
- .2 - 2.7
.2 5.8
- .2 -16.8
-2.0 - 4.3
-4.3 -10.6
-. 3 -11.2
3.0 - 1.0
-1.8 -17.3
-. 8 9.7
4.0 - .1
-3.5 - 1.0
- .3 3.0
1.0 -28.9
-5.2 -75.4
g Differenceis actualemploymentor earningslessderivedemploymentor earningsbasedon U.S.industrygrowthrate.
J/Totalearningsincludeswagesandsalaries,otherlaborincome,and proprietorialincome.
2’Employmentof 50 or less.

-16-
Differentialyear-to-yearchanges in total earnings, i.e., wages and salaries,
other labor income, and proprietorialincome, differ from their employmentseries.
These differencesresult from correspondingdifferences in the industry wage rate
and earnings per worker trends, which, in turn, manifest structural changes in
income sources of farm households,especially in rural areas within 100 miles of
downtown Minneapolisand St. Paul. Many new off-farm job opportunitiesemerged
outside the seven-countyMinneapolis-St.Paul Metropolitanarea in 1970’s as
manufacturingand, also, retail and service businessessought low cost sites in
close proximately to part-time and full-time employees and local markets.
Minnesota agriculture is unique in its interdependencewith nonagricultural
enterprise, both in rural areas and in the Twin Cities Metropolitanarea. An
increasing proportion of all farm households derive a major portion of personal
income from off-farm employment. Thus, small-to-mediumsize farm enterprises,
even the below-averagenet income per farm, provide a level of living and quality
of life sufficientlyattractive to sustain a large and stable work force in
agriculture. In addition, Minnesota agriculture and agriculture-relatedindustry
depends on the Twin Cities Metropolitanarea for roughly one-fourth of its total
value added. Structural changes are occurring also in food products manufacturing , ~
as illustratedearlier in Figure 3. This industry is more cyclically sensitive
than farming, i.e., in this industry, year-to-year fluctuationsin wage and salary
employmentare larger. In Minnesota, this industry has lagged its U.S.
counterpartin regaining its former employment during the recovery phase of each
business cycle. Thus, the projected 1985 and 1990 food products manufacturing
employment levels are less than would be the case if average U.S. growth rate were
to apply to current employment levels.
The 1983 MBA Outlook Survey respondentsattribute 23 percent of agriculture’s
less-than-fullrecovery in 1983 to structural changes. This means that 23 percent

-17-
of the difference between actual and full employment levels. Farm households
income levels have declined because of the reduced levels of off-farm employment as
well as reduced levels of farm employment and, also, low farm prices. Thus,
structural changes affecting the employment prospectsof farm householdsinclude
long-term shifts in nonagriculturalindustry location. In the 1970’s these shifts
were translatedinto sharp increases in off-farm employment.
Capital Spending
The expected 11 percent increase in the capital spending of farm operators
reported in the MBA Outlook Survey is consistentwith an early upturn in net farm
income levels. Low farm prices and high farm expenses, however, would depress net
farm income levels in 1983, which would, in turn delay an upturn in capital
spending on farms.
Estimates of capital spending in Minnesota food products manufacturingare not
readily available. An increase in capital spending in this industry would imply
changes in supply-side factors affecting the profitabilityof private investment
in food productsmanufacturing. Such an increase is unlikely with the expected
lack of strong market demand in 1983 for Minnesota farm products. Like
commodity-producingindustries generally, capital spending is largely
labor-reducing,which means stable or declining total employment. In Minnesota,
this trend is confounded by growth in off-farm jobs for less-than-fullyemployed
farm operators.
Few fiscal incentives exist which would increase capital spending in a
cyclically-depressedindustry like agriculture. Because of structuralchanges,
this new capital spending may be redirected towards small-to-mediumsize
enterpriseswhich provide only a partial, although still large, contributionto
-18-
the total personal income of farm households.
Similarly,capital spending in food products manufacturingis, at best,
neutral in its labor-reducingconsequencesbecause it is, also, output-increasing.
While food products manufacturingemployment is cyclically-sensitivein Minnesota,
as in the U.S. generally, it has declined, relative to U.S. food products
manufacturingemployment,in the post-recoveryperiod between the first stage of
recovery and the start of the next downturn in industry employment.
-19-
MANUFACTURINGAND SERVICES
Manufacturingand service industries account for a major portion of
basic industry employment. As shown earlier in Figure 3, basic employment
in machinery manufacturingand medical and other services increased from
23 percent to 42 percent of total employment. Most of this employment is
concentratedin the Minneapolis-St.Paul metropolitan area. The employment
increases,however, are dispersed as a result> in part, of population redistribution.
Cyclical and Structural Change
The steady, above-averagegrowth of employment in manufacturing and
services in the 1967-80 period is summarized in Table 3 for selected
industries. Machinery manufacturing,that is nonelectricalmachinery and
instruments-relatedequipment, increasedmore rapidly in Minnesota than in
the U.S., as shown by the net differentialincrease of 13.3 thousand in
total employment in the two industry groups. Employment in services,
includingwholesale trade and eating and drinking places, also increased
more rapidly in Minnesota than in the U.S. A net differential increase of
23.2 thousand is reported for this industry group in Table 3.
Differential increases in total earnings accompanied the differential
increases in total wage and salary employment,except for medical services.
The largest increases,relative tO the employment increasers occurred ‘n
manufacturing,specifically,instrumentsand related equipment. The
accumulativeincreases in total earningsmanifest
changes in the Minnesota economy. Although total
important structural
employment in these

-20-
..?’.

-21-
industries increased faster in Minnesota than in the U.S., the annual
increases in earnings per worker roughly were nearly the same in the two
areas.
Contrastingpatterns of growth in employment and earnings per worker
are shown in Figure 4. Of the two industries,metal mining (represented
by the top set of numbers), accounts for less total employment and is
declining. Employment in nonelectricalmachinery manufacturing,while
also cyclically-sensitive,accounts for an increasing level of total
employment. Increases in earnings per worker, nonetheless,are smaller in
nonelectricalmachinery manufacturing than in mining.
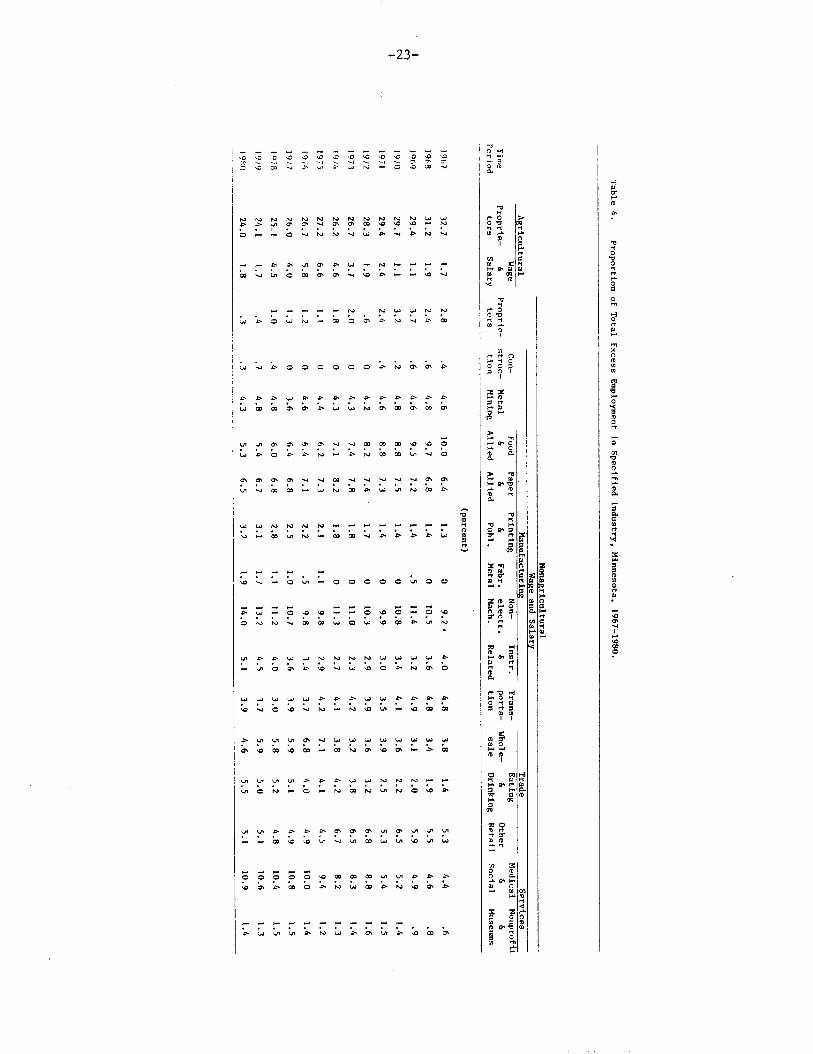
Structural
by total excess
allied products
allied products
and instruments
distributionof
changes among basic industry groups are represented,finally,
employment in Table 4. The declining importanceof food and
manufacturingand the increasing importanceof paper and
manufacturing,fabricatedmetals, nonelectricalmachinery,
and related equipment is clearly illustratedby the
total excess employment among the individual industry groups.
In addition, dependence on basic employment in eating and drinking places
has increased steadily,while dependence on basic employment in other retail
trade declined in recent years. Importanceof basic employment in the
medical, social, and nonprofit service industriesalso has increased.
Capital Spending
Capital spending by manufacturingbusinesses in Minnesota was expected
to increase by 17 percent in 1983, according to the MBA Survey. Although
manufacturingwould lead Minnesota’s economic recovery, along with
construction,most manufacturing industries are not likely to reach their

-22-
ii
L!AGE AND SALAi3y EIIpLOYMWf
4
N—.
FL----.??s ,
-3 &l
@ ,1+
<
‘X’F%XJ
-23-
UUNNMW - 1-------. . .,. .“N“-‘&.lnN - “m”mL*”k-*LJ
Wwwww>m -8- WW .-*=.*. . . . .au OuY”u N”- “NkY”w”-L coca
-24-
1979 and 1980 peak employment levels until 1984 or 1985. Much of Minnesota’s
basic manufacturing industriesis capital-goodsproducing and, hence,
linked to capital spending levels in U.S. industries. For most manufacturing
industries,an expected increase of 17 percent is high, given the large
excess capacity in many individualmanufacturing industries.
The 1983 MBA Survey cited earlier included a question on structural
change in manufacturing industries. Based on this study, 27 percent of the
less-than-fullrecovery is attributed to structural change in manufacturing.
Projected 1983 manufacturing employment is nearly 12 thousand below its
1982 level and 41 thousand below its 1980 level. Thus, total manufacturing
employment in Minnesota is expected to decline further, rather than increase,
in 1983. Most, if not all, of the employment decline is cyclical. If full
recovery were to require a net manufacturing employmentincrease of 41
thousand, then the positive cyclical response anticipated in the MBA Survey
would account for 73 percent, or 30 thousand, of the total. The projected
25 thousand increase in total employment from 1983 to 1984 would be
equivalent to 83 percent of full recovery, assuming a 27 percent allowance
for structural changes in the 1983-84 period.
-25-
MXNING AND TOURISM
Mining and tourism account for roughly half of the economic base of
northern Minnesota. Both industriesare cyclically sensitive,as demonstrated
by their sharp employment losses since 1979. They also are experiencing
structural changes as a result of long-termmarket shifts.
Cyclical and Structural Change
Steel mills have reduced taconite purchases to one-third of their 1979
levels. Economic recovery is unlikely to return more than half of the
previous market decline. The 1980 and 1981-82 recessions also reduced
consumer spending on tourism/recreation-relatedactivities. Market demand
has shifted from small resorts to large resort complexes both on Lake
Superior’sNorth Shore and in Duluth. Long term adjustments to structural
change in the northeast Minnesota tourism/recreationindustry are more-\
promising than in the taconite industry because of differences in the degree
of control asserted by local resource owners over the critical variables
affecting the competitiveposition of these two industries in their
respectivemarkets.
Year-to-year changes in northeast Minnesota metal, i.e., taconite,
mining employmentwere compared earlier in Figure 4 with corresponding
changes in nonelectricalmachinery manufacturing. The latter is
concentratedin the Twin Cities metropolitanarea. Also compared are the
relative magnitudes of cyclical and structural changes in total employment
in the two industries.

-26-
Except for a strike in 1977, taconitemining employmentclimbed
gradually in the 1970’s from nearly 12 thousand in 1970 to nearly 16
thousand in 1979 -- the peak year of taconite mining employment and production.
While taconitemining employment is expected to rise, after its record low
of less than six thousand in 1983, to over eight thousand in 1984 and over
nine thousand in 1985. Average annual taconitemining employment is
expected to drop below its 1985 level to near its 1984 level by 1990.
Structural change would account for the long-term decline in taconite
employment to roughly 60 percent, and even less, of its peak 1979 level.
Tourism and recreation activities also are cyclically-sensitive,like
mining. Structuralchange is important in tourism-and-recreation-related
industries,also, in accounting for long-term employmentprospects.
To illustrate to the effects of tourism/recreationactivities, survey
data on Lake Superior-NorthShore visitors were prepared on their total
expendituresin 1981. These expenditureswere related to individual
tourism/recreationactivities and related businesses in the seven-county
Northeast Minnesota region. These results show a total 1981 visitor
expendituresof $41 million generating $44 million of
industry sales in Northeast Minnesota which provided over 1200 jobs and
total annual payroll of $16 million. To create five thousand new jobs,
more than $170 million of additional tourism/recreationexpenditureswould
be needed if the North Shore visitor expenditurerelationshipswere to
apply, also, to future industry expansion elsewhere in the region.
Existing facilities,both private and public, are unused in some areas,
but fully used in others. Much careful matching of tourism/recreation
market assessmentswith related facility requirementsis necessary before
a coordinatedmarketing and facility development strategy is available for

-27-
promoting Northeast tourism/recreationpotentials. According to the
1983 MBA survey results, 22 percent of the less~than-fullrecovery of the
tourism/recreationindustry can be attributed to structural change -- an
important considerationin the matching of markets and facilities.
Capital Spending
Capital spending by tourism/recreation-reldtedbusinesses is expected
to increase by 12 percent in 1983, according to the MBA Survey results.
The start of an economic recovery in this industrywas not expected to
occur until late 1983. Thus, a slow recovery in both tourism and mining
implie’sa slow recovery in the region of their heaviest concentration,
namely, Northeast Minnesota. Capital spending, and, hence, construction
employment,would remain low in the northeast relative to other regions.

-28-
STATE AND LOCAL GOVERNMENT
State and local government revenues and expendituresin Minnesota increased
steadily in the 1970’s. While total personal income increased by $24.8 billion --
from $14.9 billion in 1970 to $39.7 billion in 1980, state and local government
revenues increased by $5.7 billion -- from $3.0 billion to $8.7 billion. Thus,
state and local government revenues in Minnesota nearly tripled. Their proportion
of total personal income also increased from 20 percent to 21.9 percent. In the
same period, total state and local government revenues in the U.S. also increased
nearly three fold. Their proportionof total personal income increased from 18.0
percent to 19.6 percent of total personal income. Growth in state and local
governmentrevenues in Minnesota thus exceeded correspondingU.S. growth in the
10-year period from 1970 to 1980. Average annual levels of total regional income,
total state and local government revenues, and total populationare presented in
Table 5.1 for later comparisons.
Cyclical and StructuralChange
Unlike Minnesota’s basic industries,the governmentsector is characterizedby
structural, rather than cyclical, change. The structural change is represented by
shifts in (1) revenue sources and (2) expenditure patterns. Per capita levels ~
constant dollars are used in the comparisonsof Minnesota correspondingU.S.
revenue sources and spending patterns.
4Based on study u: state and local governmentrevenues and expendituresinMinnesota by Patricia Dalton et al., Staff Paper Series P83- , DepartmentofAgriculturaland Applied Economics, University of Minnesota, St. Paul, 1983.

-29-
Table5.1. Totalpersonalincome,totalstateand localgovernmentrevenues,and totalpopulation,Minnesotaand U.S., 1970-1980.
Minnesota i UnitedStatesPersonal State/Local:’Popu- Personal State/Local Popu-
Year income Revenues lation Income Revenues lation
1970
1971
1972
1973
1974
1975
1976
1977
1978
1979
1980
(roil. $)
14851
15738
17145
20371
21581
23093
25017
28529
31766
36048
39744
(roil.$)
576.2
659.0
711.4
802.4
947.3
1024.1
1113.6
1275.8
1449,4
1865.1
2113.5
(thou.)
3815
3852
3867
3885
3898
3926
3957
3980
4005
4038
4087
(bil. $)
803.9
861.9
944.9
1058.9
1162,2
1259.4
1386.8
1533.8
1717.8
1939.5
2162.9
(bil.$)
23806
26299
29819
35177
39676
43774
47343
52726
62600
75830
88595
(million)
203.3
206.8
209.3
211.4
213.3
215.5
217.6
219.8
222.1
224.6
226.5
“U.S. Bureauof theCensus,GovernmentFinancing1970-1971(andlateryears),U.S.GovernmentPrintingOffice,Washington,D.C,
-30-
Revenue Sources
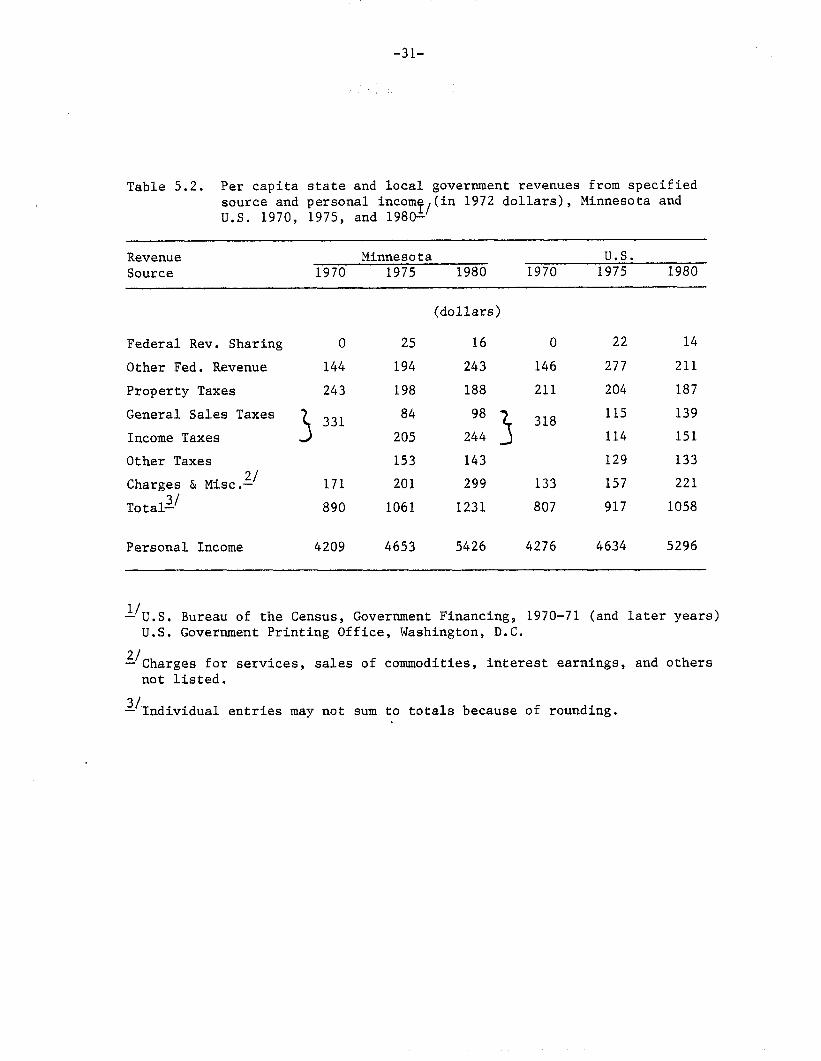
Revenue sources for state
categories-- federal and own
and local governmentsacquire
(as representedby the larger
and local governmentsare grouped into the two
sources, as shown in Table 5.2. Minnesota’sstate
an above-averageshare of revenues from both sources
per capita revenues for Minnesota than the U.S.).
State revenue sources show differences in per capita revenues between years
and between Minnesota and the U.S. when disaggregate. The largest differencesin
revenue trends in Minnsota and the U.S. occur in sales and income taxes.
Minnesota state government is increasinglydependent on these two tax sources as
its principal tax base.
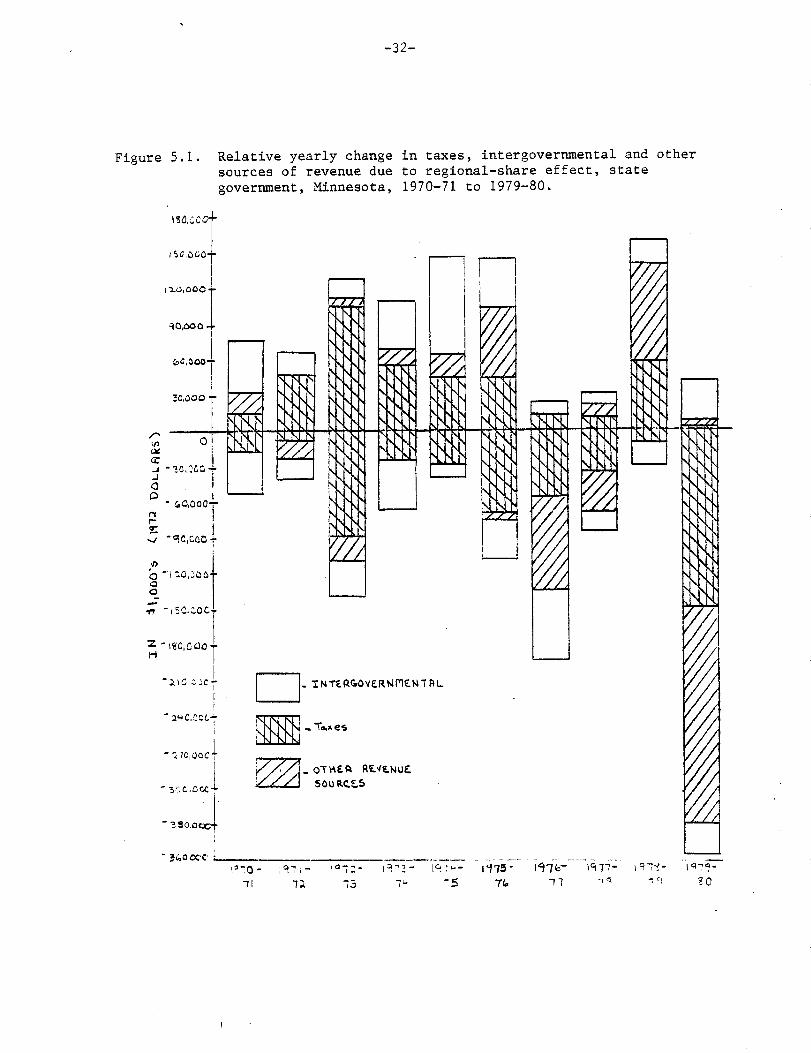
Relative year-to-yearchanges in revenue receipts from intergovernmental
transfers and all other revenue sources of state governmentsin Minnesotaare
illustratedin Figure 5.1. Large year-to-yearvariabilityin the individual
functionalareas of federal revenue-sharingaccounts for the large total positive
5and negative differentialeffects. Generally,Minnesota state government
experiencedabove-averagegrowth in federal-revenuesharing, except for the
1976-77 and 1977-78 periods.
The substantialgrowth in tax, as compared with nontax, revenue sources
persisted throughout the 10-yearperiod. Both tax and nontax sources have been
cyclically sensitive. Nontax revenues from federal sources accounted for an .
increasing share of total state revenues in much of the 1970’s.
5All positive differentialeffects (i.e., increases in yield of individualrevenue sources relative to correspondingU.S. revenue sources) are summed andrepresentedby the positive portion of the bar graph in Figure 5.1, while thenegative differentialeffects are summed with totals represented by the negativeportions of the same bar graph.
-31-
Table 5.2. Per capita state and local government revenues from specifiedsource and personal incomf,(in 1972 dollars), Minnesota andU.S. 1970, 1975, and 1980-
RevenueSource
Minnesota Us.1970 1975 1980 1970 1975 1980
Federal Rev. Sharing
Other Fed. Revenue
Property Taxes
General Sales Taxes
Income Taxes
Other Taxes
Charges & Misc.Z’
Totalzl
o
144
243
3331
171
890
Personal Income 4209
(dollars)
25 16
194 243
198 188
84 98
205 244 3
153 143
201 299
1061 1231
4653 5426
0 22
146 277
211 204
318115
114
129
133 157
807 917
4276 4634
14
211
187
139
151
133
221
1058
5296
“U.S. Bureau of the Census, Government Financing, 1970-71 (and later years)U.S. Government Printing Office, Washington, D.C.
2’Charges for services, sales of commodities,interest earnings, and othersnot listed.
“Individual entries may not sum to totals because of rounding.
-32-
Figure 5.1. Relative yearly change i.n taxes, intergovernmental and other
sources of revenue due to regional-share effect, state
government, Minnesota, 1970-71 to 1979-80.
L 1
m.Tales
I
1.
-33-
.,
For local governments, federal and state revenue sharing increased from 46.9
percent to 50.7 percent of total Minnesota local revenues in the 10-yearperiod
from 1970 to 1980. For the U.S., the correspondingincreases were from 37.5
percent to 43.3 percent. Froperty taxes, on the other hand, declined more rapidly
in Minnesota than in the U.S., particularlyin the 1970-75 period.
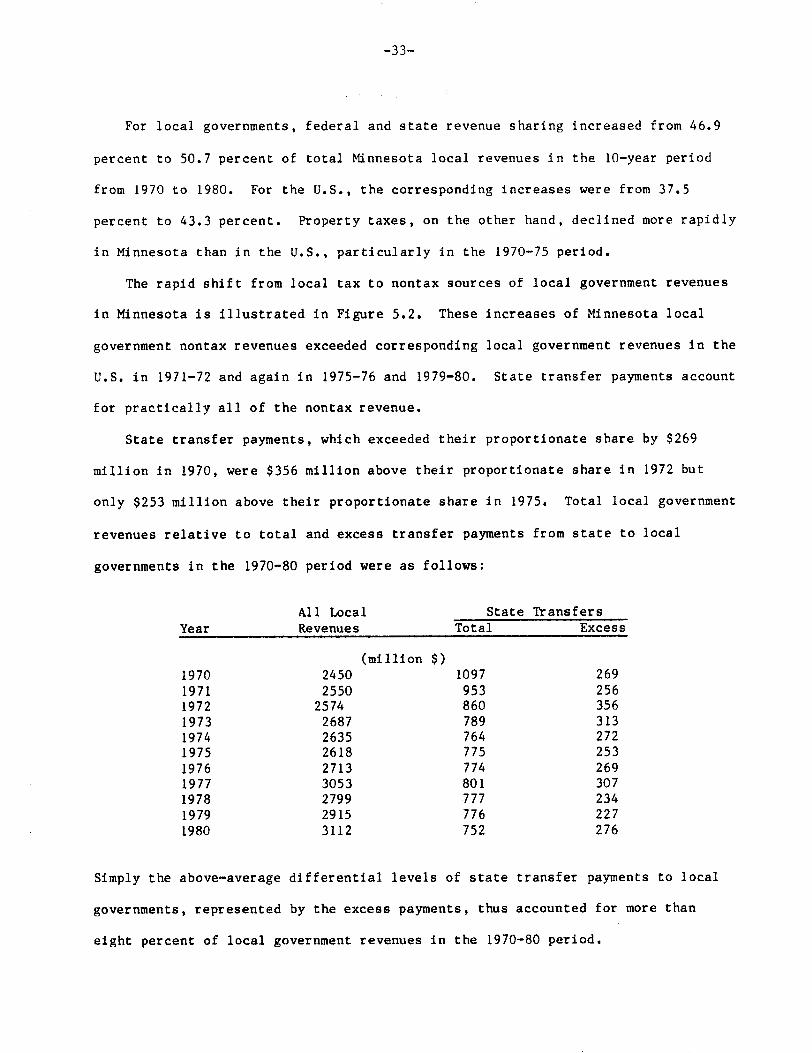
The rapid shift from local tax to nontax sources of local government revenues
in Minnesota is illustratedin Figure 5.2. These increases of Minnesota local
government nontax revenues exceeded corresponding local government revenues in the
U.S. in 1971-72and again in 1975-76 and 1979-80. State transfer payments account
for practicallyall of the nontax revenue.
State transfer payments, which exceeded their proportionateshare by $269
million in 1970, were $356 million above their proportionateshare in 1972 but
only $253 million above their proportionateshare in 1975. Total local government
revenues relative to total and excess transfer payments from state to local
governmentsin the 1970-80period were as follows:
All Local State TransfersYear Revenues Total Excess
19701971197219731974197519761977197819791980
(million $)2450 10972550 9532574 8602687 7892635 7642618 7752713 7743053 8012799 7772915 7763112 752
269256356313272253269307234227276
Simply the above-averagedifferential levels of state transfer payments to local
governments,represented by the excess payments, thus accounted for more than
eight percent of local government revenues in the 1970-80 period.

.
-34-
Figure 5.2. Relative yearly change in taxes, intergovernmental,and othersources of revenue due to regional-share, effect, localgovernments, Minnesota, 1970-71 to 1979-80.
‘t-fra-
W
n .xNTERWERNNENTRL
m
- 7AXE5
r-n
J-lI
I
.—. r
-:>2’30’ .—..-.—-.1’770- ‘ii- 3-’-” .4
— -.. . . . . . . . . . . . . .
1,;,,3-,2- ,q.7q-”--;;.,~- ICf-ic )577- l~7a- i?7°-
11 -r> 72 -1U 7.5 ~Q l; ~: -f~ ~~
-35-
Expendi.turePatterns
Consolidatedstate
for 23 functionalareas
and local government expendituresare summarized
in Table .5.3. First, current expendituresin
Minnesota are comparedwith correspondingexpendituresin the U.S.
The largest expenditure category is clearly local schools. Notable in
these comparisons is the virtually constant per capita level of expenditures
(in 1972 dollars) for both local schools and higher education in Minnesota.
While total per capita expendituresfor all public education increased in
Minnesota from $359 in 1970 to $377 in 1980, the correspondingincrease in
the U.S. was from $286 to $336.
The public welfare and health care areas account for the largest
expenditure increases in Minnesota, but not in the U.S. Total per capita
expendituresfor the two areas increased from $140 to $420 in Minnesota and
from $160 to $214 in the U.S. This increase of $280 accounts for two--thirds
of the total increase in Minnesota per capita state and local government
expendituresin the 1970-80 period.
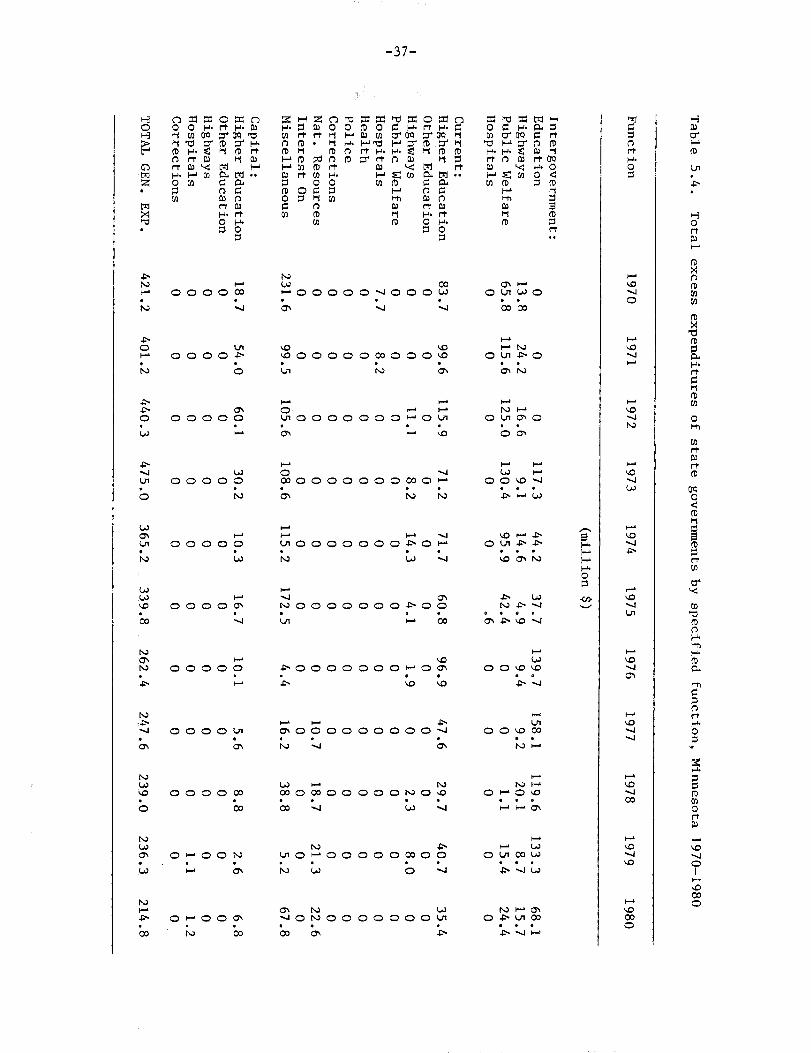
Variances in the distributionof total state government expenditures
among the 23 functional areas listed earlier are representedby total excess
expendituresin Table 5.4. An excess expenditure is the portion of tcjtal
expendituresin a functionalarea which is in excess of the level based on
the correspondingU.S. distribution. For example, the total
intergovernmentaltransfer from state to local governmentsin 1980 was
$108.2 million above the reference level based on the U.S. percentage
distributionof total state and local expenditures.
excess transfer payment of $276 million relative to
State transfer payments exceeded the U.S. reference
(This compares with an
total local revenues).
levels for highways

-36-
Table 5.3. Per capita state and local governmentand U.S., 1970, 1975, and 1980.
expenditures, Nlixmesota
Functional Minnesota United StatesArea
1970 1975 1980 1970 1975 1980
(dollars)
Capital:Local SchoolHigher EducationOther EducationHighwaysHealth & Hos.SewerageWater SupplyOther Utility
4/TOTAL –
26090103753411986313121632102
4830
51383
941
25710417142675329910422152238126
331336752453
1068
264991517924156321215548193155152
2066614102593529135812131728109
24 2716
;/ 265 666 622 109 76 8
1367 856
2197617102673534147814142037132
2311251714811
934
23387171318438371611923182443134
1991
48617919
1042
U.S. Bureau of the Census, Government Financing 1970-71 (and lateryears), U.S. Government Printing Office, Washington,D.C.
Miscellaneousexpendituresinclude libraries,veteran services, airand water transportation,housing and urban renewal, general publicbuildings, social insurance administration, all other and unallowableexpenditures.
50 cents or less.
Individualentries may not sum to total because of
Breakdownbetween current and capital expendituresthese areas.
rounding.
not available for
-37-
nlrtnlw Ii’o P.30
!3
in t-o ~ g.:m5 o“
5I-t. .
F0000OJ
●
4
G+00000 -JOO Ot%. ● ,m --l w
Ozrao● *cam
0000Eb
QGO 0000 03000 z● ● .u-l t+ m
w
+oCoooooooocno :. ●
m N “M0000:
●N
+00000
●
u h) U-J
w
20000000.F-O ‘s● . .U + co
0000;●
4
.POoooooowo %. ● 0-b am
LJOowa00000
●
f-
wl-coomoooooIvo s. . .*CO-J w+
Oooom●
co
01-C)ON. .F m
m+ONOOOOOOO :. .cam “*
0+000. .IQ CQ

-38-
and public welfare, as well as local schools. Current expenditures exceeded the
U.S. reference levels in the higher education, highways, natural resources, and
miscellaneous functional areas. All other functional areas accounted for a
less-than-proportionate share of total state governmentexpenditures.
Year-to-year changes in the Minnesota state government expenditures,relative
to correspondingstate government expenditures in the U.S., are illustratedin
Figure 5.3. Transfers to local governmentsare separated from all other current
expendituresof Minnesota state government to show their large relative growth.
Large relative increases occurred in state government transfer payments to
education, i.e., local schools, in 1971-72, 1972-73, 1974-75, 1975-76,and
1976-77,to highways in 1970-71, 1975-76, 1977-78,and 1979-80,and to public
welfare in 1970-71, 1972-73, 1976-77, 1977-78, 1978-79,and 1979-80. Thus, the
distributionof state transfer payments among functional areas in the 197-80
period varied sharply from the U.S. reference distribution.
Direct current expendituresof Minnesota state government also varied
sharply from year-to-yearrelative to state governmentexpenditures in the U.S.
Generally positive differential changes occurred for other education, highways,
public welfare, interest on state debt, and miscellaneousstate expenditures,the
largest
for the
changes
positive differentialchange occurred (of $103 million) for public welfare
1974-75period. On the other hand, generally negative differential
occurred for higher education. In the 1976-77period, for example, the
change in state government expendituresfor higher education was $49 million less
than the change based on the corresponding lJ.S.growth rate.
Local government expendituresalso varied sharply from the correspondingU.S.
distribution. Local government
sewerage, parks and recreation,
levels in eight of the 10 years
expendituresfor public welfare, highways,
and interest on local debt attained above-average
in 1970-80period, as shown in Table 5.5.

-39-
Fi.gure 5.3. Relative yearly changes in current, capital, and transferexpenditures due to regional-share effect, state government,Minnesota, 1970-71 to 1979-80.
1-
I
I150JGO+
!r 1
I 1
I

-40-
Ld.sw Ooulcnsooo● .,,* .x*-
% in b.)+ 00C9 l--oo N. . .b Ou-s “m
Ea 00 EL42000. . . .WI *col-
.st-+ oouo~oobl. ● O .Q mu L1
.
b-l 03 Wlm o
Ni-- +
OIWOO*OOOO:O Sooo, ● ● *.s u Wwl
P.o!3
+●L+O-WONOAL.J %Ooo. . . . .CCJON.SOF wok)
1-
-
O:ulcor+omoo$o Sooo● ..*. .0
*OUWN U30Y
Wlvl-uWo
L,ECmowootio+oo o.**.* ● . .u-lchN.E%l o # w
0.
WI.
w.f-rG*mm0m
.
i-hM.
hla
m
c
g
t-t
P.
0
s*
ii“

Below-averagelocal governments expenditureswere reported in at least eight of
the 10 years for higher education, health and hospitals,police, fire protection,
and other sanitation.
Year-to-year changes in 10cal government expendituresrelative to
correspondinglocal government expenditures in the”U.S.)were generally positive
for public welfare, health and hospitals, highways, police, fire protection,
sewerage, other sanitation,
miscellaneousexpenditures.
occurred for local schools.
p~rks and recreation, general control, and
qenerally,negative year-to-year differential changes
~hus, in the 1970-80 period, local governmental
expendituresincreased, relative to correspondinglocal government expendituresin
the U.S., in all functional areas, except local schools. Public welfare
~expenditures,on the other ha d, were the largest, relative to correspondinglocal
government expenditures in th~ U.S.
Capital Spending
Capital spending by state landlocal governments in Minnesota increased from
$165 per capita in 1970 to $2$4 per capita in 1980.
capital spending declined, as shown earlier in Table
{1970 to $144 per capita in 19 0. It declined, also,
government expenditures-- fr~m 19.9 percent in 1970
However, in constant dollars,
5.3., from $187 per capita
as relative to total local
to 10.5 percent in 1980.
in
Capital spending of state landlocal governments increased, also, in current
dollars, but declined in cons~ant dollars from $142 per capita in 1970 to $128 per
jcapita in 1980. Relative to otal local government expenditures the decline was
from 16.6 to 12.3 percent -- ~ somewhat slower decline than in Minnesota. Thus,
jlocal government capital spen ing trends are outpaced by inflation, which means
that spending in real terms h~s declined. The reduced spending has curtailed

-42-
constructingnew public facilitiesas well as maintenance of existing facilities.
Capital spending for higher education as well as local schools, declined sharply (in
real dollars) in both Minnesota and the U.S. Spending on highways in both state
governments declined, but it increased for local governments, as shown in Table
5.6. Largest increases were reported by local governments for water supply,
sewerage, and other public utilities.

,..
Table 5.6. Per capita ca~functionalarc1970, 1975, al
FunctionalArea
Minnesota:
Local Schools
Higher Educ.
Other Educ.
Highways
Health & Hosp.
Corrections
Sewerage
Water Supply
Other Utility
Total
United States:
Local Schools
Higher Educ.
Other Educ,
Highways
Health & Hosp.
Corrections
Sewerage
Water Supply
Other Utility
Total
1/– U.S. Bureau of the Censt
U.S. Government Printing
~’Miscellaneousexpendituxwater transportation,hcsocial insurance adminis
-43-
:al expenditures (in 1972 dollars) in specified
;, by +~vel of government, Minnesota and U.S.,
1980.–
State Government1970 1975 1980
Local Government
1970 1975 1980
(dollars)
o
20
y
54
1
1
0
0
0
76
0
73
2
66
2
1
0
0
0
74
0
14
~/
33
1
~f
o
0
0
48
0
8
2
38
2
1
0
0
0
51
0
9
~1
42
3
2
0
0
0
56
0
6
2
37
2
1
0
0
0
48
48
0
0
27
4
0
13
8
3
103
26
3
0
12
3
0
10
7
8
69
33
0
0
29
5
0
24
5
3
99
23
2
0
12
4
0
14
8
11
74
24
0
0
32
3
0
22
9
6
96
19
3
0
13
5
0
17
7
19
83
Government Financing 1970-71 (and later years),ffice, Washington, D.C,
include libraries, veteran services, air and
ing and urban renewal, general public buildings,
ation, all other and unallowable expenditures.
-44-
!-
NNIUNNU-. ooma-w.Owuma. . . . .
w-wow
mwulcm. . . .
o*w -
COmcoo. . . .
au blbl

1“
-45-
1,.
.>aco.JmmDGJw-
. . . . . . . . .?Qm.lmuc-LJN-
. . . . . . 0..
.000
I
I
I
I ,.
,,
u:.ua.
H:!-(H
I .,

-46-
~ppendi.xTable3, Civilian~?nagriculturalEmploymentin SpecifiedIndustry,Minnesota,1980-1985-
Industrv Estimated ProjectedXo, Title 1980 L981 1982 1983 1984 1985
(number)
1.2.
3.4.5,6.7.8.9.10.11.12.
13,14.15.16.17,18.19.20.21.22.23.24.25.26.27.28.29.30.31.
MiningConstruction
Mfg., Nondurable
Food ProductsTobaccoTextile Prod.ApparelPaper Prods.Printing & Publ.ChemicalProd.PetroleumProd.Rubber Prod.Leather Prod.
Mfg., Durables:
Lumber, WoodFurnitureStone, Clay, GlaesPrimaryMetalsFabr. MetalaNonelectricalElectr.Mach.Trans. Equip.Contr. Instr.Misc. Mfg.Tran., Corn,, Util.TradeFin., Ins., Real Est.ServicesFed., Civ.State and Local
yt:lJYnagr “
Total, Civilian
1577877474
145193
48509.-
31545842317003366174311649
108822366
228098
116183897915068113743988400273407907280387500
100075444814969583674853179425624117639103154532079363
1557165789
144600
47868--
30835549313793390975541839108832537
221126
10663393884076383364558940925871752327363718997771
430290973623769843135325734017386253178542056479
9684 799063423 63042
137973 139129
46841 46513-. --
2849 29374703 448729030 2964033933 347477233 71171700 171710156 97702276 2201
205985 193064
9287 89903929 38197678 73324927 466633331 3133184297 7561423245 224087156 685525565 256036571 644694165 90963
427326 42818098877 103326384009 39668128962 29222
969066636
150762
47676--
31964662318033690274381741102882289
206870
94213945785354123339982722 -23529750020127696291964451731106736417705‘29982
10990
71300
151037
48057--
33815030
3301338894
79581774
105042426
227603
10166412685996311
3553793476245878512
300557254
91688469800112927442768
30972247200 246953 246953 249196l~;~f;; l~~O;;~ l~;~;;; 1859281
3205552013726 2012941 2096300 2179836
~’Based on unpublisheddata from U,S, Departmentof Commerce,RegionalEconomic InformationSystem and Data Resourcas,Inc., January 1983, Control Forecast Series.
4’Farm and nonfarm proprietorsand farm wage and salary and householdemployment.