stackoverflow 2015 developer survey
TRANSCRIPT

2015Developer Survey
Overview
Developer Profile
Technology
Work
Community
Back to top
Get a better job
26,086 people from 157 countries participated in our 45-question survey. 6,800 identified as full-stack
developers, 1,900 as mobile developers, 1,200 as front-end developers, 2 as farmers, and 12,000 as
Overview
Every year we run a survey. This year, more developers answered more questions than ever
before.
something else.
Code is everywhere, and just about every coder uses Stack Overflow. Every day more coders are finding
great jobs on Stack Overflow Careers.
We conducted this survey to help us better understand our community and to help our community better
understand itself. For 2 weeks in early February we ran ads for the survey on Stack Overflow, posted it on
Meta Stack Overflow, and shared it across social media.
These results are not unbiased. Like the results of any survey, they are skewed by selection bias, language
bias, and probably a few other biases. So take this for what it is: the most comprehensive developer
survey ever conducted. Or at least the only one that asks devs about tabs vs. spaces.
See the link in the footer to download the full data set.
I .G E O G R A P H Y
Developer Profile
Who codes? Where do developers live? Are developers programmers and are programmers
developers? Let's talk demographics.
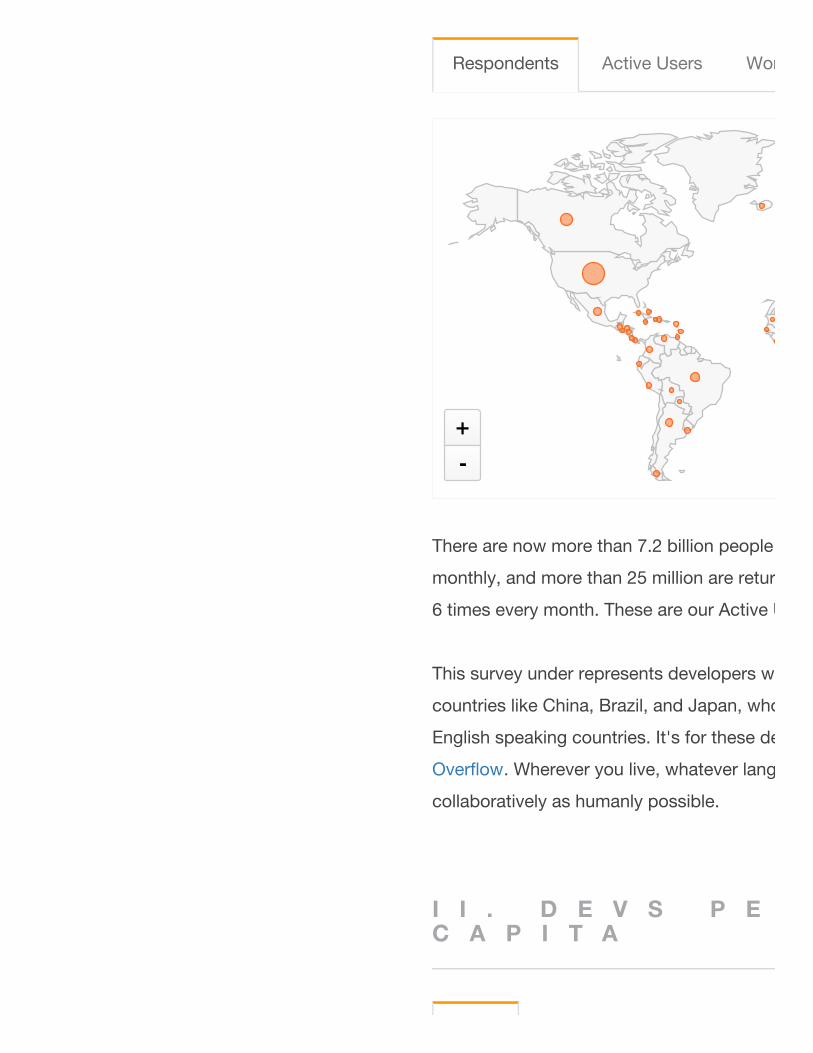
There are now more than 7.2 billion people on planet Earth. About 32 million of them visit Stack Overflow
monthly, and more than 25 million are return visitors. Return visitors land on Stack Overflow an average of
6 times every month. These are our Active Users in the map above.
This survey under represents developers who don't like to take English surveys. It's biased against devs in
countries like China, Brazil, and Japan, who participate on Stack Overflow less than devs in other non-
English speaking countries. It's for these devs that we've started to launch
Overflow. Wherever you live, whatever language you speak, we want to help you build as efficiently and
collaboratively as humanly possible.
I I . D E V S P E RC A P I T A
Respondents Active Users World Population
+-
60+
51-60
40-50
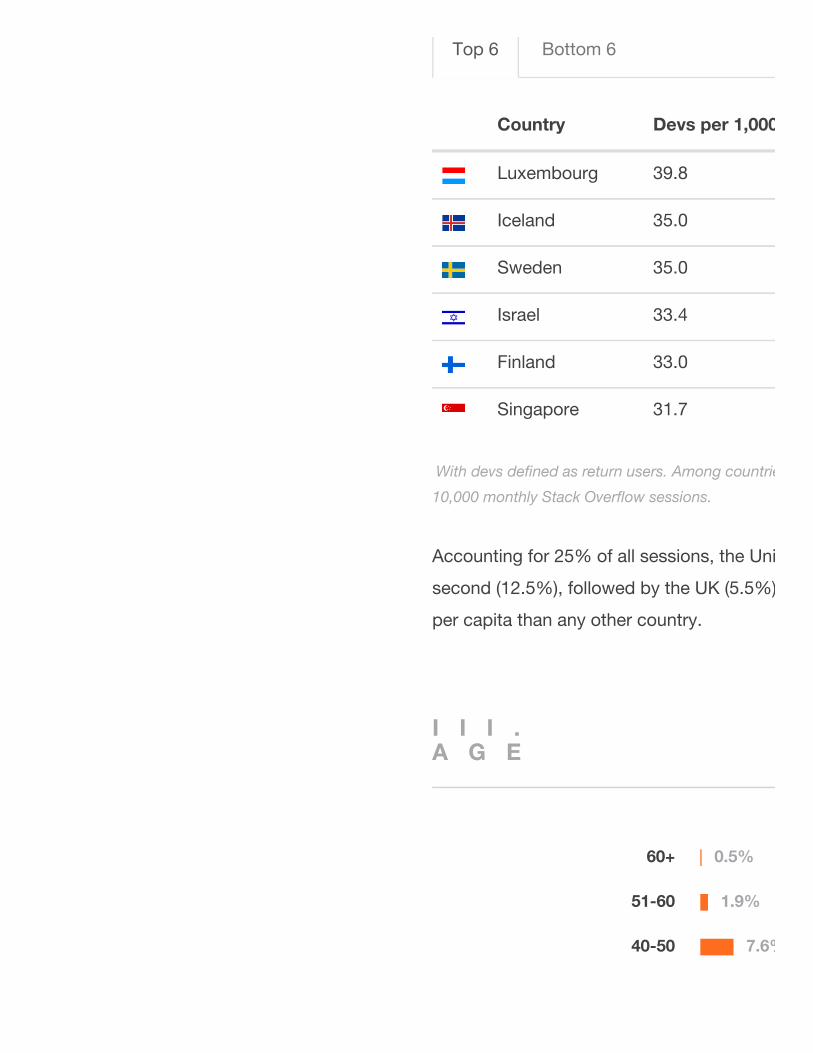
Accounting for 25% of all sessions, the United States is the top traffic source to Stack Overflow. India is
second (12.5%), followed by the UK (5.5%), and Germany (4.2%). But Luxembourg delivers more uniques
per capita than any other country.
I I I .A G E
Top 6 Bottom 6
Country Devs per 1,000 people
Luxembourg 39.8
Iceland 35.0
Sweden 35.0
Israel 33.4
Finland 33.0
Singapore 31.7
With devs defined as return users. Among countries with at least
10,000 monthly Stack Overflow sessions.
0.5%
1.9%
7.6%
35-39
30-34
25-29
20-24
< 20
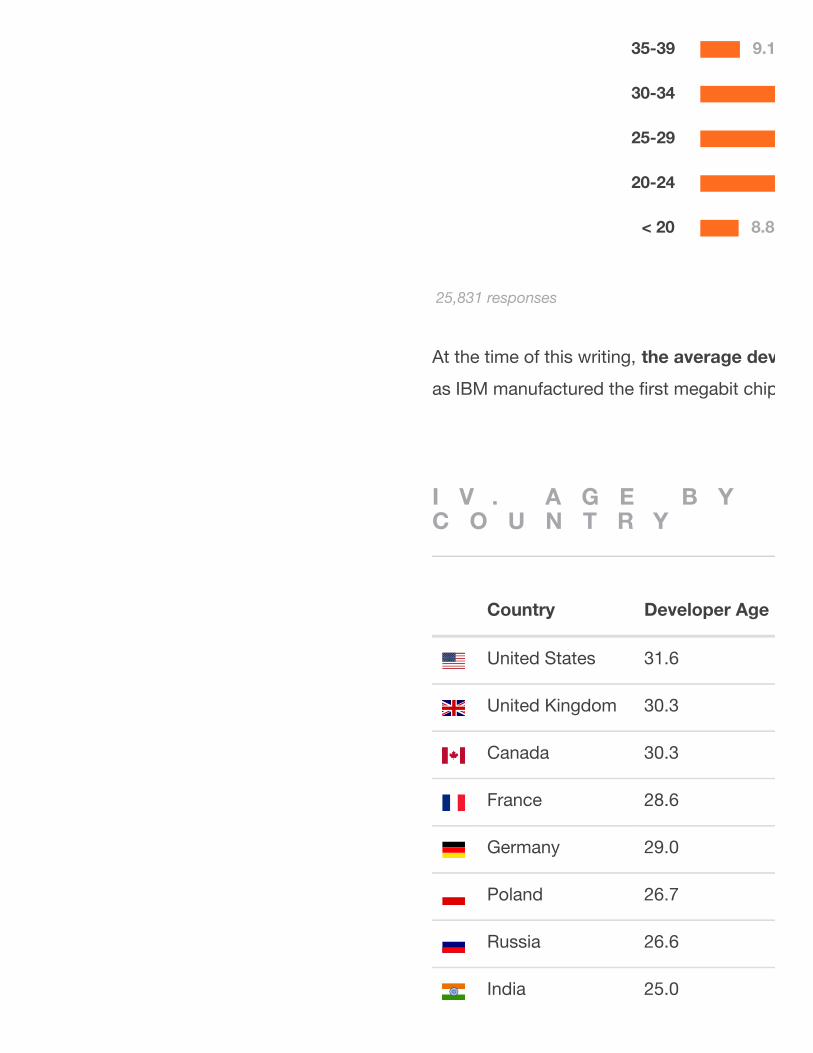
At the time of this writing, the average developer is 28.9 years old
as IBM manufactured the first megabit chip.
I V . A G E B YC O U N T R Y
9.1%
8.8%
25,831 responses
Country Developer Age (avg.)
United States 31.6
United Kingdom 30.3
Canada 30.3
France 28.6
Germany 29.0
Poland 26.7
Russia 26.6
India 25.0
Male
Female
Prefer not to disclose
Other
11+ years
Programmers are especially young in developing countries like India, where the average developer is just
25 years old.
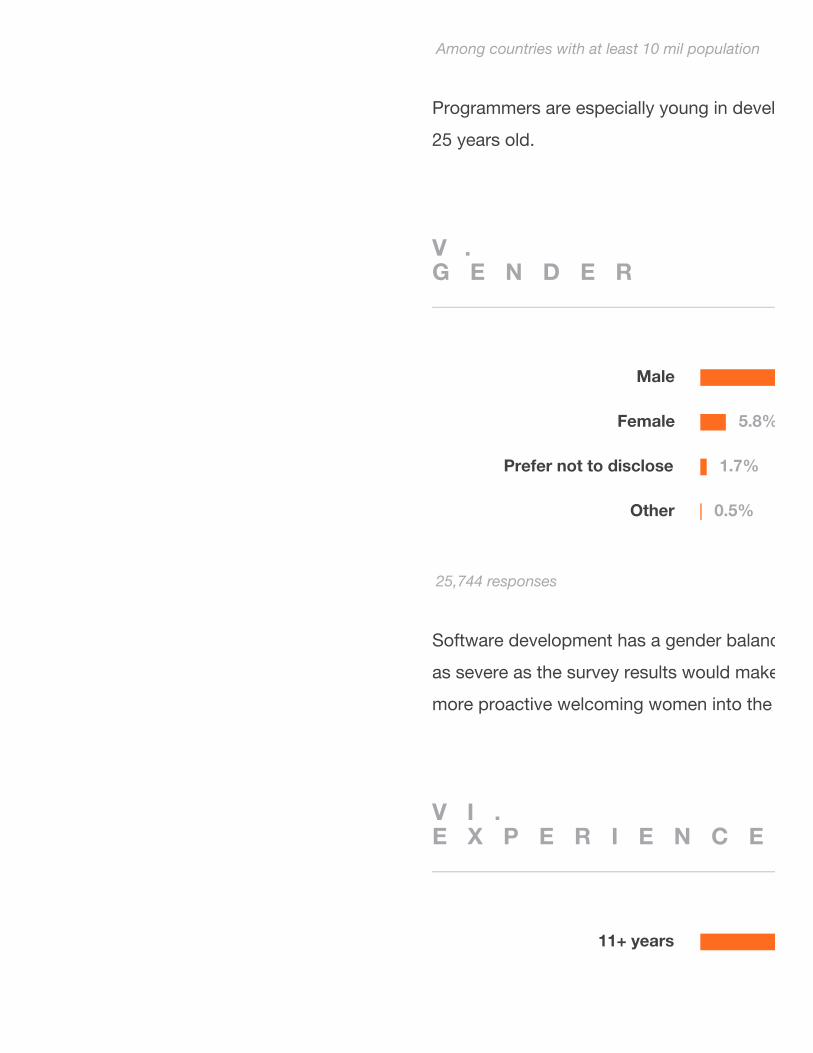
V .G E N D E R
Software development has a gender balance problem. Our internal stats suggest the imbalance isn't quite
as severe as the survey results would make it seem, but there's no doubt everyone who codes needs to be
more proactive welcoming women into the field.
V I .E X P E R I E N C E
Among countries with at least 10 mil population
5.8%
1.7%
0.5%
25,744 responses
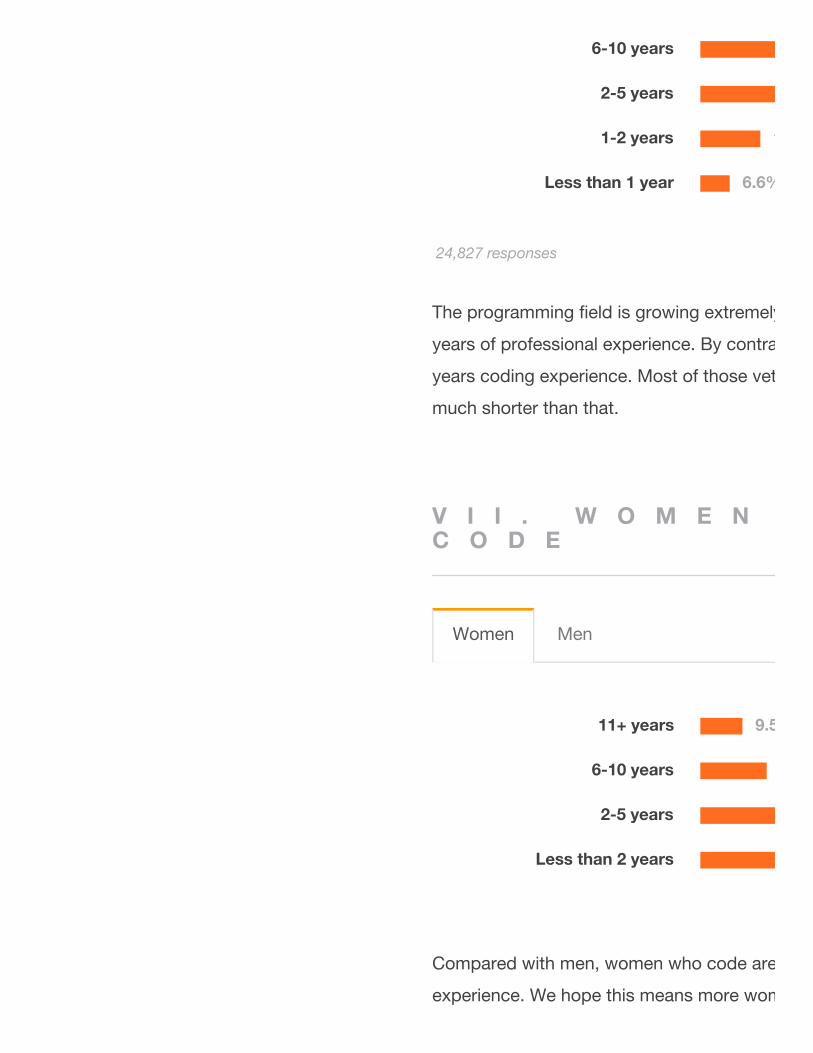
6-10 years
2-5 years
1-2 years
Less than 1 year
11+ years
6-10 years
2-5 years
Less than 2 years
The programming field is growing extremely rapidly. In the United States, nearly 40% of doctors have 10+
years of professional experience. By contrast, only about 25% of developers worldwide have more than 10
years coding experience. Most of those veteran developers have probably been coding
much shorter than that.
V I I . W O M E N W H OC O D E
Compared with men, women who code are nearly twice as likely to have less than 2 years programming
experience. We hope this means more women are joining the industry and closing the gender gap.
13.6%
6.6%
24,827 responses
Women Men
9.5%
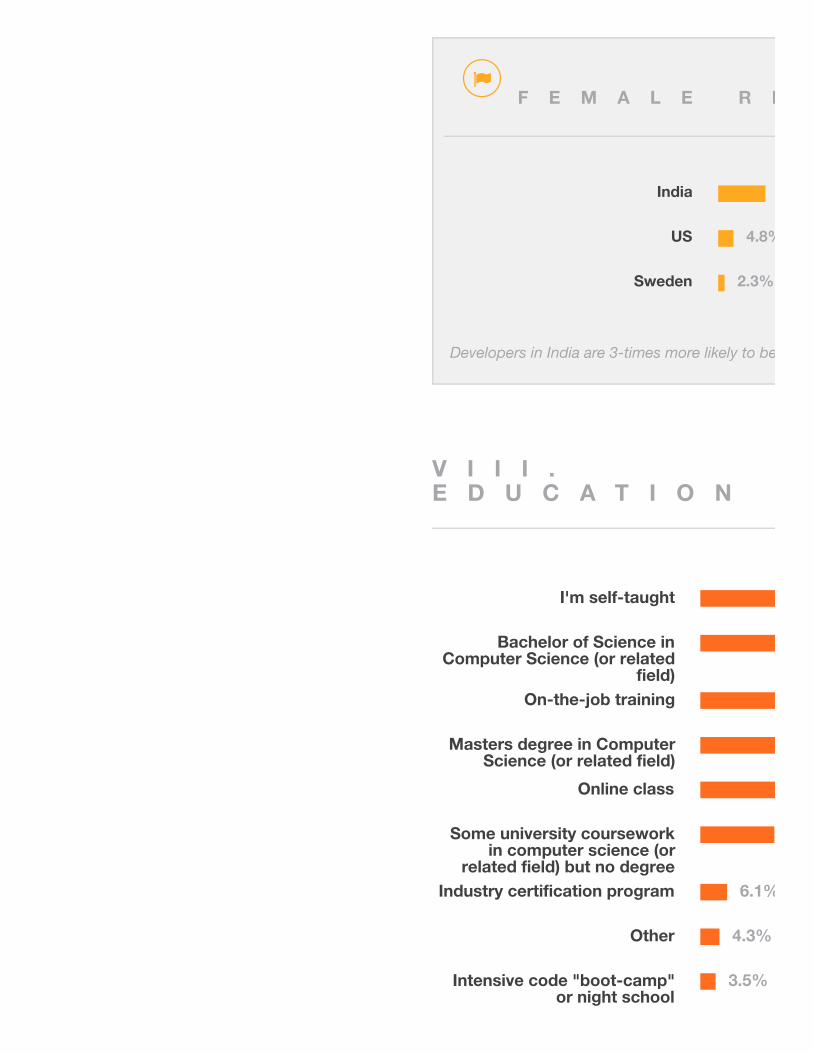
I'm self-taught
Bachelor of Science inComputer Science (or related
field)On-the-job training
Masters degree in ComputerScience (or related field)
Online class
Some university courseworkin computer science (or
related field) but no degreeIndustry certification program
Other
Intensive code "boot-camp"or night school
V I I I .E D U C A T I O N
F E M A L E R E S P O N D E N T S B Y G E O G R A P H Y
India
US
Sweden
4.8%
2.3%
Developers in India are 3-times more likely to be female than developers in the United States.
6.1%
4.3%
3.5%
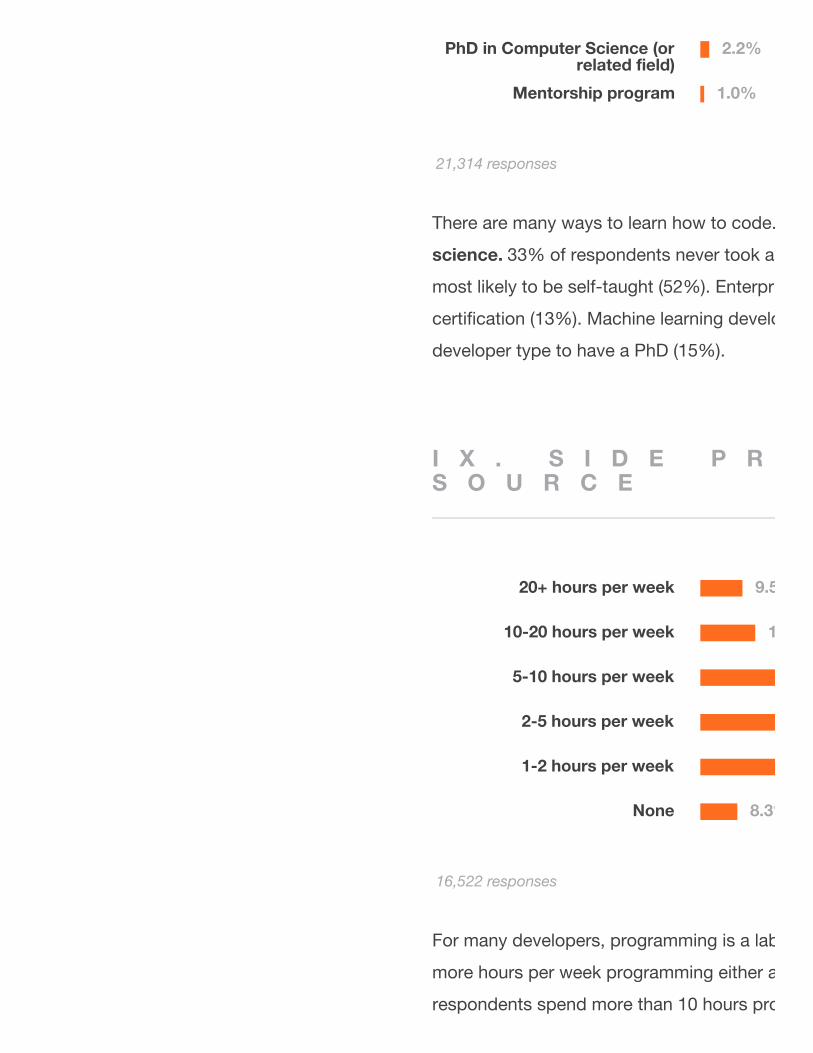
PhD in Computer Science (orrelated field)
Mentorship program
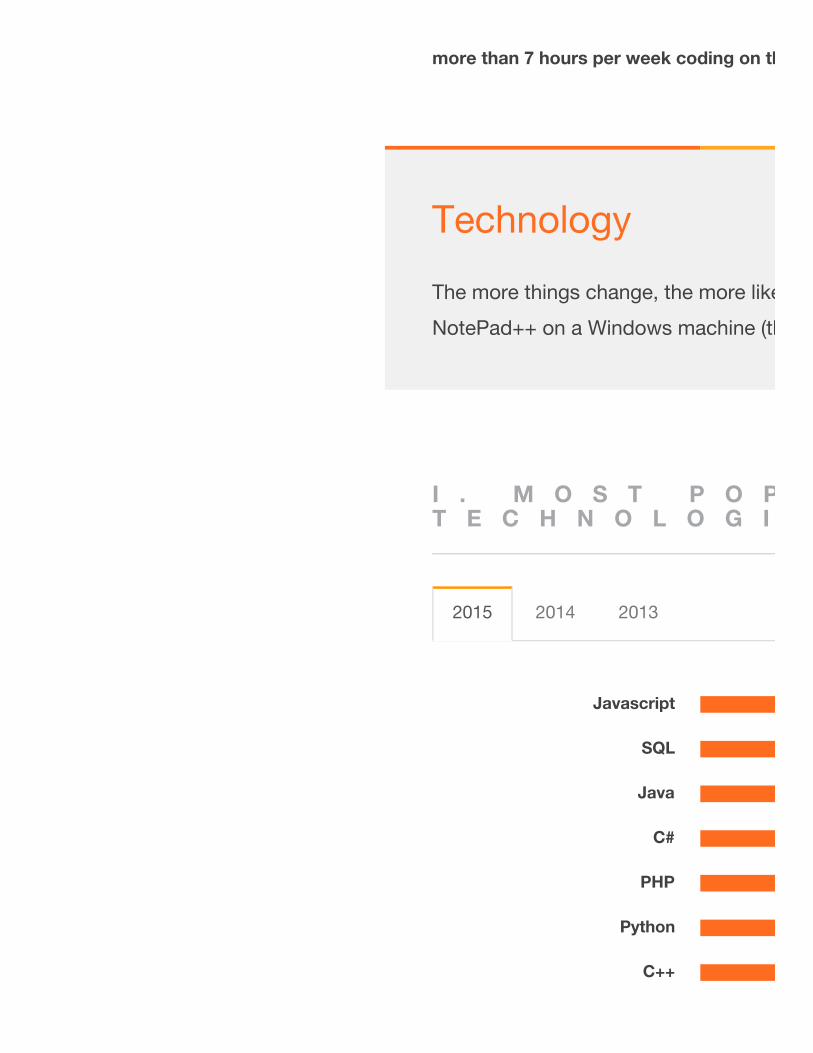
20+ hours per week
10-20 hours per week
5-10 hours per week
2-5 hours per week
1-2 hours per week
None
There are many ways to learn how to code.
science. 33% of respondents never took a computer science university course. System administrators are
most likely to be self-taught (52%). Enterprise level services developers are most likely to have an industry
certification (13%). Machine learning developers and data scientists are 10 times more likely than any other
developer type to have a PhD (15%).
I X . S I D E P R O J E C T S A N D O P E NS O U R C E
For many developers, programming is a labor of love. 70% of respondents reported that they spend 2 or
more hours per week programming either as a hobby or working on open source software. 20% of
respondents spend more than 10 hours programming away from work.
2.2%
1.0%
21,314 responses
9.5%
12.4%
8.3%
16,522 responses
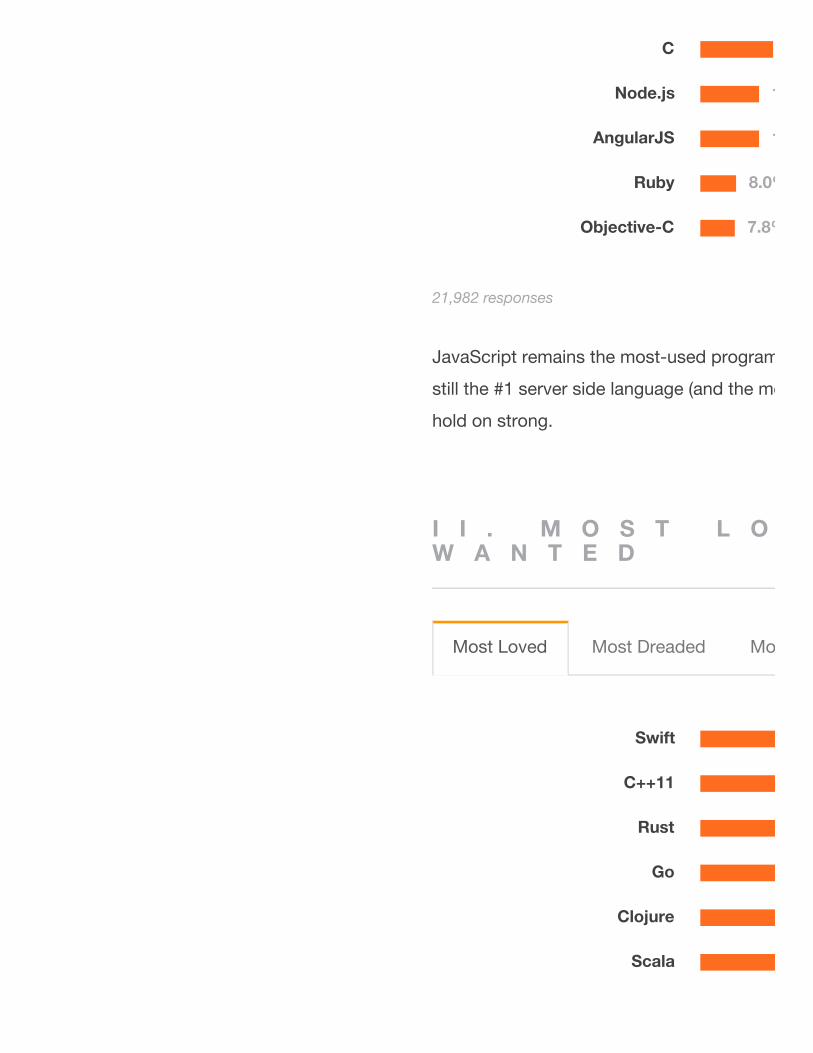
Javascript
SQL
Java
C#
PHP
Python
C++
more than 7 hours per week coding on the side.
I . M O S T P O P U L A RT E C H N O L O G I E S
Technology
The more things change, the more likely it is those things are written in JavaScript with
NotePad++ on a Windows machine (theme: dark) using Git, and tabs instead of spaces.
2015 2014 2013
C
Node.js
AngularJS
Ruby
Objective-C
Swift
C++11
Rust
Go
Clojure
Scala
JavaScript remains the most-used programming language. Node.js and AngularJS are busting out. Java is
still the #1 server side language (and the most frequently used
hold on strong.
I I . M O S T L O V E D , D R E A D E D , A N DW A N T E D
13.3%
13.3%
8.0%
7.8%
21,982 responses
Most Loved Most Dreaded Most Wanted
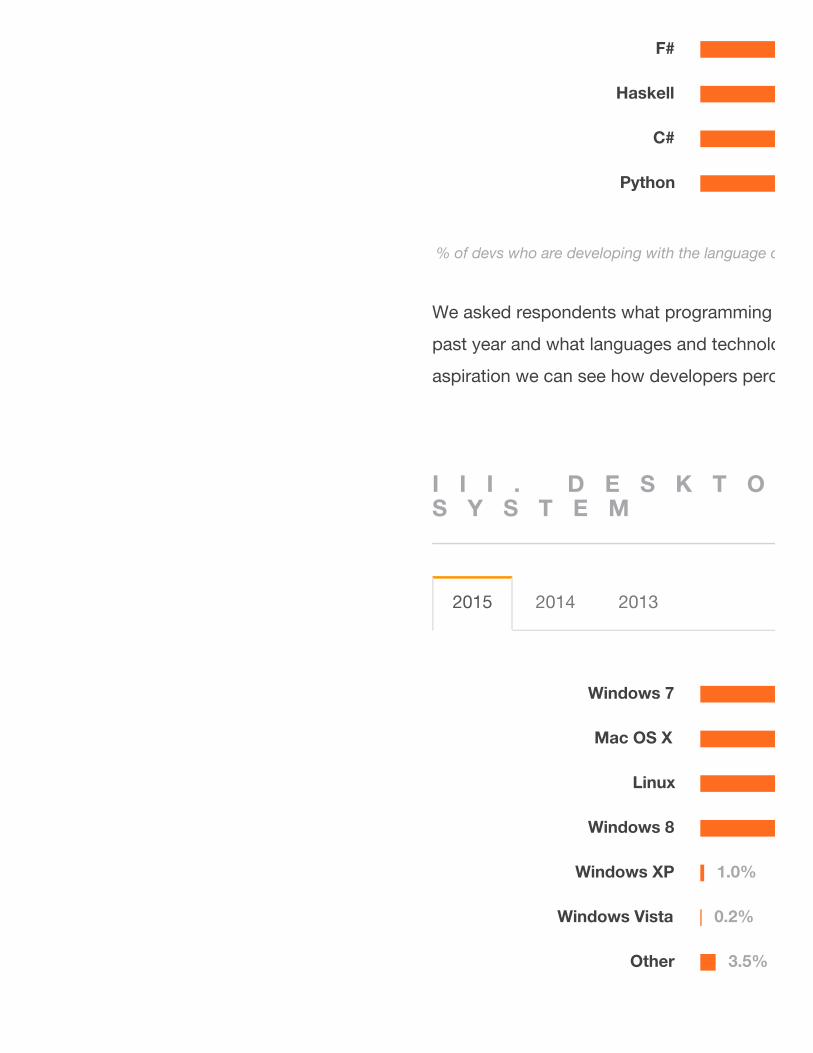
F#
Haskell
C#
Python
Windows 7
Mac OS X
Linux
Windows 8
Windows XP
Windows Vista
Other
We asked respondents what programming languages and technologies they've developed with over the
past year and what languages and technologies they want to develop with. By comparing status quo vs.
aspiration we can see how developers perceive available programming tools.
I I I . D E S K T O P O P E R A T I N GS Y S T E M
% of devs who are developing with the language or tech that have expressed interest in continuing to develop with it.
2015 2014 2013
1.0%
0.2%
3.5%
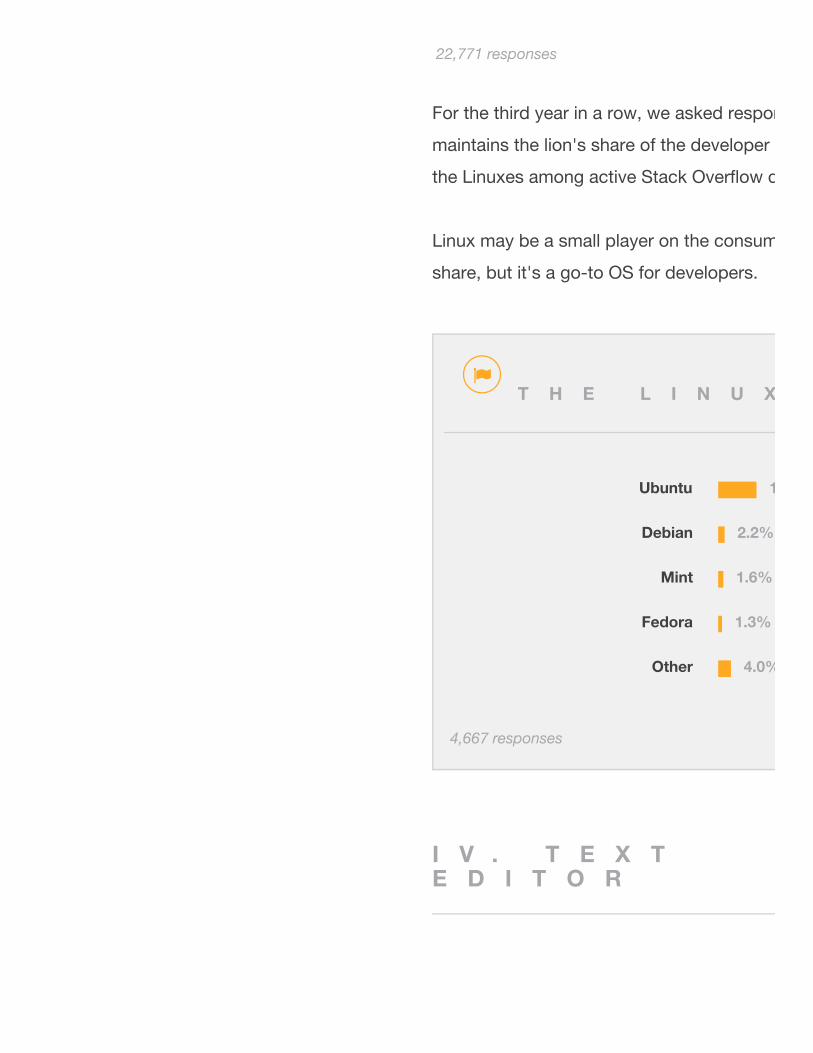
For the third year in a row, we asked respondents which operating system they use the most. Windows
maintains the lion's share of the developer operating system market, while Mac appears to have overtaken
the Linuxes among active Stack Overflow devs.
Linux may be a small player on the consumer market, with just 1.5% of global desktop operating system
share, but it's a go-to OS for developers.
I V . T E X TE D I T O R
22,771 responses
T H E L I N U X E S - D E V S H A R E 2 0 1 5
Ubuntu
Debian
Mint
Fedora
Other
12.0%
2.2%
1.6%
1.3%
4.0%
4,667 responses
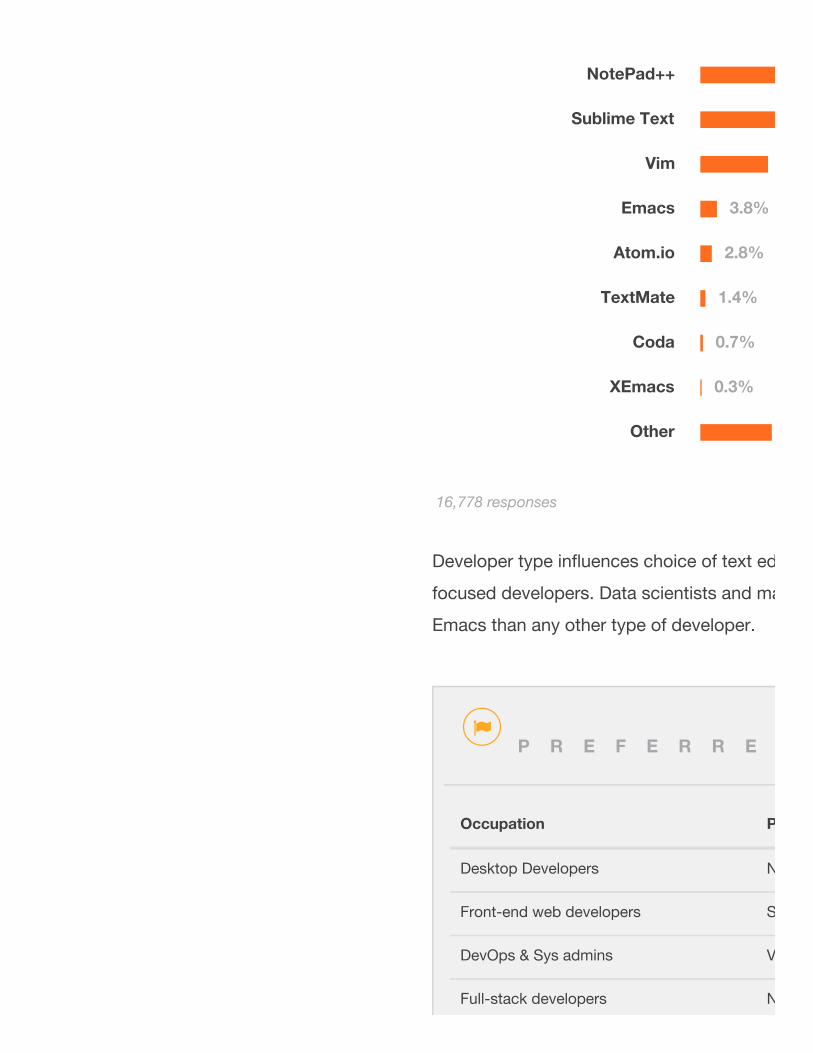
NotePad++
Sublime Text
Vim
Emacs
Atom.io
TextMate
Coda
XEmacs
Other
Developer type influences choice of text editor. Either that or Emacs turns people into mathematics-
focused developers. Data scientists and machine learning developers are about 3 times more likely to use
Emacs than any other type of developer.
3.8%
2.8%
1.4%
0.7%
0.3%
16,778 responses
P R E F E R R E D T E X T E D I T O R B Y O C C U P A T I O N
Occupation Preferred text editor
Desktop Developers NotePad++
Front-end web developers Sublime Text
DevOps & Sys admins Vim
Full-stack developers Notepad++ and Sublime Text
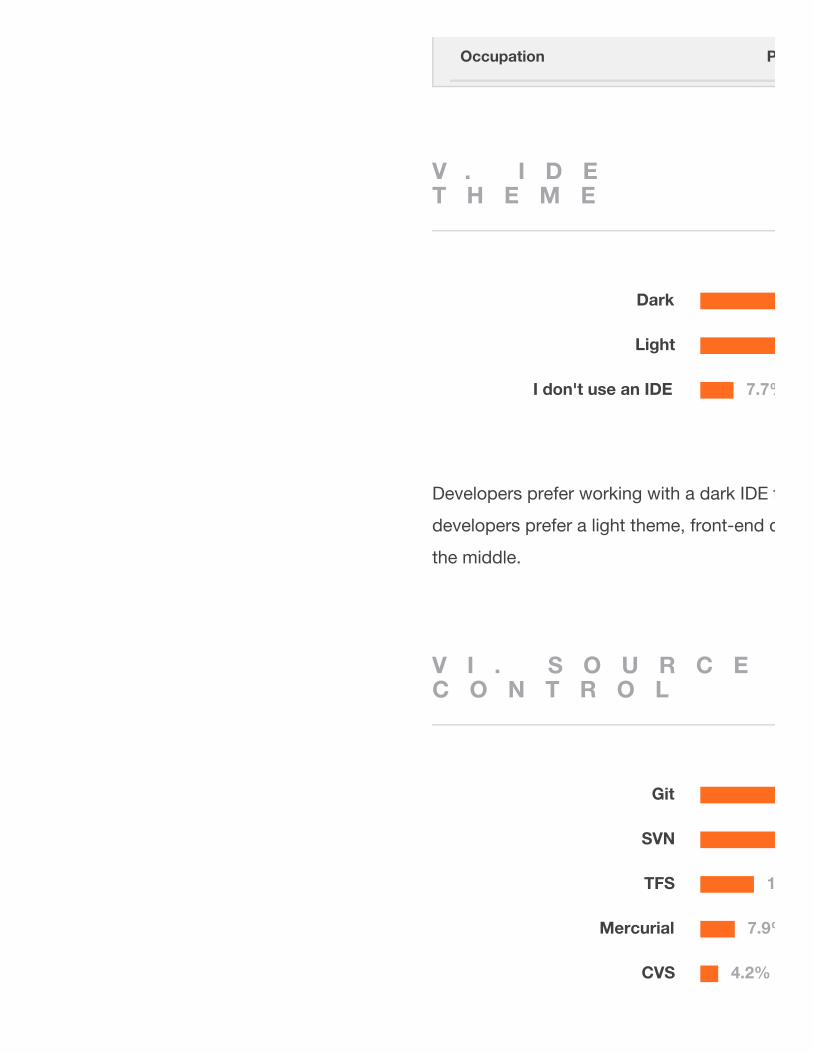
Dark
Light
I don't use an IDE
Git
SVN
TFS
Mercurial
CVS
V . I D ET H E M E
Developers prefer working with a dark IDE theme. We did a little further mining and discovered desktop
developers prefer a light theme, front-end developers prefer dark, and mobile developers are split down
the middle.
V I . S O U R C EC O N T R O L
Occupation Preferred text editor
7.7%
12.2%
7.9%
4.2%
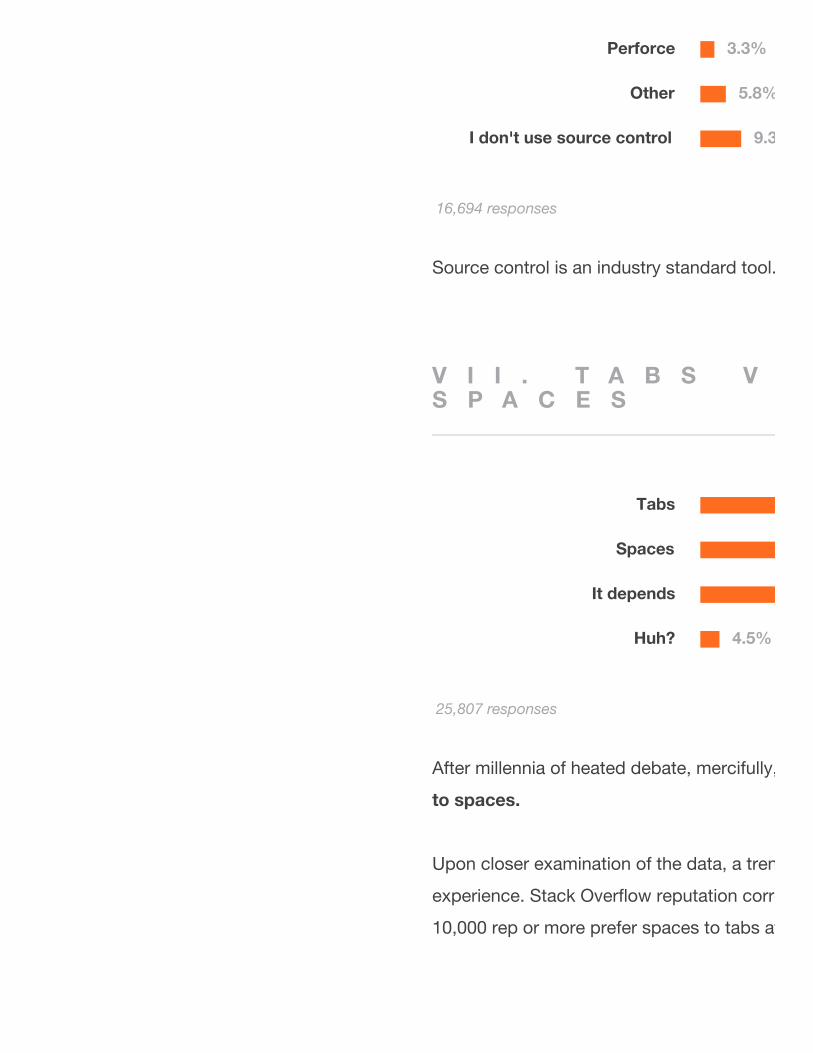
Perforce
Other
I don't use source control
Tabs
Spaces
It depends
Huh?
Source control is an industry standard tool. However, fun fact: about 10% of developers still don't use it.
V I I . T A B S V S .S P A C E S
After millennia of heated debate, mercifully, at long last, we have an answer.
to spaces.
Upon closer examination of the data, a trend emerges: Developers increasingly prefer spaces as they gain
experience. Stack Overflow reputation correlates with a preference for spaces, too: users who have
10,000 rep or more prefer spaces to tabs at a ratio of 3 to 1.
3.3%
5.8%
9.3%
16,694 responses
4.5%
25,807 responses
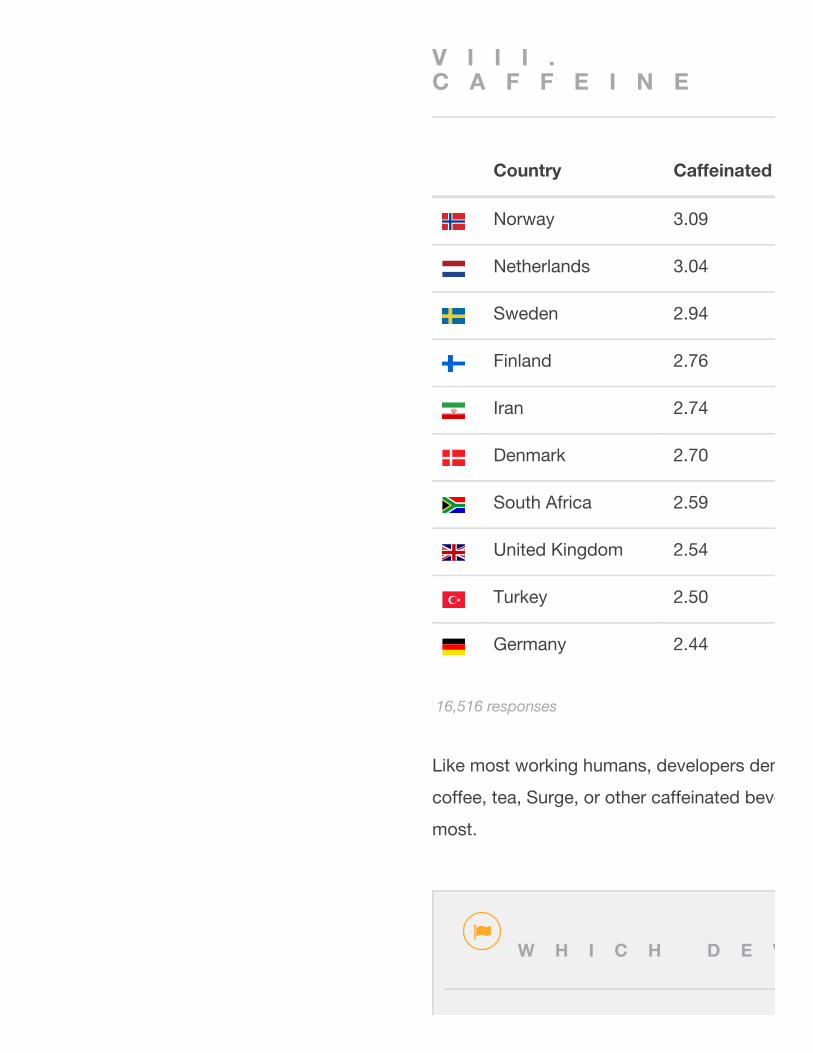
V I I I .C A F F E I N E
Like most working humans, developers demand caffeine. The average developer drinks 2.2 servings of
coffee, tea, Surge, or other caffeinated beverage every day. Nordic devs drink much more coffee than
most.
Country Caffeinated beverages per day (avg.)
Norway 3.09
Netherlands 3.04
Sweden 2.94
Finland 2.76
Iran 2.74
Denmark 2.70
South Africa 2.59
United Kingdom 2.54
Turkey 2.50
Germany 2.44
16,516 responses
W H I C H D E V E L O P E R T Y P E S D R I N K T H E M O S T C O F F E E ?

I .O C C U P A T I O N
Occupation
Product manager
Executive (VP of Eng., CTO, CIO, etc.)
Business intelligence or data warehousing expert
System administrator
Growth hacker
Work
The labor landscape is constantly evolving for those who know how to code. New developer
types are emerging. More developers are going remote (and getting better, higher-paying
jobs because of it). More than most professions, developers enjoy what they do, and it
shows: nearly every developer spends time coding on the side.
2015 2014 2013
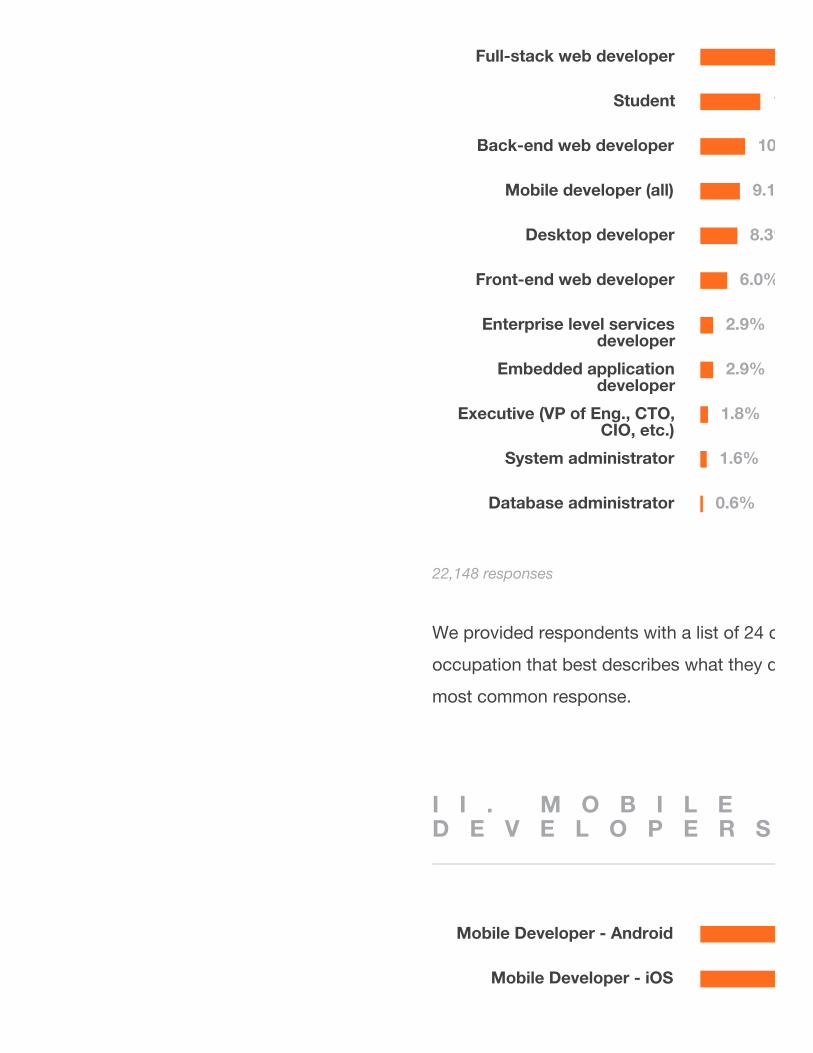
Full-stack web developer
Student
Back-end web developer
Mobile developer (all)
Desktop developer
Front-end web developer
Enterprise level servicesdeveloper
Embedded applicationdeveloper
Executive (VP of Eng., CTO,CIO, etc.)
System administrator
Database administrator
Mobile Developer - Android
Mobile Developer - iOS
We provided respondents with a list of 24 common developer types and asked them to choose the
occupation that best describes what they do. For the third year in a row, "full-stack developer" was the
most common response.
I I . M O B I L ED E V E L O P E R S
13.6%
10.1%
9.1%
8.3%
6.0%
2.9%
2.9%
1.8%
1.6%
0.6%
22,148 responses
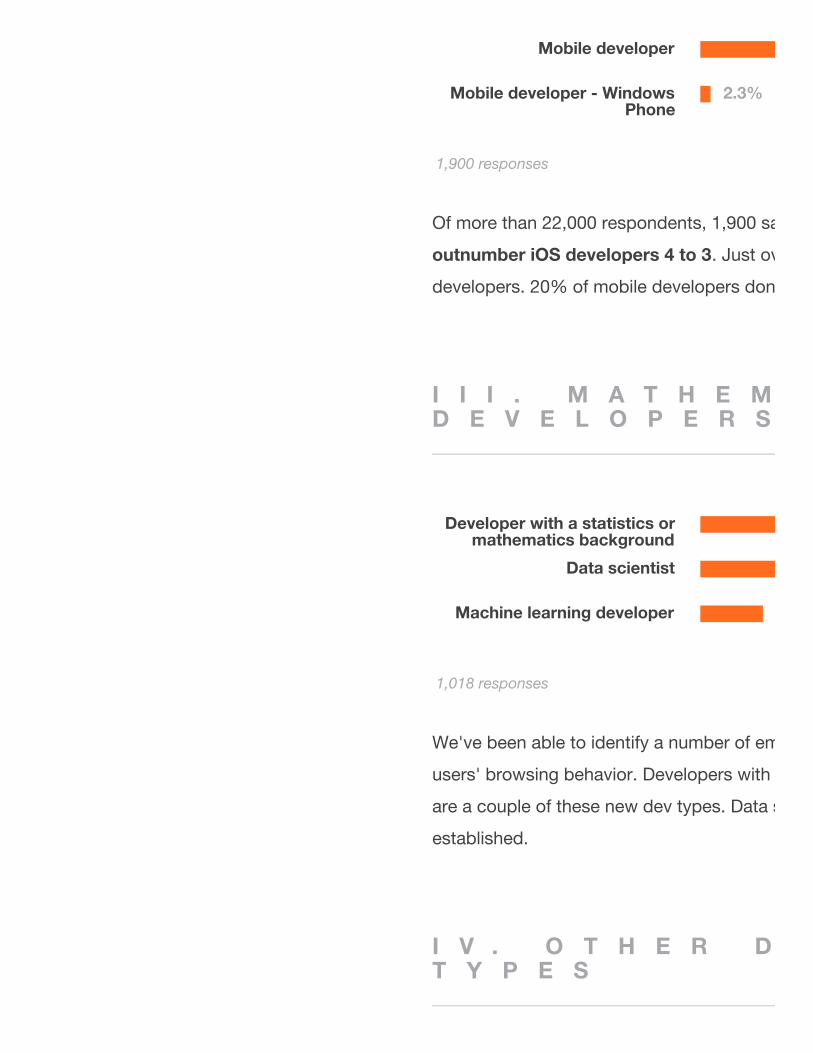
Mobile developer
Mobile developer - WindowsPhone
Developer with a statistics ormathematics background
Data scientist
Machine learning developer
Of more than 22,000 respondents, 1,900 said they are primarily a mobile developer.
outnumber iOS developers 4 to 3. Just over 2% of mobile developers identify as Windows Phone
developers. 20% of mobile developers don't identify with a particular mobile platform.
I I I . M A T H E M A T I C SD E V E L O P E R S
We've been able to identify a number of emerging developer types by observing patterns in Stack Overflow
users' browsing behavior. Developers with a stats and math background and machine learning developers
are a couple of these new dev types. Data scientist is a related developer type that is slightly more
established.
I V . O T H E R D E VT Y P E S
2.3%
1,900 responses
1,018 responses
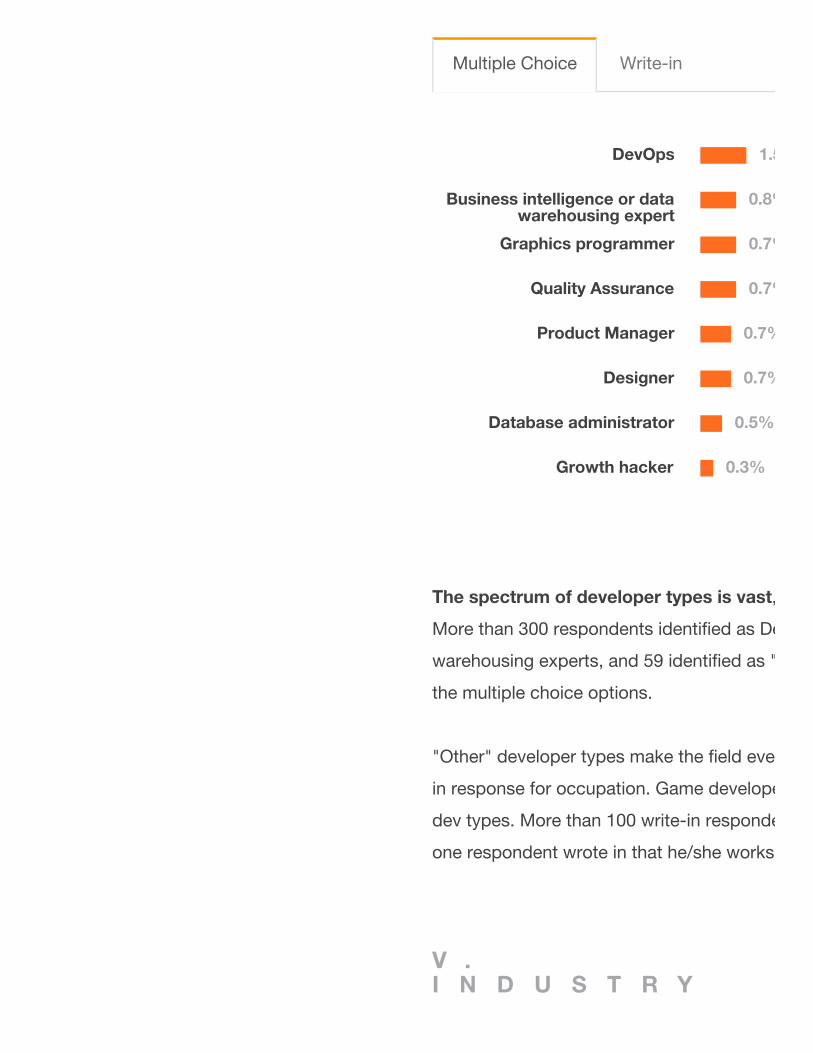
DevOps
Business intelligence or datawarehousing expert
Graphics programmer
Quality Assurance
Product Manager
Designer
Database administrator
Growth hacker
The spectrum of developer types is vast, and it's often unclear where one type ends and another begins.
More than 300 respondents identified as DevOps, nearly 200 identified as business intelligence or data
warehousing experts, and 59 identified as "growth hacker" – the smallest segment of developers among
the multiple choice options.
"Other" developer types make the field even more interesting: nearly 1,600 respondents submitted a write-
in response for occupation. Game developers and designers made up the largest segment among write-in
dev types. More than 100 write-in respondents included multiple dev types in their occupation choice. Only
one respondent wrote in that he/she works with lasers.
V .I N D U S T R Y
Multiple Choice Write-in
1.5%
0.8%
0.7%
0.7%
0.7%
0.7%
0.5%
0.3%
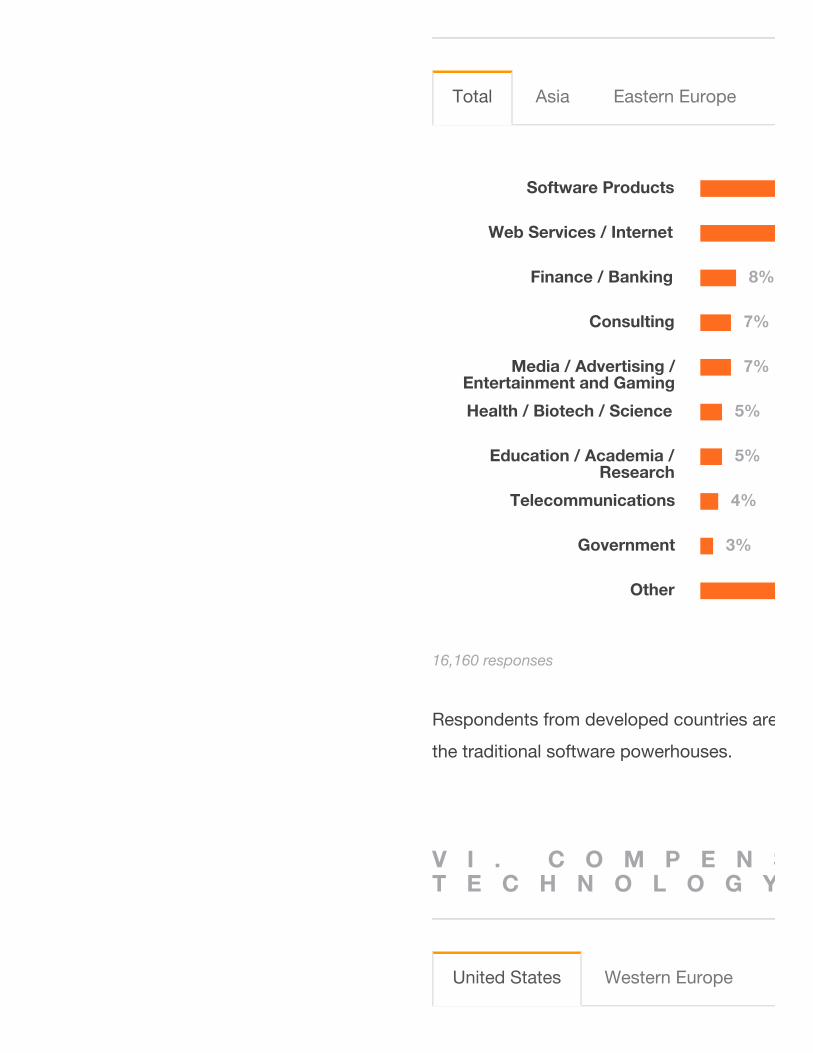
Software Products
Web Services / Internet
Finance / Banking
Consulting
Media / Advertising /Entertainment and Gaming
Health / Biotech / Science
Education / Academia /Research
Telecommunications
Government
Other
Respondents from developed countries are more likely than others to say they work in an industry outside
the traditional software powerhouses.
V I . C O M P E N S A T I O N B YT E C H N O L O G Y
Total Asia Eastern Europe
8%
7%
7%
5%
5%
4%
3%
16,160 responses
United States Western Europe
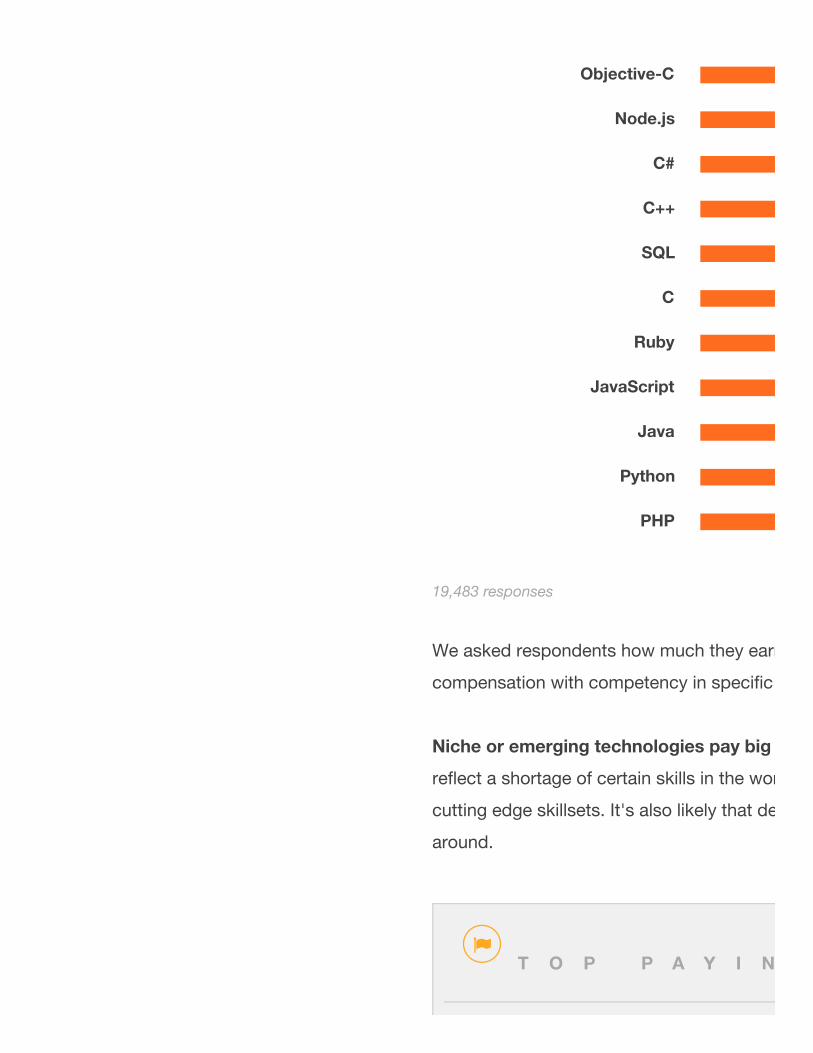
Objective-C
Node.js
C#
C++
SQL
C
Ruby
JavaScript
Java
Python
PHP
We asked respondents how much they earn in US dollars, including bonus. We cross tabulated
compensation with competency in specific technologies to see which tech pays best.
Niche or emerging technologies pay big bucks.
reflect a shortage of certain skills in the workforce – companies are willing to pay more when hiring for
cutting edge skillsets. It's also likely that developers with niche competencies are just better developers all
around.
19,483 responses
T O P P A Y I N G T E C H N O L O G I E S
V I I . C O M P E N S A T I O N B Y P U R C H A S I N GP O W E R
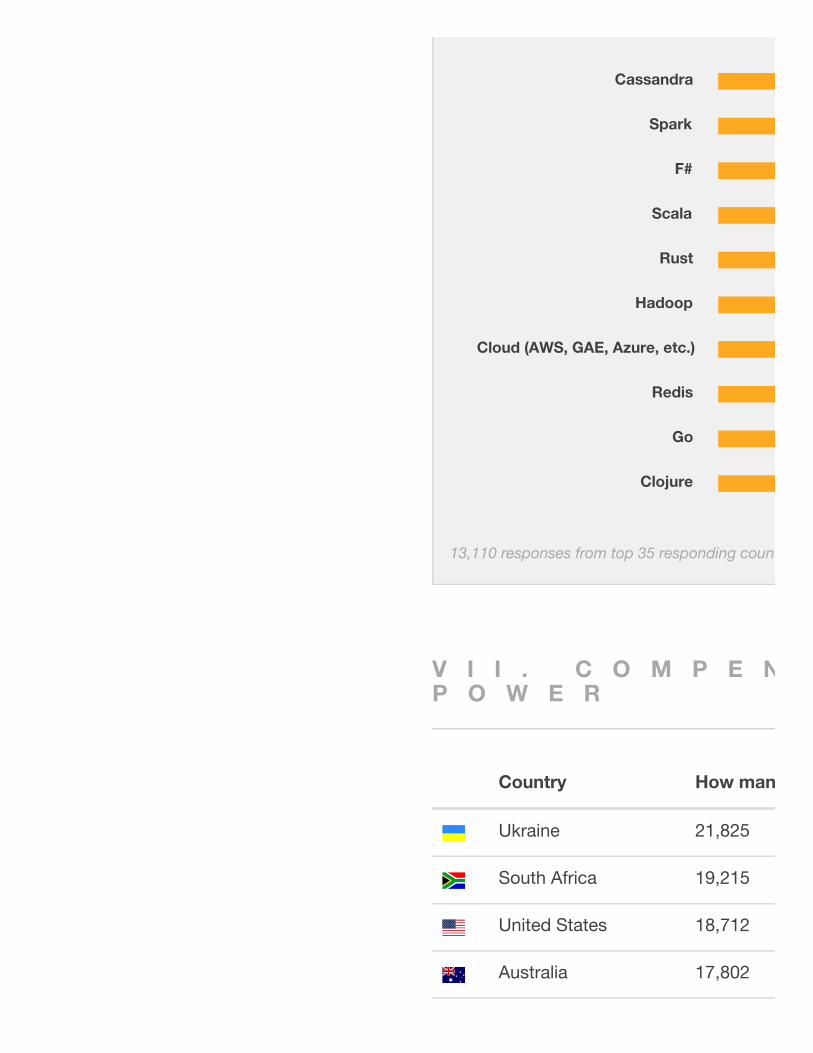
Cassandra
Spark
F#
Scala
Rust
Hadoop
Cloud (AWS, GAE, Azure, etc.)
Redis
Go
Clojure
13,110 responses from top 35 responding countries. Average salary calculated per country.
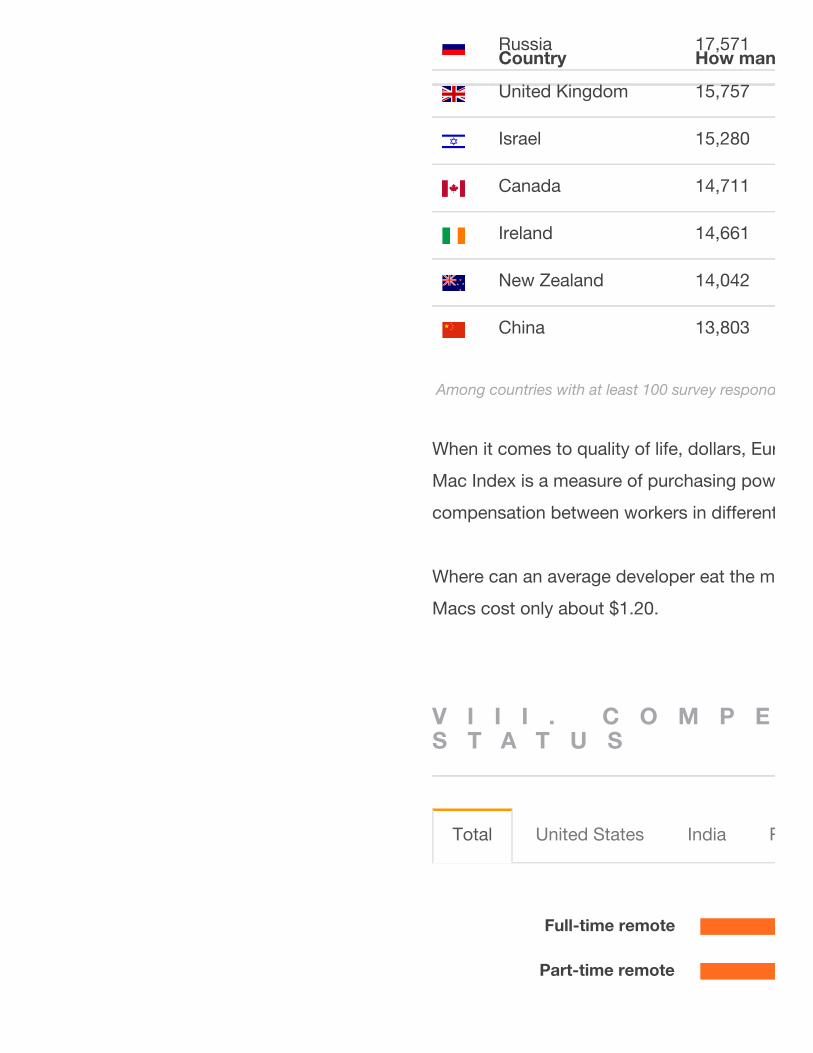
Country How many Big Macs can you buy?
Ukraine 21,825
South Africa 19,215
United States 18,712
Australia 17,802
Full-time remote
Part-time remote
When it comes to quality of life, dollars, Euros and Yen don't matter. Big Macs matter. The Economist's Big
Mac Index is a measure of purchasing power parity that can be used to compare the true value of
compensation between workers in different economies.
Where can an average developer eat the most (and live the best)? The survey says: Ukraine, where Big
Macs cost only about $1.20.
V I I I . C O M P E N S A T I O N B Y R E M O T ES T A T U S
Russia 17,571
United Kingdom 15,757
Israel 15,280
Canada 14,711
Ireland 14,661
New Zealand 14,042
China 13,803
Country How many Big Macs can you buy?
Among countries with at least 100 survey respondents. Based on
Total United States India Russia
Rarely remote
Never remote
10,000+
5,000 to 9,999
500 to 4,999
2 to 499
1
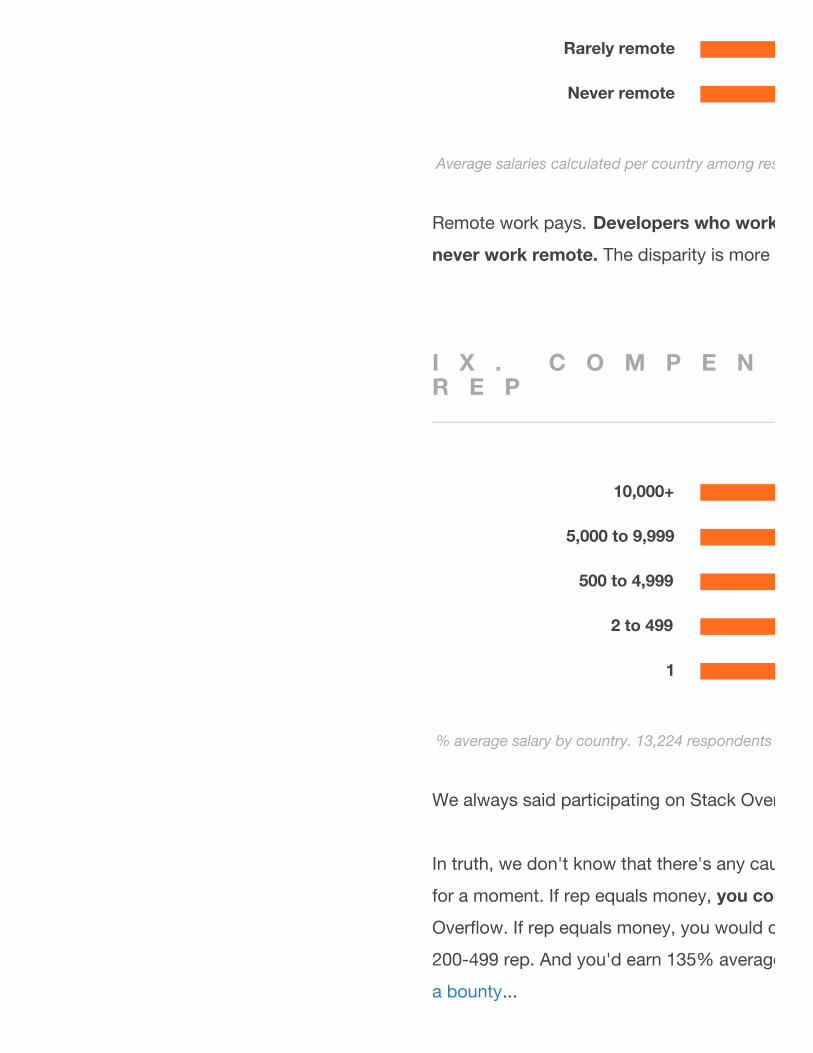
Remote work pays. Developers who work remotely full-time earn about 40% more than those who
never work remote. The disparity is more pronounced in developing countries.
I X . C O M P E N S A T I O N B Y S T A C K O V E R F L O WR E P
We always said participating on Stack Overflow is good for your career. Now we have proof.
In truth, we don't know that there's any causal link between reputation and compensation, but indulge us
for a moment. If rep equals money, you could get a 10% raise just by going from 1 to 100 rep
Overflow. If rep equals money, you would only reach average developer status once you earned between
200-499 rep. And you'd earn 135% average salary once you hit 10,000 rep. It may be a good time to
a bounty...
Average salaries calculated per country among respondents from top 35 responding countries.
% average salary by country. 13,224 respondents from top 35 responding countries.
Employed full-time
I'm a student
Freelance / Contractor
Employed part-time
Unemployed
Retired
Prefer not to disclose
Other
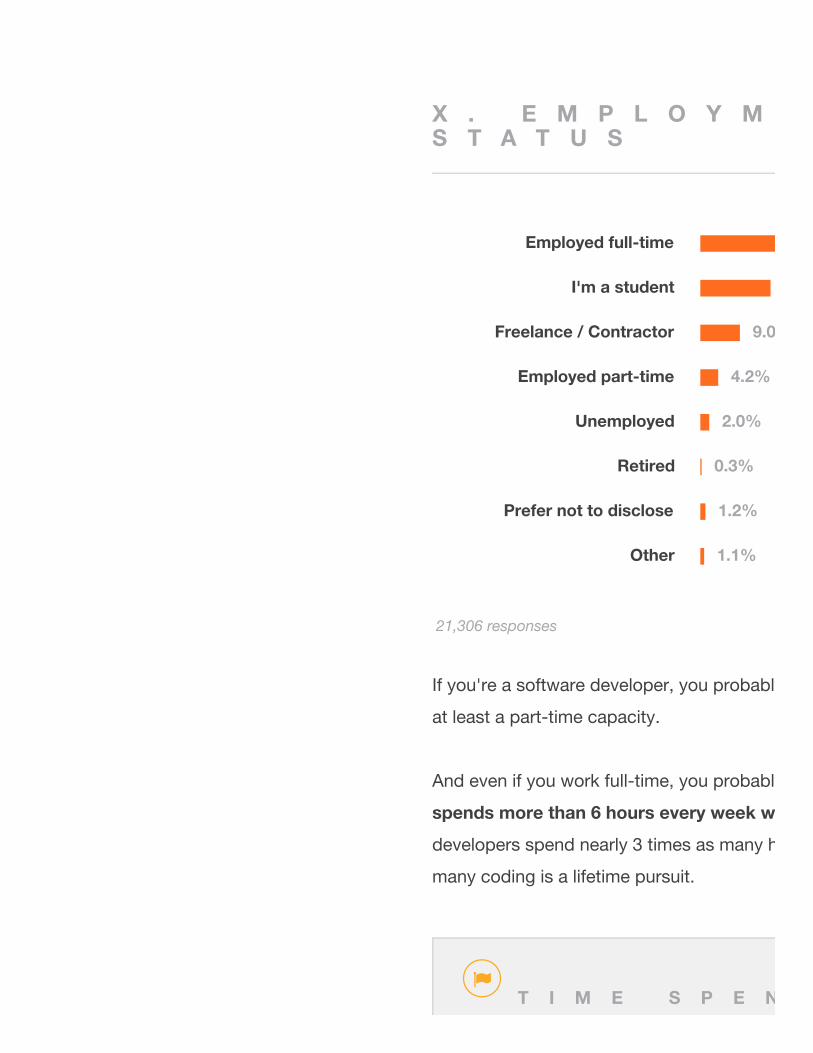
X . E M P L O Y M E N TS T A T U S
If you're a software developer, you probably have a job. 97.5% of workforce respondents are employed in
at least a part-time capacity.
And even if you work full-time, you probably code on the side.
spends more than 6 hours every week working on open source, side- or hobby projects.
developers spend nearly 3 times as many hours on hobby projects. Code is life for most devs, and for
many coding is a lifetime pursuit.
9.0%
4.2%
2.0%
0.3%
1.2%
1.1%
21,306 responses
T I M E S P E N T C O D I N G O N T H E S I D E
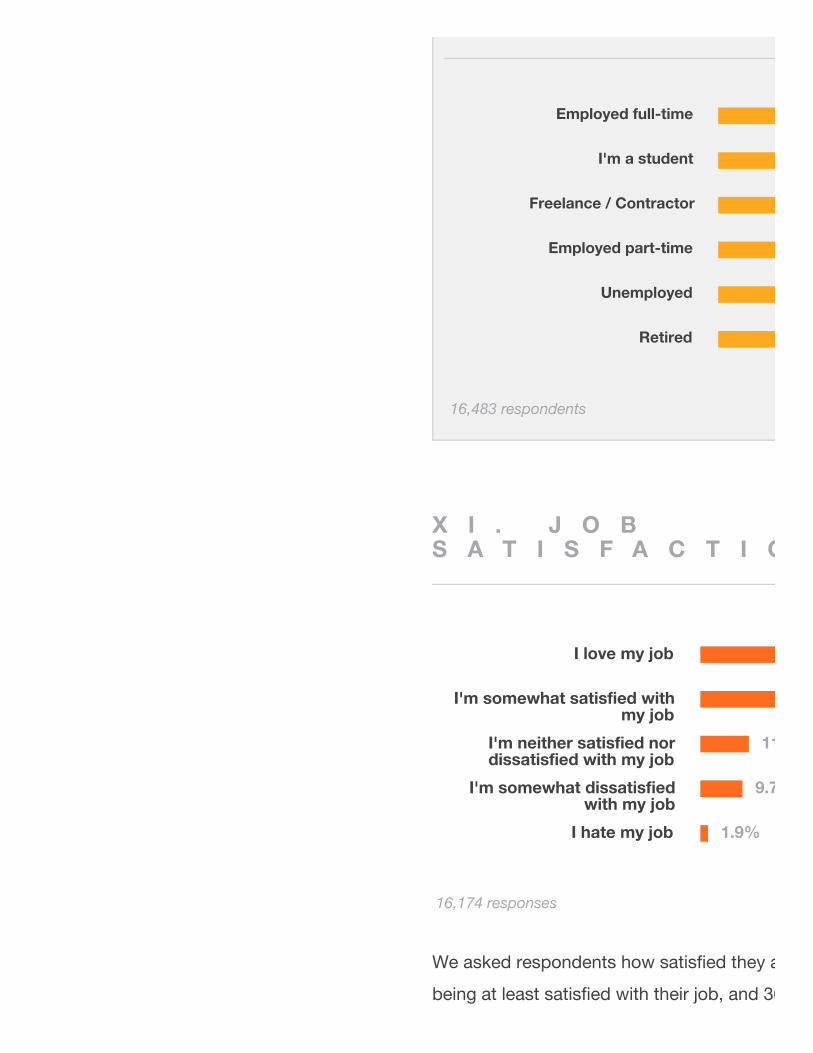
I love my job
I'm somewhat satisfied withmy job
I'm neither satisfied nordissatisfied with my job
I'm somewhat dissatisfiedwith my job
I hate my job
X I . J O BS A T I S F A C T I O N
We asked respondents how satisfied they are with their current job or jobs. 76% of developers report
being at least satisfied with their job, and 36% love their job. Developers are generally more fulfilled by
Employed full-time
I'm a student
Freelance / Contractor
Employed part-time
Unemployed
Retired
16,483 respondents
11.0%
9.7%
1.9%
16,174 responses
work than most employees.
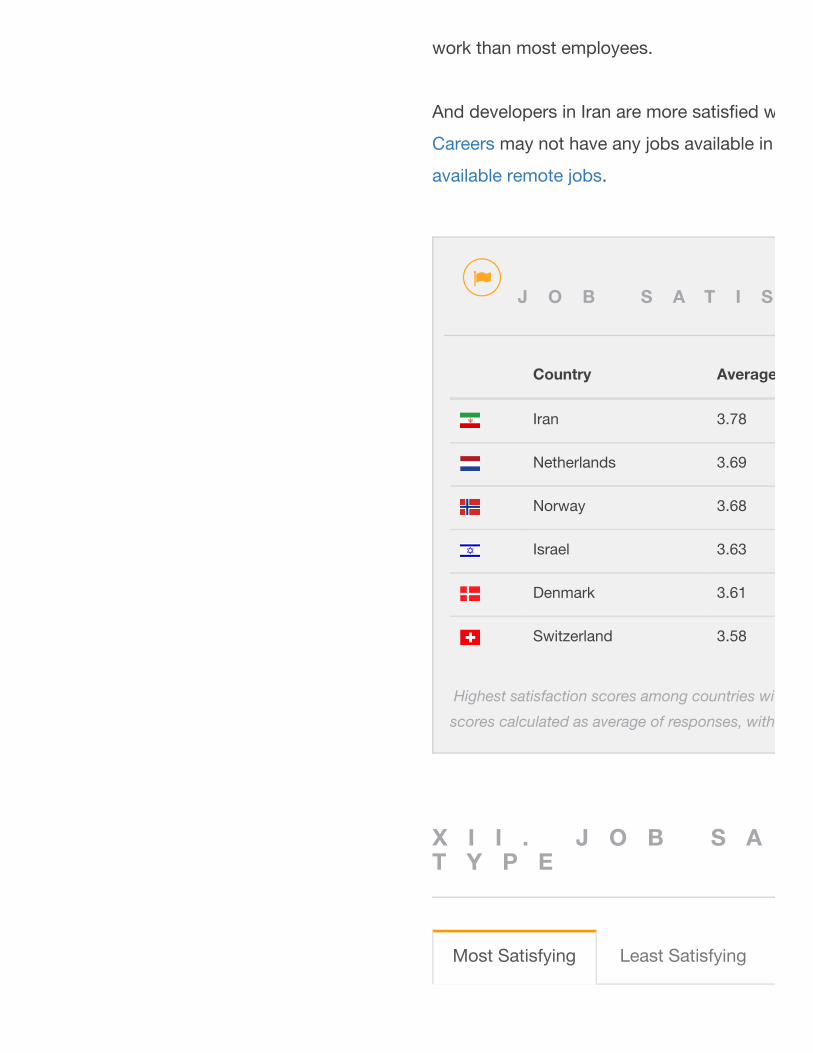
And developers in Iran are more satisfied with their jobs than developers anywhere else.
Careers may not have any jobs available in Iran, but you can still move there and apply for one of our many
available remote jobs.
X I I . J O B S A T I S F A C T I O N B Y D E VT Y P E
J O B S A T I S F A C T I O N B Y G E O G R A P H Y
Country Average Satisfaction Score
Iran 3.78
Netherlands 3.69
Norway 3.68
Israel 3.63
Denmark 3.61
Switzerland 3.58
Highest satisfaction scores among countries with 100 or more respondents. Satisfactions
scores calculated as average of responses, with extra weight given to "I love my job."
Most Satisfying Least Satisfying
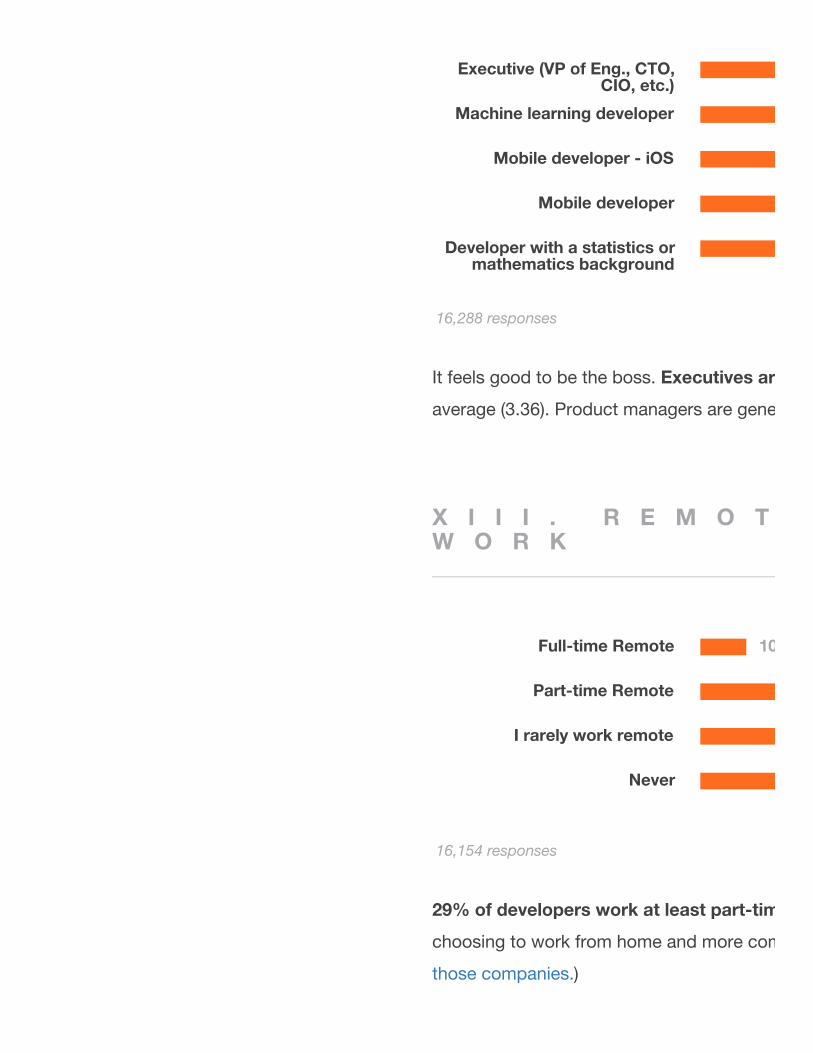
Executive (VP of Eng., CTO,CIO, etc.)
Machine learning developer
Mobile developer - iOS
Mobile developer
Developer with a statistics ormathematics background
Full-time Remote
Part-time Remote
I rarely work remote
Never
It feels good to be the boss. Executives are 16% more satisfied
average (3.36). Product managers are generally the least satisfied with their jobs.
X I I I . R E M O T EW O R K
29% of developers work at least part-time remote.
choosing to work from home and more companies are embracing the remote workplace. (
those companies.)
16,288 responses
10.4%
16,154 responses
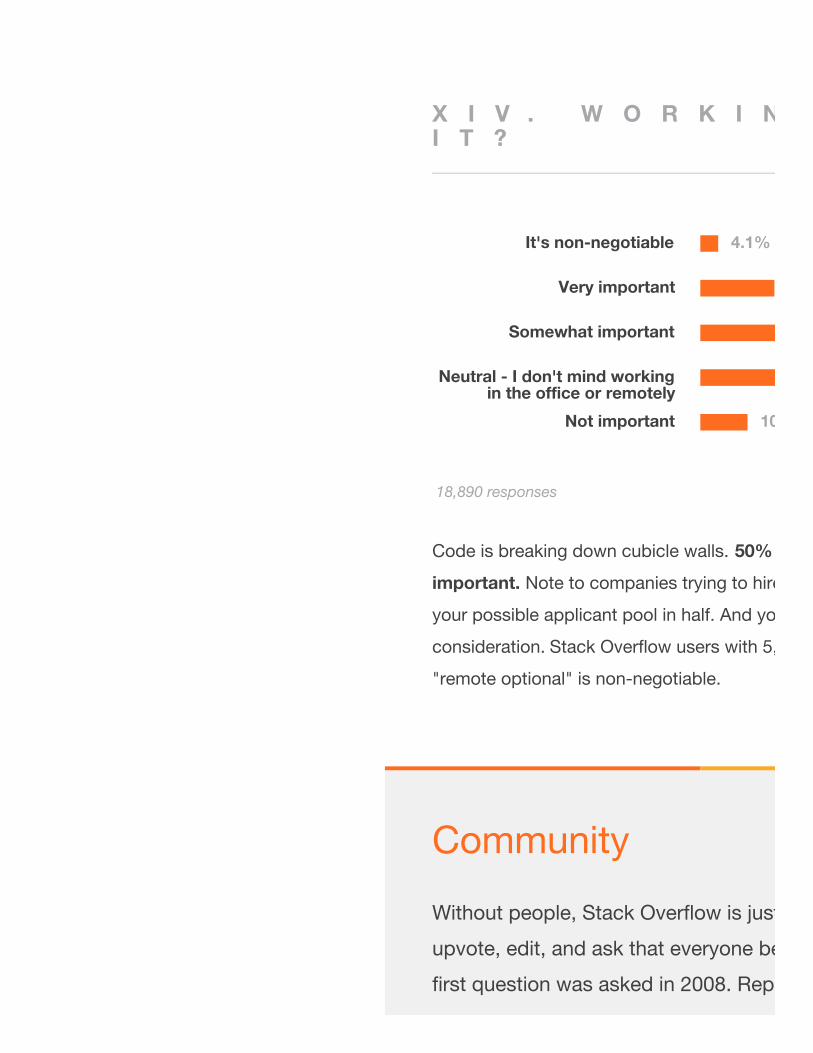
It's non-negotiable
Very important
Somewhat important
Neutral - I don't mind workingin the office or remotely
Not important
X I V . W O R K I N G R E M O T E L Y - W H O W A N T SI T ?
Code is breaking down cubicle walls. 50% of developers say working remote is at least somewhat
important. Note to companies trying to hire: if your
your possible applicant pool in half. And you may be eliminating the most qualified developers from
consideration. Stack Overflow users with 5,000+ rep are twice more likely than other developers to say
"remote optional" is non-negotiable.
4.1%
10.8%
18,890 responses
Community
Without people, Stack Overflow is just a pile of pixels. It's thanks to the devs who answer,
upvote, edit, and ask that everyone benefits from the library of Q&A we've amassed since the
first question was asked in 2008. Reputation and gamification is just a tiny part of what
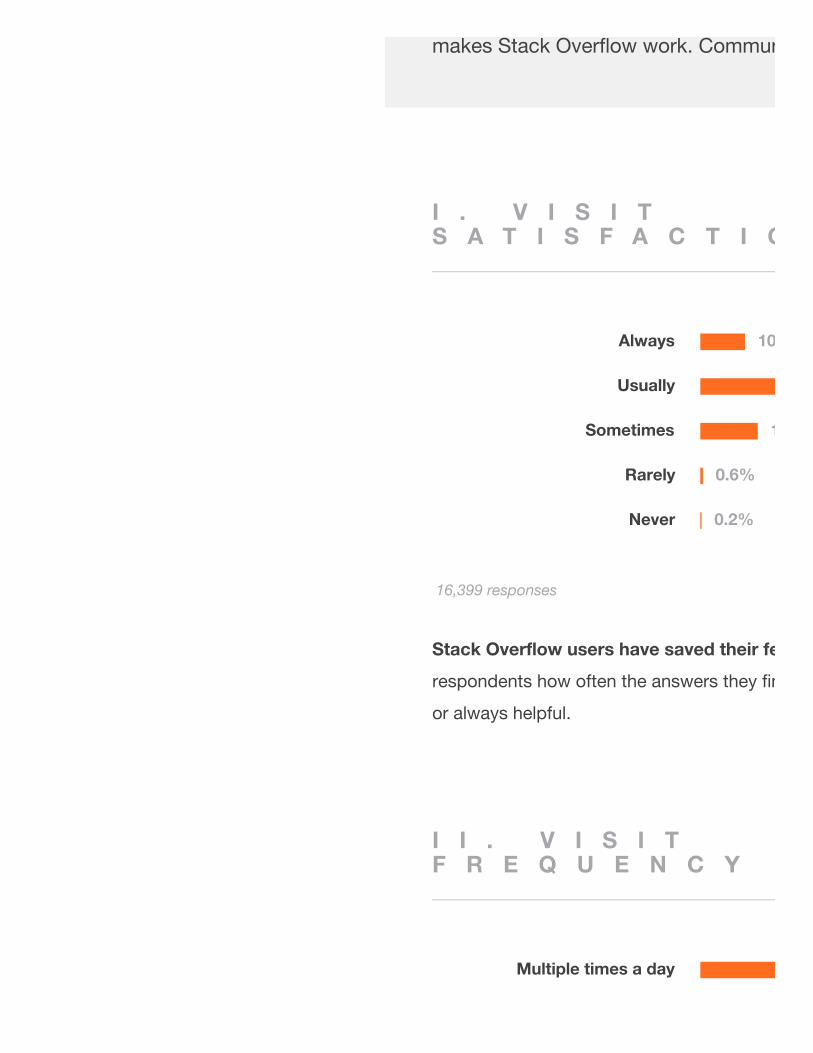
Always
Usually
Sometimes
Rarely
Never
Multiple times a day
I . V I S I TS A T I S F A C T I O N
Stack Overflow users have saved their fellow developers millions of hours of work.
respondents how often the answers they find are are helpful. 86% of respondents say answers are usually
or always helpful.
I I . V I S I TF R E Q U E N C Y
makes Stack Overflow work. Community is everything.
10.2%
13.1%
0.6%
0.2%
16,399 responses
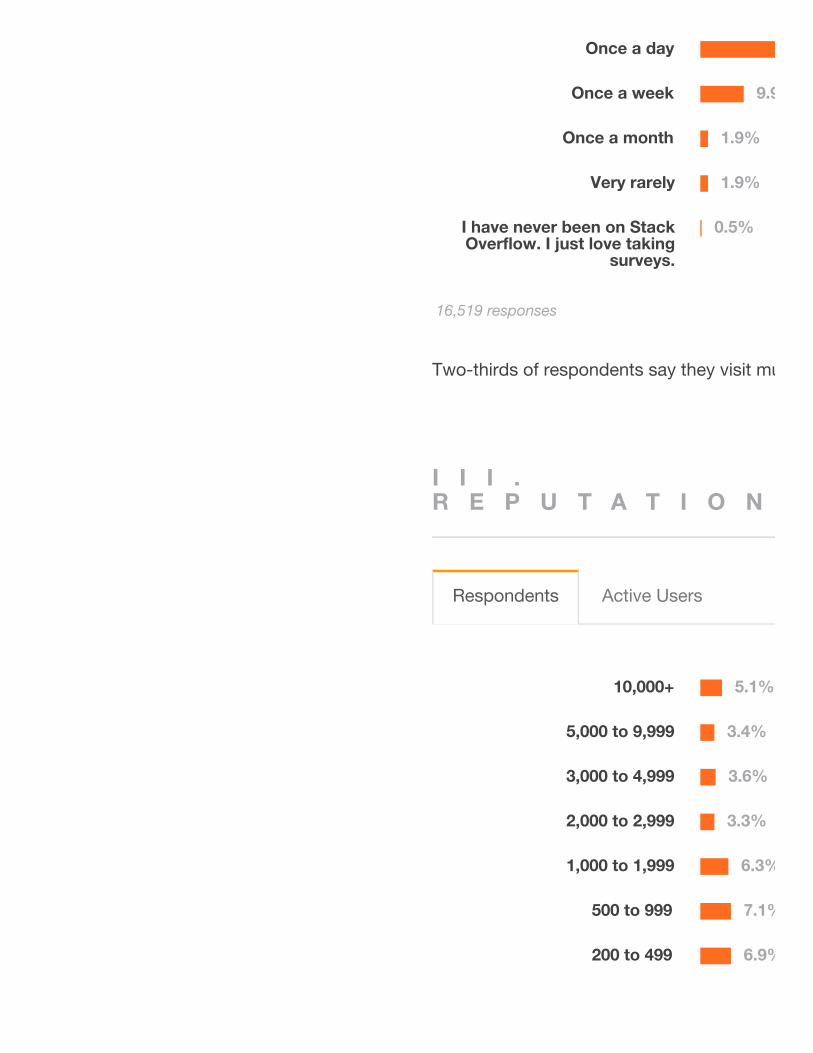
Once a day
Once a week
Once a month
Very rarely
I have never been on StackOverflow. I just love taking
surveys.
10,000+
5,000 to 9,999
3,000 to 4,999
2,000 to 2,999
1,000 to 1,999
500 to 999
200 to 499
Two-thirds of respondents say they visit multiple times per day.
I I I .R E P U T A T I O N
9.9%
1.9%
1.9%
0.5%
16,519 responses
Respondents Active Users
5.1%
3.4%
3.6%
3.3%
6.3%
7.1%
6.9%
100 to 199
50 to 99
2 to 49
1
I don't have an account
Not sure
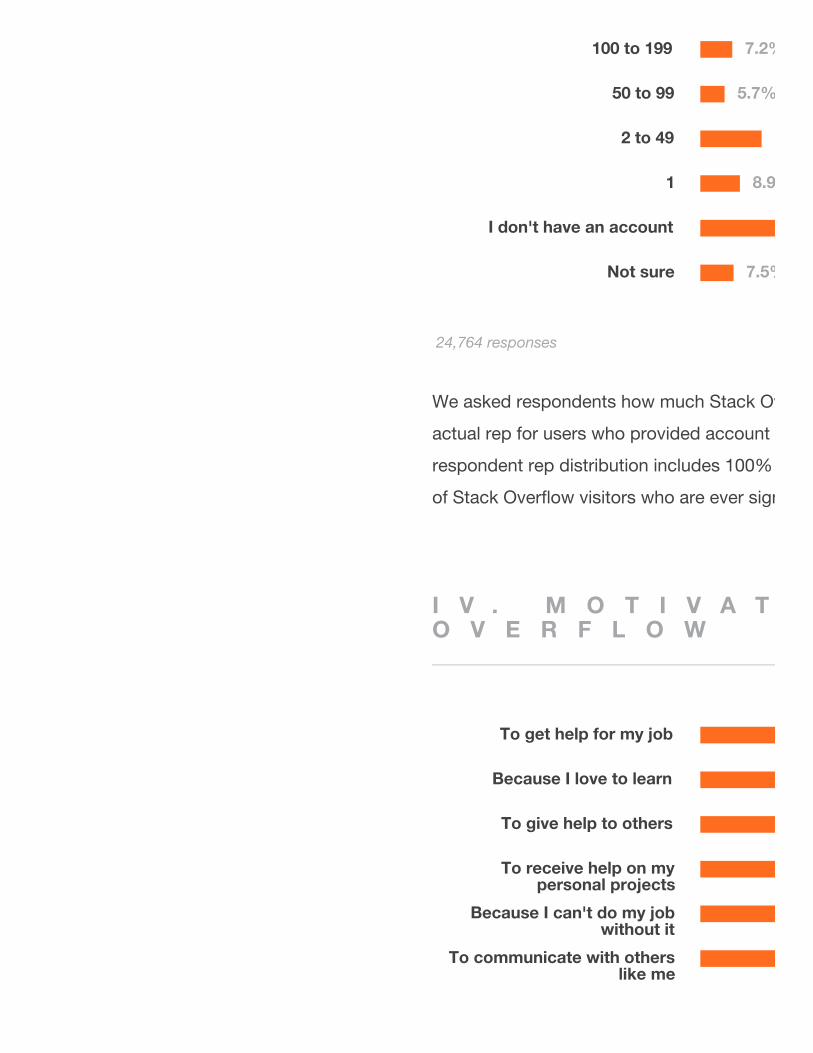
To get help for my job
Because I love to learn
To give help to others
To receive help on mypersonal projects
Because I can't do my jobwithout it
To communicate with otherslike me
We asked respondents how much Stack Overflow rep they have. (We double-checked responses vs.
actual rep for users who provided account info – our users are remarkably honest people.) Whereas
respondent rep distribution includes 100% of respondents, active user distribution includes only the ~5%
of Stack Overflow visitors who are ever signed-in.
I V . M O T I V A T I O N F O R U S I N G S T A C KO V E R F L O W
7.2%
5.7%
13.8%
8.9%
7.5%
24,764 responses
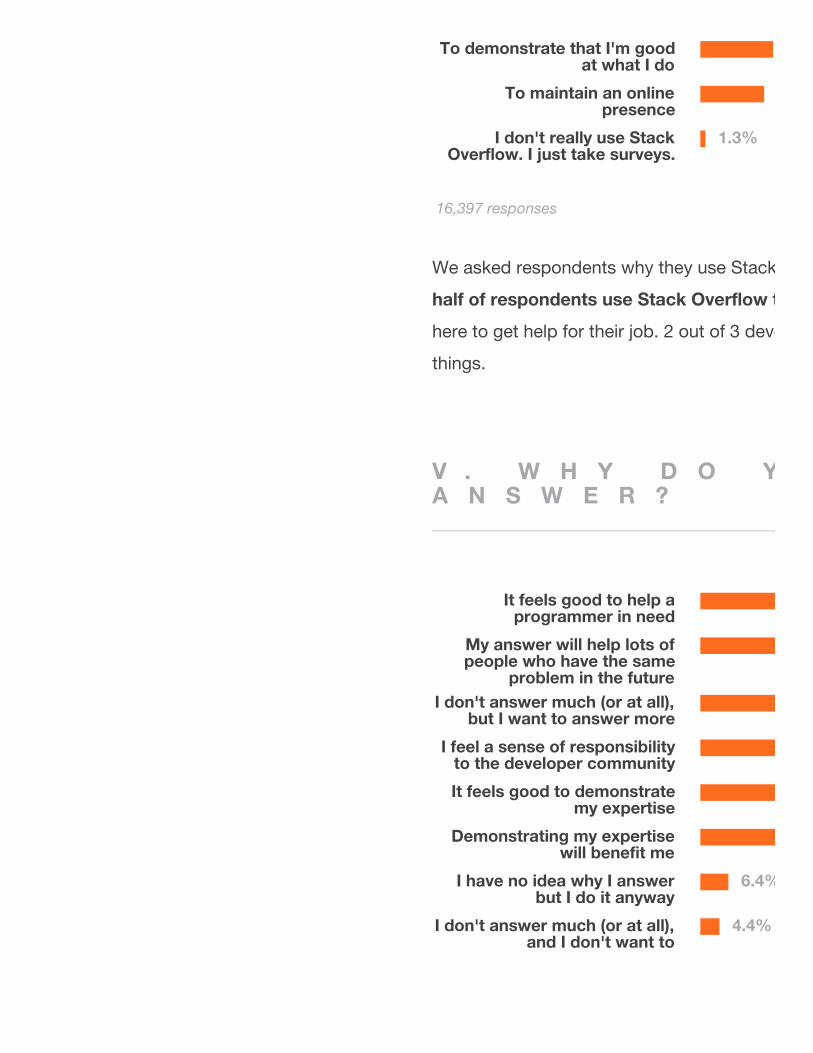
To demonstrate that I'm goodat what I do
To maintain an onlinepresence
I don't really use StackOverflow. I just take surveys.
It feels good to help aprogrammer in need
My answer will help lots ofpeople who have the same
problem in the futureI don't answer much (or at all),
but I want to answer more
I feel a sense of responsibilityto the developer community
It feels good to demonstratemy expertise
Demonstrating my expertisewill benefit me
I have no idea why I answerbut I do it anyway
I don't answer much (or at all),and I don't want to
We asked respondents why they use Stack Overflow, allowing for multiple answer selections.
half of respondents use Stack Overflow to help other developers.
here to get help for their job. 2 out of 3 developers say they are motivated by a passion for learning new
things.
V . W H Y D O Y O UA N S W E R ?
1.3%
16,397 responses
6.4%
4.4%
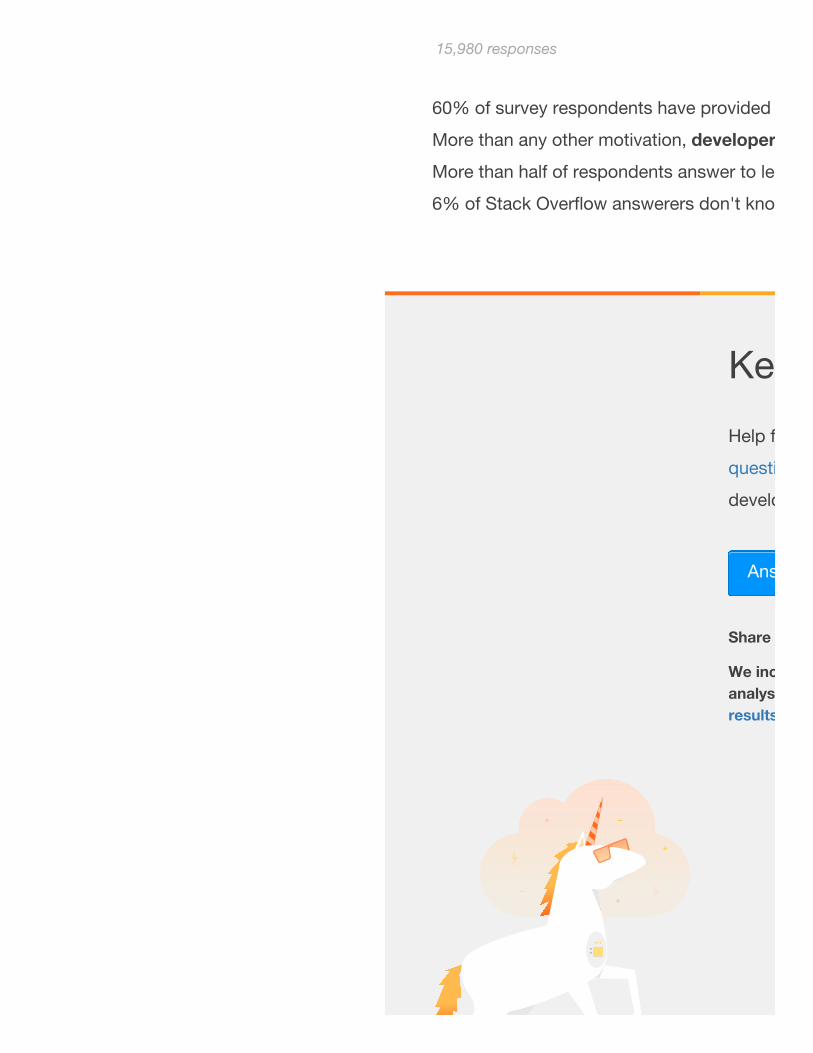
60% of survey respondents have provided an answer on Stack Overflow. What motivates answerers?
More than any other motivation, developers answer because it feels good to help a fellow developer
More than half of respondents answer to leave artifacts that will help many developers in the future. And
6% of Stack Overflow answerers don't know why they answer – they just do.
15,980 responses
Keep Stack Overflow flowing
Help fellow developers build by answering one of
questions
developers in the future.
Share
We included only limited results above. See all the data and do your ownanalysis with results
Answer

Built with ♥ using c# jQuery font-awesome