@ssrs solutions | 484.840.4300 | | 1cdn.cnn.com/cnn/2018/images/01/31/cnn.topline_.01.30.18.pdf ·...
TRANSCRIPT

@ssrs_solutions | 484.840.4300 | www.ssrs.com | 1
CNN January 2018
The study was conducted for CNN via telephone by SSRS, an independent research company. Interviews were conducted on January 30, 2018 among a sample of 549 respondents. The margin of sampling error for total
respondents is +/-4.2 at the 95% confidence level. Survey respondents were first interviewed as part of a random national sample conducted January 14-18, 2018 on the CNN Janurary Poll as well as on January 24-28, 2018 on the
SSRS Omnibus. January 25-28, 2018 respondents were also recruited via the SSRS Web Probability Panel. This panel is constructed from a random sample of the U.S. population recruited through the SSRS Omnibus, an
overlapping-frame (cell phone and landline) RDD telephone survey. In those interviews, respondents indicated they planned to watch tonight's speech and were willing to be re-interviewed after the speech. More information about SSRS can be obtained by visiting www.ssrs.com. Unless otherwise noted, results beginning with the March
31-April 2, 2006 survey and ending with the April 22-25, 2017 survey are from surveys conducted by ORC International. Results before March 31, 2006 are from surveys conducted by Gallup.
Q101. What was your overall reaction to President Trump’s speech tonight – very positive, somewhat positive,
somewhat negative or very negative?
Very positive Somewhat positive
Somewhat negative
Very negative
Both/Mixed (vol.) No opinion
January 30, 2018 48% 22% 16% 13% * * February 28, 2017 57% 21% 11% 10% 1% 8
CNN/ORC TRENDS FOR COMPARISON
Very
positive Somewhat
positive Somewhat negative
Very negative
Both/Mixed (vol.) No opinion
Barack Obama 2016 Jan 12 53% 20% 15% 10% 1% * 2015 Jan 20 51% 30% 10% 8% 1% * 2014 Jan 28 44% 32% 14% 8% 1% 1% 2013 Feb 12 53% 24% 14% 8% 1% 1% 2011 Jan 25 52% 32% 11% 4% 1% 1% 2010 Jan 27 48% 30% 15% 6% 1% 1% 2009 Feb 24 68% 24% 6% 2% * *
George W. Bush 2007 Jan 23 41% 37% 16% 4% 1% 1%

@ssrs_solutions | 484.840.4300 | www.ssrs.com | 2
Q101. What was your overall reaction to President Trump’s speech tonight – very positive, somewhat positive, somewhat negative or very negative? (CONTINUED)
CNN/USA TODAY/GALLUP TRENDS FOR COMPARISON
Very
positive Somewhat
positive Somewhat negative
Very negative
Both/Mixed (vol.) No opinion
George W. Bush 2006 Jan 31 48% 27% 14% 9% 2% * 2005 Feb 2 60% 26% 10% 3% 1% -- 2004 Jan 20 45% 31% 13% 10% 1% -- 2003 Jan 28 50% 34% 11% 3% 2% * 2002 Jan 29 74% 20% 3% 2% 1% * 2001 Feb 27 66% 26% 6% 1% * 1%
Bill Clinton 1999 Jan 19 56% 27% 9% 7% 1% * 1998 Jan 27 52% 32% 11% 5% * *
@ssrs_solutions | 484.840.4300 | www.ssrs.com | 3
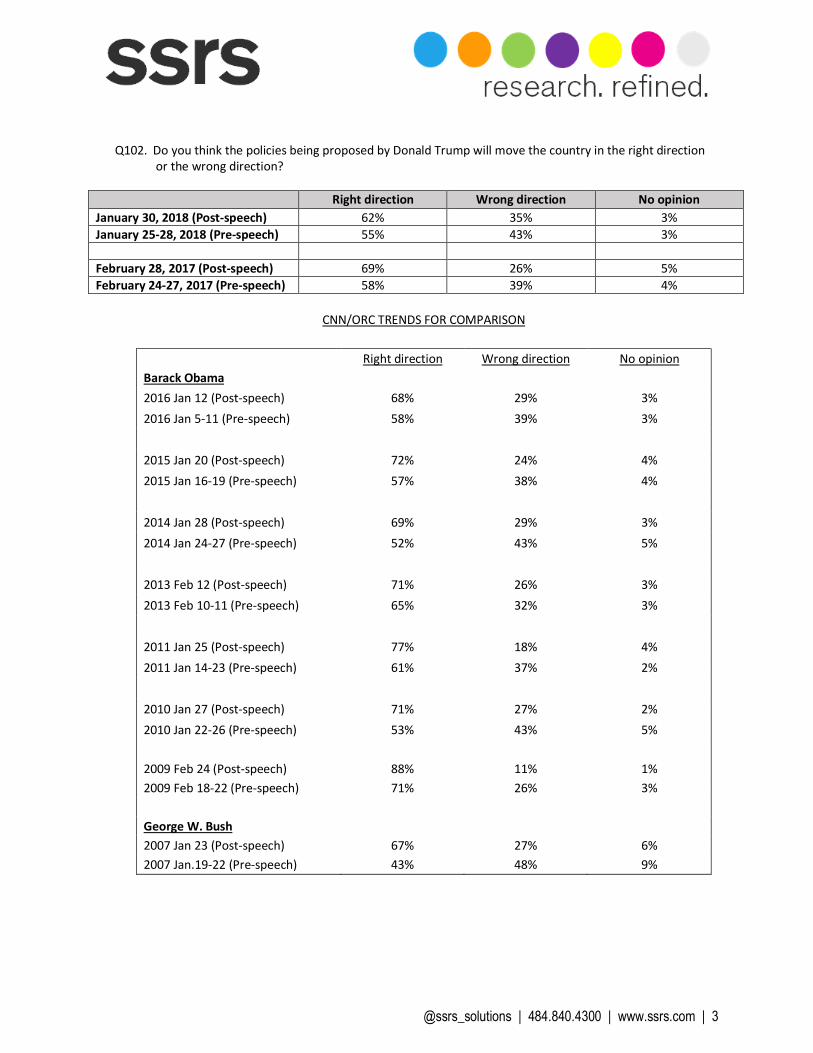
Q102. Do you think the policies being proposed by Donald Trump will move the country in the right direction or the wrong direction?
Right direction Wrong direction No opinion January 30, 2018 (Post-speech) 62% 35% 3% January 25-28, 2018 (Pre-speech) 55% 43% 3% February 28, 2017 (Post-speech) 69% 26% 5% February 24-27, 2017 (Pre-speech) 58% 39% 4%
CNN/ORC TRENDS FOR COMPARISON
Right direction Wrong direction No opinion Barack Obama 2016 Jan 12 (Post-speech) 68% 29% 3% 2016 Jan 5-11 (Pre-speech) 58% 39% 3% 2015 Jan 20 (Post-speech) 72% 24% 4% 2015 Jan 16-19 (Pre-speech) 57% 38% 4% 2014 Jan 28 (Post-speech) 69% 29% 3% 2014 Jan 24-27 (Pre-speech) 52% 43% 5% 2013 Feb 12 (Post-speech) 71% 26% 3% 2013 Feb 10-11 (Pre-speech) 65% 32% 3% 2011 Jan 25 (Post-speech) 77% 18% 4% 2011 Jan 14-23 (Pre-speech) 61% 37% 2% 2010 Jan 27 (Post-speech) 71% 27% 2% 2010 Jan 22-26 (Pre-speech) 53% 43% 5% 2009 Feb 24 (Post-speech) 88% 11% 1% 2009 Feb 18-22 (Pre-speech) 71% 26% 3% George W. Bush 2007 Jan 23 (Post-speech) 67% 27% 6% 2007 Jan.19-22 (Pre-speech) 43% 48% 9%

@ssrs_solutions | 484.840.4300 | www.ssrs.com | 4
Q102. Do you think the policies being proposed by Donald Trump will move the country in the right direction or the wrong direction? (CONTINUED)
CNN/USA TODAY/GALLUP TRENDS FOR COMPARISON
Right direction Wrong direction No opinion George W. Bush 2006 Jan 31 (Post-speech) 68% 28% 4% 2006 Jan 29-30 (Pre-speech) 52% 40% 8% 2005 Feb 2 (Post-speech) 77% 20% 3% 2005 Jan 31-Feb 1 (Pre-speech) 67% 29% 4% 2004 Jan 20 (Post-speech) 70% 26% 4% 2004 Jan 18-19 (Pre-speech) 60% 33% 7% 2003 Jan 28 (Post-speech) 71% 20% 9% 2003 Jan 23-27 (Pre-speech) 52% 40% 8% 2002 Jan 29 (Post-speech) 91% 7% 2% 2002 Jan 25-27 (Pre-speech) 77% 16% 7% 2001 Feb 27 (Post-speech) 84% 12% 4% 2001 Feb 25-26 (Pre-speech) 73% 12% 15% Bill Clinton 1995 Jan 24 (Post-speech) 83% 15% 2% 1995 Jan 23 (Pre-speech) 51% 35% 14% 1994 Jan 25 (Post-speech) 84% 11% 5% 1994 Jan 22-24 (Pre-speech) 67% 27% 6% 2001 QUESTION WORDING: Thinking about the policies of President Bush and his administration, in your view, is George W. Bush leading the country in the right direction or in the wrong direction? 1994-1995 QUESTION WORDING: Thinking about the policies of President Clinton and his administration, in your view, is Bill Clinton leading the country in the right direction or in the wrong direction?

@ssrs_solutions | 484.840.4300 | www.ssrs.com | 5
Q103. How confident are you in Donald Trump’s abilities to carry out his duties as president -- very confident, somewhat confident, not too confident, or not confident at all?
Very
confident Somewhat confident
Not too confident
Not confident at all No opinion
January 30, 2018 (Post-speech) 42% 15% 15% 28% * Feb. 28, 2017 (Post-speech) 46% 18% 17% 19% * Feb. 24-27, 2017 (Pre-speech) 45% 14% 9% 32% 1%
CNN/ORC TRENDS FOR COMPARISON
Very confident
Somewhat confident
Not too confident
Not confident at
all No opinion Barack Obama 2010 Jan 27 (Post-speech) 38% 28% 22% 12% * 2009 Feb 24 (Post-speech) 55% 32% 10% 3% *
CNN/USA TODAY/GALLUP TRENDS FOR COMPARISON
Very confident
Somewhat confident
Not too confident
Not confident at
all No opinion George W. Bush 2001 Feb 27 (Post-speech) 52% 34% 12% 2% * Bill Clinton 1999 Jan 19 (Post-speech) 55% 24% 10% 11% -- 1998 Jan 28 (Post-speech) 48% 30% 14% 8% --

@ssrs_solutions | 484.840.4300 | www.ssrs.com | 6
Q104. So far, would you say Donald Trump has had the right priorities, or that he hasn’t paid enough attention to the country’s most important problems?
Right priorities
Hasn’t paid attention to most important
problems No opinion
January 30, 2018 (Post-speech) 54% 45% 1% February 28, 2017 (Post-speech) 63% 36% 1% February 24-27, 2017 (Pre-speech) 57% 40% 3%
CNN/ORC TRENDS FOR COMPARISON
Right priorities
Hasn’t paid attention to most
important problems No opinion Barack Obama
2010 Jan 27 (Post-speech) 55% 44% 1% 2010 Jan 22-26 (Pre-speech) 49% 51% 1%
@ssrs_solutions | 484.840.4300 | www.ssrs.com | 7
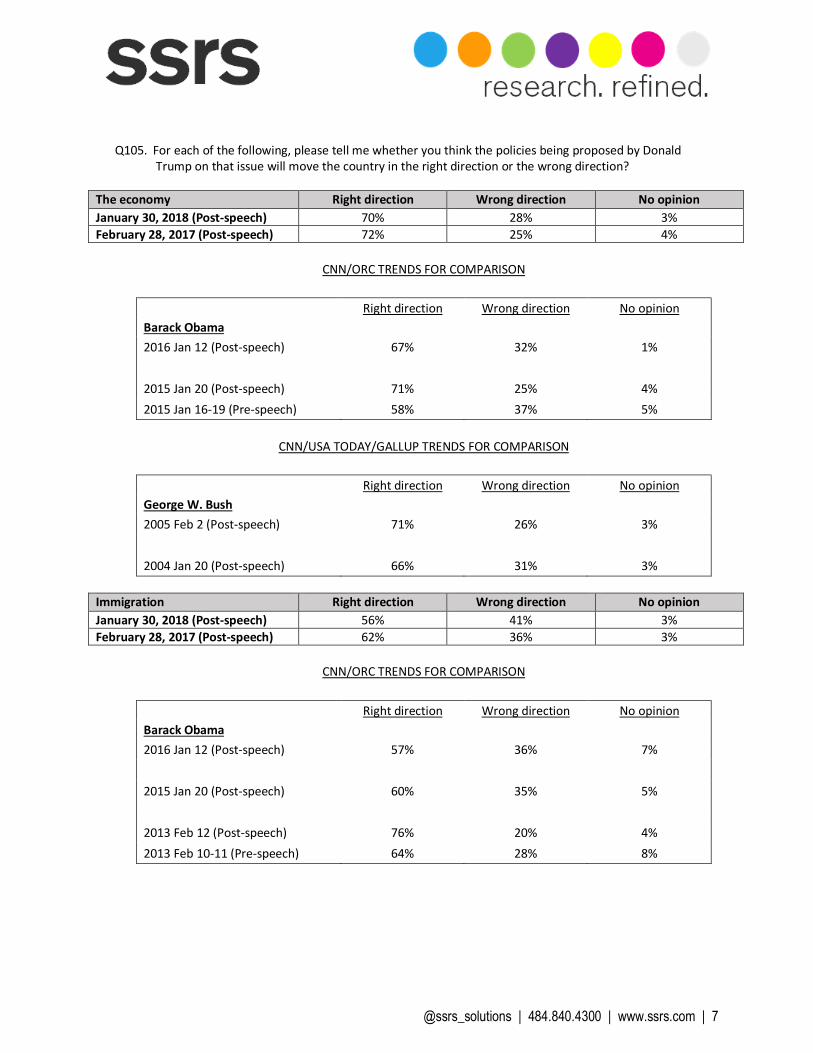
Q105. For each of the following, please tell me whether you think the policies being proposed by Donald Trump on that issue will move the country in the right direction or the wrong direction?
The economy Right direction Wrong direction No opinion January 30, 2018 (Post-speech) 70% 28% 3% February 28, 2017 (Post-speech) 72% 25% 4%
CNN/ORC TRENDS FOR COMPARISON
Right direction Wrong direction No opinion Barack Obama 2016 Jan 12 (Post-speech) 67% 32% 1% 2015 Jan 20 (Post-speech) 71% 25% 4% 2015 Jan 16-19 (Pre-speech) 58% 37% 5%
CNN/USA TODAY/GALLUP TRENDS FOR COMPARISON
Right direction Wrong direction No opinion George W. Bush 2005 Feb 2 (Post-speech) 71% 26% 3% 2004 Jan 20 (Post-speech) 66% 31% 3%
Immigration Right direction Wrong direction No opinion January 30, 2018 (Post-speech) 56% 41% 3% February 28, 2017 (Post-speech) 62% 36% 3%
CNN/ORC TRENDS FOR COMPARISON
Right direction Wrong direction No opinion Barack Obama 2016 Jan 12 (Post-speech) 57% 36% 7% 2015 Jan 20 (Post-speech) 60% 35% 5% 2013 Feb 12 (Post-speech) 76% 20% 4% 2013 Feb 10-11 (Pre-speech) 64% 28% 8%

@ssrs_solutions | 484.840.4300 | www.ssrs.com | 8
Q105. For each of the following, please tell me whether you think the policies being proposed by Donald Trump on that issue will move the country in the right direction or the wrong direction?
Trade Right direction Wrong direction No opinion January 30, 2018 (Post-speech) 62% 35% 3% Taxes Right direction Wrong direction No opinion January 30, 2018 (Post-speech) 62% 36% 2% February 28, 2017 (Post-speech) 64% 30% 6%
CNN/ORC TRENDS FOR COMPARISON
Right direction Wrong direction No opinion Barack Obama 2015 Jan 20 (Post-speech) 64% 31% 5%
CNN/USA TODAY/GALLUP TRENDS FOR COMPARISON
Right direction Wrong direction No opinion George W. Bush 2004 Jan 20 (Post-speech) 65% 32% 3% 2004 Jan 18-19 (Pre-speech) 58% 35% 7%
National security Right direction Wrong direction No opinion January 30, 2018 (Post-speech) 65% 33% 2% Infrastructure Right direction Wrong direction No opinion January 30, 2018 (Post-speech) 79% 17% 4%

@ssrs_solutions | 484.840.4300 | www.ssrs.com | 9
Q106. In his speech tonight, did Donald Trump make you feel more optimistic or more pessimistic about the direction the country is headed in over the next few years?
More optimistic More pessimistic Neither (vol.) No opinion
January 30, 2018 63% 35% 1% 1% February 28, 2017 69% 28% 2% 1%
CNN/ORC TRENDS FOR COMPARISON
More optimistic More pessimistic Neither (vol.) No opinion
Barack Obama 2011 January 25 77% 19% 4% 1% 2009 February 24 85% 11% 3% 1%

@ssrs_solutions | 484.840.4300 | www.ssrs.com | 10
MORE ON METHODOLOGY A total of 549 adults were interviewed by telephone nationwide by live interviewers calling both landline and cell phones. Interviews were conducted in English and Spanish. Interviews were conducted Janurary 30, 2018. Among the entire sample, 26% described themselves as Democrats,31% described themselves as Republicans, and 42% described themselves as independents or members of another party. Results for the full sample have a margin of sampling error of +/-4.2 percentage points. Crosstabs on the following pages only include results for subgroups with enough unweighted cases to produce a sampling error of +/-8.5 percentage points or less. Some subgroups represent too small a share of the national population to produce crosstabs with an acceptable sampling error. Interviews were conducted among these subgroups, but results for groups with a sampling error larger than +/-8.5 percentage points are not displayed and instead are denoted with "N/A".

@ssrs_solutions | 484.840.4300 | www.ssrs.com | 11
CNN/SSRS Poll -- January 30, 2018 101. What was your overall reaction to President Trump's speech tonight -- very positive, somewhat positive, somewhat negative, or very negative? Base: Total Respondents Non- Total Men Women White white ===== ===== ===== ===== ===== Very positive 48% 52% 43% 50% N/A Somewhat positive 22% 22% 21% 20% N/A Somewhat negative 16% 14% 19% 16% N/A Very negative 13% 11% 15% 13% N/A Both/mixed * - 1% * N/A Don't know/Undecided/Refused * - 1% * N/A Sampling Error (+/-) 4.2 5.7 6.1 4.6 Total 18-34 35-49 50-64 65+ <45 45+ ===== ===== ===== ===== ===== ===== ===== Very positive 48% N/A N/A 56% 46% N/A 52% Somewhat positive 22% N/A N/A 19% 21% N/A 20% Somewhat negative 16% N/A N/A 13% 20% N/A 16% Very negative 13% N/A N/A 12% 12% N/A 11% Both/mixed * N/A N/A 1% * N/A * Don't know/Undecided/Refused * N/A N/A - 1% N/A * Sampling Error (+/-) 4.2 7.1 6.6 4.6 Non- White White coll. Coll. non- coll. Total <$50K $50K+ grad grad. coll. grad. ===== ===== ===== ===== ===== ===== ===== Very positive 48% 48% 47% 55% 42% 65% 40% Somewhat positive 22% 21% 23% 23% 21% 16% 22% Somewhat negative 16% 16% 16% 12% 20% 10% 20% Very negative 13% 13% 14% 9% 17% 8% 17% Both/mixed * 1% - 1% - 1% - Don't know/Undecided/Refused * 1% - * * 1% * Sampling Error (+/-) 4.2 7.6 5.3 6.3 5.6 7.2 6.0 Indep Con Demo- endnt Repub Lib- Mode- serva Total crat Other lican eral rate tive ===== ===== ===== ===== ===== ===== ===== Very positive 48% 7% 48% 83% 11% 32% 83% Somewhat positive 22% 24% 28% 12% 20% 37% 13% Somewhat negative 16% 31% 17% 2% 33% 19% 3% Very negative 13% 37% 7% 2% 36% 9% 1% Both/mixed * 1% * - - 1% - Don't know/Undecided/Refused * 1% * - - 1% - Sampling Error (+/-) 4.2 8.1 6.5 7.5 7.9 7.9 6.5

@ssrs_solutions | 484.840.4300 | www.ssrs.com | 12
Lean Lean Demo- Repub Reg. Total crat lican voter ===== ===== ===== ===== Very positive 48% 6% 81% 49% Somewhat positive 22% 28% 15% 20% Somewhat negative 16% 34% 2% 16% Very negative 13% 30% 1% 14% Both/mixed * 1% - * Don't know/Undecided/Refused * * * * Sampling Error (+/-) 4.2 6.6 5.8 4.3

@ssrs_solutions | 484.840.4300 | www.ssrs.com | 13
CNN/SSRS Poll -- January 30, 2018 102. Do you think the policies being proposed by Donald Trump will move the country in the right direction or the wrong direction? Base: Total Respondents Non- Total Men Women White white ===== ===== ===== ===== ===== Right direction 62% 67% 56% 64% N/A Wrong direction 35% 30% 40% 33% N/A Don't know/Undecided/Refused 3% 2% 4% 3% N/A Sampling Error (+/-) 4.2 5.7 6.1 4.6 Total 18-34 35-49 50-64 65+ <45 45+ ===== ===== ===== ===== ===== ===== ===== Right direction 62% N/A N/A 68% 60% N/A 65% Wrong direction 35% N/A N/A 31% 36% N/A 32% Don't know/Undecided/Refused 3% N/A N/A 2% 5% N/A 3% Sampling Error (+/-) 4.2 7.1 6.6 4.6 Non- White White coll. Coll. non- coll. Total <$50K $50K+ grad grad. coll. grad. ===== ===== ===== ===== ===== ===== ===== Right direction 62% 61% 61% 71% 55% 78% 54% Wrong direction 35% 36% 36% 27% 41% 20% 41% Don't know/Undecided/Refused 3% 3% 2% 2% 4% 2% 5% Sampling Error (+/-) 4.2 7.6 5.3 6.3 5.6 7.2 6.0 Indep Con Demo- endnt Repub Lib- Mode- serva Total crat Other lican eral rate tive ===== ===== ===== ===== ===== ===== ===== Right direction 62% 17% 67% 94% 23% 53% 94% Wrong direction 35% 79% 29% 6% 75% 40% 4% Don't know/Undecided/Refused 3% 3% 4% 1% 2% 6% 1% Sampling Error (+/-) 4.2 8.1 6.5 7.5 7.9 7.9 6.5 Lean Lean Demo- Repub Reg. Total crat lican voter ===== ===== ===== ===== Right direction 62% 19% 93% 62% Wrong direction 35% 77% 5% 35% Don't know/Undecided/Refused 3% 4% 2% 3% Sampling Error (+/-) 4.2 6.6 5.8 4.3

@ssrs_solutions | 484.840.4300 | www.ssrs.com | 14
CNN/SSRS Poll -- January 30, 2018 103. How confident are you in Donald Trump's abilities to carry out his duties as president -- very confident, somewhat confident, not too confident, or not confident at all? Base: Total Respondents Non- Total Men Women White white ===== ===== ===== ===== ===== Very/Somewhat Confident (Net) 57% 61% 53% 59% N/A Very confident 42% 46% 37% 45% N/A Somewhat confident 15% 15% 15% 15% N/A Not Too/Not At All Confident (Net) 43% 39% 47% 40% N/A Not too confident 15% 16% 14% 13% N/A Not confident at all 28% 23% 34% 27% N/A Don't know/Undecided/Refused * * - * N/A Sampling Error (+/-) 4.2 5.7 6.1 4.6 Total 18-34 35-49 50-64 65+ <45 45+ ===== ===== ===== ===== ===== ===== ===== Very/Somewhat Confident (Net) 57% N/A N/A 65% 53% N/A 59% Very confident 42% N/A N/A 48% 40% N/A 45% Somewhat confident 15% N/A N/A 17% 13% N/A 15% Not Too/Not At All Confident (Net) 43% N/A N/A 35% 47% N/A 40% Not too confident 15% N/A N/A 13% 13% N/A 13% Not confident at all 28% N/A N/A 22% 33% N/A 27% Don't know/Undecided/Refused * N/A N/A - * N/A * Sampling Error (+/-) 4.2 7.1 6.6 4.6 Non- White White coll. Coll. non- coll. Total <$50K $50K+ grad grad. coll. grad. ===== ===== ===== ===== ===== ===== ===== Very/Somewhat Confident (Net) 57% 57% 55% 65% 50% 74% 49% Very confident 42% 43% 40% 49% 36% 58% 35% Somewhat confident 15% 14% 15% 16% 15% 17% 14% Not Too/Not At All Confident (Net) 43% 43% 45% 35% 49% 26% 51% Not too confident 15% 14% 15% 13% 16% 8% 17% Not confident at all 28% 28% 29% 22% 33% 18% 33% Don't know/Undecided/Refused * - * - * - * Sampling Error (+/-) 4.2 7.6 5.3 6.3 5.6 7.2 6.0 Indep Con Demo- endnt Repub Lib- Mode- serva Total crat Other lican eral rate tive ===== ===== ===== ===== ===== ===== ===== Very/Somewhat Confident (Net) 57% 10% 59% 94% 15% 45% 93% Very confident 42% 5% 40% 75% 9% 27% 73% Somewhat confident 15% 5% 19% 18% 6% 18% 19% Not Too/Not At All Confident (Net) 43% 90% 41% 6% 85% 54% 7% Not too confident 15% 23% 19% 2% 18% 25% 5% Not confident at all 28% 68% 22% 4% 67% 29% 3% Don't know/Undecided/Refused * - - 1% - 1% - Sampling Error (+/-) 4.2 8.1 6.5 7.5 7.9 7.9 6.5

@ssrs_solutions | 484.840.4300 | www.ssrs.com | 15
Lean Lean Demo- Repub Reg. Total crat lican voter ===== ===== ===== ===== Very/Somewhat Confident (Net) 57% 9% 93% 57% Very confident 42% 3% 74% 42% Somewhat confident 15% 6% 19% 14% Not Too/Not At All Confident (Net) 43% 91% 6% 43% Not too confident 15% 28% 3% 14% Not confident at all 28% 63% 3% 29% Don't know/Undecided/Refused * - * * Sampling Error (+/-) 4.2 6.6 5.8 4.3

@ssrs_solutions | 484.840.4300 | www.ssrs.com | 16
CNN/SSRS Poll -- January 30, 2018 104. So far, would you say Donald Trump has had the right priorities, or that he hasn't paid enough attention to the country's most important problems? Base: Total Respondents Non- Total Men Women White white ===== ===== ===== ===== ===== Has had the right priorities 54% 59% 49% 57% N/A Hasn't paid enough attention to the most important problems................................ 45% 40% 49% 42% N/A Don't know/Undecided/Refused 1% 1% 2% 1% N/A Sampling Error (+/-) 4.2 5.7 6.1 4.6 Total 18-34 35-49 50-64 65+ <45 45+ ===== ===== ===== ===== ===== ===== ===== Has had the right priorities 54% N/A N/A 62% 50% N/A 57% Hasn't paid enough attention to the most important problems................................ 45% N/A N/A 38% 47% N/A 42% Don't know/Undecided/Refused 1% N/A N/A - 3% N/A 1% Sampling Error (+/-) 4.2 7.1 6.6 4.6 Non- White White coll. Coll. non- coll. Total <$50K $50K+ grad grad. coll. grad. ===== ===== ===== ===== ===== ===== ===== Has had the right priorities 54% 55% 53% 61% 49% 70% 48% Hasn't paid enough attention to the most important problems................................ 45% 44% 47% 39% 49% 30% 50% Don't know/Undecided/Refused 1% 1% 1% * 2% - 2% Sampling Error (+/-) 4.2 7.6 5.3 6.3 5.6 7.2 6.0 Indep Con Demo- endnt Repub Lib- Mode- serva Total crat Other lican eral rate tive ===== ===== ===== ===== ===== ===== ===== Has had the right priorities 54% 9% 57% 89% 13% 42% 90% Hasn't paid enough attention to the most important problems................................ 45% 90% 42% 9% 86% 56% 8% Don't know/Undecided/Refused 1% 1% 1% 2% 1% 1% 2% Sampling Error (+/-) 4.2 8.1 6.5 7.5 7.9 7.9 6.5 Lean Lean Demo- Repub Reg. Total crat lican voter ===== ===== ===== ===== Has had the right priorities 54% 9% 90% 55% Hasn't paid enough attention to the most important problems................................ 45% 90% 9% 44% Don't know/Undecided/Refused 1% * 1% 1% Sampling Error (+/-) 4.2 6.6 5.8 4.3

@ssrs_solutions | 484.840.4300 | www.ssrs.com | 17
CNN/SSRS Poll -- January 30, 2018 105a. For each of the following, please tell me whether you think the policies being proposed by Donald Trump on that issue will move the country in the right direction or the wrong direction. * The economy * Base: Total Respondents Non- Total Men Women White white ===== ===== ===== ===== ===== Will move the country in the right direction 70% 75% 64% 71% N/A Will move the country in the wrong direction 28% 24% 32% 26% N/A Don't know/Undecided/Refused 3% 1% 4% 2% N/A Sampling Error (+/-) 4.2 5.7 6.1 4.6 Total 18-34 35-49 50-64 65+ <45 45+ ===== ===== ===== ===== ===== ===== ===== Will move the country in the right direction 70% N/A N/A 75% 67% N/A 72% Will move the country in the wrong direction 28% N/A N/A 22% 29% N/A 25% Don't know/Undecided/Refused 3% N/A N/A 3% 4% N/A 3% Sampling Error (+/-) 4.2 7.1 6.6 4.6 Non- White White coll. Coll. non- coll. Total <$50K $50K+ grad grad. coll. grad. ===== ===== ===== ===== ===== ===== ===== Will move the country in the right direction 70% 66% 70% 75% 65% 81% 65% Will move the country in the wrong direction 28% 31% 28% 23% 32% 18% 32% Don't know/Undecided/Refused 3% 3% 2% 2% 3% 2% 3% Sampling Error (+/-) 4.2 7.6 5.3 6.3 5.6 7.2 6.0 Indep Con Demo- endnt Repub Lib- Mode- serva Total crat Other lican eral rate tive ===== ===== ===== ===== ===== ===== ===== Will move the country in the right direction 70% 30% 76% 94% 33% 68% 95% Will move the country in the wrong direction 28% 65% 21% 6% 63% 27% 5% Don't know/Undecided/Refused 3% 6% 3% - 4% 5% * Sampling Error (+/-) 4.2 8.1 6.5 7.5 7.9 7.9 6.5 Lean Lean Demo- Repub Reg. Total crat lican voter ===== ===== ===== ===== Will move the country in the right direction 70% 35% 95% 69% Will move the country in the wrong direction 28% 60% 5% 28% Don't know/Undecided/Refused 3% 5% * 3% Sampling Error (+/-) 4.2 6.6 5.8 4.3
@ssrs_solutions | 484.840.4300 | www.ssrs.com | 18
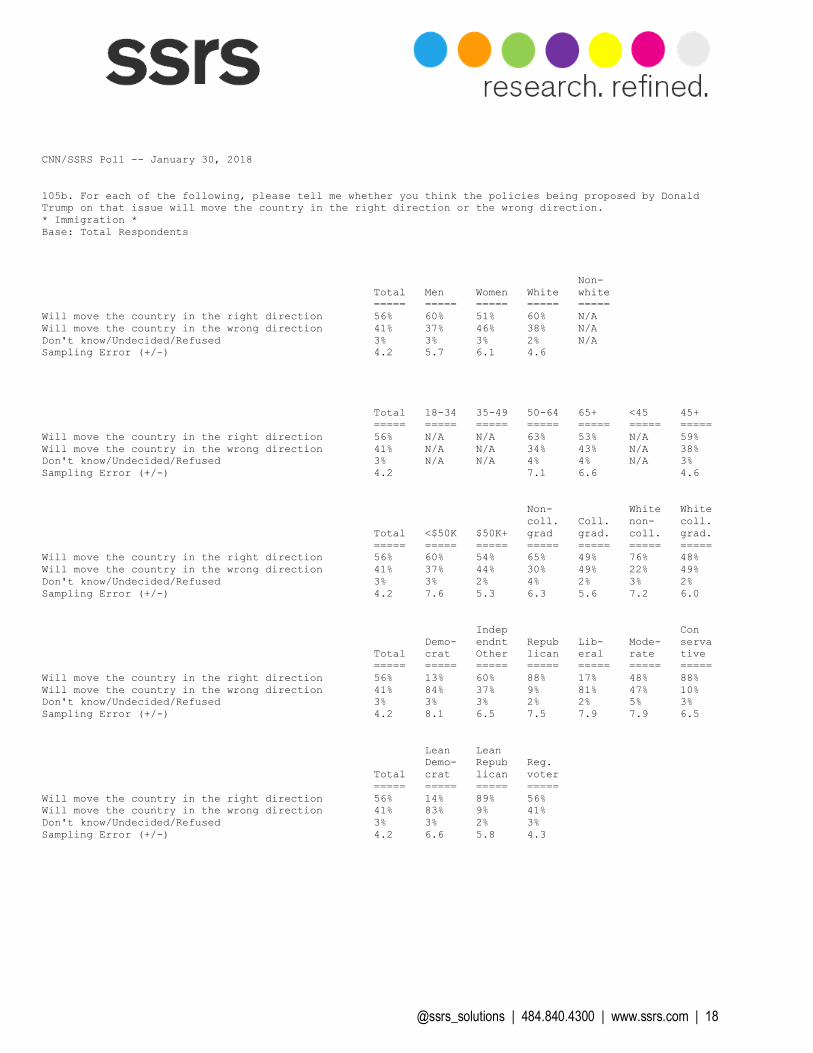
CNN/SSRS Poll -- January 30, 2018 105b. For each of the following, please tell me whether you think the policies being proposed by Donald Trump on that issue will move the country in the right direction or the wrong direction. * Immigration * Base: Total Respondents Non- Total Men Women White white ===== ===== ===== ===== ===== Will move the country in the right direction 56% 60% 51% 60% N/A Will move the country in the wrong direction 41% 37% 46% 38% N/A Don't know/Undecided/Refused 3% 3% 3% 2% N/A Sampling Error (+/-) 4.2 5.7 6.1 4.6 Total 18-34 35-49 50-64 65+ <45 45+ ===== ===== ===== ===== ===== ===== ===== Will move the country in the right direction 56% N/A N/A 63% 53% N/A 59% Will move the country in the wrong direction 41% N/A N/A 34% 43% N/A 38% Don't know/Undecided/Refused 3% N/A N/A 4% 4% N/A 3% Sampling Error (+/-) 4.2 7.1 6.6 4.6 Non- White White coll. Coll. non- coll. Total <$50K $50K+ grad grad. coll. grad. ===== ===== ===== ===== ===== ===== ===== Will move the country in the right direction 56% 60% 54% 65% 49% 76% 48% Will move the country in the wrong direction 41% 37% 44% 30% 49% 22% 49% Don't know/Undecided/Refused 3% 3% 2% 4% 2% 3% 2% Sampling Error (+/-) 4.2 7.6 5.3 6.3 5.6 7.2 6.0 Indep Con Demo- endnt Repub Lib- Mode- serva Total crat Other lican eral rate tive ===== ===== ===== ===== ===== ===== ===== Will move the country in the right direction 56% 13% 60% 88% 17% 48% 88% Will move the country in the wrong direction 41% 84% 37% 9% 81% 47% 10% Don't know/Undecided/Refused 3% 3% 3% 2% 2% 5% 3% Sampling Error (+/-) 4.2 8.1 6.5 7.5 7.9 7.9 6.5 Lean Lean Demo- Repub Reg. Total crat lican voter ===== ===== ===== ===== Will move the country in the right direction 56% 14% 89% 56% Will move the country in the wrong direction 41% 83% 9% 41% Don't know/Undecided/Refused 3% 3% 2% 3% Sampling Error (+/-) 4.2 6.6 5.8 4.3

@ssrs_solutions | 484.840.4300 | www.ssrs.com | 19
CNN/SSRS Poll -- January 30, 2018 105c. For each of the following, please tell me whether you think the policies being proposed by Donald Trump on that issue will move the country in the right direction or the wrong direction. * Trade * Base: Total Respondents Non- Total Men Women White white ===== ===== ===== ===== ===== Will move the country in the right direction 62% 65% 59% 63% N/A Will move the country in the wrong direction 35% 33% 38% 34% N/A Don't know/Undecided/Refused 3% 3% 4% 3% N/A Sampling Error (+/-) 4.2 5.7 6.1 4.6 Total 18-34 35-49 50-64 65+ <45 45+ ===== ===== ===== ===== ===== ===== ===== Will move the country in the right direction 62% N/A N/A 68% 59% N/A 64% Will move the country in the wrong direction 35% N/A N/A 29% 37% N/A 32% Don't know/Undecided/Refused 3% N/A N/A 3% 4% N/A 3% Sampling Error (+/-) 4.2 7.1 6.6 4.6 Non- White White coll. Coll. non- coll. Total <$50K $50K+ grad grad. coll. grad. ===== ===== ===== ===== ===== ===== ===== Will move the country in the right direction 62% 63% 60% 73% 53% 78% 52% Will move the country in the wrong direction 35% 34% 37% 26% 42% 20% 43% Don't know/Undecided/Refused 3% 4% 3% 1% 5% 1% 5% Sampling Error (+/-) 4.2 7.6 5.3 6.3 5.6 7.2 6.0 Indep Con Demo- endnt Repub Lib- Mode- serva Total crat Other lican eral rate tive ===== ===== ===== ===== ===== ===== ===== Will move the country in the right direction 62% 21% 66% 91% 24% 55% 93% Will move the country in the wrong direction 35% 74% 32% 6% 72% 41% 6% Don't know/Undecided/Refused 3% 6% 2% 2% 4% 5% 2% Sampling Error (+/-) 4.2 8.1 6.5 7.5 7.9 7.9 6.5 Lean Lean Demo- Repub Reg. Total crat lican voter ===== ===== ===== ===== Will move the country in the right direction 62% 24% 90% 62% Will move the country in the wrong direction 35% 71% 8% 35% Don't know/Undecided/Refused 3% 5% 2% 3% Sampling Error (+/-) 4.2 6.6 5.8 4.3

@ssrs_solutions | 484.840.4300 | www.ssrs.com | 20
CNN/SSRS Poll -- January 30, 2018 105d. For each of the following, please tell me whether you think the policies being proposed by Donald Trump on that issue will move the country in the right direction or the wrong direction. * Taxes * Base: Total Respondents Non- Total Men Women White white ===== ===== ===== ===== ===== Will move the country in the right direction 62% 65% 57% 64% N/A Will move the country in the wrong direction 36% 34% 39% 34% N/A Don't know/Undecided/Refused 2% 1% 4% 2% N/A Sampling Error (+/-) 4.2 5.7 6.1 4.6 Total 18-34 35-49 50-64 65+ <45 45+ ===== ===== ===== ===== ===== ===== ===== Will move the country in the right direction 62% N/A N/A 67% 60% N/A 64% Will move the country in the wrong direction 36% N/A N/A 32% 36% N/A 34% Don't know/Undecided/Refused 2% N/A N/A 1% 4% N/A 3% Sampling Error (+/-) 4.2 7.1 6.6 4.6 Non- White White coll. Coll. non- coll. Total <$50K $50K+ grad grad. coll. grad. ===== ===== ===== ===== ===== ===== ===== Will move the country in the right direction 62% 63% 60% 71% 54% 77% 54% Will move the country in the wrong direction 36% 34% 39% 28% 43% 21% 43% Don't know/Undecided/Refused 2% 4% 1% 1% 3% 2% 3% Sampling Error (+/-) 4.2 7.6 5.3 6.3 5.6 7.2 6.0 Indep Con Demo- endnt Repub Lib- Mode- serva Total crat Other lican eral rate tive ===== ===== ===== ===== ===== ===== ===== Will move the country in the right direction 62% 19% 66% 92% 20% 55% 94% Will move the country in the wrong direction 36% 78% 32% 7% 78% 42% 4% Don't know/Undecided/Refused 2% 3% 3% 1% 2% 3% 2% Sampling Error (+/-) 4.2 8.1 6.5 7.5 7.9 7.9 6.5 Lean Lean Demo- Repub Reg. Total crat lican voter ===== ===== ===== ===== Will move the country in the right direction 62% 20% 93% 61% Will move the country in the wrong direction 36% 76% 6% 37% Don't know/Undecided/Refused 2% 3% 1% 2% Sampling Error (+/-) 4.2 6.6 5.8 4.3

@ssrs_solutions | 484.840.4300 | www.ssrs.com | 21
CNN/SSRS Poll -- January 30, 2018 105e. For each of the following, please tell me whether you think the policies being proposed by Donald Trump on that issue will move the country in the right direction or the wrong direction. * National Security * Base: Total Respondents Non- Total Men Women White white ===== ===== ===== ===== ===== Will move the country in the right direction 65% 73% 57% 67% N/A Will move the country in the wrong direction 33% 26% 41% 31% N/A Don't know/Undecided/Refused 2% 1% 2% 2% N/A Sampling Error (+/-) 4.2 5.7 6.1 4.6 Total 18-34 35-49 50-64 65+ <45 45+ ===== ===== ===== ===== ===== ===== ===== Will move the country in the right direction 65% N/A N/A 71% 64% N/A 68% Will move the country in the wrong direction 33% N/A N/A 28% 33% N/A 30% Don't know/Undecided/Refused 2% N/A N/A 1% 3% N/A 2% Sampling Error (+/-) 4.2 7.1 6.6 4.6 Non- White White coll. Coll. non- coll. Total <$50K $50K+ grad grad. coll. grad. ===== ===== ===== ===== ===== ===== ===== Will move the country in the right direction 65% 66% 64% 73% 59% 78% 59% Will move the country in the wrong direction 33% 32% 35% 25% 39% 20% 39% Don't know/Undecided/Refused 2% 2% 1% 1% 2% 2% 2% Sampling Error (+/-) 4.2 7.6 5.3 6.3 5.6 7.2 6.0 Indep Con Demo- endnt Repub Lib- Mode- serva Total crat Other lican eral rate tive ===== ===== ===== ===== ===== ===== ===== Will move the country in the right direction 65% 25% 69% 94% 22% 66% 93% Will move the country in the wrong direction 33% 74% 28% 6% 75% 32% 6% Don't know/Undecided/Refused 2% 1% 3% - 3% 1% 1% Sampling Error (+/-) 4.2 8.1 6.5 7.5 7.9 7.9 6.5 Lean Lean Demo- Repub Reg. Total crat lican voter ===== ===== ===== ===== Will move the country in the right direction 65% 26% 94% 65% Will move the country in the wrong direction 33% 71% 5% 33% Don't know/Undecided/Refused 2% 2% * 2% Sampling Error (+/-) 4.2 6.6 5.8 4.3

@ssrs_solutions | 484.840.4300 | www.ssrs.com | 22
CNN/SSRS Poll -- January 30, 2018 105f. For each of the following, please tell me whether you think the policies being proposed by Donald Trump on that issue will move the country in the right direction or the wrong direction. * Infrastructure * Base: Total Respondents Non- Total Men Women White white ===== ===== ===== ===== ===== Will move the country in the right direction 79% 84% 74% 80% N/A Will move the country in the wrong direction 17% 12% 23% 16% N/A Don't know/Undecided/Refused 4% 5% 4% 4% N/A Sampling Error (+/-) 4.2 5.7 6.1 4.6 Total 18-34 35-49 50-64 65+ <45 45+ ===== ===== ===== ===== ===== ===== ===== Will move the country in the right direction 79% N/A N/A 78% 83% N/A 81% Will move the country in the wrong direction 17% N/A N/A 17% 13% N/A 15% Don't know/Undecided/Refused 4% N/A N/A 5% 4% N/A 5% Sampling Error (+/-) 4.2 7.1 6.6 4.6 Non- White White coll. Coll. non- coll. Total <$50K $50K+ grad grad. coll. grad. ===== ===== ===== ===== ===== ===== ===== Will move the country in the right direction 79% 77% 80% 81% 77% 84% 78% Will move the country in the wrong direction 17% 22% 16% 17% 17% 13% 17% Don't know/Undecided/Refused 4% 2% 4% 2% 6% 3% 5% Sampling Error (+/-) 4.2 7.6 5.3 6.3 5.6 7.2 6.0 Indep Con Demo- endnt Repub Lib- Mode- serva Total crat Other lican eral rate tive ===== ===== ===== ===== ===== ===== ===== Will move the country in the right direction 79% 57% 82% 94% 61% 78% 93% Will move the country in the wrong direction 17% 38% 13% 4% 35% 17% 4% Don't know/Undecided/Refused 4% 5% 5% 2% 5% 5% 3% Sampling Error (+/-) 4.2 8.1 6.5 7.5 7.9 7.9 6.5 Lean Lean Demo- Repub Reg. Total crat lican voter ===== ===== ===== ===== Will move the country in the right direction 79% 62% 92% 79% Will move the country in the wrong direction 17% 33% 5% 17% Don't know/Undecided/Refused 4% 5% 3% 4% Sampling Error (+/-) 4.2 6.6 5.8 4.3

@ssrs_solutions | 484.840.4300 | www.ssrs.com | 23
CNN/SSRS Poll -- January 30, 2018 106. In his speech tonight, did Donald Trump make you feel more optimistic or more pessimistic about the direction the country is headed in over the next few years? Base: Total Respondents Non- Total Men Women White white ===== ===== ===== ===== ===== More optimistic 63% 66% 59% 64% N/A More pessimistic 35% 31% 40% 35% N/A Neither 1% 1% 1% * N/A Don't know/Undecided/Refused 1% 2% * 1% N/A Sampling Error (+/-) 4.2 5.7 6.1 4.6 Total 18-34 35-49 50-64 65+ <45 45+ ===== ===== ===== ===== ===== ===== ===== More optimistic 63% N/A N/A 66% 61% N/A 64% More pessimistic 35% N/A N/A 32% 38% N/A 34% Neither 1% N/A N/A 1% * N/A 1% Don't know/Undecided/Refused 1% N/A N/A 1% 1% N/A 1% Sampling Error (+/-) 4.2 7.1 6.6 4.6 Non- White White coll. Coll. non- coll. Total <$50K $50K+ grad grad. coll. grad. ===== ===== ===== ===== ===== ===== ===== More optimistic 63% 64% 61% 71% 56% 76% 56% More pessimistic 35% 35% 37% 28% 42% 23% 43% Neither 1% - 1% * 1% - * Don't know/Undecided/Refused 1% 1% 1% 1% 1% 1% 1% Sampling Error (+/-) 4.2 7.6 5.3 6.3 5.6 7.2 6.0 Indep Con Demo- endnt Repub Lib- Mode- serva Total crat Other lican eral rate tive ===== ===== ===== ===== ===== ===== ===== More optimistic 63% 21% 66% 94% 23% 57% 93% More pessimistic 35% 75% 32% 6% 75% 40% 7% Neither 1% 2% * - 2% 1% - Don't know/Undecided/Refused 1% 1% 1% - 1% 3% * Sampling Error (+/-) 4.2 8.1 6.5 7.5 7.9 7.9 6.5 Lean Lean Demo- Repub Reg. Total crat lican voter ===== ===== ===== ===== More optimistic 63% 21% 94% 63% More pessimistic 35% 76% 6% 36% Neither 1% 2% - 1% Don't know/Undecided/Refused 1% 1% * 1% Sampling Error (+/-) 4.2 6.6 5.8 4.3