cnn - turner broadcasting systemi2.cdn.turner.com/cnn/2017/images/10/17/rel10b.-.trump,.guns.pdf ·...
TRANSCRIPT

@ssrs_solutions | 484.840.4300 | www.ssrs.com | 1
CNNOctober2017
ThestudywasconductedforCNNviatelephonebySSRS,anindependentresearchcompany.InterviewswereconductedfromOctober12,2017–October152017amongasampleof1,010respondents.Thelandlinetotalrespondentswere405andtherewere605ofcellphonerespondents.Themarginofsamplingerrorfortotalrespondentsis+/-3.5atthe95%confidencelevel.
Thedesigneffectis1.32.MoreinformationaboutSSRScanbeobtainedbyvisitingwww.ssrs.com.
EMBARGOEDFORRELEASE:Tuesday,October17at6:00a.m.

@ssrs_solutions | 484.840.4300 | www.ssrs.com | 2
Q1. (A1)DoyouapproveordisapproveofthewayDonaldTrumpishandlinghisjobaspresident?
Approve Disapprove NoopinionOctober12-15,2017 37% 57% 6%September26-28,2017 37% 56% 7%September17-20,2017 40% 55% 5%August03-06,2017 38% 56% 5%April22-25,2017 44% 54% 2%March1-4,2017 45% 52% 3%Jan.31-Feb.2,2017 44% 53% 3% Q1. (A1)DoyouapproveordisapproveofthewayDonaldTrumpishandlinghisjobaspresident? (ASKIF,RespondentswhoapproveofthewayDonaldTrumpishandlinghisjobaspresidentN=392) Q1a. (A1a)Doyouapprovestrongly,oronlymoderately? (ASKIF,RespondentswhodisapproveofthewayDonaldTrumpishandlinghisjobaspresidentN=560) Q1b. (A1b)Doyoudisapprovestrongly,oronlymoderately?A1/A1a/A1bCOMBOTABLE
NET
ApproveApprovestrongly
Approvemoderately
NETDisapprove
Disapprovestrongly
Disapprovemoderately
Noopinion
October12-15,2017
37% 25% 12% 56% 47% 9% 6%
Sept.17-20,2017
40% 26% 14% 55% 45% 10% 5%
Aug.3-6,2017
38% 24% 14% 56% 47% 9% 5%
Mar1-4,2017
44% 30% 14% 52% 41% 11% 4%
Jan31—Feb2,2017
45% 33% 12% 52% 43% 9% 3%

@ssrs_solutions | 484.840.4300 | www.ssrs.com | 3
Q2. (A2)DoyouapproveordisapproveofthewayDonaldTrumpishandling…?
Immigration Approve Disapprove NoopinionOctober12-15,2017 37% 59% 5%September17-20,2017 36% 60% 4%August03-06,2017* 40% 55% 5%April22-25,2017 41% 57% 2%March1-4,2017 44% 55% 1%Jan.31-Feb.2,2017 42% 56% 2%
Environmentalpolicy Approve Disapprove NoopinionOctober12-15,2017 32% 56% 12%March1-4,2017* 42% 52% 5%
HisrelationshipwithRepublicansinCongress
Approve Disapprove Noopinion
October12-15,2017 32% 54% 14% *Askedofhalfsample.

@ssrs_solutions | 484.840.4300 | www.ssrs.com | 4
Q3. DoyouthinkthepoliciesbeingproposedbyDonaldTrumpwillmovethecountryintherightdirectionorthewrongdirection?
Rightdirection Wrongdirection NoopinionOctober12-15,2017 38% 56% 6%March1-4,2017* 49% 50% 1%Jan12-15,2017* 48% 49% 3%July29-31,2016(RV) 38% 59% 3%July13-16,2016(RV) 40% 57% 3% *Askedofhalfsample. Q3a Asyoumayknow,RepublicanscontrolbothhousesofCongressandtheWhiteHouse.Doyouhavemoreconfidence
inPresidentTrumptodealwiththemajorissuesfacingthecountrytoday,ormoreconfidenceintheRepublicansinCongresstodealwiththoseissues?
PresidentTrump
RepublicansinCongress
Neither(vol.) Noopinion
October12-15,2017 30% 47% 17% 5%
Q4. Whichofthefollowingisthemostimportantissuefacingthecountrytoday?
Nationalsecurity
HealthcareThe
economyCivilrights
Foreignpolicy
Immi-gration
Other(vol.) Noopinion
October12-15,2017
21% 21% 17% 14% 11% 10% 3% 3%
March1-4,2017
16% 20% 26% 12% 7% 13% 6% *
@ssrs_solutions | 484.840.4300 | www.ssrs.com | 5
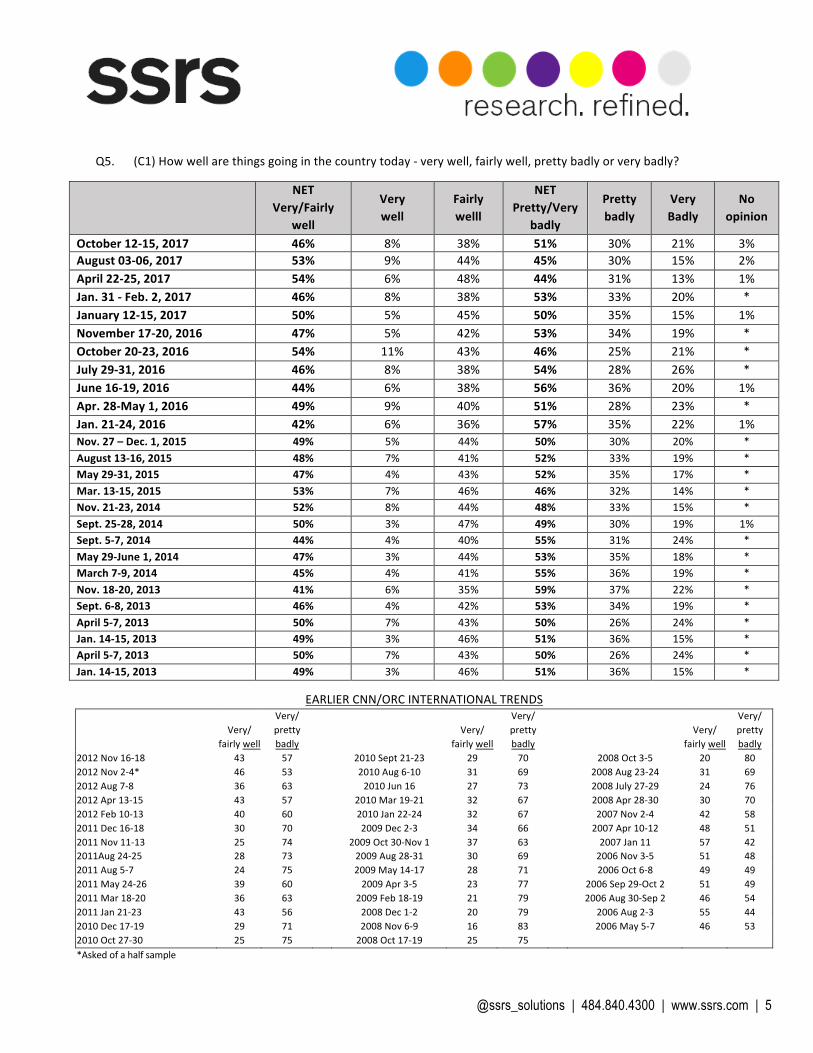
Q5. (C1)Howwellarethingsgoinginthecountrytoday-verywell,fairlywell,prettybadlyorverybadly?
NETVery/Fairly
well
Verywell
Fairlywelll
NETPretty/Very
badly
Prettybadly
VeryBadly
Noopinion
October12-15,2017 46% 8% 38% 51% 30% 21% 3%August03-06,2017 53% 9% 44% 45% 30% 15% 2%April22-25,2017 54% 6% 48% 44% 31% 13% 1%Jan.31-Feb.2,2017 46% 8% 38% 53% 33% 20% *January12-15,2017 50% 5% 45% 50% 35% 15% 1%November17-20,2016 47% 5% 42% 53% 34% 19% *October20-23,2016 54% 11% 43% 46% 25% 21% *July29-31,2016 46% 8% 38% 54% 28% 26% *June16-19,2016 44% 6% 38% 56% 36% 20% 1%Apr.28-May1,2016 49% 9% 40% 51% 28% 23% *Jan.21-24,2016 42% 6% 36% 57% 35% 22% 1%Nov.27–Dec.1,2015 49% 5% 44% 50% 30% 20% *August13-16,2015 48% 7% 41% 52% 33% 19% *May29-31,2015 47% 4% 43% 52% 35% 17% *Mar.13-15,2015 53% 7% 46% 46% 32% 14% *Nov.21-23,2014 52% 8% 44% 48% 33% 15% *Sept.25-28,2014 50% 3% 47% 49% 30% 19% 1%Sept.5-7,2014 44% 4% 40% 55% 31% 24% *May29-June1,2014 47% 3% 44% 53% 35% 18% *March7-9,2014 45% 4% 41% 55% 36% 19% *Nov.18-20,2013 41% 6% 35% 59% 37% 22% *Sept.6-8,2013 46% 4% 42% 53% 34% 19% *April5-7,2013 50% 7% 43% 50% 26% 24% *Jan.14-15,2013 49% 3% 46% 51% 36% 15% *April5-7,2013 50% 7% 43% 50% 26% 24% *Jan.14-15,2013 49% 3% 46% 51% 36% 15% *
EARLIERCNN/ORCINTERNATIONALTRENDS
Very/
fairlywell
Very/prettybadly
Very/fairlywell
Very/prettybadly
Very/fairlywell
Very/prettybadly
2012Nov16-18 43 57 2010Sept21-23 29 70 2008Oct3-5 20 802012Nov2-4* 46 53 2010Aug6-10 31 69 2008Aug23-24 31 692012Aug7-8 36 63 2010Jun16 27 73 2008July27-29 24 762012Apr13-15 43 57 2010Mar19-21 32 67 2008Apr28-30 30 702012Feb10-13 40 60 2010Jan22-24 32 67 2007Nov2-4 42 582011Dec16-18 30 70 2009Dec2-3 34 66 2007Apr10-12 48 512011Nov11-13 25 74 2009Oct30-Nov1 37 63 2007Jan11 57 422011Aug24-25 28 73 2009Aug28-31 30 69 2006Nov3-5 51 482011Aug5-7 24 75 2009May14-17 28 71 2006Oct6-8 49 492011May24-26 39 60 2009Apr3-5 23 77 2006Sep29-Oct2 51 492011Mar18-20 36 63 2009Feb18-19 21 79 2006Aug30-Sep2 46 542011Jan21-23 43 56 2008Dec1-2 20 79 2006Aug2-3 55 442010Dec17-19 29 71 2008Nov6-9 16 83 2006May5-7 46 532010Oct27-30 25 75 2008Oct17-19 25 75 *Askedofahalfsample

@ssrs_solutions | 484.840.4300 | www.ssrs.com | 6
Trendsfrom1974toMay,2004:CNN/TimeorTimemagazinepolls;TrendsfromOctober,2004toFeb,2006:CNN/USAToday/Galluppolls
Very/fairlywell
Very/prettybadly
Very/fairlywell
Very/prettybadly
Very/fairlywell
Very/prettybadly
Very/fairlywell
Very/prettybadly
Very/fairlywell
Very/prettybadly
2006Feb9-12 52 47 1999Mar25 70 29 1994Sep 45 53 1991Apr 56 42 1981Jan 26 742005Nov11-13 49 50 1999Mar4 73 26 1994Sep 46 53 1991Apr 59 41 1980Oct 32 682005Sep8-11 50 50 1999Jan20-21 77 22 1994Sep 42 57 1991Mar 74 26 1980Aug 30 702005July23-24 58 41 1999Jan7 74 25 1994Aug 42 58 1991Feb 58 42 1980May 21 792005April1-2 61 38 1998Dec17-18 60 38 1994Aug 45 52 1991Jan 39 61 1980Mar 24 762005Jan7-9 58 41 1998Oct14-15 78 21 1994Aug 49 50 1990Dec 45 55 1980Jan 34 652004Oct29-31 55 44 1998Sep23-24 72 26 1994Jul 51 48 1990Nov 42 58 1979Dec 36 642004Oct9-10 54 46 1998Sep16-17 72 25 1994Jun 49 49 1990Oct 38 62 1979Oct 36 682004May12-13 60 39 1998Aug18 77 21 1994Jun 56 41 1990Oct 41 59 1979Aug 31 702004Apr8 63 36 1998Jul30 68 31 1994May 48 51 1990Oct 42 58 1979Apr 36 652004Feb5-6 52 47 1998Jun30-Jul1 67 31 1994May 49 50 1990Sep 52 48 1978Oct 56 442004Jan14-15 53 46 1998Jun26-Jul5 55 44 1994Apr 47 52 1990Aug 55 45 1978May 49 512003Dec30-Jan1 49 49 1998May18-19 66 30 1994Apr 53 44 1990Jul 55 45 1978Mar 53 472003Nov18-19 52 46 1998Apr8-9 70 30 1994Mar 48 49 1990May 61 37 1977Nov 64 352003Sep3-4 49 49 1998Mar18-19 76 25 1994Mar 49 50 1990Apr 62 38 1977Jul 69 312003Jul16-17 57 42 1998Feb4-5 74 25 1994Feb 47 51 1990Mar 62 38 1977May 65 352003May21-22 60 39 1998Jan28-29 79 19 1994Jan 52 47 1990Feb 70 30 1977Mar 69 312003Mar27 63 36 1998Jan22 68 31 1993Dec 48 50 1990Jan 67 33 1976Oct 56 442003Feb19-20 52 47 1998Jan14-15 65 32 1993Nov 45 54 1989Oct 62 38 1976Sep 57 442003Feb6 53 46 1997Oct30 67 31 1993Oct 40 58 1989Jun 61 39 1976Aug 60 402003Jan15-16 49 49 1997Sep10-11 63 34 1993Oct 39 58 1989Jan 69 31 1976Jun 50 502002Dec17-18 54 45 1997Jul30-31 69 29 1993Oct 41 59 1988Oct 70 31 1976Apr 52 482002Nov13-14 56 42 1997Jun4-5 64 34 1993Sep 47 52 1988Sep 73 27 1976Jan 46 552002Oct23-24 49 49 1997May7-8 63 35 1993Sep 42 57 1988Apr 64 40 1975May 40 612002Aug28-29 57 41 1997Apr16-17 62 37 1993Aug 39 58 1988Mar 65 33 1975Jan 23 782002Jul10-11 59 39 1997Mar11-12 57 41 1993Aug 41 57 1988Feb 60 37 1974Sep 30 702002Jun19-20 57 41 1997Feb26-27 64 35 1993Jun 41 56 1988Jan 62 38 1974Mar 29 712002May22-23 64 35 1997Feb5-6 67 33 1993May 40 58 1987Oct 58 42 2002Apr10-11 61 38 1997Jan8-9 63 35 1993May 43 56 1987Aug 61 39 2002Mar13-14 69 29 1996Oct 67 32 1993Apr 45 53 1987May 64 37 2002Jan23-24 66 34 1996Jun 61 37 1993Mar 48 50 1987Feb 61 40 2001Dec19-20 64 34 1996Jun 62 37 1993Feb 48 49 1987Jan 61 39 2001Nov7-8 63 35 1996Feb 53 44 1993Feb 48 49 1986Sep 63 37 2001Oct12 65 33 1996Jan 48 50 1993Jan 53 45 1986Jul 69 31 2001Sep27 59 38 1996Jan 48 50 1993Jan 47 52 1986May 65 34 2001Sep13 45 53 1995Dec 54 44 1992Oct 35 65 1986Apr 67 32 2001Jul17-18 70 29 1995Oct 46 52 1992Sep 32 68 1985Nov 70 31 2001May23-24 65 33 1995Oct 47 51 1992Aug 35 63 1985Sep 67 33 2001Feb7-8 71 28 1995Sep 50 49 1992Jul 31 67 1985Jul 70 31 2001Jan10-11 73 24 1995Sep 50 49 1992Jun 35 62 1985Apr 69 32 2000Nov10 74 25 1995Aug 47 52 1992Jun 33 65 1984Dec 74 26 2000Oct25-26 79 19 1995Jul 51 47 1992May 30 68 1984Oct 74 26 2000Oct12-13 76 22 1995Jun 53 47 1992Apr 33 65 1984Sep 71 30 2000Oct4-5 77 22 1995Jun 45 51 1992Mar 33 66 1984Aug 68 32 2000Sep6-7 79 19 1995May 50 49 1992Feb 35 62 1984Jan 67 32 2000Aug9-10 77 21 1995Apr 46 52 1992Jan 29 71 1983Dec 60 40 2000Jul26-27 74 24 1995Mar 52 46 1992Jan 35 64 1983Sep 56 45 2000Jun14-15 72 27 1995Mar 49 48 1992Jan 36 64 1983Jun 58 41 2000Mar8-9 76 22 1995Feb 54 44 1991Dec 29 71 1983Mar 46 55 2000Feb2-3 78 17 1995Jan 58 41 1991Nov 36 64 1982Dec 35 65 2000Jan12-13 81 19 1995Jan 56 43 1991Oct 42 56 1982Oct 40 60 2000Jan5-6 80 19 1995Jan 54 44 1991Oct 42 58 1982Jun 40 60 1999Nov10-11 68 30 1994Dec 55 44 1991Sep 49 49 1982Mar 39 62 1999Jul14-15 70 28 1994Nov 49 48 1991Aug 53 47 1981Dec 43 58 1999Jun9-10 69 31 1994Oct 50 49 1991Jun 53 47 1981Sep 53 47 1999May26-27 61 37 1994Oct 51 47 1991May 53 47 1981May 51 50

POLL10 Oct.12-15,2017 @ssrs_solutions | 484.840.4300 | www.ssrs.com | 7
Q6. (H1)IftheelectionsforCongresswerebeingheldtoday,whichparty'scandidatewouldyouvoteforinyourCongressionaldistrict–
(ASKIF,RespondentswhowouldvoteforanothercandidateornoopiniontosayforwhomtheywouldvoteN=151)
Q6a. (H1a)Asoftoday,doyouleanmoretowardH1/H1aCOMBOTABLE
TheDemocraticParty'scandidate
TheRepublicanParty'scandidate
Neither/Othercandidate(vol.)
Don'tplantovote(vol.)
Noopinion
October12-15,2017 51% 37% 3% 2 6%October12-15,2017(RV) 54% 38% 3% 1% 5%Sept.17-20,2017 50% 41% 3% 3% 3%Sept.17-20,2017(RV) 49% 43% 2% 2% 3%August03-06,2017 51% 40% 3% 2% 4%August03-06,2017(RV) 51% 42% 3% 1% 3%April22-25,2017 50% 41% 6% 2% 1%April22-25,2017(RV) 49% 41% 7% 1% 1%October20-23,2016(RV) 49% 47% 1% 2% 1%Sept.1-4,2016(RV) 46% 47% 3% 2% 1%Oct.24-26,2014 49% 43% 5% 1% 2%Sept.25-28,2014 49% 42% 5% 2% 3%Sept.5-7,2014 47% 45% 5% 2% 1%July18-20,2014 48% 44% 5% 1% 2%May2-4,2014 45% 46% 5% 3% 1%Nov.18-20,2013 47% 48% 3% 2% 1%Oct.18-20,2013 50% 41% 4% 4% 1%Nov.2-4,2012(RV) 50% 46% 2% * 1%May29-31,2012 50% 43% 4% 2% 2%Apr.29-May1,2011 50% 45% 3% NA 3%Oct.27-30,2010 45% 46% 5% NA 4%Oct.5-7,2010 47% 46% 5% NA 3%Sept.21-23,2010 45% 49% 5% NA 2%Sept.1-2,2010 45% 49% 5% NA 1%Aug.6-10,2010 47% 45% 6% NA 1%July16-21,2010 44% 50% 5% NA 1%May21-23,2010 48% 44% 8% NA 1%April9-11,2010 50% 45% 4% NA 2%March25-28,2010 46% 48% 4% NA 2%March19-21,2010 46% 46% 6% NA 3%February12-15,2010 46% 46% 5% NA 3%Jan.8-10,2010 45% 46% 6% NA 2%Nov.13-15,2009 49% 42% 7% NA 2%Oct.30-Nov.1,2009 51% 41% 6% NA 2%

POLL10 Oct.12-15,2017 @ssrs_solutions | 484.840.4300 | www.ssrs.com | 8
Q6. (H1)IftheelectionsforCongresswerebeingheldtoday,whichparty'scandidatewouldyouvoteforinyourCongressionaldistrict–
(ASKIF,RespondentswhowouldvoteforanothercandidateornoopiniontosayforwhomtheywouldvoteN=151)
Q6a. (H1a)Asoftoday,doyouleanmoretowardH1/H1aCOMBOTABLECONTINUED
TheDemocraticParty'scandidate
TheRepublicanParty'scandidate
Neither/Othercandidate(vol.)
Don'tplantovote(vol.)
Noopinion
Oct.30-Nov.1,2008(RV) 53% 45% 1% NA 1%October3-5,2008(RV) 54% 45% 1% NA *Sept.19-21,2008(RV) 56% 42% 2% NA 1%September5-7,2008(RV) 49% 46% 3% NA 1%June4-5,2008(RV) 54% 44% 2% NA 1%November2-4,2007(RV) 53% 42% 4% NA 1%June22-24,2007(RV) 53% 41% 4% NA 2%Nov.3-5,2006 54% 39% 3% NA 4%Oct.27-29,2006 55% 37% 2% NA 6%Oct.20-22,2006 54% 40% 2% NA 4%Oct.13-15,2006 55% 37% 3% NA 5%Oct.6-8,2006 55% 36% 2% NA 7%Sept.29-Oct.2,2006 54% 37% 2% NA 7%Sept.22-24,2006 52% 42% 1% NA 5%Aug.30-Sept.2,2006 55% 39% 2% NA 4%Aug.18-20,2006 52% 41% 3% NA 7%Aug.2-3,2006 51% 40% 2% NA 5%June14-15,2006 44% 36% 4% NA 4%May5-7,2006 50% 37% 3% NA 4%April21-23,2006 50% 38% 4% NA 7%

POLL10 Oct.12-15,2017 @ssrs_solutions | 484.840.4300 | www.ssrs.com | 9
Q7. (G1)Doyoufavororopposestricterguncontrollaws? Favor Oppose NoopinionOctober12-15,2017 52% 44% 4%June16-19,2016 55% 42% 3%Oct.14-17,2015 46% 52% 3%June26-28,2015 49% 49% 1%Sept.5-7,2014 44% 55% 1%Nov.18-20,2013 49% 50% 1%April5-7,2013 53% 45% 2%Jan.14-15,2013 55% 44% 1%
CNN/TIMETRENDS
Favor Oppose Noopinion 2003May21-22 52 43 52002Oct23-24 51 43 62000Jan12-13 59 35 61999May26-27 62 34 41996Feb24-27 48 47 51995Oct31-Nov6 59 34 71993Dec2 70 27 31993Mar18 68 29 31989Dec15-22 51 38 111989Feb13-14 65 28 7

POLL10 Oct.12-15,2017 @ssrs_solutions | 484.840.4300 | www.ssrs.com | 10
Q7. (G1)Doyoufavororopposestricterguncontrollaws? (ASKIF,RespondentswhofavorstricterguncontrollawsN=534) Q7a. (G1a)Wouldyousayyoustronglyfavorstricterguncontrollaws,oronlymoderatelyfavorthem? (ASKIF,RespondentswhoopposestricterguncontrollawsN=427) Q7b. (G1b)Wouldyousayyoustronglyopposestricterguncontrollaws,oronlymoderatelyopposethem?G1a/G1bCOMBOTABLE
NETStrongly/
Moderatelyfavor
Stronglyfavor
Moderatelyfavor
NETStongly/
Moderatelyoppose
Stronglyoppose
Moderatelyoppose
Noopinion
October12-15,2017
51% 36% 15% 43% 27% 16% 4%
June16-19,2016
55% 37% 18% 42% 23% 19% 3%
Sept.5-7,2014
44% 29% 15% 55% 36% 19% 1%
Nov.18-20,2013
49% 31% 18% 50% 32% 18% 1%
Apr.5-7,2013
56% 36% 17% 45% 29% 16% 2%
Jan.14-15,2013
55% 37% 18% 44% 27% 17% 1%

POLL10 Oct.12-15,2017 @ssrs_solutions | 484.840.4300 | www.ssrs.com | 11
Q8. Doyouthinkhavingstricterguncontrollawswouldreducethenumberofgun-relateddeathsinthecountry,ornot?
Yes No Noopinion
October12-15,2017 46% 51% 3%June26-28,2015* 40% 60% **Askedofhalfsample. Q9. Pleasetellmewhetheryouwouldgenerallyfavororopposeeachofthefollowingproposalswhichsome
peoplehavemadetoreducetheamountofgunviolence:a. Abanonthemanufacture,saleandpossessionofhigh-poweredriflescapableofsemi-automaticfire,suchasthe
AR-15 Favor Oppose NoopinionOctober12-15,2017 49% 49% 3%April5-7,2013* 51% 48% 1%*QUESTIONWORDINGAPRIL2013:“Abanonthemanufacture,saleandpossessionofso-calledassaultrifles,capableofsemi-automaticfire,suchastheAR-15”
FORCOMPARISON:
Abanonthemanufacture,saleandpossessionofsemi-automaticassaultguns,suchastheAK-47 Favor Oppose NoopinionCNN/ORCTRENDS June16-19,2016 54% 44% 2%January14-15,2013 56% 44% 1%December17-18,2012 56% 44% 1%August7-8,2012 57% 42% 1%January14-16,2011 61% 37% 2% CNN/USATODAY/GALLUPTREND December17-21,1993 77% 20% 3%

POLL10 Oct.12-15,2017 @ssrs_solutions | 484.840.4300 | www.ssrs.com | 12
Q9. Pleasetellmewhetheryouwouldgenerallyfavororopposeeachofthefollowingproposalswhichsomepeoplehavemadetoreducetheamountofgunviolence:
b. Abanonthesaleandpossessionofequipmentknownashigh-capacityorextendedammunitionmagazines,whichallowsomegunstoshootmorethan10bulletsbeforetheyneedtobereloaded.
Favor Oppose NoopinionOctober12-15,2017 54% 43% 2%June16-19,2016* 54% 45% 1%April5-7,2013 53% 46% 1%January14-15,2013* 58% 41% 1%December17-18,2012* 62% 37% 1%August7-8,2012* 60% 40% 1%Jan.14-16,2011* 61% 38% 1%*QUESTIONWORDINGJUNE2016,JAN.2013ANDEARLIER:“Abanonthesaleandpossessionofequipmentknownashigh-capacityorextendedammunitionclips,whichallowsomegunstoshootmorethan10bulletsbeforetheyneedtobereloaded”Q9. Pleasetellmewhetheryouwouldgenerallyfavororopposeeachofthefollowingproposalswhichsome
peoplehavemadetoreducetheamountofgunviolence: c. PreventingallAmericansfromowningguns. Favor Oppose NoopinionOctober12-15,2017 11% 86% 2%June16-19,2016 9% 90% *August7-8,2012 10% 89% *June4-5,2008* 13% 87% **QUESTIONWORDINGJUNE2008:“Thinkingaboutspecificwaysthatthegovernmenthasdealtwithgunsinthepast,doyoufavororopposeeachofthefollowing.” Q9. Pleasetellmewhetheryouwouldgenerallyfavororopposeeachofthefollowingproposalswhichsome
peoplehavemadetoreducetheamountofgunviolence: d. Limitingthenumberofgunsanindividualcanown. Favor Oppose NoopinionOctober12-15,2017 46% 51% 3%December17-18,2012 48% 52% *August7-8,2012 45% 54% 1%June4-5,2008* 51% 48% 1%*QUESTIONWORDINGJUNE2008:“Thinkingaboutspecificwaysthatthegovernmenthasdealtwithgunsinthepast,doyoufavororopposeeachofthefollowing.”

POLL10 Oct.12-15,2017 @ssrs_solutions | 484.840.4300 | www.ssrs.com | 13
Q9. Pleasetellmewhetheryouwouldgenerallyfavororopposeeachofthefollowingproposalswhichsomepeoplehavemadetoreducetheamountofgunviolence:
e. Abanonthesaleandpossessionofequipmentknownasbumpfirestocks,afirearmaccessorythatallowssemi-automaticweaponstofiremorelikeautomaticones.
Favor Oppose NoopinionOctober12-15,2017 63% 34% 4%
Q10. Whichofthefollowingstatementscomesclosertoyouroverallview…
GovernmentandsocietycantakeactionthatwillbeeffectiveinpreventingshootingsliketheoneinLasVegasfromhappening
again
ShootingsliketheoneinLasVegaswillhappen
againregardlessofwhatactionistakenby
governmentandsociety
Noopinion
October12-15,2017 47% 49% 4% CNN/ORCFORCOMPARISON*
Governmentandsocietycantakeactionthatwillbeeffectiveinpreventingshootingsliketheonein
[LOCATION]*fromhappeningagain
Shootingsliketheonein[LOCATION]*willhappenagainregardlessofwhat
actionistakenbygovernmentandsociety
Noopinion
June16-19,2016* 46% 52% 2%June26-28,2015* 35% 64% 2%Dec.17-18,2012* 46% 53% 2%Jan14-16,2011* 33% 66% 1%*NOTE:QuestionwordingsinJune2016referredto“theshootingsliketheoneinOrlandowillhappenagainregardlessofwhatactionistakenbygovernmentandsociety”andJanuary2011referredto"theshootingswhichoccurredinTucsonArizona,inwhichJaredLoughnerallegedlyshotacongresswomanand18otherpeople”,inDecember2012referredto“theshootingswhichoccurredrecentlyinanelementaryschoolinConnecticut,”andinJune2015referredto“theshootingswhichoccurredinCharleston,SouthCarolinainwhichDylannRoofshotninepeopleduringabiblestudyinahistoricallyblackchurch”

POLL10 Oct.12-15,2017 @ssrs_solutions | 484.840.4300 | www.ssrs.com | 14
MOREONMETHODOLOGY
Atotalof1,010adultswereinterviewedbytelephonenationwidebyliveinterviewerscallingbothlandlineandcellphones.InterviewswereconductedinEnglishandSpanish.Amongtheentiresample,31%describedthemselvesasDemocrats,23%describedthemselvesasRepublicans,and42%describedthemselvesasindependentsormembersofanotherparty.Allrespondentswereaskedquestionsconcerningbasicdemographics,andtheentiresamplewasweightedtoreflectnationalCensusfiguresforgender,race,age,education,regionofcountry,andtelephoneusage.Resultsforthefullsamplehaveamarginofsamplingerrorof+/-3.5percentagepoints.Forthesampleof894registeredvoters,itis+/-3.8percentagepoints.Crosstabsonthefollowingpagesonlyincluderesultsforsubgroupswithenoughunweightedcasestoproduceasamplingerrorof+/-8.5.percentagepointsorlessonceadjustedfordesigneffect.Somesubgroupsrepresenttoosmallashareofthenationalpopulationtoproducecrosstabswithanacceptablesamplingerror.Interviewswereconductedamongthesesubgroups,butresultsforgroupswithadesign-effectadjustedsamplingerrorlargerthan+/-8.5percentagepointsarenotdisplayedandinsteadaredenotedwith"N/A".

POLL10 Oct.12-15,2017 @ssrs_solutions | 484.840.4300 | www.ssrs.com | 15
CNN/SSRS Poll -- October 12, 2017 to October 15, 2017 1. (A1) Do you approve or disapprove of the way Donald Trump is handling his job as president? Base: Total Respondents Non- Total Men Women White white ===== ===== ===== ===== ===== Approve 37% 46% 28% 45% 20% Disapprove 57% 47% 66% 50% 71% Don't know/Undecided/Refused 6% 7% 6% 5% 9% Sampling Error (+/-) 3.5 4.9 5.1 4.3 6.4 Total 18-34 35-49 50-64 65+ <45 45+ ===== ===== ===== ===== ===== ===== ===== Approve 37% 23% 35% 50% 41% 27% 46% Disapprove 57% 66% 60% 46% 54% 64% 50% Don't know/Undecided/Refused 6% 11% 5% 4% 5% 9% 4% Sampling Error (+/-) 3.5 7.4 7.7 6.4 6.4 5.8 4.4 Non- White White coll. Coll. non- coll. Total <$50K $50K+ grad grad. coll. grad. ===== ===== ===== ===== ===== ===== ===== Approve 37% 30% 42% 37% 35% 49% 38% Disapprove 57% 64% 51% 55% 61% 45% 59% Don't know/Undecided/Refused 6% 6% 7% 8% 4% 5% 4% Sampling Error (+/-) 3.5 5.7 4.7 4.6 5.2 5.7 6.2 Indep Con Demo- endnt Repub Lib- Mode- serva Total crat Other lican eral rate tive ===== ===== ===== ===== ===== ===== ===== Approve 37% 7% 35% 82% 6% 29% 66% Disapprove 57% 89% 57% 13% 94% 63% 27% Don't know/Undecided/Refused 6% 3% 8% 5% 1% 8% 7% Sampling Error (+/-) 3.5 6.3 5.5 7.0 7.5 5.7 5.9 Lean Lean Trump Trump Demo- Repub ap- disap Reg. Total crat lican prove prove voter ===== ===== ===== ===== ===== ===== Approve 37% 6% 77% 100% - 38% Disapprove 57% 90% 16% - 100% 57% Don't know/Undecided/Refused 6% 4% 7% - - 4% Sampling Error (+/-) 3.5 5.2 5.4 5.6 4.8 3.8

POLL10 Oct.12-15,2017 @ssrs_solutions | 484.840.4300 | www.ssrs.com | 16
CNN/SSRS Poll -- October 12, 2017 to October 15, 2017 A1/A1a/A1b. Combo table Base: Total Respondents Non- Total Men Women White white ===== ===== ===== ===== ===== Approve strongly 25% 30% 20% 31% 11% Approve moderately 12% 15% 8% 13% 9% Approve unspecified * 1% * 1% - Disapprove unspecified * * * * 1% Disapprove moderately 9% 10% 7% 9% 9% Disapprove strongly 47% 36% 58% 41% 61% Don't know/Undecided/Refused 6% 7% 6% 5% 9% Sampling Error (+/-) 3.5 4.9 5.1 4.3 6.4 Total 18-34 35-49 50-64 65+ <45 45+ ===== ===== ===== ===== ===== ===== ===== Approve strongly 25% 12% 21% 36% 32% 15% 33% Approve moderately 12% 11% 13% 13% 8% 11% 12% Approve unspecified * 1% 1% - 1% 1% * Disapprove unspecified * 1% - - 1% * * Disapprove moderately 9% 13% 8% 6% 7% 12% 7% Disapprove strongly 47% 53% 52% 40% 46% 53% 43% Don't know/Undecided/Refused 6% 11% 5% 4% 5% 9% 4% Sampling Error (+/-) 3.5 7.4 7.7 6.4 6.4 5.8 4.4 Non- White White coll. Coll. non- coll. Total <$50K $50K+ grad grad. coll. grad. ===== ===== ===== ===== ===== ===== ===== Approve strongly 25% 17% 31% 24% 26% 34% 27% Approve moderately 12% 12% 12% 12% 10% 14% 11% Approve unspecified * 1% - 1% - 1% - Disapprove unspecified * * * - 1% - * Disapprove moderately 9% 11% 7% 11% 5% 11% 5% Disapprove strongly 47% 53% 44% 44% 55% 35% 54% Don't know/Undecided/Refused 6% 6% 7% 8% 4% 5% 4% Sampling Error (+/-) 3.5 5.7 4.7 4.6 5.2 5.7 6.2 Indep Con Demo- endnt Repub Lib- Mode- serva Total crat Other lican eral rate tive ===== ===== ===== ===== ===== ===== ===== Approve strongly 25% 2% 23% 61% 3% 14% 51% Approve moderately 12% 5% 12% 18% 2% 15% 13% Approve unspecified * - * 2% - - 1% Disapprove unspecified * * 1% - * 1% * Disapprove moderately 9% 9% 11% 5% 7% 12% 7% Disapprove strongly 47% 80% 46% 9% 86% 50% 20% Don't know/Undecided/Refused 6% 3% 8% 5% 1% 8% 7% Sampling Error (+/-) 3.5 6.3 5.5 7.0 7.5 5.7 5.9 Lean Lean Trump Trump Demo- Repub ap- disap Reg. Total crat lican prove prove voter ===== ===== ===== ===== ===== ===== Approve strongly 25% 1% 56% 67% - 28% Approve moderately 12% 5% 21% 32% - 9% Approve unspecified * - 1% 1% - 1% Disapprove unspecified * * * - 1% * Disapprove moderately 9% 10% 6% - 16% 8% Disapprove strongly 47% 79% 10% - 84% 49% Don't know/Undecided/Refused 6% 4% 7% - - 4% Sampling Error (+/-) 3.5 5.2 5.4 5.6 4.8 3.8

POLL10 Oct.12-15,2017 @ssrs_solutions | 484.840.4300 | www.ssrs.com | 17
CNN/SSRS Poll -- October 12, 2017 to October 15, 2017 2E. (A2e) Do you approve or disapprove of the way Donald Trump is handling Immigration? Base: Total Respondents Non- Total Men Women White white ===== ===== ===== ===== ===== Approve 37% 44% 30% 46% 18% Disapprove 59% 51% 66% 50% 76% Don't know/Undecided/Refused 5% 5% 5% 4% 6% Sampling Error (+/-) 3.5 4.9 5.1 4.3 6.4 Total 18-34 35-49 50-64 65+ <45 45+ ===== ===== ===== ===== ===== ===== ===== Approve 37% 23% 37% 48% 41% 28% 44% Disapprove 59% 72% 61% 47% 52% 68% 50% Don't know/Undecided/Refused 5% 5% 2% 5% 7% 4% 5% Sampling Error (+/-) 3.5 7.4 7.7 6.4 6.4 5.8 4.4 Non- White White coll. Coll. non- coll. Total <$50K $50K+ grad grad. coll. grad. ===== ===== ===== ===== ===== ===== ===== Approve 37% 30% 42% 37% 36% 50% 39% Disapprove 59% 65% 54% 58% 61% 46% 59% Don't know/Undecided/Refused 5% 4% 4% 6% 3% 4% 2% Sampling Error (+/-) 3.5 5.7 4.7 4.6 5.2 5.7 6.2 Indep Con Demo- endnt Repub Lib- Mode- serva Total crat Other lican eral rate tive ===== ===== ===== ===== ===== ===== ===== Approve 37% 8% 36% 80% 10% 29% 63% Disapprove 59% 89% 59% 16% 89% 67% 32% Don't know/Undecided/Refused 5% 4% 5% 4% 1% 4% 6% Sampling Error (+/-) 3.5 6.3 5.5 7.0 7.5 5.7 5.9 Lean Lean Trump Trump Demo- Repub ap- disap Reg. Total crat lican prove prove voter ===== ===== ===== ===== ===== ===== Approve 37% 7% 75% 86% 5% 38% Disapprove 59% 90% 21% 10% 92% 58% Don't know/Undecided/Refused 5% 2% 4% 3% 2% 4% Sampling Error (+/-) 3.5 5.2 5.4 5.6 4.8 3.8

POLL10 Oct.12-15,2017 @ssrs_solutions | 484.840.4300 | www.ssrs.com | 18
CNN/SSRS Poll -- October 12, 2017 to October 15, 2017 2J. (A2j) Do you approve or disapprove of the way Donald Trump is handling Environmental policy? Base: Total Respondents Non- Total Men Women White white ===== ===== ===== ===== ===== Approve 32% 40% 25% 41% 16% Disapprove 56% 49% 64% 51% 67% Don't know/Undecided/Refused 12% 11% 12% 8% 17% Sampling Error (+/-) 3.5 4.9 5.1 4.3 6.4 Total 18-34 35-49 50-64 65+ <45 45+ ===== ===== ===== ===== ===== ===== ===== Approve 32% 21% 30% 42% 38% 24% 39% Disapprove 56% 64% 61% 48% 51% 65% 49% Don't know/Undecided/Refused 12% 14% 9% 10% 12% 11% 12% Sampling Error (+/-) 3.5 7.4 7.7 6.4 6.4 5.8 4.4 Non- White White coll. Coll. non- coll. Total <$50K $50K+ grad grad. coll. grad. ===== ===== ===== ===== ===== ===== ===== Approve 32% 26% 37% 33% 31% 45% 33% Disapprove 56% 61% 53% 54% 61% 46% 60% Don't know/Undecided/Refused 12% 13% 10% 13% 8% 10% 7% Sampling Error (+/-) 3.5 5.7 4.7 4.6 5.2 5.7 6.2 Indep Con Demo- endnt Repub Lib- Mode- serva Total crat Other lican eral rate tive ===== ===== ===== ===== ===== ===== ===== Approve 32% 8% 31% 69% 9% 22% 60% Disapprove 56% 85% 55% 19% 88% 63% 29% Don't know/Undecided/Refused 12% 7% 14% 12% 3% 15% 11% Sampling Error (+/-) 3.5 6.3 5.5 7.0 7.5 5.7 5.9 Lean Lean Trump Trump Demo- Repub ap- disap Reg. Total crat lican prove prove voter ===== ===== ===== ===== ===== ===== Approve 32% 8% 64% 77% 5% 34% Disapprove 56% 85% 22% 10% 87% 56% Don't know/Undecided/Refused 12% 7% 14% 13% 8% 10% Sampling Error (+/-) 3.5 5.2 5.4 5.6 4.8 3.8

POLL10 Oct.12-15,2017 @ssrs_solutions | 484.840.4300 | www.ssrs.com | 19
CNN/SSRS Poll -- October 12, 2017 to October 15, 2017 2P. (A2p) Do you approve or disapprove of the way Donald Trump is handling His relationship with Republicans in Congress? Base: Total Respondents Non- Total Men Women White white ===== ===== ===== ===== ===== Approve 32% 38% 26% 40% 17% Disapprove 54% 49% 58% 48% 66% Don't know/Undecided/Refused 14% 13% 15% 13% 17% Sampling Error (+/-) 3.5 4.9 5.1 4.3 6.4 Total 18-34 35-49 50-64 65+ <45 45+ ===== ===== ===== ===== ===== ===== ===== Approve 32% 23% 28% 41% 37% 25% 38% Disapprove 54% 56% 61% 48% 50% 57% 51% Don't know/Undecided/Refused 14% 20% 11% 11% 14% 17% 12% Sampling Error (+/-) 3.5 7.4 7.7 6.4 6.4 5.8 4.4 Non- White White coll. Coll. non- coll. Total <$50K $50K+ grad grad. coll. grad. ===== ===== ===== ===== ===== ===== ===== Approve 32% 26% 36% 32% 31% 42% 34% Disapprove 54% 60% 50% 52% 57% 45% 53% Don't know/Undecided/Refused 14% 13% 14% 15% 12% 13% 13% Sampling Error (+/-) 3.5 5.7 4.7 4.6 5.2 5.7 6.2 Indep Con Demo- endnt Repub Lib- Mode- serva Total crat Other lican eral rate tive ===== ===== ===== ===== ===== ===== ===== Approve 32% 12% 28% 68% 14% 24% 53% Disapprove 54% 76% 54% 22% 72% 60% 36% Don't know/Undecided/Refused 14% 12% 18% 10% 14% 17% 11% Sampling Error (+/-) 3.5 6.3 5.5 7.0 7.5 5.7 5.9 Lean Lean Trump Trump Demo- Repub ap- disap Reg. Total crat lican prove prove voter ===== ===== ===== ===== ===== ===== Approve 32% 11% 60% 71% 8% 34% Disapprove 54% 74% 29% 19% 80% 54% Don't know/Undecided/Refused 14% 14% 12% 10% 13% 12% Sampling Error (+/-) 3.5 5.2 5.4 5.6 4.8 3.8

POLL10 Oct.12-15,2017 @ssrs_solutions | 484.840.4300 | www.ssrs.com | 20
CNN/SSRS Poll -- October 12, 2017 to October 15, 2017 3. Do you think the policies being proposed by Donald Trump will move the country in the right direction or the wrong direction? Base: Total Respondents Non- Total Men Women White white ===== ===== ===== ===== ===== Right direction 38% 47% 30% 47% 22% Wrong direction 56% 46% 65% 48% 71% Don't know/Undecided/Refused 6% 8% 4% 5% 7% Sampling Error (+/-) 3.5 4.9 5.1 4.3 6.4 Total 18-34 35-49 50-64 65+ <45 45+ ===== ===== ===== ===== ===== ===== ===== Right direction 38% 28% 35% 49% 43% 29% 46% Wrong direction 56% 64% 62% 45% 51% 64% 49% Don't know/Undecided/Refused 6% 8% 4% 6% 5% 7% 5% Sampling Error (+/-) 3.5 7.4 7.7 6.4 6.4 5.8 4.4 Non- White White coll. Coll. non- coll. Total <$50K $50K+ grad grad. coll. grad. ===== ===== ===== ===== ===== ===== ===== Right direction 38% 32% 44% 40% 35% 52% 37% Wrong direction 56% 62% 51% 53% 61% 42% 59% Don't know/Undecided/Refused 6% 6% 5% 7% 4% 6% 4% Sampling Error (+/-) 3.5 5.7 4.7 4.6 5.2 5.7 6.2 Indep Con Demo- endnt Repub Lib- Mode- serva Total crat Other lican eral rate tive ===== ===== ===== ===== ===== ===== ===== Right direction 38% 9% 38% 82% 8% 31% 67% Wrong direction 56% 88% 55% 13% 89% 62% 28% Don't know/Undecided/Refused 6% 3% 8% 6% 3% 8% 5% Sampling Error (+/-) 3.5 6.3 5.5 7.0 7.5 5.7 5.9 Lean Lean Trump Trump Demo- Repub ap- disap Reg. Total crat lican prove prove voter ===== ===== ===== ===== ===== ===== Right direction 38% 8% 78% 94% 3% 39% Wrong direction 56% 89% 16% 2% 94% 56% Don't know/Undecided/Refused 6% 3% 7% 4% 3% 5% Sampling Error (+/-) 3.5 5.2 5.4 5.6 4.8 3.8

POLL10 Oct.12-15,2017 @ssrs_solutions | 484.840.4300 | www.ssrs.com | 21
CNN/SSRS Poll -- October 12, 2017 to October 15, 2017 3a. As you may know, Republicans control both houses of Congress and the White House. Do you have more confidence in President Trump to deal with the major issues facing the country today, or more confidence in the Republicans in Congress to deal with those issues? Base: Total Respondents Non- Total Men Women White white ===== ===== ===== ===== ===== President Trump 30% 38% 23% 38% 14% Republicans in Congress 47% 42% 51% 43% 56% Neither 17% 14% 20% 15% 22% Don't know/Undecided/Refused 5% 6% 5% 4% 8% Sampling Error (+/-) 3.5 4.9 5.1 4.3 6.4 Total 18-34 35-49 50-64 65+ <45 45+ ===== ===== ===== ===== ===== ===== ===== President Trump 30% 16% 27% 44% 37% 19% 40% Republicans in Congress 47% 58% 53% 35% 39% 57% 38% Neither 17% 17% 18% 16% 19% 17% 17% Don't know/Undecided/Refused 5% 9% 3% 5% 6% 6% 5% Sampling Error (+/-) 3.5 7.4 7.7 6.4 6.4 5.8 4.4 Non- White White coll. Coll. non- coll. Total <$50K $50K+ grad grad. coll. grad. ===== ===== ===== ===== ===== ===== ===== President Trump 30% 24% 34% 32% 28% 43% 29% Republicans in Congress 47% 48% 47% 45% 51% 39% 50% Neither 17% 21% 15% 17% 18% 14% 17% Don't know/Undecided/Refused 5% 7% 4% 7% 3% 5% 4% Sampling Error (+/-) 3.5 5.7 4.7 4.6 5.2 5.7 6.2 Indep Con Demo- endnt Repub Lib- Mode- serva Total crat Other lican eral rate tive ===== ===== ===== ===== ===== ===== ===== President Trump 30% 6% 31% 63% 6% 21% 55% Republicans in Congress 47% 63% 46% 29% 62% 54% 32% Neither 17% 27% 17% 2% 30% 18% 7% Don't know/Undecided/Refused 5% 4% 6% 6% 2% 7% 5% Sampling Error (+/-) 3.5 6.3 5.5 7.0 7.5 5.7 5.9 Lean Lean Trump Trump Demo- Repub ap- disap Reg. Total crat lican prove prove voter ===== ===== ===== ===== ===== ===== President Trump 30% 6% 61% 73% 4% 32% Republicans in Congress 47% 64% 31% 20% 65% 46% Neither 17% 26% 4% 2% 27% 17% Don't know/Undecided/Refused 5% 5% 5% 5% 4% 5% Sampling Error (+/-) 3.5 5.2 5.4 5.6 4.8 3.8

POLL10 Oct.12-15,2017 @ssrs_solutions | 484.840.4300 | www.ssrs.com | 22
CNN/SSRS Poll -- October 12, 2017 to October 15, 2017 4. Which of the following is the most important issue facing the country today? Base: Total Respondents Non- Total Men Women White white ===== ===== ===== ===== ===== National security 21% 22% 20% 22% 20% Health care 21% 16% 26% 25% 16% The economy 17% 22% 12% 17% 17% Civil rights 14% 12% 16% 11% 20% Foreign policy 11% 12% 10% 13% 7% Immigration 10% 10% 10% 7% 14% Other 3% 3% 3% 3% 3% Don't know/Undecided/Refused 3% 2% 3% 2% 3% Sampling Error (+/-) 3.5 4.9 5.1 4.3 6.4 Total 18-34 35-49 50-64 65+ <45 45+ ===== ===== ===== ===== ===== ===== ===== National security 21% 18% 21% 26% 22% 20% 23% Health care 21% 22% 20% 22% 22% 19% 24% The economy 17% 19% 14% 18% 16% 16% 17% Civil rights 14% 21% 18% 9% 5% 22% 7% Foreign policy 11% 9% 14% 8% 13% 11% 11% Immigration 10% 9% 7% 13% 9% 9% 10% Other 3% 1% 3% 2% 6% 2% 4% Don't know/Undecided/Refused 3% 2% 3% 2% 6% 2% 4% Sampling Error (+/-) 3.5 7.4 7.7 6.4 6.4 5.8 4.4 Non- White White coll. Coll. non- coll. Total <$50K $50K+ grad grad. coll. grad. ===== ===== ===== ===== ===== ===== ===== National security 21% 19% 24% 22% 20% 24% 20% Health care 21% 28% 16% 21% 21% 25% 24% The economy 17% 13% 20% 18% 16% 18% 15% Civil rights 14% 15% 13% 13% 16% 9% 13% Foreign policy 11% 7% 15% 9% 16% 10% 18% Immigration 10% 12% 7% 11% 7% 8% 6% Other 3% 4% 2% 3% 3% 3% 2% Don't know/Undecided/Refused 3% 3% 2% 3% 2% 3% 2% Sampling Error (+/-) 3.5 5.7 4.7 4.6 5.2 5.7 6.2 Indep Con Demo- endnt Repub Lib- Mode- serva Total crat Other lican eral rate tive ===== ===== ===== ===== ===== ===== ===== National security 21% 16% 21% 29% 13% 20% 29% Health care 21% 28% 22% 13% 27% 25% 14% The economy 17% 13% 20% 18% 11% 15% 22% Civil rights 14% 18% 16% 4% 22% 16% 6% Foreign policy 11% 12% 9% 15% 14% 12% 9% Immigration 10% 7% 7% 16% 6% 8% 14% Other 3% 5% 3% 1% 5% 1% 3% Don't know/Undecided/Refused 3% 2% 3% 3% 1% 3% 4% Sampling Error (+/-) 3.5 6.3 5.5 7.0 7.5 5.7 5.9 Lean Lean Trump Trump Demo- Repub ap- disap Reg. Total crat lican prove prove voter ===== ===== ===== ===== ===== ===== National security 21% 16% 29% 32% 14% 22% Health care 21% 29% 13% 11% 29% 22% The economy 17% 12% 23% 25% 11% 18% Civil rights 14% 19% 6% 5% 20% 13% Foreign policy 11% 11% 12% 8% 13% 12% Immigration 10% 8% 14% 14% 7% 8% Other 3% 4% 1% 2% 3% 3% Don't know/Undecided/Refused 3% 2% 3% 3% 2% 3% Sampling Error (+/-) 3.5 5.2 5.4 5.6 4.8 3.8

POLL10 Oct.12-15,2017 @ssrs_solutions | 484.840.4300 | www.ssrs.com | 23
CNN/SSRS Poll -- October 12, 2017 to October 15, 2017 5. (C1) How well are things going in the country today - very well, fairly well, pretty badly or very badly? Base: Total Respondents Non- Total Men Women White white ===== ===== ===== ===== ===== Well (Net) 46% 59% 34% 50% 37% Very well 8% 12% 3% 8% 6% Fairly well 38% 47% 30% 42% 32% Badly (Net) 51% 38% 64% 47% 61% Pretty badly 30% 22% 38% 29% 33% Very badly 21% 17% 26% 18% 28% Don't know/Undecided/Refused 3% 3% 3% 3% 2% Sampling Error (+/-) 3.5 4.9 5.1 4.3 6.4 Total 18-34 35-49 50-64 65+ <45 45+ ===== ===== ===== ===== ===== ===== ===== Well (Net) 46% 45% 43% 49% 44% 45% 46% Very well 8% 5% 6% 8% 12% 5% 10% Fairly well 38% 40% 37% 41% 32% 40% 37% Badly (Net) 51% 51% 54% 49% 53% 52% 51% Pretty badly 30% 34% 32% 25% 29% 35% 26% Very badly 21% 17% 22% 23% 24% 17% 25% Don't know/Undecided/Refused 3% 4% 3% 2% 3% 4% 2% Sampling Error (+/-) 3.5 7.4 7.7 6.4 6.4 5.8 4.4 Non- White White coll. Coll. non- coll. Total <$50K $50K+ grad grad. coll. grad. ===== ===== ===== ===== ===== ===== ===== Well (Net) 46% 37% 54% 46% 46% 52% 46% Very well 8% 6% 9% 7% 8% 8% 9% Fairly well 38% 31% 45% 39% 37% 44% 37% Badly (Net) 51% 59% 44% 51% 51% 45% 50% Pretty badly 30% 35% 25% 29% 32% 26% 33% Very badly 21% 24% 19% 22% 19% 19% 17% Don't know/Undecided/Refused 3% 3% 2% 3% 3% 4% 3% Sampling Error (+/-) 3.5 5.7 4.7 4.6 5.2 5.7 6.2 Indep Con Demo- endnt Repub Lib- Mode- serva Total crat Other lican eral rate tive ===== ===== ===== ===== ===== ===== ===== Well (Net) 46% 25% 46% 72% 25% 46% 60% Very well 8% 3% 8% 13% 3% 7% 12% Fairly well 38% 22% 38% 59% 23% 39% 48% Badly (Net) 51% 72% 51% 26% 71% 52% 38% Pretty badly 30% 43% 30% 14% 40% 33% 21% Very badly 21% 29% 21% 12% 30% 19% 17% Don't know/Undecided/Refused 3% 3% 3% 3% 4% 2% 2% Sampling Error (+/-) 3.5 6.3 5.5 7.0 7.5 5.7 5.9 Lean Lean Trump Trump Demo- Repub ap- disap Reg. Total crat lican prove prove voter ===== ===== ===== ===== ===== ===== Well (Net) 46% 26% 71% 76% 25% 46% Very well 8% 3% 13% 15% 3% 8% Fairly well 38% 23% 58% 61% 23% 38% Badly (Net) 51% 71% 27% 23% 72% 51% Pretty badly 30% 43% 16% 14% 41% 30% Very badly 21% 29% 11% 8% 30% 21% Don't know/Undecided/Refused 3% 3% 2% 2% 3% 3% Sampling Error (+/-) 3.5 5.2 5.4 5.6 4.8 3.8

POLL10 Oct.12-15,2017 @ssrs_solutions | 484.840.4300 | www.ssrs.com | 24
CNN/SSRS Poll -- October 12, 2017 to October 15, 2017 6. (H1) If the elections for Congress were being held today, which party's candidate would you vote for in your Congressional district...? 6A. (H1a) As of today, do you lean more toward...? H1/H1a. Combo Table Base: Total Respondents Non- Total Men Women White white ===== ===== ===== ===== ===== The Democratic Party's candidate 51% 41% 62% 46% 64% The Republican Party's candidate 37% 45% 30% 44% 25% Other candidate 3% 3% 2% 3% 2% Don't plan to vote 2% 3% 2% 2% 3% Don't know/Undecided/Refused 6% 8% 4% 5% 6% Sampling Error (+/-) 3.5 4.9 5.1 4.3 6.4 Total 18-34 35-49 50-64 65+ <45 45+ ===== ===== ===== ===== ===== ===== ===== The Democratic Party's candidate 51% 56% 51% 47% 50% 54% 50% The Republican Party's candidate 37% 30% 39% 43% 38% 34% 40% Other candidate 3% 3% 2% 4% 1% 3% 3% Don't plan to vote 2% 3% 3% 1% 4% 3% 2% Don't know/Undecided/Refused 6% 7% 5% 4% 7% 7% 5% Sampling Error (+/-) 3.5 7.4 7.7 6.4 6.4 5.8 4.4 Non- White White coll. Coll. non- coll. Total <$50K $50K+ grad grad. coll. grad. ===== ===== ===== ===== ===== ===== ===== The Democratic Party's candidate 51% 57% 48% 50% 56% 41% 55% The Republican Party's candidate 37% 31% 43% 38% 36% 47% 38% Other candidate 3% 2% 4% 2% 4% 2% 3% Don't plan to vote 2% 3% 2% 3% 2% 3% * Don't know/Undecided/Refused 6% 8% 3% 7% 4% 6% 3% Sampling Error (+/-) 3.5 5.7 4.7 4.6 5.2 5.7 6.2 Indep Con Demo- endnt Repub Lib- Mode- serva Total crat Other lican eral rate tive ===== ===== ===== ===== ===== ===== ===== The Democratic Party's candidate 51% 98% 42% 8% 86% 57% 26% The Republican Party's candidate 37% 1% 38% 88% 8% 31% 64% Other candidate 3% - 7% * 1% 3% 3% Don't plan to vote 2% * 4% 1% 3% 2% 2% Don't know/Undecided/Refused 6% 1% 9% 2% 3% 6% 5% Sampling Error (+/-) 3.5 6.3 5.5 7.0 7.5 5.7 5.9 Lean Lean Trump Trump Demo- Repub ap- disap Reg. Total crat lican prove prove voter ===== ===== ===== ===== ===== ===== The Democratic Party's candidate 51% 92% 9% 12% 81% 54% The Republican Party's candidate 37% 3% 85% 79% 9% 38% Other candidate 3% 1% 2% 2% 3% 3% Don't plan to vote 2% 1% 1% 2% 2% 1% Don't know/Undecided/Refused 6% 2% 4% 5% 5% 5% Sampling Error (+/-) 3.5 5.2 5.4 5.6 4.8 3.8

POLL10 Oct.12-15,2017 @ssrs_solutions | 484.840.4300 | www.ssrs.com | 25
CNN/SSRS Poll -- October 12, 2017 to October 15, 2017 7. (G1) Do you favor or oppose stricter gun control laws? Base: Total Respondents Non- Total Men Women White white ===== ===== ===== ===== ===== Favor 52% 42% 62% 48% 61% Oppose 44% 54% 35% 48% 36% Don't know/Undecided/Refused 4% 5% 3% 4% 4% Sampling Error (+/-) 3.5 4.9 5.1 4.3 6.4 Total 18-34 35-49 50-64 65+ <45 45+ ===== ===== ===== ===== ===== ===== ===== Favor 52% 54% 55% 47% 51% 54% 50% Oppose 44% 42% 42% 50% 43% 42% 46% Don't know/Undecided/Refused 4% 4% 3% 3% 6% 4% 4% Sampling Error (+/-) 3.5 7.4 7.7 6.4 6.4 5.8 4.4 Non- White White coll. Coll. non- coll. Total <$50K $50K+ grad grad. coll. grad. ===== ===== ===== ===== ===== ===== ===== Favor 52% 52% 52% 48% 61% 42% 59% Oppose 44% 44% 45% 49% 34% 55% 36% Don't know/Undecided/Refused 4% 4% 4% 3% 5% 3% 5% Sampling Error (+/-) 3.5 5.7 4.7 4.6 5.2 5.7 6.2 Indep Con Demo- endnt Repub Lib- Mode- serva Total crat Other lican eral rate tive ===== ===== ===== ===== ===== ===== ===== Favor 52% 75% 45% 30% 85% 54% 29% Oppose 44% 22% 49% 67% 15% 40% 66% Don't know/Undecided/Refused 4% 3% 5% 4% 1% 5% 5% Sampling Error (+/-) 3.5 6.3 5.5 7.0 7.5 5.7 5.9 Lean Lean Trump Trump Demo- Repub ap- disap Reg. Total crat lican prove prove voter ===== ===== ===== ===== ===== ===== Favor 52% 74% 26% 21% 72% 51% Oppose 44% 23% 70% 76% 24% 45% Don't know/Undecided/Refused 4% 3% 4% 4% 4% 4% Sampling Error (+/-) 3.5 5.2 5.4 5.6 4.8 3.8

POLL10 Oct.12-15,2017 @ssrs_solutions | 484.840.4300 | www.ssrs.com | 26
CNN/SSRS Poll -- October 12, 2017 to October 15, 2017 G1/G1a/G1b. Combo table Base: Total Respondents Non- Total Men Women White white ===== ===== ===== ===== ===== Favor strongly 36% 27% 45% 31% 47% Favor moderately 15% 14% 16% 17% 14% Favor unspecified * * * * * Oppose unspecified 1% 1% * 1% * Oppose moderately 16% 19% 13% 17% 15% Oppose strongly 27% 33% 21% 31% 21% Don't know/Undecided/Refused 4% 5% 3% 4% 4% Sampling Error (+/-) 3.5 4.9 5.1 4.3 6.4 Total 18-34 35-49 50-64 65+ <45 45+ ===== ===== ===== ===== ===== ===== ===== Favor strongly 36% 32% 44% 33% 37% 36% 36% Favor moderately 15% 22% 11% 13% 13% 18% 13% Favor unspecified * - - - 1% - * Oppose unspecified 1% - 1% * 2% * 1% Oppose moderately 16% 16% 16% 18% 15% 16% 17% Oppose strongly 27% 26% 25% 31% 26% 26% 28% Don't know/Undecided/Refused 4% 4% 3% 3% 6% 4% 4% Sampling Error (+/-) 3.5 7.4 7.7 6.4 6.4 5.8 4.4 Non- White White coll. Coll. non- coll. Total <$50K $50K+ grad grad. coll. grad. ===== ===== ===== ===== ===== ===== ===== Favor strongly 36% 35% 38% 32% 45% 25% 42% Favor moderately 15% 16% 14% 15% 16% 17% 16% Favor unspecified * 1% - * * * * Oppose unspecified 1% 1% * 1% * 1% - Oppose moderately 16% 17% 16% 19% 11% 19% 13% Oppose strongly 27% 27% 28% 30% 23% 35% 23% Don't know/Undecided/Refused 4% 4% 4% 3% 5% 3% 5% Sampling Error (+/-) 3.5 5.7 4.7 4.6 5.2 5.7 6.2 Indep Con Demo- endnt Repub Lib- Mode- serva Total crat Other lican eral rate tive ===== ===== ===== ===== ===== ===== ===== Favor strongly 36% 60% 29% 15% 69% 34% 18% Favor moderately 15% 15% 16% 14% 15% 20% 11% Favor unspecified * * * - - * 1% Oppose unspecified 1% * 1% 2% * 1% 1% Oppose moderately 16% 11% 19% 19% 6% 18% 21% Oppose strongly 27% 11% 29% 46% 9% 21% 44% Don't know/Undecided/Refused 4% 3% 5% 4% 1% 5% 5% Sampling Error (+/-) 3.5 6.3 5.5 7.0 7.5 5.7 5.9 Lean Lean Trump Trump Demo- Repub ap- disap Reg. Total crat lican prove prove voter ===== ===== ===== ===== ===== ===== Favor strongly 36% 55% 14% 10% 54% 35% Favor moderately 15% 18% 12% 10% 18% 16% Favor unspecified * 1% - - * * Oppose unspecified 1% * 2% 2% * 1% Oppose moderately 16% 11% 22% 21% 12% 15% Oppose strongly 27% 12% 46% 53% 12% 29% Don't know/Undecided/Refused 4% 3% 4% 4% 4% 4% Sampling Error (+/-) 3.5 5.2 5.4 5.6 4.8 3.8

POLL10 Oct.12-15,2017 @ssrs_solutions | 484.840.4300 | www.ssrs.com | 27
CNN/SSRS Poll -- October 12, 2017 to October 15, 2017 8. Do you think having stricter gun control laws would reduce the number of gun-related deaths in the country, or not? Base: Total Respondents Non- Total Men Women White white ===== ===== ===== ===== ===== Yes 46% 36% 56% 41% 56% No 51% 62% 40% 55% 41% Don't know/Undecided/Refused 3% 2% 4% 3% 3% Sampling Error (+/-) 3.5 4.9 5.1 4.3 6.4 Total 18-34 35-49 50-64 65+ <45 45+ ===== ===== ===== ===== ===== ===== ===== Yes 46% 48% 50% 41% 45% 48% 45% No 51% 48% 48% 56% 51% 49% 52% Don't know/Undecided/Refused 3% 4% 3% 3% 3% 3% 3% Sampling Error (+/-) 3.5 7.4 7.7 6.4 6.4 5.8 4.4 Non- White White coll. Coll. non- coll. Total <$50K $50K+ grad grad. coll. grad. ===== ===== ===== ===== ===== ===== ===== Yes 46% 49% 43% 42% 54% 36% 52% No 51% 47% 54% 55% 43% 61% 46% Don't know/Undecided/Refused 3% 4% 3% 3% 3% 4% 2% Sampling Error (+/-) 3.5 5.7 4.7 4.6 5.2 5.7 6.2 Indep Con Demo- endnt Repub Lib- Mode- serva Total crat Other lican eral rate tive ===== ===== ===== ===== ===== ===== ===== Yes 46% 69% 42% 21% 78% 47% 26% No 51% 27% 55% 77% 19% 49% 72% Don't know/Undecided/Refused 3% 4% 3% 2% 2% 4% 2% Sampling Error (+/-) 3.5 6.3 5.5 7.0 7.5 5.7 5.9 Lean Lean Trump Trump Demo- Repub ap- disap Reg. Total crat lican prove prove voter ===== ===== ===== ===== ===== ===== Yes 46% 68% 21% 17% 66% 44% No 51% 28% 77% 81% 30% 52% Don't know/Undecided/Refused 3% 4% 2% 2% 4% 3% Sampling Error (+/-) 3.5 5.2 5.4 5.6 4.8 3.8

POLL10 Oct.12-15,2017 @ssrs_solutions | 484.840.4300 | www.ssrs.com | 28
CNN/SSRS Poll -- October 12, 2017 to October 15, 2017 9A. Please tell me whether you would generally favor or oppose each of the following proposals which some people have made to reduce the amount of gun violence: A ban on the manufacture, sale and possession of high-powered rifles capable of semi-automatic fire, such as the AR-15, would you favor or oppose this proposal? Base: Total Respondents Non- Total Men Women White white ===== ===== ===== ===== ===== Favor 49% 34% 62% 49% 48% Oppose 49% 64% 34% 48% 50% Don't know/Undecided/Refused 3% 1% 4% 3% 2% Sampling Error (+/-) 3.5 4.9 5.1 4.3 6.4 Total 18-34 35-49 50-64 65+ <45 45+ ===== ===== ===== ===== ===== ===== ===== Favor 49% 50% 50% 46% 48% 51% 46% Oppose 49% 49% 49% 51% 46% 48% 50% Don't know/Undecided/Refused 3% 1% 1% 2% 7% 1% 4% Sampling Error (+/-) 3.5 7.4 7.7 6.4 6.4 5.8 4.4 Non- White White coll. Coll. non- coll. Total <$50K $50K+ grad grad. coll. grad. ===== ===== ===== ===== ===== ===== ===== Favor 49% 49% 49% 43% 60% 44% 60% Oppose 49% 49% 49% 54% 38% 53% 37% Don't know/Undecided/Refused 3% 3% 2% 3% 2% 3% 3% Sampling Error (+/-) 3.5 5.7 4.7 4.6 5.2 5.7 6.2 Indep Con Demo- endnt Repub Lib- Mode- serva Total crat Other lican eral rate tive ===== ===== ===== ===== ===== ===== ===== Favor 49% 67% 44% 33% 76% 50% 30% Oppose 49% 32% 54% 61% 24% 48% 65% Don't know/Undecided/Refused 3% * 2% 6% * 2% 5% Sampling Error (+/-) 3.5 6.3 5.5 7.0 7.5 5.7 5.9 Lean Lean Trump Trump Demo- Repub ap- disap Reg. Total crat lican prove prove voter ===== ===== ===== ===== ===== ===== Favor 49% 65% 31% 28% 62% 49% Oppose 49% 34% 65% 68% 37% 49% Don't know/Undecided/Refused 3% 1% 4% 4% 1% 3% Sampling Error (+/-) 3.5 5.2 5.4 5.6 4.8 3.8

POLL10 Oct.12-15,2017 @ssrs_solutions | 484.840.4300 | www.ssrs.com | 29
CNN/SSRS Poll -- October 12, 2017 to October 15, 2017 9B. Please tell me whether you would generally favor or oppose each of the following proposals which some people have made to reduce the amount of gun violence: A ban on the sale and possession of equipment known as high-capacity or extended ammunition magazines, which allow some guns to shoot more than 10 bullets before they need to be reloaded, would you favor or oppose this proposal? Base: Total Respondents Non- Total Men Women White white ===== ===== ===== ===== ===== Favor 54% 43% 65% 55% 55% Oppose 43% 55% 32% 43% 43% Don't know/Undecided/Refused 2% 2% 3% 2% 2% Sampling Error (+/-) 3.5 4.9 5.1 4.3 6.4 Total 18-34 35-49 50-64 65+ <45 45+ ===== ===== ===== ===== ===== ===== ===== Favor 54% 58% 52% 51% 57% 56% 53% Oppose 43% 41% 47% 47% 38% 43% 44% Don't know/Undecided/Refused 2% 1% 2% 2% 5% 1% 3% Sampling Error (+/-) 3.5 7.4 7.7 6.4 6.4 5.8 4.4 Non- White White coll. Coll. non- coll. Total <$50K $50K+ grad grad. coll. grad. ===== ===== ===== ===== ===== ===== ===== Favor 54% 54% 55% 50% 64% 50% 66% Oppose 43% 44% 43% 47% 34% 49% 31% Don't know/Undecided/Refused 2% 2% 2% 2% 2% 1% 3% Sampling Error (+/-) 3.5 5.7 4.7 4.6 5.2 5.7 6.2 Indep Con Demo- endnt Repub Lib- Mode- serva Total crat Other lican eral rate tive ===== ===== ===== ===== ===== ===== ===== Favor 54% 73% 48% 41% 81% 57% 36% Oppose 43% 25% 51% 54% 18% 42% 59% Don't know/Undecided/Refused 2% 2% 1% 5% 1% 1% 4% Sampling Error (+/-) 3.5 6.3 5.5 7.0 7.5 5.7 5.9 Lean Lean Trump Trump Demo- Repub ap- disap Reg. Total crat lican prove prove voter ===== ===== ===== ===== ===== ===== Favor 54% 71% 37% 33% 69% 55% Oppose 43% 27% 59% 64% 30% 43% Don't know/Undecided/Refused 2% 2% 3% 3% 1% 2% Sampling Error (+/-) 3.5 5.2 5.4 5.6 4.8 3.8

POLL10 Oct.12-15,2017 @ssrs_solutions | 484.840.4300 | www.ssrs.com | 30
CNN/SSRS Poll -- October 12, 2017 to October 15, 2017 9D. Please tell me whether you would generally favor or oppose each of the following proposals which some people have made to reduce the amount of gun violence: Limiting the number of guns an individual can own, would you favor or oppose this proposal? Base: Total Respondents Non- Total Men Women White white ===== ===== ===== ===== ===== Favor 46% 33% 58% 38% 61% Oppose 51% 65% 39% 59% 37% Don't know/Undecided/Refused 3% 2% 4% 4% 1% Sampling Error (+/-) 3.5 4.9 5.1 4.3 6.4 Total 18-34 35-49 50-64 65+ <45 45+ ===== ===== ===== ===== ===== ===== ===== Favor 46% 52% 52% 37% 42% 51% 42% Oppose 51% 46% 48% 60% 52% 48% 55% Don't know/Undecided/Refused 3% 2% * 3% 6% 2% 4% Sampling Error (+/-) 3.5 7.4 7.7 6.4 6.4 5.8 4.4 Non- White White coll. Coll. non- coll. Total <$50K $50K+ grad grad. coll. grad. ===== ===== ===== ===== ===== ===== ===== Favor 46% 51% 42% 44% 50% 33% 46% Oppose 51% 47% 55% 54% 46% 64% 49% Don't know/Undecided/Refused 3% 2% 3% 2% 4% 3% 5% Sampling Error (+/-) 3.5 5.7 4.7 4.6 5.2 5.7 6.2 Indep Con Demo- endnt Repub Lib- Mode- serva Total crat Other lican eral rate tive ===== ===== ===== ===== ===== ===== ===== Favor 46% 69% 39% 23% 69% 46% 30% Oppose 51% 29% 58% 74% 27% 52% 67% Don't know/Undecided/Refused 3% 2% 3% 3% 4% 2% 3% Sampling Error (+/-) 3.5 6.3 5.5 7.0 7.5 5.7 5.9 Lean Lean Trump Trump Demo- Repub ap- disap Reg. Total crat lican prove prove voter ===== ===== ===== ===== ===== ===== Favor 46% 66% 21% 18% 63% 44% Oppose 51% 31% 76% 78% 34% 53% Don't know/Undecided/Refused 3% 3% 3% 4% 3% 3% Sampling Error (+/-) 3.5 5.2 5.4 5.6 4.8 3.8

POLL10 Oct.12-15,2017 @ssrs_solutions | 484.840.4300 | www.ssrs.com | 31
CNN/SSRS Poll -- October 12, 2017 to October 15, 2017 9E. Please tell me whether you would generally favor or oppose each of the following proposals which some people have made to reduce the amount of gun violence: A ban on the sale and possession of equipment known as bump fire stocks, a firearm accessory that allows semi-automatic weapons to fire more like automatic ones, would you favor or oppose this proposal? Base: Total Respondents Non- Total Men Women White white ===== ===== ===== ===== ===== Favor 63% 59% 66% 68% 54% Oppose 34% 38% 30% 28% 43% Don't know/Undecided/Refused 4% 3% 4% 4% 3% Sampling Error (+/-) 3.5 4.9 5.1 4.3 6.4 Total 18-34 35-49 50-64 65+ <45 45+ ===== ===== ===== ===== ===== ===== ===== Favor 63% 58% 68% 63% 63% 62% 63% Oppose 34% 39% 28% 33% 34% 36% 32% Don't know/Undecided/Refused 4% 3% 4% 4% 3% 3% 4% Sampling Error (+/-) 3.5 7.4 7.7 6.4 6.4 5.8 4.4 Non- White White coll. Coll. non- coll. Total <$50K $50K+ grad grad. coll. grad. ===== ===== ===== ===== ===== ===== ===== Favor 63% 56% 69% 56% 76% 61% 82% Oppose 34% 41% 28% 40% 21% 35% 16% Don't know/Undecided/Refused 4% 3% 3% 4% 3% 4% 3% Sampling Error (+/-) 3.5 5.7 4.7 4.6 5.2 5.7 6.2 Indep Con Demo- endnt Repub Lib- Mode- serva Total crat Other lican eral rate tive ===== ===== ===== ===== ===== ===== ===== Favor 63% 71% 59% 59% 78% 65% 52% Oppose 34% 28% 37% 35% 20% 33% 41% Don't know/Undecided/Refused 4% 1% 3% 6% 1% 1% 6% Sampling Error (+/-) 3.5 6.3 5.5 7.0 7.5 5.7 5.9 Lean Lean Trump Trump Demo- Repub ap- disap Reg. Total crat lican prove prove voter ===== ===== ===== ===== ===== ===== Favor 63% 70% 56% 54% 68% 64% Oppose 34% 29% 38% 41% 30% 32% Don't know/Undecided/Refused 4% 1% 6% 5% 2% 4% Sampling Error (+/-) 3.5 5.2 5.4 5.6 4.8 3.8

POLL10 Oct.12-15,2017 @ssrs_solutions | 484.840.4300 | www.ssrs.com | 32
CNN/SSRS Poll -- October 12, 2017 to October 15, 2017 9C. Please tell me whether you would generally favor or oppose each of the following proposals which some people have made to reduce the amount of gun violence: Preventing all Americans from owning guns, would you favor or oppose this proposal? Base: Total Respondents Non- Total Men Women White white ===== ===== ===== ===== ===== Favor 11% 7% 15% 7% 20% Oppose 86% 91% 82% 91% 78% Don't know/Undecided/Refused 2% 2% 3% 2% 2% Sampling Error (+/-) 3.5 4.9 5.1 4.3 6.4 Total 18-34 35-49 50-64 65+ <45 45+ ===== ===== ===== ===== ===== ===== ===== Favor 11% 16% 11% 8% 10% 15% 8% Oppose 86% 82% 87% 91% 85% 83% 89% Don't know/Undecided/Refused 2% 2% 2% 1% 5% 2% 3% Sampling Error (+/-) 3.5 7.4 7.7 6.4 6.4 5.8 4.4 Non- White White coll. Coll. non- coll. Total <$50K $50K+ grad grad. coll. grad. ===== ===== ===== ===== ===== ===== ===== Favor 11% 16% 8% 12% 10% 7% 8% Oppose 86% 82% 91% 86% 89% 91% 91% Don't know/Undecided/Refused 2% 2% 1% 2% 1% 2% 1% Sampling Error (+/-) 3.5 5.7 4.7 4.6 5.2 5.7 6.2 Indep Con Demo- endnt Repub Lib- Mode- serva Total crat Other lican eral rate tive ===== ===== ===== ===== ===== ===== ===== Favor 11% 18% 9% 6% 23% 8% 8% Oppose 86% 80% 89% 93% 76% 90% 90% Don't know/Undecided/Refused 2% 2% 2% 1% 1% 2% 2% Sampling Error (+/-) 3.5 6.3 5.5 7.0 7.5 5.7 5.9 Lean Lean Trump Trump Demo- Repub ap- disap Reg. Total crat lican prove prove voter ===== ===== ===== ===== ===== ===== Favor 11% 15% 7% 5% 16% 10% Oppose 86% 83% 92% 93% 82% 88% Don't know/Undecided/Refused 2% 2% 1% 2% 2% 2% Sampling Error (+/-) 3.5 5.2 5.4 5.6 4.8 3.8

POLL10 Oct.12-15,2017 @ssrs_solutions | 484.840.4300 | www.ssrs.com | 33
CNN/SSRS Poll -- October 12, 2017 to October 15, 2017 10. Which of the following statements comes closer to your overall view: Base: Total Respondents Non- Total Men Women White white ===== ===== ===== ===== ===== Government and society can take action that will be effective in preventing shootings like the one in Las Vegas from happening again................. 47% 38% 55% 43% 56% Shootings like the one in Las Vegas will happen again regardless of what action is taken by government and society............................ 49% 57% 42% 54% 41% Don't know/Undecided/Refused 4% 4% 3% 4% 3% Sampling Error (+/-) 3.5 4.9 5.1 4.3 6.4 Total 18-34 35-49 50-64 65+ <45 45+ ===== ===== ===== ===== ===== ===== ===== Government and society can take action that will be effective in preventing shootings like the one in Las Vegas from happening again................. 47% 56% 50% 41% 38% 54% 40% Shootings like the one in Las Vegas will happen again regardless of what action is taken by government and society............................ 49% 42% 47% 56% 55% 43% 55% Don't know/Undecided/Refused 4% 2% 3% 4% 7% 3% 5% Sampling Error (+/-) 3.5 7.4 7.7 6.4 6.4 5.8 4.4 Non- White White coll. Coll. non- coll. Total <$50K $50K+ grad grad. coll. grad. ===== ===== ===== ===== ===== ===== ===== Government and society can take action that will be effective in preventing shootings like the one in Las Vegas from happening again................. 47% 48% 46% 44% 53% 37% 53% Shootings like the one in Las Vegas will happen again regardless of what action is taken by government and society............................ 49% 48% 51% 52% 44% 58% 45% Don't know/Undecided/Refused 4% 4% 2% 4% 3% 4% 2% Sampling Error (+/-) 3.5 5.7 4.7 4.6 5.2 5.7 6.2 Indep Con Demo- endnt Repub Lib- Mode- serva Total crat Other lican eral rate tive ===== ===== ===== ===== ===== ===== ===== Government and society can take action that will be effective in preventing shootings like the one in Las Vegas from happening again................. 47% 68% 42% 24% 74% 49% 26% Shootings like the one in Las Vegas will happen again regardless of what action is taken by government and society............................ 49% 29% 55% 70% 25% 48% 67% Don't know/Undecided/Refused 4% 3% 3% 6% 1% 2% 7% Sampling Error (+/-) 3.5 6.3 5.5 7.0 7.5 5.7 5.9 Lean Lean Trump Trump Demo- Repub ap- disap Reg. Total crat lican prove prove voter ===== ===== ===== ===== ===== ===== Government and society can take action that will be effective in preventing shootings like the one in Las Vegas from happening again................. 47% 66% 26% 18% 65% 47% Shootings like the one in Las Vegas will happen again regardless of what action is taken by government and society............................ 49% 31% 69% 76% 32% 49% Don't know/Undecided/Refused 4% 3% 5% 6% 2% 4% Sampling Error (+/-) 3.5 5.2 5.4 5.6 4.8 3.8