srp1056 swine day 2011 - pork information...
TRANSCRIPT

Report of Progress 1056
Kansas State UniversityAgricultural Experiment Station and Cooperative
Extension Service
SWINEDAY
2011
2011
I
ContentsV Foreword
V Standard Abbreviations
VI K-State Vitamin and Trace Mineral Premixes
VII Biological Variability and Chances of Error
Herd Health1 A PRRS CAP Update on the Regional Control and Elimination
of PRRSV
6 Is Aerosol Transmission an Important Risk for PRRSV Transmission? An Example of How Simple Biosecurity Procedures Can Prevent Virus Spread Within a Barn
12 Utilizing Vaccination for Porcine Circovirus Type 2 as a Tool to Aid Elimination of PCV2 from Swine Populations
Nursery Nutrition and Management34 The Effects of Orally Supplemented Vitamin D3 on Serum
25(OH)D3 Concentrations and Growth of Pre-Weaning and Nursery Pigs
46 The Effects of High-Sulfate Water and Zeolite (Clinoptilolite) on Nursery Pig Performance
57 Effects of Feeding Copper and Feed-Grade Antimicrobials on the Growth Performance of Weanling Pigs
62 Effects of Liquitein on Weanling Pigs Administered a Porcine Circovirus Type 2 and Mycoplasma hyopneumoniae Vaccine Strategy
SWINEDAY
2011

II
70 Effect of Total Lysine:Crude Protein Ratio on Growth Performance of Nursery Pigs from 15 to 25 lb
75 Effect of Replacing Commonly Used Specialty Protein Sources with Crystalline Amino Acids on Growth Performance of Nursery Pigs from 15 to 25 lb
81 Evaluation of Heparin Production By-Products in Nursery Pig Diets
90 Evaluating the Effects of Pelleting Deoxynivalenol-Contaminated Dried Distillers Grains with Solubles in the Presence of Sodium Metabisulfite on Analyzed DON Levels
96 Evaluating the Effects of Pelleting, Corn Dried Distillers Grains with Solubles Source, and Supplementing Sodium Metabisulfite in Nursery Pig Diets Contaminated with Deoxynivalenol
105 Evaluating the Effects of Pelleting, Dried Distillers Grains with Solubles Source, and Supplemental Sodium Metabisulfite in Nursery Pig Diets Contaminated with Deoxynivalenol
114 Effects of Increasing Dietary Wheat Middlings on Nursery Pig Growth Performance
118 The Effects of Sorghum Dried Distillers Grains with Solubles on Nursery Pig Performance
129 Effects of XFE Liquid Energy and Choice White Grease on Nursery Pig Performance
138 Influence of Standardized Ileal Digestible Tryptophan:Lysine Ratio on Growth Performance of 13- to 21-lb Nursery Pigs
145 Influence of Dietary Isoleucine:Lysine Ratio on the Optimal Tryptophan:Lysine Ratio for 13- to 24-lb Pigs
Finishing Nutrition and Management155 Determining the Effects of Tryptophan:Lysine Ratios in Diets
Containing 30% Dried Distillers Grains with Solubles on Growth Performance of 157- to 285-lb Pigs

III
162 Determining the Effects of L-Tryptophan Addition to Diets Containing 30% Dried Distillers Grains with Solubles on Finishing Pig Growth Performance
168 Determining the Effects of Tryptophan:Lysine Ratio in Diets Containing Dried Distillers Grains with Solubles on Growth Performance of Finishing Pigs
174 Determining the Effect of the Ratio of Tryptophan to Large Neutral Amino Acids on the Growth Performance of Finishing Pigs
182 The Effects of Sorghum Dried Distillers Grains with Solubles on Finishing Pig Growth Performance, Carcass Characteristics, and Fat Quality
197 Effect of Regrinding Dried Distillers Grains with Solubles on Finishing Pig Growth Performance
202 Effects of Lowering Dietary NDF Levels Prior to Marketing on Finishing Pig Growth Performance, Carcass Characteristics, Carcass Fat Quality, and Intestinal Weights
216 Effects of Increasing NDF from Either Dried Distillers Grains With Solubles or Wheat Middlings, Individually or in Combination, on the Growth Performance, Carcass Characteristics, and Carcass Fat Quality in Growing- Finishing Pigs
227 Effects of Xylanase in Growing-Finishing Diets Varying in Dietary Energy and Fiber on Growth Performance, Carcass Characteristics, and Nutrient Digestibility
240 The Effect of Bacillus Probiotic on Growth Performance and Fecal Consistency of Growing-Finishing Pigs
247 The Effects of Diet Form and Feeder Design on the Growth Performance of Finishing Pigs
257 The Effects of Feeder Design (Conventional Dry vs. Wet-Dry) in the Nursery and in the Finisher on Growth Performance of Finishing Pigs
262 Effects of Stocking Density on Lightweight Pig Performance Prior to Marketing

IV
266 Evaluation of Ractopamine HCl Feeding Programs on Growth Performance and Carcass Characteristics of Finishing Pigs
272 Effects of Diet Mix Time on Growth Performance of Finishing Pigs Fed Ractopamine HCl
278 Effects of Abrupt Changes between Mash and Pellet Diets on Growth Performance in Finishing Pigs
282 Effects of Sorghum Particle Size on Milling Characteristics, Growth Performance, and Carcass Characteristics in Finishing Pigs
288 Effects of Adding Cracked Corn to a Pelleted Supplement for Nursery and Finishing Pigs
301 Effect of Sample Size and Method of Sampling Pig Weights on the Accuracy of Estimating the Mean Weight of the Population
319 Effects of Dietary L-Carnitine and DDGS on Growth, Carcass Characteristics, and Loin and Fat Quality of Growing-Finishing Pigs
330 Effects of Dietary Astaxanthin and Ractopamine HCl on the Growth and Carcass Characteristics of Finishing Pigs and the Color Shelf-Life of Longissimus Chops from Barrows and Gilts
Meat Quality341 Effect of Sorghum Dried Distillers Grains with Solubles
on Composition, Retail Stability, and Sensory Attributes of Ground Pork from Barrows and Gilts
354 Index of Key Words
355 Acknowledgments
357 The Livestock and Meat Industry Council, Inc.

V
ForewordIt is with great pleasure that we present the 2011 Swine Industry Day Report of Progress. This report contains updates and summaries of applied and basic research conducted at Kansas State University during the past year. We hope that the information will be of benefit as we attempt to meet the needs of the Kansas swine industry. 2011 Swine Day Report of Progress EditorsBob Goodband Mike Tokach Steve Dritz Joel DeRouchey
Standard Abbreviations
SWINEDAY
2011
ADG = average daily gainADF = acid detergent fiberADFI = average daily feed intakeAI = artificial inseminationavg. = averagebu = bushelBW = body weightcm = centimeter(s)CP = crude proteinCV = coefficient of variationcwt = 100 lbd = day(s)DE = digestible energyDM = dry matterDMI = dry matter intakeF/G = feed efficiencyft = foot(feet)ft2 = square foot(feet)g = gram(s)µg = microgram(s), .001 mggal = gallon(s)GE = gross energyh = hour(s)HCW = hot carcass weightin. = inch(es)IU = international unit(s)kg = kilogram(s)
kcal = kilocalorie(s)kWh = kilowatt hour(s)lb = pound(s)Mcal = megacalorie(s)ME = metabolizable energymEq = milliequivalent(s)min = minute(s)mg = milligram(s)mL = cc (cubic centimeters)mm = millimeter(s)mo = month(s)N = nitrogenNE = net energyNDF = neutral detergent fiberng = nanogram(s), .001 Fg no. = numberNRC = National Research Councilppb = parts per billionppm = parts per millionpsi = pounds per sq. in.sec = second(s)SE = standard errorSEM = standard error of the meanSEW = segregated early weaningwk = week(s)wt = weight(s)yr = year(s)

VI
K-State Vitamin and Trace Mineral PremixesDiets listed in this report contain the following vitamin and trace mineral premixes unless otherwise specified.• Trace mineral premix: Each pound of premix contains 12 g Mn, 50 g Fe, 50 g Zn,
5 g Cu, 90 mg I, and 90 mg Se.
• Vitamin premix: Each pound of premix contains 2,000,000 IU vitamin A, 300,000 IU vitamin D3, 8,000 IU vitamin E, 800 mg menadione, 1,500 mg riboflavin, 5,000 mg pantothenic acid, 9,000 mg niacin, and 7 mg vitamin B12.
• Sow add pack: Each pound of premix contains 100,000 mg choline, 40 mg biotin, 300 mg folic acid, and 900 mg pyridoxine.
NoteSome of the research reported here was carried out under special FDA clearances that apply only to investigational uses at approved research institutions. Materials that require FDA clear-ances may be used in the field only at the levels and for the use specified in that clearance.

VII
Biological Variability and Chances of ErrorVariability among individual animals in an experiment leads to problems in interpret-ing the results. Animals on treatment X may have higher average daily gains than those on treatment Y, but variability within treatments may indicate that the differences in production between X and Y were not the result of the treatment alone. Statistical analysis allows us to calculate the probability that such differences are from treatment rather than from chance.
In some of the articles herein, you will see the notation “P < 0.05.” That means the probability of the differences resulting from chance is less than 5%. If two averages are said to be “significantly different,” the probability is less than 5% that the difference is from chance or the probability exceeds 95% that the difference resulted from the treat-ments applied.
Some papers report correlations or measures of the relationship between traits. The rela-tionship may be positive (both traits tend to get larger or smaller together) or negative (as one trait gets larger, the other gets smaller). A perfect correlation is one (+1 or -1). If there is no relationship, the correlation is zero.
In other papers, you may see an average given as 2.5 ± 0.1. The 2.5 is the average; 0.1 is the “standard error.” The standard error is calculated to be 68% certain that the real average (with unlimited number of animals) would fall within one standard error from the average, in this case between 2.4 and 2.6.
Many animals per treatment, replicating treatments several times, and using uniform animals increase the probability of finding real differences when they exist. Statisti-cal analysis allows more valid interpretation of the results, regardless of the number of animals. In all the research reported herein, statistical analyses are included to increase the confidence you can place in the results.

1
Herd Health
A PRRS CAP Update on the Regional Control and Elimination of PRRSV1
R. R. R. Rowland2
SummaryThe control and elimination of porcine reproductive and respiratory syndrome virus (PRRSV) represents one of the most challenging tasks facing the swine industry world-wide. Several factors related to the biology of the virus make disease detection and elimi-nation difficult. Efforts are further hampered by a lack of vaccines that can protect naïve herds from infection. With this in mind, elimination efforts that incorporate existing tools and knowledge are being initiated. The principal focus is at the region level. One example of success is the Stevens County project in Minnesota, which has attained a PRRSV-negative status and has been expanded to include all of northern Minnesota.
Key words: PRRSV, PRRSV control and elimination
IntroductionPorcine reproductive and respiratory syndrome (PRRS), initially described in the late 1980s as “Mystery Swine Disease,” is associated with reproductive failure in sows, respi-ratory distress in nursery pigs, and poor growth performance during finishing. Severe outbreaks result in abortion storms accompanied by high sow mortality. The causative agent of PRRS, PRRS virus (PRRSV), was first isolated and identified by investigators in the Netherlands and later in the United States. Viruses of European origin were first identified in U.S herds in 1999, and have further complicated efforts to control the virus.
The entry of PRRSV into a production system can occur through the introduction of infected pigs or the use of PRRSV-contaminated semen. Other avenues for introduc-tion include mechanical vectors. A fourth route is through so-called area spread, which includes aerosols. Transmission by aerosols is still poorly understood; however, a recent report indicates that under the right conditions, PRRSV can travel up to 6 miles (Otake et al., 2010)3.
After entering a production system, PRRSV is efficiently transmitted both horizon-tally (pig-to-pig infection) and vertically (transplacental infection). Pigs may become subclinical carriers, further perpetuating the virus. The continued maintenance of the virus as a subclinical continuous infection is termed endemicity, which is periodically punctuated by outbreaks that result in high mortality and economic loss.
1 The work is supported by PRRS CAP, USDA NIFA Award 2008-55620-19132.2 PRRS CAP Project Director, Department of Diagnostic Medicine and Pathobiology, Kansas State University, Manhattan, KS 66506.3 Otake, S., S. Dee, C. Corzo, S. Oliveira, and J. Deen. 2010. Long-distance airborne transport of infectious PRRSV and Mycoplasma hyopneumoniae from a swine population infected with multiple viral variants. Vet. Microbiol. 145, 198-208.

2
Herd Health
PRRSV has the capacity to generate a large degree of genetic diversity in both struc-tural and non-structural proteins, which has proved an obstacle for vaccine develop-ment (Lunney et al., 20104). An alternative to vaccination is controlled exposure or acclimation, which involves the intentional infection of naïve animals with wild-type live PRRSV, either through contact with infected animals or exposure to infectious material. Controlled exposure is an attempt to induce immunity against farm-specific strains; however, the intentional exposure of young animals to virulent virus presents unintended consequences, such as the risk of introducing other pathogens.
Although PRRSV appears to be a formidable pathogen, the virus is relatively unstable under normal environmental conditions and is especially sensitive to UV radiation (Cutler et al., 20115). The virus has been documented to travel up to 6 miles, but aerial transmission of the virus over long distances appears to be a rare event and dependent on a set of ideal environmental conditions. For example, we found that 10 PRRSV-negative sentinel pigs separated by a distance of less than 30 ft from 190 experimentally infected pigs failed to become infected during continuous exposure over 42 d (see “Is Aerosol Transmission an Important Risk for PRRSV Transmission? An Example of How Simple Biosecurity Procedures can Prevent Virus Spread within a Barn,” p. 6).
Virus stability is also affected by temperature. Jacobs et al. (20106) calculated T1/2 values of 1.6, 27.4, 84.8 and 155.5 h for temperatures of 86, 68, 50 and 40oF, respectively. The virus is completely inactivated after a short incubation at temperatures greater than 130oF (Bloemrad et al., 19947); therefore, the application of common antimicrobial agents or steam is sufficient to completely inactivate PRRSV on surfaces.
The Control of PRRSV at the Herd LevelSince the discovery of the disease, several approaches have been employed for the control and elimination of PRRSV in single herds (Corzo et al., 20108). Highly effec-tive approaches include depopulation-repopulation and all-in, all-out methods. Both depend on the placement of PRRSV-negative pigs in a facility that is “free” of virus. Herd closure and rollover is the most common method for eliminating virus from sow farms. The technique is based on observations that new PRRSV infections gradually decrease in closed herds. The typical length for herd closure is approximately 220 d, which approximates the maximum period that PRRSV can persist in a pig. All remain-ing seropositive animals are removed and replaced with negative pigs. The most recent tool for preventing the entry of PRRSV into a virus-negative herd is whole-barn filtra-tion combined with negative pressure ventilation. Filtration is designed to block the
4 Lunney, J., D. Benfield, and R. Rowland. 2010. Porcine reproductive and respiratory syndrome virus: an update on an emerging and re-emerging viral disease of swine. Virus Res. 154, 1-6.5 Cutler, T., C. Wang, Q. Qin, F. Zhou, K. Warren, K. Yoon, S. Hoff, J. Ridpath, and J. Zimmerman. 2011. Kinetics of UV(254) inactivation of selected viral pathogens in a static system. J. Appl. Microbiol. 111, 389-395.6 Jacobs, A., J. Hermann, C. Muñoz-Zanzi, J. Prickett, M. Roof, K. Yoon, and J. Zimmerman, 2010. Stability of porcine reproductive and respiratory syndrome virus at ambient temperatures. J. Vet. Diagn. Invest. 22, 257-260.7 Bloemraad, M., E. de Kluijver, A. Petersen, G. Burkhardt, and G. Wensvoort. 1994. Porcine reproduc-tive and respiratory syndrome: temperature and pH stability of Lelystad virus and its survival in tissue specimens from viraemic pigs. Vet. Microbiol. 42, 361-371.8 Corzo, C., E. Mondaca, S. Wayne, M. Torremorell, S. Dee, P. Davies, and R. Morrison. 2010. Control and elimination of porcine reproductive and respiratory syndrome virus. Virus Res. 154, 185-192.
3
Herd Health
aerosol entry of PRRSV and other pathogens (Dee et al. 20109). Despite its expense, filtration has proved to be a promising method reducing risk of PRRSV transmission into herds in pig-dense regions.
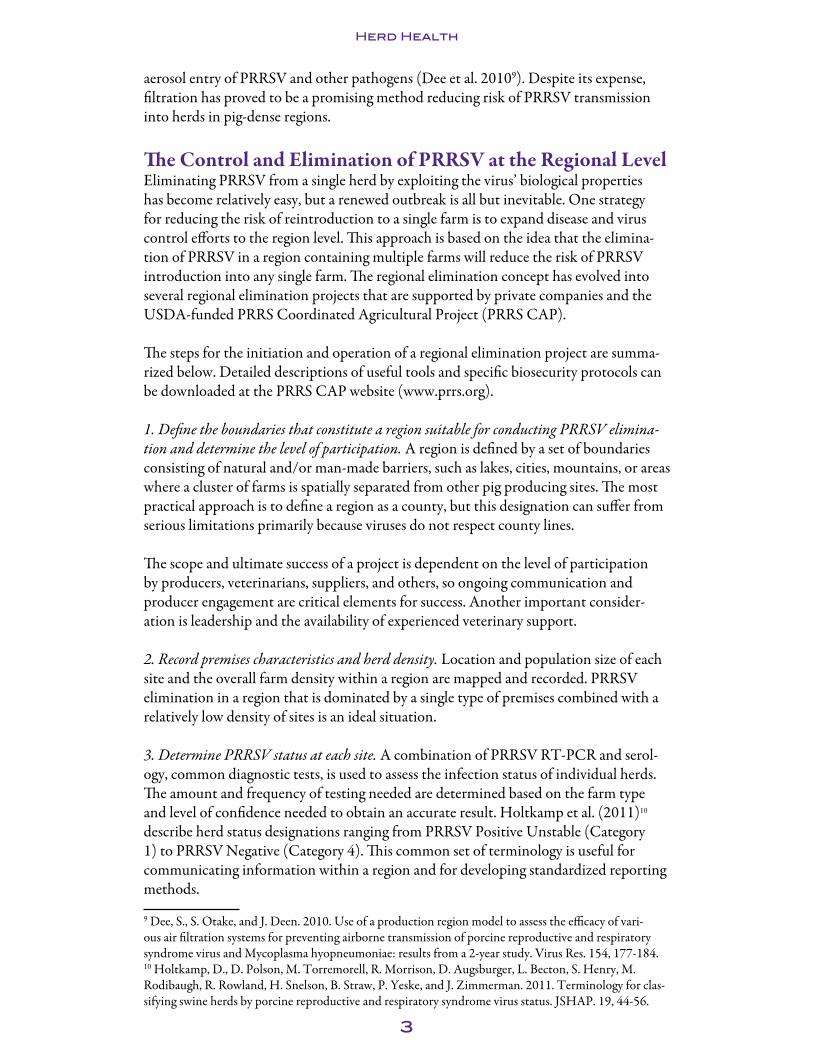
The Control and Elimination of PRRSV at the Regional LevelEliminating PRRSV from a single herd by exploiting the virus’ biological properties has become relatively easy, but a renewed outbreak is all but inevitable. One strategy for reducing the risk of reintroduction to a single farm is to expand disease and virus control efforts to the region level. This approach is based on the idea that the elimina-tion of PRRSV in a region containing multiple farms will reduce the risk of PRRSV introduction into any single farm. The regional elimination concept has evolved into several regional elimination projects that are supported by private companies and the USDA-funded PRRS Coordinated Agricultural Project (PRRS CAP).
The steps for the initiation and operation of a regional elimination project are summa-rized below. Detailed descriptions of useful tools and specific biosecurity protocols can be downloaded at the PRRS CAP website (www.prrs.org).
1. Define the boundaries that constitute a region suitable for conducting PRRSV elimina-tion and determine the level of participation. A region is defined by a set of boundaries consisting of natural and/or man-made barriers, such as lakes, cities, mountains, or areas where a cluster of farms is spatially separated from other pig producing sites. The most practical approach is to define a region as a county, but this designation can suffer from serious limitations primarily because viruses do not respect county lines.
The scope and ultimate success of a project is dependent on the level of participation by producers, veterinarians, suppliers, and others, so ongoing communication and producer engagement are critical elements for success. Another important consider-ation is leadership and the availability of experienced veterinary support.
2. Record premises characteristics and herd density. Location and population size of each site and the overall farm density within a region are mapped and recorded. PRRSV elimination in a region that is dominated by a single type of premises combined with a relatively low density of sites is an ideal situation.
3. Determine PRRSV status at each site. A combination of PRRSV RT-PCR and serol-ogy, common diagnostic tests, is used to assess the infection status of individual herds. The amount and frequency of testing needed are determined based on the farm type and level of confidence needed to obtain an accurate result. Holtkamp et al. (2011)10 describe herd status designations ranging from PRRSV Positive Unstable (Category 1) to PRRSV Negative (Category 4). This common set of terminology is useful for communicating information within a region and for developing standardized reporting methods.
9 Dee, S., S. Otake, and J. Deen. 2010. Use of a production region model to assess the efficacy of vari-ous air filtration systems for preventing airborne transmission of porcine reproductive and respiratory syndrome virus and Mycoplasma hyopneumoniae: results from a 2-year study. Virus Res. 154, 177-184.10 Holtkamp, D., D. Polson, M. Torremorell, R. Morrison, D. Augsburger, L. Becton, S. Henry, M. Rodibaugh, R. Rowland, H. Snelson, B. Straw, P. Yeske, and J. Zimmerman. 2011. Terminology for clas-sifying swine herds by porcine reproductive and respiratory syndrome virus status. JSHAP. 19, 44-56.

4
Herd Health
4. Assess overall herd biosecurity and risk for introduction of PRRSV. The web-based tool, Production Animal Disease Risk Assessment Program (PADRAP), is useful for assess-ing overall PRRS biosecurity at the herd level and can be a guide for estimating the success of a PRRSV elimination program (www.padrap.org). When reapplied at later time points, the PADRAP can be used to measure improvements in biosecurity over time.
5. Map movement of pigs between farms within the region and entering from sources outside the region. As discussed above, a major biosecurity risk for the entry of PRRSV is through the introduction of PRRSV-infected pigs. A good prospect for PRRSV elimi-nation is a situation where the principal source of pigs and pig transport are confined to sites within the region (intra-regional movement).
6. Implement herd control strategies and report progress. From a menu of herd-based PRRSV elimination methods, summarized above (Corzo et al., 2010), a combination of herd control strategies can be initiated that best fit the type and density of pig farms within the region. Regular status reports are important for updating participants and veterinarians on the progress of the region. Open lines of communication, obtainable goals, and clear criteria related to progress are critical to keeping producers engaged in the process. Reported data include the number of pigs and the PRRSV status for each herd, as well as a general description of progress, including the identification of obsta-cles to success. Publicized progress provides an incentive for PRRSV-positive farms to make progress toward a negative status.
7. Surveillance. After Category 4 (PRRSV-negative) status is achieved, continued moni-toring is important to ensure that farms remain PRRSV-negative. The most common method is to monitor for the presence of PRRSV by standard diagnostic serology. The frequency of sampling is variable, but should be conducted at least twice a year. In addi-tion, herds are monitored for the appearance of PRRS-associated clinical signs.
Current ProgressAt this time, the PRRS CAP supports seven regional elimination projects, which enroll approximately 2.5 million pigs. The overall elimination effort within the PRRS CAP is directed by Dr. Robert Morrison, University of Minnesota. A list of ongoing PRRSV regional projects conducted in 6 states is below. Each project is designed to address a specific opportunity or challenge related to PRRSV control and elimination. Detailed information on each project, including progress, can be found at www.prrs.org.
1. Illinois – DeKalb Area, Bethany Swine Health Services, Dr. Noel Garbes2. Illinois – Western - Tri-County, Carthage Veterinary Service, Ltd.,
Dr. Dyneah M. Classen 3. Iowa – Iowa County, Iowa State University, Dr. Derald Holtkamp4. Michigan – Allegan & Ottawa Area, Michigan Pork Producers,
Dr. James A. Kober5. Minnesota – Northern Minnesota Project (above Hwy 212),
including Stevens Co., University of Minnesota, Dr. Montse Torremorell6. Nebraska – Cuming County, Nebraska Veterinary Service, Dr. Alan Snodgrass7. Pennsylvania – Pennsylvania Project, University of Pennsylvania,
Dr. Thomas D. Parsons
5
Herd Health
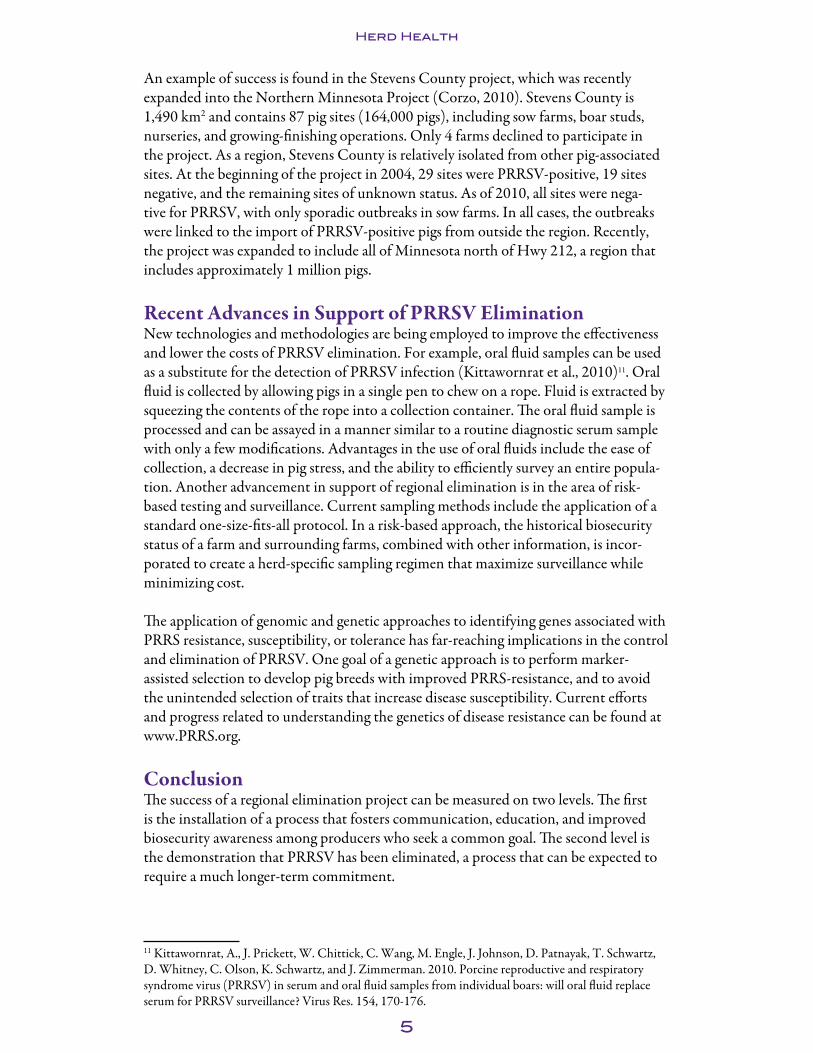
An example of success is found in the Stevens County project, which was recently expanded into the Northern Minnesota Project (Corzo, 2010). Stevens County is 1,490 km2 and contains 87 pig sites (164,000 pigs), including sow farms, boar studs, nurseries, and growing-finishing operations. Only 4 farms declined to participate in the project. As a region, Stevens County is relatively isolated from other pig-associated sites. At the beginning of the project in 2004, 29 sites were PRRSV-positive, 19 sites negative, and the remaining sites of unknown status. As of 2010, all sites were nega-tive for PRRSV, with only sporadic outbreaks in sow farms. In all cases, the outbreaks were linked to the import of PRRSV-positive pigs from outside the region. Recently, the project was expanded to include all of Minnesota north of Hwy 212, a region that includes approximately 1 million pigs.
Recent Advances in Support of PRRSV EliminationNew technologies and methodologies are being employed to improve the effectiveness and lower the costs of PRRSV elimination. For example, oral fluid samples can be used as a substitute for the detection of PRRSV infection (Kittawornrat et al., 2010)11. Oral fluid is collected by allowing pigs in a single pen to chew on a rope. Fluid is extracted by squeezing the contents of the rope into a collection container. The oral fluid sample is processed and can be assayed in a manner similar to a routine diagnostic serum sample with only a few modifications. Advantages in the use of oral fluids include the ease of collection, a decrease in pig stress, and the ability to efficiently survey an entire popula-tion. Another advancement in support of regional elimination is in the area of risk-based testing and surveillance. Current sampling methods include the application of a standard one-size-fits-all protocol. In a risk-based approach, the historical biosecurity status of a farm and surrounding farms, combined with other information, is incor-porated to create a herd-specific sampling regimen that maximize surveillance while minimizing cost.
The application of genomic and genetic approaches to identifying genes associated with PRRS resistance, susceptibility, or tolerance has far-reaching implications in the control and elimination of PRRSV. One goal of a genetic approach is to perform marker-assisted selection to develop pig breeds with improved PRRS-resistance, and to avoid the unintended selection of traits that increase disease susceptibility. Current efforts and progress related to understanding the genetics of disease resistance can be found at www.PRRS.org.
ConclusionThe success of a regional elimination project can be measured on two levels. The first is the installation of a process that fosters communication, education, and improved biosecurity awareness among producers who seek a common goal. The second level is the demonstration that PRRSV has been eliminated, a process that can be expected to require a much longer-term commitment.
11 Kittawornrat, A., J. Prickett, W. Chittick, C. Wang, M. Engle, J. Johnson, D. Patnayak, T. Schwartz, D. Whitney, C. Olson, K. Schwartz, and J. Zimmerman. 2010. Porcine reproductive and respiratory syndrome virus (PRRSV) in serum and oral fluid samples from individual boars: will oral fluid replace serum for PRRSV surveillance? Virus Res. 154, 170-176.
6
Herd Health
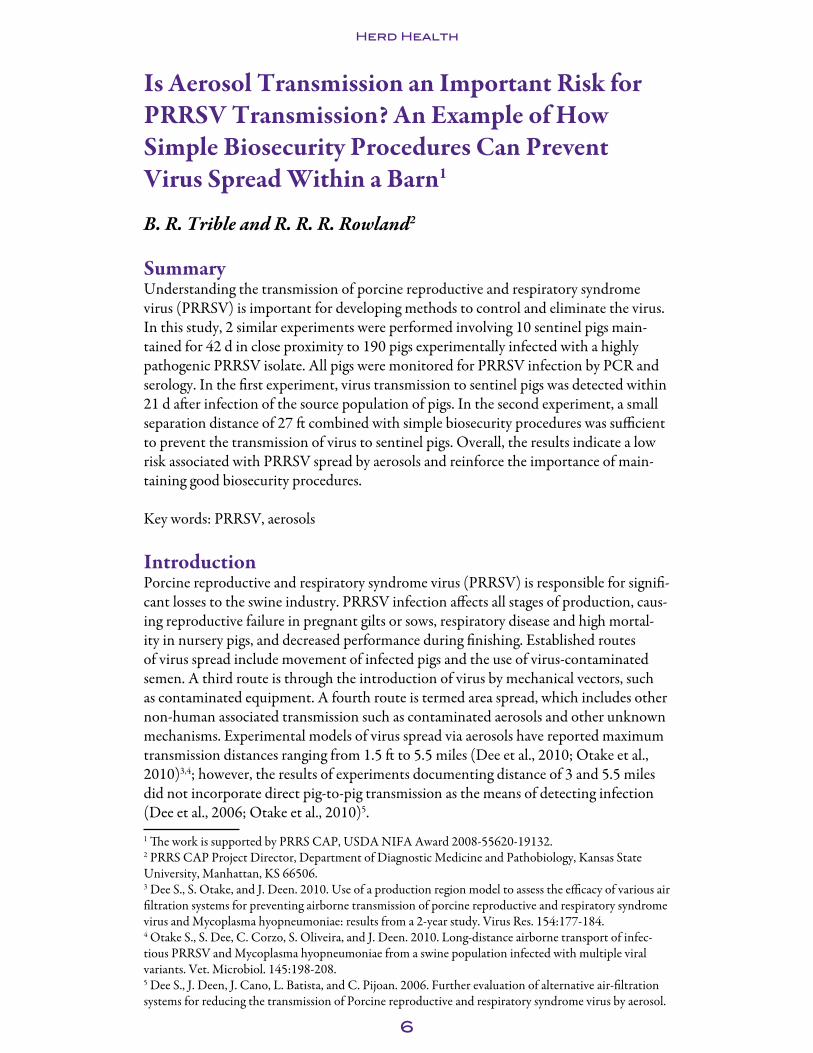
Is Aerosol Transmission an Important Risk for PRRSV Transmission? An Example of How Simple Biosecurity Procedures Can Prevent Virus Spread Within a Barn1
B. R. Trible and R. R. R. Rowland2
SummaryUnderstanding the transmission of porcine reproductive and respiratory syndrome virus (PRRSV) is important for developing methods to control and eliminate the virus. In this study, 2 similar experiments were performed involving 10 sentinel pigs main-tained for 42 d in close proximity to 190 pigs experimentally infected with a highly pathogenic PRRSV isolate. All pigs were monitored for PRRSV infection by PCR and serology. In the first experiment, virus transmission to sentinel pigs was detected within 21 d after infection of the source population of pigs. In the second experiment, a small separation distance of 27 ft combined with simple biosecurity procedures was sufficient to prevent the transmission of virus to sentinel pigs. Overall, the results indicate a low risk associated with PRRSV spread by aerosols and reinforce the importance of main-taining good biosecurity procedures.
Key words: PRRSV, aerosols
IntroductionPorcine reproductive and respiratory syndrome virus (PRRSV) is responsible for signifi-cant losses to the swine industry. PRRSV infection affects all stages of production, caus-ing reproductive failure in pregnant gilts or sows, respiratory disease and high mortal-ity in nursery pigs, and decreased performance during finishing. Established routes of virus spread include movement of infected pigs and the use of virus-contaminated semen. A third route is through the introduction of virus by mechanical vectors, such as contaminated equipment. A fourth route is termed area spread, which includes other non-human associated transmission such as contaminated aerosols and other unknown mechanisms. Experimental models of virus spread via aerosols have reported maximum transmission distances ranging from 1.5 ft to 5.5 miles (Dee et al., 2010; Otake et al., 2010)3,4; however, the results of experiments documenting distance of 3 and 5.5 miles did not incorporate direct pig-to-pig transmission as the means of detecting infection (Dee et al., 2006; Otake et al., 2010)5.1 The work is supported by PRRS CAP, USDA NIFA Award 2008-55620-19132.2 PRRS CAP Project Director, Department of Diagnostic Medicine and Pathobiology, Kansas State University, Manhattan, KS 66506.3 Dee S., S. Otake, and J. Deen. 2010. Use of a production region model to assess the efficacy of various air filtration systems for preventing airborne transmission of porcine reproductive and respiratory syndrome virus and Mycoplasma hyopneumoniae: results from a 2-year study. Virus Res. 154:177-184.4 Otake S., S. Dee, C. Corzo, S. Oliveira, and J. Deen. 2010. Long-distance airborne transport of infec-tious PRRSV and Mycoplasma hyopneumoniae from a swine population infected with multiple viral variants. Vet. Microbiol. 145:198-208.5 Dee S., J. Deen, J. Cano, L. Batista, and C. Pijoan. 2006. Further evaluation of alternative air-filtration systems for reducing the transmission of Porcine reproductive and respiratory syndrome virus by aerosol.

7
Herd Health
As part of a large study involving the infection of hundreds of pigs with a highly patho-genic PRRSV isolate, we sought to determine if implementing a few biosecurity proce-dures would prevent the aerial spread of PRRSV in a facility that possessed some of the features found in commercial production settings.
ProceduresAnimal experiments were initiated after review and approval by the Kansas State University Institutional Animal Care and Use Committee. For each experiment, ~200 high-health pigs were randomly distributed at a density of 10 to 15 pigs per pen (12 ft by 12 ft). A diagram of the facility is shown in Figure 1A. Each pen consisted of a solid concrete floor separated by either solid concrete partitions or metal-framed partitions covered by hard plastic. A metal-framed gate was located at the front of each pen to allow access for personnel while keeping the pens relatively open. Pens were washed daily by animal caretakers and effluent material was allowed to flow out the front of each pen into a central floor drain (Figure 1A).
The virus challenge consisted of 105 50% tissue culture infectious doses of the PRRSV isolate NVSL 97-7895. This isolate was selected based on its relatively high pathogenic properties (Willis et al., 19976). Half of the 3 mL virus inoculum was administered intranasally and the remainder was given intramuscularly. Pigs were monitored daily for clinical signs and received appropriate veterinary care as needed. Experiments were terminated 42 d after infection.
Blood samples were collected from all pigs on d 0, 4, 7, 11, 14, 21, 28, 35, and 42 postin-fection. Animal care and scientific personnel donned protective equipment, includ-ing disposable Tyvek coveralls, nitrile gloves, and foot covers. A footbath filled with disinfectant (Trifectant; Alpha Tech Pet, Littleton, MA) was placed in the walkway for workers to clean boots before entering or leaving animal areas. PRRSV diagnostic assays, including PCR and ELISA, were performed by personnel at the Kansas State Veterinary Diagnostic Laboratory.
ResultsExperiment 1. For the first experiment, biosecurity procedures included a one-way flow of personnel from the clean area to the infected area (Figure 1B). Personnel entered through a single door, donned protective gear, then worked with the sentinel pigs prior to entering the infected pig area. The experimentally challenged pigs exhibited clini-cal signs, including lethargy and respiratory distress, which first appeared within 1 wk after challenge. Infection was confirmed by PRRSV qRT-PCR, with the first positive results appearing on d 4 postinfection and positive serology beginning on d 14 (Figure 2A, Table 1). The sentinel pigs became PRRSV-positive on d 21 (6 out of 10 pigs were PCR-positive) followed by seroconversion on d 35. By the end of the study, all senti-nel pigs were PCR- and antibody-positive for PRRSV. The results from Experiment 1 demonstrated that PRRSV NVSL 97-7895 was transmitted between infected and sentinel pigs. Transmission likely occurred during peak levels of viremia in the virus-challenged pigs. The transmission of virus to sentinel pigs was not the result of direct
Can. J. Vet. Res. 70:168-175.6 Willis R., J. Zimmerman, S. Swenson, K. Yoon, H. Hill, D. Bundy, and M. McGinley. 1997. Transmis-sion of PRRSV by direct, close, or indirect contact. Swine Health Prod. 213-218.

8
Herd Health
pig-to-pig contact, but could have occurred through the aerosol spread of virus, either by virus released into the air by infected pigs or by droplets generated during the wash-ing of pens. Other possibilities included the movement of personnel or contaminated materials from the infected area, back through the gate, and into the clean area.
Experiment 2. Experiment 2 was performed in the same manner as Experiment 1, with the exception of three changes in biosecurity (Figure 1C). The first was an increase in separation from 17 ft to 27 ft between sentinel pigs and the nearest infected pen. The second change was the replacement of the gate with a barrier fence to prevent the move-ment of personnel between clean and infected areas. Finally, the clean and infected areas had separate personnel entrances and exits. The infection and immune response of the challenge pigs followed the same course as Experiment 1 (see Figure 2B and Table 1). In this experiment, the sentinel pigs remained PRRSV PCR-negative and seronegative throughout the 42-d exposure to the infected pigs (Figure 2B, Table 1).
DiscussionThe model used in this study incorporates several features relevant for understanding mechanisms of aerosol transmission, including (1) a large source population infected with a highly pathogenic PRRSV isolate, (2) the placement of sentinel pigs and infected pigs within the same facility that shared the same air space, and (3) the exposure of sentinel pigs for an extended period of time. The results from this study indicate that the risk of the spread of PRRSV via aerosols is likely minimal and supports the observa-tions and conclusions of several previous studies showing that aerosol spread of PRRSV is limited to a couple of meters. This is in contrast to recent reports indicating that isolates such as MN-184 can spread via aerosols over distances of several miles. The PRRSV isolate used in this study shares characteristics similar to MN-184 in terms of pathogenicity and the capacity to replicate to high titers within pigs (Johnson et al., 2004; Osorio, et al., 2002; Troung et al., 2004).7,8,9 MN-184 was reported to travel up to 9.1 km from the source of the virus, which was 300 experimentally infected pigs (Otake et al., 2010), whereas in this study, 190 pigs infected with NVSL 97-7895 were unable to infect pigs at a distance of approximately 27 ft. The reason for this discrep-ancy is unclear. One possibility is related to the method used to determine virus spread. In this study, pig-to-pig transmission was used as the indicator of aerosol spread. In contrast, the spread of MN-184 was measured by assaying the contents of concentrated air samples collected at various distances from the source population. Although infec-tious virus particles were identified by virus isolation and swine bioassays, whether these methods accurately replicate the conditions of pig-to-pig aerosol transmission found in the field is unknown.
7 Johnson W., M. Roof, E. Vaughn, J. Christopher-Hennings, C. R. Johnson, and M. Murtaugh. 2004. Pathogenic and humoral immune responses to porcine reproductive and respiratory syndrome virus (PRRSV) are related to viral load in acute infection. Vet. Immunol. Immunopathol. 102:233-247.8 Osorio F., J. Galeota, E. Nelson, B. Brodersen, A. Doster, R. Wills, F. Zuckermann, and W. Laegreid. 2002. Passive transfer of virus-specific antibodies confers protection against reproductive failure induced by a virulent strain of porcine reproductive and respiratory syndrome virus and establishes sterilizing immunity. Virology 302:9-20.9 Truong H., Z. Lu, G. Kutish, J. Galeota, F. Osorio, and A. K. Pattnaik. 2004. A highly pathogenic porcine reproductive and respiratory syndrome virus generated from an infectious cDNA clone retains the in vivo virulence and transmissibility properties of the parental virus. Virology 325:308-319.

9
Herd Health
Although the transmission of PRRSV in aerosols was not seen in this study, we cannot conclude that area spread never occurs; however, our results indicate that simple changes in biosecurity procedures, including the redirection of personnel flow and a relatively small distance between infected and non-infected pigs, reduced PRRSV trans-mission risk within an experimental facility.
A
B
1
2928271716
1415
C
1
26 28271716
1415
Infected area
Clean area
Fence with gate
Fence without gate
Entrance/exit
Personnel �ow
Floor drainE�uent direction
27 ft 17 ft
12 ft
36 ft
12 ft
225 ft
Figure 1. Layout of the PRRSV challenge facility used to house the experimentally infected and sentinel pigs. A shows the general layout of the facility including dimensions and location of the central floor drain. The flow of personnel; the location of gates, barriers, entrances and exits; and the areas designated as clean and infected are shown in B (Experiment 1) and C (Experiment 2). For B and C, the gray and white areas denote infected and clean areas, respectively. Pigs were located in numbered pens. The sentinel pigs were placed in pen 1.

10
Herd Health
Tem
plat
es p
er re
acti
on (l
og10
)
Days postinfection (DPI)
0 423528147 21114
8
7
6
5
4
3
2
1
<1
8
7
6
5
4
3
2
1
<1
Infected pigs
Sentinel pigs
A
B
Tem
plat
es p
er re
acti
on (l
og10
)
0 423528147 21114
Figure 2. PRRSV load in reference and infected pig sera. Quantitative RT-PCR was performed as described in Procedures. The average of the log10 of PRRSV templates per reaction for infected and sentinel pigs is shown for Experiment 1 (A) and Experiment 2 (B). Filled circles and non-filled circles show the means for infected pigs and sentinel pigs in each panel, respectively. Standard deviations are represented by horizontal and vertical lines within each panel.

11
Herd Health
Table 1. Serum antibody levels against PRRSV as detected by ELISAExperiment 1 Experiment 2
Days postinfection Days postinfectionGroup Pig ID 35 45 Pig ID 35 42Sentinel pigs (pen 1)1 1358 0.653 2.75 6605 -0.06 -0.04
1412 1.39 1.78 6639 -0.06 -0.05 1388 0.08 0.68 6662 -0.05 -0.06 1359 0.01 1.59 6663 -0.04 -0.05 1343 1.79 2.50 6707 -0.06 -0.06 1413 2.31 1.15 6739 -0.01 -0.02 1512 0.14 0.43 6749 -0.06 -0.03 1362 0.04 2.09 6758 -0.06 -0.06 1497 0.04 1.50 6761 -0.06 -0.06 1433 1.79 1.17 6773 -0.05 -0.04
Infected pigs2 Mean 2.31 2.15 Mean 2.26 2.031 Includes all pigs in the sentinel group.2 Includes the mean sample to positive ratio (S/P) for all pigs in the infected group (approximately 200 pigs).3 Values indicate S/P of the PRRS ELISA. Shaded numbers indicate a positive result (S/P > 0.39).

12
Herd Health
Utilizing Vaccination for Porcine Circovirus Type 2 as a Tool to Aid Elimination of PCV2 from Swine Populations1,2
M. L. Potter3, S. S. Dritz4, R. A. Hesse4, R. R. R. Rowland4, J. C. Nietfeld4, R. Oberst4, S. C. Henry3, L. M. Tokach3, M. Hays4, A. Fuller4, B. E. Straw5, and R. O. Bates6
SummaryA total of 928 pigs from the Swine Teaching and Research Centers at Michigan State University (MSU) and Kansas State University (KSU) and a Kansas commercial farm were used during a 3-year study to determine whether circovirus vaccination influ-enced porcine circovirus type 2 (PCV2) circulation within a herd and could be used as a tool to eliminate PCV2 from PCV2-positive swine herds. Infection with PCV2 was confirmed in both university herds before circovirus vaccine introduction. After vaccination implementation, vaccinated barrows from consecutive groups were serially tested for viremia. Follow-up antibody and growth testing with vaccinated and non-vaccinated pigs was performed at the KSU farm. In a circovirus-vaccinated commercial herd, testing of non-circovirus-vaccinated pigs for viremia was completed. Environmen-tal swab samples were collected from facilities at the KSU and commercial farms for PCV2 DNA detection.
Sera from 0 of 9 MSU vaccinated-cohorts and 3 of 10 KSU vaccinated-cohorts had detectable PCV2 DNA. From follow-up testing, a PCV2 antibody rise after vaccina-tion was detected for vaccinated pigs with no detectable antibody rise for non-vacci-nated pigs. Overall growth rate of non-vaccinated pigs tended (P = 0.07) to increase compared with vaccinated pigs. Non-vaccinated pigs became PCV2 viremic at the commercial farm. Viral DNA was detected in the environment of the commercial farm but not in the KSU facilities.
1 Appreciation is expressed to the Kanas State University Swine Nutrition Team: Drs. Steve Dritz, Mike Tokach, Jim Nelssen, Bob Goodband, and Joel DeRouchey; the Kansas State and Michigan State swine nutrition and diagnostic medicine/pathology graduate students and undergraduate student employ-ees; Dr. Kyle Horlen, member of the Rowland Laboratory in the Kansas State Veterinary Diagnostic Laboratory; and the Kansas State Swine Research and Teaching Herd Farm Crew, Mark Nelson, Frank Jennings, and Lyle Figge, for their assistance with a variety of supportive procedures including planning and on-farm data collection, manuscript review, and their continued enthusiasm and willingness to make pigs available for sampling purposes.2 Appreciation is expressed to the American Association of Swine Veterinarians, Kansas State University, contributors to the Swine Diagnostic Fund, Michigan State University, and Dr. Brad Thacker (Intervet/Schering-Plough, Millsboro, DE) for partial funding of this project.3 Abilene Animal Hospital, PA, Abilene, KS.4 Department of Diagnostic Medicine/Pathobiology, College of Veterinary Medicine, Kansas State University.5 Department of Large Animal Clinical Sciences, College of Veterinary Medicine, Michigan State University.6 Department of Animal Science, Michigan State University.

13
Herd Health
Therefore, circovirus vaccine can affect viral circulation on farms but would need to be used in conjunction with other management practices to eliminate PCV2 from most swine populations.
Key words: circovirus, disease elimination, PCV2, swine, vaccine
IntroductionInfection with porcine circovirus type 2 (PCV2) can result in a multi-syndrome disease, porcine circovirus disease (PCVD).7 Identified in diagnostic laboratory samples in the early 1990s, PCV2 has affected most U.S. swine herds. Despite a long history of PCV2 circulation within the swine population, vaccines against PCV2 have been commer-cially available only since 2006.8 Initial studies evaluating the effects of circovirus vaccination on production parameters in PCV2-affected herds indicate that vaccination was effective at reducing finishing phase mortality and increasing pig growth rate.9,10,11 In single-cohort studies, vaccination with commercial or experimental vaccines against PCV2 reduced viremia10,11 and decreased viral shedding in nasal secretions and feces,12,13 but data evaluating the effects of vaccination on PCV2 viral circulation within a herd over time are limited. Our goal was to monitor PCV2 viral circulation in swine herds after implementing a circovirus vaccination program for growing pigs. The short-term objective of this project was to determine whether circovirus vaccination could be used to affect viral circulation within 2 farrow-to-finish herds. The long-term objective of the project was to understand whether use of circovirus vaccines over time in PCV2-positive swine herds could provide a tool to eliminate PCV2 from these herds.
ProceduresProcedures used in these studies were approved by the Kansas State University and Michigan State University Institutional Animal Care and Use Committees.
Herd History. The MSU and KSU Swine Teaching and Research Centers were single-location farrow-to-finish operations. Pigs were moved through the KSU farm in an
7 Segalés, J., G. M. Allan, and M. Domingo. 2005. Porcine circovirus diseases. Anim. Health Res. Rev. 6:119-142.8 Opriessnig, T., A. R. Patterson, D. M. Madson, N. Pal, and P. G. Halbur. 2009. Comparison of efficacy of commercial one dose and two dose PCV2 vaccines using a mixed PRRSV-PCV2-SIV clinical infection model 2-3-months post vaccination. Vaccine 27:1002-1007.9 K. P. Horlen, S. S. Dritz, J. C. Nietfeld, S. C. Henry, R. A. Hesse, R. Oberst, M. Hays, J. Anderson, and R. R. Rowland. 2008. A field evaluation of mortality rate and growth performance in pigs vaccinated against porcine circovirus type 2. J Am. Vet. Med. Assoc. 232:906-912.10 Fachinger, V., R. Bischoff, S. B. Jedidia, A. Saalmüller, and K. Elbers. 2008. The effect of vaccination against porcine circovirus type 2 in pigs suffering from porcine respiratory disease complex. Vaccine 26:1488-1499.11 Kixmöller, M., M. Ritzmann, M. Eddicks, A. Saalmüller, K. Elbers, and V. Fachinger. 2008. Reduction of PMWS-associated clinical signs and co-infections by vaccination against PCV2. Vaccine 26:3443-3451.12 Fort, M., M. Sibila, A. Allepuz, E. Mateu, R. Roerink, and J. Segalés. 2008. Porcine circovirus type 2 (PCV2) vaccination of conventional pigs prevents viremia against PCV2 isolates of different genotypes and geographic origins. Vaccine 26:1063-1071.13 Fort, M., M. Sibila, E. Pérez-Martín, M. Nofrarías, E. Mateu, and J. Segalés. 2009. One dose of a porcine circovirus 2 (PCV2) sub-unit vaccine administered to 3-week-old conventional piglets elicits cell-mediated immunity and significantly reduces PCV2 viremia in an experimental model. Vaccine 27:4031-4037.

14
Herd Health
all-in, all-out manner in nursery, grower, or finisher rooms. In the MSU farm, about half of the pigs placed in a nursery, grower, or finisher room were moved in and out at a time. Pigs were born (farrowed) at each farm approximately every 4 (MSU) or 5 (KSU) wk, which resulted in growing pig populations of about 300 pigs in each age group. Both herds were negative for porcine reproductive and respiratory syndrome virus, and the MSU herd was negative for Mycoplasma hyopneumoniae (M. hyo). Pigs at the KSU farm were vaccinated at weaning for M. hyo (RespiSure-ONE; Pfizer Animal Health, New York, NY), which, along with other management procedures, contributed to low levels of clinical disease. Prior to the start of our study, both farms had been closed to live animal introductions, but semen was introduced from outside sources. In October 2007, the KSU farm began to bring replacement gilts from an outside source into the herd approximately every 9 wk.
Clinical history. The KSU farm did not have any clinical signs of PCVD noted before the baseline testing and subsequent implementation of a circovirus vaccination program, although prior to baseline testing, histopathologic evaluation on tissues of one pig documented lymphoid depletion lesions consistent with PCVD. The MSU farm had evidence of moderate clinical PCVD (10 to 15% nursery mortality) prior to baseline testing.
Phase 1: Baseline testing procedures. In early 2007, a cross-sectional survey was conducted of both university herds to verify the presence of PCV2 and to characterize patterns of PCV2 infection and seroconversion. At the MSU farm, blood was collected from 101 pigs across a total of 5 growing pig populations (6 to 10, 11 to 15, 16 to 20, 21 to 25, and 26 to 30 wk of age). Within the KSU farm, 141 pigs were sampled across 5 growing pig populations (4, 9, 14, 19, and 24 wk of age). Serum was pooled (MSU: 21 pools, and KSU: 27 pools) within age group and analyzed using the Kansas State Veterinary Diagnostic Laboratory (KSVDL) PCV2 PCR assay for detection of PCV2 nucleic acid. Viral template quantities for each serum pool were log10 transformed and transformed results were averaged for pools within each age range to characterize the changes in viral load. For the detection of PCV2 antibodies, individual serum samples were tested using the 96-well format KSVDL PCV2 indirect fluorescent antibody (IFA) assay with serial 1:2 dilutions beginning with a 1:20 serum to phosphate-buffered saline dilution and ending with a 1:2,560 ratio. The titration endpoint was calculated as the reciprocal of the last serum dilution that gave a positive result.
All IFA titers were log2 transformed to approximate a normal distribution prior to descriptive analysis. For samples that did not have antibody detected at the most concentrated dilution (1:20), the log2 of 10 was used in the analysis. For samples that were strongly positive at the least concentrated dilution (1:2,560), the log2 of 5,120 was used. This approach allowed results to be weighted differently than samples with anti-body detected with a normal level of fluorescence at the 1:20 and 1:2,560 dilutions.
Infection and antibody profiles obtained from the baseline testing were considered when deciding on sampling times for the Phase 2 study on each farm.
Phase 2: Trial procedures. In the spring of 2007, both MSU and KSU initiated circo-virus vaccination programs. A 2-dose circovirus vaccine (Circumvent PCV; Intervet/Schering-Plough, Millsboro, DE) was administered as an intramuscular injection

15
Herd Health
(2 mL per dose) to all growing pigs in each weaning group with 3 to 5 wk between vaccine doses. Pigs were weaned and vaccinated with the first dose of circovirus vaccine at approximately 3 wk of age at the KSU farm, but weaning age and timing of first vacci-nation at the MSU farm varied (range: 2 to 6 wk).
From 2007 through 2008, barrows from consecutive weaning cohorts at the MSU (9 groups) and KSU (10 groups) farms were monitored for PCV2 viremia. A minimum of 12 barrows per group from different litters were randomly selected, ear-tagged, and serially bled at 4 time points: weaning or just before vaccination, entry-to-finishing, mid-finishing, and end-of-finishing. After completion of data collection in 2008, indi-vidual serum samples for pigs with complete serum sets (4 serum samples per pig) were tested by the KSVDL PCV2 PCR assay for detection of PCV2 nucleic acid. An aver-age of 40 cycles was run with a cycle time threshold of 0.05 for classification of PCV2 nucleic acid-containing (positive) samples.
Phase 3: Follow-up monitoring procedures. Beginning in the spring of 2009, a total of 372 pigs (186 non-vaccinated control pigs and 186 circovirus-vaccinated pigs) across 3 weaning groups were used in a Phase 3 growth and PCV2 antibody follow-up study at the KSU farm. At the start of the Phase 3 study, the KSU farm had been vaccinat-ing pigs against PCV2 for the previous 2 years. During that time there had been no evidence of clinical disease. A first objective of this follow-up study was to document the effects of circovirus vaccination on PCV2 antibody titers and to determine whether there was evidence of PCV2 exposure. A second objective of this Phase 3 study was to evaluate the effects of circovirus vaccination on growth rate of pigs in the KSU herd.
Three groups of pigs were used in the Phase 3 study. Groups 1 and 2 had 7 pigs per nurs-ery pen. A total of 18 barrow pairs (36 pigs; 1 pair in each of 18 pens) for group 1 and 30 barrow pairs (60 pigs; 1 pair in each of 30 pens) for group 2 were utilized. Within a pen, a pair of barrows was selected with one barrow per pair randomly allotted to a vaccinated treatment and the pen-mate barrow assigned to the non-vaccinated control treatment. Barrows assigned to the vaccinated treatment were injected intramuscularly with a 2-dose circovirus vaccine (Circumvent PCV) at approximately 3 and 6 wk of age. All other pigs in the weaning group not enrolled in the follow-up study were vaccinated with the same 2-dose circovirus vaccine.
Throughout the entire study, pairs of barrows remained penned together. Barrows were individually weighed and bled at 4 time points: d 0 (pre-vaccination), entry-to-finisher, mid-finishing, and end-of-finishing. From these data, ADG was calculated for 3 periods: nursery and grower, finisher, and overall nursery to finisher. Removals and mortalities were recorded and weighed and their gain and time on test were included in performance calculations.
For group 3, 138 barrow or gilt pairs (276 pigs) were randomly allotted to treatments (vaccinated or non-vaccinated control) at the time of weaning with procedures similar to those used for groups 1 and 2. For group 3, 6 or 8 pigs were assigned to each nurs-ery pen (3 or 4 pairs within a pen) and all pigs were placed on test. Pigs assigned to the vaccinated treatment were injected intramuscularly with a 2-dose circovirus vaccine (Circumvent PCV) at approximately 3 and 9 wk of age. Weighing and penning proce-dures for each pair were similar to those used for groups 1 and 2. A subset of 20 barrow

16
Herd Health
pairs (40 pigs) from 20 different pens distributed throughout the nursery were bled at the time of weighing. Pairs of barrows were selected and, within each pair, one barrow was randomly assigned to a vaccinated treatment and the pen-mate barrow assigned to the non-vaccinated control treatment. For group 3, removals and mortalities were recorded and weighed and their gain and time on test were included in performance calculations.
Individual serum samples for groups 1, 2, and 3 were tested for PCV2 antibodies using the KSVDL IFA assay. Test procedures used were similar to those used in Phase 1; however, an initial serum to phosphate-buffered saline dilution of 1:40 was used with subsequent serial 1:3 dilutions for group 1, 2, and 3 samples. Testing was performed over 7 d (2 d for group 1, 3 d for group 2, and 2 d for group 3), and pairs of pigs were balanced across IFA days within each study.
Group 1, 2, and 3 IFA titers were log3 transformed to approximate a normal distribu-tion prior to statistical analysis. For samples that did not have antibody detected at the most concentrated dilution (1:40), the log3 of 13.3 was used in the analysis, whereas the log3 of 262,440 was used for analysis for samples that were strongly positive at the least concentrated dilution (1:87,480). This approach allowed these samples to be weighted differently than positive samples with normal level fluorescence at 1:40 and 1:87,480.
Group 1, 2, and 3 IFA data were analyzed by repeated measures analysis using the GLIMMIX procedure in SAS version 9.1.3 (SAS Institute, Inc., Cary, NC). Fixed effects in the model included treatment, time, and their interaction. Group and IFA day were used as random effects. Differences between treatments were determined using least squares means (P < 0.05). Log3 transformed least squares means were transformed back to the original scale for presentation as geometric mean titers (GMT).
Growth data were analyzed using the GLIMMIX procedure in SAS version 9.1.3. The interaction with gender and treatment was determined to be non-significant for group 3, and growth data were pooled across the genders for subsequent analysis of the treat-ment effect. Thus, growth data for all 3 groups were analyzed using a single model. Treatment was a fixed effect and group was included as a random effect. Differences between treatments were determined using least squares means (P < 0.05).
Phase 4: Monitoring for PCV2 under commercial conditions. A commercial farm in Kansas that was determined to have had severe PCVD before circovirus vaccine became available was selected as a herd for an additional monitoring study (Phase 4) because of proximity and clinical history. Prior to the introduction of circovirus vaccine, post-weaning mortality had ranged from 5% to 19%. After implementation of a circovirus vaccination program (Circumvent PCV), the herd had less apparent clinical disease (mortality: 4 to 9%). The circovirus vaccination program had been in place for a year before our Phase 4 study began. In addition to the history of PCV2 infection, porcine reproductive and respiratory syndrome virus and M. hyo also contributed to the health challenges in the nursery and finishing phases of production. Pigs were weaned from a sow farm in western Kansas and moved to eastern Kansas to be placed at a nursery-finishing site with 2 nursery barns with 4 rooms each and 8 finishing barns. Pigs were moved all-in, all-out by nursery room and finishing barn.
17
Herd Health
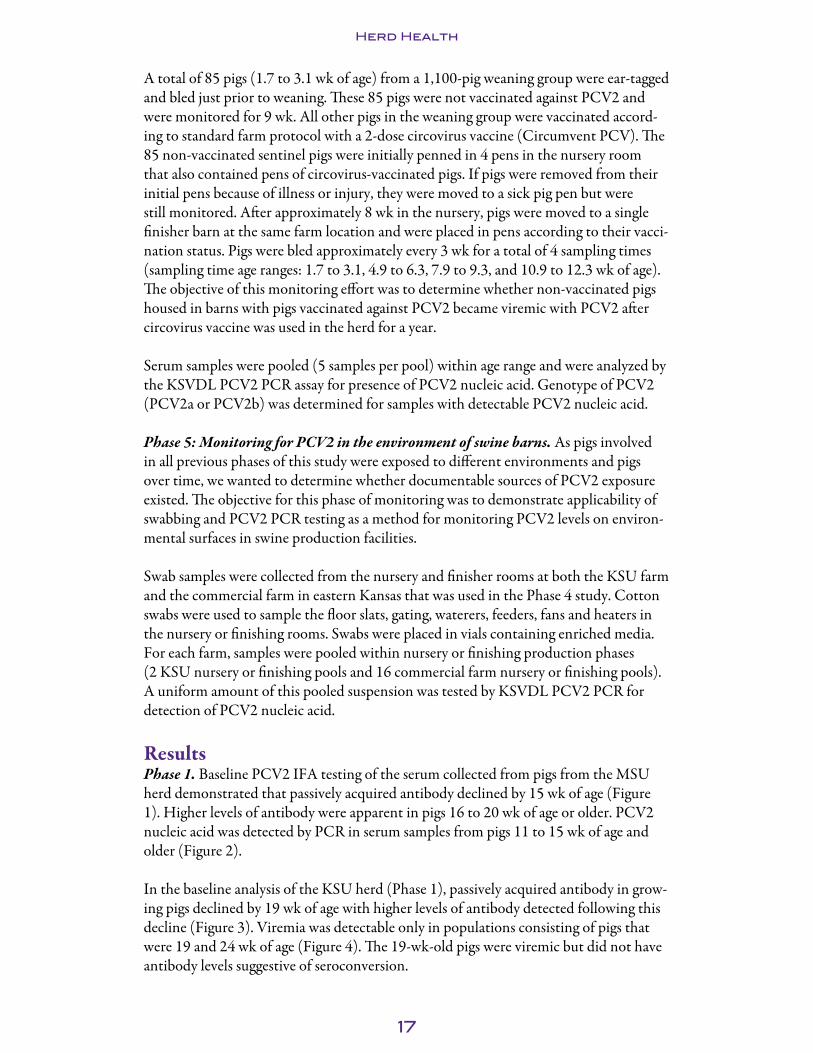
A total of 85 pigs (1.7 to 3.1 wk of age) from a 1,100-pig weaning group were ear-tagged and bled just prior to weaning. These 85 pigs were not vaccinated against PCV2 and were monitored for 9 wk. All other pigs in the weaning group were vaccinated accord-ing to standard farm protocol with a 2-dose circovirus vaccine (Circumvent PCV). The 85 non-vaccinated sentinel pigs were initially penned in 4 pens in the nursery room that also contained pens of circovirus-vaccinated pigs. If pigs were removed from their initial pens because of illness or injury, they were moved to a sick pig pen but were still monitored. After approximately 8 wk in the nursery, pigs were moved to a single finisher barn at the same farm location and were placed in pens according to their vacci-nation status. Pigs were bled approximately every 3 wk for a total of 4 sampling times (sampling time age ranges: 1.7 to 3.1, 4.9 to 6.3, 7.9 to 9.3, and 10.9 to 12.3 wk of age). The objective of this monitoring effort was to determine whether non-vaccinated pigs housed in barns with pigs vaccinated against PCV2 became viremic with PCV2 after circovirus vaccine was used in the herd for a year.
Serum samples were pooled (5 samples per pool) within age range and were analyzed by the KSVDL PCV2 PCR assay for presence of PCV2 nucleic acid. Genotype of PCV2 (PCV2a or PCV2b) was determined for samples with detectable PCV2 nucleic acid.
Phase 5: Monitoring for PCV2 in the environment of swine barns. As pigs involved in all previous phases of this study were exposed to different environments and pigs over time, we wanted to determine whether documentable sources of PCV2 exposure existed. The objective for this phase of monitoring was to demonstrate applicability of swabbing and PCV2 PCR testing as a method for monitoring PCV2 levels on environ-mental surfaces in swine production facilities.
Swab samples were collected from the nursery and finisher rooms at both the KSU farm and the commercial farm in eastern Kansas that was used in the Phase 4 study. Cotton swabs were used to sample the floor slats, gating, waterers, feeders, fans and heaters in the nursery or finishing rooms. Swabs were placed in vials containing enriched media. For each farm, samples were pooled within nursery or finishing production phases (2 KSU nursery or finishing pools and 16 commercial farm nursery or finishing pools). A uniform amount of this pooled suspension was tested by KSVDL PCV2 PCR for detection of PCV2 nucleic acid.
Results Phase 1. Baseline PCV2 IFA testing of the serum collected from pigs from the MSU herd demonstrated that passively acquired antibody declined by 15 wk of age (Figure 1). Higher levels of antibody were apparent in pigs 16 to 20 wk of age or older. PCV2 nucleic acid was detected by PCR in serum samples from pigs 11 to 15 wk of age and older (Figure 2).
In the baseline analysis of the KSU herd (Phase 1), passively acquired antibody in grow-ing pigs declined by 19 wk of age with higher levels of antibody detected following this decline (Figure 3). Viremia was detectable only in populations consisting of pigs that were 19 and 24 wk of age (Figure 4). The 19-wk-old pigs were viremic but did not have antibody levels suggestive of seroconversion.
18
Herd Health
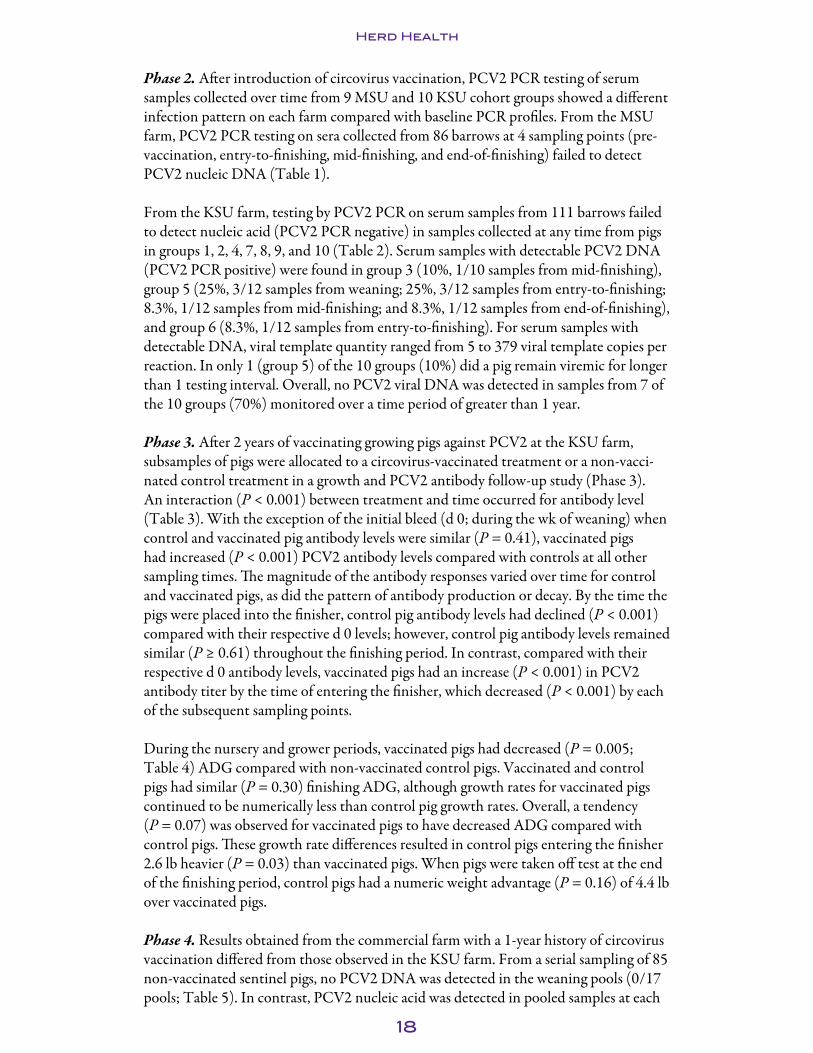
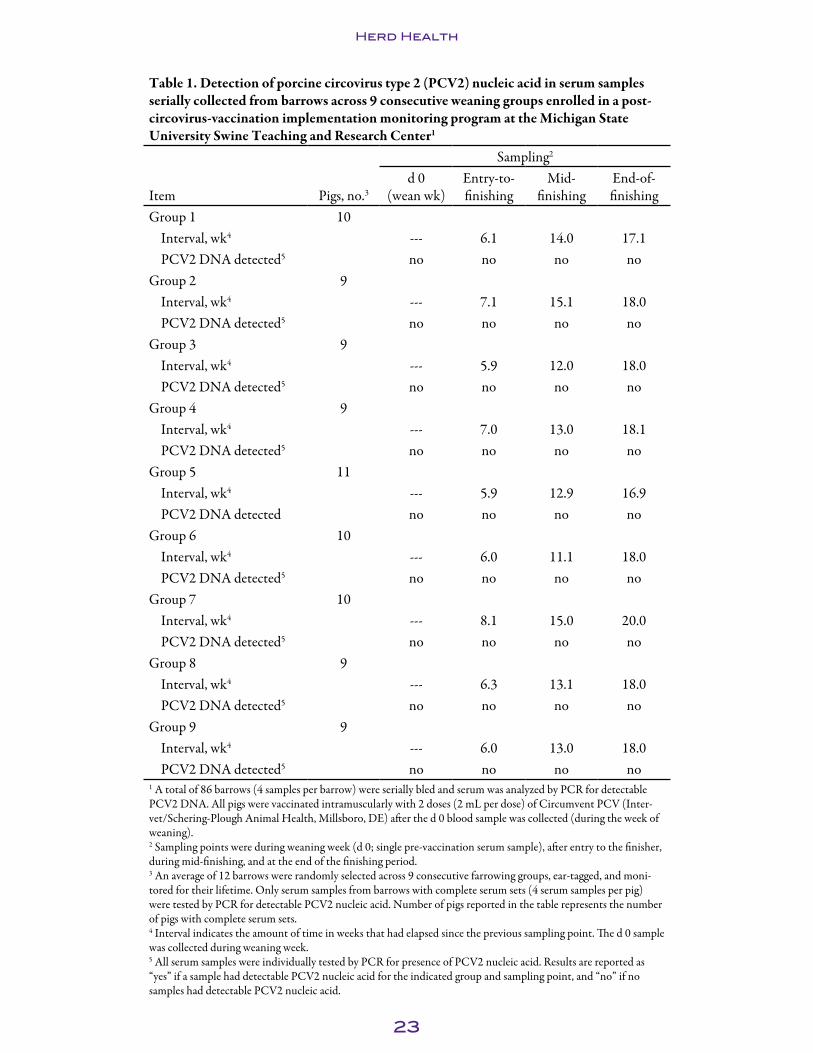
Phase 2. After introduction of circovirus vaccination, PCV2 PCR testing of serum samples collected over time from 9 MSU and 10 KSU cohort groups showed a different infection pattern on each farm compared with baseline PCR profiles. From the MSU farm, PCV2 PCR testing on sera collected from 86 barrows at 4 sampling points (pre-vaccination, entry-to-finishing, mid-finishing, and end-of-finishing) failed to detect PCV2 nucleic DNA (Table 1).
From the KSU farm, testing by PCV2 PCR on serum samples from 111 barrows failed to detect nucleic acid (PCV2 PCR negative) in samples collected at any time from pigs in groups 1, 2, 4, 7, 8, 9, and 10 (Table 2). Serum samples with detectable PCV2 DNA (PCV2 PCR positive) were found in group 3 (10%, 1/10 samples from mid-finishing), group 5 (25%, 3/12 samples from weaning; 25%, 3/12 samples from entry-to-finishing; 8.3%, 1/12 samples from mid-finishing; and 8.3%, 1/12 samples from end-of-finishing), and group 6 (8.3%, 1/12 samples from entry-to-finishing). For serum samples with detectable DNA, viral template quantity ranged from 5 to 379 viral template copies per reaction. In only 1 (group 5) of the 10 groups (10%) did a pig remain viremic for longer than 1 testing interval. Overall, no PCV2 viral DNA was detected in samples from 7 of the 10 groups (70%) monitored over a time period of greater than 1 year.
Phase 3. After 2 years of vaccinating growing pigs against PCV2 at the KSU farm, subsamples of pigs were allocated to a circovirus-vaccinated treatment or a non-vacci-nated control treatment in a growth and PCV2 antibody follow-up study (Phase 3). An interaction (P < 0.001) between treatment and time occurred for antibody level (Table 3). With the exception of the initial bleed (d 0; during the wk of weaning) when control and vaccinated pig antibody levels were similar (P = 0.41), vaccinated pigs had increased (P < 0.001) PCV2 antibody levels compared with controls at all other sampling times. The magnitude of the antibody responses varied over time for control and vaccinated pigs, as did the pattern of antibody production or decay. By the time the pigs were placed into the finisher, control pig antibody levels had declined (P < 0.001) compared with their respective d 0 levels; however, control pig antibody levels remained similar (P ≥ 0.61) throughout the finishing period. In contrast, compared with their respective d 0 antibody levels, vaccinated pigs had an increase (P < 0.001) in PCV2 antibody titer by the time of entering the finisher, which decreased (P < 0.001) by each of the subsequent sampling points.
During the nursery and grower periods, vaccinated pigs had decreased (P = 0.005; Table 4) ADG compared with non-vaccinated control pigs. Vaccinated and control pigs had similar (P = 0.30) finishing ADG, although growth rates for vaccinated pigs continued to be numerically less than control pig growth rates. Overall, a tendency (P = 0.07) was observed for vaccinated pigs to have decreased ADG compared with control pigs. These growth rate differences resulted in control pigs entering the finisher 2.6 lb heavier (P = 0.03) than vaccinated pigs. When pigs were taken off test at the end of the finishing period, control pigs had a numeric weight advantage (P = 0.16) of 4.4 lb over vaccinated pigs.
Phase 4. Results obtained from the commercial farm with a 1-year history of circovirus vaccination differed from those observed in the KSU farm. From a serial sampling of 85 non-vaccinated sentinel pigs, no PCV2 DNA was detected in the weaning pools (0/17 pools; Table 5). In contrast, PCV2 nucleic acid was detected in pooled samples at each

19
Herd Health
of 3 subsequent sampling ages (4.9 to 6.3 wk of age: 1/17 pools; 7.9 to 9.3 wk of age: 6/16 pools; and 10.9 to 12.3 wk of age: 12/16 pools). Genotype was reported for each pool. PCV2a was detected in all but 1 pool (4.9 to 6.3 wk of age: 1/17 pools; 7.9 to 9.3 wk of age: 6/16 pools; and 10.9 to 12.3 wk of age: 11/16 pools), but PCV2b was not detected in any of the pools until 10.9 to 12.3 wk of age (2/16 pools).
Phase 5. Environmental swabbing and testing by PCV2 PCR (Figure 5) detected PCV2 DNA in samples from 8 commercial nursery and 8 commercial finisher barns. In contrast, the presence of PCV2 DNA was not detected by PCV2 PCR testing of environmental swab samples from the KSU farm.
DiscussionThis was a first study to evaluate the effects of circovirus vaccination on viral circulation at the herd level. Our study was designed to begin to evaluate the hypothesis that circo-virus vaccination programs in herds would affect viremia and subsequent viral shedding into the environment. Over time, a reduction in environmental contamination coupled with continued use of circovirus vaccine to build immunity in growing pigs prior to viral exposure would aid derivation of PCV2-free herds.
The MSU and KSU herds and management served as models for commercial multisite swine production systems. Based on the Phase 1 baseline testing, PCV2 was detected in both swine populations, although viremia was not increased until after the nursery period. This testing provided evidence for primarily horizontal rather than vertical transmission. Both herds had PCV2-viremic pigs during finishing and showed evidence that pigs likely seroconverted after the documented time for onset of viremia (Figures 1, 2, 3, and 4).
Although both farms had evident viral circulation during finishing, the MSU pigs expe-rienced an earlier onset of viremia than the KSU pigs. Both herds were considered good models in which to monitor the effects of circovirus vaccination long-term because baseline results from both non-vaccinated populations indicated viral presence and seroconversion-supporting antibody profiles.
Circovirus vaccination programs were started in each herd in the spring of 2007, and monitoring of barrows from each farrowing group began. In the MSU herd, viremia was not detected in serum collected at any sampling point from circovirus-vaccinated barrows (Table 1). During the same time, there were no reports of clinical PCVD from the farm, but some pigs may have become transiently viremic between sampling points; however, the MSU farm baseline testing indicated onset of viremia early in the finishing phase and infection appeared to be detectable in a portion of the population through-out finishing. Thus, the MSU vaccinated pig PCR data demonstrate that vaccination had an effect on the viral circulation within this farm by either shortening the duration of viremia or preventing it altogether.
In the KSU herd, 3 groups had at least 1 pig with detectable PCV2 DNA in the serum. These groups (3, 5, and 6; Table 2) were not consecutive groups, nor were the ages at the time of detectable viremia consistent among groups. In addition, only 1 group had pigs testing positive for PCV2 at more than 1 sampling point. Although the viral load
20
Herd Health
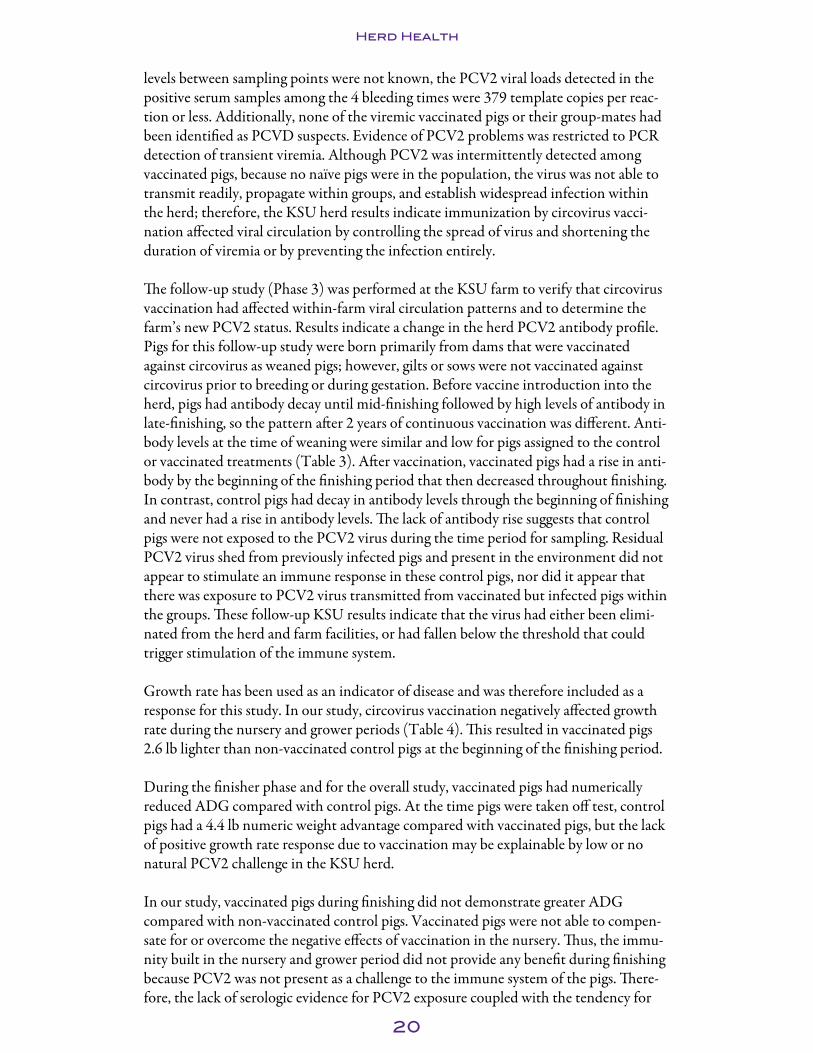
levels between sampling points were not known, the PCV2 viral loads detected in the positive serum samples among the 4 bleeding times were 379 template copies per reac-tion or less. Additionally, none of the viremic vaccinated pigs or their group-mates had been identified as PCVD suspects. Evidence of PCV2 problems was restricted to PCR detection of transient viremia. Although PCV2 was intermittently detected among vaccinated pigs, because no naïve pigs were in the population, the virus was not able to transmit readily, propagate within groups, and establish widespread infection within the herd; therefore, the KSU herd results indicate immunization by circovirus vacci-nation affected viral circulation by controlling the spread of virus and shortening the duration of viremia or by preventing the infection entirely.
The follow-up study (Phase 3) was performed at the KSU farm to verify that circovirus vaccination had affected within-farm viral circulation patterns and to determine the farm’s new PCV2 status. Results indicate a change in the herd PCV2 antibody profile. Pigs for this follow-up study were born primarily from dams that were vaccinated against circovirus as weaned pigs; however, gilts or sows were not vaccinated against circovirus prior to breeding or during gestation. Before vaccine introduction into the herd, pigs had antibody decay until mid-finishing followed by high levels of antibody in late-finishing, so the pattern after 2 years of continuous vaccination was different. Anti-body levels at the time of weaning were similar and low for pigs assigned to the control or vaccinated treatments (Table 3). After vaccination, vaccinated pigs had a rise in anti-body by the beginning of the finishing period that then decreased throughout finishing. In contrast, control pigs had decay in antibody levels through the beginning of finishing and never had a rise in antibody levels. The lack of antibody rise suggests that control pigs were not exposed to the PCV2 virus during the time period for sampling. Residual PCV2 virus shed from previously infected pigs and present in the environment did not appear to stimulate an immune response in these control pigs, nor did it appear that there was exposure to PCV2 virus transmitted from vaccinated but infected pigs within the groups. These follow-up KSU results indicate that the virus had either been elimi-nated from the herd and farm facilities, or had fallen below the threshold that could trigger stimulation of the immune system.
Growth rate has been used as an indicator of disease and was therefore included as a response for this study. In our study, circovirus vaccination negatively affected growth rate during the nursery and grower periods (Table 4). This resulted in vaccinated pigs 2.6 lb lighter than non-vaccinated control pigs at the beginning of the finishing period.
During the finisher phase and for the overall study, vaccinated pigs had numerically reduced ADG compared with control pigs. At the time pigs were taken off test, control pigs had a 4.4 lb numeric weight advantage compared with vaccinated pigs, but the lack of positive growth rate response due to vaccination may be explainable by low or no natural PCV2 challenge in the KSU herd.
In our study, vaccinated pigs during finishing did not demonstrate greater ADG compared with non-vaccinated control pigs. Vaccinated pigs were not able to compen-sate for or overcome the negative effects of vaccination in the nursery. Thus, the immu-nity built in the nursery and grower period did not provide any benefit during finishing because PCV2 was not present as a challenge to the immune system of the pigs. There-fore, the lack of serologic evidence for PCV2 exposure coupled with the tendency for

21
Herd Health
vaccinated pigs to have poorer overall growth performance than control pigs suggests that PCV2 was not a pathogenic threat for growing pigs in the KSU herd during the follow-up testing.
The results that indicated PCV2 was no longer an apparent natural challenge for pigs in the KSU farm could not be replicated in a commercial farm in Kansas despite both farms having implemented long-term circovirus vaccination programs. At the time the data were collected, the commercial farm had been continuously vaccinating pigs for 1 year—slightly less time than the KSU farm. Clinical disease had decreased during the time the vaccine was being used in the commercial herd. The commercial farm moved pigs all-in, all-out from their nursery and finisher rooms and used a disinfectant similar to that of the KSU farm; however, the period of downtime between batches of pigs for cleaning and disinfection of rooms was longer at the KSU farm compared with the commercial farm.
In the commercial farm, the non-vaccinated pigs did become viremic after movement into the nursery (Table 5) and exhibited clinical signs of PCVD. The clinical disease in these pigs was apparent even though they constituted a relatively low percentage of the population, and herd immunity did not appear to prevent propagation of the infec-tion; therefore, the belief that housing environment contributed a significant source of PCV2 virus in this population led us to perform the environmental evaluation. We acknowledge that pig-to-pig transmission from viremic pigs could also play a role in the dynamics of the infection, but we believe this was less likely. At each time point, more serum pools had detectable DNA, which indicated that more pigs were becoming infected. In addition, PCV2a was detected first, followed by PCV2b, so the infection profile also changed over time. Whether this differential pattern has biologic signifi-cance is yet to be determined.
To understand why non-vaccinated pig results differed between the KSU herd and the commercial farm, it was important to identify sources of viral exposure. Pigs at both farms were seemingly weaned free of PCV2, implicating PCV2 in the environment as a primary source of exposure. Swabs were collected in all nursery and finishing rooms at the commercial farm. Nursery and finishing rooms at the KSU farm that had housed study pigs at some point through the 3-year study were also sampled. Although PCR detection of PCV2 nucleic acid does not provide any information about whether the viral material is infectious, it does allow measurement of environmental viral loads that could potentially contain infectious material.
In the commercial facility, PCV2 DNA was found in every room and barn. In contrast, at the KSU farm, PCV2 nucleic acid was not detected in either the nursery or finishing facility. Although the infectivity status of the PCV2 DNA detected at the commercial site was not known, any residual infectious material present in the environment could explain why non-vaccinated pigs placed in this facility became viremic shortly after movement into the facility. Complete inactivation of PCV2 was difficult by disinfec-tion under laboratory conditions.14 Therefore, in our study, with viral material detected in the environment, some infectious virus likely remained. Further investigation of this
14 Royer, R. L., P. Nawagitgul, P. G. Halbur, and P. S. Paul. 2001. Susceptibility of porcine circovirus type 2 to commercial and laboratory disinfectants. J. Swine Health Prod. 9:281-284.

22
Herd Health
environmental virus-based route of transmission is warranted to determine the impor-tance of this potential risk.
In conclusion, results from this 3-year investigation indicate that circovirus vaccination did affect viral circulation in swine herds. Success in lowering levels or eliminating the virus as a pathogenic threat was achieved at a university research herd, but other expo-sure risk factors, such as residual PCV2 in the environment, appeared under commer-cial conditions and inhibited viral elimination efforts. Therefore, circovirus vaccine provides a tool to affect viral circulation on farms but needs to be used in conjunction with other management practices to eliminate PCV2 from most swine populations.
23
Herd Health
Table 1. Detection of porcine circovirus type 2 (PCV2) nucleic acid in serum samples serially collected from barrows across 9 consecutive weaning groups enrolled in a post-circovirus-vaccination implementation monitoring program at the Michigan State University Swine Teaching and Research Center1
Sampling2
Item Pigs, no.3d 0
(wean wk)Entry-to-finishing
Mid-finishing
End-of-finishing
Group 1 10Interval, wk4 --- 6.1 14.0 17.1PCV2 DNA detected5 no no no no
Group 2 9Interval, wk4 --- 7.1 15.1 18.0PCV2 DNA detected5 no no no no
Group 3 9Interval, wk4 --- 5.9 12.0 18.0PCV2 DNA detected5 no no no no
Group 4 9Interval, wk4 --- 7.0 13.0 18.1PCV2 DNA detected5 no no no no
Group 5 11Interval, wk4 --- 5.9 12.9 16.9PCV2 DNA detected no no no no
Group 6 10Interval, wk4 --- 6.0 11.1 18.0PCV2 DNA detected5 no no no no
Group 7 10Interval, wk4 --- 8.1 15.0 20.0PCV2 DNA detected5 no no no no
Group 8 9Interval, wk4 --- 6.3 13.1 18.0PCV2 DNA detected5 no no no no
Group 9 9Interval, wk4 --- 6.0 13.0 18.0PCV2 DNA detected5 no no no no
1 A total of 86 barrows (4 samples per barrow) were serially bled and serum was analyzed by PCR for detectable PCV2 DNA. All pigs were vaccinated intramuscularly with 2 doses (2 mL per dose) of Circumvent PCV (Inter-vet/Schering-Plough Animal Health, Millsboro, DE) after the d 0 blood sample was collected (during the week of weaning).2 Sampling points were during weaning week (d 0; single pre-vaccination serum sample), after entry to the finisher, during mid-finishing, and at the end of the finishing period. 3 An average of 12 barrows were randomly selected across 9 consecutive farrowing groups, ear-tagged, and moni-tored for their lifetime. Only serum samples from barrows with complete serum sets (4 serum samples per pig) were tested by PCR for detectable PCV2 nucleic acid. Number of pigs reported in the table represents the number of pigs with complete serum sets.4 Interval indicates the amount of time in weeks that had elapsed since the previous sampling point. The d 0 sample was collected during weaning week.5 All serum samples were individually tested by PCR for presence of PCV2 nucleic acid. Results are reported as “yes” if a sample had detectable PCV2 nucleic acid for the indicated group and sampling point, and “no” if no samples had detectable PCV2 nucleic acid.

24
Herd Health
Table 2. Detection of porcine circovirus type 2 (PCV2) nucleic acid in serum samples serially collected from barrows across 10 consecutive weaning groups enrolled in a post-circovirus-vaccination implementation monitoring program at the Kansas State Univer-sity Swine Teaching and Research Center1
Sampling2
Item Pigs, no.3d 0
(wean wk)Entry-to-finishing
Mid-finishing
End-of-finishing
Group 1 11Interval, wk4 --- 8.7 15.0 21.9PCV2 DNA detected5 no no no no
Group 2 10Interval, wk4 --- 9.9 14.9 20.0PCV2 DNA detected5 no no no no
Group 3 10Interval, wk4 --- 9.3 14.4 19.1PCV2 DNA detected5,6 no no yes no
Group 4 8Interval, wk4 --- 10.1 14.9 20.0PCV2 DNA detected5 no no no no
Group 5 12Interval, wk4 --- 9.9 15.0 19.9PCV2 DNA detected5,6 yes yes yes yes
Group 6 12Interval, wk4 --- 10.3 15.3 19.8PCV2 DNA detected5,6 no yes no no
Group 7 12Interval, wk4 --- 10.2 14.0 19.5PCV2 DNA detected5 no no no no
Group 8 12Interval, wk4 --- 9.7 14.7 17.1PCV2 DNA detected5 no no no no
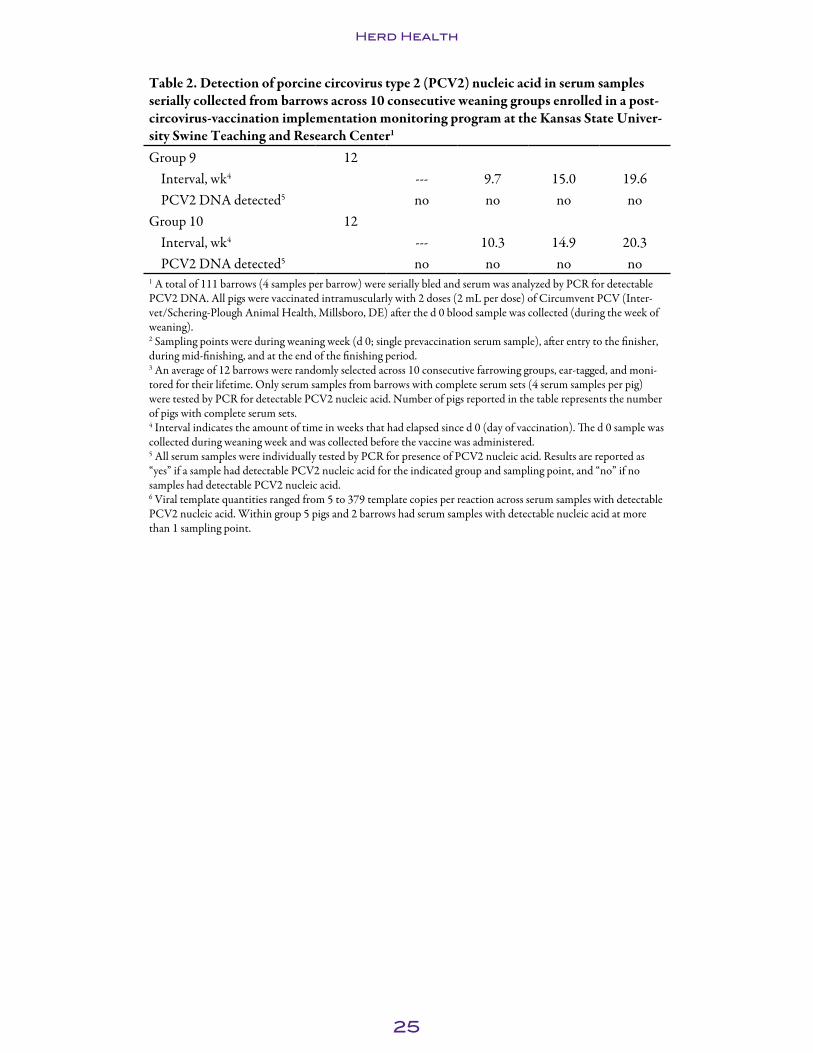
25
Herd Health
Table 2. Detection of porcine circovirus type 2 (PCV2) nucleic acid in serum samples serially collected from barrows across 10 consecutive weaning groups enrolled in a post-circovirus-vaccination implementation monitoring program at the Kansas State Univer-sity Swine Teaching and Research Center1
Group 9 12Interval, wk4 --- 9.7 15.0 19.6PCV2 DNA detected5 no no no no
Group 10 12Interval, wk4 --- 10.3 14.9 20.3PCV2 DNA detected5 no no no no
1 A total of 111 barrows (4 samples per barrow) were serially bled and serum was analyzed by PCR for detectable PCV2 DNA. All pigs were vaccinated intramuscularly with 2 doses (2 mL per dose) of Circumvent PCV (Inter-vet/Schering-Plough Animal Health, Millsboro, DE) after the d 0 blood sample was collected (during the week of weaning).2 Sampling points were during weaning week (d 0; single prevaccination serum sample), after entry to the finisher, during mid-finishing, and at the end of the finishing period. 3 An average of 12 barrows were randomly selected across 10 consecutive farrowing groups, ear-tagged, and moni-tored for their lifetime. Only serum samples from barrows with complete serum sets (4 serum samples per pig) were tested by PCR for detectable PCV2 nucleic acid. Number of pigs reported in the table represents the number of pigs with complete serum sets.4 Interval indicates the amount of time in weeks that had elapsed since d 0 (day of vaccination). The d 0 sample was collected during weaning week and was collected before the vaccine was administered.5 All serum samples were individually tested by PCR for presence of PCV2 nucleic acid. Results are reported as “yes” if a sample had detectable PCV2 nucleic acid for the indicated group and sampling point, and “no” if no samples had detectable PCV2 nucleic acid.6 Viral template quantities ranged from 5 to 379 template copies per reaction across serum samples with detectable PCV2 nucleic acid. Within group 5 pigs and 2 barrows had serum samples with detectable nucleic acid at more than 1 sampling point.

26
He
rd
He
al
th
Table 3. Effect of circovirus vaccination and time on indirect fluorescent antibody (IFA) geometric mean titer (GMT) in pigs produced at a farm that had been vaccinating growing pigs against porcine circovirus type 2 (PCV2) continuously for 2 years1
Treatment2
Control Vaccinate Probability, P <
Item Time:d 0
(wean wk)Entry-to-finishing
Mid- finishing
End-of-finishing
d 0 (wean wk)
Entry-to-finishing
Mid- finishing
End-of-finishing
Treatment × time
Samples, no. 68 68 68 68 68 66 66 66 ---GMT3 35.9a 15.2b 14.8b 13.6b 43.6a 52789.3c 13841.2d 3729.8e <0.001a,b,c,d,e Means without a common superscript letter differ (P < 0.05). 1 A total of 136 barrows (68 control and 68 vaccinated pigs) across 3 farrowing groups were ear-tagged and monitored from weaning through finishing at the Kansas State University Swine Teaching and Research Center. Pigs were serially bled on d 0 (within a wk of weaning), after entering the finisher (time elapsed since d 0 range: 8.4 to 8.9 wk), mid-finishing (time elapsed since d 0 range: 13.4 to 13.9 wk), and at the end of the finishing period (time elapsed since d 0 range: 18.0 to 19.4 wk). Antibody levels against PCV2 were determined by IFA testing on individual serum samples. Individual pig IFA titer data were log3 transformed and were analyzed by repeated measures analysis using the GLIMMIX procedure in SAS version 9.1.3 (SAS Institute, Inc., Cary, NC). Fixed effects in the model included treat-ment, time, and their interaction. Group and IFA day were included as random effects. 2 Treatments were non-vaccinated control or vaccinated. Vaccinated pigs were injected intramuscularly with 2 doses (2 mL per dose) of Circumvent PCV (Intervet/Schering-Plough Animal Health, Mills-boro, DE) after the d 0 blood sample was collected (during the week of weaning).3 Geometric mean titers were calculated by taking the mean of the log3 transformed IFA titer values then converting the resulting transformed mean back to the original scale for presentation.

27
Herd Health
Table 4. Effect of circovirus vaccination on growth rate of pigs produced at a farm that had been vaccinating growing pigs against porcine circovirus type 2 (PCV2) continu-ously for 2 years1
Treatment2
Item Control Vaccinate SEM Probability, P <Pigs started on test, no. 186 186 --- ---ADG, lb
Nursery-grower3 1.24 1.18 0.013 0.005Finisher4 2.41 2.39 0.029 0.30Overall5 1.88 1.85 0.023 0.07
Weight, lbd 0 13.9 14.0 0.44 0.97Entry-to-finishing 89.0 86.4 1.99 0.03End-of-finishing (off test) 262.8 258.4 5.33 0.16
1 A total of 372 weanling pigs (186 control and 186 vaccinated pigs) across 3 farrowing groups were ear-tagged and monitored from weaning through finishing at the Kansas State University Swine Teaching and Research Center. Pigs were individually weighed on d 0 (within the weaning week and the day of vaccination), after entering the finisher, and at the end of the finishing period to calculate ADG. Growth and on-test time data from mortali-ties and removed pigs were included in growth and period length calculations. Individual pig growth data were analyzed using the GLIMMIX procedure in SAS version 9.1.3 (SAS Institute, Inc., Cary, NC). The interaction with gender and treatment was determined to be non-significant for group 3, and growth data were pooled across the genders for subsequent analysis. Growth data for all 3 groups were analyzed using a model that included treat-ment as a fixed effect and group as a random effect.2 Treatments were non-vaccinated control or vaccinated. Vaccinated pigs were injected intramuscularly with 2 doses (2 mL per dose) of Circumvent PCV (Intervet/Schering-Plough Animal Health, Millsboro, DE).3 Nursery-grower ADG and period length include data from mortalities and removed pigs. The nursery period length did not differ (P = 0.15) between control (59.7 ± 1.48 d) and vaccinated (59.1 ± 1.48 d) pigs.4 Finisher ADG and length include data from mortalities and removed pigs. The number of days for the finisher period did not differ (P = 0.94) between control (71.7 ± 1.13 d) and vaccinated (71.6 ± 1.14 d) pigs.5 Overall ADG and length include data from mortalities and removed pigs. The number of days for the overall trial did not differ (P = 0.96) between control (132.1 ± 2.67 d) and vaccinated (132.1 ± 2.67 d) pigs.

28
Herd Health
Table 5. Detection of porcine circovirus type 2 (PCV2) nucleic acid in serum samples serially collected from pigs not vaccinated for PCV2 in a monitoring program at a commercial farm1
Age, wk2
Item1.7 to 3.1
(wean wk) 4.9 to 6.3 7.9 to 9.310.9 to
12.3Pig survival, % 100.0 97.6 91.8 91.8Interval, wk3 --- 3.2 6.2 9.2PCV2 PCR results
Pools for PCR, no.4 17 17 16 16PCV2 DNA detected5,6 no yes yes yesPools with detectable PCV2 DNA, % 0 5.9 37.5 75.0
1 A total of 85 pigs were serially bled and serum was analyzed by PCR for detectable PCV2 DNA. Pigs were not vaccinated for PCV2 at any time during this monitoring period on this commercial farm.2 Pigs were bled initially during the wk of weaning when pig ages ranged from 1.7 to 3.1 wk of age. Pigs were serially bled every 3 wk (on average) thereafter until pigs were 10.9 to 12.3 wk of age. 3 Interval indicates the amount of time in weeks that had elapsed since the initial sampling point. The initial sample was collected during weaning week.4 A total of 5 serum samples were included in a single pool for testing by PCV2 PCR.5 All serum samples were individually tested by PCR for presence of PCV2 nucleic acid. Results are reported as “yes” if a sample had detectable PCV2 nucleic acid for the indicated group and sampling point, and “no” if no samples had detectable PCV2 nucleic acid.6 For serum pools with PCV2 DNA detected, cycle time (Ct) values ranged from 27.7 to 40.7.

29
Herd Health
GM
T
3,000
2,500
2,000
1,500
1,000
500
0
26 to 3021 to 2516 to 2011 to 156 to 10
Age, weeks
1,678.7
2,751
1,568.3
102.7180.5
Figure 1. Characterization of the porcine circovirus type 2 (PCV2) antibody profile of the Michigan State University (MSU) Swine Teaching and Research Center herd prior to implementation of a circovirus vaccination program. At the MSU farm, a total of 101 pigs were sampled across 5 growing pig populations (6 to 10, 11 to 15, 16 to 20, 21 to 25, and 26 to 30 wk of age) using a cross-sectional design. Serum samples from individual pigs were tested by the Kansas State University Veterinary Diagnostic Laboratory PCV2 indirect fluorescent antibody (IFA) assay for detection of PCV2 antibodies. All IFA titers were log2 transformed to approximate a normal distribution prior to descriptive analysis. Resulting transformed means were transformed back to the original scale for presenta-tion as geometric mean titers (GMT).

30
Herd Health
Incr
easi
ng
vir
us
load
26 to 3021 to 2516 to 2011 to 156 to 10
Age, weeks
Figure 2. Characterization of the porcine circovirus type 2 (PCV2) infection profile of the Michigan State University (MSU) Swine Teaching and Research Center herd prior to implementation of a circovirus vaccination program. Serum was pooled (MSU: 21 pools) within age group and analyzed using the Kansas State University Veterinary Diagnostic Laboratory PCV2 PCR assay for detection of PCV2 nucleic acid. Pooled results were log10 transformed and transformed results were averaged within age ranges to characterize patterns for viral load.
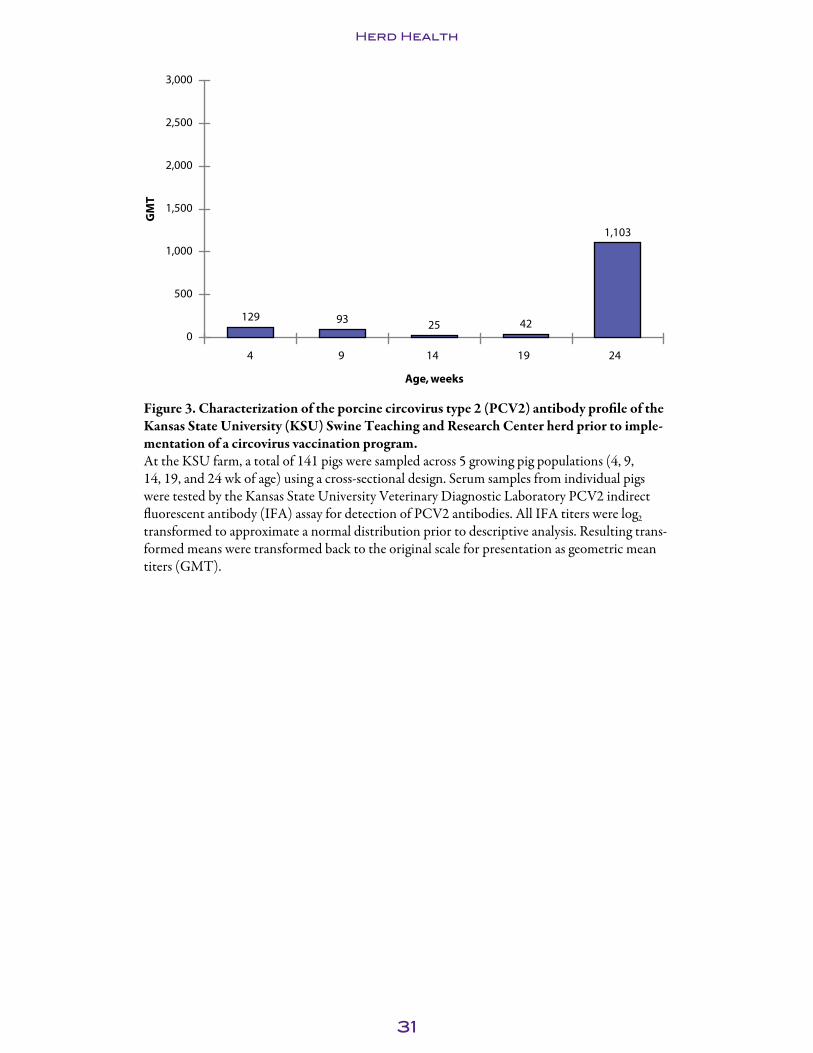
31
Herd Health
GM
T
3,000
2,500
2,000
1,500
1,000
500
0
24191494
Age, weeks
1,103
422593129
Figure 3. Characterization of the porcine circovirus type 2 (PCV2) antibody profile of the Kansas State University (KSU) Swine Teaching and Research Center herd prior to imple-mentation of a circovirus vaccination program.At the KSU farm, a total of 141 pigs were sampled across 5 growing pig populations (4, 9, 14, 19, and 24 wk of age) using a cross-sectional design. Serum samples from individual pigs were tested by the Kansas State University Veterinary Diagnostic Laboratory PCV2 indirect fluorescent antibody (IFA) assay for detection of PCV2 antibodies. All IFA titers were log2 transformed to approximate a normal distribution prior to descriptive analysis. Resulting trans-formed means were transformed back to the original scale for presentation as geometric mean titers (GMT).

32
Herd Health
Incr
easi
ng
vir
us
load
26 to 3021 to 2516 to 2011 to 156 to 10
Age, weeks
Figure 4. Characterization of the porcine circovirus type 2 (PCV2) infection profile of the Kansas State University (KSU) Swine Teaching and Research Center herd prior to imple-mentation of a circovirus vaccination program.Serum was pooled (KSU: 27 pools) within age group and analyzed using the Kansas State University Diagnostic Laboratory PCV2 PCR assay for detection of PCV2 nucleic acid. Pooled results were log10 transformed and transformed results were averaged within age ranges to char-acterize patterns for viral load.

33
Herd Health
23.4 25.729.9
26.3 28.2 29.4 30.6 28.7
PCR
cycl
e ti
me
(Ct)
Farm:�nisher location
40
30
20
10
0
B
B:Rm8
31.5 29.9 31.7 30.3 30.6 30.726.8
30.9
B:Rm7B:Rm6B:Rm5B:Rm4B:Rm3B:Rm2B:Rm1A:KSU
No PCV2detected
0.0
PCR
cycl
e ti
me
(Ct)
Farm:�nisher location
40
30
20
10
0
A
B:Rm8B:Rm7B:Rm6B:Rm5B:Rm4B:Rm3B:Rm2B:Rm1A:KSU
No PCV2detected
0.0
Figure 5. Detection of porcine circovirus type 2 (PCV2) nucleic acid in the environment of nursery and finisher facilities at the Kansas State University (KSU) Swine Teaching and Research Center and a commercial farm. Effect of farm and nursery location on environ-mental PCV2 DNA detection (A) and effect of farm and finisher location on environmen-tal PCV2 DNA detection (B) are shown below.Porcine circovirus type 2 (PCV2) PCR results for environmental swabs of Farm A (KSU farm) and Farm B (commercial farm) nursery and finisher locations. Cycle time (Ct) values are reported as 0.0 (no PCV2 DNA detected) or greater than 0.0 (PCV2 DNA detected) with the lower positive Ct values indicative of more PCV2 viral DNA.

34
Nursery Nutrition and Management
The Effects of Orally Supplemented Vitamin D3 on Serum 25(OH)D3 Concentrations and Growth of Pre-Weaning and Nursery Pigs
J. R. Flohr, M. D. Tokach, S.S. Dritz1, S. C. Henry2, M. L. Potter2, L.M. Tokach2, J. P. Goff3, R. L. Horst4, J. C. Nietfeld1, D. M. Madson5, S. M. Ensley5, R. D. Goodband, J. L. Nelssen, J. R. Bergstrom, and J. M. DeRouchey
SummaryA total of 270 pigs from 29 litters (PIC 327 × 1050, initially 2 d of age) were used in a 52-d study to determine the effects of oral vitamin D3 supplementation on growth performance, serum 25(OH)D3 concentrations, and bone mineralization of pre- and postweaning pigs. Vitamin D plays an essential role in maintaining proper Ca and P homeostasis within the body of mammals. Because most swine production occurs in environmentally controlled facilities, direct sunlight is no longer a source of vitamin D for the neonatal pig, which could impact bone growth and muscle function.
Experimental treatments consisted of 3 oral dosage treatments: (1) control (1 mL peanut oil), (2) 40,000 IU vitamin D3 delivered in 1 mL peanut oil, or (3) 80,000 IU vitamin D3 delivered in 1 mL peanut oil. Pigs were initially weighed over 2 differ-ent days (d 0 or 2), allowing pigs to be placed on test 1 or 2 d after birth. Within a litter, pigs were assigned to similar-weight matched sets of 3 and were allotted to 1 of the 3 oral dosage treatments. Blood samples were collected from pigs of 29 matched sets (87 pigs total) prior to dosing, then the same matched set pigs were bled periodi-cally throughout the trial to measure 25(OH)D3 serum concentrations. All pigs were weighed again on d 10 and 20. On d 20, pigs were weaned and allotted to the nursery portion of the trial and all pigs were fed common diets from d 20 to 52 of age. Pigs were also randomly selected for necropsy on d 19 and d 35. Eighteen pigs were necropsied on d 19 (6 matched sets for a total of 6 pigs per treatment) and 12 pigs were necropsied on d 35 (6 control pigs and 6 pigs previously dosed with 80,000 IU vitamin D3). Bone and tissue samples were collected. All bone samples were analyzed for ash content and histopathology.
Increasing oral vitamin D3 increased serum 25(OH)D3 concentrations on d 10 and 20 (quadratic, P < 0.01), and on d 30 (linear, P < 0.01). During lactation, no differences were observed in ADG across treatments, but at weaning, pigs previously dosed with vitamin D3 were 0.3 lb heavier than control pigs. Throughout the nursery study (d 20 to 52), no significant differences were observed in ADG, ADFI, or F/G; however, on d 52, pigs previously dosed with vitamin D3 were 0.5 lb heavier than control pigs. Vita-min D3 supplementation had no effect on bone ash concentration of either the femur
1 Diagnostic Medicine and Pathobiology, College of Veterinary Medicine, Kansas State University.2 Abilene Animal Hospital, PA, Abilene, KS.3 Biomedical Sciences, College of Veterinary Medicine, Iowa State University.4 Heartland Assays Inc., Ames, IA.5 Veterinary Diagnostic and Production Animal Medicine, Iowa State University.
35
Nursery Nutrition and Management
or 2nd rib. Pathologic lesions were not identified by microscopic evaluation of bone, regardless of vitamin D3 treatment. Oral vitamin D3 did not influence growth perfor-mance or bone measurements in this study, but more research may be needed to test the response under field conditions with more health challenges.
Key words: nursery pig, vitamin D, 25(OH)D3
IntroductionVitamin D is a group of fat-soluble secosteriods. The two major physiologically relevant forms of vitamin D are vitamin D2 (ergocalciferol) and vitamin D3 (cholecalciferol). Although humans utilize both sources, pigs discriminate in their metabolism and more readily utilize cholecalciferol. Cholecalciferol is produced in the photochemi-cal conversion of 7-dehydrocholesterol within the skin of animals when exposed to sunlight or a synthetic UVb light source. One IU of vitamin D is defined as .025 μg of cholecalciferol. Both vitamin D2 and vitamin D3 are hydroxylated in the liver to the 25-hydroxy forms (25(OH)D2 and 25(OH)D3). This metabolite of vitamin D is the main circulating form in the blood and acts as a clinically useful marker for vitamin D status. 25(OH)D3 is then hydroxylated again in the renal tubules within the kidney to 1,25(OH)2D3 by the 25(OH)D 1α-hydroxylase enzyme or to 24,25(OH)2D3 by the 24α-hydroxylase enzyme. The 1,25(OH)2D3 form is the most potent metabolite that is used in the regulation of Ca and P absorption across the intestinal wall. The vita-min D receptor (VDR) transcription factor acts as the major mediator between the metabolite 1,25(OH)2D3 and its target cell. Research shows that both the 1,25 and the 24,25 metabolites are important for proper bone formation. Additionally, the presence of VDRs has been reported within macrophages and activated T and B lymphocytes, insinuating a relationship between vitamin D and immune function. Also, the hydrox-ylated D3 metabolites are viewed as hormones because they act according to established criteria for hormones, which includes acting on mucosal cells of the small intestine to cause the formation of calcium-binding proteins. These proteins facilitate Ca and Mg absorption and influence P absorption. Together with a parathyroid hormone and calcitonin, they maintain a Ca and P homeostasis in the body.
Relatively little information is available on the normal concentration of cholecalciferol or its metabolite 25(OH)D3 in weanling pigs. Results of recent analyses from serum samples collected by Abilene Animal Hospital (Abilene, KS) and Iowa State University and assayed at Heartland Assays Inc. (Ames, IA) indicate that pigs have lower than expected concentrations of vitamin D at weaning. These concentrations are considered inadequate for bone mineralization and overall health in young pigs. Bone microfrac-tures have been documented in cohorts of these pigs sampled for serum analysis. These microfractures could represent a subclinical form of rickets. We hypothesized that microfractures could result in slowed growth of piglets during the farrowing and nurs-ery phase; furthermore, low-serum vitamin D concentrations may also affect muscle function and the immune system. A prior pilot study has verified that oral dosing of vitamin D3 to pigs shortly after birth can increase serum 25(OH)D3 at weaning, but growth performance was not measured. Therefore, this trial was conducted to deter-mine the effects of oral vitamin D3 dosage on growth performance, serum 25(OH)D3,
and bone ash of pre- and postweaning pigs.

36
Nursery Nutrition and Management
ProceduresThe protocol in this experiment was approved by the Kansas State University Institu-tional Animal Care and Use Committee. The study was performed at the K-State Swine Teaching and Research Center in Manhattan, KS.
A total of 270 pigs (PIC 327 × 1050; initially 2 d of age) from 29 litters were used in a 52-d study to determine the effects of oral vitamin D3 dosage on subsequent pre- and postweaning pig performance, serum 25(OH)D3, and bone ash concentrations. Pigs were allotted to treatments in a randomized complete block design with litter and matched set within litter functioning as the blocks. Sow gestation and lactation diets were corn-soybean meal-based with 40% DDGS in gestation and 20% DDGS in lacta-tion and contained 625 IU vitamin D3 per lb (Table 1).
Shortly after farrowing, pigs were allotted to 1 of 3 oral vitamin D3 treatments: (1) a control treatment with 1 mL of a peanut oil- and ethanol-based liquid carrier without vitamin D3, (2) 1 mL with 40,000 IU vitamin D3 in a peanut oil- and ethanol-based liquid carrier, or (3) 1 mL with 80,000 IU vitamin D3 in a peanut oil- and ethanol-based liquid carrier. Pigs were allotted to treatments on 2 different days (d 0 or 2 of the trial) during the week of farrowing. This allowed pigs to be placed on test at either 1 or 2 d after farrowing. To perform the allotment, pigs were weighed on their own respective allotment days and 3 pigs closest in weight within a litter were considered a matched set. The numbers of matched sets per litter were variable depending on the number of pigs born and weight variation; however, gender was balanced across treat-ments. Within each litter, 1 matched set closest to the average litter weight was then bled by jugular venipuncture to determine initial 25(OH)D3 levels. Each pig was ear-tagged for identification, and pigs within each matched set were randomly allotted and dosed with 1 of the 3 oral treatments. No cross-fostering was performed on treatment pigs. Necropsies were performed on the majority of pigs that died during the lactation period. Neither creep feed nor other supplements were provided except the respective vitamin D3 dosage. Management of all pigs, including processing methods, was similar throughout the trial and consistent with standard farm procedures.
After the initial 2 allotment days, all pigs were individually weighed on single days, which were 10, 18, and 20 d after the first pigs were placed on test (d 0). On d 10, pigs were weighed, and the same matched set of pigs bled previously within each litter were bled again for 25(OH)D3 concentrations via jugular venipuncture. On d 18, pigs were again weighed, and based on this weight a total of 6 matched sets were selected for a necropsy on d 19. On d 20, remaining pigs were weighed and weaned into a nursery facility. After pigs were placed in their respective nursery pens, blood was again collected from those pigs previously sampled for serum 25(OH)D3 concentrations.
For the nursery phase (d 20 to 52), pigs were penned by treatment. Sets of pens were blocked to minimize the effect of location. Pigs were assigned to a set of pens, maintain-ing the integrity of the initial matched sets within a pen set. There were 6 or 7 pigs per pen and a total of 12 pens for the control treatment and the 40,000 IU treatment and 11 pens for the 80,000 IU treatment. All pigs that were allotted on d 0 and alive at d 20 were evaluated in the nursery phase. Pens contained a 4-hole, dry self-feeder and nipple waterer to allow for ad libitum access to feed and water. All pigs were fed a common
37
Nursery Nutrition and Management
3-phase dietary program. Phase 1 diets (SEW and transition diets) were fed from d 20 to 25 and were fed in pelleted form. Phase 2 and 3 diets were fed from d 25 to 39 and d 39 to 52, respectively, and were fed in meal form (Table 2).
During the nursery phase, pig weights were recorded on d 20, 25, 32, 39, 46, and 52. Feed disappearance was recorded during the nursery stage and used with pig weights to determine ADG, ADFI, and F/G. Pigs selected for serum 25(OH)D3 concentrations were bled again on d 30 and 52. On d 35, 12 pigs were selected (6 from the control treatment and 6 from the 80,000 IU vitamin D3 treatment) for necropsy.
Necropsies were conducted at the K-State College of Veterinary Medicine. All necrop-sies performed were in compliance with the college’s standard operating procedures. On d 19, pigs were bled via jugular venipuncture and were euthanized with an intrave-nous overdose of sodium pentobarbital (Fatal Plus, Deerborn, MI). Both femurs and the 2nd and 3rd ribs on both sides were removed to determine bone ash content. The 4th ribs and tibias were removed for histopathology examination. On d 35, 12 more pigs were selected for necropsy with 6 chosen from both the control and 80,000 IU vitamin D3 treatment groups. Tissue collection procedures were similar to those performed on d 19.
Blood samples were collected on prior to dosing and on d 10, 20, 30, and 52 (along with the blood samples from the necropsy pigs on d 19 and 35). All samples were collected in serum separator tubes and were refrigerated for at least 6 h after collection. Blood was centrifuged at 2,800 rpm for 25 min. Serum was extracted and stored in 2-mL vials and frozen in a freezer at -20ºC. All 25(OH)D3 testing was performed by Heartland Assays Inc.
Statistical analysis conducted for each portion of the study was performed using the PROC MIXED procedure of SAS (SAS Institute Inc., Cary, NC). For the preweaning period, the growth data were analyzed as a randomized complete block design. Individ-ual pig was the experimental unit and litter and matched sets within litter were included as blocking factors in the statistical model. Only pigs that completed the full lactation period (d 0 to 20) were used in this analysis. Nursery growth performance data were analyzed as a randomized complete block using pen as the experimental unit and pen set as a blocking factor. Bone ash results were analyzed using the PROC MIXED proce-dure of SAS with individual pig as the experimental unit. Serum 25(OH)D3 results were analyzed using the repeated measures function of SAS to determine the effect of treatment on serum concentrations over time and the treatment × time interactions. Linear and quadratic effects were also evaluated for increasing vitamin D3 dosage.
Results and DiscussionIn the lactation phase (d 0 to 20), no significant differences were observed (P > 0.14) for ADG (Table 3), but d 20 BW was numerically increased by 0.3 lb/pig for pigs previously given oral vitamin D3. During the nursery phase (d 20 to 52), previous oral vitamin D3 dosage did not affect (P > 0.29) ADG, ADFI, or F/G (Table 4); however, similar to the lactation phase, pigs previously dosed with either 40,000 or 80,000 IU vitamin D3 were numerically heavier (0.5 lb/pig) at the end of the nursery phase.

38
Nursery Nutrition and Management
Prior to vitamin D3 supplementation, initial serum 25(OH)D3 concentrations were similar (P = 0.99) among all pigs (Table 5). A vitamin D3 dose × day interaction (P < 0.01) was observed for serum 25(OH)D3. The interaction was the result of serum 25(OH)D3 increasing (quadratic, P < 0.01) over time with the greatest values observed on d 10 for pigs dosed with vitamin D3 (Figure 1). Pigs orally dosed with vitamin D3 had greater serum 25(OH)D3 on d 10 (quadratic, P < 0.01), 20 (quadratic, P < 0.01), and 30 (linear, P < 0.01) with concentrations similar to control values on d 52 (P > 0.36).
Bone ash from femurs of pigs euthanized on d 19 (Table 6) showed no effect (P > 0.46) of vitamin D3 dosage, but 2nd rib ash content tended (linear P < 0.09) to decrease as oral vitamin D3 dosage increased. No differences were found in bone mineralization of femurs or the 2nd rib collected on d 35 (P > 0.47).
Histopathologic analysis revealed all ribs from both collection days were similar in progression of chondrocytes through the normal maturation zones. The zones had a normal even, abrupt transition to primary spongiosa, which undergoes remodeling to form the secondary spongiosa and trabecular bone. The growth plates were uniform in width across their length except one rib that was collected from a pig dosed with 40,000 IU vitamin D3. For this pig, the physis was uneven and there were irregular, somewhat rectangular plugs of hypertrophied zone cartilage extending into the metaphysis. On the metaphyseal surface, and lateral to the plugs, there was normal formation of primary spongiosa that was remodeled to secondary spongiosa. The tibial physis of this pig also was uneven with a few V-shaped plugs of cartilage extending toward the metaphysis. One potential explanation for this phenomenon is trauma that may have occurred during lactation. This pig also showed swelling in its right hip and, upon visual evalu-ation during necropsy, abnormal mineralization of its right femur (not ashed). The presentation of this pig is consistent with injury by the sow during lactation. All tibias collected for histopathologic analysis were categorized as having normal maturation zones and growth plates as well as typical primary spongiosa formation.
In summary, pigs in this study initially started with similar concentrations of 25(OH)D3 prior to dosing. On d 10, 20, and 30, serum concentrations were dependent on the dosage of supplemental vitamin D3; however, by d 52, serum concentrations had returned to values similar to that of control pigs. This might suggest that the standard addition of 625 IU vitamin D3/lb of vitamin premix supports circulating 25(OH)D3 concentrations of approximately 15 ng/mL in the nursery pig.
Oral vitamin D3 dosage had no significant effect on growth performance throughout the duration of the study. Yet pigs dosed with either 40,000 IU or 80,000 IU vitamin D3 weighed numerically more than that of their control contemporaries at weaning (d 20) and again at the end of the study (d 52). Also, no differences were observed for percentage bone ash or histopathologic analysis of bone samples collected on d 19 or 35. But it should be pointed out that percentage ash values, regardless of treatment, were much lower than the expected range of values (approximately 56%)6 for mineral content as a percentage of dry fat-free bone. Perhaps this is because of the young age of the pigs on trial and the fact that most reference sources on the topic have been sampled
6 Lewis and Southern. 2002. Swine Nutrition. 2nd ed. CRC Press, Boca Raton, FL.

39
Nursery Nutrition and Management
from older pigs. Even so, oral vitamin D3 at d 2 postfarrowing failed to increase percent-age of ash in the nursery pig.
Although no growth performance differences were observed in this study, more research should be conducted with varying genotypes and herd health statuses to determine other possible links related to vitamin D responses. More work also should be completed in the area of Ca, P, and vitamin D interactions to determine optimal concentrations of these nutrients in feed for optimal mineralization of bone tissue, muscle function, and performance of growing swine.

40
Nursery Nutrition and Management
Table 1. Composition of sow diets (as-fed basis)Item Gestation Lactation
Corn 51.98 51.96Soybean meal (46.5% CP) 4.14 24.24Dried distillers grains with solubles 40.00 20.00Limestone 1.75 1.45Monocalcium P (21% P) 0.70 1.00Salt 0.50 0.50Trace mineral premix 0.15 0.15Sow add pack 0.25 0.25Vitamin premix 0.25 0.25L-Lysine HCl 0.18 0.10Phytase1 0.10 0.10
Total 100 100
Calculate analysisME, kcal/lb 1,494 1,490CP, % 17.4 21.2Total lysine, % 0.71 1.10
Standardized ileal digestible amino acids, %Lysine 0.55 0.94Isoleucine:lysine 93 79Leucine:lysine 303 191Methionine:lysine 52 34Met & Cys:lysine 106 69Threonine:lysine 89 71Tryptophan:lysine 20 21Valine:lysine 120 92
Ca, % 0.84 0.84P, % 0.61 0.66Available P, %2 0.50 0.49Ca:P 1.38 1.26
continued

41
Nursery Nutrition and Management
Table 1. Composition of sow diets (as-fed basis)Item Gestation LactationAdded vitamins
VitaminA, IU/ton 10,000,000 10,000,000Vitamin D, IU/ton3 1,250,000 1,250,000Vitamin E, IU/ton 60,000 60,000Vitamin K (menadione), mg/ton 4,000 4,000Vitamin B12, mg/ton 35 35Niacin, mg/ton 45,000 45,000Pantothenic acid, mg/ton 25,000 25,000Riboflavin, mg/ton 7,500 7,500Biotin, mg/ton 200 200Folic acid, mg/ton 1,500 1,500Pyridoxine, mg/ton 4,500 4,500Choline, mg/ton 500,000 500,000Carnitine, mg/ton 45,000 45,000
1 Natuphos 600, BASF, Florham Park, NJ. Provided 272 phytase units per pound of diet.2 Phytase provided 0.11% available P to both gestation and lactation diets.3 Provided 625 IU vitamin D per pound of diet.

42
Nursery Nutrition and Management
Table 2. Composition of nursery diets (as-fed basis)Phase 11
Item SEW Transition Phase 2 Phase 3Ingredient, %
Corn 36.10 38.23 57.06 65.80Soybean meal (46.5% CP) 12.44 19.98 25.90 30.67Spray-dried whey 25.00 25.00 10.00 ---Spray-dried animal plasma 6.70 2.50 --- ---Select menhaden fish meal 6.00 5.00 4.50 ---Spray-dried blood cells 1.65 1.25 --- ---Lactose 5.00 --- --- ---Choice white grease 5.00 5.00 --- ---Monocalcium P (21% P) --- 0.70 0.38 1.02Limestone 0.45 0.45 0.58 0.98Salt 0.25 0.30 0.30 0.35Zinc oxide 0.375 0.375 0.25 ---Vitamin premix with phytase 0.25 0.25 --- ---Trace mineral premix 0.15 0.15 0.15 0.15Vitamin premix --- --- 0.25 0.25L-Lysine HCl 0.15 0.26 0.25 0.36DL-Methionine 0.15 0.18 0.125 0.13L-Threonine 0.08 0.125 0.105 0.13Phytase2 --- --- 0.165 0.165Acidifier3 0.2 0.2 --- ---Vitamin E, 20,000 IU 0.05 0.05 --- ---
Total 100 100 100 100
Calculated analysisME, kcal/lb 1,611 1,590 1,505 1,504CP, % 22.7 22.3 21.3 20.4Total lysine, % 1.70 1.65 1.43 1.38
Standardized ileal digestible amino acids, %Lysine 1.56 1.51 1.30 1.25Isoleucine:lysine 49 52 61 60Methionine:lysine 30 33 35 33Met & Cys:lysine 55 56 59 58Threonine:lysine 64 63 63 62Tryptophan:lysine 17 17 17 17
Ca, % 0.79 0.83 0.70 0.68P, % 0.73 0.77 0.63 0.61Available P, % 0.68 0.68 0.47 0.42Ca:P 1.08 1.08 1.12 1.12
continued

43
Nursery Nutrition and Management
Table 2. Composition of nursery diets (as-fed basis)Phase 11
Item SEW Transition Phase 2 Phase 3
Vitamins (added levels)Vit A, IU/ton 10,000,000 10,000,000 10,000,000 10,000,000Vit D, IU/ton4 1,250,000 1,250,000 1,250,000 1,250,000Vit E, IU/ton 40,000 40,000 40,000 40,000Vit K (menadione), mg/ton 4,000 4,000 4,000 4,000Vit B12, mg/ton 35 35 35 35Niacin, mg/ton 45,000 45,000 45,000 45,000Pantothenic acid, mg/ton 25,000 25,000 25,000 25,000Riboflavin, mg/ton 7,500 7,500 7,500 75,00
1 During Phase 1 (d 20 to 25) in the nursery, SEW and transition diets were allotted at 1 and 3 lb/pig, respectively (4 lb total per pig).2 Natuphos 600, BASF, Florham Park, NJ. Provided 449 phytase units per pound of diet in Phase 2 and 3 rations.3 Ken Gest, Kemin Industries Inc., Des Moines, IA.4 Provided 625 IU vitamin D per pound of diet.
Table 3. Effects of oral vitamin D3 dose on preweaning growth performance growth1,2
Vitamin D3 P-valuesControl 40,000 IU 80,000 IU SEM Quadratic Linear
Number of pigsInitial3 90 90 90d 10 87 88 85d 18 86 86 83d 204 79 78 77
BWInitial 3.77 3.75 3.77 0.08 0.41 0.92d 10 8.01 8.10 8.04 0.23 0.66 0.89d 18 12.17 12.37 12.47 0.36 0.86 0.41d 20 13.00 13.28 13.30 0.39 0.69 0.44
ADGd 0 to 10 0.45 0.46 0.45 0.02 0.60 0.90d 10 to 18 0.52 0.53 0.55 0.02 0.86 0.14d 18 to 20 0.41 0.45 0.42 0.03 0.17 0.90d 2 to 20 0.48 0.49 0.49 0.02 0.69 0.42
1 A total of 270 pigs from 29 litters (PIC 327 × 1050) were used in a 20-d preweaning study to determine the effects of oral vitamin D3 dose at 2 d of age on growth performance.2 Data were analyzed using performance records from pigs that survived through weaning, d 20.3 Initial refers to pigs placed on test on both d 0 and d 2 of the trial. Pigs were placed on test at 1 or 2 d postfarrow-ing. Pig days were adjusted to account for differences in trial starting day for calculating ADG from d 0 to 10.4 Six pigs per treatment (6 matched sets) were removed on d 19 for necropsy.

44
Nursery Nutrition and Management
Table 4. Effects of oral vitamin D3 dose on nursery pig growth1
Vitamin D3 P-valuesItem Control 40,000 IU 80,000 IU SEM Linear Quadraticd 20 to 25
ADG, lb 0.52 0.53 0.52 0.03 0.99 0.86ADFI, lb 0.51 0.53 0.52 0.02 0.89 0.48F/G 1.01 1.01 1.00 0.04 0.91 0.89
d 25 to 39ADG, lb 0.66 0.66 0.69 0.02 0.35 0.65ADFI, lb 0.97 0.98 0.99 0.03 0.56 0.93F/G 1.47 1.48 1.44 0.04 0.64 0.59
d 39 to 52ADG, lb 1.06 1.10 1.07 0.02 0.83 0.29ADFI, lb 1.68 1.74 1.70 0.04 0.65 0.33F/G 1.58 1.59 1.60 0.03 0.72 0.95
d 20 to 52ADG, lb 0.79 0.82 0.81 0.02 0.47 0.50ADFI, lb 1.17 1.21 1.19 0.03 0.52 0.30F/G 1.47 1.49 1.47 0.02 0.93 0.60
BW, lbd 20 13.0 13.4 13.3 0.28 0.46 0.60d 25 15.9 16.0 16.0 0.36 0.96 0.87d 39 25.4 25.4 25.8 0.58 0.63 0.83d 52 39.2 39.7 39.7 0.75 0.65 0.79
1 A total of 235 weaned pigs (PIC 327 × 1050) initially 21 d of age were used in a 32-d nursery study to determine the effects of oral vitamin D3 dose at 2 d of age on nursery pig growth and performance.
Table 5. Effects of oral vitamin D3 dose on serum 25(OH)D3 levels, ng/ml1,2
Vitamin D3 P-valuesDay of collection Control 40,000 IU 80,000 IU SEM Linear QuadraticInitial3 3.6 3.5 3.6 1.1 0.99 0.9910 14.7 57.3 68.5 1.2 <0.01 <0.0120 8.0 28.1 35.8 1.2 <0.01 <0.0130 10.4 17.8 22.5 1.2 <0.01 0.3652 13.9 15.0 15.4 1.2 0.36 0.821 A total of 87 pigs or 29 pigs per treatment (1 matched set per litter) were bled prior to dosing (initial: includes pigs placed on test on both d 0 and 2) and 10 later in lactation and d 20, 30, and 52 in the nursery to determine serum 25(OH)D3 concentrations.2 Vitamin D3 treatment × day effect (P < 0.01).3 Initial refers to pigs placed on test on both d 0 and d 2 of the trial. Pigs were placed on test at 1 or 2 d postfarrow-ing. Pig days were adjusted to account for differences in trial starting day for calculating ADG from d 0 to 10.
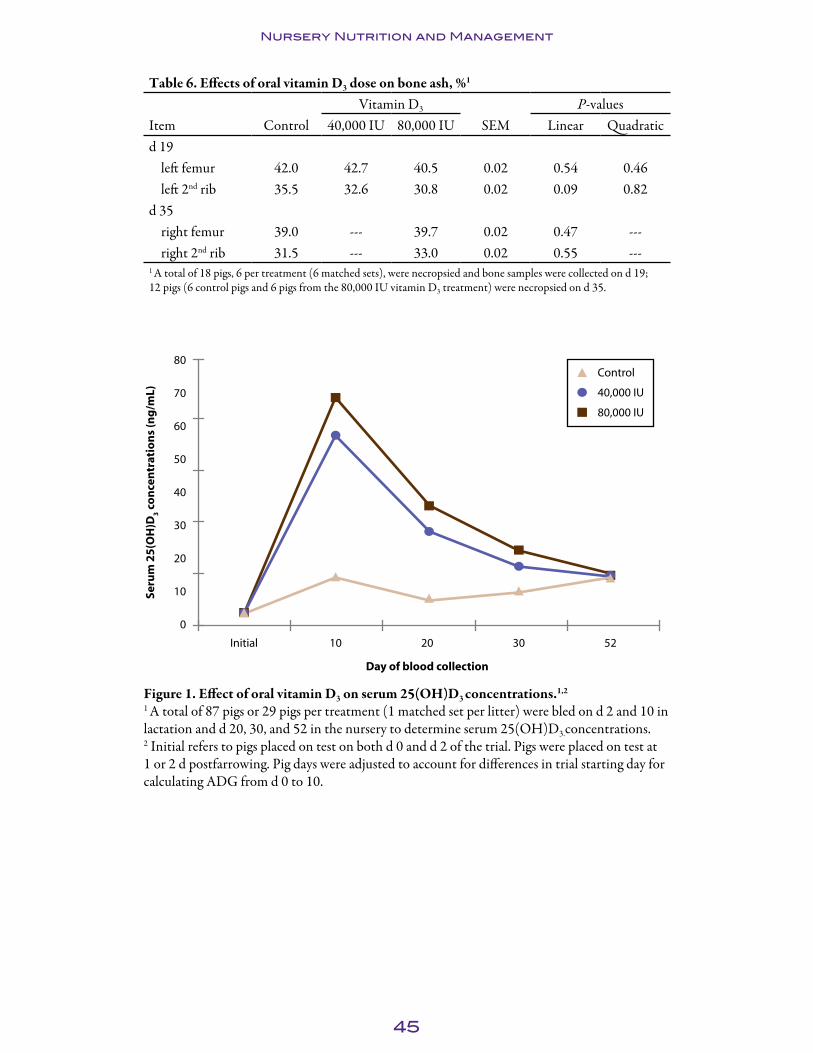
45
Nursery Nutrition and Management
Table 6. Effects of oral vitamin D3 dose on bone ash, %1
Vitamin D3 P-valuesItem Control 40,000 IU 80,000 IU SEM Linear Quadraticd 19
left femur 42.0 42.7 40.5 0.02 0.54 0.46left 2nd rib 35.5 32.6 30.8 0.02 0.09 0.82
d 35right femur 39.0 --- 39.7 0.02 0.47 ---right 2nd rib 31.5 --- 33.0 0.02 0.55 ---
1 A total of 18 pigs, 6 per treatment (6 matched sets), were necropsied and bone samples were collected on d 19; 12 pigs (6 control pigs and 6 pigs from the 80,000 IU vitamin D3 treatment) were necropsied on d 35.
Seru
m 2
5(O
H)D
3 c
on
cen
trat
ion
s (n
g/m
L)
80
70
60
50
40
30
20
10
0
52302010Initial
Day of blood collection
Control
40,000 IU
80,000 IU
Figure 1. Effect of oral vitamin D3 on serum 25(OH)D3 concentrations.1,2
1 A total of 87 pigs or 29 pigs per treatment (1 matched set per litter) were bled on d 2 and 10 in lactation and d 20, 30, and 52 in the nursery to determine serum 25(OH)D3.concentrations.2 Initial refers to pigs placed on test on both d 0 and d 2 of the trial. Pigs were placed on test at 1 or 2 d postfarrowing. Pig days were adjusted to account for differences in trial starting day for calculating ADG from d 0 to 10.

46
Nursery Nutrition and Management
The Effects of High-Sulfate Water and Zeolite (Clinoptilolite) on Nursery Pig Performance1
J.R. Flohr, M.D. Tokach, J.L. Nelssen, S.S. Dritz2, J.M. DeRouchey, R.D. Goodband, and N.W. Shelton
SummaryA total of 320 nursery pigs (PIC 1050 barrows) were used in a 24-d study to determine the effects of high-sulfate water and dietary natural zeolite on growth performance and fecal consistency of nursery pigs. Eight treatments were arranged as a 2 × 4 facto-rial with 2 water treatments (control or water with 3,000 ppm sodium sulfate), and 4 dietary zeolite concentrations (0, 0.25, 0.5, and 1.0%). Water treatments remained the same from d 0 to 24 and all diets were fed in 2 phases, with diets containing zeolite having the same inclusion rate in both phases. Phase 1 diets were fed in a pellet form from d 0 to 10 after weaning, with Phase 2 diets fed in meal form from d 10 to 24. Fecal samples were collected on d 5, 9, 16, and 23. These samples were visually assessed and scored on a scale of 1 to 5 to determine consistency of the fecal samples then analyzed for DM.
From d 0 to 10, neither sulfate addition to the water nor zeolite influenced ADG, ADFI, or F/G. Dietary treatment had no effect on fecal consistency; however, pigs drinking control water had a lower (P < 0.01) fecal score (fewer visual observations of scours) than pigs drinking high-sodium sulfate water. From d 10 to 24, pigs drink-ing control water had improved (P < 0.01) ADG, ADFI and F/G compared with pigs drinking high-sodium sulfate water. Dietary zeolite increased (linear, P < 0.01) ADG and ADFI, but did not affect fecal scores. Similar to Phase 1, pigs drinking control water had lower (P < 0.01) fecal scores, indicating less scouring compared with pigs drinking the high-sodium sulfate water. Dry matter analysis indicated that dietary zeolite had no effect on fecal DM, but high-sodium sulfate water decreased (P < 0.01) total DM content of fecal samples in both Phase 1 and the first collection in Phase 2, but not on d 23, the final collection.
Overall (d 0 to 24), increasing zeolite increased (linear, P < 0.05) ADG and ADFI, but F/G was not affected. Pigs drinking high-sulfate water had decreased (P < 0.01) ADG and ADFI and poorer (P < 0.01) F/G compared with pigs drinking control water. In conclusion, pigs drinking water with 3,000 ppm sodium sulfate had decreased ADG, ADFI, and poorer F/G from d 10 to 24 and for the overall trial. These pigs also had an increased incidence of scouring as measured by lower fecal DM compared with pigs drinking control water. Although zeolite improved ADG and ADFI, it did not influ-ence fecal consistency.
Key words: nursery pig, sulfate, water, zeolite
1 The authors would like to thank St. Cloud Mining Co., Truth or Consequences, NM, for providing the zeolite used in this study.2 Food Animal Health and Management Center, College of Veterinary Medicine, Kansas State University.

47
Nursery Nutrition and Management
IntroductionZeolites are microporous aluminosilicate minerals composed of alkali and alkaline earth cations along with small amounts of other elements. The zeolite molecules are arranged in 3-dimensional structures that create interconnected channels capable of trapping molecules of proper dimensions similar to a sieve. Zeolite molecules can also bind and release specific molecules by adsorption or ion exchange. In industrial opera-tions, zeolites have been used as detergents because of their ability to bind with water and other molecules. In agriculture, zeolites frequently have been used to reduce odor because of their ability to bind with ammonia. Although research is limited, previous results (Shurson et al., 19843) observed in a study comparing synthetic zeolite and natu-ral zeolite as growth promoters in late nursery phases that the synthetic zeolite (zeolite A) was relatively ineffective as a growth promoter in nursery pig diets. Synthetic zeolite was thought to become disassociated in the acidic environment of the digestive system; however, naturally occurring zeolite (clinoptilolite) was effective in its ammonia-bind-ing capabilities and more stable in the gut, yet when it exceeded 5% of the diet, overall growth performance decreased compared with the control treatment. Perhaps by using its sieving capabilities, natural zeolite can bind with non-nutritive components of the diet and decrease their ability to cross the gut wall, but when inclusion rates become too high, it may bind with required nutrients and decrease pig performance.
Producers, especially those in the upper Midwest, have recently observed increased inci-dence of scours. Scours typically are associated with health and disease challenge along with the stress that accompanies weaning. Water quality and high-protein diets can also contribute to diarrhea and loose feces. In addition, increased incidence of scour-ing could be due to high sodium sulfate concentrations within groundwater supplies. Research by Anderson and Stothers (1978)4 has shown that sulfates act as a natural laxative and can cause an increased occurrence of scours, but without significant detri-mental effects on growth performance. Whether sulfates influence performance or not, they lead to increased cost in commercial swine production because producers treat the pigs with antibiotics in an attempt to decrease scour symptoms.
Therefore, our objectives for the study were to evaluate the effects of high-sulfate water on the performance and fecal consistency of newly weaned pigs and to determine whether a natural zeolite (clinoptilolite) could improve fecal consistency and growth of pigs drinking high-sulfate water.
ProceduresThe protocol for this experiment was approved by the Kansas State University Institu-tional Animal Care and Use Committee. The study was conducted at the K-State Segre-gated Early Weaning Facility in Manhattan, KS.
A total of 320 nursery pigs (PIC 1050 barrows, initially 11.9 lb, and 21 d of age) were used in a 24-d trial to evaluate the effects of high-sulfate water and dietary zeolite (clino-ptilolite) on growth performance. Pigs were weighed and allotted to 1 of 8 treatments
3 G. C. Shurson, P. K. Ku, E. R. Miller and M. T. Yokoyama. 1984. Effects of Zeolite a or Clinoptilolite in Diets of Growing Swine. J. Anim. Sci. 59:1536-1545. 4 D. M. Anderson and S. C. Stothers. Effects of saline water in sulfates, chlorides and nitrates on the performance of young weanling pigs. J. Anim. Sci. 47:900-907.

48
Nursery Nutrition and Management
arranged in a 2 × 4 factorial with main effects of water source (control or water contain-ing 3,000 ppm sodium sulfate) and dietary zeolite (0, 0.25, 0.5, and 1.0%). There were 5 pigs per pen and 8 pens per treatment. Pigs were provided unlimited access to feed and water by way of a 4-hole dry self-feeder and a cup waterer in each pen (5 ft by 5 ft). For the sodium sulfate water treatment, sodium sulfate was mixed in a stock solution and administered in the water supply (Manhattan, KS, municipal water source) of the corresponding pens by a medicator (Dosatron; Dosatron International Inc., Clear-water, FL) at the rate of 1:10 for a calculated inclusion rate of 3,000 ppm of sodium sulfate. All diets were fed in 2 phases (Table 1), and the dietary zeolite concentration was the same in both phases. Phase 1 diets were fed in a pellet form from d 0 to 10 after weaning. Phase 2 diets were fed in a meal form from d 10 to 24. Average daily gain, ADFI, and F/G were determined by weighing pigs and measuring feed disappearance on d 5, 10, 17, and 24.
Chemical composition of the natural zeolite (clinoptilolite) used in the experiment is shown in Table 2. Water samples were collected for both the control water supply with no sodium sulfate and the water treatment with 3,000 ppm sodium sulfate. Samples were analyzed by Servi-Tech Laboratories, Dodge City, KS, and were analyzed for sodium, sulfate, and total dissolved solids (Table 3).
Fecal samples were collected on d 5, 9, 16, and 23. The samples were collected from 3 randomly selected pigs per pen for a total of 24 samples per treatment. Immediately after collection, the samples were individually scored by 5 individuals trained to deter-mine fecal consistency; therefore, 15 consistency scores were made for each pen and an average score was reported for the pen. The scale used for assessing fecal consistency was based on a numerical scale of 1 to 5, where 1 represented a hard, dry fecal pellet, 2 represented a firm formed feces, 3 represented soft moist feces that retained its shape, 4 represented soft unformed feces that assumes the shape of its container, and 5 repre-sented a watery liquid that can be poured. After scoring, samples were analyzed for DM. A 2-stage DM procedure was used. The first stage consisted of drying the complete sample in a 122ºF oven for 24 h. Afterward, the samples were allowed to cool, then were ground into a powder. In the second stage, 1 g of the ground sample was placed in a crucible and dried in a 212ºF oven for 24 h. The initial DM value was then multiplied by the second to determine a total percentage DM.
Nursery pig growth performance was analyzed as a 2 × 4 factorial with main effects of water treatment and dietary zeolite using the MIXED procedure of SAS (SAS Institute, Inc., Cary, NC). Pen was designated as the experimental unit and contrast statements were used to determine effects of water treatment, linear and quadratic effects of dietary zeolite, and their interactions.
For fecal scores and fecal DM, repeated measures analysis was conducted using the MIXED procedure of SAS. Pen was the experimental unit and again the fixed effects were water treatment and dietary zeolite. Contrast statements were used to evaluate: (1) linear and quadratic effects of increasing zeolite, (2) linear and quadratic effects over time (collection days), (3) water × day interactions, (4) diet × day interactions, and (5) water × diet × day interactions.
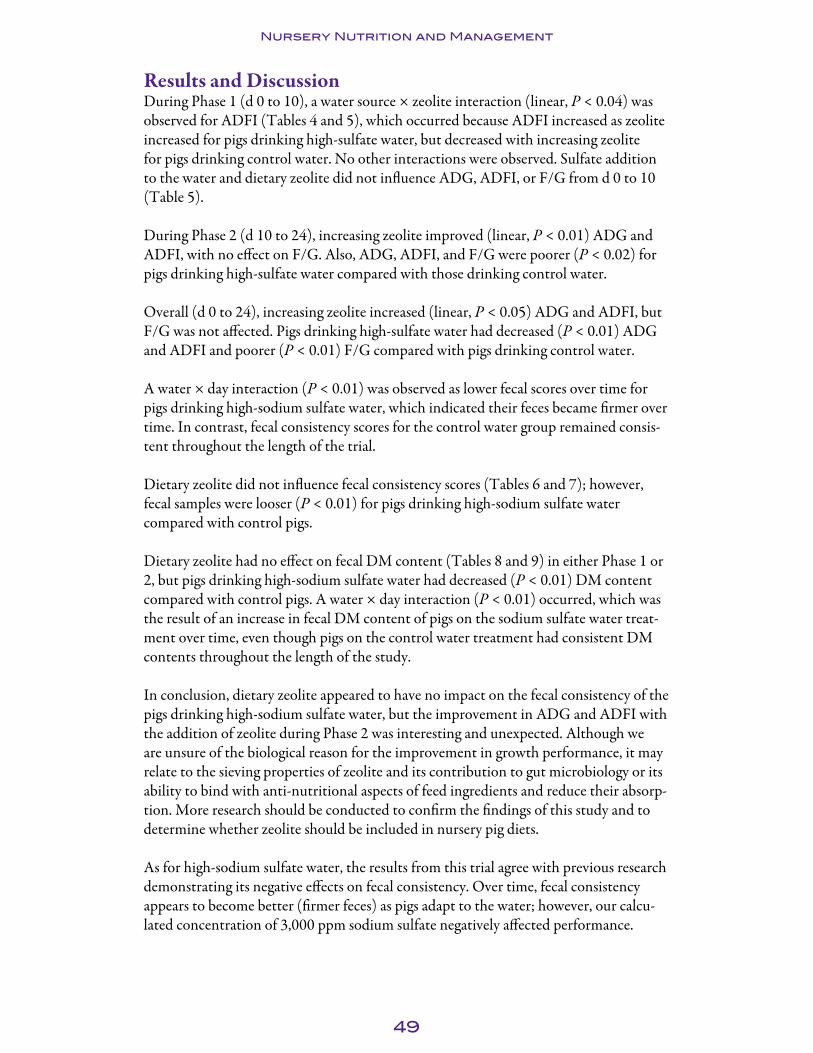
49
Nursery Nutrition and Management
Results and DiscussionDuring Phase 1 (d 0 to 10), a water source × zeolite interaction (linear, P < 0.04) was observed for ADFI (Tables 4 and 5), which occurred because ADFI increased as zeolite increased for pigs drinking high-sulfate water, but decreased with increasing zeolite for pigs drinking control water. No other interactions were observed. Sulfate addition to the water and dietary zeolite did not influence ADG, ADFI, or F/G from d 0 to 10 (Table 5).
During Phase 2 (d 10 to 24), increasing zeolite improved (linear, P < 0.01) ADG and ADFI, with no effect on F/G. Also, ADG, ADFI, and F/G were poorer (P < 0.02) for pigs drinking high-sulfate water compared with those drinking control water.
Overall (d 0 to 24), increasing zeolite increased (linear, P < 0.05) ADG and ADFI, but F/G was not affected. Pigs drinking high-sulfate water had decreased (P < 0.01) ADG and ADFI and poorer (P < 0.01) F/G compared with pigs drinking control water.
A water × day interaction (P < 0.01) was observed as lower fecal scores over time for pigs drinking high-sodium sulfate water, which indicated their feces became firmer over time. In contrast, fecal consistency scores for the control water group remained consis-tent throughout the length of the trial.
Dietary zeolite did not influence fecal consistency scores (Tables 6 and 7); however, fecal samples were looser (P < 0.01) for pigs drinking high-sodium sulfate water compared with control pigs.
Dietary zeolite had no effect on fecal DM content (Tables 8 and 9) in either Phase 1 or 2, but pigs drinking high-sodium sulfate water had decreased (P < 0.01) DM content compared with control pigs. A water × day interaction (P < 0.01) occurred, which was the result of an increase in fecal DM content of pigs on the sodium sulfate water treat-ment over time, even though pigs on the control water treatment had consistent DM contents throughout the length of the study.
In conclusion, dietary zeolite appeared to have no impact on the fecal consistency of the pigs drinking high-sodium sulfate water, but the improvement in ADG and ADFI with the addition of zeolite during Phase 2 was interesting and unexpected. Although we are unsure of the biological reason for the improvement in growth performance, it may relate to the sieving properties of zeolite and its contribution to gut microbiology or its ability to bind with anti-nutritional aspects of feed ingredients and reduce their absorp-tion. More research should be conducted to confirm the findings of this study and to determine whether zeolite should be included in nursery pig diets.
As for high-sodium sulfate water, the results from this trial agree with previous research demonstrating its negative effects on fecal consistency. Over time, fecal consistency appears to become better (firmer feces) as pigs adapt to the water; however, our calcu-lated concentration of 3,000 ppm sodium sulfate negatively affected performance.

50
Nursery Nutrition and Management
Table 1: Diet composition (as-fed basis)Item Phase 11 Phase 22
Ingredient, %Corn 38.16 57.06Soybean meal (46.5% CP) 16.99 25.90Dried distillers grains with solubles 5.00 ---Spray-dried animal plasma 4.00 ---Select menhaden fish meal --- 4.50Spray-dried blood cells 1.25 ---Spray-dried whey 25.00 10.00DPS 503 3.00 ---Monocalcium P (21% P) 0.85 0.38Limestone 0.85 0.58Salt 0.30 0.30Zinc oxide 0.39 0.25Trace mineral premix 0.15 0.15Vitamin premix 0.25 0.25L-Lysine HCl 0.20 0.25DL-Methionine 0.13 0.13L-Threonine 0.08 0.11Phytase4 0.13 0.17Acidifier5 0.20 ---Vitamin E, 20,000 IU 0.05 ---Choline chloride 60% 0.04 ---Zeolite (clinoptilolite)6 --- 0.00
Total 100 100continued

51
Nursery Nutrition and Management
Table 1: Diet composition (as-fed basis)Item Phase 11 Phase 22
Calculated analysisStandardized ileal digestible amino acids, %
Lysine 1.35 1.30Isoleucine:lysine 54 61Leucine:lysine 132 127Methionine:lysine 30 35Met & Cys:lysine 57 59Threonine:lysine 65 63Tryptophan:lysine 18 17Valine:lysine 72 68
Total lysine, % 1.51 1.43CP, % 21.6 21.32ME, kcal/lb 1,552 1,505Ca, % 0.75 0.70P, % 0.73 0.63Available P, % 0.65 0.47Na, % 0.75 0.25K, % 1.07 0.97
Added trace minerals, ppm7
Zn 2,973 1,965Fe 165 165Mn 40 40Cu 17 17I 0.30 0.30Se 0.30 0.30
1 Phase 1 diets were fed from d 0 to 10.2 Phase 2 diets were fed from d 10 to 24.3 Nutra-Flo Company, Sioux City, IA. 4 Phyzyme 600, Danisco Animal Nutrition, Carol Stream, IL. Provided 354 and 463 FTU/lb of diet, respectively.5 Kem-gest, Kemin Industries Inc., Des Moines, IA.6 Zeolite, St. Cloud Mining Company, Truth or Consequences, NM, replaced corn to provide 0, 0.25, 0.50, and 1% zeolite.7 Zeolite calculated trace mineral content was added to the calculated trace mineral levels within each respective dietary regimen.
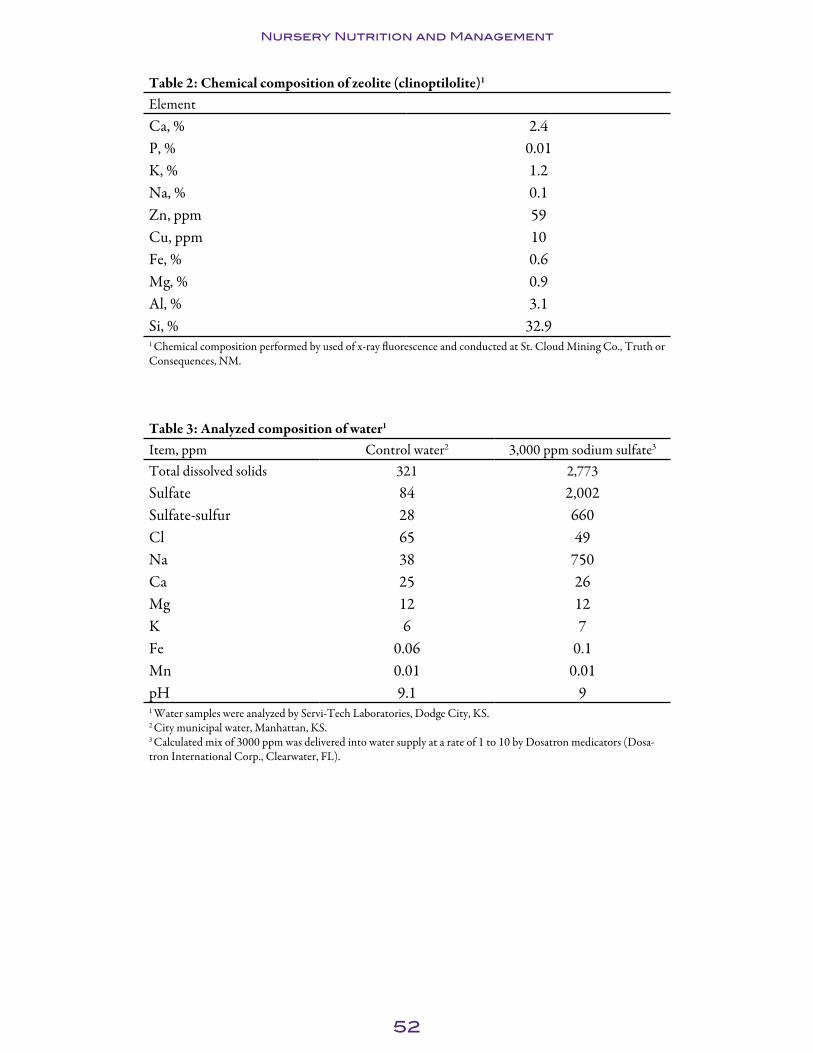
52
Nursery Nutrition and Management
Table 2: Chemical composition of zeolite (clinoptilolite)1
ElementCa, % 2.4P, % 0.01K, % 1.2Na, % 0.1Zn, ppm 59 Cu, ppm 10 Fe, % 0.6Mg, % 0.9Al, % 3.1Si, % 32.91 Chemical composition performed by used of x-ray fluorescence and conducted at St. Cloud Mining Co., Truth or Consequences, NM.
Table 3: Analyzed composition of water1
Item, ppm Control water2 3,000 ppm sodium sulfate3
Total dissolved solids 321 2,773Sulfate 84 2,002Sulfate-sulfur 28 660Cl 65 49Na 38 750Ca 25 26Mg 12 12K 6 7Fe 0.06 0.1Mn 0.01 0.01pH 9.1 91 Water samples were analyzed by Servi-Tech Laboratories, Dodge City, KS.2 City municipal water, Manhattan, KS. 3 Calculated mix of 3000 ppm was delivered into water supply at a rate of 1 to 10 by Dosatron medicators (Dosa-tron International Corp., Clearwater, FL).

53
Nu
rs
er
y N
ut
rit
ion
an
d M
an
ag
em
en
t
Table 4: Effects of high-sulfate water and dietary zeolite (clinoptilolite) on nursery pig performance1
Water treatment P-valuesControl 3,000 ppm sodium sulfate Sulfate × zeolite
Zeolite, %: 0 0.25 0.50 1.0 0 0.25 0.50 1.0 SEMSulfate × zeolite
interaction Linear Quadraticd 0 to 10
ADG, lb 0.37 0.36 0.33 0.32 0.28 0.37 0.33 0.32 0.028 0.25 0.17 0.21ADFI, lb 0.37 0.36 0.33 0.33 0.31 0.36 0.34 0.36 0.019 0.14 0.04 0.34F/G 1.00 1.00 1.04 1.12 1.32 0.98 1.02 1.12 0.110 0.32 0.24 0.18
d 10 to 24ADG, lb 0.78 0.82 0.86 0.90 0.68 0.71 0.78 0.77 0.044 0.92 0.68 0.65ADFI, lb 1.10 1.15 1.17 1.20 0.98 1.02 1.12 1.12 0.049 0.75 0.49 0.66F/G 1.42 1.42 1.37 1.33 1.44 1.46 1.45 1.46 0.038 0.51 0.14 0.94
d 0 to 24ADG, lb 0.61 0.63 0.62 0.64 0.51 0.57 0.59 0.58 0.028 0.58 0.43 0.25ADFI, lb 0.79 0.82 0.80 0.82 0.69 0.75 0.79 0.80 0.032 0.23 0.08 0.37F/G 1.30 1.31 1.29 1.27 1.37 1.32 1.35 1.38 0.026 0.25 0.18 0.30
1 A total of 320 weanling pigs (PIC 1050 barrows, initial BW of 11.9 lb and 21 d of age) were used with 5 pigs per pen and 8 pens per treatment.

54
Nu
rs
er
y N
ut
rit
ion
an
d M
an
ag
em
en
t
Table 5: Main effects of high-sulfate water and dietary zeolite (clinoptilolite) on nursery pig performance1
Water treatment Zeolite, % Zeolite P-values
Item Control3,000 ppm
sodium sulfate SEM 0 0.25 0.50 1.0 SEM Sulfate Linear Quadraticd 0 to 10
ADG, lb 0.34 0.33 0.014 0.32 0.37 0.33 0.32 0.020 0.40 0.51 0.31ADFI, lb 0.35 0.34 0.010 0.34 0.36 0.33 0.35 0.014 0.62 0.90 0.90F/G 1.04 1.11 0.055 1.16 0.99 1.03 1.12 0.078 0.36 0.97 0.12
d 10 to 24ADG, lb 0.84 0.74 0.029 0.73 0.77 0.82 0.84 0.035 <0.01 <0.01 0.39ADFI, lb 1.15 1.06 0.033 1.04 1.09 1.14 1.16 0.039 <0.01 <0.01 0.21F/G 1.38 1.45 0.019 1.43 1.44 1.41 1.40 0.027 0.02 0.32 0.86
d 0 to 24ADG, lb 0.63 0.56 0.017 0.56 0.60 0.61 0.61 0.021 <0.01 0.05 0.20ADFI, lb 0.81 0.76 0.022 0.74 0.78 0.80 0.81 0.026 0.01 0.02 0.23F/G 1.29 1.35 0.013 1.34 1.31 1.32 1.33 0.019 <0.01 0.85 0.43
1 A total of 320 weanling pigs (PIC 1050 barrows, initial BW of 11.9 lb and 21 d of age) were used with 5 pigs per pen and 8 pens per treatment.

55
Nu
rs
er
y N
ut
rit
ion
an
d M
an
ag
em
en
t
Table 6: The interactions of high-sulfate water and dietary zeolite (clinoptilolite) on fecal consistency1,2,3,4
Water treatment P-valuesControl 3,000 ppm sodium sulfate Sulfate × zeolite
Zeolite % 0% 0.25% 0.50% 1.0% 0% 0.25% 0.50% 1.0% SEM Linear QuadraticDay of collection
d 5 3.4 3.3 3.0 3.2 4.1 4.1 4.1 4.1 0.13 0.58 0.26d 9 3.4 3.3 3.4 3.3 4.0 4.0 4.4 4.0 0.13 0.68 0.12d 16 3.3 3.0 3.3 3.2 3.6 3.9 3.5 3.5 0.13 0.44 0.72d 23 3.3 3.2 3.5 3.2 3.7 3.6 3.6 3.4 0.13 0.50 0.53Mean 3.4 3.2 3.3 3.2 3.9 3.9 3.9 3.8 0.07 0.23 0.80
1 A total of 792 fecal samples were collected (192 per collection day; fecal samples were collected on d 5, 9, 16, and 23). Three samples were taken per pen and were scored by 5 trained individuals; those 15 scores were then averaged and reported as pen means for each collection day.2 Three samples were collected randomly from 3 pigs per pen, and samples were scored on a numerical scale from 1 to 5.3 Scoring scale guidelines: 1 = dry firm pellet, 2 = firm formed stool, 3 = soft stool that retains shape, 4 = soft unformed stool that takes shape of container, 5 = watery liquid that can be poured.4 Water × diet × day interaction (P = 0.18).
Table 7: Main effects of high-sulfate water and dietary zeolite (clinoptilolite) on fecal consistency scores1,2,3,4
Water treatment Zeolite Zeolite P-values
Item Control3,000 ppm
sodium sulfate SEM 0% 0.25% 0.50% 1.0% SEM Sulfate Linear QuadraticDay of collection
d 5 3.2 4.1 0.07 3.7 3.7 3.6 3.7 0.09 <0.01 0.55 0.38d 9 3.4 4.1 0.07 3.7 3.7 3.9 3.6 0.09 <0.01 0.74 0.18d 16 3.2 3.6 0.07 3.5 3.4 3.4 3.4 0.09 <0.01 0.37 0.79d 23 3.3 3.6 0.07 3.5 3.4 3.5 3.3 0.09 <0.01 0.25 0.64Mean 3.3 3.8 0.04 3.6 3.5 3.6 3.5 0.05 <0.01 0.14 0.75
1 A total of 792 fecal samples were collected (192 per collection day; fecal samples were collected on d 5, 9, 16, and 23). Three samples were taken per pen and were scored by 5 trained individuals; those 15 scores were then averaged and reported as pen means for each collection day.2 Three samples were collected randomly from 3 pigs per pen, and samples were scored on a numerical scale from 1 to 5.3 Scoring scale guidelines: 1 = dry firm pellet, 2 = firm formed stool, 3 = soft stool that retains shape, 4 = soft unformed stool that takes shape of container, 5 = watery liquid that can be poured.4 Day main effect (P ≤ 0.01).

56
Nu
rs
er
y N
ut
rit
ion
an
d M
an
ag
em
en
t
Table 8: The interactions of high-sulfate water and dietary zeolite (clinoptilolite) on fecal dry matter, %1,2,3
Water treatment P-valuesControl 3,000 ppm sodium sulfate Sulfate × zeolite
Zeolite % 0% 0.25% 0.50% 1.0% 0% 0.25% 0.50% 1.0% SEM Linear QuadraticDay of collection
d 5 21.4 21.0 23.5 23.1 13.5 12.7 14.0 13.2 0.01 0.41 0.87d 9 23.9 25.0 25.2 26.2 19.0 18.0 17.0 19.8 0.01 0.64 0.24d 16 25.6 26.4 24.6 26.0 25.6 20.9 24.4 23.7 0.01 0.85 0.61d 23 24.6 25.8 21.9 25.7 21.9 23.9 24.3 24.6 0.01 0.43 0.14Mean 23.9 24.6 23.8 25.3 20.0 18.9 19.9 20.4 0.01 0.73 0.86
1 A total of 792 fecal samples were collected (192 per collection day).2 Three samples were collected randomly from 3 pigs per pen, and samples were dried using a 2-stage drying method.3 Water × diet × day interaction (P = 0.41)
Table 9: The main effects of high-sulfate water and dietary zeolite (clinoptilolite) on fecal DM, %1,2,3
Water treatment Zeolite Zeolite P-values
Item Control3,000 ppm
sodium sulfate SEM 0% 0.25% 0.50% 1.0% SEM sulfate Linear QuadraticDay of collectiond 5 22.3 13.4 0.01 17.4 16.9 18.8 18.2 0.01 <0.01 0.39 0.71d 9 25.1 18.5 0.01 21.4 21.5 21.1 23.0 0.01 <0.01 0.22 0.39d 16 25.6 23.7 0.01 25.6 23.7 24.5 24.9 0.01 0.04 0.88 0.29d 23 24.5 23.7 0.01 23.2 24.9 23.1 25.2 0.01 0.39 0.27 0.72Mean 24.4 19.8 <0.01 21.9 21.7 21.9 22.8 0.01 <0.01 0.13 0.341 A total of 792 fecal samples were collected (192 per collection day; fecal samples were collected on d 5, 9, 16, and 23).2 Three samples were collected randomly from 3 pigs per pen, and samples were dried using a 2-stage drying method.3 Day main effect (P < 0.01).
57
Nursery Nutrition and Management
Effects of Feeding Copper and Feed-Grade Antimicrobials on the Growth Performance of Weanling Pigs
R. G. Amachawadi1, N. W. Shelton, M. D. Tokach, H. M. Scott1, S. S. Dritz1, R. D. Goodband, J. M. DeRouchey, J. L. Nelssen, and T. G. Nagaraja1
SummaryA total of 240 weanling pigs (34 d of age with an average body weight of 17.1 lb) were used in a 35-d growth trial to compare the growth performance effects of copper (Cu) and feed-grade antimicrobials. The 6 dietary treatments were arranged in a 2 × 3 facto-rial with 2 added Cu levels (basal level of 16.5 ppm or basal + 125 ppm from copper sulfate) and 3 antimicrobial treatments including a control, chlortetracycline (CTC; Alpharma, Fort Lee, NJ) at 500 g/ton (10 mg/kg BW), and tylosin (Tylan; Elanco Animal Health, Greenfield, IN) at 100 g/ton. Each treatment had 8 pens with 5 pigs per pen. Treatments were allotted to pen in a randomized complete block design, with location within the barn serving as the blocking factor. Following the brief acclimatiza-tion period prior to starting the experiment (13 d), pigs were fed dietary treatments for 21 d followed by another 14 d on the control diet to examine any carryover effects. No significant copper × antimicrobial interactions were observed (P > 0.07) for any pig performance response. From d 0 to 21, pharmacological Cu tended to increase (P < 0.07) both ADG and ADFI compared with pigs provided basal levels of Cu. Dietary CTC inclusion increased (P < 0.01) ADG and tended to improve (P < 0.09) ADFI and F/G over pigs not fed diets with CTC. Dietary Tylan did not alter (P > 0.19) ADG, ADFI, or F/G compared with pigs provided the control diets. From d 21 to 35, pigs that previously had received pharmacological Cu tended to have lower (P < 0.06) ADG compared with those never receiving pharmacological Cu. Also, pigs previously receiving Tylan had lower (P < 0.01) ADG than those never receiving Tylan.
For the overall trial (d 0 to 35), adding Cu for the first 21 d had no impact (P > 0.32) on ADG, ADFI, or F/G. Similarly, Tylan did not influence (P > 0.30) pig performance. The benefits of CTC during the first 21 d led to a tendency for increased (P < 0.06) ADG and ADFI compared with those not receiving CTC. Overall, pharmacological Cu and antimicrobials may offer performance advantages when incorporated in nursery pig diets; however, that advantage will not increase and may be lost after Cu and/or antimicrobials are removed from diet.
Key words: antimicrobials, copper, growth promoters, nursery pig
IntroductionPharmacological concentrations of Cu, fed as copper sulfate, are often used to enhance the growth performance in both weanling and growing pigs. Copper is often supple-
1 Department of Diagnostic Medicine/Pathobiology, College of Veterinary Medicine, Kansas State University.

58
Nursery Nutrition and Management
mented at pharmacological levels of 125 to 250 ppm to increase growth and feed intake in weanling pigs. The growth promotional effects of Cu are similar to that of antibiotics in that it alters the gut microbial flora, thereby reducing the fermentation loss of nutri-ents and suppressing pathogens. Studies done by Stahly et al. (1980)2 showed additive responses to subtherapeutic levels of Cu and antimicrobials; however, recent studies on the role of Cu and feed-grade antimicrobials on the growth performance of piglets are sparse. Therefore, the present study was conducted to evaluate the effects of Cu, chlortetracycline (CTC), and tylosin (Tylan) on the growth performance of weanling piglets.
ProceduresThe protocol used in this experiment was approved by the Kansas State University Institutional Animal Care and Use Committee. The study was conducted at the K-State Segregated Early Weaning Research Facility in Manhattan, KS. A total of 240 weanling pigs (34 d of age with an average body weight of 17.1 lb) were used in a 35-d growth trial to compare the growth performance effects of Cu and feed-grade antimicrobials. The 6 dietary treatments were arranged in a 2 × 3 factorial with 2 added Cu levels (basal level of 16.5 ppm or basal + 125 ppm from copper sulfate) and 3 antimicrobial treatments including a control, CTC at 500 g/ton (10 mg/kg BW), and Tylan at 100 g/ton. There were 8 pens per treatment with 5 pigs per pen. Each pen contained a 4-hole, dry self-feeder and a nipple waterer to provide ad libitum access to feed and water. All the pens had metal tri-bar flooring and provided approximately 3 ft2/pig. Pig weights and feed disappearance were recorded every week to calculate ADG, ADFI, and F/G. Treatments were allotted to pens in a randomized complete block design with location within the barn serving as the blocking factor, thereby ensur-ing that adjacent pens alternated among the treatment groups.
All pigs were placed on common starter diets for 13 d upon arrival to the nursery facil-ity. The common diets did not contain any antimicrobials or pharmacological levels of Cu or Zn. After feeding a prestarter diet for the first 7 d of the 13-d pretest period, pigs were fed the phase 1 control diet for 6 d prior to the start of the experiment to become accustomed to the nutrient profile and create a constant environment for the enteric bacteria prior to starting the experiment. Treatment diets were then assigned for 21 d. The Phase 1 diet was utilized for 14 d, and the Phase 2 diet was used for the remaining 7 d of the 21-d antimicrobial portion (Table 1). To generate treatment diets, corn was replaced in the control diet with copper sulfate, Tylan, and/or CTC. After 21 d, all pigs were placed on the control diet from Phase 2 for 14 d to examine for any carryover effects from providing pharmacological Cu or antimicrobials.
Experimental data were analyzed as a 2 × 3 factorial using the PROC MIXED proce-dure of SAS (SAS Institute Inc., Cary, NC). Contrast statements were used to test the main effects of Cu addition and antimicrobial effects as well as the interactions. Additional contrast statements were used to compare the effects of CTC and Tylan compared with the controls. Random effects were used for barn as well as location
2 Stahly, T. S., G. L. Cromwell, and H. J. Monegue. 1980. Effects of dietary inclusions of copper and (or) antibiotics on the performance of weanling pigs. J. Anim. Sci. 51:1347-1351.

59
Nursery Nutrition and Management
within barn. Pen was the experimental unit for all data analysis. Statistics were consid-ered significant at P < 0.05 and were considered tendencies at P < 0.10.
Results and DiscussionNo significant copper × antimicrobial interactions were observed (P > 0.07) for any pig performance response in this study (Table 2). From d 0 to 21, adding pharmacologi-cal Cu to the diet tended to increase (P < 0.07) both ADG and ADFI compared with pigs provided basal levels of Cu. Dietary CTC inclusion increased (P < 0.02) ADG and d-21 BW. Adding CTC also tended to improve (P < 0.09) ADFI and F:G over pigs not provided diets with CTC. Dietary Tylan inclusion did not alter (P > 0.19) ADG, ADFI, or F/G compared with pigs provided the control diets.
As pigs were switched to the control diet (d 21 to 35), pigs that previously had received pharmacological Cu tended to have lower (P < 0.06) ADG compared with those never receiving pharmacological Cu. Also, pigs previously receiving Tylan had lower (P < 0.01) ADG compared with their control counterparts.
Throughout the entire 35-d study, Cu supplementation for the first 21 d had no impact (P > 0.32) on ADG, ADFI, or F/G. Similarly, addition of Tylan did not affect (P > 0.30) pig performance; however, the benefits of including CTC in the diet observed during the first 21 d led to a tendency for increased (P < 0.09) ADG, ADFI, and final BW compared with those not receiving CTC.
Overall, this study showed advantages to inclusion of 500 g/ton (10 mg/kg BW) of CTC in the diets of weanling pigs. After CTC was withdrawn from the feed, growth rate returned to control levels; however, the added gain achieved when CTC was fed was not lost. No advantages were observed for inclusion of Tylan. Several previous studies performed by K-State researchers have shown growth and feed intake advan-tages with pharmacological Cu. The current study showed a marginal pig performance response to Cu that was limited to the period when it was fed, followed by a lag in performance when pigs were switched back to basal Cu levels. Pharmacological Cu and antimicrobials may offer performance advantages when incorporated in nursery pig diets; however, that advantage will not increase and may be lost after Cu and/or antimi-crobials are removed from diet.
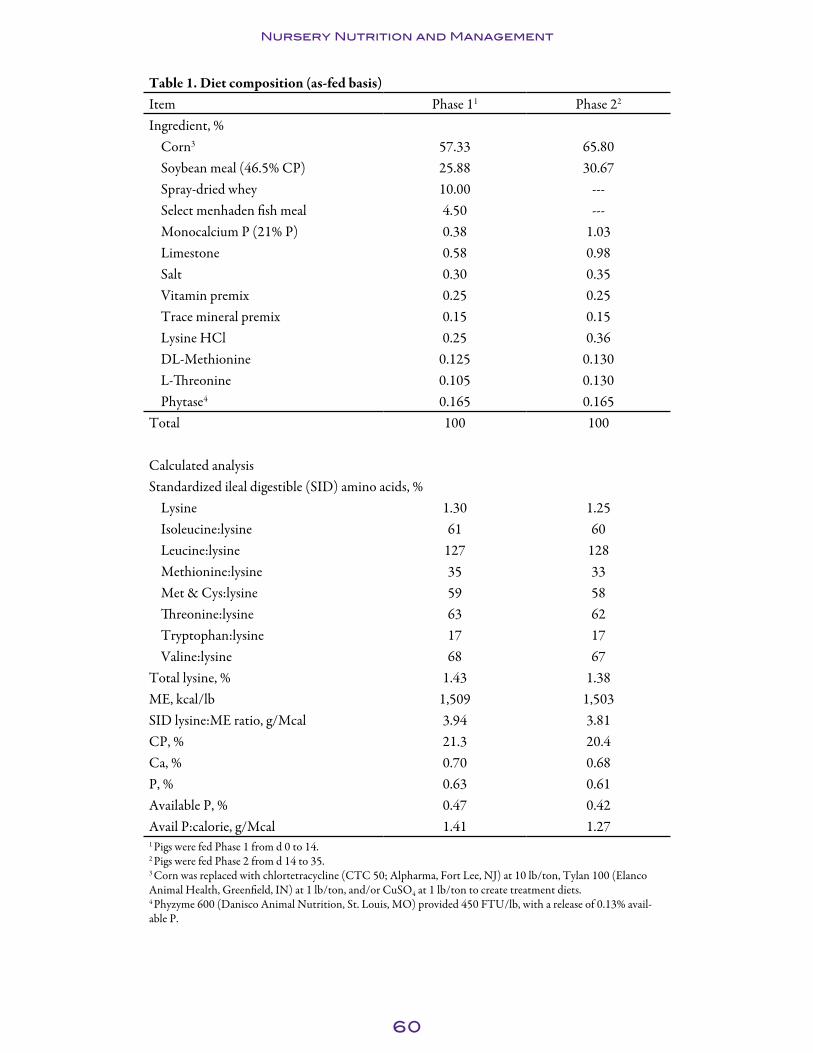
60
Nursery Nutrition and Management
Table 1. Diet composition (as-fed basis)Item Phase 11 Phase 22
Ingredient, %Corn3 57.33 65.80Soybean meal (46.5% CP) 25.88 30.67Spray-dried whey 10.00 ---Select menhaden fish meal 4.50 ---Monocalcium P (21% P) 0.38 1.03Limestone 0.58 0.98Salt 0.30 0.35Vitamin premix 0.25 0.25Trace mineral premix 0.15 0.15Lysine HCl 0.25 0.36DL-Methionine 0.125 0.130L-Threonine 0.105 0.130Phytase4 0.165 0.165
Total 100 100
Calculated analysisStandardized ileal digestible (SID) amino acids, %
Lysine 1.30 1.25Isoleucine:lysine 61 60Leucine:lysine 127 128Methionine:lysine 35 33Met & Cys:lysine 59 58Threonine:lysine 63 62Tryptophan:lysine 17 17Valine:lysine 68 67
Total lysine, % 1.43 1.38ME, kcal/lb 1,509 1,503SID lysine:ME ratio, g/Mcal 3.94 3.81CP, % 21.3 20.4Ca, % 0.70 0.68P, % 0.63 0.61Available P, % 0.47 0.42Avail P:calorie, g/Mcal 1.41 1.271 Pigs were fed Phase 1 from d 0 to 14.2 Pigs were fed Phase 2 from d 14 to 35. 3 Corn was replaced with chlortetracycline (CTC 50; Alpharma, Fort Lee, NJ) at 10 lb/ton, Tylan 100 (Elanco Animal Health, Greenfield, IN) at 1 lb/ton, and/or CuSO4 at 1 lb/ton to create treatment diets.4 Phyzyme 600 (Danisco Animal Nutrition, St. Louis, MO) provided 450 FTU/lb, with a release of 0.13% avail-able P.

61
Nu
rs
er
y N
ut
rit
ion
an
d M
an
ag
em
en
t
Table 2. Effects of dietary antimicrobials and copper sulfate on weanling pig growth performance1
Probability, P <Antimicrobial regiment2 Control vs.
Item Control Tylan3 CTC4 Cu5Cu5 + Tylan3
Cu5 + CTC4 SEM
Copper × antimicrobial Copper Antimicrobial Tylan CTC
Initial wt, lb 17.1 17.0 17.1 17.0 17.1 17.1 0.52 0.96 0.96 0.99 0.90 0.88d 0 to 21
ADG, lb 1.04 1.09 1.14 1.11 1.11 1.24 0.039 0.52 0.07 0.02 0.55 0.01ADFI, lb 1.51 1.50 1.60 1.59 1.56 1.68 0.049 0.95 0.07 0.07 0.74 0.07F/G 1.45 1.37 1.41 1.43 1.42 1.36 0.032 0.31 0.87 0.20 0.20 0.09
wt on d 21, lb 38.9 39.8 41.1 40.4 40.4 43.1 0.99 0.79 0.11 0.05 0.63 0.02d 21 to 35
ADG, lb 1.79 1.66 1.74 1.70 1.62 1.69 0.082 0.83 0.06 0.02 0.01 0.44ADFI, lb 2.89 2.75 2.97 2.84 2.80 2.90 0.076 0.50 0.57 0.02 0.09 0.16F/G 1.62 1.67 1.70 1.67 1.74 1.72 0.053 0.75 0.13 0.15 0.13 0.08
d 0 to 35ADG, lb 1.33 1.31 1.37 1.34 1.30 1.41 0.038 0.72 0.58 0.03 0.40 0.06ADFI, lb 2.03 1.98 2.12 2.07 2.03 2.15 0.046 0.98 0.33 0.02 0.31 0.06F/G 1.53 1.51 1.55 1.54 1.57 1.53 0.027 0.30 0.47 0.99 0.99 0.90
Final wt, lb 62.1 61.4 63.8 62.5 61.5 65.0 1.67 0.89 0.55 0.06 0.48 0.091 A total of 240 nursery pigs (PIC 1050 barrows, initially 17.1 lb) were used in a 35-d experiment with 8 pens per treatment.2 Antimicrobial regiments were applied from d 0 to 21. All pigs received the control diet from d 21 to 35.3 Tylan (Elanco Animal Health, Greenfield, IN) was fed at 100 g/ton.4 Chlortetracycline (Alpharma, Fort Lee, NJ ) was fed at 500 g/ton or approximately 10 mg/kg of body weight. 5 Copper was supplemented at 125 ppm above the basal level (16.5 ppm) from copper sulfate.
62
Nursery Nutrition and Management
Effects of Liquitein on Weanling Pigs Administered a Porcine Circovirus Type 2 and Mycoplasma hyopneumoniae Vaccine Strategy1
A. J. Myers, J. R. Bergstrom, M. D. Tokach, S. S. Dritz2, R. D. Goodband, J. M. DeRouchey, J. L. Nelssen, B. W. Ratlif3, and D. M. McKilligan3
Summary A total of 180 nursery pigs (PIC 327 × 1050, initially 12.6 ± 0.22 lb, and 19 ± 2 d of age) were used in a 35-d study to determine the effects of Liquitein and a porcine circo-virus 2 (PCV2)/Mycoplasma hyopneumoniae (M. hyo) vaccine regimen on the growth performance of weanling pigs. Liquitein (TechMix, LLC Stewart, MN) is a water-soluble source of plasma and energy provided in the drinking water immediately after weaning. Pigs were randomly allotted to 1 of 4 treatments arranged in a 2 × 2 factorial with main effects of Liquitein (with or without) and PCV2/M. hyo vaccine regimen (vaccinates or non-vaccinates) with 5 pigs per pen and 9 pens per treatment. At wean-ing, pigs in the vaccinate group were given a full dose (2 mL) of ResprisureOne (Pfizer Animal Health, New York, NY) and Circumvent (Intervet/Schering-Plough Animal Health, Millsboro, DE). On d 21, pigs in the vaccinate group were administered a second full dose (2 mL) of Circumvent per label instructions. Liquitein was adminis-tered to the pigs via water medicators for the first 5 d after arrival to the nursery. No vaccine × Liquitein interactions occurred for ADG or F/G throughout the study. From d 0 to 5, non-vaccinated pigs had a tendency (P < 0.07) for increased ADG. From d 21 to 35, pigs previously administered Liquitein had greater ADFI (P = 0.05) than those not provided Liquitein; however, overall (d 0 to 35) Liquitein had no effects on growth performance. From d 0 to 35, vaccinated pigs had decreased (P < 0.01) ADG and ADFI compared with non-vaccinated pigs. In conclusion, administering Liquitein during the first 5 d in the nursery increased feed intake later in the nursery stage (d 21 to 35), but the response was not great enough to influence overall growth performance. Pigs administered the PCV2 and M. hyo vaccine regimen had decreased ADG and ADFI.
Key words: growth, liquid supplement, PCV2, weanling pig
IntroductionWeaning poses new challenges to the young pig such as a sudden change in diet and navigating social hierarchy. Consequently, postweaning pigs typically do not eat large quantities of feed in the first 24 to 72 h, which becomes problematic because sufficient nutrient intake is imperative to maintain gut integrity. To further compound the issue, anecdotal field reports have indicated that producers are having increased difficulty starting and maintaining weaned pigs on feed. These reports seem to have correlated
1 Appreciation is expressed to TechMix, LLC, Stewart, MN, for providing the Liquitein and partial financial support.2 Department of Diagnostic Medicine/Pathobiology, College of Veterinary Medicine, Kansas State University.3 TechMix, LLC, Stewart, MN.

63
Nursery Nutrition and Management
with the wide-scale vaccination of weaned pigs for PCV2. Subsequent research trials at Kansas State University have indicated that PCV2 and M. hyo result in reduced nursery growth rate because of reduced feed intake (Kane et al., 20094; Potter, 20105).
Spray-dried animal plasma has been shown to improve both growth performance and feed intake in newly weaned pigs. Previous research has indicated that providing water-soluble plasma improved growth performance in newly weaned pigs (Steidinger et al., 2002)6. Liquitein, a new product, recently has become available. Liquitein is a high-density, ready-to-use source of plasma and digestible energy. It is shelf-stable and can be administered through water lines during the weaning period or other times of low feed intake and stress; therefore, our hypothesis was that providing nutrients through the water may be an effective method in combating postvaccination feed intake reduction. The objective of the study was to evaluate the effects of Liquitein and a PCV2 and M. hyo vaccine regimen on growth performance of nursery pigs.
ProceduresAll practices and procedures used in these experiments were approved by the Kansas State University Institutional Animal Care and Use Committee.
A total of 180 nursery pigs (C327 ×1050, PIC, Hendersonville, TN) with an initial BW of 12.6 ± 0.22 lb and 19 ± 2 d of age were used in a 35-d study. Pigs were trans-ported approximately 7 h (387 miles) from the sow farm to the K-State Segregated Early Weaning facility in Manhattan. The facility is a totally enclosed, environmentally regulated, mechanically ventilated barn with 40 12.9 ft2 pens located over metal tri-bar flooring. Each pen housed 5 pigs and provided 3.2 ft2 floor space per pig. Pigs were provided unlimited access to feed and water via a 4-hole dry self-feeder (17.3 in.) and 1-cup waterer.
After arrival to the segregated early weaning facility, pigs were allotted to 1 of 4 treat-ments arranged in a 2 × 2 factorial with main effects of Liquitein (with or without) and a PCV2 and M. hyo vaccine regimen (vaccinates or non-vaccinates) with 5 pigs per pen and 9 pens per treatment.
Liquitein was provided to the pigs via water medicators (Select Doser 640; Genesis Instruments, Elmwood, WI) set at a ratio of 50:1 (50 parts water to 1 part Liquitein) for the first 5 d after arrival to the nursery. Liquitein is a ready-to-use product, which allowed for the water medicator to draw Liquitein directly out of the container using peristaltic action to pump the product into the water. For all treatments, waterers were shut off until the pigs were allotted and placed into their respective pens for the experiment. After allotment, Liquitein treatment waterers were flushed until Liquitein
4 Kane, E. M., M. L. Potter, J. R. Bergstrom, S. S. Dritz, M. D. Tokach, J. M. DeRouchey, R. D. Good-band, and J. L. Nelssen. 2009. Effects of diet source and timing of porcine circovirus type 2 (PCV2) and Mycoplasma hyopneumoniae vaccines on post-weaning nursery pig performance. J. Anim. Sci. 87 (E-Suppl 3):7 (Abstr.).5 Potter, M. L. 2010. Effects of Circovirus vaccination on immune responses, viral load, and growth performance of pigs under field conditions. PhD Diss. Kansas State University, Manhattan, KS.6 Steidinger, M. U., R. D. Goodband, M. D. Tokach, J. L. Nelssen, S. S. Dritz, B. S. Borg, and J. M. Camp-bell. 2002. Effects of providing a water soluble globulin in drinking water and diet complexity on growth performance of weaning pigs. J. Anim. Sci. 80:3065-3072.

64
Nursery Nutrition and Management
appeared in the cup. For the duration of the Liquitein treatment, the container with the Liquitein was weighed daily and usage recorded. Lines distributing Liquitein were flushed daily to ensure a constant supply of product.
On d 0 (weaning), pigs in the vaccinate group were given a full dose (2 mL) each of ResprisureOne and Circumvent. Again on d 21, pigs in the vaccinate group were administered a second full dose (2 mL) of Circumvent. All vaccines were administered as separate intramuscular injections according to label directions.
Common 3-phase diets were fed for the duration of the trial (Table 1). Phase 1 diets were fed from d 0 to 5 and were in pellet form. Phase 2 and 3 diets were fed from d 5 to 21 and d 21 to 35, respectively, and were in meal form. Pigs were weighed on d 0, 2, 5, 7, 14, 21, 23, 25, and 35. Feed disappearance was measured on d 0, 1, 2, 3, 4, 5, 7, 14, 21, 22, 23, 24, 25, and 35. The frequent weighing and feed intake measurements were done to determine the immediate effects of vaccine administration. These measurements were used to calculate ADG, ADFI, F/G, and DMI.
Data were analyzed as a 2 × 2 factorial in a completely randomized design using the PROC MIXED procedure of SAS (SAS Institute Inc., Cary, NC). Pen was used as the experimental unit. When significant interactions (P < 0.05) were observed, least signifi-cant differences (LSDs) were the method used to separate the means. Results were considered significant at P ≤ 0.05.
Results and DiscussionNo vaccine × Liquitein interactions were observed for ADG or F/G for the duration of the study (Table 2).
One objective of our study was to evaluate ADG and ADFI immediately following administration of PCV2/M. hyo vaccination. To achieve this, we measured ADFI daily for 5 d after the first ResprisureOne and Circumvent (d 0) and second Circumvent vaccination (d 21). By d 3, pigs in the non-vaccinate group had increased (P < 0.05) ADFI compared with pigs in the vaccinate group (Figure 1). On d 4, a vaccine × Liquit-ein interaction (P < 0.05) was observed for ADFI. The interaction is a result of non-vaccinate pigs that did not receive Liquitein via their drinking water having increased ADFI compared with all other treatments. On d 7, a vaccine × Liquitein interaction (P < 0.05) for ADFI was observed where pigs in the vaccinate group who had not been previously administered Liquitein demonstrated increased ADFI compared with all other treatments. Average daily gain (data not shown) was affected by dehydration of the pigs during transportation (approximately 7 h from IL) to the facility.
From d 0 to 5, the period immediately following the first injection, a tendency (P = 0.07) was observed for pigs administered PCV2/M. hyo vaccine regimen to have decreased ADG compared with the non-vaccinate group. Although not significant, pigs admin-istered Liquitein during this period had a numerical tendency (P = 0.11) for increased ADG and dry matter ADFI (DMFI).

65
Nursery Nutrition and Management
From d 5 to 21 and 0 to 21, pigs administered PCV2/M. hyo vaccine regimen had decreased (P < 0.05) ADG compared with pigs in the non-vaccinate group. No signifi-cant differences were observed for Liquitein.
From d 21 to 25, pigs administered PCV2/M. hyo vaccine regimen had lower (P < 0.01) ADG and ADFI compared with pigs in the non-vaccinate group. As a result of the reduced feed intake, a tendency (P < 0.07) was measured for pigs administered PCV2/M. hyo vaccine regimen to have decreased F/G compared with pigs in the non-vaccinate group. No significant differences were observed for Liquitein.
The stress of diet change and vaccination could perhaps explain the decrease in growth performance seen from d 21 to 23 and 23 to 25, where pigs administered PCV2/M. hyo vaccine regimen had decreased (P < 0.05) ADG compared with pigs in the non-vacci-nate group (Figure 2). On d 23 and 35, pigs in the non-vaccinate group had increased (P < 0.05) ADFI compared with pigs in the vaccinate group (Figure 3).
From d 21 to 35, pigs administered PCV2/M. hyo vaccine regimen had decreased (P < 0.01) ADG and ADFI compared with pigs in the non-vaccinate group. Pigs previ-ously administered Liquitein had increased (P < 0.05) ADFI compared with pigs that were not provided Liquitein. Why pigs previously administered Liquitein had increased ADFI during this period is unclear; however, other studies that have evaluated Liquit-ein also have observed the same postadministration increase in ADFI (unpublished data). Several theories have evolved regarding the increase in ADFI observed post-Liquitein administration. Perhaps Liquitein aids in maintaining the gut brush border, helping to boost immunity and consequently improve the piglet’s ability to handle the stress of the second vaccination.
Overall, no significant differences were observed for Liquitein. Pigs administered PCV2/M. hyo vaccine regimen had decreased (P < 0.01) ADG and ADFI compared with pigs in the non-vaccinate group.
In conclusion, administering Liquitein during the first 5 d in the nursery increased feed intake later in the nursery stage (d 21 to 35), but the response was not great enough to influence overall growth performance; however, pigs administered the PCV2 and M. hyo vaccine regimen had decreased ADG and ADFI.
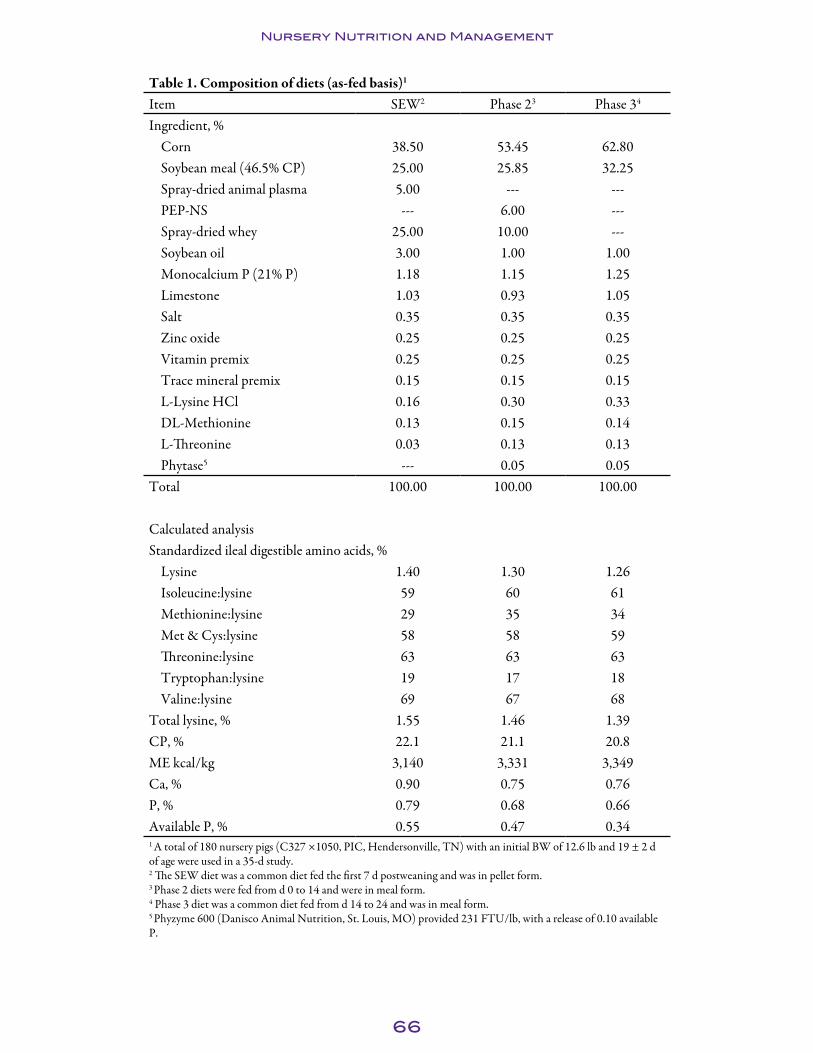
66
Nursery Nutrition and Management
Table 1. Composition of diets (as-fed basis)1
Item SEW2 Phase 23 Phase 34
Ingredient, %Corn 38.50 53.45 62.80Soybean meal (46.5% CP) 25.00 25.85 32.25Spray-dried animal plasma 5.00 --- ---PEP-NS --- 6.00 ---Spray-dried whey 25.00 10.00 ---Soybean oil 3.00 1.00 1.00Monocalcium P (21% P) 1.18 1.15 1.25Limestone 1.03 0.93 1.05Salt 0.35 0.35 0.35Zinc oxide 0.25 0.25 0.25Vitamin premix 0.25 0.25 0.25Trace mineral premix 0.15 0.15 0.15L-Lysine HCl 0.16 0.30 0.33DL-Methionine 0.13 0.15 0.14L-Threonine 0.03 0.13 0.13Phytase5 --- 0.05 0.05
Total 100.00 100.00 100.00
Calculated analysisStandardized ileal digestible amino acids, %
Lysine 1.40 1.30 1.26Isoleucine:lysine 59 60 61Methionine:lysine 29 35 34Met & Cys:lysine 58 58 59Threonine:lysine 63 63 63Tryptophan:lysine 19 17 18Valine:lysine 69 67 68
Total lysine, % 1.55 1.46 1.39CP, % 22.1 21.1 20.8ME kcal/kg 3,140 3,331 3,349Ca, % 0.90 0.75 0.76P, % 0.79 0.68 0.66Available P, % 0.55 0.47 0.341 A total of 180 nursery pigs (C327 ×1050, PIC, Hendersonville, TN) with an initial BW of 12.6 lb and 19 ± 2 d of age were used in a 35-d study.2 The SEW diet was a common diet fed the first 7 d postweaning and was in pellet form. 3 Phase 2 diets were fed from d 0 to 14 and were in meal form. 4 Phase 3 diet was a common diet fed from d 14 to 24 and was in meal form. 5 Phyzyme 600 (Danisco Animal Nutrition, St. Louis, MO) provided 231 FTU/lb, with a release of 0.10 available P.

67
Nursery Nutrition and Management
Table 2. Effects of Liquitein and vaccine regimen on nursery pig performance1
Liquitein2 No Liquitein
Item NoPCV2/ M. hyo No
PCV2/ M. hyo SEM V × L3 Vaccine Liquitein
d 0 to 5ADG, lb 0.39 0.35 0.36 0.30 0.03 0.60 0.07 0.11ADFI, lb 0.24 0.23 0.24 0.20 0.02 0.30 0.17 0.52DMADFI, lb 0.23 0.22 0.22 0.17 0.02 0.31 0.17 0.10F/G 0.607 0.658 0.678 0.665 0.03 0.34 0.58 0.24DM F/G4 0.588 0.640 0.605 0.594 0.03 0.30 0.52 0.63
d 5 to 21ADG, lb 0.70 0.63 0.68 0.66 0.02 0.31 0.04 0.86ADFI, lb 0.92 0.87 0.91 0.87 0.03 0.98 0.19 0.85F/G 1.316 1.380 1.336 1.322 0.03 0.16 0.35 0.48
d 0 to 21ADG, lb 0.47 0.44 0.46 0.41 0.02 0.72 0.05 0.30ADFI, lb 0.51 0.48 0.50 0.46 0.03 0.83 0.15 0.48F/G 1.084 1.097 1.088 1.114 0.03 0.84 0.55 0.75
d 21 to 25ADG, lb 0.91 0.62 0.77 0.62 0.04 0.11 0.001 0.13ADFI, lb 1.42 1.05 1.30 1.10 0.05 0.11 0.001 0.49F/G 1.583 1.740 1.688 1.791 0.07 0.69 0.06 0.26
d 21 to 35ADG, lb 1.10 0.98 1.05 0.91 0.05 0.87 0.006 0.18ADFI, lb 1.91 1.67 1.80 1.60 0.04 0.66 0.001 0.05F/G 1.744 1.736 1.747 1.783 0.07 0.76 0.85 0.73
d 0 to 35ADG, lb 0.82 0.73 0.78 0.71 0.02 0.83 0.001 0.23ADFI, lb 1.21 1.09 1.17 1.06 0.03 0.78 0.001 0.21F/G 1.495 1.508 1.505 1.511 0.04 0.92 0.77 0.85
1 A total of 180 nursery pigs ( PIC C327 ×1050) with an initial BW of 12.6 lb and 19 ± 2 d of age were used in a 35-d study to evaluate the effects of Liquitein and porcine circovirus type 2 (PCV2) and Mycoplasma hyopneumoniae (M. hyo) vaccine regimen on growth performance of nursery pigs. 2 Liquitein (Protein Resources; West Bend, IA) was added to the water lines at a ratio of 50:1. Liquitein disappearance was measured by weighing the container and was 1.10, 1.70, 5.20, 0.40, and 1.61 lb for days 1, 2, 3, 4, 5, respectively.3 V × L = vaccine × Liquitein interaction.4 Calculated by dividing ADG by DMI from both feed and liquid.

68
Nursery Nutrition and Management
AD
FI, l
b
0.500
0.400
0.300
0.200
0.100
0.000
75321
Period, days
Liquitein/non-vaccinate
Liquitein/vaccinate
No liquitein/non-vaccinate
No liquitein/vaccinate
4
**
*
**
* P < 0.05, main e�ect of vaccine** P < 0.05, vaccine × Liquitein
Figure 1: Effects of Liquitein and PCV2/M. hyo vaccine strategy on ADFI.
AD
G, l
b
1.500
1.250
1.000
0.750
0.500
0.250
0.000
25 to 3523 to 2521 to 2314 to 21
Period, days
Liquitein/non-vaccinate
Liquitein/vaccinate
No liquitein/non-vaccinate
No liquitein/vaccinate
*
*
* P < 0.05, main e�ect of vaccine
Figure 2: Effects of Liquitein and PCV2/M. hyo vaccine strategy on ADG.
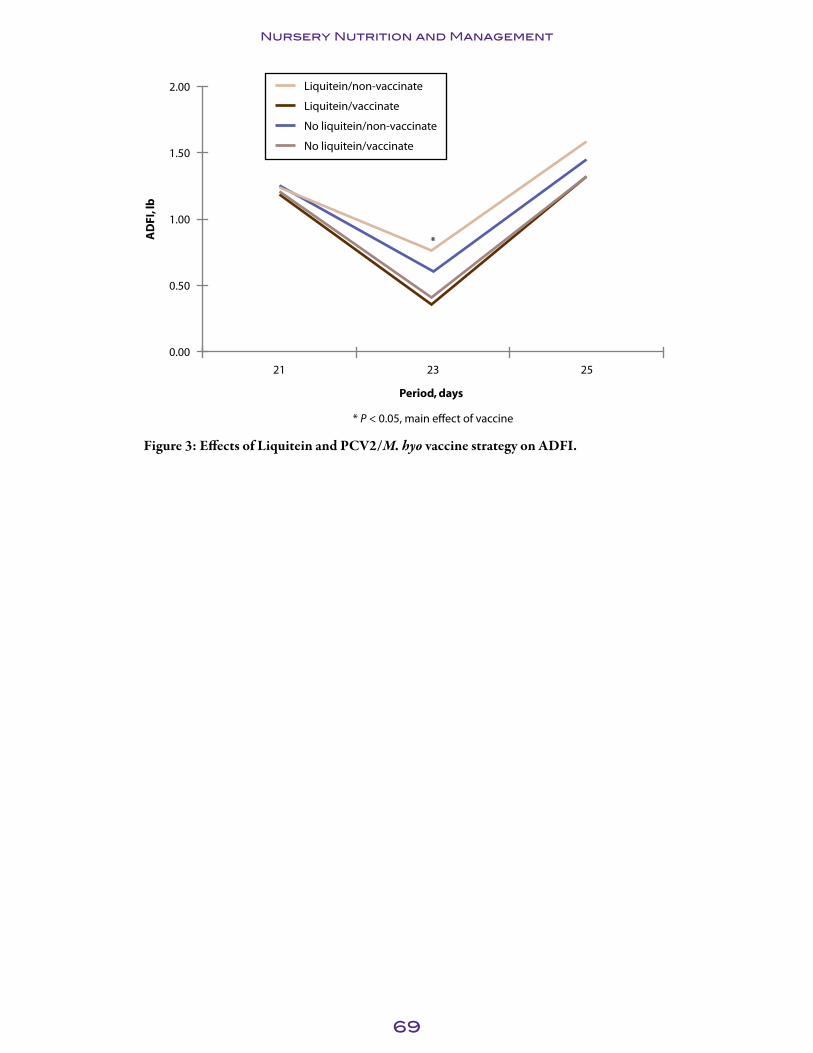
69
Nursery Nutrition and Management
AD
FI, l
b
2.00
1.50
1.00
0.50
0.00
252321
Period, days
Liquitein/non-vaccinate
Liquitein/vaccinate
No liquitein/non-vaccinate
No liquitein/vaccinate
*
* P < 0.05, main e�ect of vaccine
Figure 3: Effects of Liquitein and PCV2/M. hyo vaccine strategy on ADFI.

70
Nursery Nutrition and Management
Effect of Total Lysine:Crude Protein Ratio on Growth Performance of Nursery Pigs from 15 to 25 lb1
J. E. Nemechek, M. D. Tokach, S. S. Dritz2, R. D. Goodband, J. M. DeRouchey, J. L. Nelssen, and J. Usry3
SummaryA total of 282 nursery pigs (PIC TR4 × 1050, initially 15.9 ± 0.15 lb BW and 3 d postweaning) were used in a 28-d growth trial to evaluate the effects of total lysine:CP ratio, using fish meal as a source of non-essential N, on growth performance. Pigs were allotted to 1 of 6 dietary treatments. Each treatment had 5 replications with 7 pigs per pen and 2 replications with 6 pigs per pen. Pigs and feeders were weighed on d 0, 7, 14, 21, and 28 to calculate ADG, ADFI, and F/G. A 2-phase diet series was used with treatment diets fed from d 0 to 14 and a common diet fed from d 14 to 28. All diets were in meal form. The 6 total lysine:CP ratios were 6.79, 6.92, 7.06, 7.20, 7.35, and 7.51%. From d 0 to 14, there was a trend for increased (quadratic; P < 0.09) ADG with an increasing dietary total lysine:CP ratio up to 7.35%, with poorer performance in pigs fed the greatest lysine:CP diet. Increasing the total lysine:CP ratio tended to improve (quadratic; P < 0.09) F/G for pigs fed 7.35%, with poorer F/G as total lysine:CP ratio increased to 7.51%. When a common diet was fed (d 14 to 28), there was no differ-ence in ADG or F/G. A response (quadratic; P < 0.04) was detected for ADFI due to an increase in ADFI from the pigs fed the intermediate diets (7.06 and 7.20% total lysine:CP) during the previous period. Overall (d 0 to 28), there was a trend (quadratic; P < 0.07) for increased ADG and ADFI caused by the numerically highest values from pigs fed a total lysine:CP ratio of 7.35% and the numerically lowest values from pigs fed a total lysine:CP ratio of 7.51%. Dietary treatment did not influence F/G for the overall trial. These results indicated that feeding total lysine:CP ratio greater than 7.35% may decrease growth performance of nursery pigs.
Key words: fish meal, lysine, nonessential amino acids, nursery pig
IntroductionResearch has shown that increasing diet complexity improves growth performance of early nursery pigs; thus, these diets commonly contain specialty protein sources (fish meal, meat and bone meal, poultry meal, etc.). Although these products have been shown to positively influence growth compared with soybean meal, specialty protein sources are typically more expensive. The current trial was the fourth experiment of a series in which the primary objective was to determine the effect of replacing expensive specialty protein sources with crystalline amino acids (AA) on growth performance of nursery pigs. The first experiment was a lysine titration that established a standardized
1 The authors wish to thank Ajinomoto Heartland LLC, Chicago, IL, for providing the synthetic amino acids used in diet formulation and partial financial support.2 Department of Diagnostic Medicine/Pathobiology, College of Veterinary Medicine, Kansas State University.3 Ajinomoto Heartland LLC, Chicago, IL.

71
Nursery Nutrition and Management
ileal digestible (SID) lysine requirement of 1.30% for nursery pigs from 15 to 25 lb. The next experiment completely replaced fish meal with high amounts of crystalline AA with no negative effects on growth performance. This established a low-CP, AA-forti-fied diet that could then be used in subsequent experiments. By removing specific AA from the previously established diet, the third trial demonstrated that valine, trypto-phan, and a source of nonessential AA are required in the low-CP, AA-fortified diet. Thus, in addition to essential AA, pigs must also be supplied with a source of nones-sential AA to achieve optimal growth. One method of measuring the nonessential AA relative to essential AA in the diet is by calculating the lysine:CP ratio. Research has shown that, in pigs, the total CP in muscle typically contains about 6.5 to 7.5% lysine, providing an approximate range of dietary lysine:CP ratios to be used in the current experiment. Therefore, the objective of this experiment was to evaluate the maximum total lysine:CP ratio required for optimal growth performance.
ProceduresThe Kansas State University Institutional Animal Care and Use Committee approved the protocol used in this experiment. The study was conducted at the K-State Swine Teaching and Research Center in Manhattan, KS.
A total of 282 nursery pigs (PIC TR4 × 1050, initially 15.9 ± 0.15 lb BW) were used in a 28-d growth trial to evaluate the effects of the total lysine:CP ratio, using fish meal as a source of non-essential N, on growth performance. Pigs were weaned at 19.5 ± 1.4 d of age and fed a common pelleted starter diet for 3 d. At weaning, pigs were allotted to pens by initial BW to achieve the same average weight for all pens. On d 3 after wean-ing, pens were allotted randomly to 1 of 6 dietary treatments; thus, d 3 after weaning was d 0 of the experiment. Each treatment had 5 replications with 7 pigs per pen and 2 replications with 6 pigs per pen. All pens (4 × 5 ft) contained a 4-hole, dry self-feeder and a nipple waterer to provide ad libitum access to feed and water.
A 2-phase diet series was used, with treatment diets fed from d 0 to 14 and a common diet fed from d 14 to 28. Treatment diets were corn-soybean meal-based and contained 10% dried whey and 1% soy oil. Diets were formulated to a predetermined SID lysine level of 1.30%. The 6 total lysine:CP ratios were 6.79, 6.92, 7.06, 7.20, 7.35, and 7.51% (Table 1). Crystalline L-Lysine, DL-Methionine, L-Threonine, L-Tryptophan, and L-Valine all increased as fish meal decreased to maintain minimum AA ratios of 58% Met & Cys:lysine, 64% threonine:lysine, 20% tryptophan:lysine, 52% isoleucine:lysine, and 70% valine:lysine. Large batches of the 6.79 and 7.51% total lysine:CP ratio diets were manufactured then blended at ratios of 80:20, 60:40, 40:60, and 20:80 to achieve the intermediate diets. The subsequent common diet for all the trials was a corn-soybean meal-based diet with no specialty protein sources, formulated to 1.26% SID lysine. All experimental diets were in meal form and were prepared at the K-State Animal Science Feed Mill. A subsample of all experimental diets was collected and analyzed for dietary AA by Ajinomoto Heartland LLC (Chicago, IL). Pigs and feeders were weighed on d 0, 7, 14, 21, and 28 to calculate ADG, ADFI, and F/G.
Experimental data were analyzed for linear and quadratic effects of increasing total lysine:CP ratio using the PROC MIXED procedure of SAS (SAS Institute Inc., Cary,

72
Nursery Nutrition and Management
NC). Pen was the experimental unit for all data analysis. Significant differences were declared at P < 0.05 and trends declared at P < 0.10.
Results and DiscussionFrom d 0 to 14, there was a trend for increased (quadratic; P < 0.09) ADG with increas-ing the total lysine:CP ratio up to 7.35%, with a 13% reduction in ADG when the ratio increased from 7.35 to 7.51% (Table 2). Increasing the total lysine:CP ratio tended to decrease (quadratic; P < 0.09) F/G for pigs fed 7.35%, with 7% poorer F/G as total lysine:CP ratio increased to 7.51%.
From d 14 to 28, there was no difference in ADG or F/G. A response (quadratic; P < 0.04) was observed for ADFI, which was the result of an increase in ADFI from the pigs fed the intermediate diets (7.06 and 7.20% total lysine:CP ratio) during the previ-ous period (Table 2).
Overall (d 0 to 28), there was a trend (quadratic; P < 0.07) for increased ADG and ADFI caused by the numerically highest values from pigs fed a total lysine:CP ratio of 7.35% and the numerically lowest values from pigs fed a total lysine:CP ratio of 7.51% (Table 2). Dietary treatment did not influence F/G for the overall trial. These results indicated that feeding total lysine:CP ratio greater than 7.35% may decrease growth performance of nursery pigs. These data are consistent with reports of muscle composi-tion of pigs which consist of approximately 6.5 to 7.5% lysine:CP.

73
Nursery Nutrition and Management
Table 1. Diet composition (as-fed basis)Total lysine:CP ratio, %2 Common
Phase 21Item 6.79 6.92 7.06 7.20 7.35 7.51Ingredient, %
Corn 56.58 57.19 57.79 58.40 59.01 59.62 65.05Soybean meal (46.5% CP) 25.21 25.18 25.16 25.14 25.11 25.09 30.73Spray-dried whey 10.00 10.00 10.00 10.00 10.00 10.00 ---Select menhaden fish meal 4.50 3.60 2.70 1.80 0.90 --- ---Soybean oil 1.00 1.00 1.00 1.00 1.00 1.00 ---Monocalcium phosphate (21% P) 0.51 0.63 0.75 0.86 0.98 1.10 1.08Limestone 0.55 0.62 0.69 0.76 0.83 0.90 0.95Salt 0.30 0.31 0.32 0.33 0.34 0.35 0.35Zinc oxide 0.25 0.25 0.25 0.25 0.25 0.25 ---Trace mineral premix 0.15 0.15 0.15 0.15 0.15 0.15 0.15Vitamin premix 0.25 0.25 0.25 0.25 0.25 0.25 0.25L-Lysine HCl 0.275 0.327 0.378 0.430 0.481 0.533 0.360DL-Methionine 0.124 0.143 0.162 0.182 0.201 0.220 0.130L-Threonine 0.136 0.155 0.174 0.192 0.211 0.230 0.130L-Tryptophan 0.046 0.051 0.056 0.060 0.065 0.070 ---L-Valine 0.037 0.062 0.086 0.111 0.135 0.160 ---Phytase2 0.085 0.085 0.085 0.085 0.085 0.085 0.165
Total 100 100 100 100 100 100 100
Calculated analysisStandardized ileal digestible (SID) amino acids, %
Lysine 1.30 1.30 1.30 1.30 1.30 1.30 1.26Isoleucine:lysine 60 59 57 55 54 52 61Leucine:lysine 125 122 120 117 114 112 129Methionine:lysine 35 35 35 36 36 37 33Met & Cys:lysine 58 58 58 58 58 58 58Threonine:lysine 64 64 64 64 64 64 63Tryptophan:lysine 20 20 20 20 20 20 17.4Valine:lysine 70 70 70 70 70 70 68
Total lysine, % 1.43 1.43 1.43 1.43 1.42 1.42 1.39ME, kcal/lb 1,528 1,526 1,524 1,522 1,520 1,518 1,503SID Lys:ME, g/Mcal 3.86 3.86 3.87 3.87 3.88 3.89 3.80CP, % 21.1 20.6 20.2 19.8 19.4 18.9 20.8Ca, % 0.72 0.72 0.72 0.72 0.72 0.72 0.69P, % 0.65 0.65 0.65 0.65 0.64 0.64 0.62Available P, % 0.47 0.47 0.47 0.47 0.47 0.47 0.421 Treatment diets were fed from d 0 to 14 and a common diet was fed from d 14 to 28.2 Phyzyme 600 (Danisco Animal Nutrition, St. Louis, MO) provided 5,231 FTU/lb, with a release of 0.10% available P.
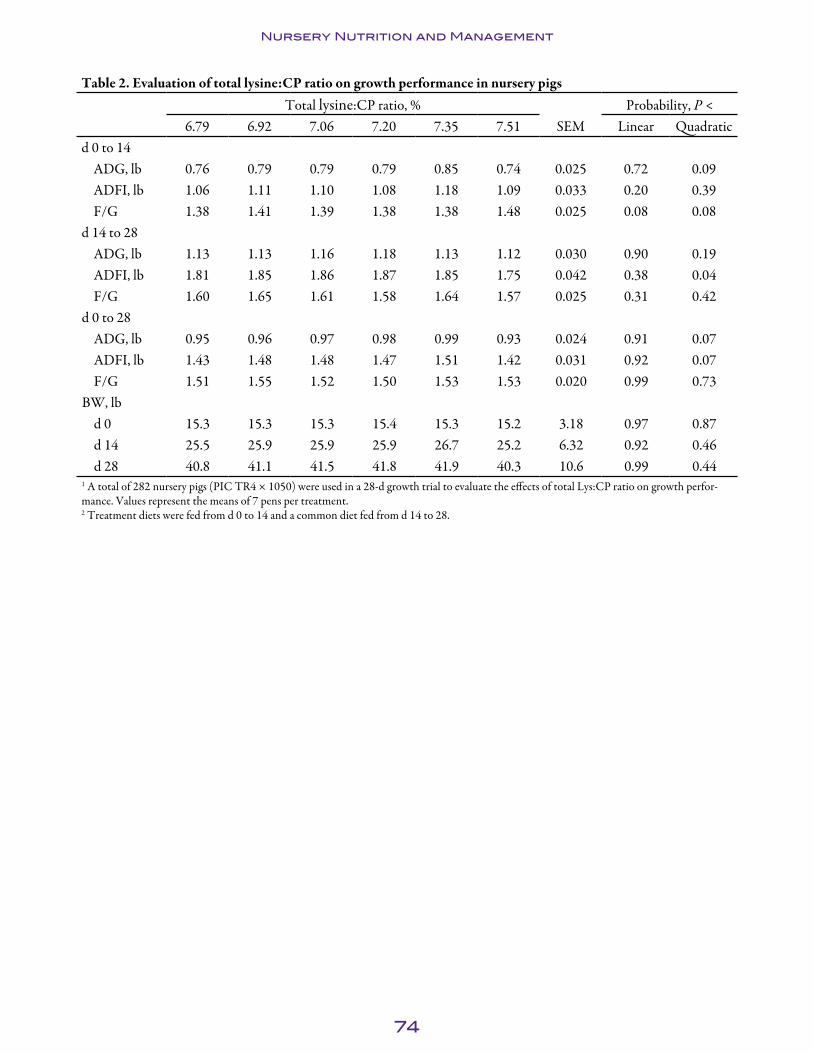
74
Nursery Nutrition and Management
Table 2. Evaluation of total lysine:CP ratio on growth performance in nursery pigsTotal lysine:CP ratio, % Probability, P <
6.79 6.92 7.06 7.20 7.35 7.51 SEM Linear Quadraticd 0 to 14
ADG, lb 0.76 0.79 0.79 0.79 0.85 0.74 0.025 0.72 0.09ADFI, lb 1.06 1.11 1.10 1.08 1.18 1.09 0.033 0.20 0.39F/G 1.38 1.41 1.39 1.38 1.38 1.48 0.025 0.08 0.08
d 14 to 28ADG, lb 1.13 1.13 1.16 1.18 1.13 1.12 0.030 0.90 0.19ADFI, lb 1.81 1.85 1.86 1.87 1.85 1.75 0.042 0.38 0.04F/G 1.60 1.65 1.61 1.58 1.64 1.57 0.025 0.31 0.42
d 0 to 28ADG, lb 0.95 0.96 0.97 0.98 0.99 0.93 0.024 0.91 0.07ADFI, lb 1.43 1.48 1.48 1.47 1.51 1.42 0.031 0.92 0.07F/G 1.51 1.55 1.52 1.50 1.53 1.53 0.020 0.99 0.73
BW, lbd 0 15.3 15.3 15.3 15.4 15.3 15.2 3.18 0.97 0.87d 14 25.5 25.9 25.9 25.9 26.7 25.2 6.32 0.92 0.46d 28 40.8 41.1 41.5 41.8 41.9 40.3 10.6 0.99 0.44
1 A total of 282 nursery pigs (PIC TR4 × 1050) were used in a 28-d growth trial to evaluate the effects of total Lys:CP ratio on growth perfor-mance. Values represent the means of 7 pens per treatment.2 Treatment diets were fed from d 0 to 14 and a common diet fed from d 14 to 28.

75
Nursery Nutrition and Management
Effect of Replacing Commonly Used Specialty Protein Sources with Crystalline Amino Acids on Growth Performance of Nursery Pigs from 15 to 25 lb1
J. E. Nemechek, M. D. Tokach, S. S. Dritz2, R. D. Goodband, J. M. DeRouchey, J. L. Nelssen, and J. Usry3
SummaryA total of 282 nursery pigs (PIC TR4 × 1050, initially 14.5 ± 0.13 lb BW and 3 d postweaning) were used in a 28-d growth trial to determine the effects of replacing high amounts of specialty protein sources with crystalline amino acids (AA) on growth performance of nursery pigs from 15 to 25 lb. Pigs were allotted to 1 of 6 dietary treat-ments arranged as a 2 × 3 factorial treatment structure. Each treatment had 5 replica-tions with 7 pigs per pen and 2 replications with 6 pigs per pen. Pigs and feeders were weighed on d 0, 7, 14, 21, and 28 to calculate ADG, ADFI, and F/G. A 2-phase diet series was used, with treatment diets fed from d 0 to 14 and a common diet fed from d 14 to 28. All diets were in meal form. Pens were assigned 1 of 3 specialty protein sources with either a low or high crystalline AA level. Thus, diets included either select menhaden fish meal (4.50 vs. 1.00%), porcine meat and bone meal (6.00 vs. 1.20%), or pet food-grade poultry meal (6.00 vs. 1.05%).
From d 0 to 14, pigs fed high crystalline AA had improved (P < 0.04) ADG compared with pigs fed the low crystalline AA diets. There was no difference in ADG among pigs fed fish meal, meat and bone meal, or poultry meal. Average daily feed intake and F/G were similar between pigs fed different crystalline AA concentrations or different protein sources. From d 14 to 28, there were no differences in ADG and ADFI between pigs previously fed different crystalline AA levels. There was a tendency for improved (P < 0.04) F/G for pigs previously fed fish meal during Phase 1 compared with pigs fed diets containing meat and bone meal or poultry meal. There was no difference between pigs previously fed different crystalline AA concentrations during Phase 2. Overall (d 0 to 28), dietary crystalline AA had no impact on ADG, ADFI, or F/G. Pigs fed diets containing fish meal from d 0 to 14 tended to have improved ADG for the overall trial compared with pigs fed diets containing meat and bone meal or poultry meal. There were no differences in ADFI or F/G among pigs fed different protein sources. These data suggest that crystalline AA can be used to replace specialty protein sources in nurs-ery pig diets without negatively influencing growth.
Key words: crystalline amino acids, nonessential amino acid, nursery pig, protein source
1 The authors wish to thank Ajinomoto Heartland LLC, Chicago, IL, for providing the synthetic amino acids used in diet formulation and partial financial support.2 Department of Diagnostic Medicine/Pathobiology, College of Veterinary Medicine, Kansas State University.3 Ajinomoto Heartland LLC, Chicago, IL.
76
Nursery Nutrition and Management
IntroductionSeveral experiments have been conducted to evaluate replacing expensive specialty protein sources with crystalline AA in diets for nursery pigs. Because variable results have been observed among trials, a series of experiments has been conducted at Kansas State University to determine the reason for the inconsistent response. The current trial was the sixth experiment of the series and was conducted to validate the concepts devel-oped in the previous experiments. These concepts included: (1) at least 1.30% standard-ized ileal digestible (SID) lysine is required for optimal growth, (2) high amounts of crystalline AA can replace select menhaden fish meal with no negative effects on growth performance, (3) supplementation of valine, tryptophan, and nonessential AA is required in low-CP, AA-fortified nursery pig diets, (4) a total lysine:CP ratio no greater than 7.35% should be fed for optimal growth, and (5) at least 65% SID valine:lysine should be fed for maximum growth performance of nursery pigs. In addition to validat-ing the concepts developed from the previous experiments, the objective of this experi-ment was to determine the effects of replacing high amounts of specialty protein sources with crystalline AA on growth performance of nursery pigs from 15 to 25 lb.
ProceduresThe Kansas State University Institutional Animal Care and Use Committee approved the protocol used in this experiment. The study was conducted at the K-State Swine Teaching and Research Center in Manhattan, KS.
A total of 282 nursery pigs (PIC TR4 × 1050, initially 14.5 ± 0.13 lb BW) were used in a 28-d growth trial to evaluate the effects of replacing high amounts of specialty protein sources with crystalline AA on growth performance. Pigs were weaned at approxi-mately 21 d of age and fed a common pelleted starter diet for 3 d. At weaning, pigs were allotted to pens by initial BW to achieve the same average weight for all pens. On d 3 after weaning, pens were allotted randomly to 1 of 6 dietary treatments; thus, d 3 after weaning was d 0 of the experiment. Each treatment had 5 replications with 7 pigs per pen and 2 replications with 6 pigs per pen. All pens (4 × 5 ft) contained a 4-hole, dry self-feeder and a nipple waterer to provide ad libitum access to feed and water.
A 2-phase diet series was used, with treatment diets fed from d 0 to 14 and a common diet fed from d 14 to 28. Treatment diets were corn-soybean meal-based and contained 10% dried whey and 1% soy oil. Diets were formulated to a predetermined SID lysine level of 1.30%. Pens were assigned 1 of 3 specialty protein sources with either a low or high crystalline AA level. Thus, diets included either select menhaden fish meal (4.50 vs. 1.00%), porcine meat and bone meal (6.00 vs. 1.20%), or pet food-grade poultry meal (6.00 vs. 1.05%; Table 1). Specialty protein sources were included at low levels in the high crystalline AA diets to ensure a total lysine:CP ratio no greater than 7.36%. Appropriate amounts of crystalline AA were added to treatment diets to maintain SID AA ratios relative to lysine of 52% isoleucine, 58% methionine and cysteine, 62% threonine, 16.4% tryptophan, and 65% valine. The subsequent common diet for all the trials was a corn-soybean meal-based diet with no specialty protein sources, formulated to 1.26% SID lysine. All experimental diets were in meal form and were prepared at the K-State Animal Science Feed Mill. Pigs and feeders were weighed on d 0, 7, 14, 21, and 28 to calculate ADG, ADFI, and F/G.

77
Nursery Nutrition and Management
Experimental data were analyzed using analysis of variance as a 2 × 3 factorial with 2 crystalline AA levels and 3 specialty protein sources. Differences between treatments were determined using the PDIFF statement in SAS (SAS Institute, Inc., Cary, NC). Significant differences were declared at P < 0.05 and trends declared at P < 0.10. Pen was the experimental unit for all data analysis.
Results and DiscussionFrom d 0 to 14 (experimental treatment period), pigs fed high crystalline AA had improved (P < 0.04) ADG compared with pigs fed the low crystalline AA diets (Table 2). There was no difference in ADG among pigs fed fish meal, meat and bone meal, or poultry meal. Average daily feed intake and F/G were similar among pigs fed different crystalline AA concentrations or different protein sources during the first period.
From d 14 to 28, when the common diet was fed, there were no differences in ADG or ADFI between pigs previously fed different crystalline AA concentrations in place of specialty protein sources. Average daily gain tended (P < 0.09) to decrease for pigs previously fed meat and bone meal and ADFI tended (P < 0.09) to increase for pigs previously fed poultry meal. These tendencies resulted in improved (P < 0.04) F/G for pigs previously fed fish meal during Phase 1 compared with pigs fed diets containing meat and bone meal or poultry meal. There were no differences among pigs fed different crystalline AA levels during the second period.
Overall (d 0 to 28), dietary crystalline AA had no impact on ADG, ADFI, or F/G. Pigs fed diets containing fish meal from d 0 to 14 tended to have improved ADG for the overall trial compared with pigs fed diets containing meat and bone meal or poultry meal. There was no difference in ADFI or F/G among pigs fed different protein sources. There were no interactions between dietary treatments during any phases. These data suggest that crystalline AA can be used to replace specialty protein sources in nursery pig diets without negatively influencing growth.
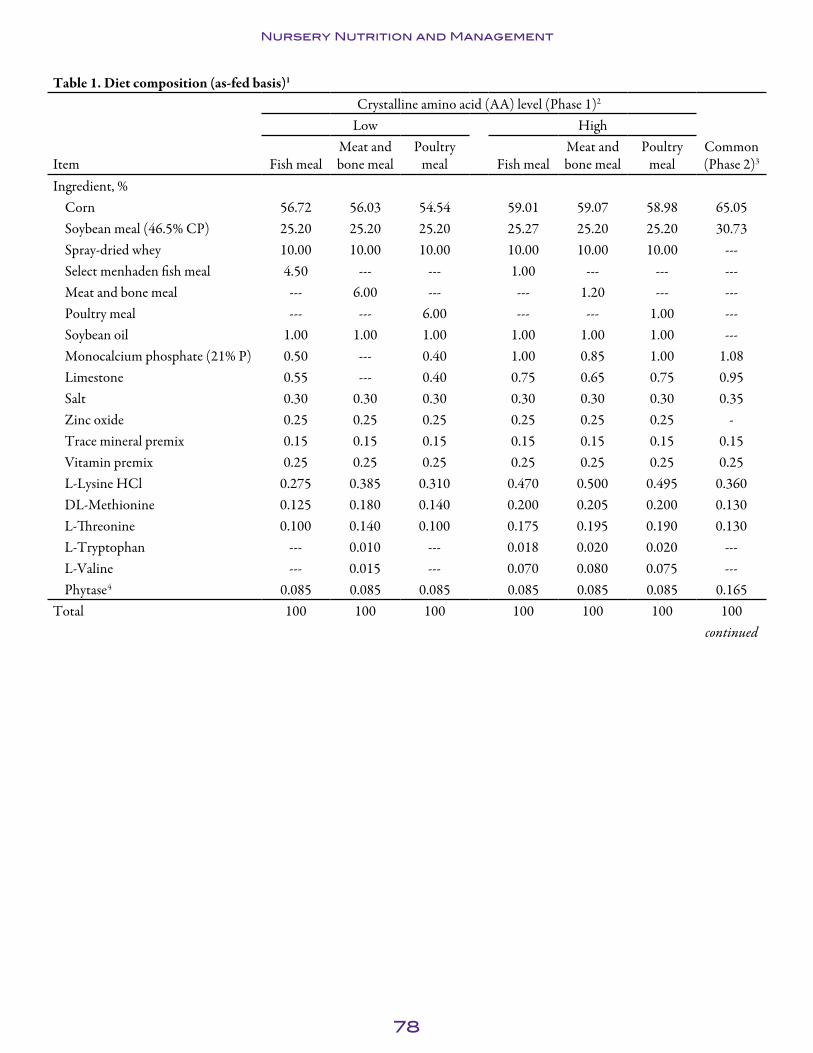
78
Nursery Nutrition and Management
Table 1. Diet composition (as-fed basis)1
Crystalline amino acid (AA) level (Phase 1)2
Low High
Item Fish mealMeat and bone meal
Poultry meal Fish meal
Meat and bone meal
Poultry meal
Common (Phase 2)3
Ingredient, %Corn 56.72 56.03 54.54 59.01 59.07 58.98 65.05Soybean meal (46.5% CP) 25.20 25.20 25.20 25.27 25.20 25.20 30.73Spray-dried whey 10.00 10.00 10.00 10.00 10.00 10.00 ---Select menhaden fish meal 4.50 --- --- 1.00 --- --- ---Meat and bone meal --- 6.00 --- --- 1.20 --- ---Poultry meal --- --- 6.00 --- --- 1.00 ---Soybean oil 1.00 1.00 1.00 1.00 1.00 1.00 ---Monocalcium phosphate (21% P) 0.50 --- 0.40 1.00 0.85 1.00 1.08Limestone 0.55 --- 0.40 0.75 0.65 0.75 0.95Salt 0.30 0.30 0.30 0.30 0.30 0.30 0.35Zinc oxide 0.25 0.25 0.25 0.25 0.25 0.25 -Trace mineral premix 0.15 0.15 0.15 0.15 0.15 0.15 0.15Vitamin premix 0.25 0.25 0.25 0.25 0.25 0.25 0.25L-Lysine HCl 0.275 0.385 0.310 0.470 0.500 0.495 0.360DL-Methionine 0.125 0.180 0.140 0.200 0.205 0.200 0.130L-Threonine 0.100 0.140 0.100 0.175 0.195 0.190 0.130L-Tryptophan --- 0.010 --- 0.018 0.020 0.020 ---L-Valine --- 0.015 --- 0.070 0.080 0.075 ---Phytase4 0.085 0.085 0.085 0.085 0.085 0.085 0.165
Total 100 100 100 100 100 100 100continued

79
Nursery Nutrition and Management
Table 1. Diet composition (as-fed basis)1
Crystalline amino acid (AA) level (Phase 1)2
Low High
Item Fish mealMeat and bone meal
Poultry meal Fish meal
Meat and bone meal
Poultry meal
Common (Phase 2)3
Calculated analysisStandardized ileal digestible (SID) AA, %
Lysine 1.30 1.30 1.30 1.30 1.30 1.30 1.26Isoleucine:lysine 60 57 60 54 53 54 61Leucine:lysine 125 121 125 115 114 114 129Methionine:lysine 35 36 34 36 36 36 33Met & Cys:lysine 58 58 58 58 58 58 58Threonine:lysine 62 62 62 62 62 62 63Tryptophan:lysine 16.7 16.4 16.5 16.5 16.4 16.5 17.4Valine:lysine 67 65 66 65 65 65 68
Total lysine, % 1.43 1.45 1.46 1.42 1.43 1.43 1.39ME, kcal/lb 1,528 1,514 1,516 1,520 1,518 1,518 1,503SID lysine:ME, g/Mcal 3.86 3.89 3.89 3.88 3.88 3.88 3.80CP, % 21.0 21.4 22.4 19.4 19.4 19.4 20.8Total lysine:CP, % 6.82 6.78 6.53 7.35 7.36 7.36 6.68Ca, % 0.71 0.78 0.71 0.70 0.70 0.70 0.69P, % 0.65 0.70 0.65 0.65 0.65 0.65 0.62Available P, % 0.47 0.50 0.47 0.48 0.47 0.47 0.421 A total of 282 nursery pigs (PIC TR4 × 1050) were used in a 28-d trial to evaluate the effects of replacing high amounts of fish meal, meat and bone meal, and poultry meal with crystalline AA on growth performance.2 Treatment diets were fed from d 0 to 14.3 Common diet was fed from d 14 to 28. 4 Phyzyme 600 (Danisco Animal Nutrition, St. Louis, MO) provided 509 FTU/kg, with a release of 0.10% available P.

80
Nursery Nutrition and Management
Table 2. Comparison of replacing different specialty protein sources with crystalline amino acids (AA) on growth perfor-mance in nursery pigs1,2
Crystalline AA level3,4
Low High Probability5, P <
Fish mealMeat and bone meal
Poultry meal Fish meal
Meat and bone meal
Poultry meal SEM
Protein source
Low AA vs.
high AAd 0 to 14
ADG, lb 0.54 0.49 0.52 0.57 0.54 0.57 0.026 0.19 0.04ADFI, lb 0.81 0.77 0.81 0.84 0.82 0.84 0.032 0.29 0.14F/G 1.51 1.56 1.56 1.48 1.51 1.47 0.033 0.45 0.15
d 14 to 28ADG, lb 1.15 1.12 1.13 1.14 1.06 1.14 0.031 0.09 0.42ADFI, lb 1.83 1.82 1.89 1.82 1.77 1.86 0.046 0.09 0.38F/G 1.60 1.63 1.67 1.60 1.68 1.64 0.025 0.04 0.89
d 0 to 28ADG, lb 0.84 0.81 0.83 0.86 0.80 0.85 0.024 0.08 0.57ADFI, lb 1.32 1.30 1.35 1.33 1.29 1.35 0.036 0.13 0.96F/G 1.57 1.61 1.63 1.56 1.62 1.58 0.027 0.16 0.40
Weight, lbd 0 14.5 14.5 14.5 14.6 14.5 14.5 0.059 0.99 1.00d 14 22.1 21.5 21.8 22.5 22.1 22.2 0.176 0.59 0.46d 28 38.1 37.1 37.7 38.5 36.9 37.8 0.328 0.39 0.94
1 A total of 282 nursery pigs (PIC TR4 × 1050) were used in a 28-d growth trial to evaluate the effects of replacing high amounts of specialty protein sources with crystalline AA on growth performance of nursery pigs. Values represent the means of 7 pens per treatment.2 Treatment diets were fed from d 0 to 14 and a common diet fed from d 14 to 28.3 Pigs were fed either a low or a high crystalline AA level.4 Pigs were fed fish meal, meat and bone meal, or poultry meal.5 There were no dietary interactions between treatments.
81
Nursery Nutrition and Management
Evaluation of Heparin Production By-Products in Nursery Pig Diets1
A. J. Myers, M. D. Tokach, R. D. Goodband, M.U. Steidinger2, S. S. Dritz3, J. M. DeRouchey, J. L. Nelssen, B. W. Ratliff 4, and D. M. McKilligan4
SummaryA total of 1,152 weanling pigs (Newsham GPK35 × PIC380, initially 12.3 ± 1.30 lb, 20 ± 2 d of age) were used in a 39-d study to evaluate the effects of select menha-den fish meal (SMFM), poultry meal, PEP2+, Peptone 50, and PEP-NS on nursery pig performance. PEP2+, Peptone 50, and PEP-NS are all porcine intestinal mucosa products, but they differ in the carriers with which they are co-dried. PEP2+ is co-dried with enzymatically processed vegetable proteins and amino acid (AA) dried fermenta-tion biomass. Peptone 50 is co-dried with a vegetable protein, whereas PEP-NS uses by-products from corn wet-milling as well as dried fermentation biomass.
Pigs were randomly allotted to 1 of 6 dietary treatments with 32 pigs per pen and 6 replications per treatment. Treatment diets were fed in 2 phases (d 0 to 7 and d 7 to 21) with a common diet fed to all pigs in the third phase (d 21 to 39). Treatments consisted of a negative control (NC) diet containing 4.5% SDAP in Phase 1 and no specialty protein sources in Phase 2 or the NC diet with 6% poultry meal (PM), PEP2+, Peptone 50, or PEP-NS. From d 0 to 21, pigs fed diets containing 6% SMFM, PM, PEP2+, or PEP-NS had improved (P < 0.05) ADG and ADFI compared with those fed the negative control diet. Pigs fed diets containing 6% SMFM, PM, PEP2+, or PEP-NS had improved (P < 0.05) F/G compared with pigs fed 6% Peptone 50.
From d 21 to 39, pigs previously fed diets containing 6% PEP2+ or PEP-NS had improved (P < 0.05) ADG and ADFI compared with those previously fed the negative control diet. Overall (d 0 to 39), pigs fed diets containing 6% SMFM, PM, PEP2+, or PEP-NS had improved (P < 0.05) ADG and ADFI compared with pigs fed the nega-tive control diet. No significant differences were observed among treatments for F/G; therefore, PEP2+ and PEP-NS are suitable replacements for fish meal and poultry meal in nursery diets from d 7 to 21 postweaning.
Key words: fish meal, PEP2+, Peptone 50, PEP-NS, spray-dried animal plasma, nursery pig
IntroductionNumerous protein sources have been investigated for their efficacy in stimulating both feed intake and growth performance in the weanling pig. Research has indicated that
1 Appreciation is expressed to TechMix, LLC, Stewart, MN, and Midwest Ag Enterprises, Marshal, MN, for providing the PEP products and partial financial support.2 Swine Nutrition Service, Anchor, IL. 3 Diagnostic Medicine/Pathobiology, College of Veterinary Medicine, Kansas State University.4 TechMix, LLC, Stewart, MN.
82
Nursery Nutrition and Management
porcine intestinal mucosa, by-products of heparin production, may be suitable replace-ments for fish meal in nursery pig diets (Jones et al., 20085; Myers et al., 20106). Porcine digest is derived when mucosa linings from the intestines collected at pork packing plants are removed and hydrolyzed, and the remaining material consists of small-chain peptides. PEP2+, Peptone 50, and PEP-NS (Tech Mix, LLC, Stewart, MN) are by-products of heparin production. Although all of these products originate from intestinal mucosa lining, they vary in that they are co-dried with different carriers to create a final product. PEP2+ is co-dried with enzymatically processed vegetable protein and AA fermentation biomass whereas Peptone 50 is co-dried with an unprocessed vegetable protein. PEP-NS is co-dried with a corn-wet milling by-product and AA dried fermentation biomass.
Other specialty protein sources are routinely used in nursery pig diets. Fish meal is a commonly used protein source in nursery pig diets due to its digestibility and desirable AA profile. Furthermore, studies evaluating poultry meal in nursery pig diets have indi-cated that it can replace fish meal in nursery pig diets without adversely affecting perfor-mance. Thus, our objective was to evaluate the effects of Peptone products (PEP2+, Peptone 50, and PEP-NS), select menhaden fish meal, and poultry meal on the growth performance of nursery pigs.
ProceduresAll practices and procedures used in these experiments were approved by the Kansas State University Institutional Animal Care and Use Committee.
A total of 1,152 nursery pigs (Newsham GPK35 × PIC380; initial BW of 12.3 ± 1.30 lb and 20 ± 2 d of age) were used in a 39-d study to evaluate the effects of Peptone prod-ucts on the growth performance of nursery pigs. The study was conducted at a commer-cial research wean-to-finish facility in Anchor, IL. The facility was an environmentally controlled, fully slatted, wean-to-finish barn. Pigs were provided ad libitum access to feed and water via a 4-hole dry self-feeder (60 in. long) and 2 cup waterers. Each pen was 220.8 ft2 and provided 6.9 ft2/pig floor space. At weaning, pigs were weighed by pen and were randomly allotted to 1 of 6 dietary treatments based upon average pen weight, with 32 pigs per pen and 6 replicate pens per treatment. The number of barrows and gilts were equalized across pens.
The 6 dietary treatments were (1) a negative control containing 4.5% SDAP in Phase 1 (d 0 to 7) followed by no specialty protein sources in Phase 2 (d 7 to 21), or (2) the negative control with 6% SMFM, poultry meal, PEP2+, Peptone 50, or PEP-NS. The specialty protein source and crystalline AA replaced soybean meal in the negative control diet. Nutrient profiles, including standardized ileal digestible (SID) values of AA for PEP2+, Peptone 50, and PEP-NS, were provided by the manufacturer (Tech-Mix, LLC, Stewart, MN) and used in diet formulation (Table 1). Spray-dried animal plasma digestibility coefficients obtained from the manufacturer (APC, Ames, IA) and SID AA digestibility values for SMFM and poultry meal used in diet formulation were obtained from NRC (1998).
5 Jones et al., Swine Day 2008, Report of Progress 1001, pp. 52-61. 6 Myers et al., Swine Day 2010, Report of Progress 1038, pp. 27-34.

83
Nursery Nutrition and Management
Phase 1 diets were fed in pellet form from d 0 to 7 postweaning (Table 2). Phase 2 diets were fed in meal form from d 7 to 21 (Table 3). A common Phase 3 diet was fed in meal form from d 21 to 39. Average daily gain, ADFI, and F/G were determined by weighing pigs and measuring feed disappearance on d 0, 7, 21, and 39.
Data were analyzed as a completely randomized design with pen as the experimental unit. Analysis of variance was performed using the MIXED procedure in SAS (SAS Institute, Inc., Cary, NC). Means were separated using least significant difference (LSD). Results were considered significant at P ≤ 0.05 and considered a trend at P ≤ 0.10.
Results and DiscussionFrom d 0 to 21, pigs fed diets containing 6% SMFM, poultry meal (PM), PEP2+, or PEP-NS had improved (P < 0.05) ADG compared with those fed the negative control diet or diets containing 6% Peptone 50. Pigs fed 6% PEP-NS had increased (P < 0.05) ADG compared with those fed 6% PM. Furthermore, pigs fed 6% SMFM, PM, PEP2+, or PEP-NS had increased (P < 0.05) ADFI compared with those fed the negative control diet. Pigs fed 6% SMFM, PEP2+, and PEP-NS had increased (P < 0.01) ADFI compared with pigs fed diets containing 6% Peptone 50. Pigs fed diets containing 6% SMFM, PM, PEP2+, or PEP-NS had improved (P < 0.05) F/G compared with pigs fed 6% Peptone 50 (Table 4).
During Phase 3 (d 21 to 39), pigs previously fed diets containing 6% PEP2+ or PEP-NS had improved (P < 0.05) ADG compared with those previously fed the negative control diet. Pigs previously fed 6% SMFM, PM, PEP2+, or PEP-NS had increased (P < 0.05) feed intake than pigs previously fed the negative control diet or diets containing 6% Peptone 50. Pigs previously fed the negative control diet and diets containing 6% Peptone 50 had improved (P < 0.05) F/G over those fed 6% SMFM or 6% PEP-NS.
Overall (d 0 to 39), pigs fed diets containing 6% SMFM, PM, PEP2+, or PEP-NS had improved (P < 0.05) ADG and ADFI compared with pigs fed the negative control diet. Pigs fed diets containing 6% SMFM, PEP2+, or PEP-NS had improved (P < 0.05) ADG and ADFI compared with pigs fed diets containing 6% Peptone 50. No signifi-cant differences were observed among treatments for F/G.
In conclusion, PEP2+ and PEP-NS are suitable replacements for fish meal and poultry meal in nursery diets from d 7 to 21 postweaning.

84
Nursery Nutrition and Management
Table 1. Nutrient composition of ingredients (as-fed basis)Item SMFM1, 4 Poultry meal2, 4 PEP2+3, 5 Peptone 503, 5 PEP-NS3, 5
CP, % 62.90 64.10 58.00 52.20 47.50
Amino acids, %Isoleucine 2.57 (94) 6 2.01 (81) 2.67 (88) 2.35 (91) 2.06 (83)Leucine 4.54 (94) 3.89 (80) 4.55 (89) 3.98 (91) 3.78 (72)Lysine 4.81 (95) 3.32 (80) 4.51 (88) 3.53 (91) 3.75 (83)Methionine 1.77 (94) 1.11 (77) 0.97 (88) 0.75 (93) 0.95 (86)Threonine 2.64 (88) 2.18 (77) 2.47 (83) 2.13 (88) 2.06 (77)Tryptophan 0.66 (88) 0.48 (75) 0.68 (87) 0.67 (90) 0.67 (83)Valine 3.03 (93) 2.51 (74) 3.03 (86) 2.55 (89) 2.60 (81)Cysteine 0.57 (88) 0.65 (72) 0.68 (77) 0.61 (88) 0.49 (68)1 Special select menhaden fish meal; Omega Protein Corp., Houston, TX. 2 Poultry meal obtained from Hubbard Feeds, Mankato, MN. 3 TechMix, LLC, Stewart, MN. 4 Nutrient values from NRC (1998). 5 Nutrient values provided by the manufacturer. 6 Parentheses indicate standardized ileal digestible amino acid coefficients (%) used in diet formulation.

85
Nursery Nutrition and Management
Table 2. Composition of diets, Phase 1 (as-fed basis)1
6%
ItemNegative control
Poultry meal2 SMFM3 PEP2+4
Peptone 505 PEP-NS6
Ingredient, %Corn 43.60 44.31 44.78 43.54 43.36 43.48Soybean meal, (46.5% CP) 22.45 16.68 16.69 16.70 16.69 16.70Spray-dried animal plasma 4.50 4.50 4.50 4.50 4.50 4.50Select menhaden fish meal --- --- 6.00 --- --- ---Poultry meal --- 6.00 --- --- --- ---PEP2+ --- --- --- 6.00 --- ---Peptone 50 --- --- --- --- 6.00 ---PEP-NS --- --- --- --- --- 6.00Spray-dried whey 25.00 25.00 25.00 25.00 25.00 25.00Soybean oil 1.00 1.00 1.00 1.00 1.00 1.00Monocalcium P, ( 21% P) 0.85 0.30 0.10 0.75 0.80 0.65Limestone 1.00 0.63 0.60 1.05 1.07 1.13Salt 0.35 0.35 0.35 0.35 0.35 0.35Zinc oxide 0.25 0.25 0.25 0.25 0.25 0.25Vitamin premix7 0.25 0.25 0.25 0.25 0.25 0.25Trace mineral premix7 0.15 0.15 0.15 0.15 0.15 0.15L-Lysine HCl 0.28 0.27 0.12 0.17 0.24 0.23DL-Methionine 0.17 0.16 0.11 0.16 0.18 0.17L-Threonine 0.10 0.10 0.05 0.08 0.11 0.09Phytase7 0.05 0.05 0.05 0.05 0.05 0.05
Total 100 100 100 100 100 100continued

86
Nursery Nutrition and Management
Table 2. Composition of diets, Phase 1 (as-fed basis)1
6%
ItemNegative control
Poultry meal2 SMFM3 PEP2+4
Peptone 505 PEP-NS6
Calculated analysisStandardized ileal digestible (SID) amino acids, %
Lysine 1.40 1.40 1.40 1.40 1.40 1.40Isoleucine:lysine 55 58 54 57 55 56Methionine:lysine 31 31 32 32 33 32Met & Cys:lysine 58 58 58 58 58 58Threonine:lysine 65 65 65 65 65 65Tryptophan:lysine 18 18 17 18 18 18Valine:lysine 65 69 65 68 66 67
Total lysine, % 1.54 1.54 1.56 1.56 1.56 1.54CP, % 21.1 22.1 22.3 21.8 21.2 21.5ME kcal/kg 1,511 1,527 1,511 1,505 1,510 1,506Ca, % 0.82 0.82 0.82 0.82 0.82 0.82P, % 0.71 0.70 0.70 0.70 0.70 0.69Available P, % 0.56 0.56 0.56 0.55 0.56 0.561 Phase 1 diets were fed from d 0 to 7 and were in meal form.2 Poultry meal; Hubbard Feeds, Mankato, MN. 3 Special select menhaden fish meal; Omega Protein Corp., Houston, TX. 4 PEP2; TechMix, LLC, Stewart, MN. 5 Peptone 50; TechMix, LLC, Stewart, MN. 6 PEP-NS; TechMix, LLC, Stewart, MN.7 Natuphos (BASF Animal Nutrition; Mount Olive, NJ) provided 509 FTU/kg, with a release of 0.10 available P.

87
Nursery Nutrition and Management
Table 3. Composition of diets, Phase 2 (as-fed basis) 1
6%
ItemNegative control
Poultry meal2 SMFM3 PEP2+4
Peptone 505 PEP-NS6
Ingredient, %Corn 54.46 54.35 54.81 53.55 53.41 53.53Soybean meal, (46.5% CP) 30.76 25.92 25.89 25.91 25.89 25.88Select menhaden fish meal --- --- 6.00 --- --- ---Poultry meal --- 6.00 --- --- --- ---PEP2+ --- --- --- 6.00 --- ---Peptone 50 --- --- --- --- 6.00 ---PEP-NS --- --- --- --- --- 6.00Spray-dried whey 10.00 10.00 10.00 10.00 10.00 10.00Soybean oil 1.00 1.00 1.00 1.00 1.00 1.00Monocalcium P, (21% P) 1.20 0.60 0.43 1.10 1.15 1.00Limestone 0.88 0.50 0.48 0.93 0.93 1.07Salt 0.35 0.35 0.35 0.35 0.35 0.35Zinc oxide 0.25 0.25 0.25 0.25 0.25 0.25Vitamin premix7 0.25 0.25 0.25 0.25 0.25 0.25Trace mineral premix7 0.15 0.15 0.15 0.15 0.15 0.15L-Lysine HCl 0.35 0.32 0.17 0.22 0.28 0.28DL-Methionine 0.16 0.15 0.10 0.15 0.16 0.15L-Threonine 0.14 0.12 0.08 0.10 0.13 0.11Phytase8 0.05 0.05 0.05 0.05 0.05 0.05
Total 100 100 100 100 100 100continued
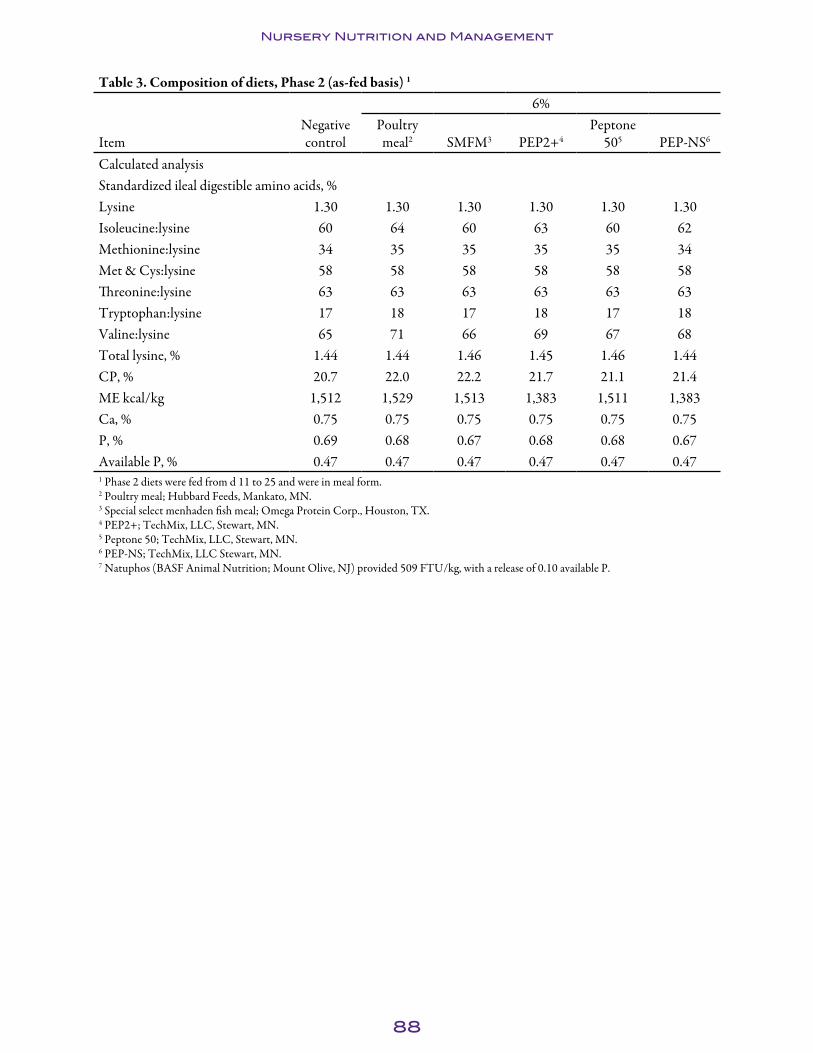
88
Nursery Nutrition and Management
Table 3. Composition of diets, Phase 2 (as-fed basis) 1
6%
ItemNegative control
Poultry meal2 SMFM3 PEP2+4
Peptone 505 PEP-NS6
Calculated analysisStandardized ileal digestible amino acids, %Lysine 1.30 1.30 1.30 1.30 1.30 1.30Isoleucine:lysine 60 64 60 63 60 62Methionine:lysine 34 35 35 35 35 34Met & Cys:lysine 58 58 58 58 58 58Threonine:lysine 63 63 63 63 63 63Tryptophan:lysine 17 18 17 18 17 18Valine:lysine 65 71 66 69 67 68Total lysine, % 1.44 1.44 1.46 1.45 1.46 1.44CP, % 20.7 22.0 22.2 21.7 21.1 21.4ME kcal/kg 1,512 1,529 1,513 1,383 1,511 1,383Ca, % 0.75 0.75 0.75 0.75 0.75 0.75P, % 0.69 0.68 0.67 0.68 0.68 0.67Available P, % 0.47 0.47 0.47 0.47 0.47 0.471 Phase 2 diets were fed from d 11 to 25 and were in meal form.2 Poultry meal; Hubbard Feeds, Mankato, MN. 3 Special select menhaden fish meal; Omega Protein Corp., Houston, TX. 4 PEP2+; TechMix, LLC, Stewart, MN. 5 Peptone 50; TechMix, LLC, Stewart, MN. 6 PEP-NS; TechMix, LLC Stewart, MN. 7 Natuphos (BASF Animal Nutrition; Mount Olive, NJ) provided 509 FTU/kg, with a release of 0.10 available P.

89
Nursery Nutrition and Management
Table 4. Effects of protein source on nursery pig performance1,2
Item Control36%
SMFM46%
poultry56%
PEP2+66%
PEP-NS76%
Peptone 508 SEMInitial wt, lb 12.5 12.4 12.6 12.5 12.4 12.5 ---d 0 to 21
ADG, lb 0.44a 0.53bc 0.51b 0.54bc 0.57c 0.44a 0.02ADFI, lb 0.64a 0.76c 0.71bc 0.76c 0.77c 0.65ab 0.02F/G 1.45ab 1.42a 1.40a 1.40a 1.36a 1.51b 0.03
d 21 to 399
ADG, lb 1.11a 1.17ab 1.18ab 1.20b 1.19b 1.15ab 0.03ADFI, lb 1.77a 1.94b 1.92b 1.96b 2.01b 1.79a 0.04F/G 1.59ab 1.67c 1.63ac 1.64bc 1.68c 1.57a 0.02
d 0 to 39ADG, lb 0.74a 0.82c 0.81bc 0.84c 0.85c 0.76ab 0.02ADFI, lb 1.21a 1.32c 1.31bc 1.34c 1.39c 1.23ab 0.03F/G 1.64 1.60 1.61 1.59 1.59 1.63 0.02
a,b,c Within a row, means without a common superscript differ at P < 0.05.1 A total of 1,152 nursery pigs (initial BW 12.5 lb) were used in a 39-d trial. Pigs were randomly allotted to 1 of 6 dietary treatments with 32 pigs per pen and 6 pens per treatment. 2 Used d 0 body weight as covariate in analysis. 3 4.5% spray dried animal plasma (APC, Ames, IA) from d 0 to 11 and no specialty protein sources from d 11 to 21.4 Select menhaden fish meal; Hubbard Feeds, Mankato, MN. 5 Poultry meal; Hubbard Feeds. 6 PEP2; TechMix, LLC, Stewart, MN. 7 Peptone 50; TechMix, LLC. 8 PEP-NS; TechMix, LLC. 9 Common diet was fed from d 21 to 39.
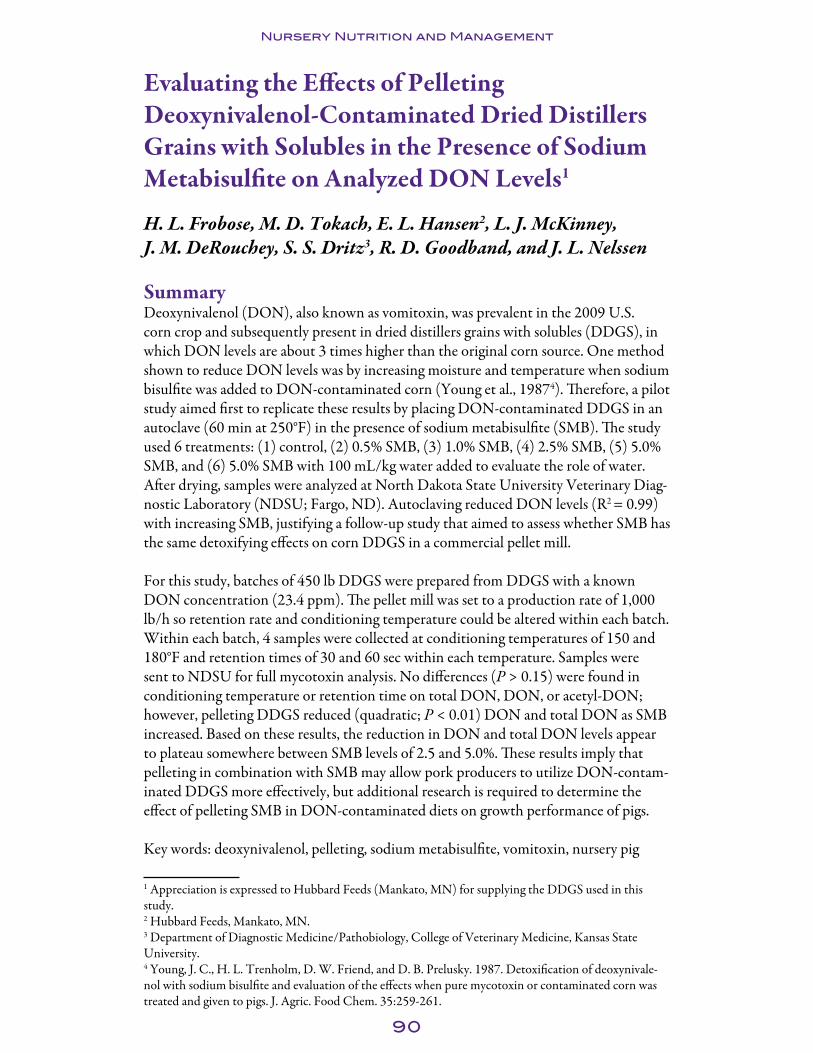
90
Nursery Nutrition and Management
Evaluating the Effects of Pelleting Deoxynivalenol-Contaminated Dried Distillers Grains with Solubles in the Presence of Sodium Metabisulfite on Analyzed DON Levels1
H. L. Frobose, M. D. Tokach, E. L. Hansen2, L. J. McKinney, J. M. DeRouchey, S. S. Dritz3, R. D. Goodband, and J. L. Nelssen
SummaryDeoxynivalenol (DON), also known as vomitoxin, was prevalent in the 2009 U.S. corn crop and subsequently present in dried distillers grains with solubles (DDGS), in which DON levels are about 3 times higher than the original corn source. One method shown to reduce DON levels was by increasing moisture and temperature when sodium bisulfite was added to DON-contaminated corn (Young et al., 19874). Therefore, a pilot study aimed first to replicate these results by placing DON-contaminated DDGS in an autoclave (60 min at 250°F) in the presence of sodium metabisulfite (SMB). The study used 6 treatments: (1) control, (2) 0.5% SMB, (3) 1.0% SMB, (4) 2.5% SMB, (5) 5.0% SMB, and (6) 5.0% SMB with 100 mL/kg water added to evaluate the role of water. After drying, samples were analyzed at North Dakota State University Veterinary Diag-nostic Laboratory (NDSU; Fargo, ND). Autoclaving reduced DON levels (R2 = 0.99) with increasing SMB, justifying a follow-up study that aimed to assess whether SMB has the same detoxifying effects on corn DDGS in a commercial pellet mill.
For this study, batches of 450 lb DDGS were prepared from DDGS with a known DON concentration (23.4 ppm). The pellet mill was set to a production rate of 1,000 lb/h so retention rate and conditioning temperature could be altered within each batch. Within each batch, 4 samples were collected at conditioning temperatures of 150 and 180°F and retention times of 30 and 60 sec within each temperature. Samples were sent to NDSU for full mycotoxin analysis. No differences (P > 0.15) were found in conditioning temperature or retention time on total DON, DON, or acetyl-DON; however, pelleting DDGS reduced (quadratic; P < 0.01) DON and total DON as SMB increased. Based on these results, the reduction in DON and total DON levels appear to plateau somewhere between SMB levels of 2.5 and 5.0%. These results imply that pelleting in combination with SMB may allow pork producers to utilize DON-contam-inated DDGS more effectively, but additional research is required to determine the effect of pelleting SMB in DON-contaminated diets on growth performance of pigs.
Key words: deoxynivalenol, pelleting, sodium metabisulfite, vomitoxin, nursery pig
1 Appreciation is expressed to Hubbard Feeds (Mankato, MN) for supplying the DDGS used in this study.2 Hubbard Feeds, Mankato, MN.3 Department of Diagnostic Medicine/Pathobiology, College of Veterinary Medicine, Kansas State University.4 Young, J. C., H. L. Trenholm, D. W. Friend, and D. B. Prelusky. 1987. Detoxification of deoxynivale-nol with sodium bisulfite and evaluation of the effects when pure mycotoxin or contaminated corn was treated and given to pigs. J. Agric. Food Chem. 35:259-261.

91
Nursery Nutrition and Management
IntroductionThe 2009 corn crop presented challenges for livestock producers due to high concentra-tions of mycotoxins, particularly DON. Deoxynivalenol, also known as vomitoxin, is one of the most abundant members of the group of mycotoxins known as trichothe-cenes, which are produced by fungi of the Fusarium genus. Toxin production is strongly dependent on environmental conditions, especially temperature and humidity, so contamination cannot be avoided completely. In growing pigs, concentrations of DON above 1 ppm are associated with reductions in voluntary feed intake, abnormal diges-tive morphology, and subclinical immune suppression. Nevertheless, swine producers are interested in finding ways to incorporate DON-contaminated feedstuffs into swine diets. When DDGS is produced from DON-contaminated corn, swine producers encounter substantial problems because the DON level in DDGS is 2 to 3 times more concentrated than the original corn source. Due to the particularly high levels and prevalence of DON found in DDGS and other feed grains during so-called Fusarium years such as 2009, the traditional strategy of diluting concentrations during ration formulation may not be a viable option. Furthermore, using adsorbent materials to bind mycotoxins in the digestive tract have proven largely ineffective against mycotoxins in the trichothecene family.
Studies by Young et al. (19875) and Danicke et al. (20046) have both shown significant reductions in DON concentrations when sodium metabisulfite (Na2S2O5) is added prior to hydrothermal treatment of the feedstuff, such as in an autoclave or labora-tory conditioner environment. Young et al. (1987) found that pure DON or DON in naturally contaminated feedstuffs reacts readily with sodium bisulfite, the aqueous form of SMB, to form a 10-sulfonate adduct that showed no acute toxic effects when fed to pigs at levels that caused emesis with DON. The initial goal of this study was to attempt to mimic results seen by Young et al. using an autoclave environment and DDGS as the contaminated feedstuff. Following the proof of concept at the autoclave level, we hypothesized that a commercial pellet mill could provide similar hydrothermal condi-tions through manipulation of retention time and temperature at the conditioner stage of the process. Ultimately, pelleting the original feedstuff or final diet with SMB could be a viable way to decontaminate DON levels and thereby increase the inclusion rate of the DON-contaminated feedstuffs in livestock diets. If SMB is able to detoxify DON effectively, titrating varying concentrations of SMB may reveal the optimal dose for use in livestock diets.
ProceduresAutoclave study. All samples used in this pilot study were prepared at the Kansas State University Swine Nutrition Laboratory, with the samples autoclaved at the K-State Food Science Laboratory.
5 Young, J. C., H. L. Trenholm, D. W. Friend, and D. B. Prelusky. 1987. Detoxification of deoxynivale-nol with sodium bisulfite and evaluation of the effects when pure mycotoxin or contaminated corn was treated and given to pigs. J. Agric. Food Chem. 35:259-261.6 Danicke, S., H. Valenta, M. Gareis, H. W. Lucht, and H. von Reichenbach. 2005. On the effects of a hydrothermal treatment of deoxynivalenol (DON)-contaminated wheat in the presence of sodium metabisulfite (Na2S2O5) on DON reduction and on piglet performance. Anim. Feed Sci. Tech. 118:93-108.

92
Nursery Nutrition and Management
The experiment used 6 DDGS treatments: (1) control, (2) 0.5% SMB, (3) 1.0% SMB, (4) 2.5% SMB, (5) 5.0% SMB, and (6) 5.0% SMB with 100 mL/kg distilled water added to evaluate the role of water in the reaction. Each treatment had a final weight of 500 g per sample, except treatment 6 (550g with water). Samples were split into two replicates and placed in aluminum trays with foil covers, but were not sealed airtight to allow steam interaction and gas release. Samples were autoclaved at 250°F for 60 min. After autoclaving, samples were dried in a 131°F drying oven to convert remaining sample to a DM basis before being sent for mycotoxin analysis.
All samples were sent for full mycotoxin analysis at NDSU and were analyzed using a combination of mass spectrometry, enzyme-linked immunosorbent assay (ELISA), and high-pressure liquid chromatography (HPLC). Samples were prepared from a previously identified, uniform source of DDGS with a known total DON (DON and 15-Acetyl DON) concentration of 23.9 ppm. The DDGS were homogenized thor-oughly prior to sample preparation to eliminate variation in mycotoxin content due to “hot spots” that could cause a discrepancy in initial DON levels. Total DON reflects a combination of DON and 15-Acetyl DON, because both mycotoxins elicit similar effects and are typically combined to form an overall value. Total DON values were adjusted by the proportion of DDGS in the sample to show the actual magnitude of reduction from the original sample.
Pelleting study. This study was conducted at the K-State Grain Sciences and Indus-try Feed Mill. Initially, a 450-lb batch of clean DDGS was pelleted to verify retention times and practice procedures. All personnel involved were required to wear respirators during the pelleting process because sodium metabisulfite gives off toxic sulfur dioxide gas in the presence of heat and moisture.
Treatments comprised 450-lb batches of DDGS after the addition of SMB. DDGS were sourced from 3 tons of bagged contaminated DDGS (23.9 ppm DM), which was provided by Hubbard Feeds (Mankato, MN). The experiment used 4 DDGS treat-ments: (1) control, (2) 1.0% SMB, (3) 2.5% SMB, and (4) 5.0% SMB. Prior to the addition of SMB, each batch was mixed for 4 min in a paddle mixer (Forberg 500 L double-shaft) to homogenize the DDGS and eliminate any variation in initial DON concentration. After adding SMB, each batch was mixed for an additional 3 min before pelleting. The pellet mill (CPM Master Model 1000HD, Crawfordsville, IN) was set to a production rate of 1,000 lb/h so conditioning temperature and retention time could be manipulated within each batch of DDGS. Within each treatment, the pellet conditioner was adjusted so 5-lb samples could be collected at temperatures of 150°F and 180°F and condition times of 30 and 60 sec within each temperature. Pellets were cooled prior to sampling, and the 4 corresponding samples from each batch were ground, homogenized, and sent for mycotoxin analysis at NDSU.
Data were analyzed for linear and quadratic effects of SMB and interactions with temperature and retention time using GenStat Release 11.1 (VBN International, 2009). For all statistical tests, significance and tendencies were set at P < 0.05 and P < 0.10, respectively.

93
Nursery Nutrition and Management
Results and DiscussionAutoclave study. The results of the DON analysis are shown in Table 1. Mycotoxin analysis verified the expected reduction in DON with increasing SMB (R2= 0.99; Figure 1). Deoxynivalenol concentration was reduced by 13.9% by autoclaving the DDGS (control treatment), and the addition of SMB elicited further detoxifying effects, with 5.0% SMB reducing DON by 76.7%. Adding 10% water to the 5.0% level of SMB also aided in detoxifying DON, reducing it by 88.1%, an 11.4% increase from the 5.0% level alone. Overall, the results of the autoclave experiment confirm the results shown by Young et al. The addition of SMB to DON-contaminated DDGS in an autoclave environment can effectively reduce analyzed DON levels, and the volume of water appears to affect the extent of the detoxification. Although autoclaving DDGS with SMB can substantially decrease DON levels, whether similar results will be seen in commercially viable conditions, such as by adding SMB to DDGS prior to pelleting, remains uncertain. Additionally, whether reductions in analyzed DON levels translate to improvements in animal performance remains unclear.
Pelleting study. Results from DON analysis are shown in Table 2. During the pelleting process, the addition of SMB caused a considerable amount of gas to be produced from the pellet mill, and the gas generated a very strong odor and irritation to both the eyes and respiratory tract. Whenever utilizing SMB at levels used in this study in combina-tion with hydrothermal treatment, wearing a full respirator within direct vicinity of the pellet mill is critical.
Conditioning temperature had no effect on total DON, DON, or acetyl-DON levels. Additionally, total DON, DON, and acetyl-DON levels were similar across both 30- and 60-sec retention times in the pellet conditioner, so these data are not presented.
Pelleting DDGS reduced (quadratic, P < 0.001) DON and total DON levels as SMB inclusion rate increased. According to these results, the reduction in DON and total DON levels appears to plateau somewhere between 2.5% and 5.0% SMB. These results imply that pelleting in combination with SMB may allow swine producers to utilize DON-contaminated DDGS more effectively. Additionally, DON concentrations appear to be reduced in the presence of SMB without requiring adjustment of retention time or conditioning temperature at the pellet mill, simplifying procedures for opera-tors; however, additional research is required to determine if pelleting with SMB can reduce vomitoxin levels in final diets rather than only in individual ingredients such as DDGS. Also, further investigation needs to be conducted into the effects of pelleting with SMB in DON-contaminated diets on the growth performance of pigs.

94
Nursery Nutrition and Management
Table 1. Effects of sodium metabisulfite (SMB) and autoclave on deoxynivalenol (DON) levels in dried distillers grains with solubles (DDGS; DM basis)1
SampleSMB2 added,
%
Water added, mL/kg of
DDGS DON, ppm15-acetyl
DON, ppmTotal adjusted DON3, ppm
DON remaining, %
1 0 --- 18.2 2.4 20.6 86.12 0.5 --- 16.5 2.3 18.9 79.03 1.0 --- 14.5 2.0 16.7 69.74 2.5 --- 7.5 2.0 9.7 40.75 5.0 --- 3.5 1.8 5.6 23.36 5.0 100 1.2 1.5 2.8 11.9
DDGS4 0 --- 20.6 3.3 23.9 100.0¹ DDGS samples were autoclaved for 60 min at 250°F. After autoclaving, samples were dried in a 131°F drying oven. Mycotoxin analysis took place at the North Dakota State University Veterinary Diagnostic Laboratory (Fargo, ND) and included mass spectrometry, ELISA (enzyme-linked immunosorbent assay), and HPLC (high-pressure liquid chromatography) methods.2 Sodium metabisulfite (Samirian Chemicals, Campbell, CA); 100% by weight.3 Total adjusted DON = (DON + 15-acetyl DON)/% DDGS in sample (needed to correct for the dilution effect of the addition of SMB). Both DON compounds have similar toxicity, and are typically combined to form an overall DON value.4 Original DDGS sample (90.1% DM). DON levels are converted to a DM basis.
Table 2. Effect of pelleting temperature (Temp) and dose of sodium metabisulfite (SMB) on deoxynivalenol (DON) and acetyl-DON in diets containing corn dried distillers grains with solubles (DDGS) naturally contami-nated with DON1
Sodium metabisulfite, % Probability, P <2
Temp, ºF 0 1.0 2.5 5.0 SED3 Temp Linear4 Quad4
Total DON, ppm5 150 23.2 12.8 8.2 6.0 1.52 0.25 0.001 0.001180 21.5 11.5 7.0 6.5
DON, ppm5 150 20.5 10.2 5.6 3.3 1.29 0.15 0.001 0.001180 18.7 9.0 4.2 3.6
Acetyl DON, ppm5 150 2.7 2.6 2.7 2.8 0.42 0.74 0.45 0.64180 2.8 2.5 2.8 3.0
1 No significant effect (P > 0.40) for retention time in pellet conditioner, thus data are not shown.2 No significant temp × SMB interactions (P > 0.69).3 Standard error of the difference for the temp × SMB interaction. For SED for effect of Temp and SMB, multiply by 0.50 and 0.71, respectively. 4 Linear and quadratic effects of SMB.5 Samples analyzed at North Dakota State University Veterinary Diagnostic Laboratory (Fargo, ND) using a variety of mass spectrometry, ELISA (enzyme-linked immunosorbent assay), and HPLC (high-pressure liquid chromatography).
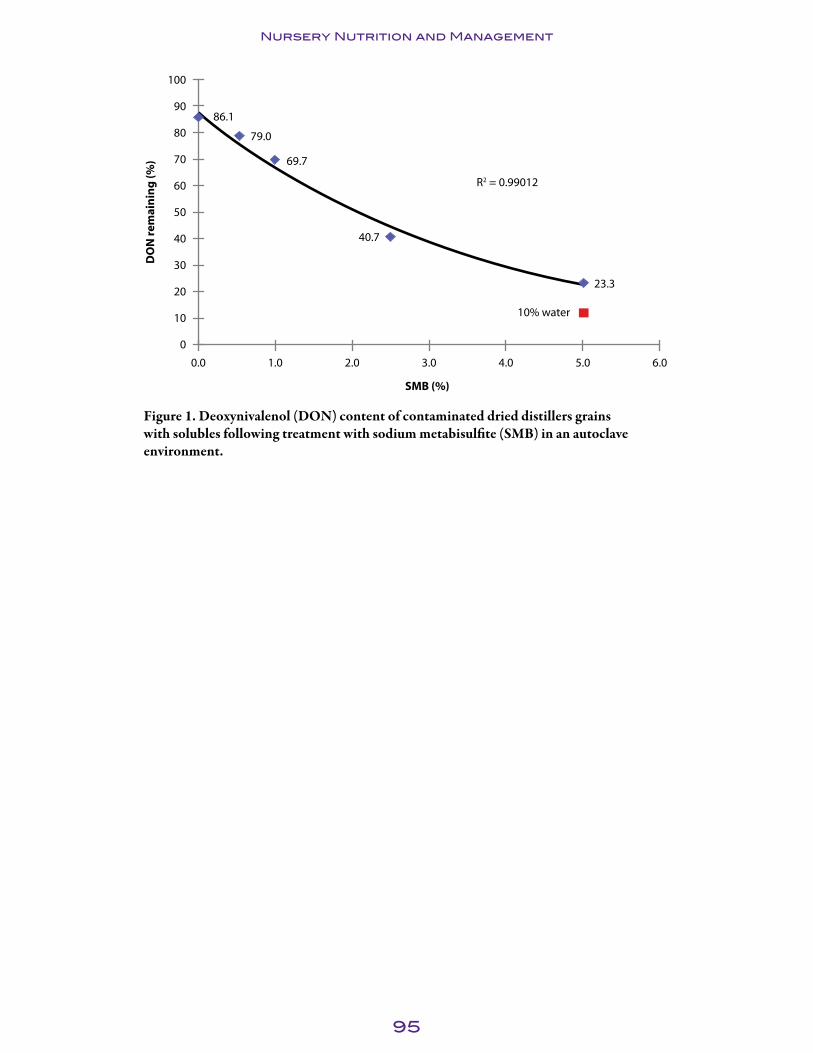
95
Nursery Nutrition and Management
DO
N r
emai
nin
g (%
)
100
90
80
70
60
50
40
30
20
10
0
6.03.02.01.00.0
SMB (%)
R2 = 0.99012
10% water
5.04.0
23.3
40.7
69.7
79.0
86.1
Figure 1. Deoxynivalenol (DON) content of contaminated dried distillers grains with solubles following treatment with sodium metabisulfite (SMB) in an autoclave environment.

96
Nursery Nutrition and Management
Evaluating the Effects of Pelleting, Corn Dried Distillers Grains with Solubles Source, and Supplementing Sodium Metabisulfite in Nursery Pig Diets Contaminated with Deoxynivalenol1
H. L. Frobose, M. D. Tokach, E. L. Hansen2, J. M. DeRouchey, S. S. Dritz3, R. D. Goodband, and J. L. Nelssen
SummaryA total of 360 barrows (PIC 1050, initially 24.7 lb ± 0.3 lb BW and 35 d of age) were used in a 28-d trial examining the effects of pelleting, pelleting dried distillers grains with solubles (DDGS), and supplementing sodium metabisulfite4 (SMB) in diets containing deoxynivalenol (DON) on nursery pig performance. Pigs were allotted to 1 of 10 treatments with 7 replications per treatment (pens) and 5 pigs per pen. Naturally contaminated DDGS were used to incorporate DON at desired concentrations. Ingre-dients were tested for mycotoxins by the North Dakota State University Veterinary Diagnostic Laboratory (NDSU; Fargo, ND) and served as the basis for diet formula-tion. The 5 experimental diets were fed in meal and pellet form: (1) positive control, (2) negative control (NC, 5.3 ppm DON), (3) NC with 0.5% SMB, (4) pelleted and reground DDGS (5.3 ppm DON), and (5) pelleted and reground DDGS with 2.5% SMB (final diet contained 0.5% SMB). Experimental diets were fed from d 0 to 21 with a common diet fed from d 21 to 28 to evaluate performance after DON was removed. Due to the variability of DON assays when levels exceed 8 ppm, final diets were lower in DON than predicted from analysis of the DDGS. As a result, expected reductions in performance due to DON were not as significant as anticipated, and may have affected results. From d 0 to 21, pigs fed diets with high-DON levels had decreased (P < 0.03) ADG, but the reduction in ADG was only 4%. Pelleting high-DON diets decreased (P < 0.04) ADFI and improved (P < 0.02) F/G compared with diets fed in meal form; however, pelleting DDGS prior to manufacturing final diets had no effect on growth performance. Supplementing SMB tended (P < 0.08) to decrease ADFI, and had no effect on ADG or F/G.
Our results indicate that pelleting high-DON nursery pig diets can recover some reduc-tion in feed intake by improving F/G. Although pelleting DDGS and supplementing SMB did not improve performance in DON-contaminated diets, further studies are needed to verify these results.
Key words: deoxynivalenol, pelleting, sodium metabisulfite, vomitoxin, nursery pig
1 Appreciation is expressed to Hubbard Feeds (Mankato, MN) for supplying the DDGS used in this study.2 Hubbard Feeds, Mankato, MN.3 Department of Diagnostic Medicine/Pathobiology, College of Veterinary Medicine, Kansas State University.4 Sodium metabisulfite, (Na2S2O5), Samirian Chemicals, Campbell, CA; 100% by weight.

97
Nursery Nutrition and Management
IntroductionMycotoxins produced by the Fusarium species present significant challenges globally because weather conditions at the time of cereal flowering ultimately control toxin production. Of the Fusarium toxins, deoxynivalenol (DON, also known as vomitoxin) is of particular importance, because it can be found in toxicologically relevant concen-trations that negatively affect farm animal species. Among the most sensitive species are pigs, with concentrations above 1 ppm eliciting a decrease in feed intake and higher levels causing subclinical immune suppression, feed refusal, and vomiting. During so-called Fusarium years, such as 2009, when DON levels cause significant problems, swine producers struggled to find ways to incorporate DON-contaminated feedstuffs into swine diets. Dried distillers grains with solubles produced from DON-contam-inated corn also presents considerable problems because mycotoxins become 2 to 3 times more concentrated in the DDGS than in the original corn source.
The use of adsorbent feed additives to bind mycotoxins in the digestive tract has shown promise for some mycotoxins, but their efficacy against DON has until now proven ineffective. Other detoxification approaches involve using chemical and/or physical treatments of contaminated feedstuffs before feeding. Young et al. (1987)5 demon-strated that in an autoclave, aqueous sodium bisulfite converted DON to a 10-sulfonate adduct (DON-S), which reduced the toxicity of DON-contaminated corn when fed to pigs and subsequent feed intake matched the level of the control group. A recent study (see “Evaluating the Effects of Pelleting Deoxynivalenol-Contaminated Dried Distill-ers Grains with Solubles in the Presence of Sodium Metabisulfite on Analyzed DON Levels,” p. 90) at Kansas State University attempted to mimic these processing condi-tions in both an autoclave environment as well as in a commercial pellet mill. Deoxyni-valenol levels in contaminated DDGS were significantly reduced after pelleting in the presence of sodium metabisulfite (SMB).
Although pelleting with SMB appears to detoxify contaminated DDGS, whether these methods are able to detoxify DON levels in final diets after incorporation of additional ingredients is uncertain. Furthermore, the effects of pelleting DON-contaminated diets in the presence SMB on nursery pig performance are unknown. The goal of this study was to ascertain the influence of both SMB and pelleting DDGS or complete diets containing DON on nursery pig performance. Additionally, this study aimed to deter-mine whether an interaction exists between pelleting and sodium metabisulfite in both DDGS and final diets that are contaminated with DON.
ProceduresThe Kansas State University Institutional Animal Care and Use Committee approved the protocol used in this experiment. The study was conducted at the K-State Segre-gated Early Weaning Research Facility in Manhattan, KS.
A total of 360 barrows (PIC 1050, initially 24.7 lb ± 0.3 lb BW and 35 d of age) were used in a 28-d growth trial. Pigs were allotted to pens by initial weight, and pens were assigned to 1 of 10 treatments in a 2 × 2 × 2 + 2 randomized complete block design,
5 Young, J. C., H. L. Trenholm, D. W. Friend, and D. B. Prelusky. 1987. Detoxification of deoxynivale-nol with sodium bisulfite and evaluation of the effects when pure mycotoxin or contaminated corn was treated and given to pigs. J. Agric. Food Chem. 35:259-261.

98
Nursery Nutrition and Management
with location in the barn serving as the blocking factor. Each treatment comprised 7 replications (pens) with 5 pigs per pen, and each pen (4 ft by 4 ft) contained a 4-hole dry self-feeder and 1-cup waterer to provide ad libitum access to feed and water.
To naturally incorporate DON at desired concentrations, both a clean and a contami-nated source of DDGS were supplied by Hubbard Feeds (Mankato, MN) to incor-porate DDGS into the test diets at equivalent levels. Base corn and the two sources of DDGS were tested for mycotoxin content at NDSU (Table 1) prior to diet manufac-turing. These results were used in diet formulation. Diets were manufactured at the K-State Grain Science Feed Mill. Due to the release of sulfur dioxide gas during pellet-ing of SMB, all personnel were required to wear respirators and safety goggles to prevent eye or lung damage from the gas. For diets requiring DDGS to be pelleted (7 through 10), the DDGS were pelleted prior to diet manufacturing and re-ground through a hammer mill to ensure no particle segregation at the feeder. Diets requiring the addi-tion of SMB were homogenized for 4 min in a paddle mixer prior to and 3 min after SMB addition to eliminate any discrepancies in initial DON level. For both DDGS and final diets, the pellet conditioner was adjusted to a conditioning temperature of 180°F and a retention time of 30 sec. Pellets were cooled prior to sampling, then reground if in pellet form, and 10 subsamples were collected and compiled to make a composite sample that was shipped to NDSU for a full mycotoxin analysis.
Initially, all pigs were fed a commercial SEW diet with a budget of 2 lb/pig followed by a commercial transition diet for the first 7 d postweaning. From d 7 to 14 postweaning, Phase 2 diets were fed. Starting on d 14 (d 0 of the experiment), the 10 experimental treatments (Table 2) were fed to the pigs. Apart from DON and SMB content, diets were formulated to be identical in nutrient composition, and all diets contained a total of 20% DDGS. Based on the initial mycotoxin analysis of base ingredients, 5 experi-mental diets were fed in meal and pellet form. These included: (1) positive control (PC), (2) negative control (NC, 5.3 ppm DON), (3) NC with 0.5% SMB, (4) pelleted DDGS (5.3 ppm DON), and (5) pelleted DDGS with 2.5% SMB (final diet contained 0.5% SMB). Experimental diets were fed from d 0 to 21. A common diet (<0.5 ppm DON) was fed in meal form from d 21 to 28 to evaluate the change in performance immediately after removing DON from the diet. Average daily gain, ADFI, and F/G were determined by weighing pigs and measuring feed disappearance on d 3, 7, 14, 21, and 28 of the trial.
Results were analyzed as a randomized complete block design with a 3-way factorial treatment structure by using the PROC MIXED procedure of SAS (SAS Institute, Inc., Cary, NC) with pen as the experimental unit. Treatment means were separated using the LSMEANS statement and CONTRAST statements in SAS. Two-way interactions between final diet form and DON level were evaluated in positive and negative control treatments. Two- and three-way interactions within high-DON treatments compared final diet form, pelleting DDGS prior to final diets, and SMB inclusion. Means were considered significant at P < 0.05 and trends at P < 0.10.
Results and DiscussionThe DON analyses of the basal ingredients and test diets are shown in Table 2. Deoxynivalenol values for contaminated DDGS sample varied from 26.5 ppm, the basis

99
Nursery Nutrition and Management
of diet formulation, to analyzed levels of 9.7 and 17.9 ppm when analysis was performed again after diet manufacturing. The variation in DON assay results is because the test is designed to analyze samples accurately at 8 ppm or below. When DON levels exceed 8 ppm, samples must be diluted and re-analyzed at laboratory level to quantify actual levels; therefore, at levels exceeding 8 ppm, the variability of results can be significantly greater, as seen in the 3 samples of contaminated DDGS sent for analysis (Table 1). Because of variability in initial mycotoxin analyses, incorporating a high enough level of DON during formulation to generate a true DON response is critical in future studies evaluating strategies to improve growth performance in high-DON containing diets.
When contaminated DDGS were pelleted with SMB individually or only in the final diet, analyzed DON levels were reduced from initial concentrations, which supports observations of detoxification by Young et al. (1987), and the conversion of DON to a DON-S form undetected by standard DON assays. However, test diets without SMB formulated to be 5.3 ppm were analyzed at levels between 3.0 and 3.3 ppm, raising concerns about the extent of expected performance reduction in pigs fed NC diets. Diets 7 and 8, where DDGS was pelleted without SMB prior to final diet manufactur-ing, also had slightly lower analyzed DON levels, indicating that pelleting alone may somewhat detoxify DON, but not to the extent of pelleting with SMB.
The growth performance of nursery pigs fed the 10 dietary treatments is shown in Table 3. Statistical analysis also revealed no 2-way interactions between DON level and pelleting in PC and NC diets. No 2- or 3-way interactions occurred within high-DON diets, so they are not reported in Table 3. The PC and NC diets were compared to assess the direct effect of DON and pelleting. High-DON levels decreased (P < 0.01) ADFI and tended (P < 0.06) to decrease ADG between d 0 and 21; however, the DON effect was not as large as expected at only 4% reduction, likely due to the lower than formu-lated DON levels in NC diets. The common diet period (d 21 to 28) did not affect ADG or ADFI in pigs previously fed high-DON diets, although pigs fed PC diets had better (P < 0.03) F/G in this subsequent period. In previous studies, pigs previously fed high-DON diets experienced compensatory performance during the common diet period with higher ADFI and ADG than pigs fed PC diets. The lack of compensatory growth is another indication that DON levels in NC diets did not produce reductions in performance expected in pigs fed high DON levels. Overall (d 0 to 28), pigs fed NC diets had lower (P < 0.03) ADG, but ADFI and F/G did not differ. Feeding high-DON diets reduced (P < 0.04) pig BW at d 21 and BW remained lower (P < 0.02) at d 28 than pigs fed PC diets.
From d 0 to 21, comparing final diet form, pelleting PC, and NC diets decreased (P < 0.01) ADFI and improved (P < 0.02) F/G with no difference in ADG. Pigs previ-ously fed pelleted diets tended (P < 0.07) to have decreased ADFI when switched to meal diets during the common diet period, but the switch had no effect on ADG or F/G. Overall, pelleting PC and NC diets decreased (P < 0.01) ADFI and improved (P < 0.02) F/G compared with meal diets. No differences occurred in pig BW at d 21 or 28 due to pelleting. Within treatments formulated to contain high levels of DON (diets 3 to 10), the effects of pelleting, pelleting DDGS, and SMB were examined. Pigs fed pelleted diets tended (P < 0.06) to have lower ADFI and had improved (P < 0.01) F/G than pigs fed meal

100
Nursery Nutrition and Management
diets from d 0 to 21, but there was no difference in ADG. When all pigs were switched to a common meal diet from d 21 to 28, pigs previously fed pelleted diets had increased (P < 0.03) ADG compared with those fed meal diets throughout the trial, but ADFI and F/G were similar. Overall, pigs fed pelleted diets had decreased (P < 0.04) ADFI but improved (P < 0.02) F/G. No differences were measured in pig BW at d 21 or 28.
When evaluating DDGS processing prior to final diet manufacturing, pelleting high-DON DDGS had no effect on ADG, ADFI, F/G, or pig weights in any period. Supple-menting SMB to high-DON diets tended (P < 0.08) to decrease daily feed intake during the experimental period (d 0 to 21), but ADG and F/G were similar. From d 21 to 28, pigs previously fed SMB had decreased (P < 0.04) ADG and tended (P < 0.10) to have decreased ADFI, with no difference in F/G. Overall, supplementing 0.5 % SMB to nursery pigs had no effect on ADG, ADFI, F/G, or pig BW.
In summary, obtaining correct DON analysis and providing an adequate level in formu-lation is crucial to obtain a great enough DON response to adequately test amelioration strategies. In this study, DON levels in negative control diets were approximately 3 ppm, and expected reductions in growth performance were not as great as anticipated; however, pelleting high-DON nursery pig diets can overcome some of the reduction in feed intake by improving F/G. Furthermore, pelleting DDGS prior to diet manu-facturing had no effect on performance. Although analyzed DON levels were reduced by supplementing 0.5% SMB, SMB tended to decrease feed intake, which may indi-cate that the conversion to DON-S is not truly a non-toxic form of DON, or could also indicate palatability issues when including SMB in nursery pig diets. Additional research should be carried out with a greater negative DON response to reinforce these results.

101
Nursery Nutrition and Management
Table 1. Analyzed deoxynivalenol (DON) concentration in diet samples (as-fed basis)1,2
Item Initial AnalyzedBasal ingredients, ppm
Ground corn <0.5 -3
Control dried distillers grains with solubles (DDGS) 0.7 0.6Contaminated DDGS 26.5 9.7, 17.94
Contaminated DDGS, pelleted final diet form - 7.4Contaminated DDGS, pelleted prior to final diet - 3.0
Test diets, ppm Formulated Analyzed1 Positive control, meal 0.0 <0.52 Positive control, pellet 0.0 0.53 Negative control, meal 5.3 3.24 Negative control, pellet 5.3 3.25 Negative control, meal [0.5% SMB] 5.3 3.36 Negative control, pellet [0.5% SMB] 5.3 0.77 Pelleted DDGS, meal 5.3 3.08 Pelleted DDGS, pellet 5.3 1.99 Pelleted DDGS [2.5% SMB], meal 5.3 2.810 Pelleted DDGS [2.5% SMB], pellet 5.3 0.5¹ Reported total DON levels as a combination of DON and 15-acetyl DON levels.2 North Dakota State University Veterinary Diagnostic Laboratory, Fargo, ND. Samples were analyzed using a variety of mass spectrometry, ELISA (enzyme-linked immunosorbent assay), and HPLC (high-pressure liquid chromatography).3 (-) indicates sample was not analyzed at this time.4 After analyzed at 9.7 ppm, the contaminated DDGS sample was reanalyzed due to the major difference from initial value.

102
Nursery Nutrition and Management
Table 2. Diet composition (as-fed basis)1
ItemPositive control
Negative control
Negative control +
SMBPelleted DDGS2
Pelleted DDGS +
SMBCommon Phase 33
Ingredient, %Corn 48.77 48.77 48.23 48.77 48.23 48.77Soybean meal (46.5% CP) 27.98 27.98 28.02 27.98 28.02 27.98Control DDGS (26.3% CP) 20.00 - - - - 20.00Contaminated DDGS (26.4% CP) - 20.00 20.00 20.00 - -Contaminated DDGS (2.5% SMB) - - - - 20.50 -Monocalcium P (21% P) 0.60 0.60 0.60 0.60 0.60 0.60Limestone 1.20 1.20 1.20 1.20 1.20 1.20Salt 0.35 0.35 0.35 0.35 0.35 0.35Copper sulfate 0.05 0.05 0.05 0.05 0.05 0.05Vitamin premix 0.25 0.25 0.25 0.25 0.25 0.25Trace mineral premix 0.15 0.15 0.15 0.15 0.15 0.15L-Lysine HCl 0.40 0.40 0.40 0.40 0.40 0.40DL-Methionine 0.05 0.05 0.05 0.05 0.05 0.05L-Threonine 0.08 0.08 0.08 0.08 0.08 0.08Phytase4 0.13 0.13 0.13 0.13 0.13 0.13Sodium metabisulfite5 - - 0.50 - - -
Total 100 100 100 100 100 100continued

103
Nursery Nutrition and Management
Table 2. Diet composition (as-fed basis)1
ItemPositive control
Negative control
Negative control +
SMBPelleted DDGS2
Pelleted DDGS +
SMBCommon Phase 33
Calculated composition, %Standardized ileal digestible (SID) amino acids, %
Lysine 1.27 1.27 1.27 1.27 1.27 1.27 Isoleucine:lysine 64 64 64 64 64 64Leucine:lysine 148 148 148 148 148 148Methionine:lysine 30 30 30 30 30 30Met & Cys:lysine 58 58 58 58 58 58Threonine:lysine 62 62 62 62 62 62Tryptophan:lysine 17.1 17.1 17.1 17.1 17.1 17.1Valine:lysine 73 73 73 73 73 73
Total lysine, % 1.44 1.44 1.44 1.44 1.44 1.44 ME, kcal/lb 1,506 1,506 1,506 1,506 1,506 1,506SID lysine:ME, g/Mcal 3.83 3.83 3.83 3.83 3.83 3.83CP, % 22.9 22.9 22.9 22.9 22.9 22.9Ca, % 0.70 0.69 0.69 0.69 0.69 0.70P, % 0.60 0.61 0.61 0.61 0.61 0.60Available P, % 0.42 0.43 0.43 0.43 0.43 0.42Deoxynivalenol, ppm6 0.14 5.30 5.30 5.30 5.30 0.141 Diets were fed in meal and pellet form.2 Dried distillers grains with solubles. 3 Common diet was fed from d 21 to 28.4 Natuphos 600 (BASF Corporation, Florham Park, NJ).5 Sodium metabisulfite, Samirian Chemicals, Campbell, CA; 100% by weight.6 Formulated deoxynivalenol (DON) level from control and contaminated DDGS was analyzed at North Dakota State University Veterinary Diag-nostic Laboratory prior to diet manufacturing with DON levels of 0.7 and 26.5 ppm, respectively.

104
Nu
rs
er
y N
ut
rit
ion
an
d M
an
ag
em
en
t
Table 3. Effect of pelleting, dried distillers grains with solubles (DDGS) source, and sodium metabisulfite (SMB) on growth performance of nursery pigs fed deoxynivalenol (DON)-contaminated diets1 DON level2 < 0.5 ppm 5.3 ppm Probability, P <3
Positive control
Negative control NC4 + SMB5 Pellet DDGS
Pellet DDGS + SMB6 PC vs. NC4 High-DON Diets
Diet form M P M P M P M P M P SEM DONPellet
vs. mealPellet
vs. mealPelleted DDGS SMB
d 0 to 21ADG, lb 1.36 1.32 1.29 1.26 1.25 1.29 1.30 1.32 1.27 1.31 0.033 0.06 0.30 0.44 0.25 0.54ADFI, lb 2.12 1.96 1.96 1.88 1.89 1.84 1.99 1.94 1.94 1.89 0.042 0.01 0.01 0.06 0.13 0.08F/G 1.56 1.48 1.52 1.49 1.52 1.43 1.53 1.47 1.53 1.44 0.022 0.41 0.02 0.01 0.92 0.13
d 21 to 287
ADG, lb 1.77 1.75 1.72 1.68 1.84 1.75 1.76 1.73 1.86 1.72 0.053 0.20 0.61 0.03 0.55 0.04ADFI, lb 3.69 3.44 3.76 3.61 3.92 3.81 3.61 3.71 3.82 3.66 0.114 0.29 0.07 0.29 0.33 0.10F/G 2.09 1.97 2.19 2.15 2.13 2.19 2.07 2.15 2.05 2.13 0.062 0.03 0.19 0.32 0.13 0.74
d 0 to 28ADG, lb 1.46 1.43 1.40 1.37 1.40 1.40 1.42 1.42 1.41 1.42 0.028 0.03 0.25 0.84 0.21 0.78ADFI, lb 2.51 2.33 2.41 2.31 2.39 2.33 2.39 2.38 2.40 2.33 0.420 0.16 0.01 0.04 0.66 0.72F/G 1.72 1.63 1.72 1.69 1.72 1.66 1.69 1.67 1.70 1.65 0.025 0.18 0.02 0.02 0.21 0.43
BW, lbd 0 24.6 24.9 24.7 24.7 24.9 24.9 24.7 24.7 24.5 24.5 0.29 0.95 0.22 0.82 0.06 0.78d 21 53.3 53.0 51.9 51.3 51.1 52.5 52.1 52.9 51.4 52.0 0.73 0.04 0.55 0.29 0.40 0.58d 28 65.6 65.3 63.9 63.1 64.0 64.7 64.4 65.0 64.5 64.1 0.87 0.02 0.48 0.96 0.34 0.72
1 A total of 360 barrows (initial BW of 24.7 lb ± 0.3 lb BW and 35 d of age), with 5 pigs per pen and 7 replicates per treatment.2 Formulated deoxynivalenol (DON) levels of <0.5 and 5.3 ppm total DON. Analyzed DON levels are shown in Table 2.3 All interactions were excluded from the table due to lack of significance.4 NC, negative control; PC, positive control.5 Treatments contained a final level of 0.5% SMB added during final diet manufacturing.6 Treatments had 2.5% SMB added prior to pelleting DDGS; final SMB level of 0.5%.7 A common diet was fed from d 21 to 28.

105
Nursery Nutrition and Management
Evaluating the Effects of Pelleting, Dried Distillers Grains with Solubles Source, and Supplemental Sodium Metabisulfite in Nursery Pig Diets Contaminated with Deoxynivalenol1
H. L. Frobose, E. D. Fruge2, M. D. Tokach, E. L. Hansen2, J. M. DeRouchey, S. S. Dritz3, R. D. Goodband, and J. L. Nelssen
SummaryA total of 1,180 mixed sex pigs (initial BW = 24.4 ± 0.7 lb and 35 d of age) were used in a 21-d trial evaluating the effects of pelleting, pelleting dried distillers grains with solubles (DDGS), and the influence of sodium metabisulfite4 (SMB) in diets contain-ing deoxynivalenol (DON; commonly referred to as vomitoxin) on nursery pig growth performance. This study was conducted simultaneously at two locations: (1) Kansas State University Swine Teaching and Research Center (PIC 337 ×1050) in Manhattan, KS, and (2) New Fashion Pork Research Nursery (Fast/PIC × TR4) in Buffalo Center, IA. At both locations, pigs were assigned to 1 of 7 treatments in a completely random-ized design 2 × 3 +1 arrangement. Apart from the positive control diet at location 1 (4 replications), there were 5 replications (pens) per treatment at each research site, with 5 and 28 pigs per pen at location 1 and 2, respectively.
Initial mycotoxin analyses were conducted at NDSU5 on the main ingredients, and these results were used in diet formulation. Seven treatments were formulated based on 3 diets fed in meal and pellet form: (1) Positive control; (2) negative control (5.5 ppm DON); and (3) pelleted and crumbled DDGS (5.5 ppm DON); as well as a seventh treatment, based on diet 3 but with 2.5% SMB added prior to pelleting DDGS, fed in meal form (5.5 ppm DON). Following feed manufacturing for both locations at Hubbard Feeds (Mankato, MN), ingredients and diets were analyzed at NDSU. Over-all (d 0 to 21), DON reduced (P < 0.01) ADG, ADFI, and pig BW; however, ADG, ADFI and pig BW improved (P < 0.01) when DON-contaminated diets were pelleted. When comparing high-DON DDGS processing prior to final diet manufacturing, pelleting DDGS had no effect on ADG, ADFI, F/G, or pig final BW, although there was an interaction in which pelleting final diets improved (P < 0.05) F/G by a greater margin than pelleting DDGS, then crumbling and repelleting in the final diet. Adding SMB prior to pelleting DDGS increased (P < 0.01) ADG, ADFI, and overall pig BW. Pelleting of diets can improve growth and F/G and thereby offset some of the reduc-tions in performance when feeding high-DON containing diets.
Key words: deoxynivalenol, pelleting, sodium metabisulfite, vomitoxin, nursery pig
1 Appreciation is expressed to New Fashion Pork (Buffalo Center, IA) for the use of pigs and facilities and to Hubbard Feeds for diet manufacturing, feed contribution, and technical support. 2 Hubbard Feeds, Mankato, MN. 3 Department of Diagnostic Medicine/Pathobiology, College of Veterinary Medicine, Kansas State University.4 Sodium metabisulfite, (Na2S2O5), Samirian Chemicals, Campbell, CA; 100% by weight.5 North Dakota State University Veterinary Diagnostic Laboratory, Fargo, ND.
106
Nursery Nutrition and Management
IntroductionHigh concentrations of mycotoxins, especially vomitoxin, were present in the 2009 corn crop. Deoxynivalenol (DON), also known as vomitoxin, develops with overabun-dant moisture during corn’s flowering period. Deoxynivalenol is directly associated with the plant pathogens Fusarium graminearum (Gibberella zeae) and F. culmorum, the causative agents for Fusarium head blight in wheat and Gibberella ear rot in corn. Among livestock species, pigs are particularly susceptible to deoxynivalenol contamina-tion, which can cause reductions in performance, subclinical immune suppression and, in high concentrations, vomiting and feed refusal. Dried distillers grains with solubles (DDGS), a by-product of the ethanol industry, also presents significant problems for swine producers because mycotoxin levels are 2 to 3 times more concentrated than in the original corn source.
In an effort to utilize the DON-contaminated corn crop as a feedstuff, a variety of feed additives were tested to mitigate negative performance seen in diets containing DON. Although it is most commonly used as a preservative or cleaning agent, previ-ous research has indicated that SMB can lower DON levels in feed, especially when applied in conjunction with heat treatment. When mixed with water, SMB produces sulfur dioxide gas. Young et al. (19876) demonstrated that in an autoclave, aqueous sodium bisulfite converted DON to a 10-sulfonate adduct (DON-S), which reduced the toxicity of DON-contaminated corn when fed to pigs, and feed intake increased to that of the control group. A recent experiment at Kansas State University (see “Evaluat-ing the Effects of Pelleting Deoxynivalenol-Contaminated Dried Distillers Grains with Solubles in the Presence of Sodium Metabisulfite on Analyzed DON Levels,” p. 90) has shown that SMB has the same detoxifying effects using naturally contaminated DDGS in a commercial pellet mill. Additionally, a study by Hansen et al. (2010, unpublished data) showed improved ADG in pigs fed pelleted high-DON diets, but no response from adding SMB to the diet. Thus, this study’s main focus was to determine what effect pelleting either the final diet or the contaminated DDGS had on the growth performance of nursery pigs fed high-DON diets. An additional treatment including SMB was added to gather further data on SMB’s effect when pelleted in high-DON diets.
ProceduresThe Kansas State University Institutional Animal Care and Use Committee approved the protocol used in this experiment. The study was conducted concurrently at 2 loca-tions: (1) K-State Swine Teaching and Research Center in Manhattan, KS, and (2) New Fashion Pork (NFP) Research Nursery in Buffalo Center, IA.
At the K-State site, a total of 238 mixed sex pigs (PIC 337 × 1050, initially 25.3 lb ± 0.4 lb BW and 35 d of age) were used in a 21-d growth trial with 5 replicates per treatment (pens) and 7 pigs (4 barrows, 3 gilts) per pen; based on limited pen avail-ability, 1 treatment (positive control, mash) had 4 replicate pens. Pigs were allotted to pens by initial weight at weaning, and when pigs reached approximately 25 lb, they were reweighed and pen average pig weight was balanced across 1 of 7 treatments in
6 Young, J. C., H. L. Trenholm, D. W. Friend, and D. B. Prelusky. 1987. Detoxification of deoxynivale-nol with sodium bisulfite and evaluation of the effects when pure mycotoxin or contaminated corn was treated and given to pigs. J. Agric. Food Chem. 35:259-261.
107
Nursery Nutrition and Management
a completely randomized design, 2 × 3 +1 arrangement with an additional treatment including SMB. Each pen contained a 4-hole, dry self-feeder and a nipple waterer to provide ad libitum access to feed and water.
At the NFP site, a total of 942 pigs (Fast/PIC × TR4 initially 24.1 ± 0.7 lb BW) were used in a 21-d growth trial with 5 replications per treatment and 28 pigs (14 barrows, 14 gilts) per pen. Pens of pigs were allotted based on initial pen weight to 1 of 7 treat-ments in a completely randomized 2 × 3 +1 arrangement with an additional treatment including SMB.
All diets were manufactured simultaneously at the Hubbard Feeds mill in Mankato, MN, and diets for the K-State site were bagged and shipped to K-State so both trials could commence on the same date. Naturally contaminated DDGS with a known DON concentration were used to produce diets with the desired concentrations. Corn and both a clean and contaminated source of DDGS had 10 subsamples collected and compiled into a composite sample for a full 19-component mycotoxin analysis at NDSU prior to diet formulation and manufacturing. Apart from DON and SMB content, diets were formulated to be identical in nutrient composition (Table 1), each containing a total of approximately 30% DDGS. Diets were also analyzed for sodium and sulfur content (Table 1) due to concerns that incorporating SMB at high levels may negatively affect performance due to high sodium and sulfur content. To prevent segre-gation of diet ingredients, diets with pelleted DDGS were crumbled before incorporat-ing into the final diet. Based on initial mycotoxin analysis (Table 1) of basal ingredients, there were 7 experimental treatments consisting of 3 diets fed in meal or pellet form: (1) positive control, (2) negative control (5.5 ppm DON), and (3) pelleted and crum-bled DDGS (5.5 ppm). For the seventh treatment, high-DON DDGS were mixed with 2.5% SMB before pelleting, then crumbled and mixed into the diet to achieve a final dietary DON level of 5.5 ppm. This diet was fed in meal form. Salt was also removed from the diet containing SMB due to concerns with the high sodium content of SMB. Deoxynivalenol-contaminated diets were formulated at higher DON concentrations than in past trials to retain a significant reduction in performance in diets contain-ing DON, in case individual diet levels analyzed lower than formulated, which had occurred in previous research. Experimental diets were fed from d 0 to 21. Average daily gain, ADFI, and F/G were determined by weighing pigs and measuring feed disappear-ance on d 7, 14, and 21 of the trial.
Results were pooled from both research locations and analyzed with research location included as a random effect using the PROC MIXED procedure of SAS (SAS Institute, Inc., Cary, NC). Pen was the experimental unit. Treatment means were separated using preplanned CONTRAST statements in SAS. Contrasts compared the following treat-ments: (1) “DON” compared positive control to negative control without crumbling, both meal and pellet form; (2) “Pellet vs. Meal” compared meal to pelleted diets in the first six treatments; (3) “Pelleting DDGS” compared the effect of pelleting DDGS and crumbling before final diet manufacturing in the four negative control treatments; (4) “Pellet × DDGS” evaluated the 2-way interaction between pelleting DDGS and pelleting final diets in the 4 negative control treatments; (5) “SMB” compared treat-ment 5 to treatment 7, the 2 diets where negative control DDGS were pelleted, crum-bled and fed in meal form, isolating the effect of adding SMB. Means were considered significant at P < 0.05 and trends at P < 0.10.

108
Nursery Nutrition and Management
Results and DiscussionAlthough diets were formulated to contain 5.5 ppm DON based on an initial analysis of the contaminated DDGS (18.2 ppm), analyzed diet DON levels were between 3.9 and 4.1 ppm (Table 2). Nevertheless, these analyzed DON levels were adequate to cause an approximate 10% reduction in growth performance. The lone exception was treatment 7, containing 0.77% SMB, which had an analyzed DON level of 2.2 ppm. A reduction in DON concentration was expected because of the conversion from DON to DON-S that takes place in the presence of heat and moisture with SMB (Young et al., 1987). Salt was removed from diet 7 because of concerns that supplementing SMB may raise sodium and sulfur levels; however, nutrient analysis showed that treatment 7 actually had the lowest sodium level of all treatments. Analyzed sulfur content was higher for the diet containing SMB compared with the other diets. Nevertheless, at 0.57%, the analyzed sulfur level was within levels that previous research has shown pigs can tolerate without negative effects on performance.
Initially (d 0 to 7) and overall, there was a 2-way interaction within negative control diets where pelleting only the final diet improved F/G (P < 0.05) by a greater margin in high-DON diets than in treatments where the DDGS was pelleted, crumbled, then repelleted in the final diet. No further 2-way interactions for ADG or F/G were detected from d 7 to 14 or d 14 to 21. Additionally, ADFI and pig weights were not affected by 2-way interaction between pelleting and pelleting DDGS in negative control diets.
From d 0 to 7, pigs fed high concentrations of DON had reduced (P < 0.001) ADG and ADFI, and poorer (P < 0.01) F/G than pigs fed control diets (Table 3). From d 7 to 14, ADG and ADFI decreased (P < 0.001) in pigs fed high-DON-containing diets. Pigs fed high-DON-containing diets from d 14 to 21 tended to have decreased (P < 0.08) ADG and had lower (P < 0.01) ADFI than pigs fed diets without DON, but during d 14 to 21, pigs fed high-DON-containing diets had improved (P < 0.01) F/G compared with those fed control diets. For the overall test period (d 0 to 21), pigs fed diets high in DON had decreased (P < 0.02) ADG, ADFI, and BW compared with those fed positive control diets, but there were no differences in F/G. Pigs presented diets in pellet form had increased (P < 0.03) ADG, improved (P < 0.001) F/G, and heavier (P < 0.01) BW over all periods. Although pelleting the diet resulted in greater (P < 0.03) ADFI between d 0 and 7, there were no differences in ADFI over the remaining periods.
When comparing DDGS processing in high-DON-containing diets, pelleting DDGS had no effect on ADG from d 0 to 7 or d 7 to 14, but tended to increase (P < 0.06) ADG from d 14 to 21. Overall, no differences were measured in ADG, ADFI, and F/G for pelleting high-DON DDGS, nor were there significant differences in ADFI, F/G or pig BW within any test period.
Sodium metabisulfite inclusion was compared between the two diets in which DDGS was pelleted prior to final diet manufacturing, both of which were fed in meal form. From d 0 to 7, adding SMB increased (P < 0.03) ADG and ADFI in diets where DDGS was pelleted, crumbled, and fed in meal form. From d 7 to 14, supplementing DDGS

109
Nursery Nutrition and Management
with SMB prior to pelleting DDGS tended to increase (P < 0.07) ADG and increase (P < 0.03) ADFI. Overall, the inclusion of SMB prior to pelleting DDGS and feeding diets in meal form increased (P < 0.01) ADG and ADFI; however, no differences were found in F/G for any period. Sodium metabisulfite inclusion did not affect pig BW at d 7, but incorporating SMB to negative control diets (meal form) prior to pelleting DDGS resulted in heavier (P < 0.03) pig BW at d 14 and d 21.
These results agree with previous studies that high DON concentrations in nursery pig diets significantly reduce feed intake and thus overall daily gain; however, presenting high-DON diets in pelleted form appears to improve feed efficiency enough to effec-tively offset reductions in feed intake to result in similar growth to pigs fed low-DON diets in meal form. In agreement with DON analysis of diets in which contaminated DDGS was pelleted prior to final diet manufacturing, DON does not appear to be converted to DON-S simply due to heat and moisture, so no benefit was observed in pelleting contaminated DDGS as the sole ingredient, but supplementing 2.5% SMB prior to pelleting DDGS can reduce analyzed DON levels by 50% or more and ulti-mately result in improvements in feed intake and daily gain. Further research needs to be conducted to clarify whether SMB can be incorporated at final diet manufacturing with similar success, which would make its inclusion in high-DON diets a realistic strat-egy. Additional work also needs to be done to determine the relationship between total DON concentration and SMB inclusion rate to effectively recommend pelleting with SMB as a strategy for successfully detoxifying DON in nursery pig diets.
In conclusion, pelleting nursery pig diets high in DON and adding SMB prior to pellet-ing may serve as a way for swine producers to more successfully utilize DON-contami-nated feedstuffs without experiencing reductions in growth performance.

110
Nursery Nutrition and Management
Table 1. Diet composition (as-fed basis)1
ItemPositive control
Negative control NC crumbled2
NC crumbled w/SMB3
Ingredient, %Corn 41.36 41.36 41.36 40.44DDGS (26.3% CP) 30.00 - - -Contaminated DDGS (26.0% CP) - 30.00 30.00 -Contaminated DDGS (25.0 g/kg SMB) - - - 31.00Soybean meal (46.5% CP) 24.15 23.95 23.95 24.00Pork fat 1.30 1.30 1.30 1.60Limestone 1.10 1.10 1.10 1.10Salt 0.43 0.43 0.43 -Monocalcium phosphate (21% P) 0.45 0.45 0.45 0.45Trace mineral premix 0.08 0.08 0.08 0.08Copper sulfate 0.07 0.07 0.07 0.07Selenium 0.05 0.05 0.05 0.05Vitamin premix 0.03 0.03 0.03 0.03L-Lysine HCl 0.46 0.46 0.46 0.46Methionine hydroxy analog 0.12 0.11 0.11 0.11L-Threonine 0.07 0.07 0.07 0.07Medication4 0.40 0.40 0.40 0.40Mold inhibitor5 0.10 0.10 0.10 0.10Phytase6 0.04 0.04 0.04 0.04
Total 100 100 100 100continued

111
Nursery Nutrition and Management
Table 1. Diet composition (as-fed basis)1
ItemPositive control
Negative control NC crumbled2
NC crumbled w/SMB3
Calculated composition, %Standardized ileal digestible amino acids, %
Lysine 1.20 1.20 1.20 1.20 Isoleucine:lysine 61 61 61 61Leucine:lysine 147 148 148 148Methionine:lysine 34 34 34 34Met & Cys:lysine 58 58 58 58Threonine:lysine 60 60 60 60Tryptophan:lysine 17.5 17.5 17.5 17.5Valine:lysine 73 73 73 73
Total lysine, % 1.40 1.40 1.40 1.40 ME, kcal/lb 1,500 1,500 1,500 1,500CP, % 22.3 22.4 22.4 22.4Ca, % 0.66 0.66 0.66 0.66P, % 0.57 0.58 0.58 0.58Available P, % 0.30 0.31 0.31 0.31Sodium, % 0.25 0.25 0.25 0.30Chloride, % 0.43 0.43 0.43 0.17Sulfur, % 0.29 0.29 0.29 0.53Deoxynivalenol, ppm7 <0.5 5.5 5.5 5.51 Diets for both locations were manufactured simultaneously at Hubbard Feeds (Mankato, MN).2 Dried distillers grains with solubles (DDGS) were pelleted, then crumbled and added back to final diet to prevent segregation.3 Sodium metabisulfite (SMB) added to contaminated DDGS at 2.5% prior to pelleting and crumbling. Sodium metabisulfite level of 0.77% in final diet.4 To provide 400 g/ton chlortetracycline.5 Ammo Curb; Kemin Industries, Des Moines, IA.6 Phyzyme 2500; Danisco Animal Nutrition, St. Louis, MO.7 Based on analysis of naturally contaminated DDGS at NDSU Veterinary Diagnostic Laboratory (Fargo, ND). Samples were analyzed using a variety of mass spectrometry, ELISA, and high-pressure liquid chromatography (HPLC).

112
Nursery Nutrition and Management
Table 2. Analyzed diet deoxynivalenol (DON) content (ppm) and nutrient analysis
ItemTotal
DON1 DON215-Acetyl
DON2 Sodium, %3 Sulfur, %3
Basal ingredientsContaminated dried distillers grains with solubles (DDGS)
18.2 16 2.2 -4 -
Pelleted and crumbled DDGS 12.2 10.75 1.4 - -DDGS pelleted and crumbled with 2.5% sodium metabisulfite (SMB)
2.8 1.6 1.2 - -
Test dietsPC6 meal <0.5 <0.5 <0.5 0.28 0.39PC pellet <0.5 <0.5 <0.5 0.34 0.46NC6 meal 4.1 3.5 0.6 0.29 0.43NC pellet 3.9 3.3 0.6 0.29 0.43NC + crumbled DDGS (meal) 4.0 3.4 0.6 0.28 0.43NC + crumbled DDGS (pellet) 4.1 3.5 0.6 0.31 0.46NC + crumbled DDGS and SMB (meal) 2.2 1.6 0.6 0.23 0.57
1 Total DON is reported as a combination of DON and 15-Acetyl DON levels. Both mycotoxins have similar effects and are typically combined to form an overall DON value.2 Mycotoxin analysis conducted at NDSU Veterinary Diagnostic Laboratory (Fargo, ND) using a variety of mass spectrometry, ELISA, and high-pressure liquid chromatography (HPLC).3 Sodium and sulfur analyses were conducted at MVTL Feed Laboratory (New Ulm, MN).4 (-) indicates samples were not tested for these nutrients.5 Average of two analyzed DON levels (7.8 and 13.6 ppm). Initial analysis (NDSU) was lower than expected, so a second analysis (13.6 ppm) was performed at New Fashion Pork (Buffalo Center, IA) using a Neogen test kit. 6 PC, positive control. NC, negative control.
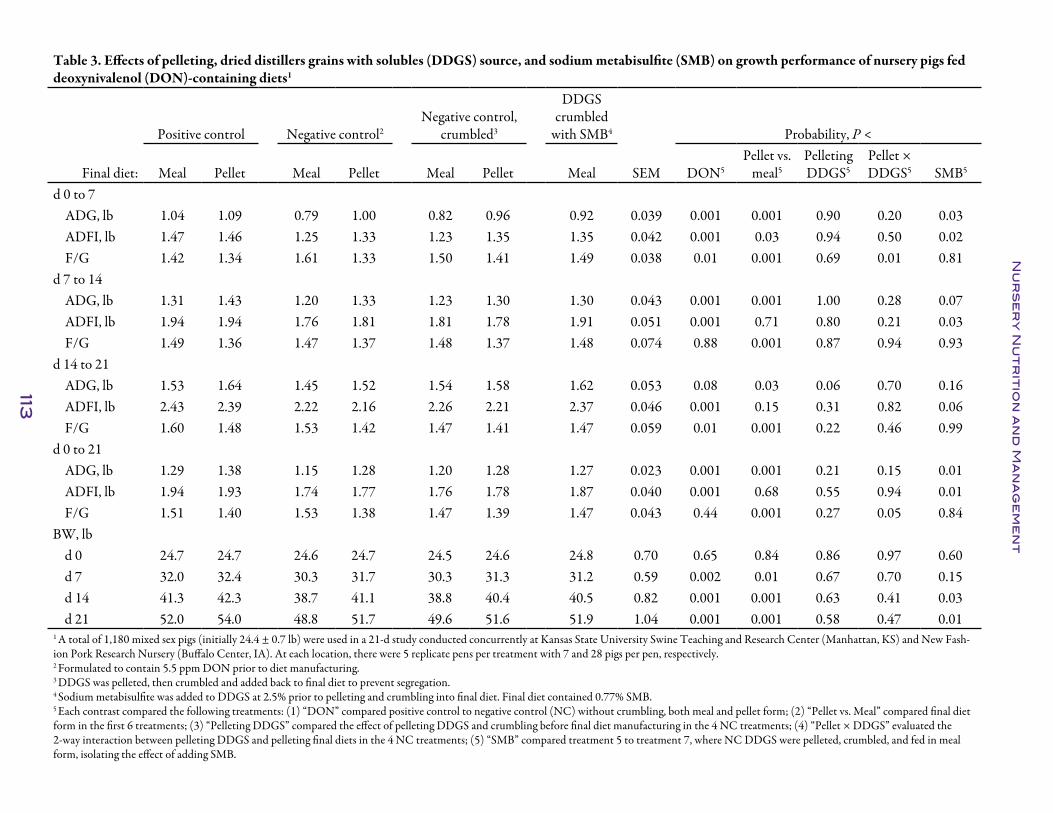
113
Nu
rs
er
y N
ut
rit
ion
an
d M
an
ag
em
en
t
Table 3. Effects of pelleting, dried distillers grains with solubles (DDGS) source, and sodium metabisulfite (SMB) on growth performance of nursery pigs fed deoxynivalenol (DON)-containing diets1
Positive control Negative control2Negative control,
crumbled3
DDGS crumbled
with SMB4 Probability, P <
Final diet: Meal Pellet Meal Pellet Meal Pellet Meal SEM DON5Pellet vs.
meal5Pelleting DDGS5
Pellet × DDGS5 SMB5
d 0 to 7ADG, lb 1.04 1.09 0.79 1.00 0.82 0.96 0.92 0.039 0.001 0.001 0.90 0.20 0.03ADFI, lb 1.47 1.46 1.25 1.33 1.23 1.35 1.35 0.042 0.001 0.03 0.94 0.50 0.02F/G 1.42 1.34 1.61 1.33 1.50 1.41 1.49 0.038 0.01 0.001 0.69 0.01 0.81
d 7 to 14ADG, lb 1.31 1.43 1.20 1.33 1.23 1.30 1.30 0.043 0.001 0.001 1.00 0.28 0.07ADFI, lb 1.94 1.94 1.76 1.81 1.81 1.78 1.91 0.051 0.001 0.71 0.80 0.21 0.03F/G 1.49 1.36 1.47 1.37 1.48 1.37 1.48 0.074 0.88 0.001 0.87 0.94 0.93
d 14 to 21ADG, lb 1.53 1.64 1.45 1.52 1.54 1.58 1.62 0.053 0.08 0.03 0.06 0.70 0.16ADFI, lb 2.43 2.39 2.22 2.16 2.26 2.21 2.37 0.046 0.001 0.15 0.31 0.82 0.06F/G 1.60 1.48 1.53 1.42 1.47 1.41 1.47 0.059 0.01 0.001 0.22 0.46 0.99
d 0 to 21ADG, lb 1.29 1.38 1.15 1.28 1.20 1.28 1.27 0.023 0.001 0.001 0.21 0.15 0.01ADFI, lb 1.94 1.93 1.74 1.77 1.76 1.78 1.87 0.040 0.001 0.68 0.55 0.94 0.01F/G 1.51 1.40 1.53 1.38 1.47 1.39 1.47 0.043 0.44 0.001 0.27 0.05 0.84
BW, lbd 0 24.7 24.7 24.6 24.7 24.5 24.6 24.8 0.70 0.65 0.84 0.86 0.97 0.60d 7 32.0 32.4 30.3 31.7 30.3 31.3 31.2 0.59 0.002 0.01 0.67 0.70 0.15d 14 41.3 42.3 38.7 41.1 38.8 40.4 40.5 0.82 0.001 0.001 0.63 0.41 0.03d 21 52.0 54.0 48.8 51.7 49.6 51.6 51.9 1.04 0.001 0.001 0.58 0.47 0.01
1 A total of 1,180 mixed sex pigs (initially 24.4 ± 0.7 lb) were used in a 21-d study conducted concurrently at Kansas State University Swine Teaching and Research Center (Manhattan, KS) and New Fash-ion Pork Research Nursery (Buffalo Center, IA). At each location, there were 5 replicate pens per treatment with 7 and 28 pigs per pen, respectively.2 Formulated to contain 5.5 ppm DON prior to diet manufacturing.3 DDGS was pelleted, then crumbled and added back to final diet to prevent segregation.4 Sodium metabisulfite was added to DDGS at 2.5% prior to pelleting and crumbling into final diet. Final diet contained 0.77% SMB.5 Each contrast compared the following treatments: (1) “DON” compared positive control to negative control (NC) without crumbling, both meal and pellet form; (2) “Pellet vs. Meal” compared final diet form in the first 6 treatments; (3) “Pelleting DDGS” compared the effect of pelleting DDGS and crumbling before final diet manufacturing in the 4 NC treatments; (4) “Pellet × DDGS” evaluated the 2-way interaction between pelleting DDGS and pelleting final diets in the 4 NC treatments; (5) “SMB” compared treatment 5 to treatment 7, where NC DDGS were pelleted, crumbled, and fed in meal form, isolating the effect of adding SMB.

114
Nursery Nutrition and Management
Effects of Increasing Dietary Wheat Middlings on Nursery Pig Growth Performance
J. A. De Jong, J. M. DeRouchey, M. D. Tokach, R. D. Goodband, S. S. Dritz1, and J. L. Nelssen
SummaryA total of 180 nursery pigs (PIC 327 × 1050, initially 25.2 lb BW) were used in a 21-d trial to evaluate the effects of increasing dietary wheat middlings on growth perfor-mance. Pens of pigs were balanced by initial BW and were randomly allotted to 1 of 5 dietary treatments with 6 replications per treatment. The 5 corn-soybean meal-based diets contained 0, 5, 10, 15 or 20% wheat middlings.
Overall (d 0 to 21), pigs fed increasing wheat middlings had decreased ADG (linear, P < 0 .05) and ADFI (linear, P < 0 .005), but F/G was not affected by dietary wheat middlings. Despite the linear decrease in ADG and ADFI, the biggest reduction in performance was not observed until wheat middlings increased beyond 15% of the diet. This suggests that in some cases, the slight decrease in ADG with a low inclusion of wheat middlings (< 15%) to the diet might be economically justified, so its inclusion needs to be evaluated on an income over feed costs basis.
Key words: nursery pig, wheat middlings
IntroductionWheat middlings are a wheat milling by-product consisting of fine particles of wheat bran, wheat shorts, wheat germ, and wheat flour, and contains no more than 9.5% crude fiber. With the increased price of corn, wheat middlings have become a more common ingredient in various swine diets. Wheat middlings have higher crude protein and fiber but lower dietary energy than corn (corn ME = 1,551 kcal/lb; wheat middlings ME = 1,372 kcal/lb; NRC, 19982), which must be accounted for when used in swine diets.
Although extensive research has been conducted with wheat middlings and its effects on growing and finishing pigs, there is no data available on its effects in corn-soybean meal-based nursery diets. In a recent review of finishing pigs fed wheat middlings or closely related wheat co-products, it was shown that pigs fed 20% had decreased ADG and worse F/G but relatively unchanged ADFI.3 Thus, although the effects in growing and finishing pigs have been quantified, research needs to be completed with nursery pigs to determine if a similar response exists.
Therefore, the objective of this study was to determine the effects of increasing dietary wheat middlings on growth performance of nursery pigs from 25 to 50 lb. 1 Department of Diagnostic Medicine/Pathobiology, College of Veterinary Medicine, Kansas State University.2 NRC. 1998. Nutrient Requirements of Swine, 10th ed. Natl. Acad. Press, Washington DC.3 Barnes et al., Swine Day 2010, Report of Progress 1038, pp. 104-114.

115
Nursery Nutrition and Management
ProceduresThe Kansas State University Institutional Animal Care and Use Committee approved the protocol used in this experiment. The study was conducted at the K-State Swine Teaching and Research Center in Manhattan, KS.
A total of 180 pigs (PIC 327 × 1050, initially 25.2 lb BW and 39 d of age) were used in a 21-d growth trial to determine the effects of dietary wheat middlings on pig growth performance. Pigs were allotted to pens by initial BW, and pens were assigned to treat-ments in a completely randomized design with 6 pigs per pen and 6 replications per treatment. The 5 treatment diets included 0, 5, 10, 15, or 20% wheat middlings (Table 1). All diets were fed in meal form and were prepared at the K-State Animal Science Feed Mill.
Each pen contained a 4-hole, dry self-feeder and a nipple waterer to provide ad libitum access to feed and water. Pens had wire-mesh floors and allowed approximately 3 ft2/pig. Pig weight and feed disappearance were measured on d 0, 7, 14, and 21 of the trial to determine ADG, ADFI, and F/G.
Wheat middling and complete diet samples were collected and submitted to Ward Laboratories, Inc. (Kearney, NE) for analysis of DM, CP, ADF, NDF, CF, Ca and P (Tables 2 and 3). In addition, bulk density of the wheat middlings and complete diets was determined.
Data were analyzed as a completely randomized design using the PROC MIXED procedure of SAS (SAS Institute, Inc., Cary, NC) with pen as the experimental unit. Contrasts were used to compare linear and quadratic effects of increasing wheat middlings. Differences between treatments were determined by using least squares means (P < 0.05), and trends were declared at P < 0.10.
Results and DiscussionThe chemical analysis of the wheat middlings (Table 2) revealed that CP levels were close to the formulated values and that crude fiber, calcium, and phosphorus were all slightly lower than the formulated values. Also, the analysis of the dietary treatments showed that ADF ranged from 3.20 to 4.10, NDF from 8.10 to 11.60, and CF from 2.40 to 3.20 across treatments, respectively. The bulk density decreased from 53.09 to 43.18 across dietary treatments.
Overall (d 0 to 21), as dietary wheat middlings increased, ADG decreased (linear; P < 0.05; Table 4). The reduction in ADG was primarily a result of decreased (linear; P < 0.005) ADFI in pigs fed increasing wheat middlings. There was no difference in F/G as wheat middlings increased. These data indicate that nursery pigs fed increas-ing wheat middlings responded differently than previously reported for growing and finishing pigs. Unlike finishing pigs, nursery pigs in the present study had decreased ADFI as wheat middlings increased as feed intake may have been limited by gut fill due to the low bulk density of the wheat middlings. This led to the reduction in ADG with no change in feed efficiency. On the other hand, finishing pigs increased feed intake as a response to offset the low energy in diets containing wheat middlings.
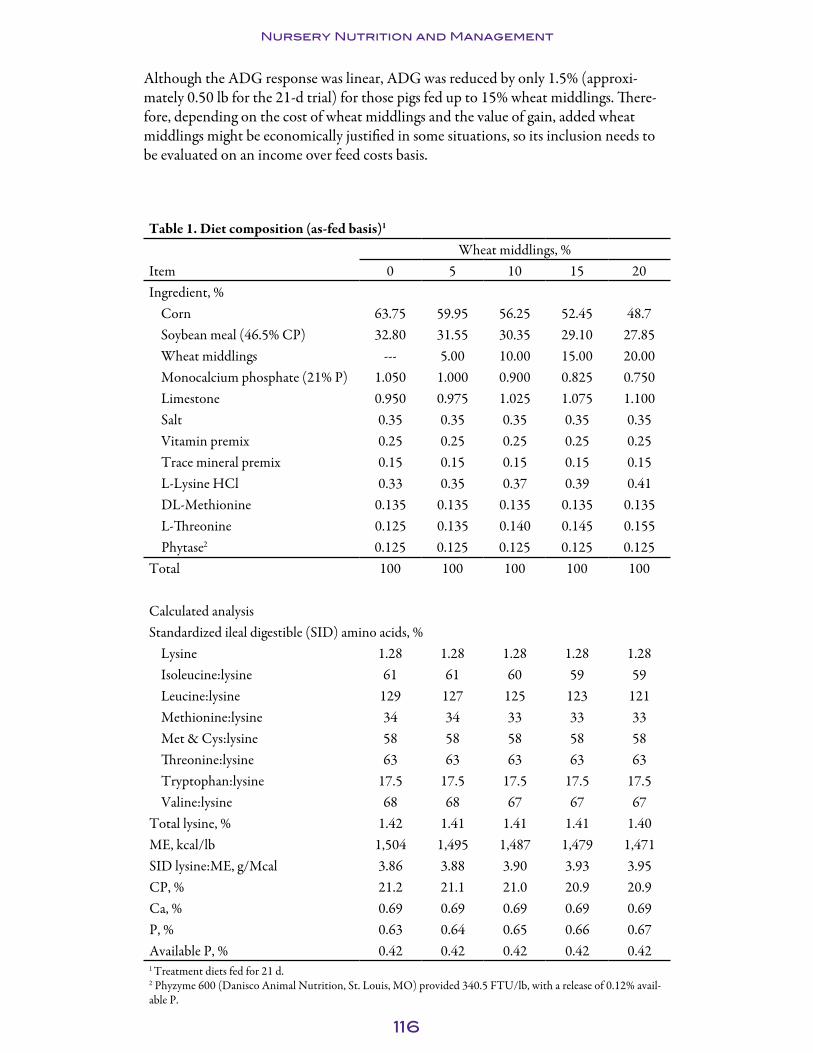
116
Nursery Nutrition and Management
Although the ADG response was linear, ADG was reduced by only 1.5% (approxi-mately 0.50 lb for the 21-d trial) for those pigs fed up to 15% wheat middlings. There-fore, depending on the cost of wheat middlings and the value of gain, added wheat middlings might be economically justified in some situations, so its inclusion needs to be evaluated on an income over feed costs basis.
Table 1. Diet composition (as-fed basis)1
Wheat middlings, % Item 0 5 10 15 20Ingredient, %
Corn 63.75 59.95 56.25 52.45 48.7Soybean meal (46.5% CP) 32.80 31.55 30.35 29.10 27.85Wheat middlings --- 5.00 10.00 15.00 20.00Monocalcium phosphate (21% P) 1.050 1.000 0.900 0.825 0.750Limestone 0.950 0.975 1.025 1.075 1.100Salt 0.35 0.35 0.35 0.35 0.35Vitamin premix 0.25 0.25 0.25 0.25 0.25Trace mineral premix 0.15 0.15 0.15 0.15 0.15L-Lysine HCl 0.33 0.35 0.37 0.39 0.41DL-Methionine 0.135 0.135 0.135 0.135 0.135L-Threonine 0.125 0.135 0.140 0.145 0.155Phytase2 0.125 0.125 0.125 0.125 0.125
Total 100 100 100 100 100
Calculated analysisStandardized ileal digestible (SID) amino acids, %
Lysine 1.28 1.28 1.28 1.28 1.28Isoleucine:lysine 61 61 60 59 59Leucine:lysine 129 127 125 123 121Methionine:lysine 34 34 33 33 33Met & Cys:lysine 58 58 58 58 58Threonine:lysine 63 63 63 63 63Tryptophan:lysine 17.5 17.5 17.5 17.5 17.5Valine:lysine 68 68 67 67 67
Total lysine, % 1.42 1.41 1.41 1.41 1.40ME, kcal/lb 1,504 1,495 1,487 1,479 1,471SID lysine:ME, g/Mcal 3.86 3.88 3.90 3.93 3.95CP, % 21.2 21.1 21.0 20.9 20.9Ca, % 0.69 0.69 0.69 0.69 0.69P, % 0.63 0.64 0.65 0.66 0.67Available P, % 0.42 0.42 0.42 0.42 0.421 Treatment diets fed for 21 d. 2 Phyzyme 600 (Danisco Animal Nutrition, St. Louis, MO) provided 340.5 FTU/lb, with a release of 0.12% avail-able P.
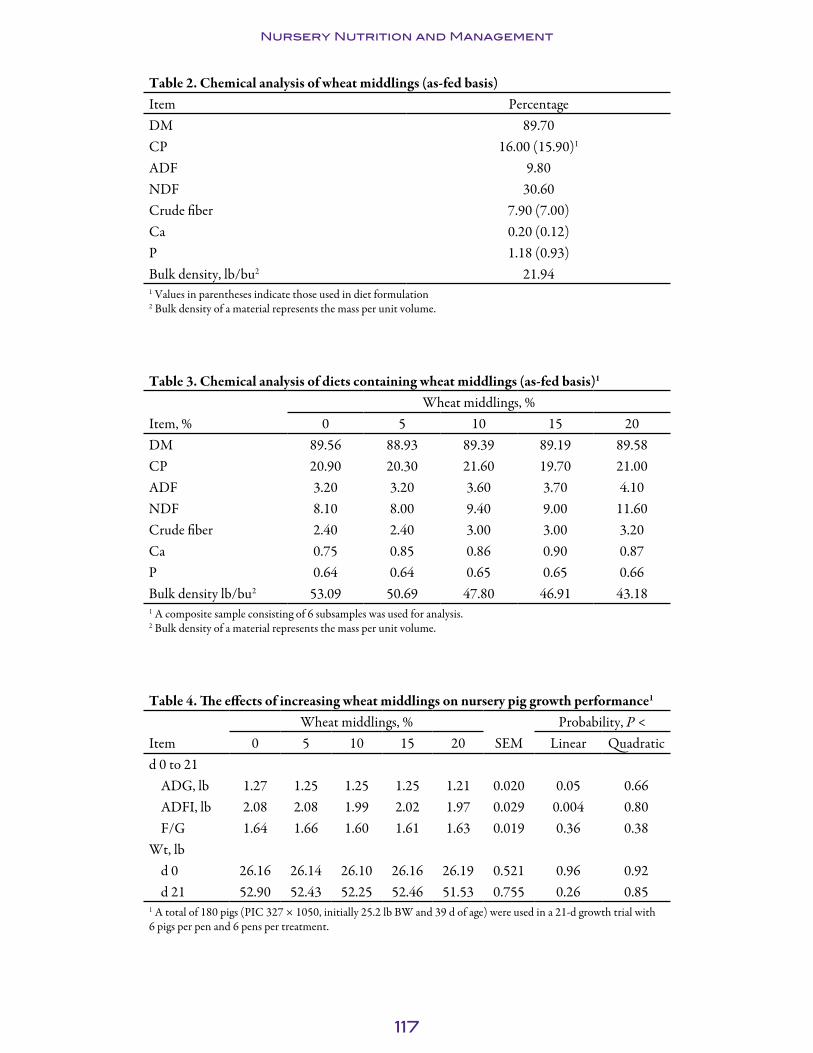
117
Nursery Nutrition and Management
Table 2. Chemical analysis of wheat middlings (as-fed basis)Item PercentageDM 89.70CP 16.00 (15.90)1
ADF 9.80NDF 30.60Crude fiber 7.90 (7.00)Ca 0.20 (0.12)P 1.18 (0.93)Bulk density, lb/bu2 21.941 Values in parentheses indicate those used in diet formulation2 Bulk density of a material represents the mass per unit volume.
Table 3. Chemical analysis of diets containing wheat middlings (as-fed basis)1
Wheat middlings, %Item, % 0 5 10 15 20DM 89.56 88.93 89.39 89.19 89.58CP 20.90 20.30 21.60 19.70 21.00ADF 3.20 3.20 3.60 3.70 4.10NDF 8.10 8.00 9.40 9.00 11.60Crude fiber 2.40 2.40 3.00 3.00 3.20Ca 0.75 0.85 0.86 0.90 0.87P 0.64 0.64 0.65 0.65 0.66Bulk density lb/bu2 53.09 50.69 47.80 46.91 43.181 A composite sample consisting of 6 subsamples was used for analysis.2 Bulk density of a material represents the mass per unit volume.
Table 4. The effects of increasing wheat middlings on nursery pig growth performance1
Wheat middlings, % Probability, P <Item 0 5 10 15 20 SEM Linear Quadraticd 0 to 21
ADG, lb 1.27 1.25 1.25 1.25 1.21 0.020 0.05 0.66ADFI, lb 2.08 2.08 1.99 2.02 1.97 0.029 0.004 0.80F/G 1.64 1.66 1.60 1.61 1.63 0.019 0.36 0.38
Wt, lbd 0 26.16 26.14 26.10 26.16 26.19 0.521 0.96 0.92d 21 52.90 52.43 52.25 52.46 51.53 0.755 0.26 0.85
1 A total of 180 pigs (PIC 327 × 1050, initially 25.2 lb BW and 39 d of age) were used in a 21-d growth trial with 6 pigs per pen and 6 pens per treatment.

118
Nursery Nutrition and Management
The Effects of Sorghum Dried Distillers Grains with Solubles on Nursery Pig Performance1
K. M. Sotak, R. D. Goodband, M. D. Tokach, S. S. Dritz2, J. M. DeRouchey, and J. L. Nelssen
SummaryTwo experiments were conducted to determine the effects of sorghum dried distillers grains with solubles (DDGS) on nursery pig growth performance. In both experiments, sorghum DDGS were added to corn- or sorghum-based diets to determine their impact on ADG, ADFI, and F/G. In Exp. 1, a total of 360 nursery barrows (PIC 1050, initially 15.1 lb and 26 d of age) were used with 5 pigs per pen and 9 pens per treatment. Pigs were allotted to 1 of 8 dietary treatments arranged in a 2 × 4 factorial with main effects of grain source (corn vs. sorghum) and sorghum DDGS (0, 15, 30, or 45%). Overall (d 0 to 34), pigs fed the corn and sorghum diets had similar ADG and ADFI; however, F/G was poorer (P < 0.05) for pigs fed the sorghum-based diets compared with the corn-based diets. Also, increasing DDGS reduced ADG (linear, P < 0.01) but increased ADFI (linear, P < 0.07), resulting in poorer F/G (linear, P < 0.01).
In Exp. 2, a total of 180 nursery pigs (PIC 327 × 1050, initially 23.8 lb and 38 d of age) were used in a 21-d study with 6 pigs per pen and 5 pens per treatment. The dietary treatments were arranged in a 2 × 3 factorial with main effects of grain source (corn vs. sorghum) and DDGS (none, 30% corn DDGS, or 30% sorghum DDGS). Overall (d 0 to 21), no differences were found in ADG, ADFI, and F/G among pigs fed the corn- or sorghum-based diets. DDGS source (corn vs. sorghum) also did not influence growth performance; however, adding 30% DDGS to either the corn- or sorghum-based diets tended to reduce ADG (P < 0.10). Pigs fed diets with DDGS had similar ADFI and F/G when compared with pigs fed the basal diets (0% DDGS).
In conclusion, sorghum can be used as a suitable replacement for corn in nursery diets. In Exp. 1, feed efficiency was approximately 5% poorer in pigs fed sorghum-based diets vs. pigs fed corn-based diets, which is similar to the energy content differences between the two grains. However, increasing sorghum DDGS to 45% of the diet reduced pig growth performance, so its inclusion needs to be evaluated on an income over feed costs basis.
Key words: corn, corn DDGS, sorghum, sorghum DDGS, nursery pig
IntroductionProducers from Texas to South Dakota have grown sorghum for many years due to its ability to thrive in drought conditions. This large production of sorghum accompanied by the rapid increase in demand for grain for ethanol production has resulted in an availability of sorghum DDGS in this area.
1 The authors thank the United Sorghum Checkoff Program for partial financial support.2 Department of Diagnostic Medicine/Pathobiology, College of Veterinary Medicine, Kansas State University.
119
Nursery Nutrition and Management
Sorghum has an energy value of 96% that of corn and can be a complete replacement for corn when formulated in swine diets (Carter et al., 19893); however, with the advent of low-tannin varieties and with proper feed processing and diet formulation, in many cases sorghum has been shown to have performance equal to corn in swine diets. Although a large amount of information is known about the nutritional value of sorghum, little is known about its by-product, sorghum DDGS. With an increas-ing amount of sorghum DDGS available, more research needs to be conducted to determine its impact on pig growth performance. Therefore, the objective of this study was to compare corn- vs. sorghum-based diets and determine the effects of increasing sorghum DDGS on nursery pig growth performance.
ProceduresThe protocol for this experiment was approved by the Kansas State University Institu-tional Animal Care and Use Committee. Experiment 1 was conducted at the K-State Segregated Early Weaning Facility, Manhattan, KS, and Exp. 2 was conducted at the K-State Swine Teaching and Research Center.
In Exp. 1, a total of 360 nursery barrows (PIC 1050, 15.1 lb and 26 d of age) were used in a 34-d trial to determine the effects of increasing sorghum DDGS on growth perfor-mance. After arrival to the nursery, pigs were fed a common pre-test diet for the first 7 d after weaning. Pens of pigs were then allotted to 1 of 8 dietary treatments with 5 pigs per pen (5 × 5 ft) and 9 replications per treatment. Each pen had metal slatted floors, one 5-hole self-feeder, and a nipple waterer. Throughout the study, the pigs had ad libitum access to feed and water.
The dietary treatments were arranged in a 2 × 4 factorial with main effects of grain source (corn vs. sorghum) and sorghum DDGS (0, 15, 30, or 45%). Sorghum and corn nutrient values were derived from NRC (19984; Table 1). Standardized ileal digest-ibility values for the sorghum DDGS were derived from Urriola et al. (20095). Other nutrient values for the sorghum DDGS were derived from previous analysis of sorghum DDGS samples collected from the ethanol plant earlier in the year (Sotak et al., 20106). Dietary treatments were fed in 2 phases (d 0 to 14 and d 14 to 34; Tables 2 and 3). All pigs and feeders were weighed on d 0, 14, and 34 to determine ADG, ADFI, and F/G.
In Exp. 2, a total of 180 nursery pigs (PIC 327 × 1050, 23.8 lb, and 38 d of age) were used in a 21-d trial to determine the effects of grain and DDGS source on growth performance. After arrival to the nursery, pigs were fed common pre-test diets for 17 d postweaning. Pens of pigs were then allotted to 1 of 6 dietary treatments with 6 pigs per pen (4 × 5 ft) and 5 replications per treatment. Each pen had slatted floors, one 5-hole
3 Carter, P. R., D. R. Hicks, E. S. Oplinger, J. D. Doll, L. G. Bundy, R. T. Schuler, and B. J. Holmes. 1989. Grain sorghum. Alternative Field Crops Manual. University of Wisconsin-Extension Cooperative Exten-sion, Madison and University of Minnesota: Center for Alternative Plant and Animal Products and the Minnesota Extension Service, Minneapolis.4 NRC. 1998. Nutrient Requirements of Swine. 10th ed. National Academy Press, Washington, DC.5 Urriola, P. E., D. Hoehler, C. Pederson. H. H. Stein, and G. C Shurson. 2009 Amino acid digestibility of distillers dried grains with solubles produced from a sorghum-a sorghum-corn blend, and corn fed to pigs. J. Anim. Sci. 87:2574-2580.6 Sotak et al., Swine Day 2010, Report of Progress 1038, pp. 265-272.

120
Nursery Nutrition and Management
self-feeder, and a nipple waterer. Throughout the study, the pigs had ad libitum access to feed and water.
The dietary treatments were arranged in a 2 × 3 factorial with main effects of grain source (corn vs. sorghum) and DDGS (none, 30% corn DDGS, or 30% sorghum DDGS). The corn, sorghum, and sorghum DDGS nutrient values were the same as those used in Exp. 1. Corn DDGS values were from Stein, 20077. Dietary treatments were fed for 21 d (Table 4). All pigs and feeders were weighed on d 0, d 7, d 14, and d 21 to determine ADG, ADFI, and F/G.
Data were analyzed in a completely randomized design with pen as the experimental unit. Analysis of variance was used with the MIXED procedure of SAS (SAS Insti-tute, Inc., Cary, NC). For Exp. 1, contrasts were used to make comparisons between the (1) linear and quadratic interactions of DDGS level × grain source, (2) corn- and sorghum-based diets, and (3) linear and quadratic effects of increasing DDGS. In Exp. 2, contrasts were used to make comparisons between the (1) interaction of DDGS × grain source, (2) corn- and sorghum-based diets, and (3) effects of 30% DDGS.
Results and DiscussionIn Exp. 1, from d 0 to 14, grain source did not influence ADG or ADFI; however, ADG was reduced (linear, P < 0.05) as sorghum DDGS increased in the diet due to a tendency (P = 0.07) for lower ADFI (interactive effects, Table 5; main effects, Table 6). A DDGS × grain source interaction (P = 0.05) was observed for F/G. In corn-based diets, increasing sorghum DDGS had relatively little effect on F/G, whereas increasing DDGS in sorghum-based diets tended to worsen F/G, leading to a trend (quadratic, P = 0.09) for poorer F/G as DDGS level increased.
From d 14 to 34, no differences were found in ADG among pigs fed corn- or sorghum-based diets; however, ADFI was greater (P < 0.04) and F/G became poorer (P < 0.01) among pigs fed sorghum-based diets compared with those fed corn-based diets. Whether in sorghum- or corn-based diets, increasing sorghum DDGS decreased ADG (linear, P < 0.01) and worsened (linear, P < 0.01) F/G.
Overall (d 0 to 34), ADG and ADFI was similar among the pigs fed the corn- and sorghum-based diets; however, F/G for pigs fed corn-based diets was improved (P < 0.05) by approximately 5% compared with pigs fed sorghum-based diets. Increas-ing DDGS resulted in poorer ADG (linear, P < 0.01) and ADFI (linear, P < 0.07). A quadratic DDGS × grain source interaction (P < 0.03) was observed for F/G. As sorghum DDGS increased in corn-based diets, feed efficiency was identical for pigs fed 0, 15, and 30% DDGS, but worsened for those fed 45% DDGS. In sorghum-based diets, F/G was best for those fed 0% DDGS, but worsened in pigs fed 15, 30, or 45% DDGS. Similar to the response for ADG, increasing DDGS resulted in decreased final weight (linear, P < 0.01).
7 Stein, H. 2007. Dried distillers grains with solubles (DDGS) in diets fed to swine. In: Swine Focus-#001. pp. 1-8.

121
Nursery Nutrition and Management
In Exp. 2, overall (d 0 to 21), no grain source × DDGS interaction was observed for ADG, ADFI, and F/G (Table 7). Pigs fed diets containing either corn or sorghum DDGS had similar growth performance with no difference in final weight.
As in Exp. 1, no difference in ADG and ADFI was observed among pigs fed corn- or sorghum-based diets; however, in Exp. 2, F/G was similar for pigs fed corn-based diets compared with those fed sorghum-based diets (Table 8). Increasing the level of DDGS from 0 to 30% reduced (P < 0.03) ADG, numerically decreased (P = 0.14) F/G, and did not influence ADFI.
In conclusion, grain sorghum can be a suitable replacement for corn in nursery pig diets, with the exception of slightly poorer F/G, possibly related to its decreased energy content. Although increasing sorghum DDGS in the diet reduced ADG, increasing sorghum DDGS in the corn-based diets worsened F/G only when fed at the 45% level. Increasing sorghum DDGS in sorghum-based diets reduced F/G in a linear manner. The economic value of ADG and F/G must be evaluated when considering adding sorghum DDGS to nursery diets. The decrease in pig growth performance will need to be offset by a reduction in diet cost when using sorghum DDGS; therefore, its inclusion needs to be evaluated on an income over feed cost basis.

122
Nursery Nutrition and Management
Table 1. Formulated and analyzed nutrient composition of ingredientsSorghum Corn Sorghum DDGS1
Item Formulated2 Analyzed3 Formulated2 Analyzed3 Formulated2,4 Analyzed3
DM, % 89.00 86.12 89.00 86.22 88.64 89.64CP, % 10.34 9.56 9.33 8.58 27.70 32.39Crude fat, % 3.26 2.40 4.38 2.73 9.35 8.00Crude fiber, % --- 2.03 --- 2.00 8.25 5.88Ash, % --- 1.50 --- 1.51 4.45 4.73
Amino acids, %Cysteine 0.17 0.13 0.19 0.14 0.44 0.44Isoleucine 0.37 0.28 0.28 0.22 1.13 1.04Leucine 1.21 0.95 0.99 0.76 2.93 2.94Lysine 0.22 0.21 0.26 0.22 0.78 0.73Methionine 0.17 0.12 0.17 0.13 0.42 0.39Threonine 0.31 0.24 0.29 0.22 0.86 0.85Tryptophan 0.10 0.06 0.06 0.05 0.22 0.15Valine 0.36 0.37 0.39 0.32 1.38 1.34
1 Dried distillers grains with solubles.2 Diets prepared using the formulated values derived from the NRC 1998, Nutrient Requirements of Swine, 10th ed. National Academy Press, Washington DC.3 Values represent the mean of 1 sample analyzed in duplicate.4 Sotak et al., Swine Day 2010, Report of Progress 1038, pp. 265-272.

123
Nursery Nutrition and Management
Table 2: Composition of diets, (d 0 to 14, Exp. 1, as-fed basis)1
Corn SorghumSorghum dried distillers grains with solubles (DDGS), %
Item 0% 15% 30% 45% 0% 15% 30% 45%Ingredient, %
Corn 56.63 44.86 33.10 21.18 --- --- --- ---Sorghum --- --- --- --- 60.05 47.50 35.05 22.40Soybean meal (46.5% CP) 25.38 22.34 19.31 16.29 21.76 19.54 17.17 14.95Sorghum DDGS --- 15.00 30.00 45.00 --- 15.00 30.00 45.00Spray-dried whey 10.00 10.00 10.00 10.00 10.00 10.00 10.00 10.00Select menhaden fish meal 5.00 5.00 5.00 5.00 5.00 5.00 5.00 5.00Monocalcium P (21% P) 0.90 0.50 0.15 --- 0.85 0.50 0.13 ---Limestone 0.65 0.85 1.00 1.08 0.70 0.85 1.05 1.10Salt 0.30 0.30 0.30 0.30 0.30 0.30 0.30 0.30Zinc oxide 0.25 0.25 0.25 0.25 0.25 0.25 0.25 0.25Vitamin premix 0.25 0.25 0.25 0.25 0.25 0.25 0.25 0.25Trace mineral premix 0.15 0.15 0.15 0.15 0.15 0.15 0.15 0.15L-Lysine HCl 0.24 0.28 0.32 0.36 0.38 0.39 0.40 0.41DL-Methionine 0.15 0.13 0.11 0.09 0.19 0.16 0.14 0.11L-Threonine 0.11 0.09 0.08 0.06 0.14 0.12 0.10 0.08
Total 100 100 100 100 100 100 100 100
Calculated analysisStandardized ileal digestible amino acids, %
Lysine 1.30 1.30 1.30 1.30 1.30 1.30 1.30 1.30Isoleucine:lysine 61 64 67 70 60 64 67 70Methionine:lysine 37 36 36 36 39 38 38 37Met & Cys:lysine 60 60 60 60 60 60 60 60Threonine:lysine 63 63 63 63 63 63 63 63Tryptophan:lysine 17 17 17 17 17 17 17 17Valine:lysine 68 72 76 80 66 71 75 79
Total lysine, % 1.43 1.46 1.49 1.51 1.41 1.44 1.47 1.50CP, % 21.4 23.1 24.9 26.6 20.6 22.5 24.4 26.3ME kcal/lb 1,499 1,467 1,435 1,401 1,478 1,451 1,423 1,394Ca, % 0.85 0.85 0.85 0.85 0.85 0.85 0.85 0.85P, % 0.75 0.72 0.71 0.73 0.73 0.71 0.70 0.73Available P, % 0.46 0.46 0.46 0.51 0.46 0.46 0.46 0.511 Diets were fed in meal form from d 0 to 14 of the experiment, which began 7 d after weaning.
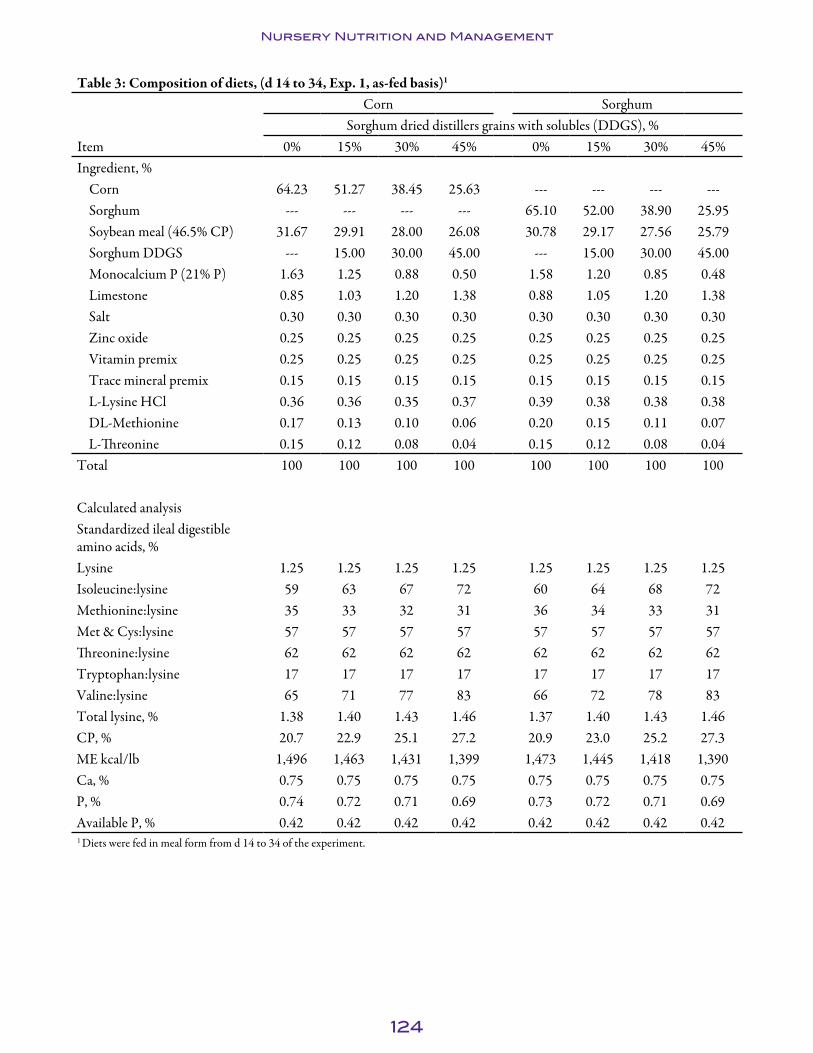
124
Nursery Nutrition and Management
Table 3: Composition of diets, (d 14 to 34, Exp. 1, as-fed basis)1
Corn SorghumSorghum dried distillers grains with solubles (DDGS), %
Item 0% 15% 30% 45% 0% 15% 30% 45%Ingredient, %
Corn 64.23 51.27 38.45 25.63 --- --- --- ---Sorghum --- --- --- --- 65.10 52.00 38.90 25.95Soybean meal (46.5% CP) 31.67 29.91 28.00 26.08 30.78 29.17 27.56 25.79Sorghum DDGS --- 15.00 30.00 45.00 --- 15.00 30.00 45.00Monocalcium P (21% P) 1.63 1.25 0.88 0.50 1.58 1.20 0.85 0.48Limestone 0.85 1.03 1.20 1.38 0.88 1.05 1.20 1.38Salt 0.30 0.30 0.30 0.30 0.30 0.30 0.30 0.30Zinc oxide 0.25 0.25 0.25 0.25 0.25 0.25 0.25 0.25Vitamin premix 0.25 0.25 0.25 0.25 0.25 0.25 0.25 0.25Trace mineral premix 0.15 0.15 0.15 0.15 0.15 0.15 0.15 0.15L-Lysine HCl 0.36 0.36 0.35 0.37 0.39 0.38 0.38 0.38DL-Methionine 0.17 0.13 0.10 0.06 0.20 0.15 0.11 0.07L-Threonine 0.15 0.12 0.08 0.04 0.15 0.12 0.08 0.04
Total 100 100 100 100 100 100 100 100
Calculated analysisStandardized ileal digestible amino acids, %Lysine 1.25 1.25 1.25 1.25 1.25 1.25 1.25 1.25Isoleucine:lysine 59 63 67 72 60 64 68 72Methionine:lysine 35 33 32 31 36 34 33 31Met & Cys:lysine 57 57 57 57 57 57 57 57Threonine:lysine 62 62 62 62 62 62 62 62Tryptophan:lysine 17 17 17 17 17 17 17 17Valine:lysine 65 71 77 83 66 72 78 83Total lysine, % 1.38 1.40 1.43 1.46 1.37 1.40 1.43 1.46CP, % 20.7 22.9 25.1 27.2 20.9 23.0 25.2 27.3ME kcal/lb 1,496 1,463 1,431 1,399 1,473 1,445 1,418 1,390Ca, % 0.75 0.75 0.75 0.75 0.75 0.75 0.75 0.75P, % 0.74 0.72 0.71 0.69 0.73 0.72 0.71 0.69Available P, % 0.42 0.42 0.42 0.42 0.42 0.42 0.42 0.421 Diets were fed in meal form from d 14 to 34 of the experiment.
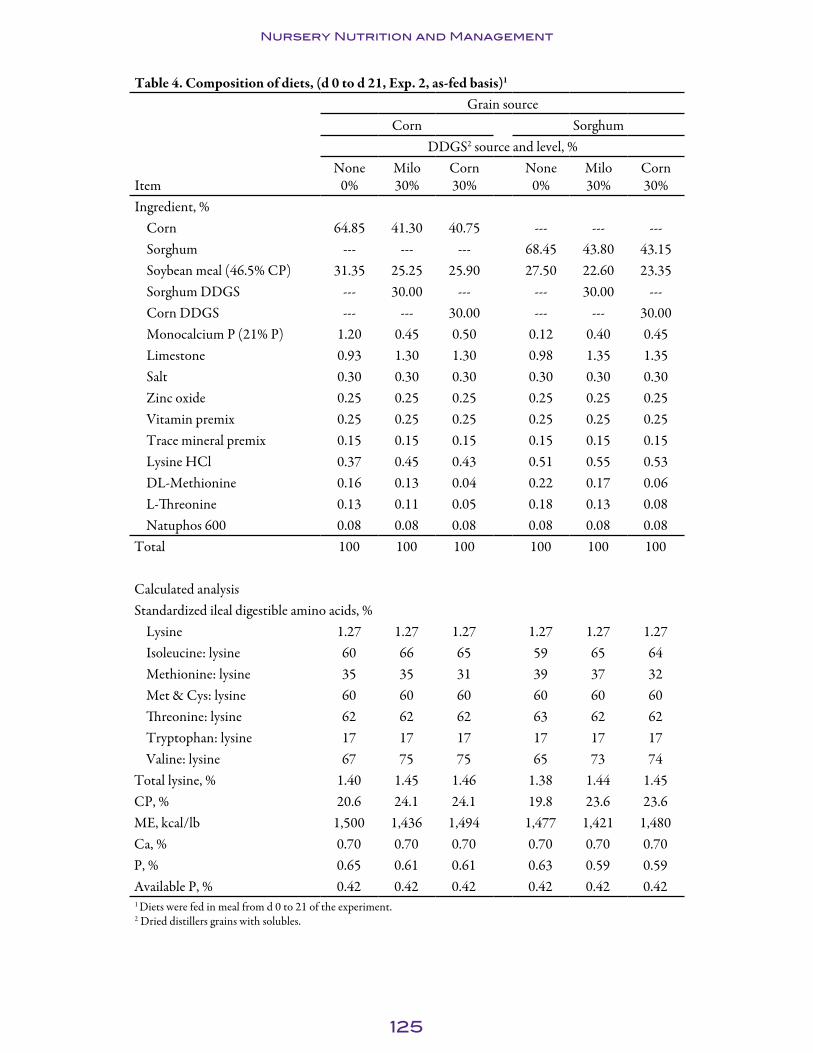
125
Nursery Nutrition and Management
Table 4. Composition of diets, (d 0 to d 21, Exp. 2, as-fed basis)1
Grain sourceCorn Sorghum
DDGS2 source and level, %
ItemNone
0%Milo 30%
Corn 30%
None 0%
Milo 30%
Corn 30%
Ingredient, %Corn 64.85 41.30 40.75 --- --- ---Sorghum --- --- --- 68.45 43.80 43.15Soybean meal (46.5% CP) 31.35 25.25 25.90 27.50 22.60 23.35Sorghum DDGS --- 30.00 --- --- 30.00 ---Corn DDGS --- --- 30.00 --- --- 30.00Monocalcium P (21% P) 1.20 0.45 0.50 0.12 0.40 0.45Limestone 0.93 1.30 1.30 0.98 1.35 1.35Salt 0.30 0.30 0.30 0.30 0.30 0.30Zinc oxide 0.25 0.25 0.25 0.25 0.25 0.25Vitamin premix 0.25 0.25 0.25 0.25 0.25 0.25Trace mineral premix 0.15 0.15 0.15 0.15 0.15 0.15Lysine HCl 0.37 0.45 0.43 0.51 0.55 0.53DL-Methionine 0.16 0.13 0.04 0.22 0.17 0.06L-Threonine 0.13 0.11 0.05 0.18 0.13 0.08Natuphos 600 0.08 0.08 0.08 0.08 0.08 0.08
Total 100 100 100 100 100 100
Calculated analysisStandardized ileal digestible amino acids, %
Lysine 1.27 1.27 1.27 1.27 1.27 1.27Isoleucine: lysine 60 66 65 59 65 64Methionine: lysine 35 35 31 39 37 32Met & Cys: lysine 60 60 60 60 60 60Threonine: lysine 62 62 62 63 62 62Tryptophan: lysine 17 17 17 17 17 17Valine: lysine 67 75 75 65 73 74
Total lysine, % 1.40 1.45 1.46 1.38 1.44 1.45CP, % 20.6 24.1 24.1 19.8 23.6 23.6ME, kcal/lb 1,500 1,436 1,494 1,477 1,421 1,480Ca, % 0.70 0.70 0.70 0.70 0.70 0.70P, % 0.65 0.61 0.61 0.63 0.59 0.59Available P, % 0.42 0.42 0.42 0.42 0.42 0.421 Diets were fed in meal from d 0 to 21 of the experiment.2 Dried distillers grains with solubles.
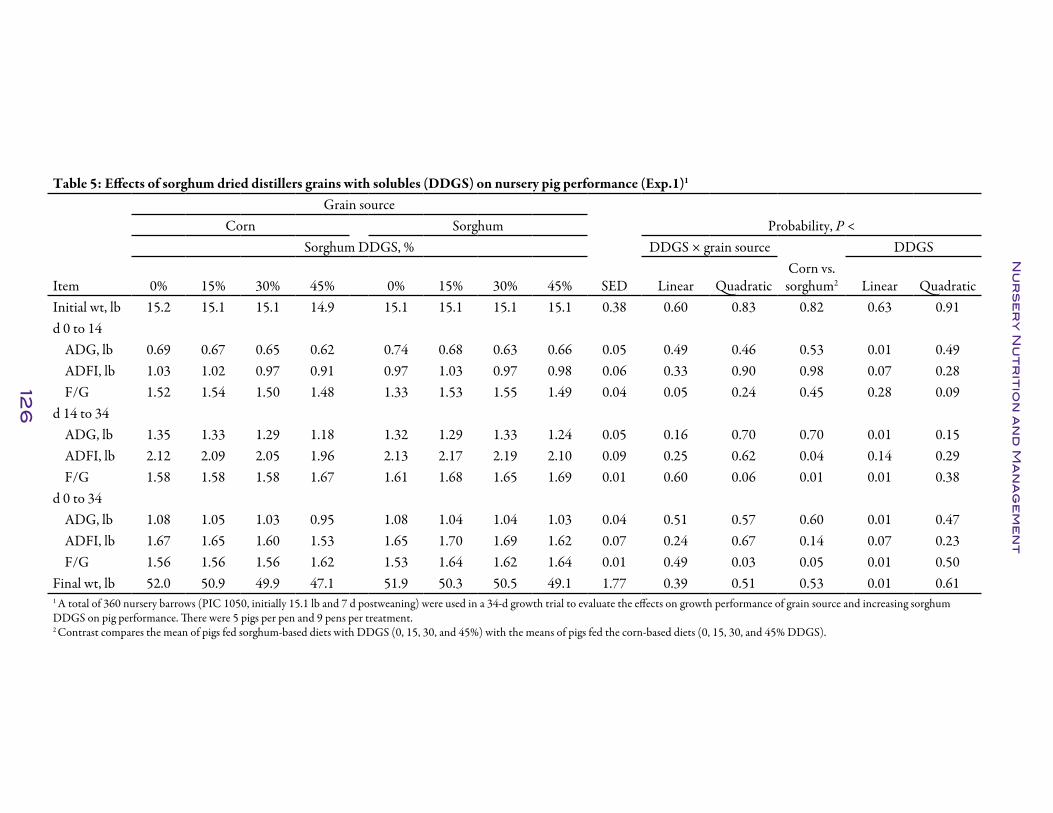
126
Nu
rs
er
y N
ut
rit
ion
an
d M
an
ag
em
en
t
Table 5: Effects of sorghum dried distillers grains with solubles (DDGS) on nursery pig performance (Exp.1)1
Grain sourceCorn Sorghum Probability, P <
Sorghum DDGS, % DDGS × grain source DDGS
Item 0% 15% 30% 45% 0% 15% 30% 45% SED Linear QuadraticCorn vs.
sorghum2 Linear QuadraticInitial wt, lb 15.2 15.1 15.1 14.9 15.1 15.1 15.1 15.1 0.38 0.60 0.83 0.82 0.63 0.91d 0 to 14
ADG, lb 0.69 0.67 0.65 0.62 0.74 0.68 0.63 0.66 0.05 0.49 0.46 0.53 0.01 0.49ADFI, lb 1.03 1.02 0.97 0.91 0.97 1.03 0.97 0.98 0.06 0.33 0.90 0.98 0.07 0.28F/G 1.52 1.54 1.50 1.48 1.33 1.53 1.55 1.49 0.04 0.05 0.24 0.45 0.28 0.09
d 14 to 34ADG, lb 1.35 1.33 1.29 1.18 1.32 1.29 1.33 1.24 0.05 0.16 0.70 0.70 0.01 0.15ADFI, lb 2.12 2.09 2.05 1.96 2.13 2.17 2.19 2.10 0.09 0.25 0.62 0.04 0.14 0.29F/G 1.58 1.58 1.58 1.67 1.61 1.68 1.65 1.69 0.01 0.60 0.06 0.01 0.01 0.38
d 0 to 34ADG, lb 1.08 1.05 1.03 0.95 1.08 1.04 1.04 1.03 0.04 0.51 0.57 0.60 0.01 0.47ADFI, lb 1.67 1.65 1.60 1.53 1.65 1.70 1.69 1.62 0.07 0.24 0.67 0.14 0.07 0.23F/G 1.56 1.56 1.56 1.62 1.53 1.64 1.62 1.64 0.01 0.49 0.03 0.05 0.01 0.50
Final wt, lb 52.0 50.9 49.9 47.1 51.9 50.3 50.5 49.1 1.77 0.39 0.51 0.53 0.01 0.611 A total of 360 nursery barrows (PIC 1050, initially 15.1 lb and 7 d postweaning) were used in a 34-d growth trial to evaluate the effects on growth performance of grain source and increasing sorghum DDGS on pig performance. There were 5 pigs per pen and 9 pens per treatment.2 Contrast compares the mean of pigs fed sorghum-based diets with DDGS (0, 15, 30, and 45%) with the means of pigs fed the corn-based diets (0, 15, 30, and 45% DDGS).

127
Nu
rs
er
y N
ut
rit
ion
an
d M
an
ag
em
en
t
Table 6. Main effects of grain source and sorghum dried distillers grains with solubles (DDGS) on nursery pig performance (Exp. 1)1
Probability, P <Grain source Sorghum DDGS, % DDGS level
Item Corn Sorghum SED 0% 15% 30% 45% SEDGrain source Linear Quadratic
d 0 to 14ADG, lb 0.66 0.67 0.02 0.72 0.67 0.64 0.63 0.03 0.53 0.01 0.49ADFI, lb 0.98 0.98 0.03 1.00 1.03 0.97 0.93 0.05 0.98 0.07 0.28F/G 1.51 1.48 0.04 1.43 1.53 1.52 1.49 0.06 0.45 0.28 0.09
d 14 to 34ADG, lb 1.29 1.30 0.03 1.33 1.31 1.31 1.21 0.04 0.70 0.01 0.15ADFI, lb 2.06 2.14 0.04 2.12 2.13 2.12 2.03 0.06 0.04 0.14 0.29F/G 1.60 1.66 0.02 1.59 1.63 1.62 1.68 0.02 0.01 0.01 0.38
d 0 to 34ADG, lb 1.03 1.04 0.02 1.08 1.05 1.03 0.97 0.03 0.60 0.01 0.47ADFI, lb 1.61 1.67 0.04 1.66 1.68 1.65 1.58 0.05 0.14 0.07 0.23F/G 1.58 1.61 0.02 1.54 1.60 1.59 1.63 0.02 0.05 0.01 0.50
Weight, lbd 0 15.0 15.1 0.09 15.1 15.1 15.1 15.0 0.27 0.82 0.63 0.91d 14 24.2 24.5 0.44 25.1 24.5 24.0 23.8 0.62 0.57 0.02 0.64d 34 49.9 50.5 0.89 51.8 50.6 50.2 48.1 1.25 0.53 0.01 0.61
1 A total of 360 nursery barrows (PIC 1050, initially 15.1 lb and 7 d postweaning) were used in a 34-d growth trial to evaluate the effects on growth performance of grain source and increasing sorghum DDGS on pig performance. There were 5 pigs per pen and 9 pens per treatment.

128
Nu
rs
er
y N
ut
rit
ion
an
d M
an
ag
em
en
t
Table 7. An evaluation of corn and sorghum dried distillers grains with solubles (DDGS) on nursery pigs performance (Exp. 2)1
TreatmentsA B C D E F
Grain sourceCorn Sorghum Probability, P <
DDGS source and level, % Grain source × DDGS
interactionCorn vs.
sorghum2
Corn DDGS vs. sorghum
DDGS3Control vs.
DDGS4ItemNone
0%Sorghum
30%Corn 30%
None 0%
Sorghum 30%
Corn 30% SED
d 0 to 21ADG, lb 1.17 1.09 1.13 1.19 1.15 1.10 0.04 0.38 0.56 0.86 0.03ADFI, lb 1.78 1.81 1.77 1.90 1.85 1.76 0.07 0.39 0.21 0.25 0.32F/G 1.53 1.66 1.57 1.60 1.61 1.61 0.02 0.22 0.51 0.24 0.14
Weight, lbd 0 23.6 23.6 23.7 23.6 23.6 23.6 0.79 1.00 0.93 0.94 0.96d 21 48.1 46.6 48.6 47.7 46.7 46.7 1.28 0.60 0.73 0.96 0.13
1 A total of 180 nursery pigs (PIC 327 × 1050, initially 23.8 lb and 38 d of age) were used in a 21-d growth trial to determine the effects of corn or sorghum DDGS (0, 30%) on growth performance. There were 6 pigs per pen and 5 pens per treatment.2 Corn vs. sorghum (treatment A, B, and C vs. treatment D, E, and F).3 Corn DDGS vs. sorghum DDGS (treatment C and F vs. treatment B and E).4 Basal diets vs. diets with sorghum or corn DDGS (treatment A and D vs. treatment B, C, E, and F).
Table 8. Main effects of grain source and dried distillers grains with solubles (DDGS) on nursery pig performance (Exp. 2)1
Grain source DDGS source DDGS level, % Probability, P<
Item Corn Sorghum SED Corn Sorghum SED 0% 30% SEDGrain source
DDGS source
DDGS level2
d 0 to 21ADG, lb 1.13 1.15 0.03 1.12 1.12 0.03 1.18 1.12 0.02 0.56 0.86 0.03ADFI, lb 1.79 1.84 0.04 1.77 1.83 0.05 1.84 1.80 0.02 0.21 0.25 0.32F/G 1.58 1.60 0.03 1.59 1.63 0.04 1.56 1.61 0.02 0.51 0.24 0.14
Weight, lbd 0 23.6 23.6 0.45 23.6 23.6 0.56 23.6 23.6 0.28 0.93 0.94 0.96d 21 47.4 47.6 0.74 47.1 47.1 0.91 48.3 47.1 0.45 0.73 0.96 0.13
1 A total of 180 nursery pigs (PIC 327 × 1050, initially 23.8 lb and 38 d of age) were used in a 21-d growth trial to determine the effects of corn or sorghum DDGS (0, 30%) on growth performance. There were 6 pigs per pen and 5 pens per treatment.2 Values for 30% DDGS include corn and sorghum DDGS.
129
Nursery Nutrition and Management
Effects of XFE Liquid Energy and Choice White Grease on Nursery Pig Performance1
W. Ying, J. M. DeRouchey, M. D. Tokach, S. S. Dritz2, R. D. Goodband, and J. L. Nelssen
SummaryTwo experiments were conducted to evaluate the effects of XFE Liquid Energy (XFE Products, Des Moines, IA) and choice white grease (CWG) on growth performance of nursery pigs. In Exp. 1, a total of 150 nursery pigs (TR4 × 1050, initially 27.0 lb) were used in a 21-d experiment. Pens of pigs were balanced by initial BW and randomly allotted to 1 of 5 dietary treatments with 6 replications per treatment. The 5 dietary treatments included a control corn-soybean meal-based diet, the control diet with 2 or 4% CWG, or the control diet with 2 or 4% liquid energy. Overall (d 0 to 21), pigs fed diets containing liquid energy had improved ADG (P < 0.02) and ADFI (P < 0.04) with no change in F/G compared with control pigs. Pigs fed CWG had greater (P < 0.04) ADG and improved (P < 0.01) F/G compared with pigs fed the control diet. The responses tended to be linear (P < 0.09) for liquid energy and were linear (P < 0.05) for CWG. Finally, pigs fed CWG had improved (P < 0.02) F/G compared with pigs fed liquid energy.
In Exp. 2, a total of 228 nursery pigs (TR4 × 1050, initially 14.1 lb and 3 d postwean-ing) were used in 30-d trial. Pigs were randomly allotted to 1 of 6 dietary treatments with 7 pens per treatment. Treatment diets were fed in 2 phases, with Phase 1 diets all containing 4.5% fishmeal and 10% dried whey. The 6 dietary treatments were in a 2 × 3 factorial arrangement with main effects of either 0 or 4% CWG and 0, 2, or 4% liquid energy. Diets were formulated to equal standardized ileal digestible (SID) lysine:ME for each phase. From d 0 to 14, a CWG × liquid energy interaction (quadratic, P < 0.01) was observed for ADG, which was the result of 2% liquid energy decreasing ADG when added to diets without CWG but increasing ADG when added to diet containing CWG. Pigs fed CWG had decreased ADG (P < 0.05) and ADFI (P < 0.02) compared with the pigs fed diets without CWG. Growth in pigs fed liquid energy did not differ. From d 14 to 30, a CWG × liquid energy interaction (quadratic, P < 0.02) occurred for ADFI. Pigs fed 2% liquid energy without CWG had lower ADFI compared with other no-CWG treatments; however, pigs fed the CWG diet with 2% liquid energy had greater ADFI than other CWG treatments. The addition of CWG decreased (P < 0.01) ADFI but improved (P < 0.01) F/G compared with pigs fed no CWG. Growth for pigs fed liquid energy did not differ. Overall (d 0 to 30), CWG × liquid energy interac-tions were observed for ADG (quadratic, P < 0.07) and ADFI (quadratic, P < 0.03). Feeding liquid energy in diets without CWG resulted in lower ADG and feed intake; however, addition of liquid energy to diets containing CWG improved ADG and feed consumption compared with the 4% CWG diet without liquid energy. Pigs fed CWG had reduced (P < 0.01) ADFI and improved (P < 0.01) F/G compared with pigs fed
1 Appreciation is expressed to XFE Products, Des Moines, IA, for donation of XFE Liquid Energy used in the experiments.2 Department of Diagnostic Medicine/Pathobiology, College of Veterinary Medicine, Kansas State University.

130
Nursery Nutrition and Management
diets without CWG. Feeding liquid energy had no significant influence on any growth criteria.
Feeding CWG improved F/G as expected in both experiments. Although ADG was improved in one experiment for pigs fed liquid energy, no differences were found in feed efficiency. These trials indicate additional research is needed to understand the effects of XFE liquid energy in nursery diets.
Key words: choice white grease, liquid energy, nursery pig
IntroductionAdding energy to nursery diets via fat sources is a common practice. For diets immedi-ately postweaning, this is done primarily to aid in pellet quality and prevent burning of specialty protein and lactose ingredients. When added to diets during the middle to late nursery period, added fat can help improve ADG and F/G; however, with the increased price of added fat, many producers have reduced or removed fat from non-pelleted nursery diets. Thus, other sources of energy for nursery pigs are being sought.
One potential alternative is XFE Liquid Energy (XFE Products, Des Moines, IA), which is an alcohol-based liquid product. Research to determine the effect of alcohol in diets for nursery pigs has been limited; therefore, the objective of these 2 experiments was to evaluate the effects of XFE Liquid Energy and compare XFE Liquid Energy and choice white grease (CWG) on the growth performance of nursery pigs.
ProceduresThe Kansas State University Institutional Animal Care and Use Committee approved all experimental procedures. Both experiments were conducted at the K-State Swine Teaching and Research Center in Manhattan, KS.
In Exp. 1, a total of 150 nursery pigs (TR4 × 1050, initially 27.0 lb) were used in a 21-d experiment. Pigs were weaned at 21 d of age and fed common starter diets until the beginning of the experimental period. Pigs were allotted to 1 of 5 treatments with 5 pigs per pen and 6 pens per treatment. Dietary treatments included a control corn-soybean meal-based diet or the control diet with 2 or 4% liquid energy or 2 or 4% CWG. Diets were formulated to the recommended standardized ileal digestible (SID) lysine:ME ratio (3.81 g/Mcal) for pig weight (Table 1). The ME of liquid energy used in diet formulation was equal to that of CWG (3.62 Mcal/lb). All experimental diets were fed in meal form. Pigs were weighed and feed disappearance was determined on d 0, 7, 14, and 21 of the trial to calculate ADG, ADFI, and F/G.
In Exp. 2, a total of 228 nursery pigs (TR4 × 1050, initially 14.1 lb and 3 d postwean-ing) were used in 30-d trial. Pigs were weaned at 21 d of age and fed a common diet for 3 d. At weaning, pigs were randomly allotted to pens by initial BW. On d 3 postwean-ing, pigs were weighed and pens were randomly allotted and assigned to 1 of 6 dietary treatments with 7 pens per treatment. Experimental diets were fed in 2 phases. The 6 dietary treatments were in a 2 × 3 factorial arrangement with 0 or 4% CWG and 0, 2, or 4% liquid energy (Table 2). Diets were formulated to the recommended SID lysine:ME for each phase. The ME of liquid energy used in diet formulation was equal

131
Nursery Nutrition and Management
to that of CWG (3.62 Mcal/lb). All experimental diets were fed in meal form. Pigs were weighed and feed disappearance was determined on d 0, 7, 14, 21, and 30 of the trial to calculate ADG, ADFI, and F/G.
Data were analyzed using the MIXED procedure in SAS (SAS Institute, Inc., Cary, NC) with pen as the experimental unit. Contrast statements were used to compare diets containing liquid energy or CWG with the control diet and with each other. Contrasts were also used to test the linear and quadratic effects of increasing the addi-tions of liquid energy and CWG in the diets with the control diet used as the lowest dosage level. In addition, the interactions between liquid energy and CWG were tested in Exp. 2.
Results and DiscussionIn Exp. 1, pigs fed diets containing liquid energy had improved ADG (P < 0.02) and ADFI (P < 0.04), but no difference in F/G compared with pigs fed the control diet (Table 3). Pigs fed CWG had greater (P < 0.04) ADG and improved (P < 0.01) F/G than pigs fed the control diet. Increasing dietary liquid energy tended to increase ADG (linear, P < 0.08) and ADFI (linear, P < 0.09), with pigs fed increasing CWG showing improved ADG (linear, P < 0.05) and F/G (linear, P < 0.01). Finally, pigs fed CWG tended to have lower (P < 0.08) ADFI but improved (P < 0.02) F/G compared with pigs fed liquid energy.
Based on the results of Exp. 1, the addition of dietary liquid energy improved ADG through an increase in ADFI, but did not change F/G, whereas the improvement in ADG from CWG was due to an improvement in F/G. Therefore, the objective of Exp. 2 was to determine the effect of combination of CWG and liquid energy in nursery diets on growth performance.
In Exp. 2, from d 0 to 14, a CWG × liquid energy interaction (quadratic, P < 0.01) was observed for ADG, which was the result of pigs fed 2% liquid energy showing lower ADG than pigs fed 0 or 4% liquid energy when added to diets without CWG but higher ADG when added to diets containing CWG. For the main effects, pigs fed diets containing CWG had decreased ADG (P < 0.05) and ADFI (P < 0.02), but adding liquid energy to the diet did not influence growth performance (Table 4).
From d 14 to 30, a CWG × liquid energy interaction (quadratic, P < 0.02) was observed for ADFI. Adding 2% liquid energy to the diet resulted in lower feed ADFI when added to diets without CWG, but resulted in greater ADFI when added to diets containing CWG. The addition of CWG decreased (P < 0.01) ADFI but improved (P < 0.01) F/G compared with pigs fed diets without CWG.
Overall (d 0 to 30), a tendency (quadratic, P < 0.07) was found for a CWG × liquid energy interaction for ADG and an interaction (quadratic, P < 0.03) for ADFI. Adding liquid energy to diets without CWG reduced ADG and feed intake; however, adding liquid energy to diets containing CWG increased ADG and ADFI. Neither the addi-tion of CWG nor liquid energy increased ADG compared with the control pigs. For main effects, pigs fed CWG had reduced (P < 0.01) ADFI and improved (P < 0.01)

132
Nursery Nutrition and Management
F/G compared with pigs fed the control diet. Feeding liquid energy did not influence ADFI or F/G.
Similar to the tendencies for interactions for ADG from d 0 to 14 and overall, a tendency occurred for a CWG × liquid energy interaction (quadratic, P < 0.08) for body weight on d 14 and 30 because adding 2% liquid energy to diets without CWG decreased weight on d 14 and 30 whereas adding 2% liquid energy to diets with CWG increased weight on 14 and 30. Neither CWG nor liquid energy increased BW compared with pigs fed the control diet.
In conclusion, feeding CWG improved F/G as expected in both experiments. Although ADG was improved in the first experiment for pigs fed liquid energy, no differences in F/G were found. These trials indicate additional research is needed to understand the effects of XFE liquid energy in nursery diets.

133
Nursery Nutrition and Management
Table 1. Composition of experimental diets (Exp. 1, as-fed basis)1
CWG2 Liquid energy3
Item Control 2% 4% 2% 4%Ingredient, %
Corn 65.00 61.50 58.15 61.50 58.13Soybean meal, 46.5% CP 31.40 32.85 34.20 32.85 34.20CWG -- 2.00 4.00 -- --Liquid energy3 -- -- -- 2.00 4.00Monocalcium P, 21% P 1.10 1.10 1.10 1.10 1.10Limestone 1.03 1.03 1.00 1.03 1.00Salt 0.35 0.35 0.35 0.35 0.35Vitamin premix 0.25 0.25 0.25 0.25 0.25Trace mineral premix 0.15 0.15 0.15 0.15 0.15L-Lysine HCl 0.35 0.355 0.36 0.355 0.36DL-Methionine 0.135 0.15 0.16 0.15 0.165L-Threonine 0.135 0.145 0.15 0.145 0.15Phytase4 0.125 0.125 0.125 0.125 0.125
Total 100.0 100.0 100.0 100.0 100.0
Calculated analysisStandardized ileal digestible (SID) amino acids
Lysine, % 1.26 1.30 1.33 1.30 1.33Isoleucine:lysine, % 60 60 60 60 60Methionine:lysine, % 34 34 35 34 35Met & Cys:lysine, % 58 58 58 58 58Threonine:lysine, % 63 63 63 63 63Tryptophan:lysine, % 17.2 17.2 17.2 17.2 17.2Valine:lysine, % 67 67 66 67 66
Total lysine, % 1.39 1.43 1.47 1.43 1.47 ME, kcal/lb 1,502 1,543 1,584 1,543 1,584SID lysine:ME, g/Mcal 3.81 3.81 3.81 3.81 3.81CP, % 20.6 21.0 21.4 21.0 21.4Ca, % 0.72 0.72 0.72 0.72 0.72P, % 0.63 0.63 0.63 0.63 0.63Available P, % 0.43 0.43 0.43 0.43 0.431 A total of 150 nursery pigs (TR4 × 1050, initially 27.0 lb) were used in a 21-d study with 5 pigs per pen and 6 replications per treatment.2 Choice white grease.3 XFE Products, Des Moines, IA.4 Phyzyme 600 (Danisco Animal Nutrition, St. Louis, MO), providing 231 FTU/lb, with a release of 0.10% avail-able P.

134
Nu
rs
er
y N
ut
rit
ion
an
d M
an
ag
em
en
t
Table 2. Composition of experimental diets (Exp. 2, as-fed basis)1
Phase 12 Phase 23
CWG, %4 0 0 0 4 4 4 0 0 0 4 4 4Item Liquid energy, %5 0 2 4 0 2 4 0 2 4 0 2 4Ingredient, %
Corn 55.25 51.90 48.45 48.45 45.00 41.75 65.00 60.15 58.15 58.15 54.60 51.05Soybean meal, 46.5% CP 27.45 28.75 30.25 30.25 31.65 32.85 31.40 32.85 34.20 34.20 35.75 37.30Select menhaden fish meal 4.50 4.50 4.50 4.50 4.50 4.50 -- -- -- -- -- --Spray-dried whey 10.00 10.00 10.00 10.00 10.00 10.00 -- -- -- -- -- --Choice white grease -- -- -- 4.00 4.00 4.00 -- -- -- 4.00 4.00 4.00Liquid energy3 -- 2.00 4.00 -- 2.00 4.00 -- 2.00 4.00 -- 2.00 4.00Monocalcium P, 21% P 0.45 0.45 0.45 0.45 0.45 0.45 1.10 1.10 1.10 1.10 1.10 1.10Limestone 0.65 0.65 0.63 0.63 0.63 0.63 1.13 1.00 1.00 1.00 1.00 0.98Salt 0.35 0.35 0.35 0.35 0.35 0.35 0.35 0.35 0.35 0.35 0.35 0.35Zinc oxide 0.275 0.275 0.275 0.275 0.275 0.275 -- -- -- -- -- --Vitamin premix 0.25 0.25 0.25 0.25 0.25 0.25 0.25 0.25 0.25 0.25 0.25 0.25Trace mineral premix 0.15 0.15 0.15 0.15 0.15 0.15 0.15 0.15 0.15 0.15 0.15 0.15L-Lysine HCl 0.265 0.275 0.28 0.28 0.29 0.30 0.35 0.355 0.36 0.36 0.36 0.36DL-methionine 0.14 0.155 0.17 0.17 0.185 0.20 0.135 0.15 0.165 0.16 0.175 0.18L-Threonine 0.125 0.145 0.15 0.145 0.155 0.165 0.125 0.145 0.15 0.15 0.15 0.15L-Valine -- -- -- -- 0.005 0.0075 -- -- -- -- -- --Phytase6 0.125 0.125 0.125 0.125 0.125 0.125 0.125 0.125 0.125 0.125 0.125 0.125
Total 100.0 100.0 100.0 100.0 100.0 100.0 100.0 100.0 100.0 100.0 100.0 100.0continued
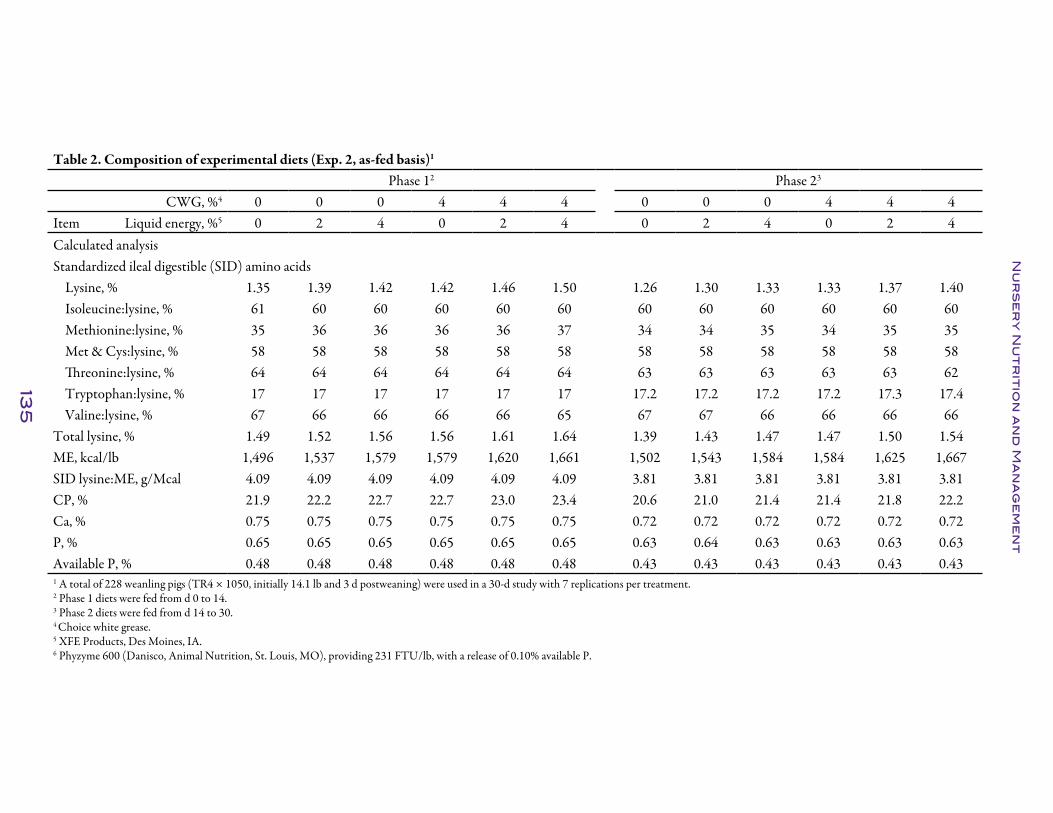
135
Nu
rs
er
y N
ut
rit
ion
an
d M
an
ag
em
en
t
Table 2. Composition of experimental diets (Exp. 2, as-fed basis)1
Phase 12 Phase 23
CWG, %4 0 0 0 4 4 4 0 0 0 4 4 4Item Liquid energy, %5 0 2 4 0 2 4 0 2 4 0 2 4Calculated analysisStandardized ileal digestible (SID) amino acids
Lysine, % 1.35 1.39 1.42 1.42 1.46 1.50 1.26 1.30 1.33 1.33 1.37 1.40 Isoleucine:lysine, % 61 60 60 60 60 60 60 60 60 60 60 60Methionine:lysine, % 35 36 36 36 36 37 34 34 35 34 35 35Met & Cys:lysine, % 58 58 58 58 58 58 58 58 58 58 58 58Threonine:lysine, % 64 64 64 64 64 64 63 63 63 63 63 62Tryptophan:lysine, % 17 17 17 17 17 17 17.2 17.2 17.2 17.2 17.3 17.4Valine:lysine, % 67 66 66 66 66 65 67 67 66 66 66 66
Total lysine, % 1.49 1.52 1.56 1.56 1.61 1.64 1.39 1.43 1.47 1.47 1.50 1.54 ME, kcal/lb 1,496 1,537 1,579 1,579 1,620 1,661 1,502 1,543 1,584 1,584 1,625 1,667SID lysine:ME, g/Mcal 4.09 4.09 4.09 4.09 4.09 4.09 3.81 3.81 3.81 3.81 3.81 3.81CP, % 21.9 22.2 22.7 22.7 23.0 23.4 20.6 21.0 21.4 21.4 21.8 22.2Ca, % 0.75 0.75 0.75 0.75 0.75 0.75 0.72 0.72 0.72 0.72 0.72 0.72P, % 0.65 0.65 0.65 0.65 0.65 0.65 0.63 0.64 0.63 0.63 0.63 0.63Available P, % 0.48 0.48 0.48 0.48 0.48 0.48 0.43 0.43 0.43 0.43 0.43 0.431 A total of 228 weanling pigs (TR4 × 1050, initially 14.1 lb and 3 d postweaning) were used in a 30-d study with 7 replications per treatment.2 Phase 1 diets were fed from d 0 to 14. 3 Phase 2 diets were fed from d 14 to 30.4 Choice white grease.5 XFE Products, Des Moines, IA.6 Phyzyme 600 (Danisco, Animal Nutrition, St. Louis, MO), providing 231 FTU/lb, with a release of 0.10% available P.

136
Nu
rs
er
y N
ut
rit
ion
an
d M
an
ag
em
en
t
Table 3. Effects of XFE Liquid Energy and choice white grease on nursery pig performance (Exp. 1)1
Probability, P <CWG2 Liquid energy3
SEMCWG vs. control
Liquid energy
vs. control
CWG Liquid energy CWG vs. liquid
energyItem Control 2% 4% 2% 4% Linear Quad Linear Quadd 0 to 21
ADG, lb 1.38 1.45 1.47 1.48 1.46 0.03 0.04 0.02 0.05 0.52 0.08 0.12 0.75ADFI, lb 2.12 2.20 2.11 2.24 2.23 0.04 0.53 0.04 0.83 0.11 0.09 0.22 0.08F/G 1.54 1.52 1.43 1.51 1.52 0.02 0.01 0.41 <0.01 0.18 0.65 0.40 0.02
BW, lbd 0 27.0 27.1 27.0 27.1 27.0 0.4 0.98 0.98 1.00 0.97 1.00 0.96 0.99d 21 56.1 57.6 58.0 58.2 57.8 0.8 0.10 0.07 0.11 0.59 0.15 0.21 0.80
1 A total of 150 pigs (TR4 × 1050, initially 27.0 lb) were used with 5 pigs per pen and 6 pens per treatment.2 Choice white grease.3 XFE Products, Des Moines, IA.

137
Nu
rs
er
y N
ut
rit
ion
an
d M
an
ag
em
en
t
Table 4. Effects of XFE Liquid Energy and choice white grease on nursery pig performance (Exp. 2)1
Probability, P <
CWG, %2 0 0 0 4 4 4CWG ×
liquid energy Main effects Liquid energy
Item Liquid energy, %3 0 2 4 0 2 4 SEM Linear Quad CWGLiquid energy Linear Quad
d 0 to 14ADG, lb 0.60 0.53 0.59 0.48 0.57 0.55 0.03 0.14 0.01 0.05 0.33 0.19 0.73ADFI, lb 0.85 0.83 0.87 0.73 0.80 0.76 0.04 0.98 0.29 0.02 0.47 0.55 0.67F/G 1.42 1.58 1.47 1.55 1.41 1.39 0.06 0.10 0.10 0.45 0.68 0.38 0.48
d 14 to 30ADG, lb 1.14 1.11 1.12 1.11 1.17 1.15 0.04 0.44 0.42 0.54 0.82 0.88 0.84ADFI, lb 1.87 1.71 1.81 1.63 1.72 1.67 0.05 0.28 0.02 <0.01 0.65 0.85 0.55F/G 1.64 1.55 1.63 1.47 1.48 1.46 0.04 0.93 0.13 <0.01 0.52 0.82 0.38
d 0 to 30ADG, lb 0.89 0.84 0.87 0.81 0.89 0.87 0.03 0.22 0.07 0.69 0.55 0.49 0.99ADFI, lb 1.39 1.30 1.37 1.21 1.29 1.24 0.04 0.48 0.03 <0.01 0.93 0.84 0.87F/G 1.57 1.56 1.58 1.49 1.46 1.44 0.04 0.41 0.83 <0.01 0.52 0.56 0.79
BW, lbd 0 14.1 14.1 14.1 14.1 14.1 14.1 0.1 0.96 0.93 0.99 0.95 0.94 0.99d 14 22.5 21.4 22.4 20.7 22.0 21.8 0.4 0.19 0.02 0.08 0.38 0.24 0.77d 30 40.7 39.2 40.3 38.5 40.7 40.1 0.9 0.24 0.08 0.70 0.56 0.51 0.99
1 A total of 228 pigs (TR4 × 1050, initially 14.1 lb) were used in a 30-d trial with 7 pens per treatment. Phase 1 diets were fed from d 0 to 14, and Phase 2 diets were fed from d 14 to 30.2 Choice white grease.3 XFE Products, Des Moines, IA.
138
Nursery Nutrition and Management
Influence of Standardized Ileal Digestible Tryptophan:Lysine Ratio on Growth Performance of 13- to 21-lb Nursery Pigs
S. Nitikanchana1, M. D. Tokach, S. S. Dritz1, J. M. DeRouchey, R. D. Goodband, J. E. Nemecheck, J. L. Nelssen, and J. Usry2
SummaryA total of 255 nursery pigs (PIC 327 × 1050, initially 13.8 lb and 3 d postweaning) were used in a 28-d growth trial to determine the minimum standardized ileal digestible (SID) tryptophan:lysine ratio for 13- to 21-lb pigs. A 2-phase diet series was used with treatment diets fed from d 0 to 14 and a common diet fed from d 14 to 28. The 6 SID tryptophan:lysine ratios were 14.7, 16.5, 18.4, 20.3, 22.1, and 24.0%. Pigs were allotted on d 3 after weaning with 6 or 7 pigs per pen and 7 replications per treatment. Weight and feed disappearance were determined on d 0, 7, 14, 21, and 28 to calculate ADG, ADFI, and F/G. From d 0 to 14, increasing SID tryptophan:lysine ratio improved ADG (linear, P = 0.02) and generated a tendency for improved ADFI and F/G (linear, P = 0.06 and quadratic, P = 0.08, respectively). Although ADG and ADFI were linear, the greatest response was observed at a SID tryptophan:lysine ratio of 20.3%. From d 14 to 28, when the common diet was fed, ADFI increased (linear, P = 0.05) as SID tryptophan:lysine ratio increased in the previous period, but no differences were found in ADG and F/G.
For the overall trial (d 0 to 28), ADG and ADFI increased (linear, P = 0.02 and P = 0.03, respectively) with increasing SID tryptophan:lysine ratio, with the greatest response observed at 20.3%. Feed/gain was unaffected by SID tryptophan:lysine ratio. Thus, the optimal SID tryptophan:lysine ratio for 13- to 21-lb nursery pigs in this study appears to be at least 20.3%. This ratio is greater than the minimum ratio currently using in many practical diet formulations in the United States, indicating an importance of tryptophan in diet formulation of low-protein amino acid-fortified diets in the swine industry.
Key words: amino acid ratio, lysine, tryptophan, nursery pig
IntroductionIn the swine industry, crystalline amino acids (AA) have been widely used to replace soybean meal in low-protein AA-fortified diets. Several trials have demonstrated the successful use of crystalline AA in diets for nursery pigs to replace specialty protein sources, especially in Phase 2 (15- to 25-lb) diets. Tryptophan is the second limiting AA in most diets containing high levels of dried distillers grains with solubles (DDGS) and the fourth limiting amino acid in a typical corn-soybean meal diet. Thus, knowl-edge of the optimal tryptophan:lysine ratio is critical for practical diet formulation, but the optimal SID tryptophan:lysine ratio remains controversial due to the vari-
1 Department of Diagnostic Medicine/Pathobiology, College of Veterinary Medicine, Kansas State University.2 Ajinomoto Heartland LLC, Chicago, IL.
139
Nursery Nutrition and Management
ability among the trials. A range of 14.5 to 23.1% SID tryptophan:lysine ratio require-ments across various pig body weights have been reported (Quant, 20083). In nursery pigs, the calculated tryptophan:lysine ratio based on NRC4 amino acid requirement estimates is 18%. Several studies indicate a SID tryptophan requirement estimate of greater than 20% of lysine (Pluske and Mullen, 20005; Guzik et al., 20056; Jansman and Van Diepen, 20107), whereas the National Swine Nutrition Guide8 suggests a SID tryptophan:lysine ratio of 16.8%. Differences among these published studies may be related to diet composition, gender, genetics, chemical analysis, or method of statistical analysis; therefore, more studies are needed to establish a tryptophan:lysine ratio and validate the requirement. Thus, this trial was conducted to determine the minimum SID tryptophan:lysine ratio in nursery diets for 13- to 21-lb pigs.
ProceduresThe Kansas State University Institutional Animal Care and Use Committee approved the protocol used in this experiment. The study was conducted at the K-State Swine Teaching and Research Center in Manhattan, KS.
A total of 255 pigs were weaned at 21 d of age and placed in the nursery facility. At weaning, pigs were fed a common diet for 3 d. At d 3 after weaning, pigs were weighed and allotted to dietary treatments in a randomized complete block. Therefore, d 3 after weaning was d 0 in the trial. Each treatment had 7 replications with 6 or 7 pigs per pen. A 4-hole, dry self-feeder and a nipple waterer were used in each pen (4 ft × 5 ft) to provide ad libitum access to feed and water. Weight and feed disappearance were determined at d 0, 7, 14, 21, and 28 to calculate for ADG, ADFI, F/G, and income over feed cost (IOFC). Income over feed cost is a method to measure an economic value by assuming that other costs, such as utility and labor, are equal and the only variables are ADG and feed usage. Corn was valued at $233/ton, soybean meal at $340/ton, spray-dried whey at $769/ton, L-lysine HCl at $1,600/ton, DL-methionine at $3,000/ton, threonine at $2,300/ton, tryptophan at $24,000/ton, and pig price at $0.55/lb.
A 2-phase diet series was used with treatment diets fed from d 0 to 14 and a common diet fed from d 14 to 28 (Table 1). Experimental diets were corn-soybean meal-based with addition of crystalline tryptophan to achieve 6 levels of SID tryptophan that were 14.7, 16.5, 18.4, 20.3, 22.1, and 24.0% of lysine. Large batches of the 14.7% and 24.0% SID tryptophan:lysine diets were made then blended to achieve the intermediate SID tryptophan:lysine ratios. The lysine level of 1.3% in these experimental diets was selected based on data of Nemecheck et al. (20109) using the same genotype in the same
3 Quant, A. D. (2008). Standardized ileal digestible tryptophan to lysine ratios in growing pigs fed U.S.-type and non-U.S-type feedstuffs. College of Agriculture, University of Kentucky. Thesis.4 NRC. 1998. Nutrient Requirements of Swine, 10th ed. Natl. Acad. Press, Washington, DC.5 Pluske, J., and B. P. Mullan. 2000. Determining the optimum Tryptophan:Lysine ratio in diets for weaner pigs. Cited in: L–Tryptophan supplementation to enhance piglet growth. Ajinomoto Eurolysine Information. 23:1-11.6 Guzik, A. C., M. J. Pettit, E. Beltranena, L. L. Southern, and B. J. Kerr. 2005b. Threonine and trypto-phan ratios fed to nursery pigs. J. Anim. Physiol. Anim. Nutr. 89:297-302.7 Jansman, A. J. M., J. T. M. Van Diepen, D. Melchior. 2010. The effect of diet composition on trypto-phan requirement of young piglets. J. Anim. Sci. 88:1017-1027.8 National Swine Nutrition Guide. 2010. Table of Nutrient Recommendations, Ingredient Composi-tion, and Use Rates, U.S. Pork Center of Excellence, Ames, IA.9 Nemecheck et al., Swine Day 2010, Report of Progress 1038, pp. 22-26.

140
Nursery Nutrition and Management
nursery facility. The 14.7% SID tryptophan:lysine ratio diet was also verified to be defi-cient in tryptophan from a previous trial (Nemecheck et al., 201010). All diets contained 10% spray-dried whey and did not contain specialty protein sources such as spray-dried blood meal or menhaden fishmeal. All experimental diets were fed in meal form and were prepared at the K-State Animal Science Feed Mill. Diet samples were collected at the beginning of the trial and on d 7 and 14, then a composite sample was made and analyzed for AA analysis by Ajinomoto Heartland LLC, Chicago, IL (Table 2).
At the end of the trial, data were analyzed for linear and quadratic effects of increasing SID tryptophan:lysine ratio using the PROC MIXED procedure of SAS (SAS Insti-tute, Inc., Cary, NC). Pen was the experimental unit for all data analysis. Results were considered significant at P ≤ 0.05 and were considered a trend at P ≤ 0.10.
Results and DiscussionFrom d 0 to 14, increasing SID tryptophan:lysine ratio improved ADG (linear, P = 0.02) and a tendency for improved ADFI and F/G (linear, P = 0.06 and quadratic, P = 0.08, respectively; Table 3). Although the response was linear for ADG and ADFI, similar to F/G, performance was optimal for pigs fed the 20.3% SID tryptophan:lysine ratio. No differences were found in IOFC; however, pigs fed the 20.3% SID tryptophan:lysine ratio again resulted in the greatest IOFC.
From d 14 to 28, when a common diet was fed, ADFI increased (linear, P = 0.05) with increasing SID tryptophan:lysine ratio fed from d 0 to 14; however, no evidence of a carryover effect for ADG, F/G, and IOFC was observed. Again, pigs previously fed the 20.3% SID tryptophan:lysine ratio also had the greatest IOFC during this period.For the overall study (d 0 to 28), ADG and ADFI increased (linear, P = 0.02 and P = 0.03, respectively) with increasing SID tryptophan:lysine ratio, but no differ-ences occurred in F/G or IOFC. Although ADG and ADFI were linear in response, little benefit was gained in performance above the 20.3% SID tryptophan:lysine ratio. Although not significant, pigs fed the 20.3% SID tryptophan:lysine ratio had the great-est IOFC.
In summary, although the ADG increased linearly with increasing SID tryptophan: lysine ratio, a quadratic trend occurred for F/G (P = 0.08), with greatest response in ADG and F/G at 20.3%. Also, based on the IOFC analysis, these data suggest an optimal SID tryptophan:lysine ratio for 13- to 21-lb nursery pigs of at least 20.3%; however, this ratio is greater than the minimum ratio currently using in many practical diet formulations in the U.S., indicating the importance of tryptophan in diet formula-tion of low-protein AA-fortified diets in swine industry. The statistical analysis in this experiment also indicated a significant linear response with a quadratic trend; therefore, more studies are needed to validate the requirement of SID tryptophan:lysine ratio for nursery pigs in this period.
10 Nemecheck et al., Swine Day 2010, Report of Progress 1038, pp. 10-16.
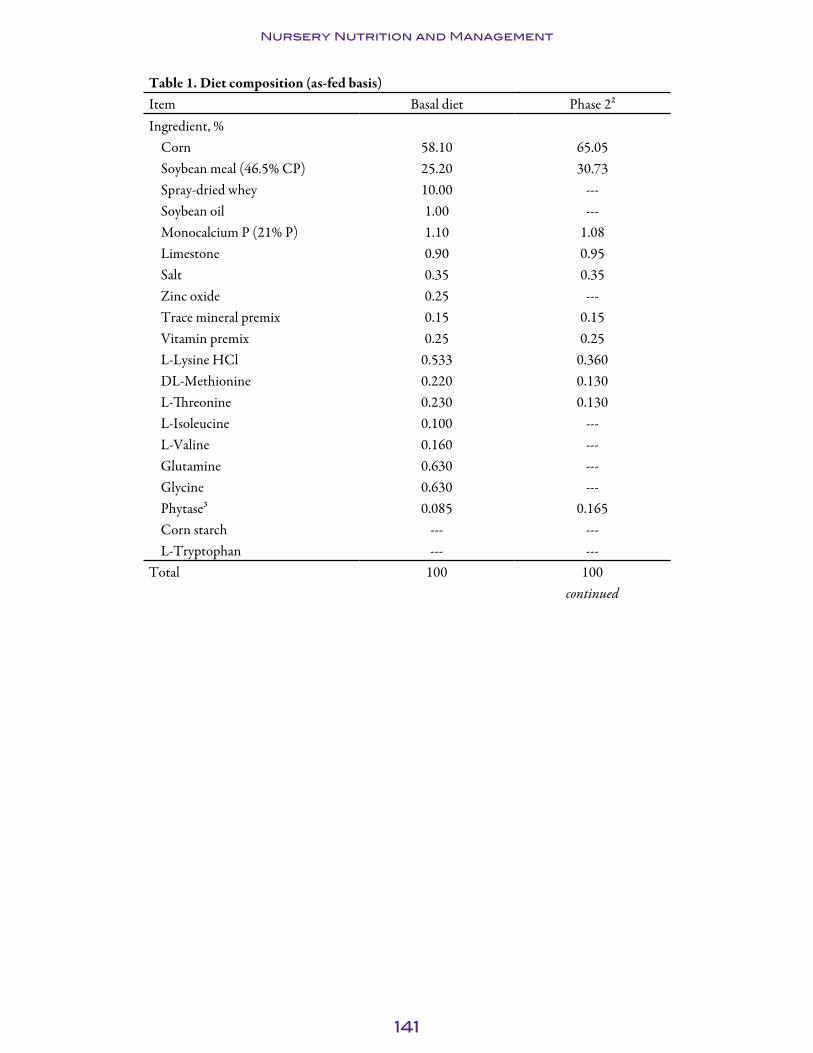
141
Nursery Nutrition and Management
Table 1. Diet composition (as-fed basis)Item Basal diet Phase 2²Ingredient, %
Corn 58.10 65.05Soybean meal (46.5% CP) 25.20 30.73Spray-dried whey 10.00 ---Soybean oil 1.00 ---Monocalcium P (21% P) 1.10 1.08Limestone 0.90 0.95Salt 0.35 0.35Zinc oxide 0.25 ---Trace mineral premix 0.15 0.15Vitamin premix 0.25 0.25L-Lysine HCl 0.533 0.360DL-Methionine 0.220 0.130L-Threonine 0.230 0.130L-Isoleucine 0.100 ---L-Valine 0.160 ---Glutamine 0.630 ---Glycine 0.630 ---Phytase³ 0.085 0.165Corn starch --- ---L-Tryptophan --- ---
Total 100 100continued

142
Nursery Nutrition and Management
Table 1. Diet composition (as-fed basis)Item Basal diet Phase 2²Calculated analysisStandadized ileal digestible (SID) amino acids, %
Lysine 1.30 1.26Isoleucine:lysine 60 61Leucine:lysine 111 129Methionine:lysine 36 33Met & Cys:lysine 58 58Threonine:lysine 64 63Tryptophan:lysine 14.7 17.0Valine:lysine 70 68
Total lysine, % 1.42 1.39ME, kcal/lb 1,517 1,503SID lysine:ME, g/Mcal 3.89 3.80CP, % 20.4 20.8Ca, % 0.72 0.69P, % 0.64 0.62Available P, % 0.47 0.42¹ Treatment diets were fed from d 0 to 14. ² Common diet was fed from d 14 to 28.³ Phytase 600 (Danisco Animal Nutrition, St. Louis, MO) provided 231 FTU/lb, with a release of 0.10% available P.4 L-Tryptophan was added at the expense of corn starch at 0, 0.024, 0.049, 0.074, 0.098, and 0.123% of the diet to provide tryptophan:lysine ratios of 47, 16.5, 18.4, 20.3, 22.1, and 24.0% of lysine.
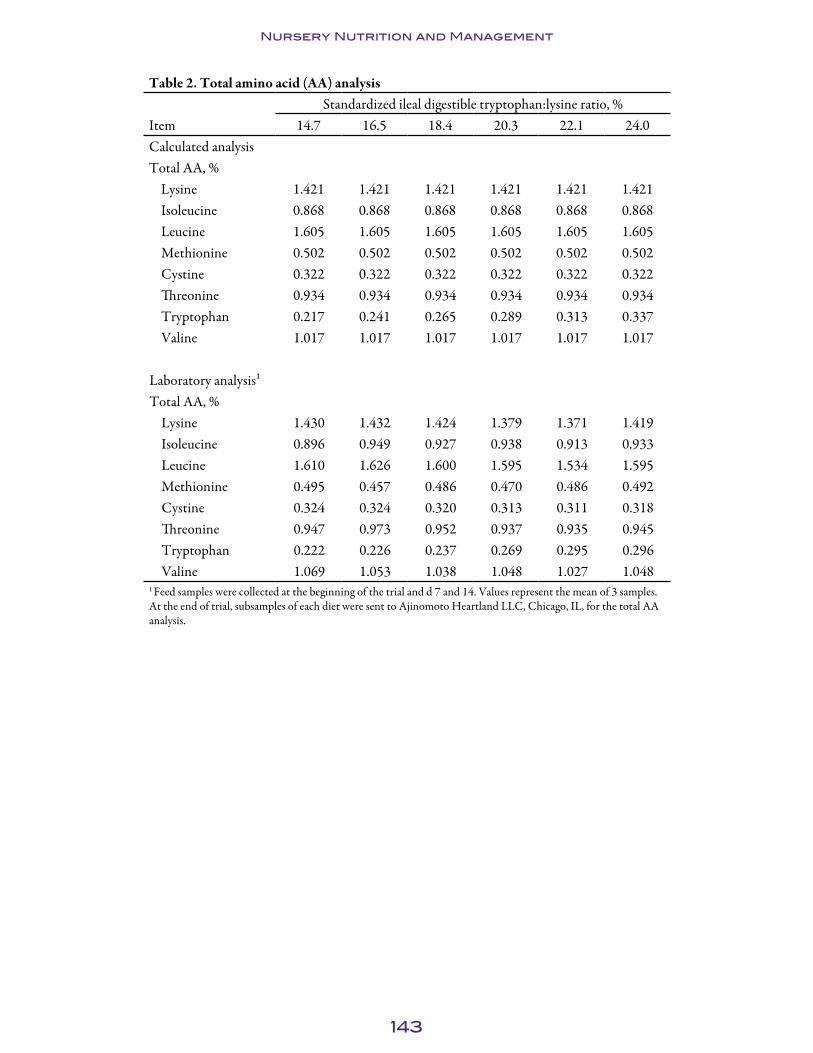
143
Nursery Nutrition and Management
Table 2. Total amino acid (AA) analysisStandardized ileal digestible tryptophan:lysine ratio, %
Item 14.7 16.5 18.4 20.3 22.1 24.0Calculated analysisTotal AA, %
Lysine 1.421 1.421 1.421 1.421 1.421 1.421 Isoleucine 0.868 0.868 0.868 0.868 0.868 0.868 Leucine 1.605 1.605 1.605 1.605 1.605 1.605 Methionine 0.502 0.502 0.502 0.502 0.502 0.502 Cystine 0.322 0.322 0.322 0.322 0.322 0.322 Threonine 0.934 0.934 0.934 0.934 0.934 0.934 Tryptophan 0.217 0.241 0.265 0.289 0.313 0.337 Valine 1.017 1.017 1.017 1.017 1.017 1.017
Laboratory analysis¹Total AA, %
Lysine 1.430 1.432 1.424 1.379 1.371 1.419Isoleucine 0.896 0.949 0.927 0.938 0.913 0.933Leucine 1.610 1.626 1.600 1.595 1.534 1.595Methionine 0.495 0.457 0.486 0.470 0.486 0.492Cystine 0.324 0.324 0.320 0.313 0.311 0.318Threonine 0.947 0.973 0.952 0.937 0.935 0.945Tryptophan 0.222 0.226 0.237 0.269 0.295 0.296Valine 1.069 1.053 1.038 1.048 1.027 1.048
1 Feed samples were collected at the beginning of the trial and d 7 and 14. Values represent the mean of 3 samples. At the end of trial, subsamples of each diet were sent to Ajinomoto Heartland LLC, Chicago, IL, for the total AA analysis.

144
Nursery Nutrition and Management
Table 3. Influence of standardized ileal digestible (SID) tryptophan:lysine ratio on growth performance of nursery pigs¹
SID tryptophan:lysine ratio, % Probability, P <Item 14.7 16.5 18.4 20.3 22.1 24.0 SEM Linear Quadraticd 0 to 14
ADG, lb 0.50 0.54 0.54 0.59 0.57 0.57 0.026 0.02 0.33ADFI, lb 0.72 0.75 0.75 0.77 0.75 0.80 0.026 0.06 0.94F/G 1.46 1.41 1.41 1.32 1.33 1.40 0.039 0.06 0.08
d 14 to 28ADG, lb 1.07 1.03 1.08 1.11 1.06 1.10 0.026 0.18 0.88ADFI, lb 1.56 1.53 1.62 1.62 1.57 1.66 0.036 0.05 0.78F/G 1.46 1.50 1.50 1.46 1.48 1.51 0.033 0.65 0.92
d 0 to 28ADG, lb 0.78 0.78 0.80 0.85 0.81 0.84 0.020 0.02 0.60ADFI, lb 1.14 1.14 1.18 1.19 1.16 1.23 0.027 0.03 0.86F/G 1.45 1.46 1.47 1.41 1.42 1.47 0.025 0.64 0.35
wt, lbd 0 13.8 13.8 13.7 13.8 13.8 13.8 0.129 0.75 0.87d 14 20.8 21.4 21.4 22.0 21.7 21.8 0.386 0.03 0.29d 28 35.8 35.8 36.4 37.5 36.6 37.2 0.559 0.03 0.53
IOFC2, $/pigd 0 to 14 1.48 1.62 1.58 1.88 1.78 1.62 0.135 0.20 0.16d 14 to 28 5.97 5.70 5.94 6.19 5.89 6.08 0.174 0.36 0.94d 0 to 28 7.45 7.32 7.49 8.07 7.67 7.68 0.216 0.13 0.42
¹ A total of 255 nursery pigs (initial 13.8 lb, 3 d postweaning) were used in a 28-d trial with 6 to 7 pigs per pen and 7 pens per treatment. Experimental diets were fed from d 0 to 14, and common diet was fed from d 14 to 28.2 Income over feed cost: Corn was valued at $233/ton, soybean meal at $340/ton, spray-dried whey at $769/ton, L-lysine HCl at $1,600/ton, DL-methionine at $3,000/ton, threonine at $2,300/ton, tryptophan at $24,000/ton, and pig price at $0.55/lb.

145
Nursery Nutrition and Management
Influence of Dietary Isoleucine:Lysine Ratio on the Optimal Tryptophan:Lysine Ratio for 13- to 24-lb Pigs1
S. Nitikanchana2, A.L. Chipman3, M.D. Tokach, S.S. Dritz2, J. Usry4, and J.F. Patience3
SummaryA total of 475 nursery pigs (initially 13.4 lb and 5 d postweaning) were used to deter-mine the influence of the standardized ileal digestible (SID) isoleucine:lysine ratio on the optimal SID tryptophan:lysine ratio for growth performance of nursery pigs. This experiment was conducted in the all-in, all-out nursery at the Swine Nutrition Farm at Iowa State University. Each treatment had 8 replications with 4 or 5 pigs per pen, with equal numbers of barrows and gilts within block and across treatments. Pens were allotted to 1 of 12 treatments in a randomized complete block design. Treat-ments were arranged as a 2 × 6 factorial with main effects of 2 SID isoleucine:lysine ratios (52 and 60% of lysine) and 6 SID tryptophan:lysine ratios (14.7, 16.6, 18.5, 20.4, 22.3, and 24.0% of lysine). Treatment diets were fed for 14 d, then a common diet was fed from d 14 to 21. Overall, no interactions (P > 0.27) were observed between SID isoleucine:lysine and SID tryptophan:lysine ratios. For the main effect of SID isoleucine:lysine ratio, no differences (P > 0.21) were observed in growth perfor-mance between pigs fed the 52 or 60% SID isoleucine:lysine ratio. Increasing the SID tryptophan:lysine ratio also had no effect (P > 0.30) on growth performance. In conclu-sion, dietary SID isoleucine:lysine ratio did not influence the response to increasing SID tryptophan:lysine ratios in 13- to 24-lb pigs. Our results also suggested that the SID isoleucine:lysine ratio is not greater than 52% for pigs fed diets that do not contain blood products. Further research is needed to determine the optimal tryptophan:lysine ratio for 13- to 24-lb pigs.
Key words: isoleucine, nursery pig, tryptophan
IntroductionNumerous recent experiments have examined the dietary standardized ileal digest-ible (SID) tryptophan:lysine ratio for nursery pigs. Optimal ratios estimated from this research range from 15 to 22% of lysine. We have conducted multiple studies to determine the response to tryptophan:lysine ratio in 15- to 25-lb pigs. In a previous experiment5 conducted at Kansas State University (an amino acid deletion experi-ment), deleting L-tryptophan from the diet lowered the tryptophan:lysine ratio from 20 to 15% of lysine and reduced ADG and ADFI. In the next experiment, 15 and 21%
1 Appreciation is expressed to Ajinomoto Heartland LLC, Chicago, IL, for providing the crystalline amino acids used in diet formulation and for partial financial support.2 Department of Diagnostic Medicine/Pathobiology, College of Veterinary Medicine, Kansas State University.3 Department of Animal Sciences, Iowa State University.4 Ajinomoto Heartland LLC, Chicago, IL.5 Nemecheck et al., Swine Day 2010, Report of Progress 1038, pp. 10-16.
146
Nursery Nutrition and Management
tryptophan:lysine ratio diets were used except isoleucine was lowered from 60 to 52% of lysine because this ratio was determined to be adequate in the amino acid deletion experiment. Increasing the tryptophan:lysine ratio from 15 to 21% did not influ-ence growth performance. In a third experiment, the SID isoleucine:lysine was set at 60%, the same as in the amino acid deletion experiment, and ADG, ADFI, and F/G improved linearly as SID tryptophan:lysine increased from 15 to 24% with the optimal level at approximately 20% of lysine (see “Influence of Standardized Ileal Digestible Tryptophan:Lysine Ratio on Growth Performance of 13- to 21-lb Nursery Pigs,” p. 138).
Interactions between other branch chain amino acids (leucine and valine) and isoleu-cine have been demonstrated by others. Additionally, the response to dietary tryp-tophan has been shown to be influenced by the levels of large neutral amino acids in the diet. Thus, we hypothesize that the isoluecine level in the diet may influence the response to dietary tryptophan. A marginal isoleucine level may limit the response to tryptophan, so this experiment was conducted to determine whether the dietary SID isoleucine:lysine ratio influenced the response to increasing SID tryptophan:lysine ratios in 13- to 24-lb pigs.
ProceduresA total of 475 pigs were used to determine the influence of dietary isoleucine:lysine ratio on the optimal tryptophan:lysine ratio for growth performance of nursery pigs. The experiment was conducted under Iowa State University Animal Care and Use Guidelines in the all-in, all-out nursery at the Swine Nutrition Farm, Iowa State University, Ames, IA. The nursery is an environmentally controlled facility with 96 pens. Upon arrival, pigs were tagged, weighed, selected for allocation to the experi-mental pens, and fed a common phase 1 (starter) diet for 5 d. On d 5 after arrival, pigs were weighed and allotted to the dietary treatments in a randomized complete block design based on ADG from arrival to the start of trial; therefore, d 5 after arrival was d 0 in the trial. Each treatment had 8 replications with 4 to 5 pigs per pen and equal numbers of barrows and gilts within block and across treatments. A 4-hole, dry self-feeder and a nipple waterer were used in each pen to provide ad libitum access to feed and water. Pig weight and feed disappearance were determined on d 0 and 14 to calculate ADG, ADFI, and F/G. After d 14, pigs were fed a common diet for 7 d then weighed. The amount of feed from d 14 to 21 was not recorded; thus, the response vari-able calculated in this period was only ADG.
Dietary treatments were arranged as a 2 × 6 factorial with main effects of SID isoleucine:lysine ratio (52 and 60%) and 6 SID tryptophan:lysine ratios (14.7, 16.6, 18.5, 20.4, 22.3, and 24.0%). The diets were manufactured by producing 5 basal diets that were used to form the 12 dietary treatments. Blend 1 was included at 50% of all 12 diets with the goal of minimizing variability in diets (Tables 1 and 2). Four more basal diets (blends 2 through 5) were mixed and blended in proportions to create all 12 experimental diets (Table 3). Thus, isoleucine and tryptophan were the only ingre-dients that varied among the 12 experimental diets. For the different blends, all crystal-line amino acids, monocalcium phosphate, limestone, salt, zinc oxide, phytase, vitamin premix, and trace mineral premix were mixed as 1 ingredient to ensure even distribu-tion. The diets contained zinc oxide but no feed medication. The vitamin and trace

147
Nursery Nutrition and Management
mineral premixes and phytase were supplied by Kansas State University to ensure that the same ingredients that were used in our previous trials were included in these diets. All diets contained 10% spray-dried whey and did not contain a specialty protein source such as spray-dried blood meal or menhaden fish meal. All experimental diets were in meal form and were prepared at the Iowa State University Swine Nutrition Feed Mill. The calculated nutrient analysis (Table 4) was developed using ingredient values based on NRC (1998). Diets subsamples were analyzed for amino acid content.
The experimental data were analyzed using the MIXED procedure of SAS (SAS insti-tute, Inc., Cary, NC). Pen was the experimental unit for all data analysis and statistical significance was claimed at P < 0.05. Data were analyzed for the main effects of SID isoleucine:lysine ratio, SID tryptophan:lysine ratio, linear and quadratic effect of SID tryptophan:lysine ratio, and any interactions between isoleucine level and tryptophan level.
Results and DiscussionAnalyzed amino acid content agreed with calculated values. No linear or quadratic interactions (P > 0.27; Table 5) occurred between SID isoleucine:lysine and SID tryptophan:lysine ratios; however, a trend (quadratic, P = 0.07) was observed for an interaction in ADG from d 14 to 21 when pigs were fed the common diet. Pigs previously fed 52% SID isoleucine:lysine had greatest ADG at 14.7 and 24.0 % SID tryptophan:lysine ratio, whereas greatest ADG of pigs previously fed 60% SID isoleucine:lysine ratio was found at 18.5% SID tryptophan:lysine ratio.
For the main effect of SID isoleucine:lysine ratio, no differences (P > 0.21; Table 6) were found in growth performance between pigs fed 52 and 60% SID isoleucine:lysine ratio. Also, increasing SID tryptophan:lysine ratio did not affect (P > 0.30) growth performance (Table 6).
With no differences in growth performance among pigs fed 52 and 60% SID isoluecine: lysine ratio, this study suggests that the optimal SID isoluecine:lysine ratio of nursery pigs fed a diet without spray-dried blood cells was no greater than 52% of lysine, but the National Swine Nutrition Guide6 suggests a SID isoleucine:lysine ratio of 55% for 15- to 25-lb pigs.
Furthermore, the SID tryptophan:lysine ratio demonstrated in this study was no greater than 14.7% of lysine, but other studies have shown higher tryptophan requirement estimates. Pluske and Mullen (20007), Guzik et al. (20058), and Jansman et al. (20109) demonstrated requirement estimates greater than 20% of lysine. A recent trial at Kansas State University (see “Influence of Standardized Ileal Digestible Tryptophan:Lysine
6 National Swine Nutrition Guide. 2010. Table of Nutrient Recommendations, Ingredient Composi-tion, and Use Rates, U.S. Pork Center of Excellence, Ames, IA.7 Pluske, J., and B. P. Mullan. 2000. Determining the optimum Tryptophan:Lysine ratio in diets for weaner pigs. Cited in: L–Tryptophan supplementation to enhance piglet growth. Ajinomoto Eurolysine Information. 23:1-11.8 Guzik, A. C., M. J. Pettit, E. Beltranena, L. L. Southern, and B. J. Kerr. 2005b. Threonine and trypto-phan ratios fed to nursery pigs. J. Anim. Physiol. Anim. Nutr. 89:297-302.9 Jansman, A. J. M., J. T. M. Van Diepen, D. Melchior. 2010. The effect of diet composition on trypto-phan requirement of young piglets. J. Anim. Sci. 88:1017-1027.

148
Nursery Nutrition and Management
Ratio on Growth Performance of 13- to 21-lb Nursery Pigs,” p. 138) also suggested an optimal SID tryptophan:lysine ratio for 13- to 21-lb pigs of at least 20.3% lysine. Varia-tion among trials is apparent, and the SID tryptophan:lysine requirement in nursery pigs is not conclusive.
In summary, this trial indicated that dietary SID isoleucine:lysine ratio did not influ-ence the response to increasing dietary SID tryptophan:lysine ratios for 13- to 24-lb pigs; therefore, the variability in response to SID tryptophan:lysine ratio on growth performance in nursery pigs among several studies cannot be explained by the interac-tion of isoleucine on tryptophan. This leaves the question of why response to trypto-phan varied; the causative factors of the variation need to be further investigated.
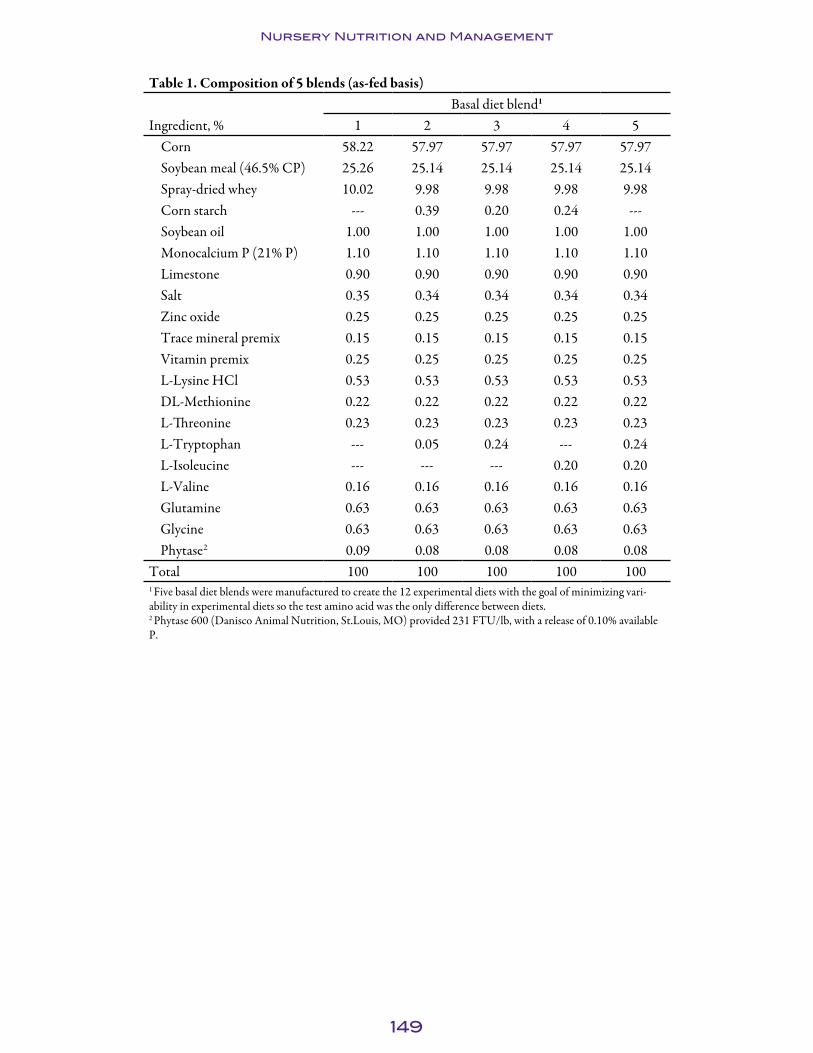
149
Nursery Nutrition and Management
Table 1. Composition of 5 blends (as-fed basis)Basal diet blend1
Ingredient, % 1 2 3 4 5Corn 58.22 57.97 57.97 57.97 57.97Soybean meal (46.5% CP) 25.26 25.14 25.14 25.14 25.14Spray-dried whey 10.02 9.98 9.98 9.98 9.98Corn starch --- 0.39 0.20 0.24 ---Soybean oil 1.00 1.00 1.00 1.00 1.00Monocalcium P (21% P) 1.10 1.10 1.10 1.10 1.10Limestone 0.90 0.90 0.90 0.90 0.90Salt 0.35 0.34 0.34 0.34 0.34Zinc oxide 0.25 0.25 0.25 0.25 0.25Trace mineral premix 0.15 0.15 0.15 0.15 0.15Vitamin premix 0.25 0.25 0.25 0.25 0.25L-Lysine HCl 0.53 0.53 0.53 0.53 0.53DL-Methionine 0.22 0.22 0.22 0.22 0.22L-Threonine 0.23 0.23 0.23 0.23 0.23L-Tryptophan --- 0.05 0.24 --- 0.24L-Isoleucine --- --- --- 0.20 0.20L-Valine 0.16 0.16 0.16 0.16 0.16Glutamine 0.63 0.63 0.63 0.63 0.63Glycine 0.63 0.63 0.63 0.63 0.63Phytase2 0.09 0.08 0.08 0.08 0.08
Total 100 100 100 100 1001 Five basal diet blends were manufactured to create the 12 experimental diets with the goal of minimizing vari-ability in experimental diets so the test amino acid was the only difference between diets.2 Phytase 600 (Danisco Animal Nutrition, St.Louis, MO) provided 231 FTU/lb, with a release of 0.10% available P.

150
Nursery Nutrition and Management
Table 2. Percentages of the 5 basal diet blends included in the 12 experimental diets1
SID2 ile:lys ratio, % 52 60SID trp:lys ratio, % 14.7 16.6 18.5 20.4 22.3 24.0 14.7 16.6 18.5 20.4 22.3 24.0
Blend 1 50% 50% 50% 50% 50% 50% 50% 50% 50% 50% 50% 50%Blend 2 50% 40% 30% 20% 10% --- --- --- --- --- --- ---Blend 3 --- 10% 20% 30% 40% 50% --- --- --- --- --- ---Blend 4 --- --- --- --- --- --- 50% 40% 30% 20% 10% ---Blend 5 --- --- --- --- --- --- --- 10% 20% 30% 40% 50%Total 100% 100% 100% 100% 100% 100% 100% 100% 100% 100% 100% 100%1 Five basal diet blends were manufactured to create the 12 experimental diets with the goal of minimizing variability in experimental diets so that the test amino acid was the only difference between diets.2 Standardized ileal digestible.

151
Nu
rs
er
y N
ut
rit
ion
an
d M
an
ag
em
en
t
Table 3. Composition of experimental diets (as-fed basis)Standardized ileal digestible (SID) isoleucine:lysine ratio, %
52 60SID trptophan:lysine ratio, % 14.7 16.6 18.5 20.4 22.3 24.0 14.7 16.6 18.5 20.4 22.3 24.0
Ingredient, %Corn 58.09 58.09 58.09 58.09 58.09 58.10 58.09 58.09 58.09 58.09 58.09 58.09Soybean meal (46.5% CP) 25.20 25.20 25.20 25.20 25.20 25.20 25.20 25.20 25.20 25.20 25.20 25.20Spray-dried whey 10.00 10.00 10.00 10.00 10.00 10.00 10.00 10.00 10.00 10.00 10.00 10.00Corn starch 0.22 0.20 0.17 0.15 0.12 0.10 0.12 0.10 0.07 0.05 0.02 ---Soybean oil 1.00 1.00 1.00 1.00 1.00 1.00 1.00 1.00 1.00 1.00 1.00 1.00Monocalcium P (21% P)
1.10 1.10 1.10 1.10 1.10 1.10 1.10 1.10 1.10 1.10 1.10 1.10Limestone 0.90 0.90 0.90 0.90 0.90 0.90 0.90 0.90 0.90 0.90 0.90 0.90Salt 0.35 0.35 0.35 0.35 0.35 0.35 0.35 0.35 0.35 0.35 0.35 0.35Zinc oxide, 72% 0.25 0.25 0.25 0.25 0.25 0.25 0.25 0.25 0.25 0.25 0.25 0.25Trace mineral premix 0.15 0.15 0.15 0.15 0.15 0.15 0.15 0.15 0.15 0.15 0.15 0.15Vitamin premix 0.25 0.25 0.25 0.25 0.25 0.25 0.25 0.25 0.25 0.25 0.25 0.25L-Lysine HCl 0.53 0.53 0.53 0.53 0.53 0.53 0.53 0.53 0.53 0.53 0.53 0.53DL-Methionine 0.22 0.22 0.22 0.22 0.22 0.22 0.22 0.22 0.22 0.22 0.22 0.22L-Threonine 0.23 0.23 0.23 0.23 0.23 0.23 0.23 0.23 0.23 0.23 0.23 0.23L-Tryptophan --- 0.03 0.05 0.08 0.10 0.12 --- 0.03 0.05 0.08 0.10 0.12L-Isoleucine --- --- --- --- --- --- 0.10 0.10 0.10 0.10 0.10 0.10L-Valine 0.16 0.16 0.16 0.16 0.16 0.16 0.16 0.16 0.16 0.16 0.16 0.16L-Glutamine 0.63 0.63 0.63 0.63 0.63 0.63 0.63 0.63 0.63 0.63 0.63 0.63L-Glycine 0.63 0.63 0.63 0.63 0.63 0.63 0.63 0.63 0.63 0.63 0.63 0.63Phytase 1 0.09 0.09 0.09 0.09 0.09 0.09 0.09 0.09 0.09 0.09 0.09 0.09
Total 100 100 100 100 100 100 100 100 100 100 100 1001 Phytase 600 (Danisco Animal Nutrition, St. Louis, MO) provided 231 FTU/lb, with a release of 0.10% available P.

152
Nursery Nutrition and Management
Table 4. Calculated nutrient analysisStandardized ileal digestible (SID) isoleucine:lysine ratio, %52 60
SID trp:lys ratio, % 14.7 16.6 18.5 20.4 22.3 24.0 14.7 16.6 18.5 20.4 22.3 24.0Standadized ileal digestible (SID) amino acids %
Lysine 1.30 1.30 1.30 1.30 1.30 1.30 1.30 1.30 1.30 1.30 1.30 1.30 Isoleucine:lysine 52 52 52 52 52 52 60 60 60 60 60 60Leucine:lysine 111 111 111 111 111 111 111 111 111 111 111 111Methionine:lysine 36 36 36 36 36 36 36 36 36 36 36 36Met & Cys:lysine 58 58 58 58 58 58 58 58 58 58 58 58Threonine:lysine 64 64 64 64 64 64 64 64 64 64 64 64Tryptophan:lysine 14.7 16.6 18.5 20.4 22.3 24.0 14.7 16.6 18.5 20.4 22.3 24.0Valine:lysine 70 70 70 70 70 70 70 70 70 70 70 70
Total lysine, % 1.42 1.42 1.42 1.42 1.42 1.42 1.42 1.42 1.42 1.42 1.42 1.42 ME, kcal/lb 1,516 1,516 1,517 1,517 1,517 1,517 1,517 1,517 1,518 1,518 1,518 1,518SID lysine:ME, g/Mcal 3.89 3.89 3.89 3.89 3.89 3.89 3.89 3.89 3.89 3.89 3.88 3.88CP, % 20.3 20.3 20.3 20.4 20.4 20.4 20.4 20.4 20.4 20.4 20.5 20.5Ca, % 0.72 0.72 0.72 0.72 0.72 0.72 0.72 0.72 0.72 0.72 0.72 0.72P, % 0.64 0.64 0.64 0.64 0.64 0.64 0.64 0.64 0.64 0.64 0.64 0.64Available P, % 0.47 0.47 0.47 0.47 0.47 0.47 0.47 0.47 0.47 0.47 0.47 0.47Ca:P 1.13 1.13 1.13 1.13 1.13 1.13 1.13 1.13 1.13 1.13 1.13 1.13
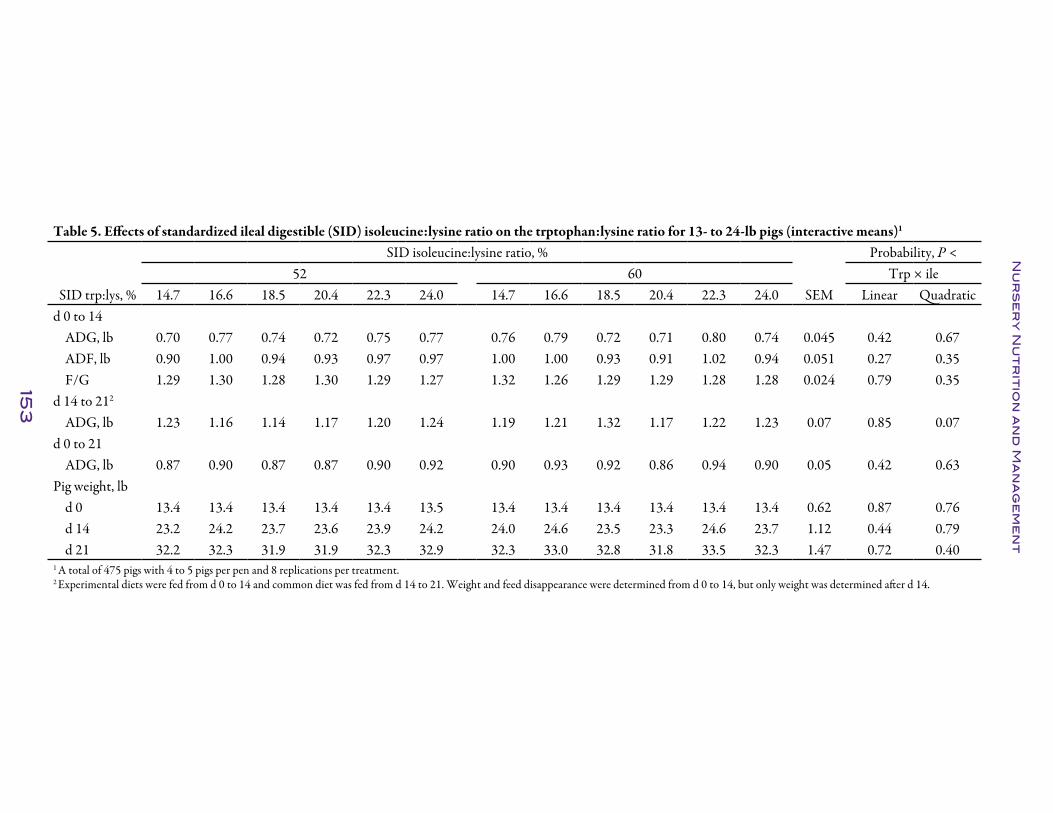
153
Nu
rs
er
y N
ut
rit
ion
an
d M
an
ag
em
en
t
Table 5. Effects of standardized ileal digestible (SID) isoleucine:lysine ratio on the trptophan:lysine ratio for 13- to 24-lb pigs (interactive means)1
SID isoleucine:lysine ratio, % Probability, P <52 60 Trp × ile
SID trp:lys, % 14.7 16.6 18.5 20.4 22.3 24.0 14.7 16.6 18.5 20.4 22.3 24.0 SEM Linear Quadraticd 0 to 14
ADG, lb 0.70 0.77 0.74 0.72 0.75 0.77 0.76 0.79 0.72 0.71 0.80 0.74 0.045 0.42 0.67ADF, lb 0.90 1.00 0.94 0.93 0.97 0.97 1.00 1.00 0.93 0.91 1.02 0.94 0.051 0.27 0.35F/G 1.29 1.30 1.28 1.30 1.29 1.27 1.32 1.26 1.29 1.29 1.28 1.28 0.024 0.79 0.35
d 14 to 212
ADG, lb 1.23 1.16 1.14 1.17 1.20 1.24 1.19 1.21 1.32 1.17 1.22 1.23 0.07 0.85 0.07d 0 to 21
ADG, lb 0.87 0.90 0.87 0.87 0.90 0.92 0.90 0.93 0.92 0.86 0.94 0.90 0.05 0.42 0.63Pig weight, lb
d 0 13.4 13.4 13.4 13.4 13.4 13.5 13.4 13.4 13.4 13.4 13.4 13.4 0.62 0.87 0.76d 14 23.2 24.2 23.7 23.6 23.9 24.2 24.0 24.6 23.5 23.3 24.6 23.7 1.12 0.44 0.79d 21 32.2 32.3 31.9 31.9 32.3 32.9 32.3 33.0 32.8 31.8 33.5 32.3 1.47 0.72 0.40
1 A total of 475 pigs with 4 to 5 pigs per pen and 8 replications per treatment. 2 Experimental diets were fed from d 0 to 14 and common diet was fed from d 14 to 21. Weight and feed disappearance were determined from d 0 to 14, but only weight was determined after d 14.

154
Nu
rs
er
y N
ut
rit
ion
an
d M
an
ag
em
en
t
Table 6. Effects of standardized ileal digestible (SID) isoleucine:lysine ratio the trptophan:lysine ratio for 13- to 24-lb pigs (main effects)1
SID isoleucine:lysine ratio, %
Probability, P < SID trpophan:lysine ratio, % Tryptophan
52 60 SEMProbability,
P < 14.7 16.6 18.5 20.4 22.3 24.0 SEM Linear Quadraticd 0 to 14
ADG, lb 0.74 0.75 0.03 0.58 0.73 0.78 0.73 0.72 0.78 0.75 0.04 0.72 0.73ADF, lb 0.95 0.97 0.04 0.54 0.95 1.00 0.94 0.92 0.99 0.95 0.04 0.86 0.60F/G 1.29 1.29 0.01 0.90 1.31 1.28 1.29 1.29 1.28 1.27 0.02 0.30 0.89
d 14 to 212
ADG, lb 1.19 1.22 0.05 0.21 1.21 1.18 1.23 1.17 1.21 1.24 0.06 0.51 0.40d 0 to 21
ADG, lb 0.89 0.91 0.04 0.29 0.89 0.92 0.89 0.86 0.92 0.91 0.04 0.52 0.48Pig weight, lb
d 0 13.4 13.4 0.60 0.94 13.4 13.4 13.4 13.4 13.4 13.4 0.60 0.90 0.90d 14 23.8 24.0 0.99 0.63 23.6 24.4 23.6 23.5 24.3 24.0 1.04 0.74 0.80d 21 32.3 32.6 1.34 0.33 32.3 32.7 32.3 31.9 32.9 32.6 1.39 0.59 0.64
1 A total of 475 pigs with 4 to 5 pigs per pen and 8 replications per treatment. 2 Experimental diets were fed from d 0 to 14 and common diet was fed from d 14 to 21. Weight and feed disappearance were determined from d 0 to 14; however, only weight was determined after d 14.

155
Finishing Nutrition and Management
Determining the Effects of Tryptophan:Lysine Ratios in Diets Containing 30% Dried Distillers Grains with Solubles on Growth Performance of 157- to 285-lb Pigs1
S. Nitikanchana2, M. D. Tokach, J. L Usry3, S. S. Dritz2, R.D. Boyd4, C.E. Zier-Rush4, and M. McGrath4
SummaryA total of 2,298 pigs (half gilts and half barrows, PIC TR4 × 1050; initially 157 lb) were used in a 52-d study to determine the effects of increasing tryptophan:lysine ratios in diets containing 30% dried distillers grains with solubles (DDGS) on the growth performance of finishing pigs raised in a commercial environment. Pens of pigs were balanced by initial weight and randomly allotted to 1 of 6 dietary treatments in a completely randomized design within gender; each pen contained 23 pigs and each treatment had 16 to 17 replications. Treatments were arranged as a 2 × 6 facto-rial with main effects of gender (gilts or barrows) and standardized ileal digestible (SID) tryptophan:lysine ratio (2 positive control diets with no DDGS containing SID tryptophan:lysine ratios of 17 or 21% of lysine and 4 diets containing 30% DDGS with SID tryptophan:lysine ratios of 15, 17, 19, or 21% lysine).
Overall (d 0 to 52), no gender × treatment interactions were measured. Pigs fed 30% DDGS had poorer ADG, ADFI, and F/G (P < 0.01, P = 0.04, and P = 0.01, respec-tively) compared with those fed the corn-soybean meal diet. In pigs fed diets without DDGS, those fed the 17% SID tryptophan:lysine ratio tended to have better F/G (P = 0.09) compared with pigs fed the 20% SID tryptophan:lysine ratio. Increas-ing SID tryptophan:lysine ratio from 15 to 21% in diets containing 30% DDGS had no effect on ADG, ADFI, or F/G. For carcass characteristics, feeding 30% DDGS reduced HCW, loin depth, and lean percentage (P < 0.01, P < 0.01, and P = 0.04, respectively). For carcass traits, in pigs fed diets without DDGS, those fed the 21% SID tryptophan:lysine ratio had decreased backfat (P = 0.04) and greater lean percentage (P = 0.04) compared with pigs fed 17% SID tryptophan:lysine ratio. Increasing the SID tryptophan:lysine ratio from 15 to 21% in the 30% DDGS diets increased (linear, P < 0.01) percentage carcass yield and had a tendency (linear, P = 0.07) to increase HCW. These results suggest an opportunity to improve carcass traits and carcass value by increasing the SID tryptophan:lysine ratio for late finishing pigs that are fed high levels of DDGS.
Key words: amino acid ratio, DDGS, lysine, tryptophan, finishing pig
1 Appreciation is expressed to The Hanor Company and Ajinomoto Heartland LLC, Chicago, IL, for use of pigs and facilities and providing the synthetic amino acids used in diet formulation.2 Department of Diagnostic Medicine/Pathobiology, College of Veterinary Medicine, Kansas State University.3 Ajinomoto Heartland LLC, Chicago, IL.4 The Hanor Company, Franklin, KY.

156
Finishing Nutrition and Management
IntroductionDried distillers grains with solubles have been widely used in swine feed in the United States. Tryptophan is the second limiting amino acid after lysine in diets containing high levels of DDGS. A previous study (Barnes et al., 20105) at Kansas State University found a linear increase in ADG and ADFI as SID tryptophan:lysine ratio increased from 14 to 18% of lysine in 160- to 265-lb pigs fed 30% DDGS. This suggested that the optimal SID tryptophan:lysine ratio in late finishing pigs was greater than 18% of lysine.
Therefore, our objective was to validate the results of Barnes et al. (2010) and use a greater range of tryptophan:lysine ratios in 150- to 275-lb pigs fed diet containing 30% DDGS.
ProceduresThe study was conducted at a commercial research-finishing barn in western Illinois. The barns were tunnel-ventilated and double-curtain-sided. Pens had completely slat-ted flooring and shallow pits for manure storage. Each pen was equipped with a 4-hole stainless steel dry self-feeder and a swinging nipple waterer for ad libitum access to feed and water. Daily feed additions to each pen were accomplished through an automated feeding system capable of providing and measuring feed amounts for individual pens.
A total of 2,298 pigs (half gilts and half barrows, PIC TR4 × 1050) with an initial BW of 157 lb were used in this study; each pen contained 23 pigs and each treatment comprised 16 to 17 pens. Pens of pigs were allotted to 1 of 6 dietary treatments in a completely randomized design within gender while balancing for initial BW. Treat-ments were arranged as a 2 × 6 factorial with main effects of gender (gilts or barrows) and level of SID tryptophan:lysine ratio (2 positive control diets with no DDGS containing SID tryptophan:lysine ratios of 17 or 21% and 4 diets contained 30% DDGS with SID tryptophan:lysine ratios of 15, 17, 19, or 21% lysine). Soybean meal replaced crystalline lysine and threonine to increase the SID tryptophan:lysine ratios from 15 to 21% (Tables 1, 2, and 3). All diets were fed in meal form and treatments were fed in 3 phases, d 0 to 21 (157 to 210 lb), d 21 to 42 (210 to 250 lb), and d 42 to 52 (250 lb to market; Tables 1 to 3). During the last phase, the DDGS level was lowered to 20%. Pens of pigs were weighed and feed disappearance was recorded at d 21, 42, and 52 to determine ADG, ADFI, and F/G. At the end of the experiment, pigs were individually tattooed by pen number to allow for carcass data collection at the packing plant and data retrieval by pen. Pigs were transported to Triumph Foods LLC (St. Joseph, MO) for processing. Standard carcass criteria of loin and backfat depth, HCW, percentage lean, and percentage carcass yield were collected.
The experimental data were analyzed by The Hanor Company (Franklin, KY) using the GLM procedure of SAS (SAS institute, Inc., Cary, NC). Pen was the experimental unit for all data and significance and tendencies were set at P < 0.05 and P < 0.10, respec-tively. Analysis of backfat depth, loin depth, percentage lean, and fat-free lean index (FFLI) were adjusted to a common carcass weight using HCW as a covariate. Data were analyzed for the main effect of level of DDGS by comparing the corn-soybean meal diets containing 17 and 20% SID tryptophan:lysine ratio with the 30% DDGS
5 Barnes et al., Swine Day 2010, Report of Progress 1038, pp. 156-165.

157
Finishing Nutrition and Management
diets containing 17 and 20% SID tryptophan:lysine ratio. Data also were analyzed to determine the influence of increasing SID tryptophan:lysine ratio in diets without DDGS (17 vs. 20% SID tryptophan:lysine ratio), linear and quadratic effect of SID tryptophan:lysine ratio in diet containing 30% DDGS, and any interactions between tryptophan level and gender.
Results and DiscussionFor the overall period (d 0 to 52), no gender × treatment interactions were observed. Pigs fed 30% DDGS had poorer ADG, ADFI, and F/G (P < 0.01, P = 0.04, and P = 0.01, respectively; Table 4) compared with those fed the corn-soybean meal diet. In pigs fed diets without DDGS, those fed the 17% SID tryptophan:lysine ratio tended to have better F/G (P = 0.09) compared with pigs fed 20% SID tryptophan :lysine ratio. Increasing SID tryptophan:lysine ratio from 15 to 21% in diets containing 30% DDGS had no effect (P > 0.26) on ADG, ADFI, or F/G.
For carcass characteristics, feeding 30% DDGS reduced HCW, loin depth, and lean percentage (P < 0.01, P < 0.01, and P = 0.04, respectively; Table 4). When considering carcass traits of pigs fed corn-soybean meal diets, pigs fed 21% SID tryptophan:lysine ratio had decreased backfat (P = 0.04) with greater lean percentage (P = 0.04) compared with pigs fed the 17% SID tryptophan:lysine ratio. Increasing the SID tryptophan:lysine ratio from 15 to 21% in the 30% DDGS diets increased (linear, P < 0.01) percentage carcass yield and had a tendency (linear, P = 0.07) to increase HCW.
In contrast to a previous trial (Barns et al., 2010) at K-State that indicated a linear improvement in ADG, ADFI, and F/G when increasing SID tryptophan:lysine ratio from 15.0 to 19.5% in diets containing 30% DDGS, increasing dietary SID tryptophan:lysine level did not influence pig growth performance in this experiment; however, improvements in carcass yield percentage in this experiment with increas-ing SID tryptophan:lysine ratio agree with a recent K-State study where increasing tryptophan:lysine ratio also improved carcass yield percentage in diets containing high levels of DDGS (see “Determining the Effects of Tryptophan:Lysine Ratio in Diets Containing Dried Distillers Grains with Solubles on Growth Performance of Finishing Pigs,” pp. 168). In conclusion, these results suggest an opportunity to improve carcass traits and carcass value by increasing the SID tryptophan:lysine ratio in late finishing pigs that are fed high levels of DDGS.

158
Finishing Nutrition and Management
Table 1. Composition of diets (Phase 1, 157 to 210 lb; as-fed basis)1
Phase 1DDGS, %2 0 30 0
SID trp:lys, % 17 15 17 19 21 21Ingredient, %
Corn 80.50 59.54 56.21 52.77 49.44 73.79Soybean meal (47.5% CP) 16.70 8.43 11.58 14.83 17.98 23.09DDGS --- 30.00 30.00 30.00 30.00 ---Choice white grease 0.53 --- 0.32 0.64 0.95 1.21Limestone 0.78 1.14 1.11 1.08 1.05 0.72Monocalcium P (21% P) 0.68 --- --- --- --- 0.65Salt 0.40 0.40 0.40 0.40 0.40 0.40Vitamin/mineral premix 0.10 0.10 0.10 0.10 0.10 0.10L-Lysine HCl 0.26 0.38 0.29 0.18 0.09 0.06L-Threonine 0.08 0.02 0.01 0.01 --- ---DL-Methionine 0.01 --- --- --- --- ---
Total 100 100 100 100 100 100
Calculated analysisStandardized ileal digestible (SID) amino acids, %
Lysine 0.82 0.82 0.82 0.82 0.82 0.82Isoleucine:lysine 62 67 74 80 86 74Met & Cys:lysine 56 76 79 82 86 61Threonine:lysine 65 65 69 74 78 66Tryptophan:lysine 17 15 17 19 21 21Valine:lysine 72 85 91 97 103 84
Total lysine, % 0.90 0.94 0.95 0.95 0.96 0.92Modified ME, kcal/lb3 1,480 1,481 1,481 1,480 1,480 1,480SID lysine:ME, g/Mcal 2.52 2.52 2.52 2.52 2.52 2.52CP, % 14.9 17.4 18.6 19.7 20.9 17.2Ca, % 0.60 0.60 0.60 0.60 0.60 0.60P, % 0.57 0.52 0.53 0.55 0.56 0.59Available P, % 0.30 0.30 0.31 0.31 0.31 0.30SID lysine4 0.83 0.80 0.81 0.81 0.81 0.83SID tryptophan:lysine, %4 17.0 15.6 17.6 19.8 21.7 21.0ME, kcal/lb5 1,530 1,526 1,532 1,538 1,544 1,5431 Phase 1 experimental diets were fed from d 0 to 21 (157- to 210-lb BW).2 Dried distillers grains with solubles.3 Modified ME was calculated by The Hanor Company. 4 SID lysine, SID tryptophan:lysine (%), and ME (kcal/lb) were calculated using NRC values. 5All energy levels used to calculate ME were based on NRC values except DDGS, where the energy value of corn was used.

159
Finishing Nutrition and Management
Table 2. Composition of diets (Phase 2, 210 to 250 lb; as-fed basis)1
Phase 2DDGS, %2 0 30 0
SID trp:lys,% 17 15 17 19 21 21Ingredient, %
Corn 83.85 62.41 59.45 56.40 53.43 77.96Soybean meal (47.5% CP) 13.43 5.53 8.31 11.17 13.95 19.04DDGS --- 30.00 30.00 30.00 30.00 ---Choice white grease 0.60 0.11 0.41 0.71 1.00 1.19Limestone 0.83 1.12 1.09 1.06 1.04 0.79Monocalcium P (21% P) 0.51 --- --- --- --- 0.48Salt 0.40 0.40 0.40 0.40 0.40 0.40Vitamin/mineral premix 0.10 0.10 0.10 0.10 0.10 0.10L-Lysine 0.23 0.34 0.26 0.17 0.09 0.06L-Threonine 0.65 --- --- --- --- ---
Total 100 100 100 100 100 100
Calculated analysisStandardized ileal digestible (SID) amino acids, %
Lysine 0.72 0.72 0.72 0.72 0.72 0.72Isoleucine:lysine 63 70 77 83 89 76Met & Cys:lysine 58 83 86 89 93 65Threonine:lysine 66 66 71 77 82 67Tryptophan:lysine 17 15 17 19 21 21Valine:lysine 75 91 97 103 109 87
Total lysine, % 0.80 0.84 0.84 0.85 0.85 0.81Modified ME, kcal/lb3 1,490 1,490 1,490 1,490 1,490 1,490SID lysine:ME, g/Mcal 2.20 2.20 2.20 2.20 2.20 2.20CP, % 13.6 16.3 17.3 18.3 19.3 15.6Ca, % 0.58 0.58 0.58 0.58 0.58 0.58P, % 0.52 0.51 0.52 0.53 0.54 0.53Available P, % 0.26 0.30 0.30 0.31 0.31 0.26SID lysine4 0.72 0.69 0.70 0.70 0.71 0.73 SID tryptophan:lysine, %4 16.9 15.7 17.7 19.8 21.8 21.0ME, kcal/lb5 1,534 1,529 1,535 1,540 1,546 1,5451 Phase 2 experimental diets were fed from d 21 to 42 (210- to 250-lb BW).2 Dried distillers grains with solubles.3 Modified ME was calculated by The Hanor Company. 4 SID lysine, SID tryptophan:lysine (%), and ME (kcal/lb) were calculated using NRC (1998) values.5 All energy levels used to calculate ME were based on NRC values except DDGS, where the energy value of corn was used.

160
Finishing Nutrition and Management
Table 3. Composition of diets (Phase 3, 250 to market; as-fed basis)1
Phase 3DDGS, %2 0 30 0
SID trp:lys,% 17 15 17 19 21 21Ingredient, %
Corn 86.02 72.58 69.92 67.18 64.53 80.67Soybean meal (47.5% CP) 11.42 5.44 7.97 10.59 13.13 16.54DDGS --- 20.00 20.00 20.00 20.00 ---Choice white grease 0.45 --- 0.25 0.50 0.75 0.95Limestone 0.84 1.09 1.08 1.06 1.04 0.81Monocalcium P (21% P) 0.52 0.07 0.05 0.02 --- 0.49Salt 0.40 0.40 0.40 0.40 0.40 0.40Vitamin/mineral premix with phytase
0.10 0.10 0.10 0.10 0.10 0.10
L-Lysine HCl 0.22 0.31 0.23 0.15 0.08 0.06L-Threonine 0.05 0.02 --- --- --- ---
Total 100 100 100 100 100 100
Calculated analysisStandardized ileal digestible (SID) amino acids, %
Lysine 0.66 0.66 0.66 0.66 0.66 0.66Isoleucine:lysine 64 68 74 80 86 77Met & Cys:lysine 61 78 81 85 88 68Threonine:lysine 66 66 70 75 79 69Tryptophan:lysine 17 15 17 19 21 21Valine:lysine 77 87 93 99 105 89
Total lysine, % 0.73 0.76 0.76 0.77 0.77 0.74Modified ME, kcal/lb3 1,491 1,491 1,490 1,490 1,490 1,490SID lysine:ME, g/Mcal 2.01 2.01 2.01 2.01 2.01 2.01CP, % 12.8 14.3 15.2 16.2 17.1 14.6Ca, % 0.58 0.58 0.58 0.58 0.58 0.58P, % 0.51 0.48 0.48 0.49 0.50 0.53Available P, % 0.26 0.26 0.26 0.26 0.26 0.26SID lysine4 0.66 0.64 0.64 0.65 0.65 0.67 SID tryptophan:lysine, %4 16.9 15.4 17.5 19.6 21.5 20.9ME, kcal/lb5 1,531 1,526 1,531 1,536 1,541 1,5401 Phase 3 experimental diets were fed from d 42 to market (250 lb BW to market).2 Dried distillers grains with solubles.3 Modified ME was calculated by The Hanor Company. 4 SID lysine, SID tryptophan:lysine (%), and ME (kcal/lb) were calculated using NRC (1988) values.5 All energy levels used to calculate ME were based on NRC values except DDGS, where the energy value of corn was used.

161
Fin
ish
ing
Nu
tr
itio
n a
nd
Ma
na
ge
me
nt
Table 4. Effects of standardized ileal digestible (SID) tryptophan:lysine ratios in diets containing 30% dried distillers grains with solubles (DDGS) on growth performance of 157- to 285-lb pigs1
Probability, P <DDGS, % 0 30 17 vs. 21%
trp:lys in corn-soy
Tryptophan
SID trp:lys,% 17 21 15 17 19 21 SEM DDGS2 Linear QuadraticReplications3 17 17 17 16 16 17Initial wt, lb 157.1 157.3 157.3 157.2 157.2 157.4 3.0 0.96 0.97 0.98 0.96Final wt, lb 280.0 278.3 274.6 272.5 276.7 273.6 2.6 0.02 0.65 0.92 0.85Avg. days from d 42 to harvest4 18.9 17.9 18.9 18.8 18.4 19.2 0.3 0.08 0.04 0.87 0.17
d 0 to 52ADG , lb 1.97 2.02 1.90 1.88 1.97 1.89 0.02 <0.01 0.12 0.52 0.27ADFI, lb 6.42 6.40 6.33 6.24 6.43 6.22 0.08 0.04 0.88 0.72 0.50F/G 3.26 3.17 3.34 3.33 3.27 3.30 0.04 0.01 0.09 0.26 0.63
HCW, lb 206.0 205.8 202.0 200.9 204.3 203.1 0.90 <0.01 0.89 0.07 0.98Yield, % 73.8 73.9 73.2 73.4 73.8 74.4 0.31 0.99 0.80 <0.01 0.42Backfat, in. 21.4 20.8 21.3 21.1 20.9 21.2 0.20 1.00 0.04 0.69 0.24Loin depth, in. 59.8 60.4 59.6 59.1 59.8 59.2 0.30 <0.01 0.15 0.79 0.73Lean, % 52.1 52.4 52.1 52.1 52.2 52.0 0.11 0.04 0.04 0.70 0.441 A total of 2,298 pigs (gilts and barrows, PIC TR4 × 1050; initially 157 lb) were used in a 52-d late finishing trial with 23 pigs per pen and 16 to 17 pens per treatment.2 Main effect of level of DDGS was analyzed by comparing between 17 and 20% SID tryptophan:lysine ratio in corn-soybean meal diet with 17 and 20% SID tryptophan:lysine ratio in 30% DDGS diet.3 Replications are numbers of pens for each treatment.4 Average days from d 42 to harvest was calculated as total pig days from d 42 to harvest divided by total head count at the d 42.

162
Finishing Nutrition and Management
Determining the Effects of L-Tryptophan Addition to Diets Containing 30% Dried Distillers Grains with Solubles on Finishing Pig Growth Performance1
S. Nitikanchana2, M. D. Tokach, S. S. Dritz2, R. D. Goodband, J. M. DeRouchey, J. L. Nelssen, and J. Usry3
SummaryA total of 845 pigs (PIC 380 × Mosanto; initially 163 lb) were used in a 61-d study to determine the effects of L-tryptophan addition to diets containing 30% dried distillers grains with solubles (DDGS) on the growth performance of finishing pigs reared in a commercial environment. Pens of pigs were balanced by initial weight and randomly allotted to 1 of 5 dietary treatments in a completely randomized design with 25 to 30 pigs per pen and 6 replications per treatment. Treatments included 4 standardized ileal digestible (SID) tryptophan:lysine ratios (15, 17, 19, and 21% of lysine) using crystal-line L-tryptophan added to the 15% diet. An additional diet used soybean meal as a source of tryptophan to provide a SID tryptophan:lysine ratio of 21%.
Overall (d 0 to d 61), increasing the SID tryptophan:lysine ratio did not affect (P > 0.25) growth performance. Pigs fed a diet containing a 21% SID tryptophan:lysine ratio with added soybean meal as the tryptophan source had (P = 0.01) poorer F/G compared with pigs fed the diet with a 21% SID tryptophan:lysine ratio from crystalline tryp-tophan. Although not significant, pigs fed the 21% SID tryptophan:lysine ratio with soybean meal as the tryptophan source had a 3% reduction in ADG compared with those fed a SID tryptophan:lysine ratio of 21% using L-tryptophan. Otherwise, ADG and ADFI (P = 0.37, P = 0.82) were similar across all treatments. In conclusion, increasing the SID tryptophan:lysine ratio from 15 to 21% by adding crystalline trypto-phan (L-tryptophan) did not influence finishing pig growth performance.
Key words: SID tryptophan:lysine ratio, tryptophan, DDGS, growth, finishing pig
IntroductionIn U.S. finishing pig diets, use of high levels of DDGShas become common. Trypto-phan is the second limiting amino acid after lysine in diets containing high levels of DDGS. Previous research4 at Kansas State University has demonstrated an optimal SID tryptophan:lysine ratio of greater than 18% in diets containing high levels (30%) of DDGS for pigs greater than 160 lb BW. In those trials, adding crystalline L-tryp-tophan to a diet containing a 15% SID tryptophan:lysine ratio to make a diet with
1 Appreciation is expressed to Steidinger Research Facility for use of pigs and facilities and to Ajinomoto Heartland LLC, Chicago, IL, for providing the crystalline amino acids used in diet formulation and for partial financial support.2 Department of Diagnostic Medicine/Pathobiology, College of Veterinary Medicine, Kansas State University.3 Ajinomoto Heartland LLC, Chicago, IL.4 Barnes et al., Swine Day 2010, Report of Progress 1038, pp. 156-165.

163
Finishing Nutrition and Management
an 18% SID tryptophan:lysine ratio improved growth performance. The tryptophan-supplemented diet resulted in similar ADG and F/G for pigs fed a diet containing 18% SID tryptophan:lysine ratio where soybean meal was used as the source tryptophan. In contrast, the National Swine Nutrition guide5 recommends a SID tryptophan:lysine ratio for this BW range of 16% of lysine.
Thus, the objective of this trial was to confirm previous findings for the optimal SID tryptophan:lysine ratio for finishing pigs fed diets containing 30% DDGS using L-tryp-tophan or soybean meal additions to increase the SID tryptophan:lysine ratio.
ProceduresThe K-State Institutional Animal Care and Use Committee approved the protocol used in this experiment. The study was conducted at the commercial research-finishing barn in Illinois. Daily feed additions to each pen were accomplished through a robotic feed-ing system (FeedPro; Feedlogic Corp., Willmar, MN) capable of providing and measur-ing feed amounts for individual pens.
A total of 845 pigs (PIC 380 × Mosanto) with an initial body weight of 163 lb were used in this study. A similar number of barrows and gilts were placed in each pen with 25 to 30 pigs per pen with the average number of pigs per pen similar across treatments and 6 pens per treatment. Pigs were fed a pretest diet containing 35% DDGS before the start of the experiment (Table 1). When pigs reached 163 lb, pens of pigs were allotted to 1 of the 5 dietary treatments in a completely randomized design while balancing for initial BW. Treatments were diets with 4 SID tryptophan:lysine ratios (15, 17, 19, and 21%) using crystalline L-tryptophan. An additional treatment diet contained a SID tryptophan:lysine ratio of 21% where soybean meal was used as the source of trypto-phan. All diets were fed in meal form and fed in 3 phases from d 0 to 21 (163 to 210 lb), d 21 to 42 (210 to 250 lb), and d 42 to 61 (250 lb to market) (Tables 1 and 2). All diets contained 30% DDGS except diets fed in the last phase, in which DDGS level was lowered to 15% to reduce the impact on carcass fat quality and yield. Diets in Phase 3 also contained 6.75 g/ton of Ractopamine HCl (Paylean; Elanco Animal Health, Greenfield, IN).
Pens of pigs were weighed and feed disappearance was recorded at d 10, 21, 31, 42, and 61 to determine ADG, ADFI, and F/G. On d 42 of the experiment, the 4 heaviest pigs (2 barrows and 2 gilts, determined visually) per pen were weighed and sold according to the farm’s normal marketing procedure.
The experimental data were analyzed using the MIXED procedure of SAS (SAS insti-tute, Inc., Cary, NC). Data were analyzed for the linear and quadratic effects of increas-ing SID tryptophan:lysine ratio. A single contrast was used to compare the 2 diets with SID tryptophan:lysine ratios of 21% made with either L-tryptophan or soybean meal. Pen was the experimental unit for all data analysis, and significance and tendencies were set at P < 0.05 and P < 0.10, respectively.
5 National Swine Nutrition Guide. 2010. Growing-Finishing Swine Nutrient Recommendations and Feeding Management, U.S. Pork Center of Excellence, Ames, IA.
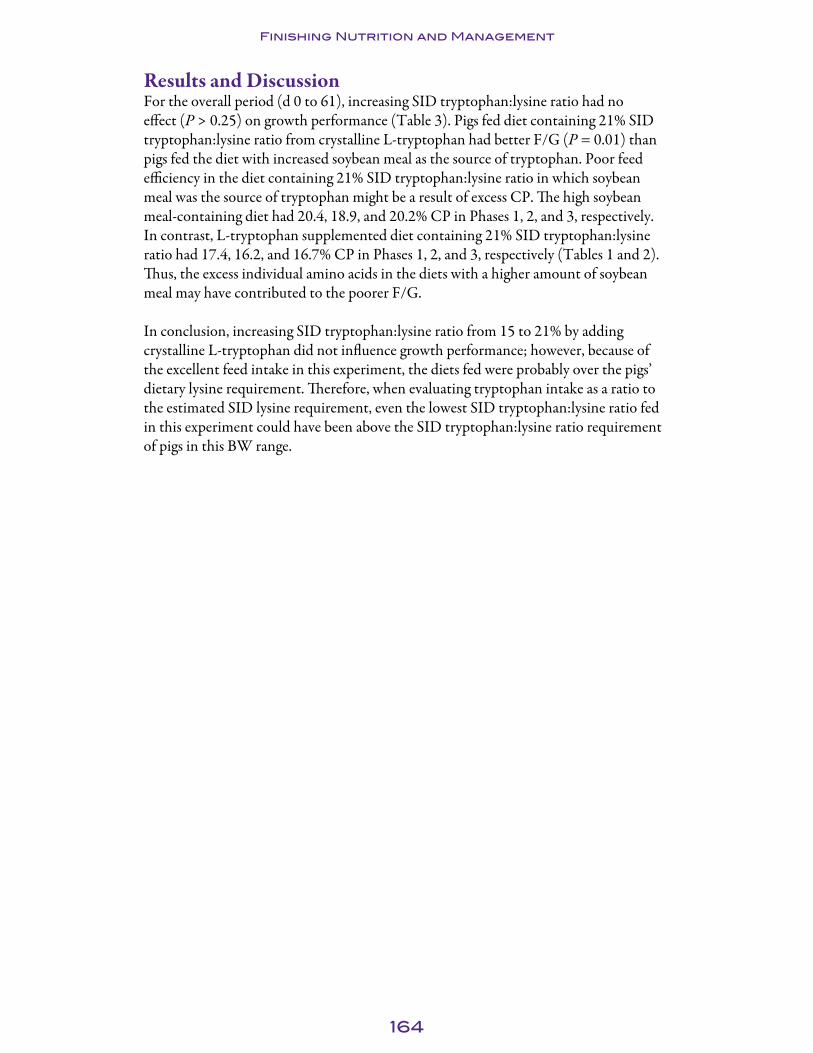
164
Finishing Nutrition and Management
Results and DiscussionFor the overall period (d 0 to 61), increasing SID tryptophan:lysine ratio had no effect (P > 0.25) on growth performance (Table 3). Pigs fed diet containing 21% SID tryptophan:lysine ratio from crystalline L-tryptophan had better F/G (P = 0.01) than pigs fed the diet with increased soybean meal as the source of tryptophan. Poor feed efficiency in the diet containing 21% SID tryptophan:lysine ratio in which soybean meal was the source of tryptophan might be a result of excess CP. The high soybean meal-containing diet had 20.4, 18.9, and 20.2% CP in Phases 1, 2, and 3, respectively. In contrast, L-tryptophan supplemented diet containing 21% SID tryptophan:lysine ratio had 17.4, 16.2, and 16.7% CP in Phases 1, 2, and 3, respectively (Tables 1 and 2). Thus, the excess individual amino acids in the diets with a higher amount of soybean meal may have contributed to the poorer F/G.
In conclusion, increasing SID tryptophan:lysine ratio from 15 to 21% by adding crystalline L-tryptophan did not influence growth performance; however, because of the excellent feed intake in this experiment, the diets fed were probably over the pigs’ dietary lysine requirement. Therefore, when evaluating tryptophan intake as a ratio to the estimated SID lysine requirement, even the lowest SID tryptophan:lysine ratio fed in this experiment could have been above the SID tryptophan:lysine ratio requirement of pigs in this BW range.
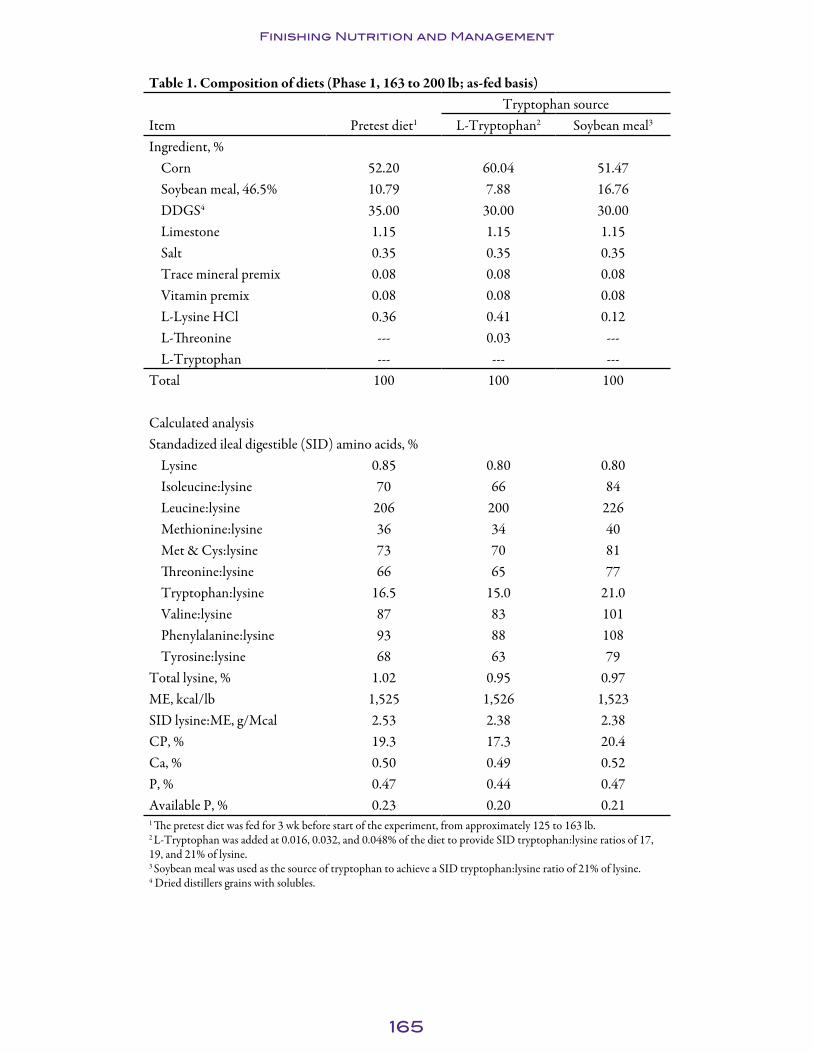
165
Finishing Nutrition and Management
Table 1. Composition of diets (Phase 1, 163 to 200 lb; as-fed basis)Tryptophan source
Item Pretest diet1 L-Tryptophan2 Soybean meal3
Ingredient, %Corn 52.20 60.04 51.47Soybean meal, 46.5% 10.79 7.88 16.76DDGS4 35.00 30.00 30.00Limestone 1.15 1.15 1.15Salt 0.35 0.35 0.35Trace mineral premix 0.08 0.08 0.08Vitamin premix 0.08 0.08 0.08L-Lysine HCl 0.36 0.41 0.12L-Threonine --- 0.03 ---L-Tryptophan --- --- ---
Total 100 100 100
Calculated analysisStandadized ileal digestible (SID) amino acids, %
Lysine 0.85 0.80 0.80 Isoleucine:lysine 70 66 84Leucine:lysine 206 200 226Methionine:lysine 36 34 40Met & Cys:lysine 73 70 81Threonine:lysine 66 65 77Tryptophan:lysine 16.5 15.0 21.0Valine:lysine 87 83 101Phenylalanine:lysine 93 88 108Tyrosine:lysine 68 63 79
Total lysine, % 1.02 0.95 0.97 ME, kcal/lb 1,525 1,526 1,523SID lysine:ME, g/Mcal 2.53 2.38 2.38CP, % 19.3 17.3 20.4Ca, % 0.50 0.49 0.52P, % 0.47 0.44 0.47Available P, % 0.23 0.20 0.211 The pretest diet was fed for 3 wk before start of the experiment, from approximately 125 to 163 lb.2 L-Tryptophan was added at 0.016, 0.032, and 0.048% of the diet to provide SID tryptophan:lysine ratios of 17, 19, and 21% of lysine.3 Soybean meal was used as the source of tryptophan to achieve a SID tryptophan:lysine ratio of 21% of lysine.4 Dried distillers grains with solubles.

166
Finishing Nutrition and Management
Table 2. Composition of diets (Phase 2 and Phase 3; as-fed basis)1
Phase 2 Phase 3Tryptophan source L-Tryptophan2 Soybean meal3 L-Tryptophan4 Soybean mealIngredient
Corn 62.99 55.45 69.46 59.82Soybean meal, 46.5% 4.99 12.78 13.39 23.36DDGS5 30.00 30.00 15.00 15.00Limestone 1.15 1.15 1.10 1.10Salt 0.35 0.35 0.35 0.35Trace mineral premix 0.08 0.08 0.08 0.08Vitamin premix 0.08 0.08 0.08 0.08L-lysine HCl 0.37 0.12 0.41 0.09DL-methionine --- --- 0.015 ---L-threonine --- --- 0.09 0.09L-tryptophan --- --- --- ---Ractopamine HCl, 9 g/lb6 --- --- 0.038 0.038
Total 100 100 100 100
Calculated analysisStandadized ileal digestible (SID) amino acids, %
Lysine 0.70 0.70 0.90 0.90 Isoleucine:lysine 68 87 60 79Leucine:lysine 218 245 163 189Methionine:lysine 37 43 30 34Met & Cys:lysine 77 87 60 69Threonine:lysine 65 80 65 80Tryptophan:lysine 15.0 21.0 15.0 21.0Valine:lysine 88 106 73 91Phenylalanine:lysine 93 113 77 97Tyrosine:lysine 67 83 55 71
Total lysine, % 0.84 0.86 1.02 1.05 ME, kcal/lb 1,526 1,524 1,525 1,522SID lysine:ME, g/Mcal 2.08 2.08 2.68 2.68CP, % 16.2 18.9 16.7 20.2Ca, % 0.48 0.51 0.49 0.52P, % 0.42 0.46 0.39 0.44Available P, % 0.20 0.21 0.13 0.141 Phase 2 diets were fed from 210 to 250 lb BW and Phase 3 diets were fed from 250 lb BW until market.2 L-tryptophan was added at 0.014, 0.029, and 0.043% of the diet to provide SID tryptophan:lysine ratios of 17, 19, and 21% of lysine.3 Soybean meal was used as the source of tryptophan to achieve a SID tryptophan:lysine ratio of 21% of lysine. 4 L-tryptophan was added at 0.018, 0.036, and 0.054% of the diet to provide SID tryptophan:lysine ratios of 17, 19, and 21% of lysine.5 Dried distillers grains with solubles. 6 Ractopamine HCl (Paylean; Elanco Animal Health, Greenfield, IN) at 6.75 g/ton was added.

167
Finishing Nutrition and Management
Table 3. Determining the effects of standardized ileal digestible (SID) tryptophan:lysine ratio in diets containing 30% dried distillers grains with solubles (DDGS) on growth performance of finishing pigs 1
Probability, P <SID tryptophan:lysine ratio, (% of lysine) Tryptophan 21%
(L-tryptophan vs. soybean meal)Item 152 17 19 21
Soybean meal 213 SEM Linear Quadratic
Initial wt, lb 163.2 163.5 163.3 163.2 163.4 2.161 0.99 0.92 0.94Final wt, lb 290.4 287.1 288.9 285.6 282.1 4.554 0.55 1.00 0.59
d 0 to 61ADG , lb 2.19 2.16 2.18 2.12 2.06 0.051 0.40 0.75 0.37ADFI, lb 7.30 7.31 7.22 7.06 7.11 0.155 0.25 0.58 0.82F/G 3.33 3.38 3.31 3.33 3.46 0.033 0.62 0.62 0.01
1 A total of 845 pigs (PIC 380 × Monsanto; initially 163 lb) were used in a 61-d growing-finishing trial with 25 to 30 pigs per pen and 6 pens per treatment.2 L-Tryptophan was added to the 15% SID tryptophan:lysine diet to provide SID tryptophan:lysine ratios 17, 19, and 21% lysine.3 Soybean meal was used as the source of tryptophan to provide a SID tryptophan:lysine ration of 21%.

168
Finishing Nutrition and Management
Determining the Effects of Tryptophan:Lysine Ratio in Diets Containing Dried Distillers Grains with Solubles on Growth Performance of Finishing Pigs1
S. Nitikanchana2, M. D. Tokach, S. S. Dritz2, J.L. Usry3, R. D. Goodband, J. M. DeRouchey, and J. L. Nelssen
SummaryA total of 1,235 pigs (PIC 1050 × 337; initially 149 lb) were used in a 71-d study to determine the effects of tryptophan:lysine ratio in diets containing 0, 20, or 40% dried distillers grains with solubles (DDGS) on growth performance of finishing pigs raised in a commercial environment. Pens of pigs were balanced by initial weight and randomly allotted to 1 of 6 dietary treatments in a completely randomized design with 26 to 28 pigs per pen and 7 to 8 replications per treatment. Treatments were arranged as a 2 × 3 factorial with main effects of standardized ileal digestible (SID) tryptophan:lysine ratio (16.5 or 20% of lysine) and DDGS (0, 20, or 40%). Overall (d 0 to d 71), no differ-ences occurred in growth performance due to SID tryptophan:lysine ratio. Increasing DDGS resulted in poorer F/G (linear, P = 0.02), but did not influence other growth performance criteria. For carcass characteristics, increasing the SID tryptophan:lysine ratio increased (P = 0.02) carcass yield percentage with the greatest improvement in yield observed when diets contained high levels (20 and 40%) of DDGS (trypto-phan × DDGS interaction, P = 0.07). Pigs fed high levels of DDGS had reduced loin depth (linear, P = 0.02); however, the lowest loin depth was at 40% DDGS for 16.5% SID tryptophan:lysine ratio and at 20% DDGS for 20% SID tryptophan:lysine ratio resulting in a tryptophan × DDGS interaction (quadratic, P = 0.02). A tendency of tryptophan × DDGS interaction (linear, P = 0.08) was observed for lean percentage, with lean percentage decreasing as DDGS increased in diets containing the 16.5% SID tryptophan:lysine ratio and no change in lean percentage as DDGS increased in diets containing the 20% SID tryptophan:lysine ratio. The tendency of interactions for yield and lean percentage indicate an advantage to increasing the SID tryptophan:lysine ratio in diets with high levels of DDGS, but no effects on growth performance were observed due to SID tryptophan:lysine ratio.
Key words: amino acid ratio, DDGS, lysine, tryptophan, finishing pig
IntroductionDried distillers grains with solubles (DDGS) have been widely used in swine diets in the United States. Tryptophan is the second limiting amino acid after lysine in diets containing high level of DDGS. A previous study (Barnes et al., 20104) observed a 1 Appreciation is expressed to New Horizon Farms for use of pigs and facilities and to Richard Brobjorg, Scott Heidebrink, and Marty Heintz for technical assistance.2 Department of Diagnostic Medicine/Pathobiology, College of Veterinary Medicine, Kansas State University.3 Ajinomoto Heartland LLC, Chicago, IL.4 Barnes et al., Swine Day 2010, Report of Progress 1038, pp. 156-165.
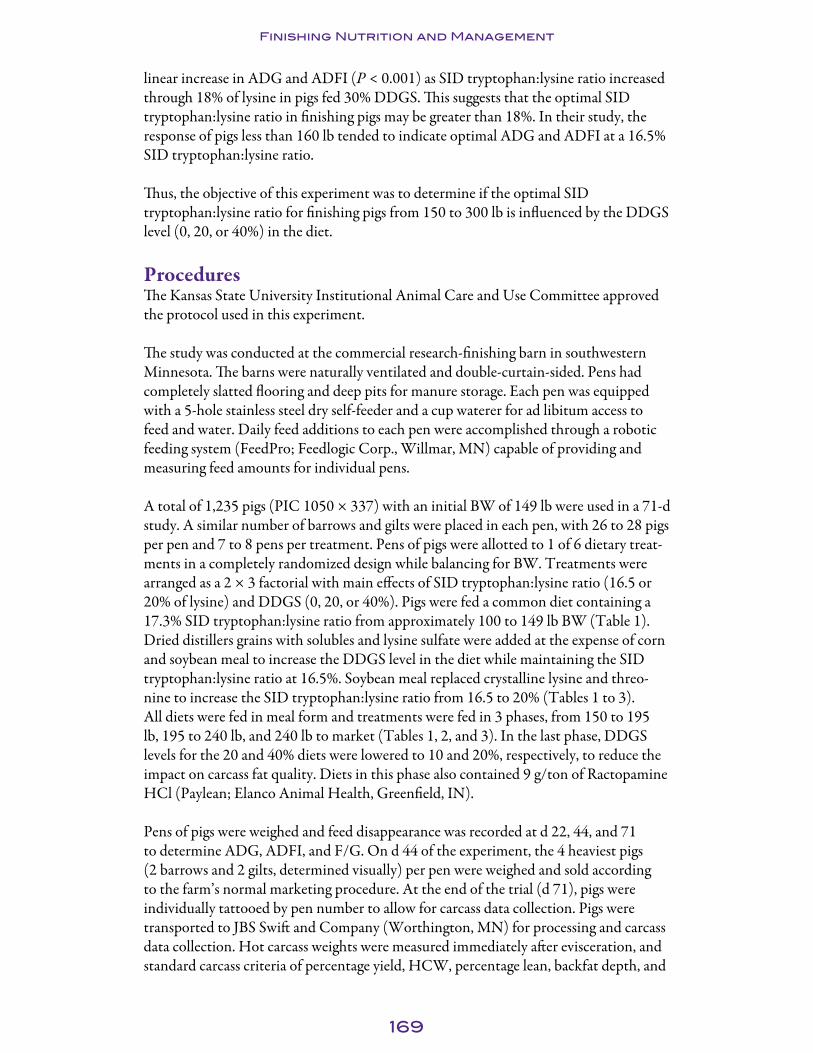
169
Finishing Nutrition and Management
linear increase in ADG and ADFI (P < 0.001) as SID tryptophan:lysine ratio increased through 18% of lysine in pigs fed 30% DDGS. This suggests that the optimal SID tryptophan:lysine ratio in finishing pigs may be greater than 18%. In their study, the response of pigs less than 160 lb tended to indicate optimal ADG and ADFI at a 16.5% SID tryptophan:lysine ratio.
Thus, the objective of this experiment was to determine if the optimal SID tryptophan:lysine ratio for finishing pigs from 150 to 300 lb is influenced by the DDGS level (0, 20, or 40%) in the diet.
ProceduresThe Kansas State University Institutional Animal Care and Use Committee approved the protocol used in this experiment.
The study was conducted at the commercial research-finishing barn in southwestern Minnesota. The barns were naturally ventilated and double-curtain-sided. Pens had completely slatted flooring and deep pits for manure storage. Each pen was equipped with a 5-hole stainless steel dry self-feeder and a cup waterer for ad libitum access to feed and water. Daily feed additions to each pen were accomplished through a robotic feeding system (FeedPro; Feedlogic Corp., Willmar, MN) capable of providing and measuring feed amounts for individual pens.
A total of 1,235 pigs (PIC 1050 × 337) with an initial BW of 149 lb were used in a 71-d study. A similar number of barrows and gilts were placed in each pen, with 26 to 28 pigs per pen and 7 to 8 pens per treatment. Pens of pigs were allotted to 1 of 6 dietary treat-ments in a completely randomized design while balancing for BW. Treatments were arranged as a 2 × 3 factorial with main effects of SID tryptophan:lysine ratio (16.5 or 20% of lysine) and DDGS (0, 20, or 40%). Pigs were fed a common diet containing a 17.3% SID tryptophan:lysine ratio from approximately 100 to 149 lb BW (Table 1). Dried distillers grains with solubles and lysine sulfate were added at the expense of corn and soybean meal to increase the DDGS level in the diet while maintaining the SID tryptophan:lysine ratio at 16.5%. Soybean meal replaced crystalline lysine and threo-nine to increase the SID tryptophan:lysine ratio from 16.5 to 20% (Tables 1 to 3). All diets were fed in meal form and treatments were fed in 3 phases, from 150 to 195 lb, 195 to 240 lb, and 240 lb to market (Tables 1, 2, and 3). In the last phase, DDGS levels for the 20 and 40% diets were lowered to 10 and 20%, respectively, to reduce the impact on carcass fat quality. Diets in this phase also contained 9 g/ton of Ractopamine HCl (Paylean; Elanco Animal Health, Greenfield, IN).
Pens of pigs were weighed and feed disappearance was recorded at d 22, 44, and 71 to determine ADG, ADFI, and F/G. On d 44 of the experiment, the 4 heaviest pigs (2 barrows and 2 gilts, determined visually) per pen were weighed and sold according to the farm’s normal marketing procedure. At the end of the trial (d 71), pigs were individually tattooed by pen number to allow for carcass data collection. Pigs were transported to JBS Swift and Company (Worthington, MN) for processing and carcass data collection. Hot carcass weights were measured immediately after evisceration, and standard carcass criteria of percentage yield, HCW, percentage lean, backfat depth, and

170
Finishing Nutrition and Management
loin depth were collected. Percentage of yield was calculated by dividing live weight at the plant with carcass weight at the plant as reported by the processor.
The experimental data were analyzed using the MIXED procedure of SAS (SAS insti-tute, Inc., Cary, NC). Pen was the experimental unit for all data and significance and tendencies were set at P < 0.05 and P < 0.10, respectively. Analysis of backfat depth, loin depth, and percentage lean were adjusted to a common carcass weight. Data were analyzed for the main effects of SID tryptophan:lysine ratio, linear and quadratic effect of DDGS, and any interactions between SID tryptophan:lysine ratio and DDGS. Results were considered significant at P ≤ 0.05 and considered a trend at P ≤ 0.10.
Results and DiscussionFor the overall period (d 0 to 71), no differences were measured in growth performance among pigs fed a SID tryptophan:lysine ratio of either 16.5 or 20% of lysine (Table 4). Increasing DDGS resulted in poorer F/G (linear, P = 0.02) but did not influence other growth performance criteria. Also, a tendency (linear, P = 0.07) for an interac-tion was observed for ADFI with the greatest ADFI at 40% DDGS for 16.5% SID tryptophan:lysine ratio and at 20% DDGS for 20% SID tryptophan:lysine ratio.
For carcass characteristics, increasing the SID tryptophan:lysine ratio increased (P = 0.02) carcass yield, with the greatest improvement in yield observed when diets contained high levels of DDGS (tryptophan:lysine ratio × DDGS interac-tion, P = 0.07), but other carcass characteristics were not affected by increasing the SID tryptophan:lysine ratio. Pigs fed high levels of DDGS had reduced loin depth (linear, P = 0.02); however, the lowest loin depth was at 40% DDGS for 16.5% SID tryptophan:lysine and at 20% DDGS for 20% SID tryptophan:lysine, resulting in a tryptophan:lysine ratio × DDGS interaction (quadratic, P = 0.02). Level of DDGS did not influence other carcass criteria. A tendency for a tryptophan:lysine ratio × DDGS interaction (linear, P = 0.08) was observed for lean percentage, with lean percentage decreasing as DDGS were added to diets containing 16.5% SID tryptophan:lysine; no changes in lean percentage occurred as DDGS were added to diets containing 20% SID tryptophan:lysine ratio. Other carcass values were not influenced by SID tryptophan:lysine ratio or DDGS (Table 4).
In conclusion, the tendency of interactions for yield and lean percentage indicate some advantage to increasing the SID tryptophan:lysine ratio in diets with high levels of DDGS compared with no advantage to increasing the ratio in the control diet; however, increasing the SID tryptophan:lysine ratio from 16.5 to 20% did not improve growth performance or carcass value. Because a previous study at Kansas State University (Barnes et al., 20105) showed improvements in ADG, ADFI, and income over feed cost when increasing SID tryptophan:lysine through 18%, more studies on tryptophan:lysine ratio in high-DDGS diets should be conducted to determine the appropriate SID tryptophan:lysine ratio in diets containing high levels of DDGS.
5 Barnes et al., Swine Day 2010, Report of Progress 1038, pp. 156-165.

171
Finishing Nutrition and Management
Table 1. Composition of Phase 1 diets (as-fed basis)1
Standardized ileal digestible (SID) tryptophan:lysine, %16.5 20
ItemCommon
diet1 DDGS, %2 0 20 40 0 20 40Ingredient
Corn 53.60 82.70 66.40 50.00 77.90 61.60 45.20Soybean meal, 46.5% CP 14.40 15.10 11.50 7.80 20.30 16.60 12.90DDGS 30.00 --- 20.00 40.00 --- 20.00 40.00Monocalcium P, 21% P --- 0.35 --- --- 0.33 --- ---Limestone 1.15 0.95 1.15 1.18 0.93 1.10 1.13Salt 0.35 0.35 0.35 0.35 0.35 0.35 0.35Vitamin premix --- 0.09 0.09 0.09 0.09 0.09 0.09L-Threonine --- 0.08 0.02 --- --- --- ---L-Lysine sulfate 0.50 0.42 0.49 0.56 0.16 0.23 0.30Phytase3 0.01 0.01 0.01 0.01 0.01 0.01 0.01
Total 100 100 100 100 100 100 100
Calculated analysisSID amino acids, %
Lysine 0.90 0.79 0.79 0.79 0.79 0.79 0.79 Isoleucine:lysine 71 62 68 73 73 79 84Leucine:lysine 195 158 191 224 174 207 240Methionine:lysine 34 28 33 39 31 36 42Met & Cys:lysine 70 57 68 79 63 74 85Threonine:lysine 65 65 65 69 65 71 78Tryptophan:lysine 17.3 16.5 16.5 16.5 20.0 20.0 20.0Valine:lysine 86 74 83 93 85 94 103Phenylalanine:lysine 91 77 88 98 89 100 110Tyrosine:lysine 67 55 63 72 64 72 81
Total lysine, % 1.06 0.88 0.92 0.96 0.90 0.93 0.97 ME, kcal/lb 1,527 1,523 1,526 1,527 1,522 1,525 1,526SID lysine:ME, g/Mcal 2.67 2.35 2.35 2.35 2.35 2.35 2.35CP, % 19.8 14.4 16.8 19.2 16.2 18.6 21.0Ca, % 0.51 0.50 0.50 0.50 0.50 0.50 0.50P, % 0.46 0.41 0.41 0.48 0.43 0.43 0.50Available P, % 0.31 0.23 0.26 0.35 0.23 0.26 0.361 Common diet was fed from 100 to 149 lb of pig body weight; Phase 1 diet was an experimental diet fed from 149 to 195 lb.2 Dried distillers grains with solubles from Vera-Sun (Aurora, SD).3 OptiPhos 2000 (Enzyvia LLC, Sheridan, IN).

172
Finishing Nutrition and Management
Table 3. Composition of Phase 3 diets (as-fed basis)1
Standardized ileal digestible (SID) tryptophan:lysine ratio, %16.5 20
Item DDGS, %2 0 20 40 0 20 40Ingredient
Corn 85.50 69.20 52.80 81.20 65.00 48.40Soybean meal, 46.5% CP 12.30 8.70 5.10 16.90 13.20 9.70DDGS --- 20.00 40.00 --- 20.00 40.00Monocalcium P, 21% P 0.35 --- --- 0.35 --- ---Limestone 0.98 1.18 1.20 0.93 1.13 1.15Salt 0.35 0.35 0.35 0.35 0.35 0.35Vitamin premix 0.09 0.09 0.09 0.09 0.09 0.09DL-Methionine 0.05 --- --- --- --- ---L-Threonine 0.05 --- --- --- --- ---L-Lysine sulfate 0.38 0.45 0.52 0.15 0.22 0.29Phytase3 0.01 0.01 0.01 0.01 0.01 0.01Ractopamine HCl, 9 g/lb4 0.05 0.05 0.05 0.05 0.05 0.05
Total 100 100 100 100 100 100
Calculated analysisSID amino acids, %
Lysine 0.92 0.92 0.92 0.92 0.92 0.92 Isoleucine:lysine 61 63 66 72 74 76Leucine:lysine 146 160 174 161 176 190Methionine:lysine 31 28 31 29 31 34Met & Cys:lysine 58 58 63 59 64 69Threonine:lysine 65 65 65 65 66 69Tryptophan:lysine 16.5 16.6 16.5 20.0 20.0 20.0Valine:lysine 71 75 79 82 86 90Phenylalanine:lysine 74 79 83 86 90 95Tyrosine:lysine 53 57 60 62 66 70
Total lysine, % 1.02 1.04 1.06 1.04 1.06 1.08 ME, kcal/lb 1,523 1,525 1,525 1,521 1,524 1,524SID lysine:ME, g/Mcal 2.74 2.74 2.74 2.74 2.74 2.74CP, % 16.0 17.2 18.4 18.0 19.2 20.4Ca, % 0.50 0.50 0.50 0.50 0.50 0.50P, % 0.42 0.39 0.42 0.44 0.41 0.45Available P, % 0.23 0.21 0.26 0.23 0.22 0.271 Phase 3 diet was fed from 240 lb until market (approximately 300 lb).2 Dried distillers grains with solubles from Vera-Sun (Aurora, SD).3 OptiPhos 2000 (Enzyvia LLC, Sheridan, IN).4 Ractopamine HCl (Paylean; Elanco Animal Health, Greenfield, IN) at 9.0 g/ton was added.

173
Fin
ish
ing
Nu
tr
itio
n a
nd
Ma
na
ge
me
nt
Table 4. Effects of tryptophan:lysine ratio in diets containing increasing dried distillers grains with solubles (DDGS) on growth performance of finishing pigs1
Standardized ileal digestible (SID) tryptophan:lysine ratio, % Probability, P <16.5 20 Trp
levelDDGS Trp × DDGS
DDGS, % 0 20 40 0 20 40 SEM TRT Linear Quadratic Linear QuadraticReplications2 8 7 8 8 7 8Initial wt, lb 149.6 149.0 149.3 149.2 149.6 149.0 3.05 1.00 1.00 0.93 0.98 1.00 0.86Final wt, lb 299.7 301.3 299.0 302.6 304.2 300.8 3.24 0.89 0.35 0.70 0.45 0.86 0.93
d 0 to 71ADG , lb 2.18 2.21 2.18 2.23 2.23 2.18 0.021 0.30 0.23 0.27 0.14 0.30 0.80ADFI, lb 6.46 6.64 6.74 6.67 6.75 6.63 0.089 0.25 0.36 0.20 0.37 0.07 0.70F/G 2.97 3.00 3.10 3.00 3.03 3.04 0.035 0.17 0.93 0.02 0.79 0.21 0.51
Carcass weight, lb 229.3 229.8 225.1 231.0 230.7 229.5 2.710 0.70 0.32 0.29 0.55 0.63 0.66Yield, % 77.6 76.5 76.8 77.2 78.2 78.0 0.408 0.05 0.02 0.96 0.85 0.07 0.10Backfat, in. 0.70 0.72 0.71 0.73 0.74 0.68 0.017 0.24 0.54 0.26 0.13 0.09 0.78Loin depth, in. 2.86 2.89 2.78 2.91 2.82 2.86 0.030 0.04 0.39 0.02 0.98 0.62 0.02Lean, % 56.8 55.8 55.8 56.4 56.0 56.7 0.362 0.24 0.40 0.37 0.13 0.08 0.99
Carcass valuesPrice, $/cwt 91.84 92.18 92.12 91.34 92.19 92.62 0.906 0.95 1.00 0.39 0.81 0.58 1.00Premium, $/cwt 2.69 2.73 2.55 2.62 2.60 3.06 0.220 0.65 0.59 0.51 0.75 0.20 0.39Sort loss, $/cwt -5.02 -4.72 -4.60 -5.46 -4.58 -4.60 0.76 0.96 0.88 0.41 0.70 0.78 0.79
1 A total of 1,235 pigs (PIC 1050 × 337, initially 149 lb) were used in a 71-d growing-finishing trial with 26 to 28 pigs per pen and 7 to 8 pens per treatment.2 Replications are numbers of pens for each treatment.

174
Finishing Nutrition and Management
Determining the Effect of the Ratio of Tryptophan to Large Neutral Amino Acids on the Growth Performance of Finishing Pigs1
S. Nitikanchana2, M. D. Tokach, S. S. Dritz2, J.L. Usry3, J. M. DeRouchey, R. D. Goodband, J. R. Bergstrom, and J. L. Nelssen
SummaryA total of 96 pigs (PIC TR4 × 1050; initially 77.4 lb) were used in 2 14-d studies to determine the effect of standardized ileal digestible (SID) tryptophan to large neutral amino acids (LNAA) ratio on growth performance of finishing pigs. Pens of pigs were balanced by initial weight and randomly allotted to 1 of 4 dietary treatments in a completely randomized design with 4 pigs per pen and 6 replications per treatment. The treatment diets were fed in 2 phases: early finishing phase (77 to 106 lb BW) and late finishing phase (183 to 217 lb BW), with a common diet fed in between. Dietary treatments included: (1) a corn-soybean meal-based diet without DDGS, (2) a corn-soybean meal-based diet with 45% dried distillers grains with solubles (DDGS), (3) a corn-soybean meal-based diet without DDGS but supplemented with similar amounts of LNAA as the diet containing 45% DDGS, and (4) the LNAA-supplemented diet with added crystalline tryptophan to increase the SID tryptophan:LNAA ratio. The diets were formulated in a similar manner for the late finishing phase with the excep-tion that DDGS were lowered to 30% of the diet. In the early finishing period (77 to 106 lb), pigs fed 45% DDGS diet had poorer F/G (P = 0.01) compared with pigs fed the other diets; however, no differences were found in other response criteria. During the late finishing period (183 to 217 lb), pig growth performance was not affected by dietary treatment. These results suggest that the high level of LNAA relative to trypto-phan in diets containing 30% DDGS or greater may not be responsible for the apparent increase in the tryptophan requirement of finishing pigs seen in previous studies.
Key words: amino acids, large neutral amino acids, lysine, tryptophan, finishing pig
IntroductionLarge neutral amino acids (LNAA; isoleucine, leucine, phenylalanine, tyrosine, and valine) compete with the transport of tryptophan through the intestinal cell membrane as well as the blood-brain barrier. Previous research4 has indicated that high levels of LNAA in the diet may reduce feed intake unless tryptophan concentrations are increased. Thus, the high concentration of LNAA found in diets with DDGS might be responsible for any reduced growth performance and may also increase the tryptophan
1 The authors wish to thank Ajinomoto Heartland LLC, Chicago, IL, for providing the crystalline amino acids used in diet formulation and for partial financial support.2 Department of Diagnostic Medicine/Pathobiology, College of Veterinary Medicine, Kansas State University.3 Ajinomoto Heartland LLC, Chicago, IL.4 Henry et al.1992. Interactive effects of dietary levels of tryptophan and protein on voluntary feed intake and growth performance in pigs, in relation to plasma free amino acids and hypothalamic serotonin. J. Anim. Sci. 70:1873-1887.

175
Finishing Nutrition and Management
requirement to offset the competitive inhibition by LNAA for cell membrane trans-porters.
Thus, our objective in this pilot study was to compare a corn-soybean meal diet to diets with 45 or 30% DDGS, and to a diet with similar LNAA ratios supplemented with and without tryptophan. In addition, a second objective was to evaluate if the high concentration of LNAA provided by DDGS reduces growth performance and if adding tryptophan would improve the performance.
ProceduresThe Kansas State University Institutional Animal Care and Use Committee approved procedures used in these experiments. These experiments were conducted in the grow-ing-finishing research barn at the K-State Swine Teaching and Research Center. The facility is a totally enclosed, environmentally regulated, mechanically ventilated barn containing 40 pens (8 ft × 10 ft). The pens had adjustable gates facing the alleyway that allowed for 10 ft2/pig. Each pen was equipped with a Farmweld (Teutopolis, IL) single-sided, dry self-feeder with 2 eating spaces located in the fence line and a cup waterer. Pens were located over a completely slatted concrete floor with a 4-ft pit underneath for manure storage. The facility was also equipped with a computerized feeding system (FeedPro; Feedlogic Corp., Willmar, MN) that delivered and recorded diets as speci-fied. The equipment provided pigs with ad libitum access to food and water.
A total of 96 pigs (PIC TR4 × 1050) with an initial BW of 77.4 lb were used in 2 14-d studies. A similar number of barrows and gilts were placed in each pen with 4 pigs per pen and 6 pens per treatment. Pens of pigs were allotted at the start of the early finish-ing phase and re-allotted before the late finishing phase to 1 of 4 dietary treatments in a completely randomized design while balancing for BW. The treatment diets were fed in 2 phases, early finishing phase (77 to 106 lb BW) and late finishing phase (183 to 217 lb BW), with a common diet fed between the 2 phases. Treatments included (1) a corn soybean-meal-based diet without DDGS, (2) a corn-soybean meal-based diet with 45% DDGS, (3) a corn-soybean meal-based diet without DDGS but supplemented with similar amounts of LNAA as the diet containing 45% DDGS, and (4) the LNAA supplemented diet with added L-tryptophan to increase the SID tryptophan:LNAA ratio (Table 1). The 45% DDGS diet was supplemented with L-lysine HCl to provide a minimum SID tryptophan:lysine ratio of 16.5%. Crystalline isoleucine, valine, leucine, phenylalanine, and tyrosine were added to provide the LNAA. Treatment diets contained 16.5% SID tryptophan:lysine ratio except the last diet, to which crys-talline tryptophan was added to achieve a ratio of 21.0%. The diets were formulated in a similar manner for the late finishing phase with the exception that the DDGS level was lowered to 30% (Table 2). The DDGS used in the 2 phases were not from the same lot but came from the same source. The SID tryptophan:LNAA ratios were 3.0 and 3.8% in early finishing phase and 3.1 and 4.1% in late finishing phase. Pens of pigs were weighed and feed disappearance was recorded at d 7 and 14 in each phase to determine ADG, ADFI, and F/G.
The experimental data were analyzed using the MIXED procedure of SAS (SAS insti-tute, Inc., Cary, NC). Pen was the experimental unit for all data analysis and signifi-cance and tendencies were set at P < 0.05 and P < 0.10, respectively.

176
Finishing Nutrition and Management
Results and DiscussionIn the early finishing period (77 to 106 lb), pigs fed the 45% DDGS diet had poorer F/G (P = 0.01; Table 3) compared with pigs fed the other dietary treatments, which was a result of numerically lower (P = 0.11) ADG without a change in feed intake; however, no other differences occurred in other response criteria. During the late finish-ing period (183 to 217 lb), pig growth performance was not different among treatments (Table 4). These results indicate that late finishing pigs can tolerate 30% DDGS with-out reducing performance; however, performance was reduced when 45% DDGS was fed to early finishing pigs.
In the early and late finishing period, pigs fed the corn-soybean meal diet had similar growth performance as those fed corn soybean-meal and LNAA, indicating that a high concentration of LNAA in DDGS may not be responsible for the poor growth performance in pigs fed diets containing DDGS. Also, increasing the percentage of tryptophan:LNAA (3.1 to 4.1% and 3.0 to 3.8% in early and late finisher) diets containing high level of supplemented LNAA neither improved growth performance nor appeared to increase the pigs’ requirement for tryptophan.
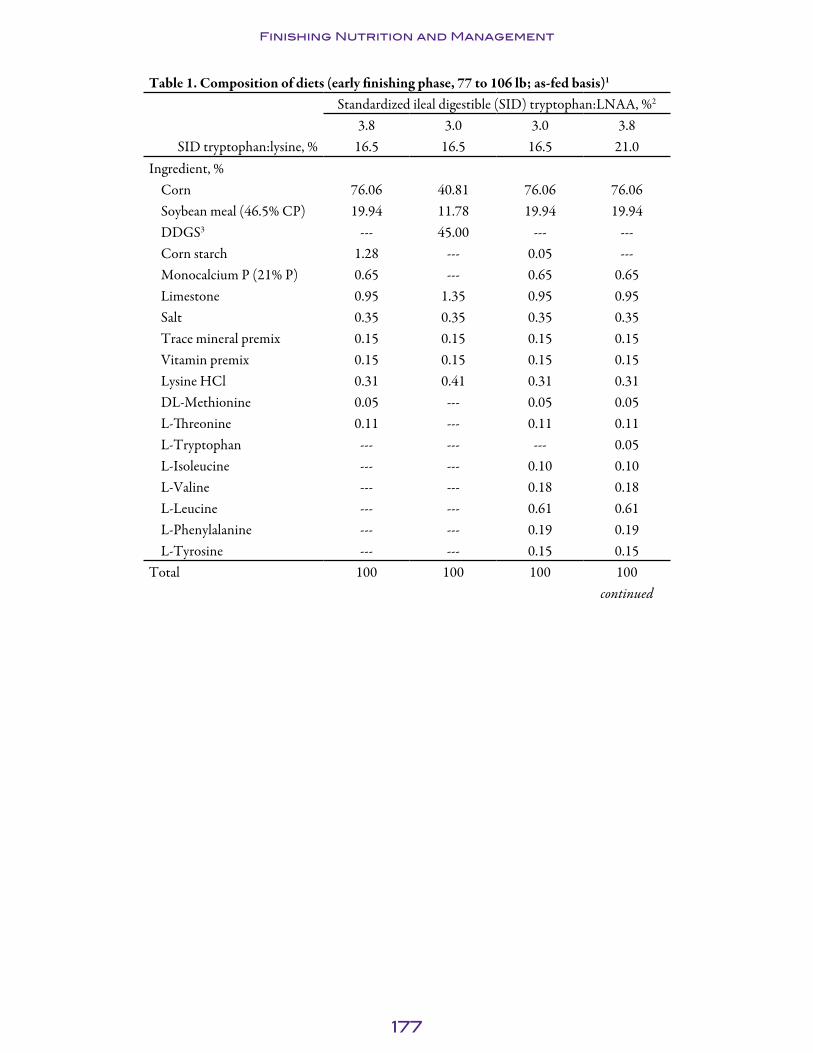
177
Finishing Nutrition and Management
Table 1. Composition of diets (early finishing phase, 77 to 106 lb; as-fed basis)1
Standardized ileal digestible (SID) tryptophan:LNAA, %2
3.8 3.0 3.0 3.8SID tryptophan:lysine, % 16.5 16.5 16.5 21.0
Ingredient, %Corn 76.06 40.81 76.06 76.06Soybean meal (46.5% CP) 19.94 11.78 19.94 19.94DDGS3 --- 45.00 --- ---Corn starch 1.28 --- 0.05 ---Monocalcium P (21% P) 0.65 --- 0.65 0.65Limestone 0.95 1.35 0.95 0.95Salt 0.35 0.35 0.35 0.35Trace mineral premix 0.15 0.15 0.15 0.15Vitamin premix 0.15 0.15 0.15 0.15Lysine HCl 0.31 0.41 0.31 0.31DL-Methionine 0.05 --- 0.05 0.05L-Threonine 0.11 --- 0.11 0.11L-Tryptophan --- --- --- 0.05L-Isoleucine --- --- 0.10 0.10L-Valine --- --- 0.18 0.18L-Leucine --- --- 0.61 0.61L-Phenylalanine --- --- 0.19 0.19L-Tyrosine --- --- 0.15 0.15
Total 100 100 100 100continued

178
Finishing Nutrition and Management
Table 1. Composition of diets (early finishing phase, 77 to 106 lb; as-fed basis)1
Standardized ileal digestible (SID) tryptophan:LNAA, %2
3.8 3.0 3.0 3.8SID tryptophan:lysine, % 16.5 16.5 16.5 21.0
Calculated analysisSID amino acid, %
Lysine 0.94 0.94 0.94 0.94 Isoleucine:lysine 60 71 71 71Leucine:lysine 143 207 207 207Methionine:lysine 31 36 31 31Met & Cys:lysine 57 73 57 57Threonine:lysine 65 66 65 65Tryptophan:lysine 16.5 16.5 16.5 21.7Valine:lysine 70 88 88 88Phenylalanine:lysine 74 94 94 94Tyrosine:lysine 53 69 69 69Histidine:lysine 41 50 41 41
Total lysine, % 1.04 1.13 1.04 1.04 ME, kcal/lb 1,518 1,520 1,503 1,503SID lysine:ME, g/Mcal 2.81 2.81 2.84 2.84CP, % 16.1 21.6 16.4 16.4Ca, % 0.57 0.58 0.57 0.57P, % 0.49 0.52 0.49 0.49Available P, % 0.29 0.38 0.29 0.291 Treatment diets were fed for 14 d from 77 to 106 lb BW.2 Large neutral amino acids (isoleucine, leucine, phenylalanine, tyrosine, and valine).3 Dried distillers grains with solubles.

179
Finishing Nutrition and Management
Table 2. Composition of diets (late finishing phase, 183 to 207 lb; as-fed basis)1
Standardized ileal digestible (SID) tryptophan:LNAA, %2
4.1 3.1 3.1 4.1SID tryptophan:lysine, % 16.5 16.5 16.5 21.0
Ingredient, %Corn 83.32 60.30 83.32 83.32Soybean meal (46.5% CP) 13.19 7.59 13.19 13.19DDGS3 --- 30.00 --- ---Corn starch 0.84 --- 0.03 ---Monocalcium P (21% P) 0.65 --- 0.65 0.65Limestone 0.95 1.15 0.95 0.95Salt 0.35 0.35 0.35 0.35Trace mineral premix 0.15 0.15 0.15 0.15Vitamin premix 0.15 0.15 0.15 0.15Lysine HCl 0.25 0.31 0.25 0.25DL-Methionine 0.05 --- 0.05 0.05L-Threonine 0.11 --- 0.11 0.11L-Tryptophan --- --- --- 0.03L-Isoleucine --- --- 0.06 0.06L-Valine --- --- 0.11 0.11L-Leucine --- --- 0.41 0.41L-Phenylalanine --- --- 0.13 0.13L-Tyrosine --- --- 0.11 0.11
Total 100 100 100 100continued
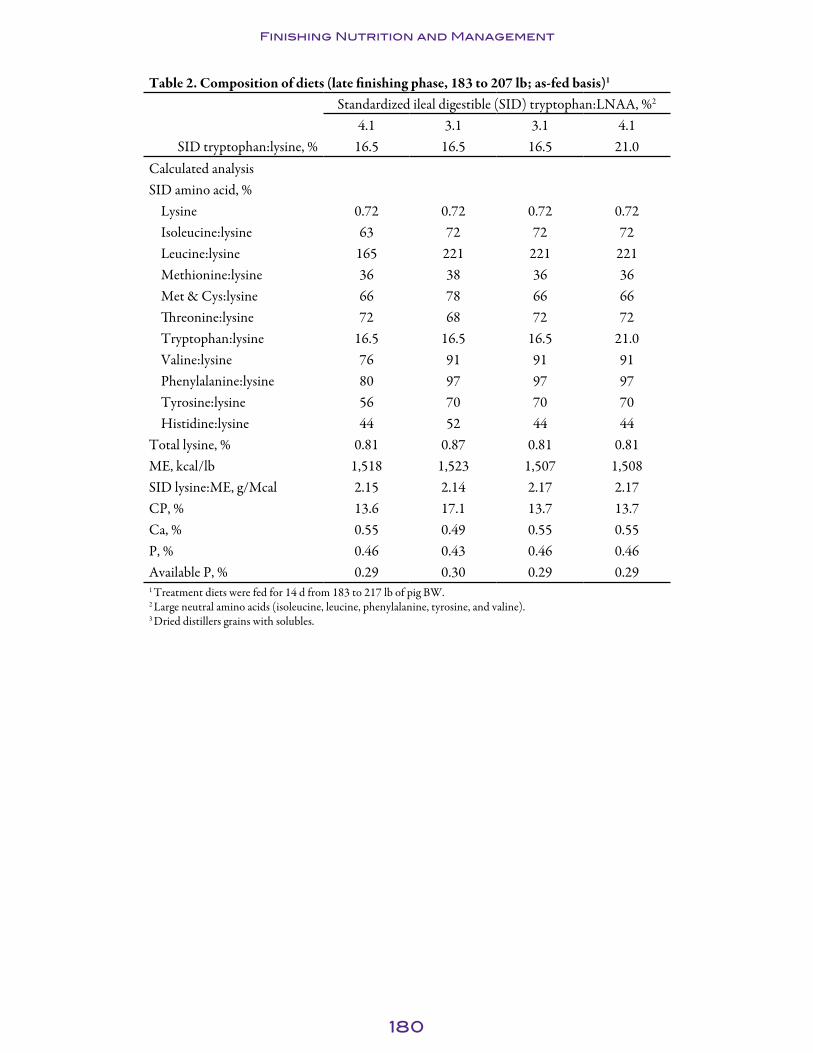
180
Finishing Nutrition and Management
Table 2. Composition of diets (late finishing phase, 183 to 207 lb; as-fed basis)1
Standardized ileal digestible (SID) tryptophan:LNAA, %2
4.1 3.1 3.1 4.1SID tryptophan:lysine, % 16.5 16.5 16.5 21.0
Calculated analysisSID amino acid, %
Lysine 0.72 0.72 0.72 0.72 Isoleucine:lysine 63 72 72 72Leucine:lysine 165 221 221 221Methionine:lysine 36 38 36 36Met & Cys:lysine 66 78 66 66Threonine:lysine 72 68 72 72Tryptophan:lysine 16.5 16.5 16.5 21.0Valine:lysine 76 91 91 91Phenylalanine:lysine 80 97 97 97Tyrosine:lysine 56 70 70 70Histidine:lysine 44 52 44 44
Total lysine, % 0.81 0.87 0.81 0.81 ME, kcal/lb 1,518 1,523 1,507 1,508SID lysine:ME, g/Mcal 2.15 2.14 2.17 2.17CP, % 13.6 17.1 13.7 13.7Ca, % 0.55 0.49 0.55 0.55P, % 0.46 0.43 0.46 0.46Available P, % 0.29 0.30 0.29 0.291 Treatment diets were fed for 14 d from 183 to 217 lb of pig BW.2 Large neutral amino acids (isoleucine, leucine, phenylalanine, tyrosine, and valine).3 Dried distillers grains with solubles.

181
Finishing Nutrition and Management
Table 3. Effect of tryptophan (trp) to large neutral amino acid (LNAA) ratio on the growth performance of early finishing pigs (77 to 106 lb BW)1
Treatments2 Corn-SBM 45% DDGSCorn-SBM
+LNAACorn-SBM
+LNAA+trp
SID3 trp:LNAA, % 3.8 3.0 3.0 3.8SID trp:lysine, % 16.5 16.5 16.5 21.0 SEM Probability, P <
d 0 to 14ADG, lb 2.16 1.89 2.12 2.09 0.08 0.11ADFI, lb 4.70 4.65 4.54 4.64 0.17 0.93F/G 2.18a 2.48b 2.15a 2.22a 0.07 0.01
Pig wt, lbd 0 77.2 77.3 77.6 77.5 3.03 1.00d 14 107.5 103.8 107.3 106.7 3.88 0.90
a,b Within a row, means without a common superscripts differ at P < 0.05.1 A total of 96 pigs (PIC TR4 × 1050, initially 77.4 lb) were used in a 14-d growing-finishing trial with 4 pigs per pen and 6 pens per treatment. Treatment diets were fed from 77.4 to 106 lb BW.2 Treatments included (1) a corn-soybean meal-based diet without DDGS, (2) a corn soybean-meal-based diet with 45% DDGS, (3) a corn-soybean meal-based diet without DDGS but supplemented with amounts of LNAA similar to a diet containing 45% DDGS, and (4) the LNAA-supplemented diet with added crystalline tryptophan to increase the SID tryptophan:LNAA ratio.3 Standardized ileal digestible.
Table 4. Effect of tryptophan to large neutral amino acid (LNAA) ratio on the growth performance of late finish-ing pigs (183 to 217 lb BW)1
Treatments2 Corn-SBM 30 % DDGSCorn-SBM
+LNAACorn-SBM
+LNAA+trpSID3 trp:LNAA, % 4.1 3.1 3.1 4.1
SID trp:lys, % 16.5 16.5 16.5 21.0 SEM Probability, P < d 0 to 14
ADG, lb 2.37 2.35 2.49 2.60 0.14 0.56ADFI, lb 6.86 6.59 6.86 6.98 0.20 0.58F/G 2.93 2.83 2.79 2.70 0.10 0.43
Pig weight, lbd 0 182.7 183.0 182.7 182.6 5.17 1.00d 14 215.8 215.9 217.5 219.0 5.41 0.97
1 A total of 96 pigs (PIC TR4 × 1050, initially 77.4 lb) were used in a 14-d growing-finishing trial with 4 pigs per pen and 6 pens per treatment. Treatment diets were fed from 183 to 217 lb BW.2 Treatments included (1) a corn-soybean meal-based diet without DDGS, (2) a corn soybean-meal-based diet with 30% DDGS, (3) a corn-soybean meal-based diet without DDGS but supplemented with amounts of LNAA similar to a diet containing 45% DDGS, and (4) the LNAA-supplemented diet with added crystalline tryptophan to increase the SID tryptophan:LNAA ratio.3 Standardized ileal digestible.

182
Finishing Nutrition and Management
The Effects of Sorghum Dried Distillers Grains with Solubles on Finishing Pig Growth Performance, Carcass Characteristics, and Fat Quality1
K.M. Sotak, T.A. Houser, R.D. Goodband, M.D. Tokach, S.S. Dritz2, J.M. DeRouchey, J.L. Nelssen, B. Goehring, and G.R. Skaar
SummaryA total of 288 finishing pigs (PIC TR4 × 1050, initially 129.6 lb) were used in a 73-d study to determine the effects of increasing sorghum dried distillers grains with solu-bles (DDGS) in sorghum- or corn-based diets on finishing pig growth performance, carcass characteristics, and fat quality. Pigs were allotted to 1 of 6 dietary treatments in a completely randomized design based on initial pen weight. The dietary treatments included sorghum-based diets with sorghum DDGS included at 0, 15, 30, or 45%; a sorghum-based diet with 30% corn DDGS; and a corn-based diet with 30% corn DDGS. Overall (d 0 to 73), increasing sorghum DDGS from 0 to 45% reduced (linear, P < 0.04) ADG and ADFI. Increasing sorghum DDGS increased (linear, P < 0.01) backfat iodine value (IV), and fat color became less red (a*; linear, P < 0.01) and tended to be less yellow (b*; linear, P < 0.06). No differences were observed in growth perfor-mance among pigs fed corn- or sorghum-based diets with 30% corn DDGS along with similar carcass characteristics, backfat, loin depth, fat-free lean index (FFLI), HCW, carcass yield, and backfat IV. Pigs fed sorghum-based diets with either 30% sorghum or corn DDGS had similar ADG, ADFI, and F/G, as well as similar carcass character-istics; however, pigs fed 30% sorghum DDGS had decreased (P < 0.01) backfat IV and fat color that was more white (L*) and less yellow (b*) in color than pigs fed 30% corn DDGS.
We observed similar ADG, ADFI, and F/G, as well as carcass characteristics, for pigs fed corn- or sorghum-based diets with 30% DDGS. Backfat IV was greater in pigs fed increasing DDGS, with a notable increase in pigs fed corn DDGS compared with those fed sorghum DDGS. Feeding sorghum DDGS produces pork fat that is lighter in color and less yellow than those fed corn DDGS, which may have an important role in pork export markets.
Key words: corn, DDGS, finishing pig, sorghum
IntroductionIn the Great Plains region of the United States, sorghum is grown due to its ability to survive in drought conditions. Due to the large production of sorghum in the area and
1 The authors thank the United Sorghum Checkoff Program for partial financial support.2 Department of Diagnostic Medicine/Pathobiology, College of Veterinary Medicine, Kansas State University.

183
Finishing Nutrition and Management
its use in ethanol production, sorghum DDGS are more available to swine producers than corn DDGS.
Sorghum has a feeding value of 96 to 100% that of the value of corn, and produces similar pig growth performance when used to completely replace corn when formulated in swine diets; however, although a large database of information is available on the nutritional value of sorghum, little is known about sorghum DDGS. Therefore, more research needs to be conducted to determine the feeding value of sorghum DDGS. The objective of this study was to compare corn- vs. sorghum-based diets and determine the effects of increasing sorghum-DDGS on finishing pig growth performance, carcass characteristics, and fat quality.
ProceduresThe protocol for this study was approved by the Kansas State University Institutional Animal Care and Use Committee. The study was conducted at the K-State Swine Teaching and Research Center, Manhattan, KS.
The sorghum, corn, sorghum DDGS, and corn DDGS and were analyzed for their amino acid profile at the University of Missouri-Columbia Agricultural Experiment Station Chemical Laboratories (Columbia, MO). Standardized ileal digestibility values for the sorghum DDGS were derived from Urriola et al. (20093). These values were then used in diet formulation (Table 1). Fatty acid analyses were conducted on the corn, sorghum, corn DDGS, and sorghum DDGS utilized in the study at the Kansas State University Analytical Lab (Manhattan, KS; Table 2). Bulk densities (lb per bushel) were also measured among the treatment diets (Table 3).
A total of 288 finishing pigs (PIC TR4 × 1050, initially 129.6 lb) were used in a 73-d study to determine the effects of increasing sorghum DDGS in corn- or sorghum-based diets on pig growth performance, carcass characteristics, and fat characteristics. Pigs were allotted to 1 of 6 dietary treatments. These dietary treatments included: sorghum-based diets with sorghum DDGS included at 0, 15, 30, or 45%; a sorghum-based diet with 30% corn DDGS; and a corn-based diet with 30% corn DDGS (Tables 4, 5, and 6). There were 8 pigs per pen and 6 replications per treatment. Each pen provided 8 ft2/pig and had totally slatted floors, one 5-hole self-feeder, and a cup waterer. Throughout the trial, the pigs had ad libitum access to feed and water. All treatment diets were in meal form and fed in 3 phases (d 0 to 28, d 28 to 56, and d 56 to 73). Pigs and feeders were weighed on d 0, d 28, d 56, and d 73 to determine ADG, ADFI, and F/G.
At the end of the study, the heaviest barrow and gilt were selected from every pen and taken to the K-State Meats Laboratory. Standard carcass characteristics were measured, as well as loin eye color, marbling and firmness, and fat color score. Fat samples from the 10th rib were taken and analyzed for fatty acid profile and IV. The remaining pigs were taken to Triumph Foods LLC (St. Joseph, MO) for standard carcass data collection and jowl IV value.
3 Urriola, P. E., D. Hoehler, C. Pederson, H. H. Stein, and G. C. Shurson. 2009. Amino acid digestibility of distillers dried grains with solubles produced from a sorghum- a sorghum-corn blend, and corn fed to pigs. J. Anim. Sci. 87:2574-2580.

184
Finishing Nutrition and Management
Data were analyzed in a completely randomized design with pen as the experimental unit. Analysis of variance was used with the MIXED procedure of SAS (SAS Institute, Inc., Cary, NC). Single degrees of freedom contrasts were used to make comparisons between: (1) the sorghum- and corn-based diet with 30% corn DDGS, (2) the sorghum diet with 30% sorghum DDGS vs. the corn-based diet with 30% corn DDGS, and (3) linear and quadratic effects of increasing sorghum DDGS (0, 15, 30, and 45%). Results were considered significant at P ≤ 0.05 and considered a trend at P ≤ 0.10.
Results and DiscussionChemical Analyses. As expected, the corn and corn DDGS contained greater concen-trations of linoleic acid (C18:2n-6) as well as lower monounsaturated fatty acids (MUFA) and polyunsaturated fatty acids (PUFA) concentrations (Table 2). Sorghum and sorghum DDGS had greater concentrations of SFA and total trans fatty acids than the corn and corn DDGS. Therefore, this resulted in the corn and corn DDGS having greater IV than the sorghum and sorghum DDGS, respectively. As the amount of DDGS increased, bulk density of the diet decreased (Table 3).
Growth Performance. Overall (d 0 to 73), increasing DDGS (0, 15, 30, or 45%) decreased (linear, P < 0.04) ADG, ADFI, and final weight with no change in F/G (Table 7). Growth performance between pigs fed the corn- and sorghum-based diets with 30% corn DDGS was similar, as was the performance of pigs fed the sorghum-based diets with either sorghum or corn DDGS.
For carcass data of pigs taken to the Triumph packing plant, jowl IV increased (linear, P < 0.01) with increasing sorghum DDGS. Increasing sorghum DDGS decreased (linear (P < 0.01) backfat depth but had no effect on loin depth, resulting in increased (linear (P < 0.01) fat-free lean index (FFLI). Hot carcass weight decreased with increas-ing sorghum DDGS (linear (P < 0.04), but carcass yield was similar among treatments. Jowl IV tended (P < 0.10) to be greater in pigs fed the corn-based diet with 30% corn DDGS than those fed the sorghum-based diet with 30% corn DDGS. No other carcass characteristics were different among the sorghum or corn diets with corn DDGS. Pigs fed sorghum-based diets with 30% sorghum DDGS had decreased (P < 0.04) jowl IV than pigs fed the sorghum-based diets with 30% corn DDGS or pigs fed the corn-based diet with 30% corn DDGS.
For carcass data of pigs slaughtered at the K-State Meat Laboratory, increasing sorghum DDGS had no effect on HCW, carcass yield, purge loss, or drip loss; however, pH tended (P < 0.06) to increase with increasing DDGS (Table 8). Increasing sorghum DDGS had no effect on backfat thickness, 10th rib loin eye area, color, firmness, or marbling. Increasing sorghum DDGS decreased 10th rib loin redness (a*; linear, P < 0.03) and also tended to decrease the degree of yellowness (b*; linear, P < 0.06). For backfat samples collected at the 10th rib, the degree of redness (a*) decreased (linear, P < 0.01) and yellowness (b*) tended to decrease (linear, P < 0.06) as sorghum DDGS increased. Pigs fed the corn-based diet with 30% corn DDGS had a decreased degree of yellowness (b*; P < 0.03) compared with pigs fed the sorghum-based diet with 30% sorghum DDGS.

185
Finishing Nutrition and Management
Carcass characteristics were not different among pigs fed sorghum- or corn-based diets with 30% corn DDGS or for pigs fed sorghum-based diets with either corn or sorghum DDGS. Pigs fed the sorghum diet with 30% corn DDGS tended to have loins that were firmer and had more marbling (P < 0.08) than those fed the corn diet with 30% corn DDGS.
Pigs fed sorghum with 30% sorghum DDGS had fat color that was more white (L*) and less yellow (b*) in color than pigs fed sorghum with 30% corn DDGS (P < 0.03; Table 8). Because a growing percentage of U.S. pork is exported to other international markets, sorghum DDGS may have an important role in the future of swine diets due to its ability to produce pork fat that is lighter in color and less yellow.
Carcass Fatty Acid Composition. Increasing sorghum DDGS reduced (linear, P < 0.01) palmitic (C16:0), stearic (C18:0), and oleic (C18:1 cis-9) fatty acids. On the other hand, linoleic (C18:2n-6) and linolenic (C18:3n-3) concentrations increased (linear, P < 0.01). As a result, SFA and MUFA decreased (linear, P < 0.01) and PUFA and backfat IV increased (linear, P < 0.01) as sorghum DDGS increased in the diet.
For backfat, pigs fed the corn-based diet with 30% corn DDGS had greater concentra-tions (P < 0.05) of C18:1 cis-9 and MUFA than pigs fed the sorghum-based diet with 30% corn DDGS (Table 9). Pigs fed the corn-based diet with 30% corn DDGS had decreased concentrations (P < 0.03) of C14:0, C16:0, C18:3n-3, and total trans fatty acids than pigs fed the sorghum-based diet with 30% sorghum DDGS. Pigs fed diets with corn DDGS had greater concentrations (P < 0.01) of C18:1 cis-9, C18:1n-7, and MUFA, whereas pigs fed diets with sorghum DDGS had greater concentrations (P < 0.01) of C18:2n-6, C20:2, and PUFA than pigs fed diets with corn DDGS.
Overall, pigs fed DDGS had greater (P < 0.01) IV than those fed the sorghum basal diet, with pigs fed corn DDGS having greater IV than those fed sorghum DDGS. Although the corn DDGS contained greater concentrations of UFA, the sorghum DDGS had greater concentrations of SFA. The results found in this study agree with previous research conducted on the effect of DDGS on carcass fat composition (Benz et al., 20114).
In conclusion, we observed similar ADG, ADFI, and F/G, as well as carcass characteris-tics, for pigs fed corn- or sorghum-based diets with 30% DDGS. Backfat IV was greater in pigs fed increasing DDGS, with a notable increase in pigs fed corn DDGS compared with those fed sorghum DDGS. Feeding sorghum DDGS produces pork fat that is lighter in color and less yellow than those fed corn DDGS, which may have be impor-tant in pork export markets.
4 Benz, J. M., M. D. Tokach, S. S. Dritz, J. L. Nelssen, J. M DeRouchey, R. C. Sulabo, and R. D. Good-band. 2011. Effects of dietary iodine value product on growth performance and carcass fat quality of finishing pigs. J. Anim. Sci. 89:1419-1428.

186
Finishing Nutrition and Management
Table 1: Analyzed nutrient composition of ingredients (as-fed basis)1
Item Sorghum CornSorghum DDGS2
Corn DDGS
DM, % 86.12 86.22 89.64 89.00CP, % 8.24 7.39 29.04 25.70Crude fat, % 2.07 2.36 7.17 8.71Crude fiber, % 1.74 1.72 5.28 5.62Ash, % 1.29 1.31 4.24 4.23
Amino acids, %Cysteine 0.13 0.14 0.44 0.43Isoleucine 0.28 0.22 1.04 0.88Leucine 0.95 0.76 2.94 2.65Lysine 0.21 0.22 0.73 0.86Methionine 0.12 0.13 0.39 0.47Threonine 0.24 0.22 0.85 0.87Tryptophan 0.06 0.05 0.15 0.18Valine 0.37 0.32 1.34 1.21
1 Values represent the mean of 1 composite sample. Diets were prepared using the analyzed values.2 Dried distillers grains with solubles.

187
Finishing Nutrition and Management
Table 2. Fatty acid analysis of dietary ingredients
Item Corn SorghumCorn
DDGS1Sorghum DDGS
Myristic acid (C14:0), % 0.11 0.07 0.08 0.09Palmitic acid (C16:0), % 16.30 14.35 15.02 16.82Palmitoleic acid (C16:1), % 0.63 0.01 0.34 0.57Margaric acid (C17:0), % 0.16 0.16 0.13 0.13Stearic acid (C18:0), % 1.71 2.25 2.13 1.84Oleic acid (C18:1 cis-9), % 26.36 22.42 26.25 27.57Vaccenic acid (C18:1n-7), % 2.10 1.06 1.44 1.99Linoleic acid (C18:2n-6), % 55.77 47.33 50.86 46.70α-Linolenic acid (C18:3n-3), % 2.55 1.52 1.91 2.41Arachidic acid (C20:0), % 0.25 0.63 0.41 0.27Gadoleic acid (C20:1), % 0.29 0.23 0.26 0.27Eicosadienoic acid (C20:2), % 0.10 0.10 0.09 0.09Arachidonic acid (C20:4n-6), % 0.12 0.06 0.06 0.08Other fatty acids, % 1.98 1.36 1.03 1.17Total SFA, %2 17.94 19.08 18.32 19.69Total MUFA, %3 23.81 29.48 28.34 30.48Total PUFA, %4 57.49 50.19 52.95 49.33Total trans fatty acids, % 5 1.52 2.55 1.98 2.53UFA:SFA ratio6 4.85 4.18 4.44 4.05PUFA:SFA ratio7 3.20 2.63 2.89 2.51Iodine value, g/100g8 121 114 118 1141 Dried distillers grains with solubles. 2 Total SFA = ([C8:0] + [C10:0] + [C12:0] + [C14:0] + [C16:0] + [C17:0] + [C18:0] + [C20:0] + [C22:0] + [C24:0]); brackets indicate concentration.3 Total MUFA = ([C14:1] + [C16:1] + [C18:1 cis-9] + [C18:1n-7] + [C20:1] + [C24:1]); brackets indicate concentration.4 Total PUFA = ([C18:2n-6] + [C18:3n-3] + [C18:3n-6] + [C20:2] + [C20:4n-6]); brackets indicate concentra-tion.5 Total trans fatty acids = ([C18:1 trans] + [C18:2 trans] + [C18:3 trans]); brackets indicate concentration.6 UFA: SFA = (total MUFA + total PUFA)/total SFA.7 PUFA: SFA = total PUFA/total SFA.8 Calculated as IV value (IV) = [C16:1] × 0.95 + [C18:1] × 0.86 + [C18:2] × 1.732 + [C18:3] × 2.616 + [C20:1] × 0.785 + [C22:1] × 0.723; brackets indicate concentration.

188
Finishing Nutrition and Management
Table 3. Bulk densities of experimental diets (as-fed basis) 1
Grain sourceSorghum Sorghum Sorghum Sorghum Sorghum Corn
DDGS2 source and level, %
ItemNone
0Sorghum
15Sorghum
30Sorghum
45Corn
30Corn
30Bulk density, lb/bushel3
Phase 1 51.1 46.3 45.4 43.1 46.2 44.8Phase 2 50.8 49.0 48.1 45.5 47.1 46.5Phase 3 52.0 49.5 48.3 46.1 47.2 46.3
1 Bulk densities represent the mass per unit volume. Diet samples were taken from the tops of feeders during each phase.2 Dried distillers grains with solubles. 3 Phase 1 was d 0 to 28; Phase 2 was d 28 to 56; Phase 3 was d 56 to 73.

189
Finishing Nutrition and Management
Table 4. Phase 1 diet composition (as-fed basis)1
Grain sourceSorghum Sorghum Sorghum Sorghum Sorghum Corn
DDGS2 source and level, %
ItemNone
0%Sorghum
15%Sorghum
30%Sorghum
45%Corn 30%
Corn 30%
Ingredient, %Sorghum 76.20 63.10 50.20 36.90 51.05 17.25Soybean meal (46.5% CP) 20.85 19.25 17.45 15.85 16.50 17.25Corn --- --- --- --- --- 50.30Sorghum DDGS --- 15.00 30.00 45.00 ---Corn DDGS --- --- --- --- 30.00 30.00Monocalcium P (21% P) 0.90 0.55 0.20 --- 0.25 0.30Limestone 0.90 1.03 1.15 1.30 1.20 1.20Salt 0.35 0.35 0.35 0.35 0.35 0.35Vitamin premix 0.15 0.15 0.15 0.15 0.15 0.15Trace mineral premix 0.15 0.15 0.15 0.15 0.15 0.15L-Lysine HCl 0.31 0.31 0.31 --- 0.31 0.29DL-Methionine 0.12 0.08 0.04 --- 0.01 ---L-Threonine 0.08 0.04 0.01 --- 0.02 0.02
Total 100 100 100 100 100 100
Calculated analysisStandardized ileal digestible amino acids, %
Lysine 0.94 0.94 0.94 0.94 0.94 0.94Isoleucine:lysine 62 68 73 79 68 67Methionine:lysine 35 33 31 29 29 30Met & Cys:lysine 58 58 58 58 58 59Threonine:lysine 60 60 60 64 60 60Tryptophan:lysine 17 17 17 17 17 17Valine:lysine 70 78 86 94 81 80
Total lysine, % 1.03 1.06 1.09 1.12 1.11 1.11CP, % 17.1 19.3 21.4 23.5 20.8 20.7ME kcal/lb 1,484 1,457 1,430 1,400 1,488 1,505Ca, % 0.60 0.59 0.58 0.60 0.58 0.59P, % 0.55 0.54 0.53 0.55 0.53 0.54Available P, % 0.27 0.27 0.27 0.31 0.27 0.271 Diets were fed in meal form from d 0 to 28 of the experiment.2 Dried distillers grains with solubles.

190
Finishing Nutrition and Management
Table 5. Phase 2 diet composition (as-fed basis)1
Grain sourceSorghum Sorghum Sorghum Sorghum Sorghum Corn
DDGS2 source and level, %
ItemNone
0%Sorghum
15%Sorghum
30%Sorghum
45%Corn 30%
Corn 30%
Ingredient, %Sorghum 79.85 66.80 53.75 40.45 54.80 ---Soybean meal (46.5% CP) 17.30 15.70 14.05 12.30 12.95 13.85Corn --- --- --- --- --- 53.90Sorghum DDGS --- 15.00 30.00 45.00 --- ---Corn DDGS --- --- --- --- 30.00 30.00Monocalcium P (21% P) 0.85 0.48 0.10 --- 0.15 0.20Limestone 0.90 1.03 1.15 1.30 1.18 1.15Salt 0.35 0.35 0.35 0.35 0.35 0.35Vitamin premix 0.15 0.15 0.15 0.15 0.15 0.15Trace mineral premix 0.15 0.15 0.15 0.15 0.15 0.15L-Lysine HCl 0.29 0.28 0.28 0.28 0.28 0.26DL-Methionine 0.09 0.05 0.01 --- --- ---L-Threonine 0.07 0.03 --- --- --- ---
Total 100 100 100 100 100 100
Calculated analysisStandardized ileal digestible amino acids, %
Lysine 0.83 0.83 0.83 0.83 0.83 0.83Isoleucine:lysine 64 70 76 82 70 68Methionine:lysine 34 31 29 30 30 32Met & Cys:lysine 58 58 58 61 60 63Threonine:lysine 60 60 62 66 61 61Tryptophan:lysine 17 17 17 17 17 17Valine:lysine 73 81 90 99 85 84
Total lysine, % 0.91 0.94 0.97 1.00 0.99 1.00CP, % 15.8 17.9 20.1 22.2 19.5 19.4ME kcal/lb 1,484 1,457 1,430 1,399 1,489 1,508Ca, % 0.58 0.56 0.55 0.59 0.54 0.55P, % 0.53 0.51 0.50 0.54 0.49 0.50Available P, % 0.25 0.25 0.25 0.30 0.25 0.251 Diets were fed in meal form from d 28 to 56 of the experiment.2 Dried distillers grains with solubles.
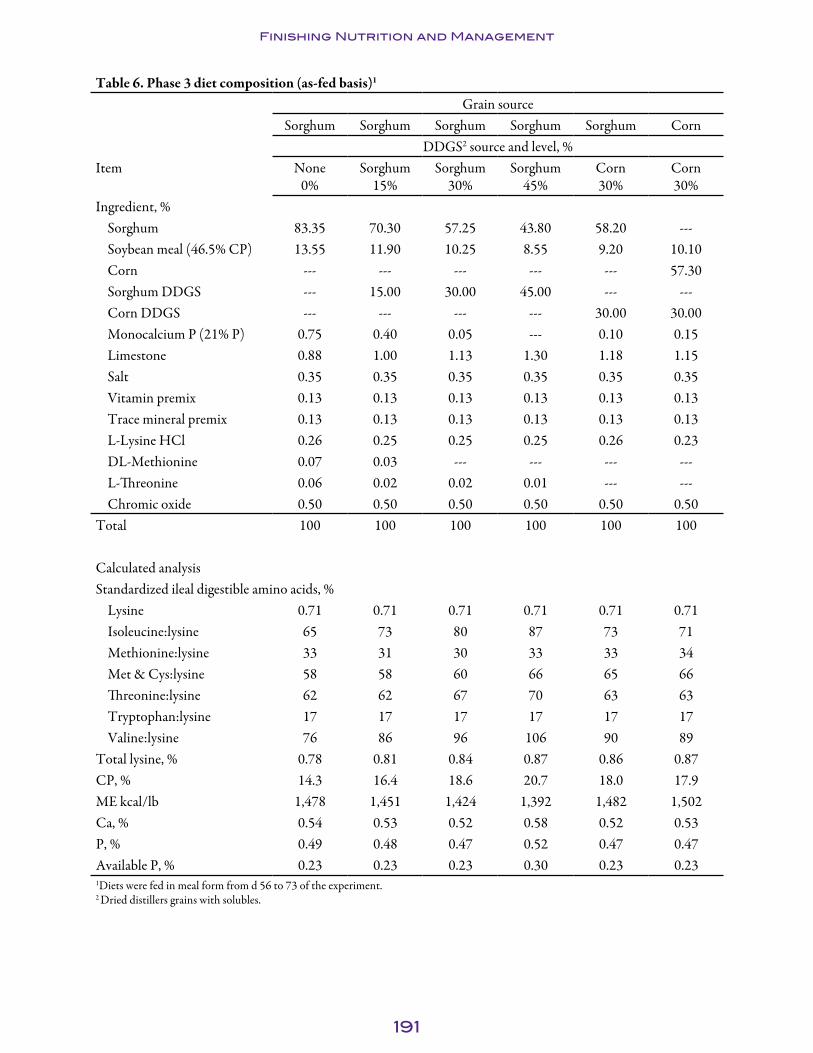
191
Finishing Nutrition and Management
Table 6. Phase 3 diet composition (as-fed basis)1
Grain sourceSorghum Sorghum Sorghum Sorghum Sorghum Corn
DDGS2 source and level, %Item None
0%Sorghum
15%Sorghum
30%Sorghum
45%Corn 30%
Corn 30%
Ingredient, %Sorghum 83.35 70.30 57.25 43.80 58.20 ---Soybean meal (46.5% CP) 13.55 11.90 10.25 8.55 9.20 10.10Corn --- --- --- --- --- 57.30Sorghum DDGS --- 15.00 30.00 45.00 --- ---Corn DDGS --- --- --- --- 30.00 30.00Monocalcium P (21% P) 0.75 0.40 0.05 --- 0.10 0.15Limestone 0.88 1.00 1.13 1.30 1.18 1.15Salt 0.35 0.35 0.35 0.35 0.35 0.35Vitamin premix 0.13 0.13 0.13 0.13 0.13 0.13Trace mineral premix 0.13 0.13 0.13 0.13 0.13 0.13L-Lysine HCl 0.26 0.25 0.25 0.25 0.26 0.23DL-Methionine 0.07 0.03 --- --- --- ---L-Threonine 0.06 0.02 0.02 0.01 --- ---Chromic oxide 0.50 0.50 0.50 0.50 0.50 0.50
Total 100 100 100 100 100 100
Calculated analysisStandardized ileal digestible amino acids, %
Lysine 0.71 0.71 0.71 0.71 0.71 0.71Isoleucine:lysine 65 73 80 87 73 71Methionine:lysine 33 31 30 33 33 34Met & Cys:lysine 58 58 60 66 65 66Threonine:lysine 62 62 67 70 63 63Tryptophan:lysine 17 17 17 17 17 17Valine:lysine 76 86 96 106 90 89
Total lysine, % 0.78 0.81 0.84 0.87 0.86 0.87CP, % 14.3 16.4 18.6 20.7 18.0 17.9ME kcal/lb 1,478 1,451 1,424 1,392 1,482 1,502Ca, % 0.54 0.53 0.52 0.58 0.52 0.53P, % 0.49 0.48 0.47 0.52 0.47 0.47Available P, % 0.23 0.23 0.23 0.30 0.23 0.231Diets were fed in meal form from d 56 to 73 of the experiment.2 Dried distillers grains with solubles.

192
Fin
ish
ing
Nu
tr
itio
n a
nd
Ma
na
ge
me
nt
Table 7. Effect of sorghum dried distillers grains with solubles (DDGS) on finishing pig growth performance and carcass characteristics1,2
TreatmentsA B C D E F
Grain source Probability, P <Sorghum Sorghum Sorghum Sorghum Sorghum Corn
SEDLinear
DDGS3Quadratic
DDGS3Corn vs.
sorghum4
Corn DDGS vs. sorghum DDGS5
30% Sorghum DDGS vs. 30% corn DDGS6
DDGS source and level, %
None 0%
Sorghum 15%
Sorghum 30%
Sorghum 45%
Corn 30%
Corn 30%
Initial wt, lb 129.4 129.4 129.8 129.6 129.4 129.7 3.38 0.94 0.96 0.94 0.91 0.98d 0 to 73
ADG, lb 2.31 2.25 2.19 2.18 2.26 2.25 0.05 0.01 0.53 0.88 0.19 0.88ADFI, lb 7.00 6.91 6.73 6.78 6.74 6.71 0.13 0.04 0.40 0.77 0.89 0.99F/G 3.04 3.07 3.07 3.11 2.99 2.98 0.06 0.25 0.96 0.89 0.15 0.93Final wt, lb 296.7 292.2 287.4 285.6 293.8 291.8 5.64 0.04 0.74 0.73 0.26 0.43
Carcass characteristics2
Jowl iodine value7 69.6 71.2 72.1 74.7 73.8 75.2 0.93 0.01 0.40 0.10 0.04 0.01Backfat, in.7 1.03 0.95 0.92 0.90 0.91 0.89 0.04 0.01 0.23 0.54 0.81 0.35Loin depth, in.7 2.34 2.32 2.28 2.28 2.34 2.35 0.09 0.44 0.84 0.90 0.39 0.29FFLI, %7,8 48.8 49.5 49.8 50.0 49.9 50.1 0.38 0.01 0.22 0.54 0.82 0.36HCW, lb 213.8 208.6 206.1 201.8 208.0 208.1 0.60 0.04 0.96 0.99 0.70 0.67Carcass yield, %9 71.40 71.41 71.74 71.79 71.45 71.43 0.60 0.43 0.96 0.97 0.81 0.77
1 A total of 288 pigs were used in the 73-d trial with 36 pens and 6 replications per diet.2 Values are the means of 6 pigs per pen and 6 pens per treatment collected at the Triumph Foods LLC packing plant, St. Joseph, MO.3 Contrasts compare only sorghum-based diets.4 Sorghum with 30% corn DDGS vs. corn with 30% corn DDGS (treatment E vs. treatment F). 5 Sorghum with 30% sorghum DDGS vs. sorghum with 30% corn DDGS (treatment C vs. treatment E).6 Sorghum with 30% sorghum DDGS vs. corn with 30% corn DDGS (treatment C vs. treatment F).7 Carcass characteristics adjusted using HCW as a covariate. 8 FFLI (fat-free lean index)=50.767+ (0.035 × HCW, lb) - (8.979 × BF, in.).9 Yield percentage was calculated by dividing HCW by live weight (before transport to the packing plant, Triumph Foods, LLC, St. Joseph, MO).
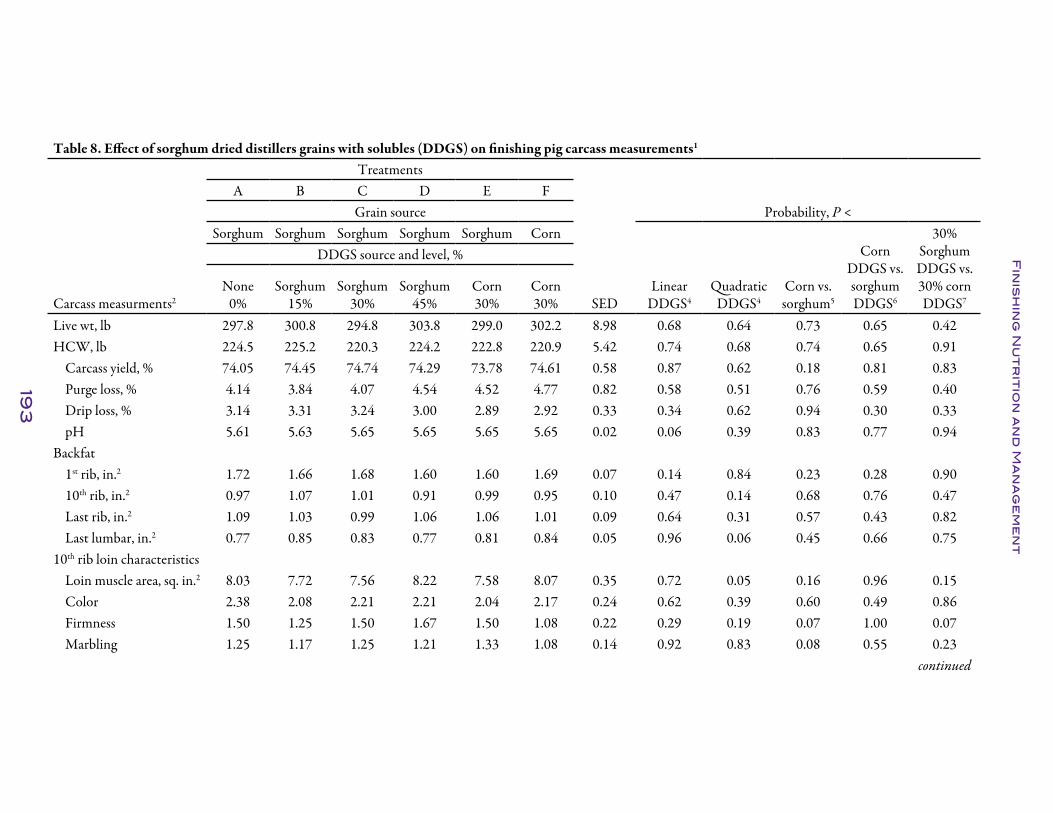
193
Fin
ish
ing
Nu
tr
itio
n a
nd
Ma
na
ge
me
nt
Table 8. Effect of sorghum dried distillers grains with solubles (DDGS) on finishing pig carcass measurements1
TreatmentsA B C D E F
Grain source Probability, P <Sorghum Sorghum Sorghum Sorghum Sorghum Corn
SEDLinear
DDGS4Quadratic
DDGS4Corn vs.
sorghum5
Corn DDGS vs. sorghum DDGS6
30% Sorghum DDGS vs. 30% corn DDGS7
DDGS source and level, %
Carcass measurments2None
0%Sorghum
15%Sorghum
30%Sorghum
45%Corn 30%
Corn 30%
Live wt, lb 297.8 300.8 294.8 303.8 299.0 302.2 8.98 0.68 0.64 0.73 0.65 0.42HCW, lb 224.5 225.2 220.3 224.2 222.8 220.9 5.42 0.74 0.68 0.74 0.65 0.91
Carcass yield, % 74.05 74.45 74.74 74.29 73.78 74.61 0.58 0.87 0.62 0.18 0.81 0.83Purge loss, % 4.14 3.84 4.07 4.54 4.52 4.77 0.82 0.58 0.51 0.76 0.59 0.40Drip loss, % 3.14 3.31 3.24 3.00 2.89 2.92 0.33 0.34 0.62 0.94 0.30 0.33pH 5.61 5.63 5.65 5.65 5.65 5.65 0.02 0.06 0.39 0.83 0.77 0.94
Backfat1st rib, in.2 1.72 1.66 1.68 1.60 1.60 1.69 0.07 0.14 0.84 0.23 0.28 0.9010th rib, in.2 0.97 1.07 1.01 0.91 0.99 0.95 0.10 0.47 0.14 0.68 0.76 0.47Last rib, in.2 1.09 1.03 0.99 1.06 1.06 1.01 0.09 0.64 0.31 0.57 0.43 0.82Last lumbar, in.2 0.77 0.85 0.83 0.77 0.81 0.84 0.05 0.96 0.06 0.45 0.66 0.75
10th rib loin characteristicsLoin muscle area, sq. in.2 8.03 7.72 7.56 8.22 7.58 8.07 0.35 0.72 0.05 0.16 0.96 0.15Color 2.38 2.08 2.21 2.21 2.04 2.17 0.24 0.62 0.39 0.60 0.49 0.86Firmness 1.50 1.25 1.50 1.67 1.50 1.08 0.22 0.29 0.19 0.07 1.00 0.07Marbling 1.25 1.17 1.25 1.21 1.33 1.08 0.14 0.92 0.83 0.08 0.55 0.23
continued

194
Fin
ish
ing
Nu
tr
itio
n a
nd
Ma
na
ge
me
nt
Table 8. Effect of sorghum dried distillers grains with solubles (DDGS) on finishing pig carcass measurements1
TreatmentsA B C D E F
Grain source Probability, P <Sorghum Sorghum Sorghum Sorghum Sorghum Corn
SEDLinear
DDGS4Quadratic
DDGS4Corn vs.
sorghum5
Corn DDGS vs. sorghum DDGS6
30% Sorghum DDGS vs. 30% corn DDGS7
DDGS source and level, %
Carcass measurments2None
0%Sorghum
15%Sorghum
30%Sorghum
45%Corn 30%
Corn 30%
Loin eye color3
L* 59.88 59.91 60.25 59.44 60.18 58.41 1.01 0.76 0.56 0.09 0.94 0.08a* 10.92 10.84 10.76 10.09 10.69 10.09 0.36 0.03 0.26 0.11 0.84 0.07b* 16.69 16.52 16.68 15.88 16.45 15.83 0.37 0.06 0.23 0.10 0.53 0.03
Fat color3
L* 84.79 85.40 85.66 85.42 83.93 84.90 0.70 0.34 0.40 0.18 0.02 0.29a* 3.33 3.40 2.97 2.39 3.24 2.67 0.31 0.01 0.15 0.08 0.40 0.34b* 11.14 11.05 10.90 10.60 11.55 10.63 0.29 0.06 0.61 0.01 0.03 0.36
1 Values represent the mean of 6 observations (1 barrow and 1gilt) per treatment.2 Carcass characteristics adjusted using HCW as a covariate.3 CIE L* on a scale of 0-100 (0=black; 100=white); CIE a* is the degree of redness; CIE b* is the degree of yellowness.4 Contrasts compare only sorghum-based diets.5 Sorghum with 30% corn DDGS vs. corn with 30% corn DDGS (treatment E vs. treatment F).6 Sorghum with 30% sorghum DDGS vs. sorghum with 30% corn DDGS (treatment C vs. treatment E).7 Sorghum with 30% sorghum DDGS vs. corn with 30% corn DDGS (treatment C vs. treatment F).

195
Fin
ish
ing
Nu
tr
itio
n a
nd
Ma
na
ge
me
nt
Table 9. Effect of sorghum dried distillers grains with solubles (DDGS) on backfat fatty acid analysis1
TreatmentsA B C D E F
Grain source Probability, P <Sorghum Sorghum Sorghum Sorghum Sorghum Corn
SEDLinear
DDGS2Quadratic
DDGS2Corn vs.
sorghum3
Corn DDGS vs. sorghum DDGS4
30% Sorghum DDGS vs. 30% corn DDGS5
DDGS source and level, %
None 0%
Sorghum 15%
Sorghum 30%
Sorghum 45%
Corn 30%
Corn 30%
Myristic acid (C14:0), % 1.45 1.41 1.37 1.31 1.34 1.28 0.04 0.01 0.81 0.12 0.45Palmitic acid (C16:0), % 25.17 24.83 23.87 22.77 23.22 22.90 0.42 0.01 0.22 0.45 0.14Palmitoleic acid (C16:1), % 2.33 2.26 1.96 1.93 1.87 1.84 0.11 0.01 0.83 0.76 0.43 0.27Margaric acid (C17:0), % 0.50 0.48 0.56 0.54 0.58 0.49 0.04 0.14 0.99 0.04 0.61 0.12Stearic acid (C18:0), % 13.51 13.11 12.68 11.67 12.21 12.08 0.50 0.01 0.40 0.80 0.35 0.24Oleic acid (C18:1 cis-9), % 40.68 39.91 38.30 37.53 36.19 37.42 0.53 0.01 1.00 0.03 0.01 0.10Vaccenic acid (C18:1n-7), % 3.37 3.23 3.00 3.00 2.73 2.76 0.09 0.01 0.28 0.67 0.01 0.01Linoleic acid (C18:2n-6), % 9.39 10.99 14.24 17.04 17.76 17.20 0.57 0.01 0.24 0.45 0.01 0.01α-Linolenic acid (C18:3n-3), % 0.56 0.60 0.74 0.84 0.71 0.64 0.73 0.01 0.21 0.10 0.53 0.03Arachidic acid (C20:0), % 0.27 0.28 0.26 0.24 0.25 0.26 0.04 0.07 0.23 0.76 0.76 1.00Gadoleic acid (C20:1), % 0.85 0.89 0.82 0.49 0.76 0.81 0.01 0.10 0.22 0.27 0.15 0.74Eicosadienoic acid (C20:2), % 0.53 0.61 0.73 0.82 0.85 0.88 0.04 0.01 0.81 0.55 0.01 0.01Arachidonic acid (C20:4n-6), % 0.10 0.11 0.12 0.13 0.11 0.10 0.01 0.01 0.50 0.34 0.46 0.09Other fatty acids, % 1.29 1.29 1.35 1.69 1.42 1.34 0.06 0.05 0.89 0.23 0.49 0.60Total SFA, %6 41.12 40.32 38.93 36.74 37.82 37.22 0.78 0.01 0.21 0.44 0.16 0.04Total MUFA, %7 47.31 46.39 44.17 43.34 41.63 42.91 0.63 0.01 0.92 0.05 0.01 0.05
continued

196
Fin
ish
ing
Nu
tr
itio
n a
nd
Ma
na
ge
me
nt
Table 9. Effect of sorghum dried distillers grains with solubles (DDGS) on backfat fatty acid analysis1
TreatmentsA B C D E F
Grain source Probability, P <Sorghum Sorghum Sorghum Sorghum Sorghum Corn
SEDLinear
DDGS2Quadratic
DDGS2Corn vs.
sorghum3
Corn DDGS vs. sorghum DDGS4
30% Sorghum DDGS vs. 30% corn DDGS5
DDGS source and level, %
None 0%
Sorghum 15%
Sorghum 30%
Sorghum 45%
Corn 30%
Corn 30%
Total PUFA, %8 10.55 12.24 15.74 18.77 19.38 18.77 0.80 0.01 0.20 0.45 0.01 0.01Total trans fatty acids, % 9 0.80 0.85 0.99 1.07 0.95 0.87 0.05 0.01 0.68 0.09 0.46 0.02UFA:SFA ratio10 1.41 1.45 1.54 1.69 1.61 1.66 0.05 0.01 0.18 0.46 0.15 0.03PUFA:SFA ratio11 0.26 0.30 0.40 0.51 0.51 0.50 0.03 0.01 0.16 0.73 0.01 0.01Iodine value, g/100g12 58.66 60.72 64.78 69.23 68.66 68.61 1.23 0.01 0.12 0.93 0.01 0.011 All values are on a DM basis.2 Contrasts compare only sorghum-based diets.3 Sorghum with 30% corn DDGS vs. corn with 30% corn DDGS (treatment E vs. treatment F).4 Sorghum with 30% sorghum DDGS vs. sorghum with 30% corn DDGS (treatment C vs. treatment E).5 Sorghum with 30% sorghum DDGS vs. corn with 30% corn DDGS (treatment C vs. treatment F).6 Total SFA = ([C8:0] + [C10:0] + [C12:0] + [C14:0] + [C16:0] + [C17:0] + [C18:0] + [C20:0] + [C22:0] + [C24:0]); brackets indicate concentration.7 Total MUFA = ([C14:1] + [C16:1] + [C18:1 cis-9] + [C18:1n-7] + [C20:1] + [C24:1]); brackets indicate concentration.8 Total PUFA = ([C18:2n-6] + [C18:3n-3] + [C18:3n-6] + [C20:2] + [C20:4n-6]); brackets indicate concentration.9 Total trans fatty acids = ([C18:1 trans] + [C18:2 trans] + [C18:3 trans]); brackets indicate concentration.10 UFA: SFA = (total MUFA + total PUFA)/total SFA.11 PUFA: SFA = total PUFA/total SFA.12 Calculated as IV value (IV) = [C16:1] × 0.95 + [C18:1] × 0.86 + [C18:2] × 1.732 + [C18:3] × 2.616 + [C20:1] × 0.785 + [C22:1] × 0.723; brackets indicate concentration.

197
Finishing Nutrition and Management
Effect of Regrinding Dried Distillers Grains with Solubles on Finishing Pig Growth Performance1
J. A. De Jong, S. S. Dritz2, M. D. Tokach, J. M. DeRouchey, J. L. Nelssen, and R. D. Goodband
SummaryA total of 1,235 barrows and gilts (PIC, 337 × 1050, initially 77.35 lb) were used in a 103-d study to determine the effects of regrinding dried distillers grains with solubles (DDGS) on finishing pig growth performance. Pigs were blocked by weight and randomly assigned to 1 of 2 treatments with 23 replications per treatment. Treatments included: (1) a corn-soybean meal diet with “normal” DDGS (DDGS average particle size of 780 µ), and (2) the same corn-soybean meal diet with reground DDGS (DDGS average particle size of 691 µ). Diets were fed in 4 phases (77 to 117, 117 to 163, 163 to 196, and 196 to 270 lb for Phases 1, 2, 3, and 4, respectively). Phase 1 and 2 diets contained 40% DDGS, and Phase 3 and 4 diets contained 20% DDGS. To achieve uniform lots of DDGS among treatments, semi-loads were split in half and left either as-received or reground. The DDGS was reground using a RMS 9X36 dual roller mill with corrugations set at 6-6 on top and 13-13 on the bottom.
Within each of the individual phases, there were no differences (P > 0.18) in ADG, ADFI, or F/G. Similarly for the overall experiment, no differences (P < 0.24) in growth performance were found. These data indicate that regrinding DDGS (95 µ reduction in particle size) was not a large enough difference to affect growth performance; however, more research is needed to evaluate a greater reduction in particle size than achieved in the present study.
Key words: DDGS, feed processing, particle size, finishing pig
IntroductionWith the increasing price of corn and the associated increased price of DDGS, swine producers are continually looking for ways to make finishing pigs more efficient. One method that has been proven to improve feed efficiency is finely grinding corn to decrease the particle size. For every 100 µ decrease in corn particle size, a 1.2% improve-ment in feed efficiency is expected. Many finishing pig diets currently include DDGS, which replaces a portion of the corn in the diet, but with the increase in DDGS use, little is known about how reducing DDGS particle size may influence growth in a commercial environment.
Therefore, the objective of this study was to determine the effects of regrinding DDGS on growth performance of finishing pigs from 77 to 270 lb.
1 Appreciation is expressed to New Horizon Farms for the use of pigs and facilities and to Richard Brob-jorg, Scott Heidebrink, and Marty Heintz for technical assistance.2 Department of Diagnostic Medicine/Pathobiology, College of Veterinary Medicine, Kansas State University.
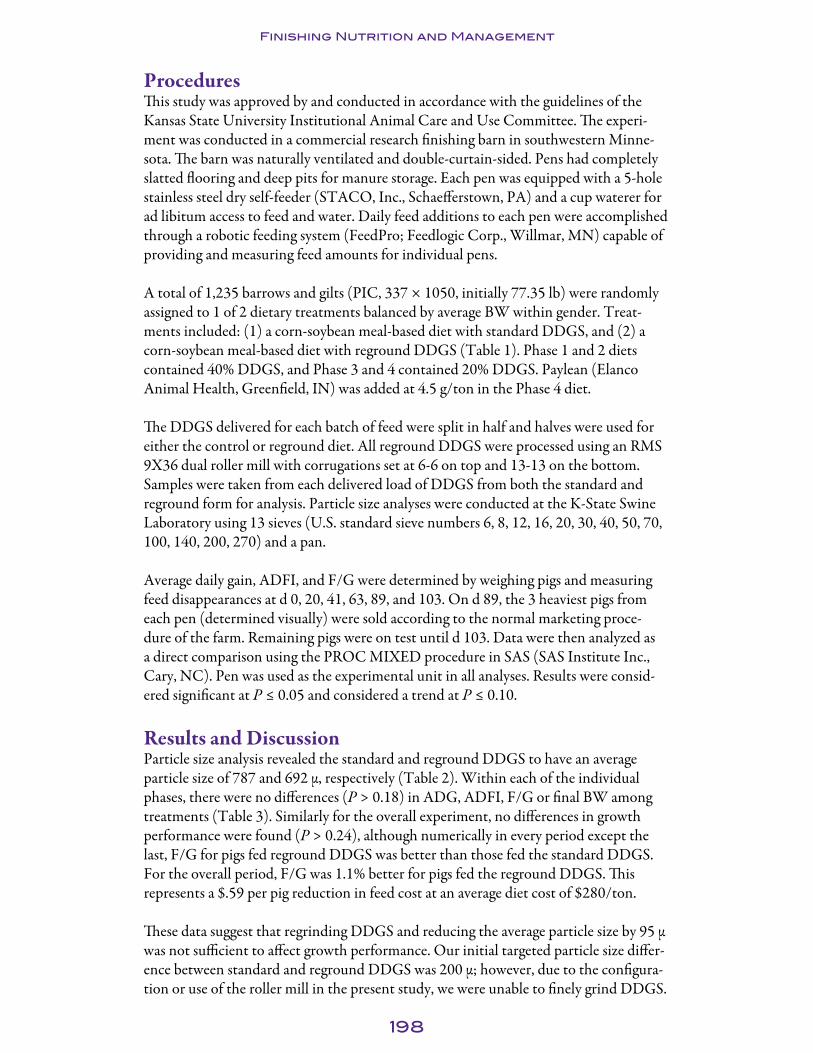
198
Finishing Nutrition and Management
ProceduresThis study was approved by and conducted in accordance with the guidelines of the Kansas State University Institutional Animal Care and Use Committee. The experi-ment was conducted in a commercial research finishing barn in southwestern Minne-sota. The barn was naturally ventilated and double-curtain-sided. Pens had completely slatted flooring and deep pits for manure storage. Each pen was equipped with a 5-hole stainless steel dry self-feeder (STACO, Inc., Schaefferstown, PA) and a cup waterer for ad libitum access to feed and water. Daily feed additions to each pen were accomplished through a robotic feeding system (FeedPro; Feedlogic Corp., Willmar, MN) capable of providing and measuring feed amounts for individual pens.
A total of 1,235 barrows and gilts (PIC, 337 × 1050, initially 77.35 lb) were randomly assigned to 1 of 2 dietary treatments balanced by average BW within gender. Treat-ments included: (1) a corn-soybean meal-based diet with standard DDGS, and (2) a corn-soybean meal-based diet with reground DDGS (Table 1). Phase 1 and 2 diets contained 40% DDGS, and Phase 3 and 4 contained 20% DDGS. Paylean (Elanco Animal Health, Greenfield, IN) was added at 4.5 g/ton in the Phase 4 diet.
The DDGS delivered for each batch of feed were split in half and halves were used for either the control or reground diet. All reground DDGS were processed using an RMS 9X36 dual roller mill with corrugations set at 6-6 on top and 13-13 on the bottom. Samples were taken from each delivered load of DDGS from both the standard and reground form for analysis. Particle size analyses were conducted at the K-State Swine Laboratory using 13 sieves (U.S. standard sieve numbers 6, 8, 12, 16, 20, 30, 40, 50, 70, 100, 140, 200, 270) and a pan.
Average daily gain, ADFI, and F/G were determined by weighing pigs and measuring feed disappearances at d 0, 20, 41, 63, 89, and 103. On d 89, the 3 heaviest pigs from each pen (determined visually) were sold according to the normal marketing proce-dure of the farm. Remaining pigs were on test until d 103. Data were then analyzed as a direct comparison using the PROC MIXED procedure in SAS (SAS Institute Inc., Cary, NC). Pen was used as the experimental unit in all analyses. Results were consid-ered significant at P ≤ 0.05 and considered a trend at P ≤ 0.10.
Results and DiscussionParticle size analysis revealed the standard and reground DDGS to have an average particle size of 787 and 692 μ, respectively (Table 2). Within each of the individual phases, there were no differences (P > 0.18) in ADG, ADFI, F/G or final BW among treatments (Table 3). Similarly for the overall experiment, no differences in growth performance were found (P > 0.24), although numerically in every period except the last, F/G for pigs fed reground DDGS was better than those fed the standard DDGS. For the overall period, F/G was 1.1% better for pigs fed the reground DDGS. This represents a $.59 per pig reduction in feed cost at an average diet cost of $280/ton.
These data suggest that regrinding DDGS and reducing the average particle size by 95 µ was not sufficient to affect growth performance. Our initial targeted particle size differ-ence between standard and reground DDGS was 200 μ; however, due to the configura-tion or use of the roller mill in the present study, we were unable to finely grind DDGS.
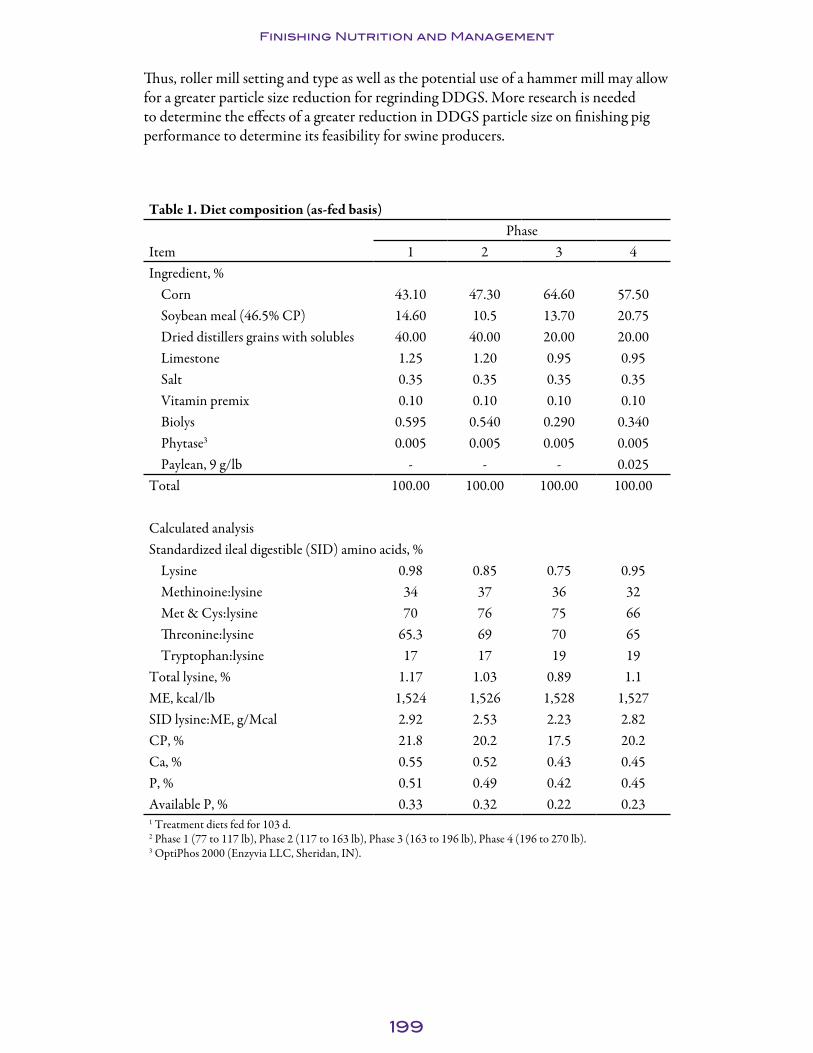
199
Finishing Nutrition and Management
Thus, roller mill setting and type as well as the potential use of a hammer mill may allow for a greater particle size reduction for regrinding DDGS. More research is needed to determine the effects of a greater reduction in DDGS particle size on finishing pig performance to determine its feasibility for swine producers.
Table 1. Diet composition (as-fed basis)Phase
Item 1 2 3 4Ingredient, %
Corn 43.10 47.30 64.60 57.50Soybean meal (46.5% CP) 14.60 10.5 13.70 20.75Dried distillers grains with solubles 40.00 40.00 20.00 20.00Limestone 1.25 1.20 0.95 0.95Salt 0.35 0.35 0.35 0.35Vitamin premix 0.10 0.10 0.10 0.10Biolys 0.595 0.540 0.290 0.340Phytase3 0.005 0.005 0.005 0.005Paylean, 9 g/lb - - - 0.025
Total 100.00 100.00 100.00 100.00
Calculated analysisStandardized ileal digestible (SID) amino acids, %
Lysine 0.98 0.85 0.75 0.95Methinoine:lysine 34 37 36 32Met & Cys:lysine 70 76 75 66Threonine:lysine 65.3 69 70 65Tryptophan:lysine 17 17 19 19
Total lysine, % 1.17 1.03 0.89 1.1ME, kcal/lb 1,524 1,526 1,528 1,527SID lysine:ME, g/Mcal 2.92 2.53 2.23 2.82CP, % 21.8 20.2 17.5 20.2Ca, % 0.55 0.52 0.43 0.45P, % 0.51 0.49 0.42 0.45Available P, % 0.33 0.32 0.22 0.231 Treatment diets fed for 103 d.2 Phase 1 (77 to 117 lb), Phase 2 (117 to 163 lb), Phase 3 (163 to 196 lb), Phase 4 (196 to 270 lb).3 OptiPhos 2000 (Enzyvia LLC, Sheridan, IN).

200
Finishing Nutrition and Management
Table 2. Dried distillers grains with solubles (DDGS) particle size analysis1
DDGSLoad Standard Reground Reduction
1 852 644 (208)2 820 732 (88)3 733 627 (106)4 772 725 (47)5 790 732 (58)6 716 672 (44)7 775 705 (70)8 837 697 (140)
Average 787 692 (95)1 The DDGS delivered for each batch of feed was split in half and each half was used for either the control or reground diet. Samples were taken from each delivered load of DDGS from both the standard and reground for analysis. Particle size analysis was conducted at the Kansas State University Swine Laboratory using 13 sieves (U.S. standard sieve numbers 6, 8, 12, 16, 20, 30, 40, 50, 70, 100, 140, 200, 270) and a pan.
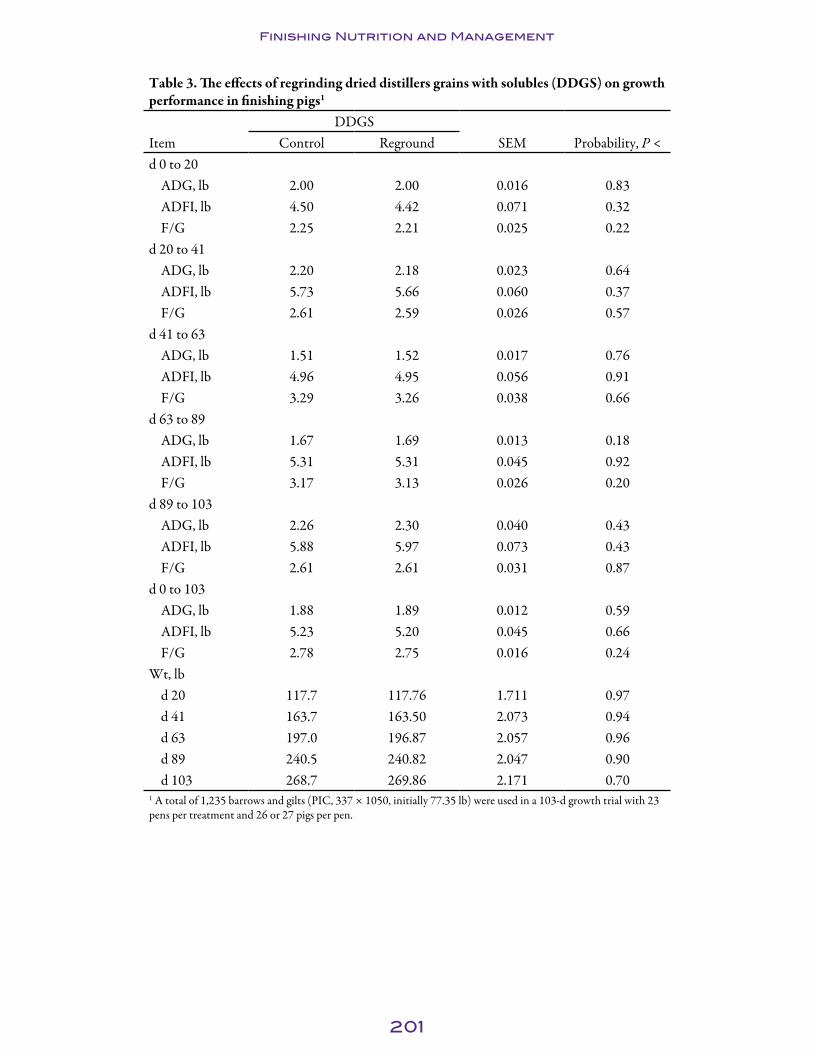
201
Finishing Nutrition and Management
Table 3. The effects of regrinding dried distillers grains with solubles (DDGS) on growth performance in finishing pigs1
DDGSItem Control Reground SEM Probability, P <d 0 to 20
ADG, lb 2.00 2.00 0.016 0.83ADFI, lb 4.50 4.42 0.071 0.32F/G 2.25 2.21 0.025 0.22
d 20 to 41ADG, lb 2.20 2.18 0.023 0.64ADFI, lb 5.73 5.66 0.060 0.37F/G 2.61 2.59 0.026 0.57
d 41 to 63ADG, lb 1.51 1.52 0.017 0.76ADFI, lb 4.96 4.95 0.056 0.91F/G 3.29 3.26 0.038 0.66
d 63 to 89ADG, lb 1.67 1.69 0.013 0.18ADFI, lb 5.31 5.31 0.045 0.92F/G 3.17 3.13 0.026 0.20
d 89 to 103ADG, lb 2.26 2.30 0.040 0.43ADFI, lb 5.88 5.97 0.073 0.43F/G 2.61 2.61 0.031 0.87
d 0 to 103ADG, lb 1.88 1.89 0.012 0.59ADFI, lb 5.23 5.20 0.045 0.66F/G 2.78 2.75 0.016 0.24
Wt, lbd 20 117.7 117.76 1.711 0.97d 41 163.7 163.50 2.073 0.94d 63 197.0 196.87 2.057 0.96d 89 240.5 240.82 2.047 0.90d 103 268.7 269.86 2.171 0.70
1 A total of 1,235 barrows and gilts (PIC, 337 × 1050, initially 77.35 lb) were used in a 103-d growth trial with 23 pens per treatment and 26 or 27 pigs per pen.

202
Finishing Nutrition and Management
Effects of Lowering Dietary NDF Levels Prior to Marketing on Finishing Pig Growth Performance, Carcass Characteristics, Carcass Fat Quality, and Intestinal Weights1
M. D. Asmus, J. M. DeRouchey, J. L. Nelssen, M. D. Tokach, S. S. Dritz2, R. D. Goodband, and T. A. Houser
SummaryA total of 264 pigs (PIC 327 × 1050, initially 90.1 lb) were used in a 90-d study to determine the effects of withdrawal of high dietary NDF (provided by wheat middlings [midds] and dried distillers grains with solubles [DDGS]) on growth performance, carcass characteristics, carcass fat quality, and intestinal weights of growing-finishing pigs. Pens of pigs were randomly allotted by initial weight and gender to 1 of 6 dietary treatments with 6 replications per treatment. There were 24 pens with 7 pigs per pen (3 barrows and 4 gilts) and 12 pens with 8 pigs per pen (4 barrows and 4 gilts). A posi-tive control diet containing no DDGS or midds and a negative control diet containing 30% DDGS and 19% midds was fed the entire study duration (no withdrawal). The other 4 treatments were arranged in a 2 × 2 factorial with the main effects of with-drawal time (23 or 47 d) and NDF level fed during the withdrawal (low or medium). Pigs on these treatments were fed the negative control diet containing 30% DDGS and 19% wheat midds (19% NDF) prior to their withdrawal treatment. The medium fiber withdrawal diet contained 15% DDGS and 9.5% midds (14.2% NDF). The low-fiber withdrawal diet was the positive control diet without DDGS or midds (9.3% NDF). Increasing the duration of the withdrawal lowered overall ADFI (linear, P < 0.03) and improved F/G (linear, P < 0.004); however, overall ADG was not affected. With-drawing the high-fiber diet for the last 23 d did not influence (P > 0.61) growth perfor-mance. Withdrawing the high-fiber diet improved carcass yield (P < 0.004) with a greater response (P < 0.001) when the low-NDF diet was fed during the withdrawal instead of the medium NDF diet; however, increasing the withdrawal time from 23 to 47 d did not further improve yield (P = 0.11).
Jowl fat iodine value (IV) decreased as withdrawal time increased (linear, P < 0.01) and was lower (P < 0.001) for pigs fed the low-NDF diet during the withdrawal period than pigs fed the medium-NDF diet during withdrawal, but increasing the withdrawal time from 23 to 47 d further reduced (P < 0.01) jowl IV. Increasing the duration that the control diet was fed by extending the withdrawal time increased (P < 0.01) backfat depth and tended (P < 0.11) to decrease percentage lean. The length of the withdrawal time had minor effects on several organ weights, but the large intestine was the most influenced with a response similar to the yield response. Withdrawing the high-fiber diet decreased full large-intestine weight (linear, P < 0.01) with a greater response
1 Appreciation is expressed to Triumph Foods LLC, St. Joseph, MO, for collecting jowl fat and conduct-ing the iodine value analysis and to Jerry Lehenbauer, David Donovan, Derek Petry, and Brad Knadler for technical assistance.2 Department of Diagnostic Medicine/Pathobiology, College of Veterinary Medicine, Kansas State University.

203
Finishing Nutrition and Management
(P < 0.04) when the low-NDF diet was fed during the withdrawal instead of the medium NDF diet; however, increasing the withdrawal time from 23 to 47 d did not further decrease (P = 0.20) large-intestine weights. Withdrawing pigs from a high-NDF diet containing DDGS and midds before market can improve F/G, carcass yield, and iodine value, and can reduce large intestine weight; however, the optimal length of withdrawal depends on the response criteria targeted.
Key words: DDGS, fiber, finishing pig, NDF, wheat middlings, withdrawal
IntroductionFeed ingredients such as wheat middlings (midds) and DDGS are often used as alterna-tives to corn and soybean meal in swine diets. Although these ingredients are used with the intent of lowering feed costs, they can negatively affect performance and carcass characteristics. Two areas of concern are the reduction in carcass yield with pigs fed high-fiber diets and the negative effect of DDGS on fat quality. Soft carcass fat with a high iodine value (IV) has consistently been observed in pigs fed high levels of DDGS. Reducing the level of DDGS in the diet prior to market has been successful in lower-ing IV and improving yield; however, more data are required to determine the length of time required and level of reduction needed to achieve desired endpoints for carcass weight and fat quality. More data are also required to determine the reasons why yield is reduced when feeding diets containing ingredients with high fiber content such as DDGS or midds.
Therefore, the objective of this trial was to determine the effects of decreasing or fully withdrawing NDF at different times prior to market on growth performance, carcass characteristics, and carcass fat quality of growing-finishing pigs.
ProceduresThe Kansas State University Institutional Animal Care and Use Committee approved the protocol used in this experiment. The study was conducted at the K-State Swine Teaching and Research Center in Manhattan, KS. The facility was a totally enclosed, environmentally regulated, mechanically ventilated barn containing 36 pens (8 × 10 ft). The pens had adjustable gates facing the alleyway that allowed for 10 ft2/pig. Each pen was equipped with a cup waterer and a single-sided, dry self-feeder (Farmweld, Teutopolis, IL) with 2 eating spaces located in the fence line. Pens were located over a completely slatted concrete floor with a 4-ft pit underneath for manure storage. The facility was also equipped with a computerized feeding system (FeedPro; Feedlogic Corp., Willmar, MN) that delivered and recorded diets as specified. The equipment provided pigs with ad libitum access to food and water.
A total of 264 pigs (PIC 327 × 1050, initially 90.1 lb) were used in a 90-d trial. Pens of pigs (4 barrows and 4 gilts per pen or 3 barrows and 4 gilts per pen) were randomly allotted by initial weight to 1 of 6 dietary treatments with 6 replications per treatment. Treatments were arranged in a 2 × 2 factorial design plus 2 additional treatments with the main effects of withdrawal time (23 or 47 d) and dietary fiber (14.2 or 9.3% NDF). The additional treatments were a positive control diet containing no DDGS or midds (9.3% NDF) and a negative control diet containing 30% DDGS and 19% midds with

204
Finishing Nutrition and Management
no withdrawal (19.0% NDF). Dietary treatments were corn-soybean meal-based and fed in 4 phases (Tables 1 and 2). All diets were fed in meal form.
Wheat middlings and DDGS samples were collected at the time of feed manufacture and a composite sample was analyzed (Table 3). Feed samples were also collected from each feeder during each phase and combined for a single composite sample by treatment for each phase to measure bulk density (Table 4). Bulk density of a material represents the mass per unit volume (pound per bushel).
Pigs and feeders were weighed approximately every 3 wk to calculate ADG, ADFI, and F/G. On d 90, all pigs were weighed individually, the second heaviest gilt in each pen (1 pig per pen, 6 pigs per treatment) was identified to be harvested at the K-State Meats Lab (KSU), and all others were then transported to Triumph Foods LLC, St. Joseph, MO. The pigs selected for harvest at K-State were blocked by treatment and randomly allotted to a harvest order to equalize the withdrawal time from feed before slaughter. Hot carcass weights were measured immediately after evisceration. Following evisceration, the entire pluck (heart, lungs, liver, kidneys, spleen, stomach, cecum, large intestine, small intestine, and reproductive tract) was weighed, then individual organs were weighed. After full organ weights were recorded, the large intestine, stomach, and cecum were physically stripped of contents and reweighed, then flushed with water, physically stripped of contents, and weighed again. For pigs harvested at the commercial packing plant, pigs were individually tattooed in sequential order by pen and gender to allow for carcass data collection at the packing plant and data retrieval by pen. Hot carcass weights were measured immediately after evisceration and each carcass was eval-uated for percentage yield, backfat, loin depth, and percentage lean. Because there were differences in HCW, it was used as a covariate for backfat, loin depth, and percentage lean. Also, jowl fat samples were collected and analyzed by Near Infrared Spectroscopy (NIR) at the plant for IV. Percentage yield was calculated by dividing HCW at the plant by live weight at the farm before transport to the plant.
Data were analyzed as a completely randomized design using the PROC MIXED procedure of SAS (SAS Institute, Inc., Cary, NC) with pen as the experimental unit. The main effects of the different withdrawal regimens of NDF level and withdrawal time were tested. Linear and quadratic contrasts were used to determine the effects of withdrawal time and NDF levels. These contrast coefficients were adjusted for unequally spaced withdrawal times. Differences between treatments were determined by using least squares means. Results were considered significant at P ≤ 0.05 and considered a trend at P ≤ 0.10.
Results and DiscussionBulk density tests showed that adding dietary NDF dramatically decreased diet bulk density (Table 4).
Withdrawal treatments did not influence (P > 0.36) overall ADG; however, because pigs switched from the high-fiber diets on d 43 (47 d before market) grew numerically faster from d 43 to 67, there was a quadratic response (P < 0.04) for the duration of withdrawal from d 43 to 67 and 43 to 90 and for NDF level fed from d 43 to 67 (Tables 5 and 6). Overall ADFI was reduced (P < 0.03) and F/G improved (P < 0.004)

205
Finishing Nutrition and Management
as duration of withdrawal increased due to reductions in ADFI from d 43 to 67 and 67 to 90 for pigs fed the high-energy (lower fiber) diets from d 43 to 90. Interestingly, lowering the NDF level by using the withdraw diets for only 23 d before market did not alter (P > 0.61) ADFI or F/G.
Withdrawing the high-NDF diet improved carcass yield (P < 0.004) with a greater response (P < 0.001) when the low-NDF diet was fed during the withdrawal instead of the medium NDF diet; however, increasing the withdrawal time from 23 to 47 d did not further improve yield (P = 0.11) (Tables 7 and 8). Jowl fat iodine value (IV) decreased as withdrawal time increased (linear, P < 0.01) and was lower (P < 0.001) for pigs fed the low-NDF diet during the withdrawal period than pigs fed the medium-NDF diet during withdrawal, but increasing the withdrawal time from 23 to 47 d further reduced (P < 0.01) jowl IV. Increasing the duration of feeding the low-NDF diets by extending the withdrawal time increased (P = 0.01) backfat depth and tended (P = 0.11) to decrease percentage lean.
The NDF level fed and duration of withdrawal had minor effects on most organ weights except the digestive tract, which, as expected, was most influenced by NDF levels. With-drawing the high-NDF diet for the last 47 d actually increased (P = 0.03) small-intes-tine weight whether calculated on a weight basis (Tables 9 and 10) or percentage of live weight basis (Tables 11 and 12). Stomach weights were not influenced by feeding dura-tion other than a tendency (P < 0.06) for stripped stomach weight to be decreased as duration of withdrawal increased. Similarly, the influence of withdrawal treatments on cecum weights was minor, with only small reductions (P < 0.08) in full, stripped, and rinsed cecum weights when the low NDF level was fed during the withdrawal period instead of the medium NDF level. The greatest impact of withdrawal treatments was on large-intestine weights, with a response similar to the yield response. Increasing dura-tion of withdrawal decreased (linear, P < 0.05) full and stripped large intestine weights. As NDF level increased in the diet from d 43 to 67 or 67 to 90, full and stripped large intestine weights also increased (P < 0.04), with pigs fed the low-NDF diet during the withdrawal period also having lower (P < 0.04) full large intestine weight than those fed the medium-NDF diet.
For the other organs, as the duration of withdrawal increased, there was a reduction (quadratic, P < 0.02) in spleen weight and a tendency (P < 0.11) for a reduction when NDF was reduced 47 d prior to market; however, no other differences were identified (P > 0.47) in spleen weight. As fiber was withdrawn 47 d prior to market, there was a reduction (quadratic, P < 0.01) in kidney weight, with a reduction (P < 0.03) in pigs fed the low-NDF diets compared with the medium-NDF diets during withdrawal. Heart, lungs, liver, and reproductive tract weights were not influenced (P > 0.10) by NDF level or withdrawal treatments.
In summary, withdrawing pigs from a high-NDF diet containing DDGS and midds before market can improve F/G, carcass yield, IV, and reduce large intestine weight, but the optimal length of withdrawal depends on the response criteria being targeted.

206
Finishing Nutrition and Management
Table 1. Phase 1 and 2 diet composition (as-fed basis)1
Phase 1 Phase 2NDF, %: 9.3 19.0 9.3 19.0ADF, %: 3.3 6.7 3.2 6.6
Wheat midds, %: 0 30 0 30Item %: 0 19 0 19Ingredient, %
Corn 73.70 34.90 78.95 40.00Soybean meal (46.5% CP) 23.80 13.75 18.85 8.70DDGS2 --- 30.00 --- 30.00Wheat middlings --- 19.00 --- 19.00Monocalcium P, (21% P) 0.45 --- 0.35 ---Limestone 1.05 1.30 1.00 1.28Salt 0.35 0.35 0.35 0.35Vitamin premix 0.15 0.15 0.13 0.13Trace mineral premix 0.15 0.15 0.13 0.13L-Lysine HCl 0.17 0.31 0.15 0.29DL-Methionine 0.02 --- --- ---L-Threonine 0.03 --- 0.01 ---Phytase3 0.13 0.13 0.13 0.13
Total 100.0 100.0 100.0 100.0
Crude fiber, % 2.5 4.9 2.5 4.9Standardized ileal digestible (SID) amino acids, %
Lysine 0.93 0.93 0.79 0.79Isoleucine:lysine 69 72 70 74Leucine:lysine 156 188 169 206Methionine:lysine 30 34 30 37Met & Cys:lysine 59 70 62 77Threonine:lysine 63 66 63 69Tryptophan:lysine 19 19 19 19Valine:lysine 78 88 81 94
SID lysine:ME/Mcal 2.79 2.84 2.36 2.41ME, kcal/lb 1,513 1,484 1,516 1,486Total lysine, % 1.04 1.09 0.89 0.94CP, % 17.52 20.83 15.62 18.91Ca, % 0.59 0.58 0.53 0.56P, % 0.47 0.58 0.42 0.56Available P, % 0.27 0.39 0.25 0.381 Phase 1 diets were fed from approximately 90 to 130 lb; Phase 2 diets were fed from 130 to 180 lb.2 Dried distillers grains with solubles.3 Phyzyme 600 (Danisco Animal Nutrition, St Louis MO) provided per pound of diet: 353.8 FTU/lb and 0.11% available P released.
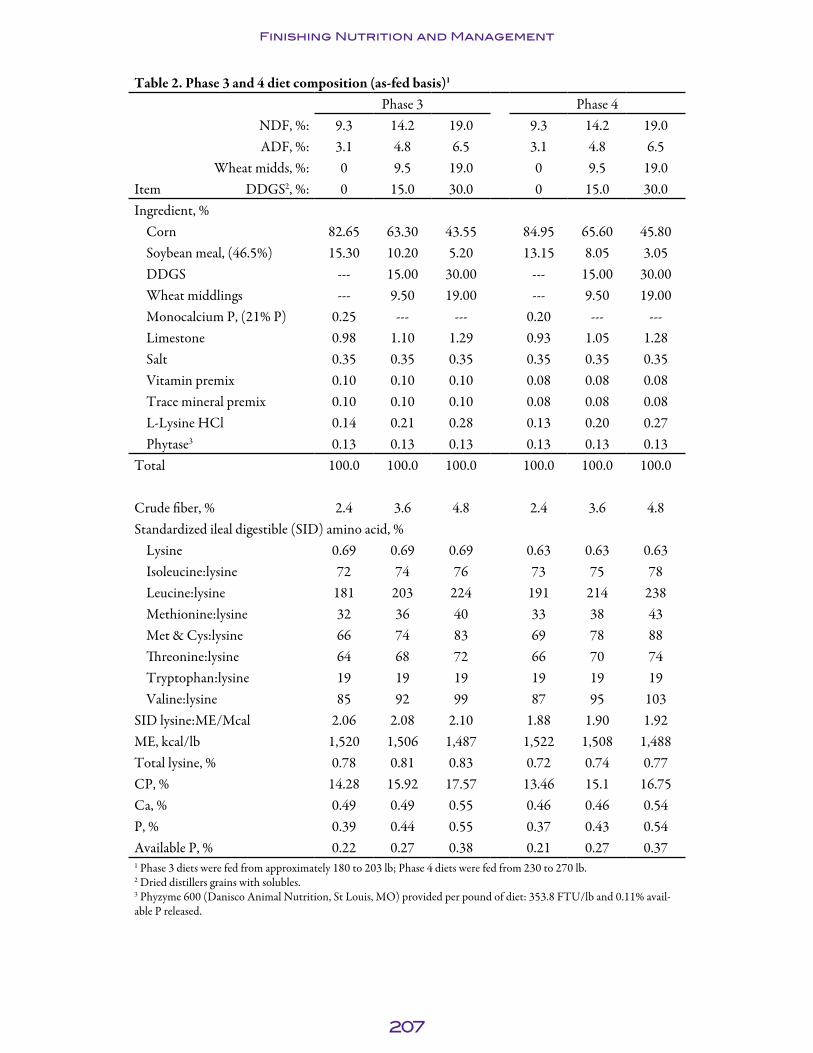
207
Finishing Nutrition and Management
Table 2. Phase 3 and 4 diet composition (as-fed basis)1
Phase 3 Phase 4NDF, %: 9.3 14.2 19.0 9.3 14.2 19.0ADF, %: 3.1 4.8 6.5 3.1 4.8 6.5
Wheat midds, %: 0 9.5 19.0 0 9.5 19.0Item DDGS2, %: 0 15.0 30.0 0 15.0 30.0Ingredient, %
Corn 82.65 63.30 43.55 84.95 65.60 45.80Soybean meal, (46.5%) 15.30 10.20 5.20 13.15 8.05 3.05DDGS --- 15.00 30.00 --- 15.00 30.00Wheat middlings --- 9.50 19.00 --- 9.50 19.00Monocalcium P, (21% P) 0.25 --- --- 0.20 --- ---Limestone 0.98 1.10 1.29 0.93 1.05 1.28Salt 0.35 0.35 0.35 0.35 0.35 0.35Vitamin premix 0.10 0.10 0.10 0.08 0.08 0.08Trace mineral premix 0.10 0.10 0.10 0.08 0.08 0.08L-Lysine HCl 0.14 0.21 0.28 0.13 0.20 0.27Phytase3 0.13 0.13 0.13 0.13 0.13 0.13
Total 100.0 100.0 100.0 100.0 100.0 100.0
Crude fiber, % 2.4 3.6 4.8 2.4 3.6 4.8Standardized ileal digestible (SID) amino acid, %
Lysine 0.69 0.69 0.69 0.63 0.63 0.63Isoleucine:lysine 72 74 76 73 75 78Leucine:lysine 181 203 224 191 214 238Methionine:lysine 32 36 40 33 38 43Met & Cys:lysine 66 74 83 69 78 88Threonine:lysine 64 68 72 66 70 74Tryptophan:lysine 19 19 19 19 19 19Valine:lysine 85 92 99 87 95 103
SID lysine:ME/Mcal 2.06 2.08 2.10 1.88 1.90 1.92ME, kcal/lb 1,520 1,506 1,487 1,522 1,508 1,488Total lysine, % 0.78 0.81 0.83 0.72 0.74 0.77CP, % 14.28 15.92 17.57 13.46 15.1 16.75Ca, % 0.49 0.49 0.55 0.46 0.46 0.54P, % 0.39 0.44 0.55 0.37 0.43 0.54Available P, % 0.22 0.27 0.38 0.21 0.27 0.371 Phase 3 diets were fed from approximately 180 to 203 lb; Phase 4 diets were fed from 230 to 270 lb.2 Dried distillers grains with solubles.3 Phyzyme 600 (Danisco Animal Nutrition, St Louis, MO) provided per pound of diet: 353.8 FTU/lb and 0.11% avail-able P released.
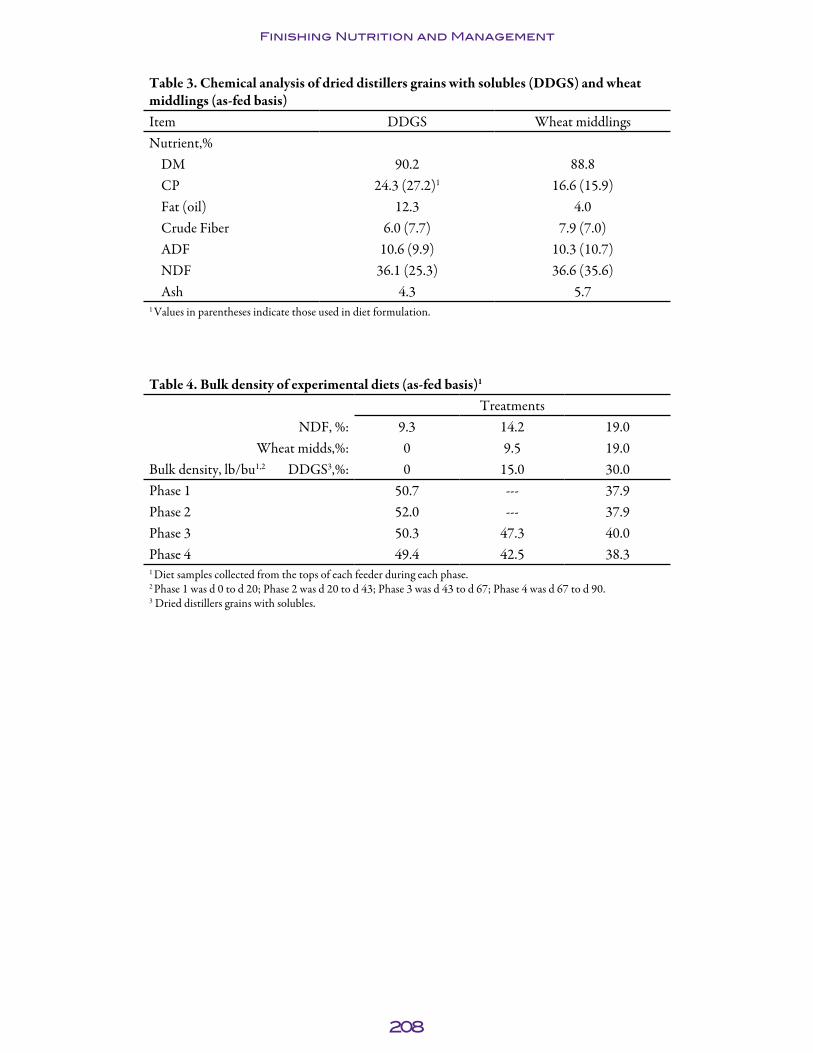
208
Finishing Nutrition and Management
Table 3. Chemical analysis of dried distillers grains with solubles (DDGS) and wheat middlings (as-fed basis)Item DDGS Wheat middlingsNutrient,%
DM 90.2 88.8CP 24.3 (27.2)1 16.6 (15.9)Fat (oil) 12.3 4.0Crude Fiber 6.0 (7.7) 7.9 (7.0)ADF 10.6 (9.9) 10.3 (10.7)NDF 36.1 (25.3) 36.6 (35.6)Ash 4.3 5.7
1 Values in parentheses indicate those used in diet formulation.
Table 4. Bulk density of experimental diets (as-fed basis)1
TreatmentsNDF, %: 9.3 14.2 19.0
Wheat midds,%: 0 9.5 19.0Bulk density, lb/bu1,2 DDGS3,%: 0 15.0 30.0Phase 1 50.7 --- 37.9Phase 2 52.0 --- 37.9Phase 3 50.3 47.3 40.0Phase 4 49.4 42.5 38.31 Diet samples collected from the tops of each feeder during each phase.2 Phase 1 was d 0 to d 20; Phase 2 was d 20 to d 43; Phase 3 was d 43 to d 67; Phase 4 was d 67 to d 90.3 Dried distillers grains with solubles.
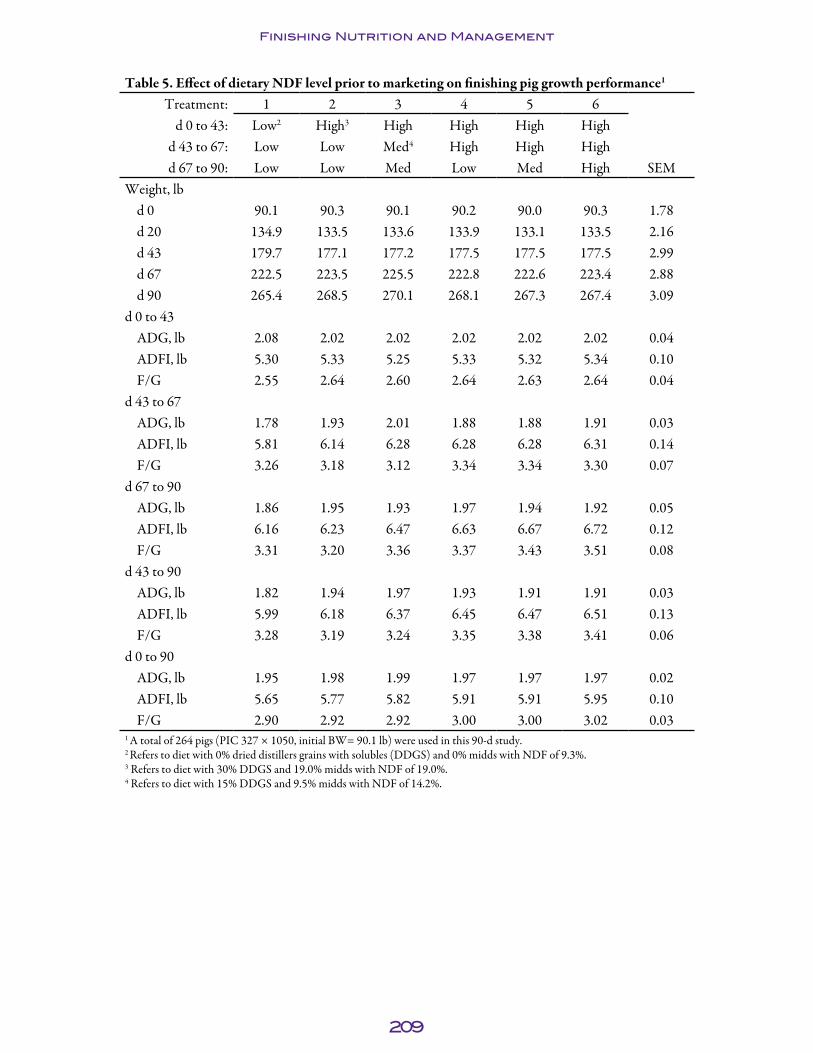
209
Finishing Nutrition and Management
Table 5. Effect of dietary NDF level prior to marketing on finishing pig growth performance1
Treatment: 1 2 3 4 5 6d 0 to 43: Low2 High3 High High High High
d 43 to 67: Low Low Med4 High High Highd 67 to 90: Low Low Med Low Med High SEM
Weight, lbd 0 90.1 90.3 90.1 90.2 90.0 90.3 1.78d 20 134.9 133.5 133.6 133.9 133.1 133.5 2.16d 43 179.7 177.1 177.2 177.5 177.5 177.5 2.99d 67 222.5 223.5 225.5 222.8 222.6 223.4 2.88d 90 265.4 268.5 270.1 268.1 267.3 267.4 3.09
d 0 to 43ADG, lb 2.08 2.02 2.02 2.02 2.02 2.02 0.04ADFI, lb 5.30 5.33 5.25 5.33 5.32 5.34 0.10F/G 2.55 2.64 2.60 2.64 2.63 2.64 0.04
d 43 to 67ADG, lb 1.78 1.93 2.01 1.88 1.88 1.91 0.03ADFI, lb 5.81 6.14 6.28 6.28 6.28 6.31 0.14F/G 3.26 3.18 3.12 3.34 3.34 3.30 0.07
d 67 to 90ADG, lb 1.86 1.95 1.93 1.97 1.94 1.92 0.05ADFI, lb 6.16 6.23 6.47 6.63 6.67 6.72 0.12F/G 3.31 3.20 3.36 3.37 3.43 3.51 0.08
d 43 to 90ADG, lb 1.82 1.94 1.97 1.93 1.91 1.91 0.03ADFI, lb 5.99 6.18 6.37 6.45 6.47 6.51 0.13F/G 3.28 3.19 3.24 3.35 3.38 3.41 0.06
d 0 to 90ADG, lb 1.95 1.98 1.99 1.97 1.97 1.97 0.02ADFI, lb 5.65 5.77 5.82 5.91 5.91 5.95 0.10F/G 2.90 2.92 2.92 3.00 3.00 3.02 0.03
1 A total of 264 pigs (PIC 327 × 1050, initial BW= 90.1 lb) were used in this 90-d study.2 Refers to diet with 0% dried distillers grains with solubles (DDGS) and 0% midds with NDF of 9.3%.3 Refers to diet with 30% DDGS and 19.0% midds with NDF of 19.0%.4 Refers to diet with 15% DDGS and 9.5% midds with NDF of 14.2%.

210
Finishing Nutrition and Management
Table 6. Main effects of dietary NDF level prior to marketing on finishing pig growth performance1
Probability, P <
Withdrawal duration2 Fiber level, d 43 to 903 Fiber level, d 67 to 904Fiber level
during withdrawal5Linear Quadratic Linear Quadratic Linear Quadratic
Weight, lbd 0 0.96 0.97 0.99 0.92 0.96 0.91d 20 0.63 0.75 0.98 0.98 0.91 0.82d 43 0.59 0.66 0.92 0.98 1.00 0.99d 67 0.90 0.74 0.98 0.57 0.89 0.89d 90 0.64 0.43 0.81 0.58 0.89 0.90
d 0 to 43ADG, lb 0.20 0.33 0.92 0.93 0.91 0.98ADFI, lb 0.75 0.79 0.92 0.49 0.94 0.89F/G 0.05 0.42 1.00 0.38 0.99 0.83
d 43 to 67ADG, lb 0.02 0.008 0.64 0.04 0.59 0.66ADFI, lb 0.01 0.29 0.42 0.75 0.91 0.92F/G 0.41 0.30 0.23 0.20 0.69 0.87
d 67 to 90ADG, lb 0.30 0.24 0.65 0.92 0.45 1.00ADFI, lb 0.001 0.81 0.008 0.99 0.63 0.98F/G 0.06 0.14 0.007 0.95 0.21 0.92
d 43 to 90ADG, lb 0.04 0.02 0.56 0.28 0.79 0.82 0.82ADFI, lb 0.003 0.61 0.07 0.86 0.76 0.94 0.42F/G 0.09 0.10 0.01 0.41 0.54 0.96 0.51
d 0 to 90ADG, lb 0.65 0.36 0.76 0.47 0.91 0.90 0.83ADFI, lb 0.03 0.86 0.22 0.74 0.82 0.86 0.83F/G 0.004 0.45 0.03 0.19 0.61 0.85 0.96
1 A total of 264 pigs (PIC 327 × 1050, initial BW= 90.1 lb) were used in an 87-d study.2 Effect of duration of withdrawal regardless of fiber level fed during withdrawal.3 Effect of fiber level (19%, 14.2%, 9.3%) fed from d 43 to 90 (last 47 d before market; treatments 2, 3, and 6). 4 Effect of fiber level (19%, 14.2%, 9.3%) fed from d 67 to 90 (last 23 d before market; treatments 4, 5, and 6).5 Effect of fiber level (14.2% vs. 9.3%) regardless of time of withdrawal (treatments 2 and 4 vs. 3 and 5).
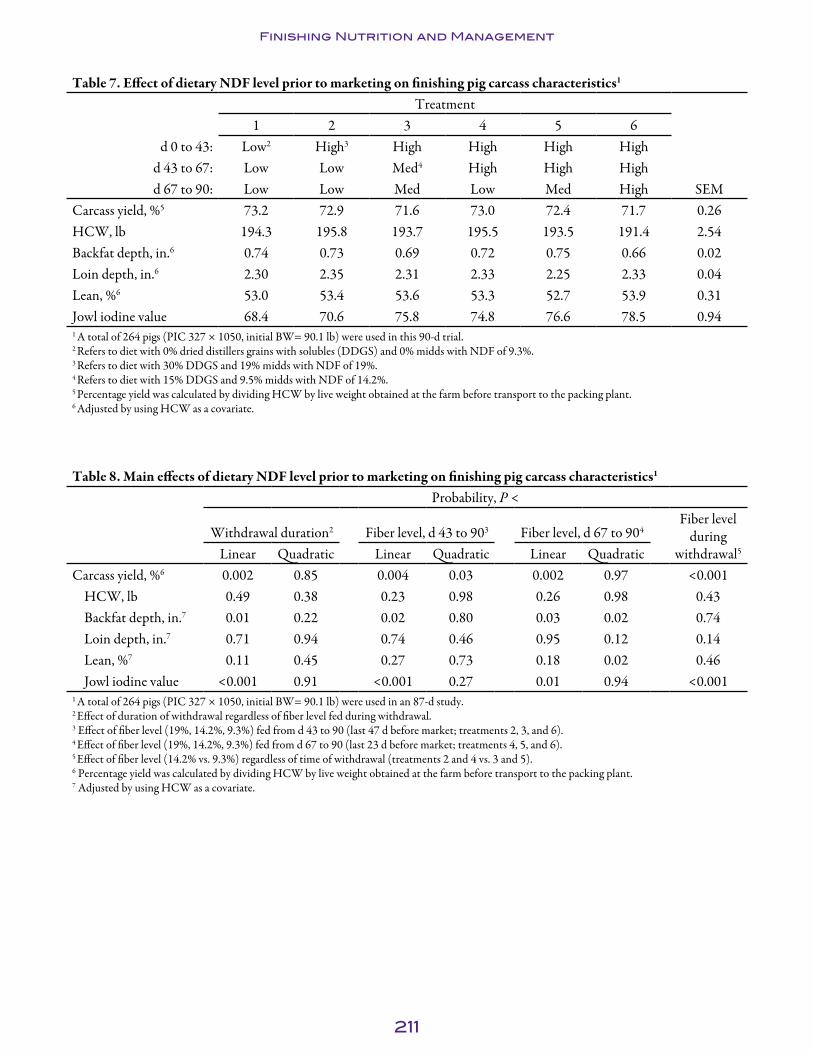
211
Finishing Nutrition and Management
Table 7. Effect of dietary NDF level prior to marketing on finishing pig carcass characteristics1
Treatment1 2 3 4 5 6
d 0 to 43: Low2 High3 High High High Highd 43 to 67: Low Low Med4 High High Highd 67 to 90: Low Low Med Low Med High SEM
Carcass yield, %5 73.2 72.9 71.6 73.0 72.4 71.7 0.26HCW, lb 194.3 195.8 193.7 195.5 193.5 191.4 2.54Backfat depth, in.6 0.74 0.73 0.69 0.72 0.75 0.66 0.02Loin depth, in.6 2.30 2.35 2.31 2.33 2.25 2.33 0.04Lean, %6 53.0 53.4 53.6 53.3 52.7 53.9 0.31Jowl iodine value 68.4 70.6 75.8 74.8 76.6 78.5 0.941 A total of 264 pigs (PIC 327 × 1050, initial BW= 90.1 lb) were used in this 90-d trial.2 Refers to diet with 0% dried distillers grains with solubles (DDGS) and 0% midds with NDF of 9.3%.3 Refers to diet with 30% DDGS and 19% midds with NDF of 19%. 4 Refers to diet with 15% DDGS and 9.5% midds with NDF of 14.2%.5 Percentage yield was calculated by dividing HCW by live weight obtained at the farm before transport to the packing plant.6 Adjusted by using HCW as a covariate.
Table 8. Main effects of dietary NDF level prior to marketing on finishing pig carcass characteristics1
Probability, P <
Withdrawal duration2 Fiber level, d 43 to 903 Fiber level, d 67 to 904Fiber level
during withdrawal5Linear Quadratic Linear Quadratic Linear Quadratic
Carcass yield, %6 0.002 0.85 0.004 0.03 0.002 0.97 <0.001HCW, lb 0.49 0.38 0.23 0.98 0.26 0.98 0.43Backfat depth, in.7 0.01 0.22 0.02 0.80 0.03 0.02 0.74Loin depth, in.7 0.71 0.94 0.74 0.46 0.95 0.12 0.14Lean, %7 0.11 0.45 0.27 0.73 0.18 0.02 0.46Jowl iodine value <0.001 0.91 <0.001 0.27 0.01 0.94 <0.001
1 A total of 264 pigs (PIC 327 × 1050, initial BW= 90.1 lb) were used in an 87-d study.2 Effect of duration of withdrawal regardless of fiber level fed during withdrawal.3 Effect of fiber level (19%, 14.2%, 9.3%) fed from d 43 to 90 (last 47 d before market; treatments 2, 3, and 6). 4 Effect of fiber level (19%, 14.2%, 9.3%) fed from d 67 to 90 (last 23 d before market; treatments 4, 5, and 6).5 Effect of fiber level (14.2% vs. 9.3%) regardless of time of withdrawal (treatments 2 and 4 vs. 3 and 5).6 Percentage yield was calculated by dividing HCW by live weight obtained at the farm before transport to the packing plant.7 Adjusted by using HCW as a covariate.

212
Finishing Nutrition and Management
Table 9. Effect of dietary NDF level prior to marketing on finishing pig intestinal and organ weights, lb1
Treatment1 2 3 4 5 6
d 0 to 43: Low2 High3 High High High Highd 43 to 67: Low Low Med4 High High Highd 67 to 90: Low Low Med Low Med High SEM
Full pluck 26.71 28.30 28.63 27.34 27.93 28.75 0.90Whole intestine 16.55 17.66 18.41 16.83 17.65 18.59 0.70Stomach
Full 1.91 2.17 2.17 2.24 2.10 2.10 0.16Stripped 1.38 1.47 1.47 1.48 1.45 1.50 0.05Rinsed 1.38 1.38 1.38 1.41 1.40 1.44 0.05
CecumFull 1.58 1.28 1.89 1.50 1.63 1.70 0.19Stripped 0.58 0.54 0.61 0.52 0.56 0.56 0.03Rinsed 0.54 0.51 0.56 0.50 0.56 0.54 0.03
Large intestineFull 6.57 7.11 8.18 6.69 7.48 8.68 0.46Stripped 3.38 3.39 3.65 3.25 3.41 3.93 0.17Rinsed 3.17 3.23 3.42 3.07 3.20 3.57 0.14
Small intestineFull 6.04 6.81 6.06 5.64 6.07 5.87 0.29
Heart 1.00 0.93 0.93 0.93 0.94 0.93 0.03Lungs 1.34 1.40 1.23 1.23 1.36 1.31 0.06Liver 3.91 3.96 3.82 3.98 3.87 4.22 0.13Kidneys 0.80 0.81 0.93 0.82 0.86 0.85 0.04Spleen 0.37 0.44 0.48 0.44 0.43 0.42 0.03Reproductive tract 1.21 1.33 1.18 1.25 1.15 1.19 0.171 A total of 264 pigs (PIC 327 × 1050, initial BW= 90.1 lb) were used in this 90-d trial.2 Refers to diet with 0% dried distillers grains with solubles (DDGS) and 0% midds with NDF of 9.3%.3 Refers to diet with 30% DDGS and 19% midds with NDF of 19%.4 Refers to diet with 15% DDGS and 9.5% midds with NDF of 14.2%.

213
Finishing Nutrition and Management
Table 10. Main effects of dietary NDF level prior to marketing on finishing pig intestinal and organ weights, lb1
Probability, P <
Withdrawal duration2 Fiber level d 43 to 903 Fiber level d 67 to 904Fiber level
during withdrawal5 Linear Quadratic Linear Quadratic Linear Quadratic
Full pluck 0.16 0.71 0.74 0.92 0.28 0.91 0.62Whole intestine 0.08 0.94 0.36 0.74 0.09 0.95 0.27Stomach
Full 0.32 0.28 0.76 0.86 0.52 0.71 0.65Stripped 0.12 0.74 0.66 0.80 0.74 0.57 0.81Rinsed 0.36 0.58 0.36 0.69 0.65 0.69 1.00
CecumFull 0.73 0.69 0.13 0.12 0.46 0.89 0.07Stripped 0.38 0.79 0.70 0.12 0.33 0.57 0.08Rinsed 0.93 0.68 0.39 0.32 0.28 0.26 0.05
Large intestineFull 0.008 0.44 0.02 0.61 0.005 0.72 0.05Stripped 0.07 0.11 0.03 0.95 0.007 0.38 0.22Rinsed 0.13 0.29 0.11 0.92 0.02 0.51 0.27
Small intestineFull 0.50 0.26 0.03 0.43 0.58 0.38 0.58
Heart 0.07 0.38 0.91 0.87 0.84 0.73 0.85Lungs 0.65 0.78 0.34 0.12 0.42 0.28 0.71Liver 0.15 0.13 0.18 0.10 0.22 0.16 0.33Kidneys 0.39 0.36 0.44 0.03 0.53 0.59 0.03Spleen 0.19 0.03 0.54 0.13 0.54 0.90 0.66Reproductive tract 0.92 0.82 0.58 0.69 0.81 0.73 0.471 A total of 264 pigs (PIC 327 × 1050, initial BW= 90.1 lb) were used in an 87-d study.2 Effect of duration of withdrawal regardless of fiber level fed during withdrawal.3 Effect of fiber level (19%, 14.2%, 9.3%) fed from d 43 to 90 (last 47 d before market; treatments 2, 3, and 6). 4 Effect of fiber level (19%, 14.2%, 9.3%) fed from d 67 to 90 (last 23 d before market; treatments 4, 5, and 6).5 Effect of fiber level (14.2% vs. 9.3%) regardless of time of withdrawal (treatments 2 and 4 vs. 3 and 5).

214
Finishing Nutrition and Management
Table 11. Effect of dietary NDF levels prior to marketing on finishing pig intestinal and organ weights, %1, 2
Treatment: 1 2 3 4 5 6d 0 to 43: Low3 High4 High High High High
d 43 to 67: Low Low Med5 High High Highd 67 to 90: Low Low Med Low Med High SEM
Full pluck 9.83 10.75 10.77 10.29 10.57 10.70 0.30Whole intestine 6.09 6.64 6.92 6.33 6.69 6.92 0.25Stomach
Full 0.70 0.82 0.81 0.84 0.79 0.78 0.05Stripped 0.51 0.55 0.55 0.55 0.55 0.56 0.02Rinsed 0.51 0.52 0.52 0.53 0.53 0.54 0.02
CecumFull 0.58 0.49 0.72 0.57 0.62 0.63 0.07Stripped 0.21 0.20 0.23 0.19 0.21 0.21 0.01Rinsed 0.20 0.19 0.21 0.19 0.21 0.20 0.01
Large intestineFull 2.42 2.67 3.07 2.52 2.84 3.23 0.17Stripped 1.25 1.27 1.37 1.22 1.29 1.47 0.06Rinsed 1.17 1.21 1.28 1.15 1.21 1.33 0.05
Small intestineFull 2.22 2.56 2.28 2.12 2.29 2.18 0.10
Heart 0.37 0.35 0.35 0.35 0.36 0.34 0.01Lungs 0.49 0.53 0.46 0.46 0.51 0.49 0.02Liver 1.44 1.48 1.43 1.50 1.47 1.57 0.05Kidneys 0.29 0.30 0.35 0.31 0.32 0.32 0.01Spleen 0.14 0.17 0.18 0.17 0.16 0.16 0.01Reproductive tract 0.44 0.50 0.44 0.47 0.43 0.44 0.061 A total of 264 pigs (PIC 327 × 1050, initial BW= 90.1 lb) were used in this 90-d trial.2 All values are a percentage of live weight; i.e., (reproductive tract/live weight) × 100.3 Refers to diet with 0% DDGS and 0% midds with NDF of 9.3%.4 Refers to diet with 30% DDGS and 19% midds with NDF of 19%.5 Refers to diet with 15% DDGS and 9.5% midds with NDF of 14.2%.

215
Finishing Nutrition and Management
Table 12. Main effects of dietary NDF levels prior to marketing on finishing pig intestinal and organ weights, %1
Probability, P <Withdrawal duration2 Fiber level, d 43 to 903 Fiber level, d 67 to 904 Fiber level
during withdrawal5Linear Quadratic Linear Quadratic Linear Quadratic
Full pluck 0.06 0.25 0.92 0.91 0.34 0.85 0.63Whole intestine 0.04 0.58 0.45 0.65 0.11 0.83 0.21Stomach
Full 0.24 0.16 0.63 0.81 0.43 0.78 0.63Stripped 0.06 0.40 0.79 0.89 0.90 0.77 0.91Rinsed 0.19 0.94 0.42 0.78 0.79 0.92 0.88
CecumFull 0.66 0.84 0.16 0.11 0.51 0.82 0.07Stripped 0.55 0.93 0.77 0.10 0.39 0.45 0.07Rinsed 0.85 1.00 0.46 0.28 0.37 0.18 0.04
Large intestineFull 0.01 0.62 0.03 0.57 0.006 0.88 0.04Stripped 0.05 0.21 0.04 0.97 0.009 0.50 0.18Rinsed 0.07 0.48 0.12 0.83 0.02 0.65 0.20
Small intestineFull 0.61 0.11 0.01 0.47 0.68 0.27 0.58
Heart 0.16 0.81 0.66 0.86 0.68 0.51 0.85Lungs 0.82 0.87 0.19 0.08 0.45 0.18 0.63Liver 0.06 0.24 0.18 0.10 0.26 0.22 0.37Kidneys 0.23 0.16 0.45 0.01 0.62 0.44 0.02Spleen 0.16 0.02 0.49 0.11 0.47 0.99 0.62Reproductive tract 0.99 0.71 0.53 0.69 0.76 0.71 0.431 A total of 264 pigs (PIC 327 × 1050, initial BW= 90.1 lb) were used in an 87-d study.2 Effect of duration of withdrawal regardless of fiber level fed during withdrawal.3 Effect of fiber level (19%, 14.2%, 9.3%) fed from d 43 to 90 (last 47 d before market; treatments 2, 3, and 6). 4 Effect of fiber level (19%, 14.2%, 9.3%) fed from d 67 to 90 (last 23 d before market; treatments 4, 5, and 6).5 Effect of fiber level (14.2% vs. 9.3%) regardless of time of withdrawal (treatments 2 and 4 vs. 3 and 5).
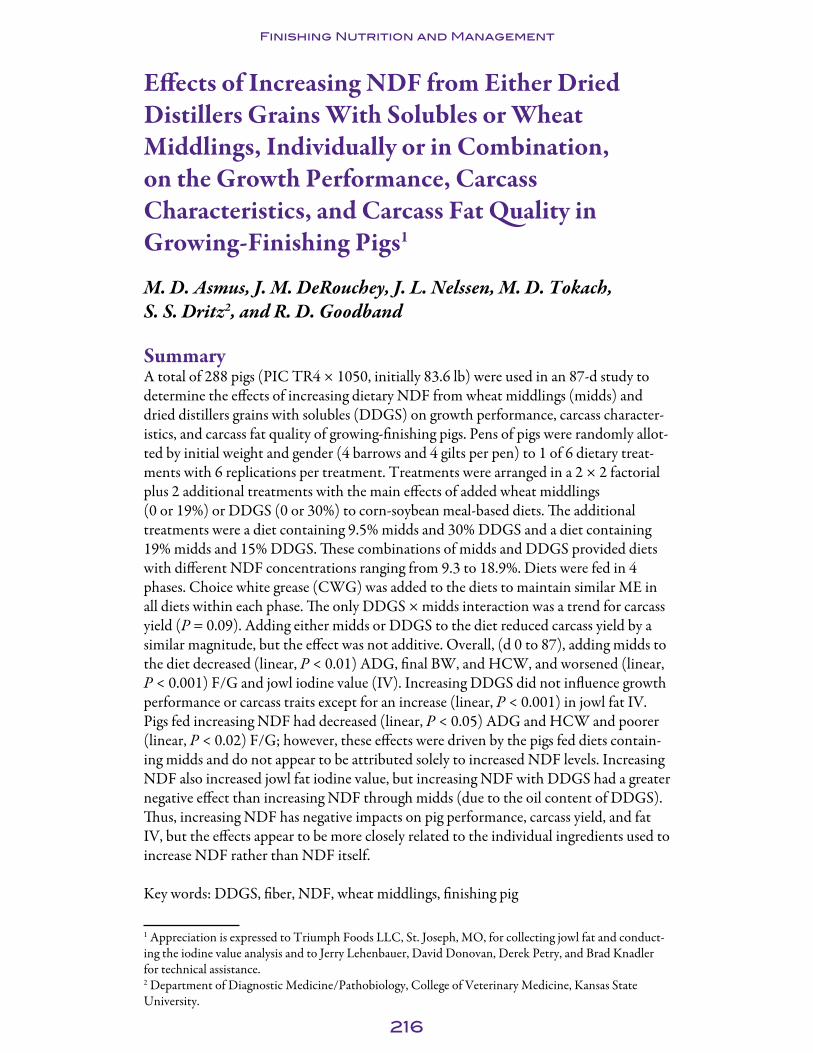
216
Finishing Nutrition and Management
Effects of Increasing NDF from Either Dried Distillers Grains With Solubles or Wheat Middlings, Individually or in Combination, on the Growth Performance, Carcass Characteristics, and Carcass Fat Quality in Growing-Finishing Pigs1
M. D. Asmus, J. M. DeRouchey, J. L. Nelssen, M. D. Tokach, S. S. Dritz2, and R. D. Goodband
SummaryA total of 288 pigs (PIC TR4 × 1050, initially 83.6 lb) were used in an 87-d study to determine the effects of increasing dietary NDF from wheat middlings (midds) and dried distillers grains with solubles (DDGS) on growth performance, carcass character-istics, and carcass fat quality of growing-finishing pigs. Pens of pigs were randomly allot-ted by initial weight and gender (4 barrows and 4 gilts per pen) to 1 of 6 dietary treat-ments with 6 replications per treatment. Treatments were arranged in a 2 × 2 factorial plus 2 additional treatments with the main effects of added wheat middlings (0 or 19%) or DDGS (0 or 30%) to corn-soybean meal-based diets. The additional treatments were a diet containing 9.5% midds and 30% DDGS and a diet containing 19% midds and 15% DDGS. These combinations of midds and DDGS provided diets with different NDF concentrations ranging from 9.3 to 18.9%. Diets were fed in 4 phases. Choice white grease (CWG) was added to the diets to maintain similar ME in all diets within each phase. The only DDGS × midds interaction was a trend for carcass yield (P = 0.09). Adding either midds or DDGS to the diet reduced carcass yield by a similar magnitude, but the effect was not additive. Overall, (d 0 to 87), adding midds to the diet decreased (linear, P < 0.01) ADG, final BW, and HCW, and worsened (linear, P < 0.001) F/G and jowl iodine value (IV). Increasing DDGS did not influence growth performance or carcass traits except for an increase (linear, P < 0.001) in jowl fat IV. Pigs fed increasing NDF had decreased (linear, P < 0.05) ADG and HCW and poorer (linear, P < 0.02) F/G; however, these effects were driven by the pigs fed diets contain-ing midds and do not appear to be attributed solely to increased NDF levels. Increasing NDF also increased jowl fat iodine value, but increasing NDF with DDGS had a greater negative effect than increasing NDF through midds (due to the oil content of DDGS). Thus, increasing NDF has negative impacts on pig performance, carcass yield, and fat IV, but the effects appear to be more closely related to the individual ingredients used to increase NDF rather than NDF itself. Key words: DDGS, fiber, NDF, wheat middlings, finishing pig
1 Appreciation is expressed to Triumph Foods LLC, St. Joseph, MO, for collecting jowl fat and conduct-ing the iodine value analysis and to Jerry Lehenbauer, David Donovan, Derek Petry, and Brad Knadler for technical assistance.2 Department of Diagnostic Medicine/Pathobiology, College of Veterinary Medicine, Kansas State University.

217
Finishing Nutrition and Management
IntroductionFeed ingredients such as wheat middlings (midds) and DDGS are often used as alter-natives to corn and soybean meal in swine diets. Although these ingredients are used with the intent of lowering feed costs, they have been shown to have the potential to negatively affect performance and carcass characteristics. Thus, whether the reduction in performance and carcass yield is due to fiber or related more closely with individual ingredients must be determined. Wheat middlings are among the cereal by-products commonly used in commercial pig feed. Often referred to as wheat midds, they are by-products from flour milling. Most U.S. wheat that is not exported is processed into flour, so milling by-products are widely available for use in the animal feed industry. Midds have higher crude protein and fiber but lower dietary energy than corn (corn ME = 1,551 kcal/lb; wheat middlings ME = 1,372 kcal/lb; NRC, 19983). Because of the lower ME content, producers can expect reduced gains and poorer feed efficiency in finishing pigs. To mitigate this effect, dietary fat can be added to increase the dietary energy level; however, limited data are available on the effects of combining midds with choice white grease (CWG) in diets for finishing pigs. Also, due to opportunities to reduce diet cost with midds, its effect on performance needs further investigation.
Considerable research has been conducted in recent years on the addition of DDGS to finishing diets. With proper diet formulation and high-quality DDGS, up to 30% DDGS can be fed without reducing pig performance, but carcass yield is often reduced and fat iodine value (IV) is increased with DDGS inclusion in the diet. Adding DDGS and midds to the diet increases dietary fiber levels, but little information is available on the potential relationships between these ingredients.
Therefore, the objective of this trial was to determine the effects of increasing fiber levels from midds and DDGS on growth performance, carcass characteristics, and carcass fat quality of growing-finishing pigs.
ProceduresThe Kansas State University Institutional Animal Care and Use Committee approved the protocol used in this experiment. The study was conducted at the K-State Swine Teaching and Research Center in Manhattan, KS. The facility was a totally enclosed, environmentally controlled, mechanically ventilated barn containing 36 pens (8 × 10 ft). The pens had adjustable gates facing the alleyway that allowed for 10 ft2/pig. Each pen was equipped with a cup waterer and a Farmweld (Teutopolis, IL) single-sided, dry self-feeder with 2 eating spaces located in the fence line. Pens were located over a completely slatted concrete floor with a 4-ft pit underneath for manure storage. The facility was also equipped with a computerized feeding system (FeedPro; Feedlogic Corp., Willmar, MN) that delivered and recorded diets as specified. The equipment provided pigs with ad libitum access to food and water.
A total of 288 pigs (PIC TR4 × 1050, initially 83.6 lb) were used in an 87-d growth trial. Pens of pigs (4 barrows and 4 gilts per pen) were randomly allotted by initial weight to 1 of 6 dietary treatments with 6 replications per treatment. Treatments were
3 NRC. 1998. Nutrient Requirements of Swine. 10th ed. Natl. Acad. Press, Washington, DC.

218
Finishing Nutrition and Management
arranged in a 2 × 2 factorial design plus 2 additional treatments with the main effects of added midds (0 or 19%) and DDGS (0 or 30%). The additional treatments were a diet containing 9.5% midds and 30% DDGS and a diet containing 19% midds and 15% DDGS. Dietary treatments were corn-soybean meal-based and fed in 4 phases (Tables 1 and 2). All diets were fed in meal form and balanced to similar ME concentra-tions and SID lysine:ME ratios within each phase. Choice white grease was added to diets to maintain the same ME level within phase. The ME values used in formulation for dietary ingredients included: DDGS = 1,552 ME kcal per lb; midds = 1,375 ME kcal per lb; and CWG = 7,995 ME kcal per lb.
Wheat middlings and DDGS samples were collected at the time of feed manufacture and a composite sample was analyzed (Table 3). Feed samples were also collected from each feeder during each phase and combined for a single composite sample by treatment for each phase to measure bulk density (Table 4). Bulk density of a material represents the mass per unit volume (lb per bushel).
Pigs and feeders were weighed approximately every 3 wk to calculate ADG, ADFI, and F/G. On d 87, all pigs were weighed and transported to Triumph Foods LLC, St. Joseph, MO. Before slaughter, pigs were individually tattooed according to pen number to allow for carcass data collection at the packing plant and data retrieval by pen. Hot carcass weights were measured immediately after evisceration and each carcass was eval-uated for percentage yield, backfat, loin depth, and percentage lean. Because there were differences in HCW, it was used as a covariate for backfat, loin depth, and percentage lean. Also, jowl fat samples were collected and analyzed by Near Infrared Spectroscopy (NIR) at the plant for IV. Percentage yield was calculated by dividing HCW at the plant by live weight at the farm before transport to the plant.
Data were analyzed as a completely randomized design using the PROC-MIXED procedure (SAS Institute, Inc., Cary, NC) with pen as the experimental unit. The main effects of the different treatment regimens of midds and DDGS and their interaction were tested. Linear and quadratic contrasts were used to determine the effects of midds, DDGS, and NDF levels. The contrast coefficients for NDF were determined using PROC IML for unequally spaced treatments in SAS. Differences between treatments were determined by using least squares means (P < 0.05), and trends were declared at P < 0.10.
Results and DiscussionAnalyzed samples of DDGS and midds had higher levels of NDF than those used in formulation (Table 3), and thus resulted in higher levels in the final diets than formu-lated; however, the incremental increase in NDF levels persisted. Using the actual NDF values from analysis, the NDF levels in the diet were 9.2, 15.4, 18.4, and 21.6, which was a 3% increase over the planned levels of 9.2, 14.0, 16.4, and 18.8, which had an increase of 2.4% between levels. Although the dietary NDF was higher than planned, the increase in fiber between treatments was still proportionally the same.
Bulk density tests showed that adding midds to the diet decreased diet bulk density more severely than the addition of DDGS (Table 4).

219
Finishing Nutrition and Management
The only DDGS × midds interaction that occurred was a trend (P = 0.09) for carcass yield (Tables 5 and 6). Adding DDGS and midds to the diet decreased carcass yield; however, the interaction occurred because the effects were not additive. Overall (d 0 to 87), adding midds to finishing pig diets decreased (linear P < 0.001) ADG, final BW, hot carcass weight, and worsened (linear, P < 0.001) F/G and jowl IV. Increases in DDGS had no influence on growth performance or carcass characteristics with the exception of the expected linear increase (P < 0.001) in jowl fat IV. Pigs fed increas-ing dietary NDF had decreased (linear; P < 0.05) ADG and hot carcass weight as well as poorer (linear; P <0.02) F/G; however, these effects were driven by the pigs on the midds diets and do not appear to be attributed solely to increased dietary NDF. Increas-ing NDF also increased jowl fat IV (linear; P < 0.001), but increasing NDF with DDGS had a greater negative effect than by increasing NDF through midds (due to the oil content of DDGS). Thus, increasing NDF has negative impacts on pig performance, yield, and fat IV, but the effects appear to be more closely related to the individual ingredients used to increase NDF than the NDF itself.
The decrease in growth rate and poorer F/G with midds suggest that we may have overestimated the energy content of midds, but the pigs do not appear to have compen-sated by eating more feed. Thus, ADG and F/G were both impaired by the addition of midds to the diet. Diets with high levels of midds had decreased bulk density, which could result in increased gut fill. Adding only midds to the diet to achieve a diet with 14% NDF worsened both ADG and F/G by 4%. Interestingly, adding only DDGS to the diet to achieve the same 14% NDF resulted in a 4% increase in ADG and similar F/G. Diets containing high levels of wheat middlings consistently resulted in poorer ADG and F/G regardless of NDF level or simultaneous inclusion of DDGS; therefore, this result implies that the decrease in performance is related to the addition of midds themselves and not the dietary NDF level.

220
Fin
ish
ing
Nu
tr
itio
n a
nd
Ma
na
ge
me
nt
Table 1. Phase 1 and 2 diet composition (as-fed basis)1
Phase 1 Phase 2NDF, %: 9.2 14.0 14.0 16.4 16.4 18.8 9.2 14.0 14.0 16.4 16.4 18.8
Wheat midds, %: 0 19 0 9.5 19 19 0 19 0 9.5 19 19DDGS, %2: 0 0 30 30 15 30 0 0 30 30 15 30
IngredientCorn 77.05 61.10 52.90 44.90 49.10 36.90 81.70 65.80 57.45 49.45 53.70 41.30Soybean meal (46.5% CP) 20.05 15.60 14.70 12.35 12.80 10.05 15.65 11.15 10.25 7.90 8.35 5.70DDGS --- --- 30.00 30.00 15.00 30.00 --- --- 30.00 30.00 15.00 30.00Wheat middlings --- 19.00 --- 9.50 19.00 19.00 --- 19.00 --- 9.50 19.00 19.00Choice white grease 0.20 1.70 --- 0.80 1.60 1.60 0.15 1.65 --- 0.80 1.60 1.60Monocalcium P, 21% P 0.55 0.25 --- --- --- --- 0.40 0.10 --- --- --- ---Limestone 0.98 1.10 1.28 1.28 1.25 1.28 1.03 1.15 1.25 1.25 1.23 1.25Salt 0.35 0.35 0.35 0.35 0.35 0.35 0.35 0.35 0.35 0.35 0.35 0.35Vitamin premix 0.15 0.15 0.15 0.15 0.15 0.15 0.15 0.15 0.15 0.15 0.15 0.15Trace mineral premix 0.15 0.15 0.15 0.15 0.15 0.15 0.15 0.15 0.15 0.15 0.15 0.15L-Lysine HCl 0.28 0.35 0.34 0.38 0.39 0.42 0.24 0.32 0.31 0.35 0.35 0.38DL-Methionine 0.03 0.03 --- --- --- --- 0.01 0.01 --- --- --- ---L-Threonine 0.07 0.09 --- --- 0.05 0.01 0.04 0.06 --- --- 0.03 ---Phytase3 0.13 0.13 0.13 0.13 0.13 0.13 0.13 0.13 0.13 0.13 0.13 0.13
Total 100.0 100.0 100.0 100.0 100.0 100.0 100.0 100.0 100.0 100.0 100.0 100.0continued
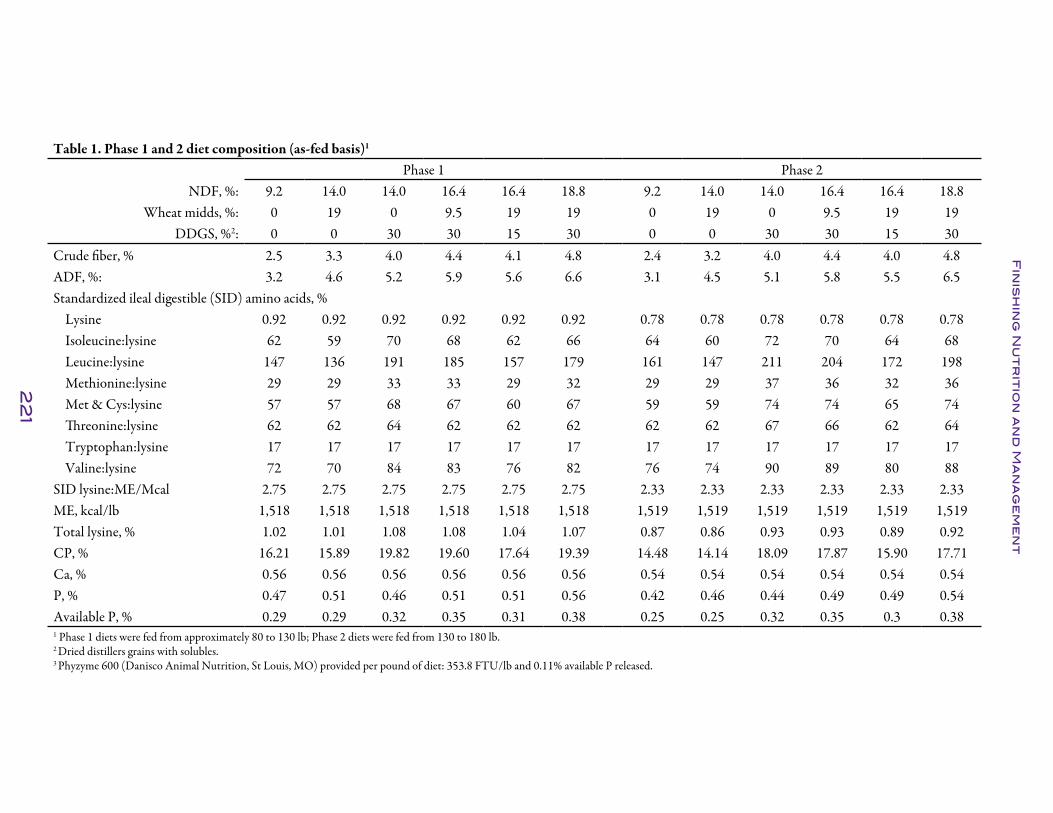
22
1
Fin
ish
ing
Nu
tr
itio
n a
nd
Ma
na
ge
me
nt
Table 1. Phase 1 and 2 diet composition (as-fed basis)1
Phase 1 Phase 2NDF, %: 9.2 14.0 14.0 16.4 16.4 18.8 9.2 14.0 14.0 16.4 16.4 18.8
Wheat midds, %: 0 19 0 9.5 19 19 0 19 0 9.5 19 19DDGS, %2: 0 0 30 30 15 30 0 0 30 30 15 30
Crude fiber, % 2.5 3.3 4.0 4.4 4.1 4.8 2.4 3.2 4.0 4.4 4.0 4.8ADF, %: 3.2 4.6 5.2 5.9 5.6 6.6 3.1 4.5 5.1 5.8 5.5 6.5Standardized ileal digestible (SID) amino acids, %
Lysine 0.92 0.92 0.92 0.92 0.92 0.92 0.78 0.78 0.78 0.78 0.78 0.78Isoleucine:lysine 62 59 70 68 62 66 64 60 72 70 64 68Leucine:lysine 147 136 191 185 157 179 161 147 211 204 172 198Methionine:lysine 29 29 33 33 29 32 29 29 37 36 32 36Met & Cys:lysine 57 57 68 67 60 67 59 59 74 74 65 74Threonine:lysine 62 62 64 62 62 62 62 62 67 66 62 64Tryptophan:lysine 17 17 17 17 17 17 17 17 17 17 17 17Valine:lysine 72 70 84 83 76 82 76 74 90 89 80 88
SID lysine:ME/Mcal 2.75 2.75 2.75 2.75 2.75 2.75 2.33 2.33 2.33 2.33 2.33 2.33ME, kcal/lb 1,518 1,518 1,518 1,518 1,518 1,518 1,519 1,519 1,519 1,519 1,519 1,519Total lysine, % 1.02 1.01 1.08 1.08 1.04 1.07 0.87 0.86 0.93 0.93 0.89 0.92CP, % 16.21 15.89 19.82 19.60 17.64 19.39 14.48 14.14 18.09 17.87 15.90 17.71Ca, % 0.56 0.56 0.56 0.56 0.56 0.56 0.54 0.54 0.54 0.54 0.54 0.54P, % 0.47 0.51 0.46 0.51 0.51 0.56 0.42 0.46 0.44 0.49 0.49 0.54Available P, % 0.29 0.29 0.32 0.35 0.31 0.38 0.25 0.25 0.32 0.35 0.3 0.381 Phase 1 diets were fed from approximately 80 to 130 lb; Phase 2 diets were fed from 130 to 180 lb.2 Dried distillers grains with solubles. 3 Phyzyme 600 (Danisco Animal Nutrition, St Louis, MO) provided per pound of diet: 353.8 FTU/lb and 0.11% available P released.

222
Fin
ish
ing
Nu
tr
itio
n a
nd
Ma
na
ge
me
nt
Table 2. Phase 3 and 4 diet composition (as-fed basis)1
Phase 3 Phase 4NDF, %: 9.3 14.0 14.0 16.4 16.4 18.9 9.3 14.1 14.1 16.5 16.5 18.9
Wheat midds, %: 0 19 0 9.5 19 19 0 19 0 9.5 19 19Ingredient DDGS, %2: 0 0 30 30 15 30 0 0 30 30 15 30
Corn 85.05 69.10 60.75 52.65 56.90 44.50 87.05 71.10 62.60 54.60 58.85 46.45Soybean meal (46.5% CP) 12.45 7.95 6.95 4.70 5.15 2.50 10.55 6.00 5.10 2.80 3.25 0.60DDGS --- --- 30.00 30.00 15.00 30.00 --- --- 30.00 30.00 15.00 30.00Wheat middlings --- 19.00 --- 9.50 19.00 19.00 --- 19.00 0.00 9.50 19.00 19.00Choice white grease 0.15 1.65 --- 0.80 1.60 1.60 0.10 1.60 0.00 0.80 1.60 1.60Monocalcium P (21% P) 0.25 --- --- --- --- --- 0.20 --- 0.00 0.00 0.00 0.00Limestone 1.10 1.20 1.25 1.25 1.23 1.25 1.10 1.20 1.25 1.25 1.23 1.25Salt 0.35 0.35 0.35 0.35 0.35 0.35 0.35 0.35 0.35 0.35 0.35 0.35Vitamin premix 0.15 0.15 0.15 0.15 0.15 0.15 0.15 0.15 0.15 0.15 0.15 0.15Trace mineral premix 0.15 0.15 0.15 0.15 0.15 0.15 0.15 0.15 0.15 0.15 0.15 0.15L-Lysine HCl 0.22 0.29 0.28 0.32 0.33 0.36 0.20 0.28 0.27 0.31 0.31 0.34DL-Methionine --- 0.01 --- --- --- --- --- --- --- --- --- ---L-Threonine 0.02 0.05 --- --- 0.01 --- 0.03 0.05 --- --- 0.02 ---Phytase3 0.13 0.13 0.13 0.13 0.13 0.13 0.13 0.13 0.13 0.13 0.13 0.13
Total 100.0 100.0 100.0 100.0 100.0 100.0 100.0 100.0 100.0 100.0 100.0 100.0continued

223
Fin
ish
ing
Nu
tr
itio
n a
nd
Ma
na
ge
me
nt
Table 2. Phase 3 and 4 diet composition (as-fed basis)1
Phase 3 Phase 4NDF, %: 9.3 14.0 14.0 16.4 16.4 18.9 9.3 14.1 14.1 16.5 16.5 18.9
Wheat midds, %: 0 19 0 9.5 19 19 0 19 0 9.5 19 19Ingredient DDGS, %2: 0 0 30 30 15 30 0 0 30 30 15 30Crude fiber, % 2.4 3.2 3.9 4.3 3.9 4.7 2.3 3.1 3.9 4.3 3.9 4.7ADF, %: 3.1 4.4 5.0 5.7 5.4 6.4 3.0 4.3 5.0 5.7 5.3 6.3Standardized ileal digestible (SID) amino acids, %
Lysine 0.68 0.68 0.68 0.68 0.68 0.68 0.62 0.62 0.62 0.62 0.62 0.62Isoleucine:lysine 66 61 75 72 65 70 67 62 77 74 66 72Leucine:lysine 174 158 2 223 187 216 183 166 247 238 198 230Methionine:lysine 30 30 40 39 34 39 32 31 42 42 36 41Met & Cys:lysine 63 62 81 80 71 80 66 65 86 85 75 85Threonine:lysine 62 62 71 69 62 67 65 65 74 71 65 69Tryptophan:lysine 17 17 17 17 17 17 17 17 17 17 17 17Valine:lysine 79 77 95 94 85 93 82 79 99 98 88 97
SID lysine:ME/Mcal 2.03 2.03 2.03 2.03 2.03 2.03 1.85 1.85 1.85 1.85 1.85 1.85ME, kcal/lb 1,520 1,520 1,520 1,520 1,520 1,520 1,520 1,520 1,520 1,520 1,520 1,520Total lysine, % 0.77 0.76 0.82 0.82 0.78 0.81 0.7 0.69 0.76 0.75 0.72 0.75CP, % 13.24 12.89 16.83 16.64 14.65 16.47 12.51 12.16 16.11 15.89 13.91 15.73Ca, % 0.53 0.53 0.53 0.53 0.53 0.53 0.52 0.52 0.52 0.52 0.52 0.52P, % 0.38 0.42 0.43 0.48 0.48 0.53 0.36 0.42 0.42 0.47 0.47 0.52Available P, % 0.22 0.23 0.31 0.34 0.3 0.37 0.21 0.22 0.31 0.34 0.30 0.371 Phase 3 diets were fed from approximately 180 to 230 lb; Phase 4 diets were fed from 230 to 280 lb.2 Dried distillers grains with solubles.3 Phyzyme 600 (Danisco Animal Nutrition, St Louis, MO) provided per pound of diet: 353.8 FTU/lb and 0.11 % available P released.

224
Finishing Nutrition and Management
Table 3. Chemical analysis of dried distillers grains with solubles (DDGS) and wheat middlings (as-fed basis)Item DDGS Wheat middlingsNutrient,%
DM 90.40 89.55CP 24.92 (27.2)1 14.09 (15.9)Fat (oil) 12.21 4.10Crude fiber 5.44 (7.7) 9.55 (7.0)ADF 9.38 (9.9) 12.53 (10.7)NDF 30.44 (25.3) 42.13 (35.6)Ash 6.04 6.47
1 Values in parenthesis indicate those used in diet formulation.
Table 4. Bulk density of experimental diets (as-fed basis)1
TreatmentsNDF, %: 9.2 14.0 14.0 16.4 16.4 18.8
Wheat midds, %: 0 19 0 9.5 19 19Bulk density, lb/bu1, 2 DDGS, %3: 0 0 30 30 15 30 Phase 1 48.9 39.4 46.4 42.1 38.2 37.2 Phase 2 50.4 39.5 46.4 41.5 38.1 36.7 Phase 3 49.0 40.2 44.9 40.8 38.2 36.7 Phase 4 48.3 40.3 44.8 40.7 38.7 38.31 Diet samples collected from the top of each feeder during each phase.2 Phase 1 was d 0 to 23; Phase 2 was d 23 to 43; Phase 3 was d 43 to 64; Phase 4 was d 64 to 87.3 Dried distillers grains with solubles.

225
Fin
ish
ing
Nu
tr
itio
n a
nd
Ma
na
ge
me
nt
Table 5. Effects of dietary NDF on finishing pig growth performance and carcass characteristics1
Treatment: 1 2 3 4 5 6NDF, %: 9.2 14 14 16.4 16.4 18.8
Wheat midds, %: 0 19 0 9.5 19 19DDGS, %2: 0 0 30 30 15 30 SEM
Initial wt, lb 83.6 83.6 83.6 83.7 83.7 83.6 1.68Day 0 to 87
ADG, lb 2.34 2.24 2.44 2.38 2.26 2.23 0.03ADFI, lb 6.41 6.37 6.61 6.46 6.32 6.48 0.12F/G 2.74 2.85 2.71 2.72 2.79 2.91 0.04
Final wt, lb 286.2 278.0 293.1 291.8 278.5 276.8 2.85Carcass characteristics3
Carcass yield, %4 73.8 72.2 71.9 71.5 72.2 72.4 0.69HCW, lb 209.3 201.0 210.9 209.4 202.1 200.5 2.53Backfat depth, in. 3 0.95 0.97 0.99 0.90 0.91 0.94 0.03Loin depth, in. 3 2.33 2.32 2.29 2.26 2.32 2.33 0.03Lean, %3 50.98 50.75 50.47 51.09 51.28 50.98 0.38Jowl iodine value (IV) 68.20 70.29 74.56 76.99 73.39 76.60 0.42
1 A total of 288 pigs (TR4 × 1050, Initial BW= 83.6 lb) were used in this 87-d study with 8 pigs per pen and 6 pens per treatment.2 Dried distillers grains with solubles.3 Carcass characteristics other than yield and IV were adjusted using HCW as a covariate.4 Percentage yield was calculated by dividing HCW by live weight obtained at the farm before transport to the packing plant.

226
Fin
ish
ing
Nu
tr
itio
n a
nd
Ma
na
ge
me
nt
Table 6. Main effects of dietary NDF on finishing pig growth performance and carcass characteristics1
Probability, P <
Main effectsWheat middlings
(midds) DDGS2 NDFInteraction3 Midds4 DDGS5 Linear6 Quadratic6 Linear7 Quadratic7 Linear8 Quadratic8
Initial wt, lb 1.00 1.00 0.99 1.00 0.96 0.99 0.96 0.98 0.99Day 0 to 87
ADG, lb 0.12 <0.001 0.16 <0.001 0.28 0.90 0.48 0.04 0.07ADFI, lb 0.71 0.49 0.19 0.45 0.57 0.50 0.46 0.89 0.88F/G 0.28 <0.001 0.68 0.001 0.06 0.29 0.08 0.02 0.10
Final wt, lb 0.16 <0.001 0.32 <0.001 0.06 0.77 0.74 0.07 0.08Carcass characteristics9
Carcass yield, %10 0.09 0.37 0.17 0.52 0.29 0.78 0.89 0.06 0.07HCW, lb 0.68 <0.001 0.82 0.007 0.24 0.89 0.66 0.04 0.49Backfat depth, in. 9 0.35 0.76 0.86 0.42 0.10 0.59 0.25 0.40 0.65Loin depth, in. 9 0.36 0.65 0.52 0.36 0.15 0.85 0.98 0.65 0.27Lean, %9 0.32 0.76 0.71 0.39 0.43 0.66 0.36 0.68 0.49Jowl iodine value (IV) 0.95 <0.001 <0.001 0.002 0.01 <0.001 0.91 <0.001 0.78
1 A total of 288 pigs (TR4 × 1050, initial BW= 83.6 lb) were used in an 87-d study.2 Dried distillers grains with solubles.3 Interaction effect of midds × DDGS was tested using treatments 1 and 6 vs. 2 and 3.4 Main effect of adding midds was tested using treatments 1 and 3 vs. 2 and 6.
5 Main effect of adding DDGS was tested using treatments 1 and 2 vs. 3 and 6.6 Linear and quadratic effects of midds level (0%, 9.5%, and 19%) were tested using treatments 3, 4, and 6.7 Linear and quadratic effects of DDGS level (0%, 15%, and 30%) were tested using treatments 2, 5, and 6.8 Linear and quadratic effects of NDF level (9.2%, 14.0%, 16.4%, and 18.8%) were tested using treatment 1, an average of 2 and 3, an average of 4 and 5, and 6.9 Carcass characteristics other than yield and IV were adjusted using HCW as a covariate.10 Percentage yield was calculated by dividing HCW by live weight obtained at the farm before transport to the packing plant.
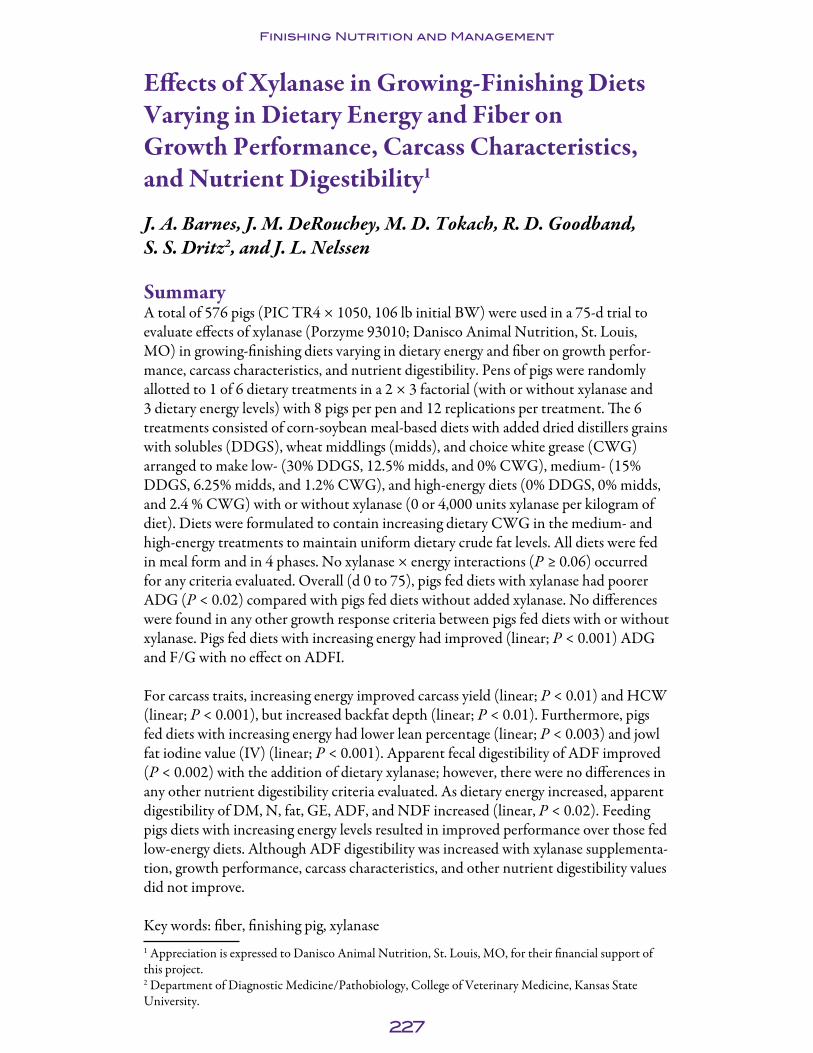
227
Finishing Nutrition and Management
Effects of Xylanase in Growing-Finishing Diets Varying in Dietary Energy and Fiber on Growth Performance, Carcass Characteristics, and Nutrient Digestibility1
J. A. Barnes, J. M. DeRouchey, M. D. Tokach, R. D. Goodband, S. S. Dritz2, and J. L. Nelssen
SummaryA total of 576 pigs (PIC TR4 × 1050, 106 lb initial BW) were used in a 75-d trial to evaluate effects of xylanase (Porzyme 93010; Danisco Animal Nutrition, St. Louis, MO) in growing-finishing diets varying in dietary energy and fiber on growth perfor-mance, carcass characteristics, and nutrient digestibility. Pens of pigs were randomly allotted to 1 of 6 dietary treatments in a 2 × 3 factorial (with or without xylanase and 3 dietary energy levels) with 8 pigs per pen and 12 replications per treatment. The 6 treatments consisted of corn-soybean meal-based diets with added dried distillers grains with solubles (DDGS), wheat middlings (midds), and choice white grease (CWG) arranged to make low- (30% DDGS, 12.5% midds, and 0% CWG), medium- (15% DDGS, 6.25% midds, and 1.2% CWG), and high-energy diets (0% DDGS, 0% midds, and 2.4 % CWG) with or without xylanase (0 or 4,000 units xylanase per kilogram of diet). Diets were formulated to contain increasing dietary CWG in the medium- and high-energy treatments to maintain uniform dietary crude fat levels. All diets were fed in meal form and in 4 phases. No xylanase × energy interactions (P ≥ 0.06) occurred for any criteria evaluated. Overall (d 0 to 75), pigs fed diets with xylanase had poorer ADG (P < 0.02) compared with pigs fed diets without added xylanase. No differences were found in any other growth response criteria between pigs fed diets with or without xylanase. Pigs fed diets with increasing energy had improved (linear; P < 0.001) ADG and F/G with no effect on ADFI.
For carcass traits, increasing energy improved carcass yield (linear; P < 0.01) and HCW (linear; P < 0.001), but increased backfat depth (linear; P < 0.01). Furthermore, pigs fed diets with increasing energy had lower lean percentage (linear; P < 0.003) and jowl fat iodine value (IV) (linear; P < 0.001). Apparent fecal digestibility of ADF improved (P < 0.002) with the addition of dietary xylanase; however, there were no differences in any other nutrient digestibility criteria evaluated. As dietary energy increased, apparent digestibility of DM, N, fat, GE, ADF, and NDF increased (linear, P < 0.02). Feeding pigs diets with increasing energy levels resulted in improved performance over those fed low-energy diets. Although ADF digestibility was increased with xylanase supplementa-tion, growth performance, carcass characteristics, and other nutrient digestibility values did not improve.
Key words: fiber, finishing pig, xylanase 1 Appreciation is expressed to Danisco Animal Nutrition, St. Louis, MO, for their financial support of this project.2 Department of Diagnostic Medicine/Pathobiology, College of Veterinary Medicine, Kansas State University.

228
Finishing Nutrition and Management
IntroductionDuring fermentation and milling processing of corn and wheat to produce DDGS and midds, the majority of the starch fraction is removed from the kernel. Thus, remain-ing components, such as fiber, increase in concentration. Both midds and DDGS have higher crude fiber content than corn, thus both contain more arabino-xylans. Arabino-xylans are hydrophilic non-starch polysaccharides (NSP) found in grain as minor constituents in the cell wall that act as anti-nutritional factors. Because swine do not digest NSP efficiently due to their lack of specific digestive enzymes, the dietary energy content of most grain by-products is lower than the parent grain. Under these condi-tions, endogenous enzymes such as xylanase may be supplemented into diets to make nutrients more available.
Xylanase is a carbohydrase, which is able to break some insoluble bonds that monogas-tric animals are otherwise unable to digest (Sugimoto and Van Buren, 19703). Xylanase has also been successful in increasing nutrient digestibility of swine diets (Nortey et al., 20084), but because corn is highly digestible and low in fiber, xylanase has not consis-tently shown improvements in growth performance when used in corn-based diets (Kim et al., 20035). Therefore, xylanase may be more beneficial in corn-soybean meal-based diets when containing ingredients such as DDGS and midds. The objective of this study was to evaluate xylanase in corn-soybean meal-based diets varying in dietary energy and fiber on growth performance, carcass characteristics, and nutrient digestibility of grow-finish pigs.
ProceduresThe Institutional Animal Care and Use Committees at Kansas State University and Danisco Animal Nutrition approved protocols used in this experiment. This experi-ment was conducted at the K-State Swine Teaching Research Center finishing barn.
The facility was a totally enclosed, environmentally controlled, mechanically ventilated barn. The barn had 2 identical rooms containing 40 pens each. Each pen was equipped with a Farmweld (Teutopolis, IL) single-sided, dry self-feeder with 2 eating spaces in the fence line and a cup waterer. Pens were located over a completely slatted concrete floor with a 4-ft-deep pit underneath for manure storage. The facility was also equipped with an automated feeding system (FeedPro; Feedlogic Corp., Willmar, MN) capable of delivering and recording diets as specified on an individual pen basis.
Animals and Diets. Two groups of finishing pigs were used to complete this experi-ment. The first group of pigs was fed from April through June 2010, and the second group was fed from May through July 2010. Both groups were fed 4-phase diets with the same time duration for each phase.
3 Sugimoto, H., and J. P. Van Buren. 1970. Removal of oligosaccharides from soy milk by an enzyme from Aspergillussaitoi. J. Food Sci. 35:655-660.4 Nortey, T. N., J. F. Patience, J. S. Sands, N. L. Trottier, and R. T. Zijlstra. 2008. Effects of xylanase supplementation on the apparent digestibility and digestible content of energy, amino acids, phosphorus, and calcium in wheat and wheat by-products from dry milling fed to grower pigs. J. Anim. Sci. 86:3450-3464.5 Kim, S.W., D. A. Knabe, K. J. Hong, and R. A. Easter. 2003. Use of carbohydrases in corn-soybean meal-based nursery diets. J. Anim. Sci. 81:2496-2504.

229
Finishing Nutrition and Management
A total of 576 pigs (TR4 × 1050: PIC Hendersonville, TN; 106 lb initial BW) were used and stocked with 8 pigs (4 barrows and 4 gilts) in each pen. All pigs were assigned to pens by balanced initial BW and gender and were randomly allotted to 1 of 6 dietary treatments in a 2 × 3 factorial design with 12 replications per treatment in a 75-d experiment. The 6 treatments consisted of corn-soybean meal-based diets with DDGS, midds, and CWG to make low- (30% DDGS, 12.5% midds, and 0% CWG), medium- (15% DDGS, 6.25% midds, and 1.2% CWG), and high-energy diets (0% DDGS, 0% midds, and 2.4 % CWG), with or without xylanase (0 or 4000 units of xylanase per kilogram of diet; Porzyme 93010). Diets were formulated to contain increasing dietary CWG in the medium- and high-energy treatments to maintain uniform dietary crude fat levels. All diets were fed in meal form and pigs were fed in 4 phases from approxi-mately 106 to 141, 141 to 181, 181 to 202, and 202 to 270 lb BW for Phases 1 through 4, respectively (Tables 1 and 2). Pigs were allowed ad libitum access to food and water. Diets were formulated to meet all requirements recommended by NRC (19986).
Pigs and feeders were weighed on d 0, 17, 35, 52, and 75 to calculate ADG, ADFI, and F/G. Feed intake and F/G were determined from feed delivery data generated through the automated feeding system and the amount of feed remaining in each pen’s feeder on every weigh date.
On d 75, pigs were weighed and transported to a commercial processing plant (Triumph Foods LLC, St. Joseph, MO). Each pig had been individually tattooed according to pen number to allow for data retrieval by pen and carcass data collection at the packing plant. Hot carcass weights were measured immediately after evisceration and each carcass was evaluated for backfat, loin depth, and lean percentage. Fat depth and loin depth were measured with an optical probe inserted between the 3rd and 4th last rib (counting from the ham end of the carcass) at a distance approximately 2.8 in. from the dorsal midline. Lean percentage was provided from the packing plant by using a proprietary equation. Jowl samples were collected and analyzed by Near Infrared Spectroscopy (NIR; Bruker MPA; Multi Purpose Analyzer) for fat IV. Percentage yield was calculated by dividing HCW by live weight obtained before transport to the pack-ing plant.
Chemical Analysis. Feces samples were collected on d 7 of phase 3 (d 42 of trial) via rectal massage from at least 4 pigs/pen. All Phase 3 diets contained 0.5% chromic oxide as the digestibility marker. Samples of feces were stored in a freezer (-4°F) until they were then thawed and homogenized within each pen. Fecal samples were then dried at 122ºF in a forced-air oven then ground for analysis of bomb calorimetry and chromium concentration.
Gross energy of diets and ground fecal samples were determined with an adiabatic bomb calorimeter (Parr Instruments, Moline, IL). Diets and ground fecal samples were also analyzed for chromium concentration with an atomic absorption spectrometer.
Samples of corn, soybean meal, DDGS (Abengoa, York, NE), and midds (Archer Daniels Midland, Lincoln, NE) were collected at the time of feed manufacture and a composite sample was analyzed for moisture, CP, crude fat, crude fiber, ash, Ca, and
6 NRC. 1998. Nutrient Requirements of Swine. 10th ed. Natl. Acad. Press, Washington, DC.

230
Finishing Nutrition and Management
P at Danisco Animal Nutrition Laboratory. A complete amino acid profile was also conducted at the University of Missouri Agricultural Experiment Station Chemical laboratories (Columbia, MO).
Diet samples were collected from each feeder and combined for a single composite sample by treatment for each phase to measure moisture, CP, crude fat, crude fiber, ash, Ca, P, and bulk density (Seedburo Model 8800, Seedburo Equipment, Chicago, IL). Fecal samples were also analyzed for moisture, CP, crude fat, crude fiber, ash, Ca, and P.
Xylanase activity was analyzed at Danisco Animal Nutrition Laboratory in which 1 unit of xylanase activity (XU) is defined as the amount of xylanase that will liberate 0.5 µmol of reducing sugars (expressed as xylose equivalents) from a cross-linked oat spelt xylan substrate (at pH 5.3 and 122°F in 1 min).
Statistical Analysis. Data were analyzed as a 2 × 3 factorial using the PROC-MIXED procedure in SAS (SAS Institute, Inc., Cary, NC) with pen as the experimental unit. Linear and quadratic polynomial contrasts were conducted to determine effects of increasing dietary energy. Because HCW differed with treatments, it was used as a covariate for backfat, loin depth, and percentage lean. Results were considered signifi-cant at P ≤ 0.05.
Results and DiscussionChemical analysis. Ingredient samples of corn, DDGS, midds, and SBM were found to be generally similar to those used in formulation (Table 3). The minor differences would not be expected to influence the results of the experiment. Nutrient analysis of the treatment diets showed that for most of the nutrients, the levels were similar to formulated values (Tables 4 and 5). The only exception was crude fat, where all values were lower than expected, especially for the high-energy diets where the greatest level of CWG was added.
Treatment diets containing xylanase were formulated to contain 4,000 units of xyla-nase activity per kilogram of diet. Chemical analysis revealed some variation in dietary xylanase activity. On average, most of the treatments tested slightly below formulated levels. As midds and DDGS were added to the diets in increasing amounts, dietary bulk density was decreased as expected.
Growth and Carcass. No xylanase × energy interactions occurred for any growth performance criteria evaluated (Table 6); thus, for overall (d 0 to 75) main effects, pigs fed diets with xylanase had poorer (P < 0.02) ADG compared with pigs fed diets without added xylanase (Table 7), but no differences were found among treatments for ADFI or F/G. Pigs fed diets with increasing energy had improved (linear; P <0.001) ADG and F/G, with no change in ADFI. Due to the improvement in ADG from increasing diet energy, final BW was also increased (linear, P < 0.01).
There were no xylanase × energy interactions for any carcass criteria evaluated. Pigs fed diets with increased energy had improved yield (linear; P < 0.01) and HCW (linear; P < 0.001), but also had increased backfat depth (linear; P < 0.001). Furthermore, pigs fed diets with increased energy had lower lean percentage (linear; P < 0.003) and jowl

231
Finishing Nutrition and Management
fat IV (linear; P < 0.001). The lower IV with increasing dietary energy was due to the changing composition of the dietary fat from more to less polyunsaturated fat sources whereas the crude fat content of the diets was similar across treatments. Additionally, dietary energy did not affect loin depth. Adding xylanase to the diet did not influence carcass characteristics.
Nutrient Digestibility. No significant xylanase × energy interactions occurred for apparent digestibility in this study (Table 8). Thus, for the main effects, apparent fecal digestibility of ADF improved (P < 0.002) with the addition of dietary xylanase (Table 9); however, no differences occurred in any other nutrient digestibility criteria evaluated. Also, as dietary energy increased, apparent digestibility of DM, N, fat, GE, ADF, and NDF increased (linear, P < 0.02).
Although ADF digestibility increased with xylanase supplementation, growth perfor-mance, carcass characteristics, and other nutrient digestibility values did not improve. As expected, pigs fed diets of increasing dietary energy had improved performance compared with pigs fed low-energy diets. Due to the varied response to xylanase in different trials, more research is needed to further explain its mode of action and how it can affect finishing pig performance.
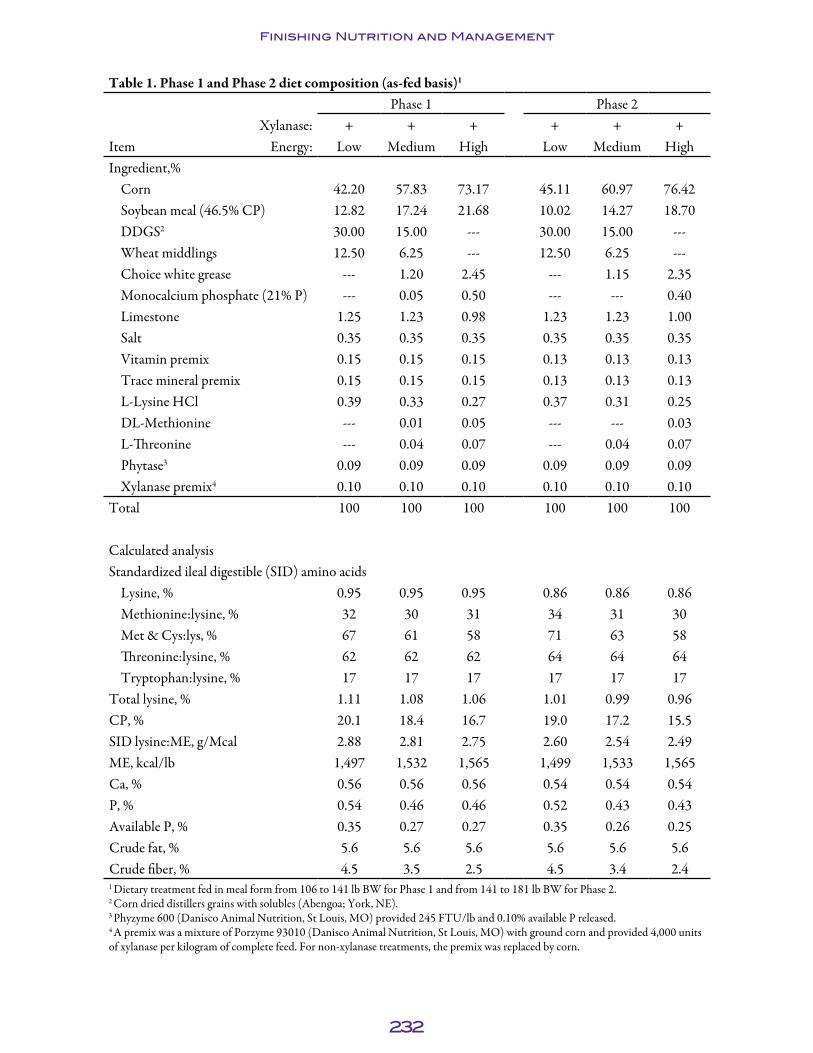
232
Finishing Nutrition and Management
Table 1. Phase 1 and Phase 2 diet composition (as-fed basis)1
Phase 1 Phase 2Xylanase: + + + + + +
Item Energy: Low Medium High Low Medium HighIngredient,%
Corn 42.20 57.83 73.17 45.11 60.97 76.42Soybean meal (46.5% CP) 12.82 17.24 21.68 10.02 14.27 18.70DDGS2 30.00 15.00 --- 30.00 15.00 ---Wheat middlings 12.50 6.25 --- 12.50 6.25 ---Choice white grease --- 1.20 2.45 --- 1.15 2.35Monocalcium phosphate (21% P) --- 0.05 0.50 --- --- 0.40Limestone 1.25 1.23 0.98 1.23 1.23 1.00Salt 0.35 0.35 0.35 0.35 0.35 0.35Vitamin premix 0.15 0.15 0.15 0.13 0.13 0.13Trace mineral premix 0.15 0.15 0.15 0.13 0.13 0.13L-Lysine HCl 0.39 0.33 0.27 0.37 0.31 0.25DL-Methionine --- 0.01 0.05 --- --- 0.03L-Threonine --- 0.04 0.07 --- 0.04 0.07Phytase3 0.09 0.09 0.09 0.09 0.09 0.09Xylanase premix4 0.10 0.10 0.10 0.10 0.10 0.10
Total 100 100 100 100 100 100
Calculated analysisStandardized ileal digestible (SID) amino acids
Lysine, % 0.95 0.95 0.95 0.86 0.86 0.86Methionine:lysine, % 32 30 31 34 31 30Met & Cys:lys, % 67 61 58 71 63 58Threonine:lysine, % 62 62 62 64 64 64Tryptophan:lysine, % 17 17 17 17 17 17
Total lysine, % 1.11 1.08 1.06 1.01 0.99 0.96CP, % 20.1 18.4 16.7 19.0 17.2 15.5SID lysine:ME, g/Mcal 2.88 2.81 2.75 2.60 2.54 2.49ME, kcal/lb 1,497 1,532 1,565 1,499 1,533 1,565Ca, % 0.56 0.56 0.56 0.54 0.54 0.54P, % 0.54 0.46 0.46 0.52 0.43 0.43Available P, % 0.35 0.27 0.27 0.35 0.26 0.25Crude fat, % 5.6 5.6 5.6 5.6 5.6 5.6Crude fiber, % 4.5 3.5 2.5 4.5 3.4 2.41 Dietary treatment fed in meal form from 106 to 141 lb BW for Phase 1 and from 141 to 181 lb BW for Phase 2.2 Corn dried distillers grains with solubles (Abengoa; York, NE).3 Phyzyme 600 (Danisco Animal Nutrition, St Louis, MO) provided 245 FTU/lb and 0.10% available P released.4 A premix was a mixture of Porzyme 93010 (Danisco Animal Nutrition, St Louis, MO) with ground corn and provided 4,000 units of xylanase per kilogram of complete feed. For non-xylanase treatments, the premix was replaced by corn.

233
Finishing Nutrition and Management
Table 2. Phase 3 and Phase 4 diet composition (as-fed basis)1
Phase 3 Phase 4Xylanase: + + + + + +
Item Energy: Low Medium High Low Medium HighIngredient,%
Corn 46.90 62.60 78.12 49.79 65.59 81.12Soybean meal (46.5% CP) 7.81 12.22 16.64 5.51 9.84 14.27DDGS2 30.00 15.00 --- 30.00 15.00 ---Wheat middlings 12.50 6.25 --- 12.50 6.25 ---Choice white grease --- 1.20 2.35 --- 1.20 2.40Monocalcium phosphate (21% P) --- --- 0.35 --- --- 0.30Limestone 1.23 1.20 1.03 1.23 1.20 1.03Salt 0.35 0.35 0.35 0.35 0.35 0.35Vitamin premix 0.10 0.10 0.10 0.08 0.08 0.08Trace mineral premix 0.10 0.10 0.10 0.08 0.08 0.08L-Lysine HCl 0.34 0.28 0.22 0.29 0.24 0.18DL-Methionine --- --- 0.03 --- --- 0.02L-Threonine --- 0.02 0.05 --- --- 0.03Phytase3 0.09 0.09 0.09 0.09 0.09 0.09Xylanase premix4 0.10 0.10 0.10 0.10 0.10 0.10Chromic oxide 0.50 0.50 0.50 --- --- ---
Total 100.0 100.0 100.0 100.0 100.0 100.0
Calculated analysisStandardized ileal digestible (SID) amino acids
Lysine, % 0.78 0.78 0.78 0.69 0.69 0.69Methionine:lysine, % 37 32 30 40 35 31Met & Cys:lys, % 75 67 60 82 73 63Threonine:lysine, % 66 65 65 71 66 66Tryptophan:lysine, % 17 17 18 18 18 18
Total lys, % 0.93 0.90 0.88 0.83 0.81 0.78CP, % 18.1 16.4 14.6 17.2 15.5 13.7SID lysine:ME, g/Mcal 2.37 2.32 2.27 2.09 2.04 1.99ME, kcal/lb 1,492 1,528 1,560 1,501 1,536 1,569Ca, % 0.53 0.53 0.53 0.52 0.52 0.52P, % 0.51 0.42 0.41 0.51 0.42 0.39Available P, % 0.35 0.25 0.23 0.34 0.25 0.22Crude fat, % 5.7 5.7 5.7 5.8 5.8 5.8Crude fiber, % 4.4 3.4 2.4 4.4 3.4 2.31 Dietary treatment fed in meal form from 181 to 202 lb BW for phase 3 and from 202 to 270 lb for Phase 4.2 Corn dried distillers grains with solubles (Abengoa; York, NE).3 Phyzyme 600 (Danisco Animal Nutrition, St Louis, MO) provided 245 FTU/lb and 0.10% available P released. 4 A premix was a mixture of Porzyme 93010 (Danisco Animal Nutrition, St Louis, MO) with ground corn and provided 4,000 units of xylanase per kilogram of complete feed. For non-xylanase treatments, the premix was replaced by corn.
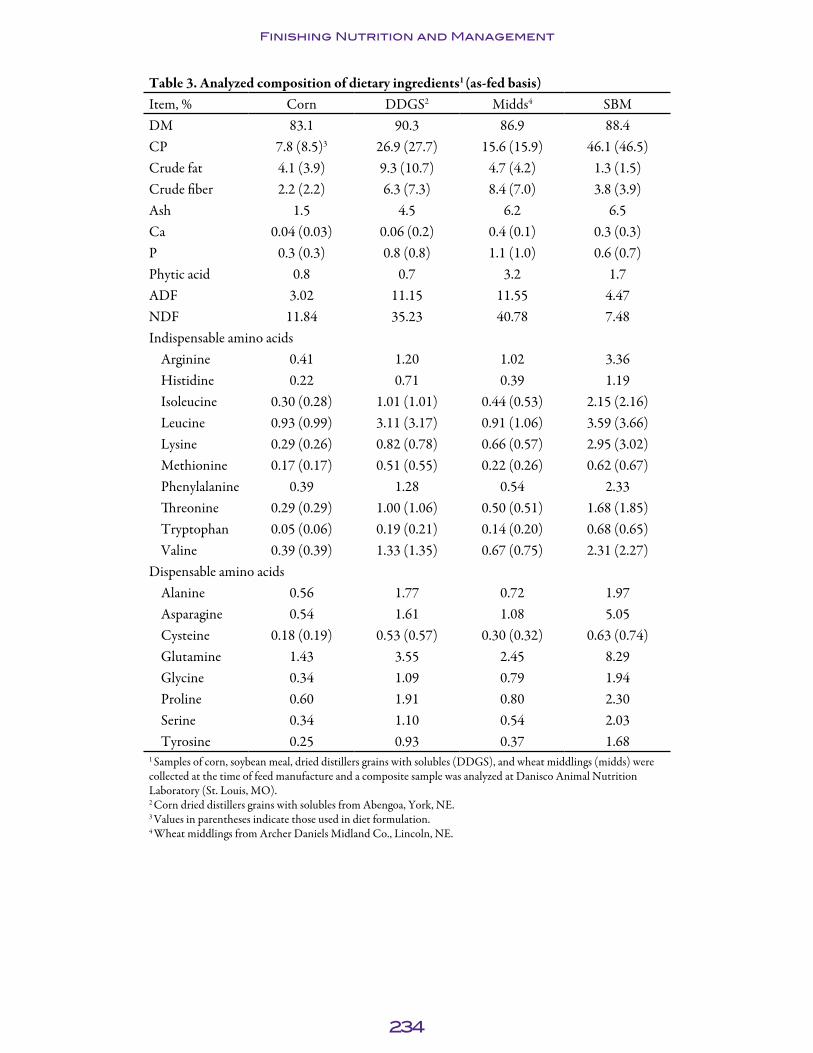
234
Finishing Nutrition and Management
Table 3. Analyzed composition of dietary ingredients1 (as-fed basis)Item, % Corn DDGS2 Midds4 SBMDM 83.1 90.3 86.9 88.4CP 7.8 (8.5)3 26.9 (27.7) 15.6 (15.9) 46.1 (46.5)Crude fat 4.1 (3.9) 9.3 (10.7) 4.7 (4.2) 1.3 (1.5)Crude fiber 2.2 (2.2) 6.3 (7.3) 8.4 (7.0) 3.8 (3.9)Ash 1.5 4.5 6.2 6.5Ca 0.04 (0.03) 0.06 (0.2) 0.4 (0.1) 0.3 (0.3)P 0.3 (0.3) 0.8 (0.8) 1.1 (1.0) 0.6 (0.7)Phytic acid 0.8 0.7 3.2 1.7ADF 3.02 11.15 11.55 4.47NDF 11.84 35.23 40.78 7.48Indispensable amino acids
Arginine 0.41 1.20 1.02 3.36Histidine 0.22 0.71 0.39 1.19Isoleucine 0.30 (0.28) 1.01 (1.01) 0.44 (0.53) 2.15 (2.16)Leucine 0.93 (0.99) 3.11 (3.17) 0.91 (1.06) 3.59 (3.66)Lysine 0.29 (0.26) 0.82 (0.78) 0.66 (0.57) 2.95 (3.02)Methionine 0.17 (0.17) 0.51 (0.55) 0.22 (0.26) 0.62 (0.67)Phenylalanine 0.39 1.28 0.54 2.33Threonine 0.29 (0.29) 1.00 (1.06) 0.50 (0.51) 1.68 (1.85)Tryptophan 0.05 (0.06) 0.19 (0.21) 0.14 (0.20) 0.68 (0.65)Valine 0.39 (0.39) 1.33 (1.35) 0.67 (0.75) 2.31 (2.27)
Dispensable amino acidsAlanine 0.56 1.77 0.72 1.97Asparagine 0.54 1.61 1.08 5.05Cysteine 0.18 (0.19) 0.53 (0.57) 0.30 (0.32) 0.63 (0.74)Glutamine 1.43 3.55 2.45 8.29Glycine 0.34 1.09 0.79 1.94Proline 0.60 1.91 0.80 2.30Serine 0.34 1.10 0.54 2.03Tyrosine 0.25 0.93 0.37 1.68
1 Samples of corn, soybean meal, dried distillers grains with solubles (DDGS), and wheat middlings (midds) were collected at the time of feed manufacture and a composite sample was analyzed at Danisco Animal Nutrition Laboratory (St. Louis, MO).2 Corn dried distillers grains with solubles from Abengoa, York, NE.3 Values in parentheses indicate those used in diet formulation.4 Wheat middlings from Archer Daniels Midland Co., Lincoln, NE.
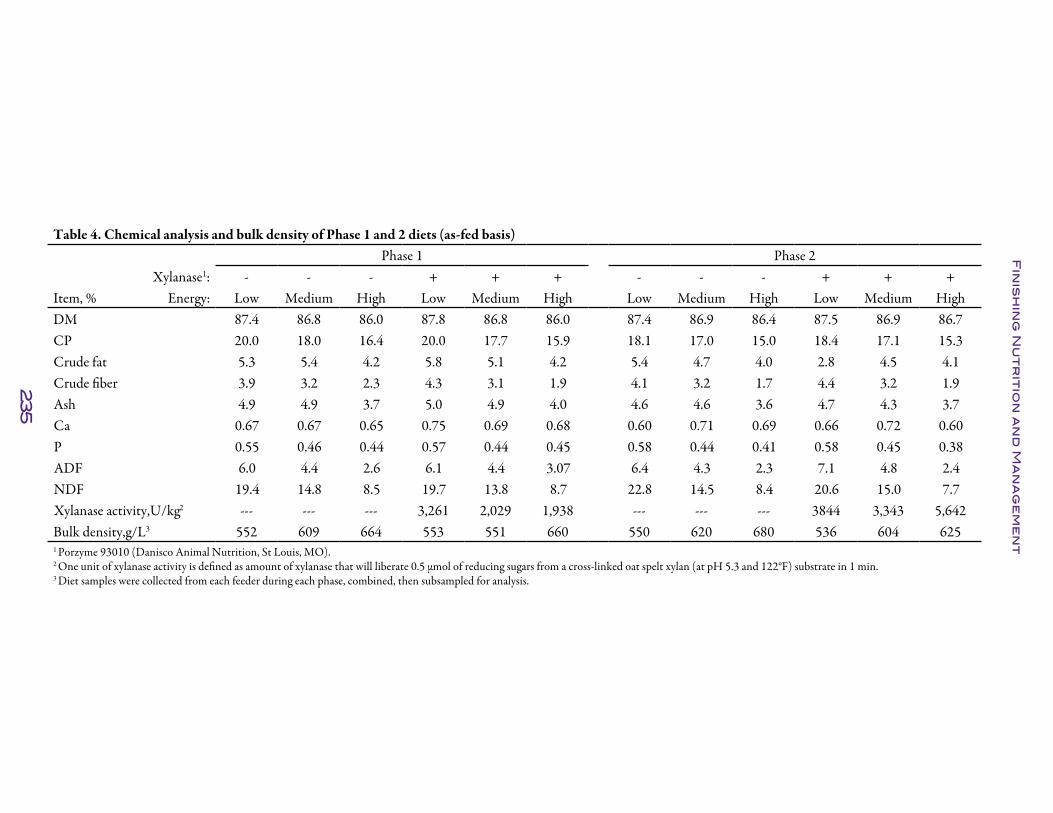
235
Fin
ish
ing
Nu
tr
itio
n a
nd
Ma
na
ge
me
nt
Table 4. Chemical analysis and bulk density of Phase 1 and 2 diets (as-fed basis)Phase 1 Phase 2
Xylanase1: - - - + + + - - - + + +Item, % Energy: Low Medium High Low Medium High Low Medium High Low Medium HighDM 87.4 86.8 86.0 87.8 86.8 86.0 87.4 86.9 86.4 87.5 86.9 86.7CP 20.0 18.0 16.4 20.0 17.7 15.9 18.1 17.0 15.0 18.4 17.1 15.3Crude fat 5.3 5.4 4.2 5.8 5.1 4.2 5.4 4.7 4.0 2.8 4.5 4.1Crude fiber 3.9 3.2 2.3 4.3 3.1 1.9 4.1 3.2 1.7 4.4 3.2 1.9Ash 4.9 4.9 3.7 5.0 4.9 4.0 4.6 4.6 3.6 4.7 4.3 3.7Ca 0.67 0.67 0.65 0.75 0.69 0.68 0.60 0.71 0.69 0.66 0.72 0.60P 0.55 0.46 0.44 0.57 0.44 0.45 0.58 0.44 0.41 0.58 0.45 0.38ADF 6.0 4.4 2.6 6.1 4.4 3.07 6.4 4.3 2.3 7.1 4.8 2.4NDF 19.4 14.8 8.5 19.7 13.8 8.7 22.8 14.5 8.4 20.6 15.0 7.7Xylanase activity,U/kg2 --- --- --- 3,261 2,029 1,938 --- --- --- 3844 3,343 5,642Bulk density,g/L3 552 609 664 553 551 660 550 620 680 536 604 6251 Porzyme 93010 (Danisco Animal Nutrition, St Louis, MO).2 One unit of xylanase activity is defined as amount of xylanase that will liberate 0.5 µmol of reducing sugars from a cross-linked oat spelt xylan (at pH 5.3 and 122°F) substrate in 1 min.3 Diet samples were collected from each feeder during each phase, combined, then subsampled for analysis.

236
Fin
ish
ing
Nu
tr
itio
n a
nd
Ma
na
ge
me
nt
Table 5. Chemical analysis and bulk density of Phase 3 and 4 diets (as-fed basis)Phase 3 Phase 4
Xylanase1: - - - + + + - - - + + +Item, % Energy: Low Medium High Low Medium High Low Medium High Low Medium HighDM 87.0 86.5 85.9 87.0 86.7 86.0 88.0 87.0 86.5 87.4 87.1 86.3CP 17.2 16.2 14.2 18.3 16.1 14.8 16.9 14.8 12.6 16.6 14.9 13.0Crude fat 5.4 5.4 4.3 5.5 4.7 3.8 5.4 4.6 4.4 5.1 4.5 3.7Crude fiber 3.8 3.0 1.8 4.2 2.9 1.8 3.8 2.9 1.9 3.6 2.7 1.9Ash 5.1 4.5 3.8 4.9 4.3 4.0 5.3 4.3 3.4 4.5 3.9 3.4Ca 0.77 0.59 0.54 0.66 0.67 0.59 0.87 0.66 0.59 0.66 0.67 0.58P 0.54 0.42 0.40 0.53 0.43 0.40 0.54 0.39 0.37 0.54 0.42 0.42ADF 5.96 4.45 2.66 --- --- --- 6.18 4.23 2.26 --- --- ---NDF 19.30 13.48 8.32 --- --- --- 18.72 13.87 8.31 --- --- ---Xylanase activity, U/kg2 --- --- --- 4,787 3,879 3,211 --- --- --- 3,745 3,279 6,198Bulk density, g/L3 552 609 669 566 604 663 554 599 652 545 582 6511 Porzyme 93010 (Danisco Animal Nutrition, St Louis, MO).2 One unit of xylanase activity is defined as amount of xylanase that will liberate 0.5 µmol of reducing sugars from a cross-linked oat spelt xylan (at pH 5.3 and 122°F) substrate in 1 min.3 Diet samples were collected from each feeder during each phase, combined, then subsampled for analysis.

23
7
Fin
ish
ing
Nu
tr
itio
n a
nd
Ma
na
ge
me
nt
Table 6. Interactive effects of dietary xylanase and energy on finishing pig growth performance and carcass characteristics1
Xylanase2: - - - + + + Probability, P <Energy: Low Medium High Low Medium High SEM Xylanase × energy
Initial wt, lb 106.0 106.1 106.1 106.0 106.1 106.1 2.34 1.00d 0 to 75
ADG, lb 2.13 2.20 2.24 2.11 2.17 2.21 0.02 0.33ADFI, lb 6.47 6.36 6.36 6.29 6.37 6.35 0.07 0.59F/G 3.04 2.90 2.84 2.99 2.94 2.87 0.03 0.21Final wt, lb 266.9 272.3 275.1 265.1 267.2 273.3 3.58 1.00
Carcass characteristicsYield, %3 72.1 73.5 73.4 72.7 72.4 73.4 0.43 0.14HCW, lb 192.4 200.0 201.9 192.6 193.8 200.6 2.40 0.40Backfat depth, in.4 0.77 0.82 0.85 0.77 0.81 0.85 0.25 0.88Loin depth, in.4 2.34 2.37 2.32 2.34 2.30 2.38 0.28 0.06Lean, %4 52.8 52.5 51.9 52.9 52.3 52.3 0.003 0.39Jowl fat iodine value 76.0 72.7 69.2 75.5 72.2 69.1 0.36 0.78
1 576 pigs (PIC TR4 × 1050; 106 lb initial BW) were used in a 75-d study with 8 pigs per pen and 12 pens per treatment.2 Porzyme 93010 (Danisco Animal Nutrition, St Louis, MO).3 Percentage yield was calculated by dividing HCW by live weight obtained before transport to the packing plant.4 Data analyzed using HCW value as a covariate.
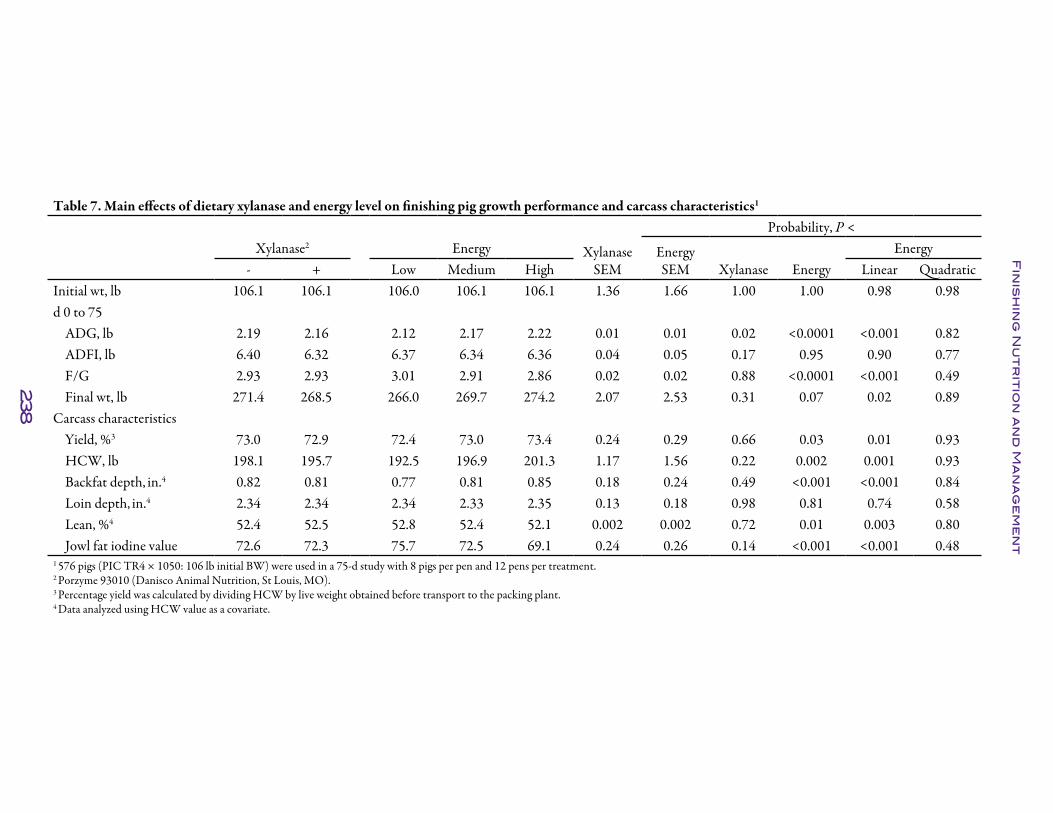
238
Fin
ish
ing
Nu
tr
itio
n a
nd
Ma
na
ge
me
nt
Table 7. Main effects of dietary xylanase and energy level on finishing pig growth performance and carcass characteristics1
Probability, P <Xylanase2 Energy Xylanase
SEMEnergySEM
Energy- + Low Medium High Xylanase Energy Linear Quadratic
Initial wt, lb 106.1 106.1 106.0 106.1 106.1 1.36 1.66 1.00 1.00 0.98 0.98d 0 to 75
ADG, lb 2.19 2.16 2.12 2.17 2.22 0.01 0.01 0.02 <0.0001 <0.001 0.82ADFI, lb 6.40 6.32 6.37 6.34 6.36 0.04 0.05 0.17 0.95 0.90 0.77F/G 2.93 2.93 3.01 2.91 2.86 0.02 0.02 0.88 <0.0001 <0.001 0.49Final wt, lb 271.4 268.5 266.0 269.7 274.2 2.07 2.53 0.31 0.07 0.02 0.89
Carcass characteristicsYield, %3 73.0 72.9 72.4 73.0 73.4 0.24 0.29 0.66 0.03 0.01 0.93HCW, lb 198.1 195.7 192.5 196.9 201.3 1.17 1.56 0.22 0.002 0.001 0.93Backfat depth, in.4 0.82 0.81 0.77 0.81 0.85 0.18 0.24 0.49 <0.001 <0.001 0.84Loin depth, in.4 2.34 2.34 2.34 2.33 2.35 0.13 0.18 0.98 0.81 0.74 0.58Lean, %4 52.4 52.5 52.8 52.4 52.1 0.002 0.002 0.72 0.01 0.003 0.80Jowl fat iodine value 72.6 72.3 75.7 72.5 69.1 0.24 0.26 0.14 <0.001 <0.001 0.48
1 576 pigs (PIC TR4 × 1050: 106 lb initial BW) were used in a 75-d study with 8 pigs per pen and 12 pens per treatment.2 Porzyme 93010 (Danisco Animal Nutrition, St Louis, MO).3 Percentage yield was calculated by dividing HCW by live weight obtained before transport to the packing plant.4 Data analyzed using HCW value as a covariate.

239
Fin
ish
ing
Nu
tr
itio
n a
nd
Ma
na
ge
me
nt
Table 8. Interactive effects of dietary xylanase and energy on finishing pig apparent total tract digestibility1
Xylanase2: - - - + + + Probability, P <Item, % Energy: Low Medium High Low Medium High SEM Xylanase × energy DM 72.5 78.5 82.6 74.6 78.7 83.2 1.35 0.59 N 69.6 72.5 76.9 72.3 70.4 77.8 1.81 0.26 Fat 42.4 52.0 49.9 45.7 49.8 50.9 2.68 0.49 GE 69.1 75.6 81.3 72.1 75.9 81.1 1.29 0.36 ADF 60.4 68.0 60.9 66.6 68.8 68.3 2.08 0.17 NDF 39.7 50.9 56.2 49.1 48.4 58.0 2.65 0.061 Fecal samples were collected on d 7 of phase 3 (d 42 of trial) via rectal massage from at least 4 pigs/pen.2 Porzyme 93010 (Danisco Animal Nutrition, St Louis, MO).
Table 9. Interactive effects of dietary xylanase and energy on finishing pig apparent total tract digestibility1
Probability, P <Xylanase2 Energy Xylanase
SEMEnergySEM
EnergyItem, % - + Low Medium High Xylanase Energy Linear QuadraticDM 77.9 78.8 73.5 78.6 82.9 1.07 1.14 0.22 <0.0001 <0.0001 0.84N 73.0 73.5 71.0 71.4 77.4 1.32 1.45 0.67 <0.0001 <0.0001 0.02Fat 48.2 48.8 44.2 50.9 50.4 1.90 2.11 0.72 0.005 0.006 0.07GE 75.3 76.4 70.6 75.8 81.2 0.82 0.95 0.29 <0.0001 <0.0001 0.72ADF 63.1 67.9 63.5 68.4 64.6 1.35 1.56 0.002 0.02 0.52 0.008NDF 49.0 51.8 44.5 49.6 57.1 1.61 1.91 0.16 <0.0001 <0.0001 0.501 Fecal samples were collected on d 7 of phase 3 (d 42 of trial) via rectal massage from at least 4 pigs/pen.2 Porzyme 93010 (Danisco Animal Nutrition, St Louis, MO).

240
Finishing Nutrition and Management
The Effect of Bacillus Probiotic on Growth Performance and Fecal Consistency of Growing-Finishing Pigs1
S. Nitikanchana2, M. D. Tokach, J. M. DeRouchey, R. D. Goodband, J. L. Nelssen, and S. S. Dritz2
SummaryA total of 1,099 pigs (PIC 1050 × 337; initially 75 lb) were used in a 104-d study to determine the influence of a Bacillus product and diet type on growth performance, carcass traits, fecal consistency, and pen cleaning time in growing-finishing pigs raised under commercial conditions. Pens of pigs were balanced by initial weight and randomly allotted to 1 of 6 dietary treatments in a completely randomized design with 26 to 27 pigs per pen and 7 replications per treatment. Treatments were arranged as a 3 × 2 factorial with main effects of Bacillus product (0, 1x, or 10x) and diet type (corn-soybean meal or a by-product diet with 30% dried distillers grains with solubles [DDGS] and 20% bakery). The dose of Bacillus in the diet was approximately 200 million cfu/g feed for the 1x level and 2 billion cfu/g feed for the 10x level. Fecal consis-tency and manure buildup in each pen was scored at the end of the trial by 3 observers with the average value per pen used for analysis. Time required to wash each individual pen was also recorded.
Overall (d 0 to 104), no differences were found in growth performance or carcass composition for pigs fed the Bacillus product; however, pigs fed the 1x level of Bacillus tended (quadratic, P = 0.10) to have the lowest ADG. Manure texture score tended to increase (linear, P = 0.07) as Bacillus dose increased, indicating that pigs fed the Bacillus product had firmer stools. For diet formulation, pigs fed the diet containing by-prod-ucts had increased (P = 0.01) ADFI compared with pigs fed the corn-soybean meal diet. With no difference in ADG, feed efficiency was poorer (P < 0.01) for pigs fed by-prod-uct diets. Pens that contained pigs fed by-product diets required more (P < 0.01) time to wash, which appeared to be the result of looser manure texture (P = 0.09) and increased (P = 0.08) manure buildup in pens where pigs were fed by-product-based diets. The Bacillus product tested did not improve growth performance, but altered fecal consistency and barn wash time.
Key words: Bacillus, by-products, fecal consistency, finishing pig, wash time
IntroductionProbiotic bacteria have been promoted to improve growth performance and as an alter-native method of preventing gastrointestinal disease in several species. One theory to explain the mechanism of action is that nonpathogenic Bacillus supplements compete
1 Appreciation is expressed to New Horizon Farms for use of pigs and facilities; to Richard Brobjorg, Scott Heidebrink, and Marty Heintz for technical assistance; and to Direct Biologicals, Inc. (Crofton, NE) for providing Bacillus product and partial financial assistance.2 Department of Diagnostic Medicine/Pathobiology, College of Veterinary Medicine, Kansas State University.

241
Finishing Nutrition and Management
for pathogenic bacterial binding sites, which leads to a reduction in the incidence of diarrhea. Supplemental feeding of Bacillus spp. bacteria also has been hypothesized to alter fecal consistency, which may reduce manure buildup and facility wash time.
Diet composition has changed dramatically for most swine farms in the United States in the last few years. Alternative ingredients such as DDGS or bakery meal have increased in the diet, which may alter the response to products such as Bacillus. Reports also indicate that including these by-products in diets leads to increased manure volume and increased barn wash times. Thus, the objective of this experiment was to investi-gate the effect of a Bacillus product on growth performance and carcass composition of finishing pigs fed corn-soy or by-product (DDGS and bakery meal) diets and the result-ing effects on fecal consistency and pen wash time.
ProceduresThe Kansas State University Institutional Animal Care and Use Committee approved the protocol used in this experiment. The study was conducted at a commercial research-finishing barn in southwestern Minnesota. The barns were naturally venti-lated and double-curtain-sided. Pens had completely slatted flooring and deep pits for manure storage. Each pen was equipped with a 5-hole stainless steel dry self-feeder and a cup waterer for ad libitum access to feed and water. Daily feed additions to each pen were accomplished through a robotic feeding system (FeedPro; Feedlogic Corp., Will-mar, MN) capable of providing and measuring feed amounts for individual pens.
A total of 1,099 pigs (PIC 1050 × 337) with an initial body weight of 75 lb were used in a 104-d study. A similar number of barrows and gilts were placed in each pen with 26 to 27 pigs per pen, with 7 pens per treatment. Pens of pigs were allotted to 1 of 6 treatments in a completely randomized design while balancing for body weight. Treatments were arranged in a 3 × 2 factorial with main effects of Bacillus product dose (0, 1x, or 10x; Sporzyme, Direct Biologicals, Inc., Crofton, NE) and diet formu-lation strategy (corn-soybean meal or by-product diet). The dietary Bacillus dose was approximately 200 million cfu/g feed for the 1x level and 2 billion cfu/g feed for the 10x level. The diets contained 30% DDGS until the last phase before market, when they contained 20%, and these diets used 20% bakery only in the first phase of the study (from 75 to 120 lb). Diets were fed in 5 phases with phases from 75 to 120 lb, 120 to 160 lb, 160 to 200 lb, 200 to 240 lb, and 240 lb to market (Tables 1 and 2).
Pens of pigs were weighed and feed disappearance was recorded at d 14, 29, 43, 65, 77, and 104 to determine ADG, ADFI, and F/G. At the end of the experiment, pigs were individually tattooed by pen number to allow for carcass data collection at the pack-ing plant and data retrieval by pen. Pigs were transported to JBS Swift and Company (Worthington, MN) for processing. Standard carcass criteria of loin and backfat depth, HCW, percentage lean, and percentage yield were collected.
To measure fecal consistency, each pen was scored for manure texture and manure buildup at the end of the trial by 3 observers. The 3 scores were averaged to determine a mean score, which was used for analysis. Manure textures were categorized in 3 catego-ries as firm, medium, and loose with the score of 1, 0, and -1, respectively. Manure buildup was given a value of 1 for visual manure buildup and -1 for no visual manure

242
Finishing Nutrition and Management
buildup. The time required to wash each individual pen was measured to determine whether the diet or supplement influenced wash time.
The experimental data were analyzed using the MIXED procedure of SAS (SAS insti-tute, Inc., Cary, NC). Treatments were arranged in a 2 × 3 factorial and data were analyzed for the main effects of diet type, linear and quadratic effect of Bacillus, and any interactions between linear and quadratic effects of Bacillus level and diet type. Pen was the experimental unit for all data analysis, and significance and tendencies were set at P < 0.05 and P < 0.10, respectively.
Results and DiscussionNo linear or quadratic interactions were detected between increasing Bacillus dosage and diet type (P > 0.13; Table 3), so the main effects of Bacillus dosage and diet type are presented (Table 4). Overall (d 0 to 104), no differences were measured in growth performance or carcass composition for pigs fed different levels of Bacillus product; however, pigs fed the 1x level of Bacillus tended (quadratic, P = 0.10) to have the lowest ADG. Due to this tendency, carcass value was affected in a quadratic manner, with pigs fed the 1x Bacillus having the highest price and premium and lowest sort loss. Manure texture score tended to increase (linear, P = 0.07) as Bacillus increased, suggesting that pigs fed the Bacillus product had firmer stools. Wash time was numerically reduced (linear, P = 0.16) as Bacillus level increased in the diet. The 50-sec difference in wash time per pen would equate to a 40-min reduction in wash time on a 48-pen barn for pigs fed the 10x level of the Bacillus product compared with the control.
For diet formulation, pigs fed the by-product diet had increased (P = 0.01) ADFI compared with pigs fed the corn-soy diet, but with no difference in ADG, feed effi-ciency was poorer (P < 0.01) for pigs fed the by-product diets. Pigs fed the by-product diets tended (P = 0.06) to have decreased backfat than pigs fed corn-soybean meal diets, which led to a tendency (P = 0.09) for greater carcass premium. No differences occurred in any other carcass criteria. Manure texture tended to be looser (P = 0.09) with more manure buildup (P = 0.08) in pens where pigs were fed by-product diets compared with pens with corn/soybean meal diets. Pens where by-product diets were fed required longer wash time (P < 0.01). Wash time was 2.4 min longer per pen where pigs were fed the by-product diets compared with pens where pigs were fed corn-soybean meal diets. When extrapolated over a 48-pen barn, feeding the high-by-product diets would increase wash time per barn by just less than 2 h (1 h and 53 min) compared with a barn where corn-soybean meal diets were fed.
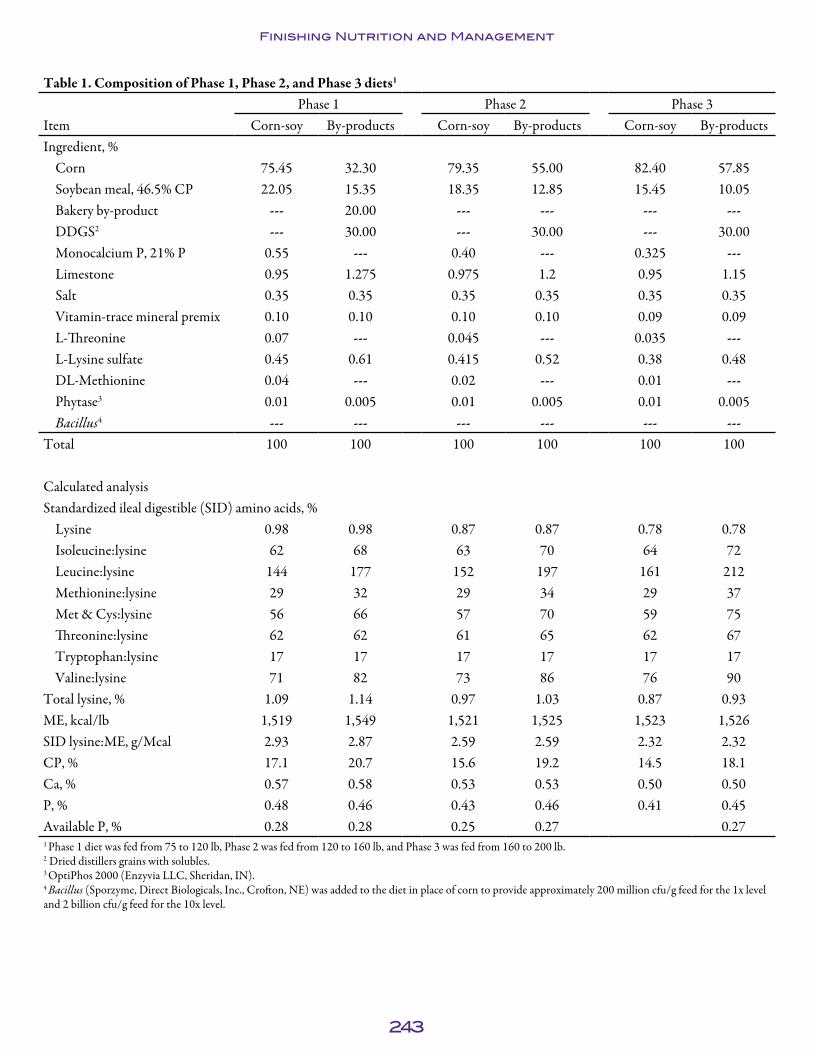
243
Finishing Nutrition and Management
Table 1. Composition of Phase 1, Phase 2, and Phase 3 diets1
Phase 1 Phase 2 Phase 3Item Corn-soy By-products Corn-soy By-products Corn-soy By-productsIngredient, %
Corn 75.45 32.30 79.35 55.00 82.40 57.85Soybean meal, 46.5% CP 22.05 15.35 18.35 12.85 15.45 10.05Bakery by-product --- 20.00 --- --- --- ---DDGS2 --- 30.00 --- 30.00 --- 30.00Monocalcium P, 21% P 0.55 --- 0.40 --- 0.325 ---Limestone 0.95 1.275 0.975 1.2 0.95 1.15Salt 0.35 0.35 0.35 0.35 0.35 0.35Vitamin-trace mineral premix 0.10 0.10 0.10 0.10 0.09 0.09L-Threonine 0.07 --- 0.045 --- 0.035 ---L-Lysine sulfate 0.45 0.61 0.415 0.52 0.38 0.48DL-Methionine 0.04 --- 0.02 --- 0.01 ---Phytase3 0.01 0.005 0.01 0.005 0.01 0.005Bacillus4 --- --- --- --- --- ---
Total 100 100 100 100 100 100
Calculated analysisStandardized ileal digestible (SID) amino acids, %
Lysine 0.98 0.98 0.87 0.87 0.78 0.78Isoleucine:lysine 62 68 63 70 64 72Leucine:lysine 144 177 152 197 161 212Methionine:lysine 29 32 29 34 29 37Met & Cys:lysine 56 66 57 70 59 75Threonine:lysine 62 62 61 65 62 67Tryptophan:lysine 17 17 17 17 17 17Valine:lysine 71 82 73 86 76 90
Total lysine, % 1.09 1.14 0.97 1.03 0.87 0.93ME, kcal/lb 1,519 1,549 1,521 1,525 1,523 1,526SID lysine:ME, g/Mcal 2.93 2.87 2.59 2.59 2.32 2.32CP, % 17.1 20.7 15.6 19.2 14.5 18.1Ca, % 0.57 0.58 0.53 0.53 0.50 0.50P, % 0.48 0.46 0.43 0.46 0.41 0.45Available P, % 0.28 0.28 0.25 0.27 0.271 Phase 1 diet was fed from 75 to 120 lb, Phase 2 was fed from 120 to 160 lb, and Phase 3 was fed from 160 to 200 lb.2 Dried distillers grains with solubles.3 OptiPhos 2000 (Enzyvia LLC, Sheridan, IN).4 Bacillus (Sporzyme, Direct Biologicals, Inc., Crofton, NE) was added to the diet in place of corn to provide approximately 200 million cfu/g feed for the 1x level and 2 billion cfu/g feed for the 10x level.

244
Finishing Nutrition and Management
Table 2. Diet composition of Phase 4 and Phase 51
Phase 4 Phase 5Item Corn-soy By-products Corn-soy By-productsIngredient, %
Corn 85.40 60.85 87.95 71.70Soybean meal, 46.5% CP 12.60 7.20 10.10 6.45Bakery by-product --- --- --- ---DDGS2 --- 30.00 --- 20.00Monocalcium P, 21% P 0.30 --- 0.25 ---Limestone 0.90 1.10 0.90 1.05Salt 0.35 0.35 0.35 0.35Vitamin-trace mineral premix 0.09 0.09 0.09 0.09L-Threonine 0.033 --- 0.03 ---L-Lysine sulfate 0.345 0.445 0.31 0.38DL-Methionine 0.01 0.005 0.01 0.005Phytase3 --- --- --- ---Bacillus4 --- --- --- ---
Total 100 100 100 100
Calculated analysisStandardized ileal digestible (SID) amino acids, %
Lysine 0.69 0.69 0.61 0.61 Isoleucine:lysine 65 75 67 74Leucine:lysine 172 230 186 229Methionine:lysine 30 40 32 39Met & Cys:lysine 62 81 67 81Threonine:lysine 64 71 66 70Tryptophan:lysine 17 17 17 17Valine:lysine 79 95 82 94
Total lysine, % 0.78 0.83 0.69 0.73 ME, kcal/lb 1,525 1,528 1,526 1,528SID lysine:ME, g/Mcal 2.05 2.05 1.81 1.81CP, % 13.4 17.0 12.4 14.8Ca, % 0.47 0.47 0.45 0.45P, % 0.39 0.43 0.37 0.39Available P, % 0.22 0.27 0.21 0.211 Phase 4 diet was fed from 200 to 240 lb and the Phase 5 diet was fed from 240 lb to market.2 Dried distillers grains with solubles.3 OptiPhos 2000 (Enzyvia LLC, Sheridan, IN).3,4 Bacillus (Sporzyme, Direct Biologicals, Inc., Crofton, NE) was added to the diet in place of corn to provide approximately 200 million cfu/g feed for the 1x level and 2 billion cfu/g feed for the 10x level.

245
Fin
ish
ing
Nu
tr
itio
n a
nd
Ma
na
ge
me
nt
Table 3. Interactive effects of probiotic (Bacillus product) on growth performance and fecal consistency of growing-finishing pigs1
Probability, P <Corn-soy By-products2 Bacillus × diet type
Bacillus3 None 1x 10x None 1x 10x SEM Linear Quadraticd 0 to 104
ADG, lb 2.21 2.14 2.15 2.18 2.16 2.19 0.022 0.13 0.89ADFI, lb 5.71 5.50 5.57 5.83 5.73 5.82 0.096 0.48 0.76F/G 2.58 2.56 2.59 2.67 2.65 2.66 0.028 0.76 0.72
Pig weight, lbd 0 75.3 75.1 75.0 75.5 74.5 74.9 2.38 0.93 0.88d 104 301.9 294.5 294.9 298.7 297.0 299.6 4.23 0.35 0.81
Carcass measurementsHCW, lb 223.8 219.3 220.8 222.2 218.3 222.6 3.33 0.62 0.85Yield, % 77.2 77.4 77.8 76.5 77.1 77.4 0.005 0.79 0.69Backfat depth, in. 0.72 0.71 0.71 0.70 0.66 0.69 0.018 0.91 0.38Loin depth, in. 2.84 2.84 2.89 2.85 2.84 2.85 0.023 0.30 0.83Lean, % 56.4 56.6 56.7 56.7 57.3 56.8 0.303 0.80 0.42
Carcass valuesPrice, $/cwt 93.5 95.1 94.2 94.9 96.0 93.4 0.722 0.14 0.63Premium, $/cwt 2.85 3.14 2.93 3.12 3.69 3.04 0.217 0.70 0.34Sort loss, $/cwt -3.51 -2.21 -2.88 -2.45 -1.90 -3.83 0.691 0.15 0.83
Manure scoreTexture4 -0.09 0.00 0.09 -0.48 -0.19 -0.05 0.167 0.47 0.81Buildup5 0.05 -0.24 -0.62 -0.05 0.43 0.05 0.281 0.18 0.44
Wash time, min/pen 9.8 8.9 9.2 11.8 12.4 10.7 0.6 0.66 0.091A total of 1,099 finishing pigs (initial BW 75 lb) were used in a 104-d trial. Pigs were randomly allotted to 1 of 6 dietary treatments with 26 or 27 pigs/pen and 7 pens per treatment. 2 By-product diets contained 30% dried distillers grains with solubles (DDGS) until the last phase before market, when they contained 20%, and these diets used 20% bakery only in the first phase of trial.3 The Bacillus that was used for this trial was approximately 200 million cfu/g feed (1 lb/ton) for the 1x level and 2 billion cfu/g feed (3.5 lb/ton) for the 10x level.4 Manure textures were categorized in 3 categories as firm, medium, and loose with the score of 1, 0, and -1.5 Manure buildup was given value of 1 for visual manure buildup and -1 for no visual manure buildup.

246
Fin
ish
ing
Nu
tr
itio
n a
nd
Ma
na
ge
me
nt
Table 4. Main effect of probiotic (Bacillus product) on growth performance and fecal consistency of growing-finishing pigs1 Probability, P <
Bacillus level2 Diet type BacillusItem None 1x 10x Corn-soy By-products3 SEM Linear Quadratic Diet typed 0 to 104
ADG, lb 2.20 2.15 2.17 2.17 2.18 0.022 0.20 0.10 0.56ADFI, lb 5.77 5.61 5.69 5.59 5.79 0.096 0.43 0.17 <0.01F/G 2.63 2.61 2.62 2.58 2.66 0.028 0.96 0.53 <0.01
Pig weight, lbd 0 75.40 74.80 74.95 75.13 74.97 2.38 0.84 0.86 0.93d 104 300.3 295.8 297.3 297.1 298.4 4.23 0.48 0.42 0.70
Carcass characteristicsHCW, lb 223.0 218.8 221.7 221.3 221.0 3.33 0.70 0.22 0.92Yield, % 76.9 77.3 77.6 77.5 77.0 0.005 0.13 0.92 0.27Backfat depth, in. 0.71 0.68 0.70 0.71 0.68 0.018 0.61 0.16 0.06Loin depth, in. 2.84 2.84 2.87 2.86 2.84 0.023 0.27 0.46 0.55Lean, % 56.5 56.9 56.8 56.5 56.9 0.303 0.45 0.24 0.12
Carcass valuesPrice, $/cwt 94.2 95.5 93.8 94.3 94.7 0.722 0.60 0.02 0.45Premium, $/cwt 2.99 3.41 2.99 2.97 3.28 0.217 0.99 0.03 0.09Sort loss, $/cwt -2.98 -2.06 -3.36 -2.87 -2.73 0.691 0.59 0.07 0.80
Manure scoreTexture4 -0.29 -0.10 0.02 0.00 -0.24 0.167 0.07 0.81 0.09Buildup5 0.00 0.10 -0.29 -0.27 0.14 0.281 0.31 0.33 0.08
Wash time, min/pen 10.8 10.6 9.9 9.3 11.6 0.6 0.16 0.57 <0.011 A total of 1,099 finishing pigs (initial BW 75 lb) were used in a 104-d trial. Pigs were randomly allotted to 1 of 6 dietary treatments with 26 or 27 pigs/pen and 7 pens per treatment. 2 The Bacillus that was used for this trial was approximately 200 million cfu/g feed (1 lb/ton) for the 1x level and 2 billion cfu/g feed (3.5 lb/ton) for the 10x level.3 By-product diets contained 30% dried distillers grains with solubles (DDGS) until the last phase before market, when they contained 20%, and these diets used 20% bakery only in the first phase of trial.4 Manure textures were categorized in 3 categories as firm, medium, and loose with the score of 1, 0, and -1.5 Manure buildup was given a value of 1 for visual manure buildup and -1 for no visual manure buildup.

247
Finishing Nutrition and Management
The Effects of Diet Form and Feeder Design on the Growth Performance of Finishing Pigs1
A. J. Myers, J. R. Bergstrom, M. D. Tokach, S. S. Dritz2, R. D. Goodband, J. M. DeRouchey, and J. L. Nelssen
Summary A total of 1,146 growing pigs (PIC 1050 × 337, initially 85.8 lb) were used in a 104-d study to evaluate the effects of diet form (meal vs. pellet) and feeder design (conven-tional dry vs. wet-dry) on finisher pig performance. The treatments were arranged in a 2 × 2 factorial with 11 replications per treatment and 25 to 27 pigs per pen. Half of the pens were equipped with a 5-hole conventional dry feeder and the other half had a double-sided wet-dry feeder. All pigs were fed a corn-soybean meal-based diet contain-ing 20% dried distillers grains with solubles (DDGS) during the first 4 dietary phases and 10% DDGS in phase 5. The only difference in diet among treatments was diet form (meal vs. pellet). Pen weights and feed disappearance were measured on d 0, 14, 28, 42, 56, 70, 86, and 104. Pictures of feeder pans were taken once during each phase and evaluated by a panel of 4 individuals for percentage pan coverage. From d 0 to 28, no diet form × feeder design interaction was observed for ADG or F/G. Pigs fed pelleted diets had poorer (P < 0.001) F/G compared with those fed meal diets, which appeared to be due to poor pellet quality (39.6% fines). From d 42 to 86, pellet quality improved (4.4% fines), and a diet form × feeder interaction (P < 0.02) was observed for ADG, whereas pigs presented meal diets in a dry feeder had decreased ADG compared with pigs presented pelleted diets in dry feeders or pigs presented feed via wet-dry feeders regardless of diet form. Pigs presented pelleted diets had improved (P < 0.001) F/G compared with those fed meal diets. Pigs fed via wet-dry feeders had increased (P < 0.03) ADFI and poorer F/G compared with pigs with dry feeders.
Overall, pigs fed with wet-dry feeders had increased (P < 0.02) ADG and ADFI, and poorer F/G compared with those with dry feeders, whereas pigs presented pelleted diets had a tendency for improved (P < 0.06) F/G compared with those presented meal diets. In conclusion, regardless of diet form, pigs fed from wet-dry feeders had increased ADG and ADFI compared with pigs fed via dry feeders. Additionally, pellet quality appeared to influence responses because pigs provided higher-quality pellets via dry feeders had increased growth performance compared with pigs fed meal diets. Conversely, if pellet quality was poor, feed efficiency benefits associated with pelleting were lost.
Key words: feeder, finishing pig, growth, pelleting
IntroductionFeed represents a significant portion of production costs during the finishing phase of growth, so producers are constantly evaluating ways to improve growth performance and lower feed cost. One method to accomplish both goals is pelleting diets, which has 1 Appreciation is expressed to New Horizon Farms for use of pigs and facilities and to Richard Brobjorg, Scott Heidebrink, and Marty Heintz for technical assistance.2 Department of Diagnostic Medicine/Pathobiology, College of Veterinary Medicine, Kansas State University.

248
Finishing Nutrition and Management
been shown to be an effective feed processing method to improve feed efficiency in pigs. Typically, a 4 to 6% improvement in F/G is observed when pigs are presented pelleted diets via conventional dry feeders.
A second method to improve growth is using different feeder designs. Bergstrom et al. (20083) reported that pigs presented meal diets via wet-dry feeders have increased ADG and ADFI compared with pigs fed with conventional dry feeders. Thus, a potential interaction or additive effect may occur between feeder type and diet form. Feeding pelleted diets via a wet-dry feeder might result in a proportionately greater improve-ment in ADG and F/G than with conventional dry feeder; however, previous research (Myers et al., 20104) evaluating the effects of diet form and feeder design observed an unexpected worsening of feed efficiency when pigs were fed pelleted diets in conven-tional dry feeders and no difference between meal and pelleted diets when using wet-dry feeders. The poorer feed efficiency was the result of increased feed wastage, which was attributed to poorer-quality pellets. Thus, the objective of this study was to re-evaluate the effects of diet form (meal vs. pellet) and feeder design (conventional dry vs. wet-dry) on finishing pig performance.
ProceduresAll practices and procedures used in these experiments were approved by the Kansas State University Institutional Animal Care and Use Committee.
The study was conducted at a commercial swine research facility in southwestern Minnesota. The facility was a naturally ventilated double-curtain-sided barn with pit fans for minimum ventilation. Pens were located over a completely slatted concrete floor with a deep pit for manure storage. Half of the pens were equipped with a conven-tional 5-hole dry feeder (STACO, Shafferstown, PA), and the other half contained a double-sided wet-dry feeder that provided both feed and water (Crystal Springs, Gro Master, Omaha, NE). All pens contained cup waterers, but pens that contained wet-dry feeders had their cup waterers shut off for the duration of the trial so the only source of water was the nipple waterer located under a food shelf over the center of the feed pan inside each of the wet-dry feeders. Pigs were provided ad libitum access to feed and water for the duration of both studies. The facility utilized a computerized feed-ing system (FeedPro; Feedlogic Corp., Wilmar, MN) that both recorded and delivered diets to pens as specified.
A total of 1,146 growing pigs (PIC 1050 × 337) with an initial BW of 85.8 lb were used in a 104-d growth study. Pigs were randomly allotted to 1 of 4 experimental treatments based on average initial BW and number of pigs per pen. Treatments comprised 11 pens with 26 to 27 pigs per pen. The number of barrows and gilts were equalized across all treatments.
Treatments were arranged in a 2 × 2 factorial with the main effects of diet form (meal vs. pellet) and feeder design (conventional dry vs. wet-dry). Initially, all wet-dry feeders were adjusted to provide a 1.00-in. gap width. Conventional dry feeders that contained meal diets were also adjusted to a minimum gap width of 1.00 in., but conventional dry
3 Bergstrom et al., Swine Day 2008, Report of Progress 1001, pp. 196-203.4 Myers et al., Swine Day 2010, Report of Progress 1038, pp. 209-215.

249
Finishing Nutrition and Management
feeders with pelleted diets were adjusted to a 0.70-in. minimum gap width. The feeder settings were not maintained for the duration of the trial because feeders were adjusted as required to ensure consistent feeder pan coverage of 40 to 60%.
Pigs were fed a common corn-soybean meal-based diet containing 20% DDGS during the first 4 dietary phases and 10% DDGS and 5 ppm Ractopamine HCl in Phase 5 (Table 1). The only difference between diets was diet form. At different periods throughout the study, a large batch of feed was manufactured at the New Horizon Farm feed mill (Pipestone, MN), then spilt into 2 smaller batches where half of the feed was transported to a commercial feed mill to be pelleted and the other half remained at the farm feed mill and was fed the meal diet. Corn was ground to 550 microns using a roller mill. Diets were pelleted at a nearby commercial feed mill with a 125 HP Cali-fornia Pellet Mill (Crawfordsville, IN) equipped with a micro mini 9.53-mm (hole diameter) × 41.28-mm (effective die thickness) pellet die. Feed was steam conditioned at 150°F for 15 sec prior to pelleting. The diet was formulated to meet or exceed NRC (19985) requirement estimates for 45- to 270-lb pigs.
Average daily gain, ADFI, and F/G were determined by weighing pigs and measuring feed disappearance on d 0, 14, 28, 42, 56, 70, 86, and 104. On d 86, 5 pigs (3 barrows and 2 gilts) from each pen were weighed and removed for marketing. At the conclu-sion of the trial (d 104), pigs were individually tattooed by pen and transported 1 h to a commercial packing plant (JBS Swift and Company, Worthington, MN), where carcass data were obtained for 891 pigs to determine HCW, percentage carcass yield, backfat depth, and longissimus muscle depth, which was taken by placing an optical probe between the 3rd and 4th rib from the last rib at 7 cm from the dorsal midline. Fat-free lean index (FFLI) was calculated using National Pork Producers Council (2000) procedures.
A digital photo of each feeder pan was taken once during each phase. Feeder pan pictures were then scored independently by a trained panel of 4 for percentage pan coverage. In addition, feed samples were taken from the feeders during each phase and analyzed for percentage fines and pellet durability index (PDI). Percentage fines were determined prior to testing pellets for durability. A number 6 screen was used to sift the fines from a 500-g sample of pellets. The amount of fines was then weighed and percentage fines were calculated using the following formula: weight of fines/weight of sample × 100. After fines were sifted off, PDI was determined. The sample of pellets were placed in a box and tumbled for 10 min. After 10 min, the samples were removed, sieved (number 6 screen), and the percentage of whole pellets was calculated. Pellet durability index was then calculated using the following formula: weight of pellets after tumbling/weight of pellets prior to tumbling × 100.
Treatments were arranged as a 2 × 2 factorial for both experiments and data were analyzed as a completely randomized design using the PROC MIXED procedure of SAS (SAS Institute Inc., Cary, NC). Pen was the experimental unit. When significant interactions (P < 0.05) were observed, least significant differences (LSDs) were used to evaluate the means. Results were considered significant at P ≤ 0.05 and considered a trend at P ≤ 0.10.
5 NRC. 1998. Nutrient Requirements of Swine. 10th ed. Natl. Acad. Press, Washington, DC.

250
Finishing Nutrition and Management
Results and DiscussionFrom d 0 to 28, no diet form × feeder design interaction was observed for ADG or F/G (Table 2). Pigs fed pelleted diets had decreased (P < 0.01) ADG compared with pigs fed meal diets. Pigs presented diets via wet-dry feeders had a tendency (P < 0.06) for improved ADG compared with pigs fed from conventional dry feeders. A trend (P < 0.06) for a diet form × feeder design interaction was also observed for ADFI. Pigs fed either meal or pelleted diets from a conventional dry feeder had decreased ADFI compared with those fed a pelleted diet from a wet-dry feeder, with meal-fed pigs with a wet-dry feeder intermediate. Despite the interaction, pigs fed with wet-dry feeders had increased (P < 0.001) ADFI compared with those with conventional dry feeders. Pigs fed meal diets had improved (P < 0.001) F/G compared with those fed pelleted diets, and pigs with conventional dry feeders had improved (P < 0.02) F/G compared with those with wet-dry feeders. Pelleted diets averaged 39.6% fines and had a PDI of 87.2. These data indicate that feeding poor-quality pellets can actually result in poorer feed efficiency compared with feeding meal diets.
From d 28 to 42, no diet form × feeder design interactions or effects of diet form were detected for any of the growth performance criteria evaluated; however, a tendency (P < 0.10) was found for pigs with wet-dry feeders to have increased ADFI compared with those with dry feeders (Table 2). Pelleted diets averaged 3.9% fines and had a PDI of 89.8. No diet form × feeder design interactions were detected for feeder coverage score, but pigs fed pelleted diets had increased (P < 0.02) feeder pan coverage compared with those with meal diets, where pigs with wet-dry had a tendency for increased (P < 0.06) feeder pan coverage compared with those with dry feeders. Notably, d 28 to 42 represented a transition phase where after the poor-quality pellets were provided in the first phase, adjustments were made to provide better-quality pellets and the percent-age fines and PDI represented pellet quality at the end of the phase.
From d 42 to 86, a diet form × feeder design interaction was observed (P < 0.02) for ADG, where pigs fed the meal diet from a conventional dry feeder had decreased (P < 0.05) ADG compared with pigs fed pelleted diets from the same feeder type, but no difference existed in wet-dry feeders based on diet form (Table 2). A tendency occurred for pigs fed meal diets to have increased (P < 0.08) ADFI compared with those fed pelleted diets. In addition, pigs with wet-dry feeders had increased (P < 0.001) ADFI compared with those fed with conventional dry feeders. Pigs fed pelleted diets had improved (P < 0.001) F/G compared with pigs fed meal diets, whereas pigs with wet-dry feeders had poorer (P < 0.03) F/G compared with those with conventional dry feeders. Pelleted diets averaged 4.4% fines and had a PDI of 93.5. No diet form × feeder design interactions were detected for feeder coverage score. During this phase when pellet quality was excellent, feed efficiency was improved 7.2% for pigs fed with the dry feeders and 5.1% for pigs fed with the wet-dry feeders.
From d 86 to 104, no diet form × feeder design interactions or effects of feeder design were observed for any of the growth criteria evaluated (Table 2). A tendency (P < 0.09) was found for pigs fed meal diets to have increased feed intake compared with those with pelleted diets. Pigs fed pelleted diets had improved (P < 0.04) F/G compared with pigs fed meal diets. Pelleted diets averaged 16.8% fines and had an average PDI of 93.8. A tendency occurred for a diet form × feeder design interaction (P < 0.07) in
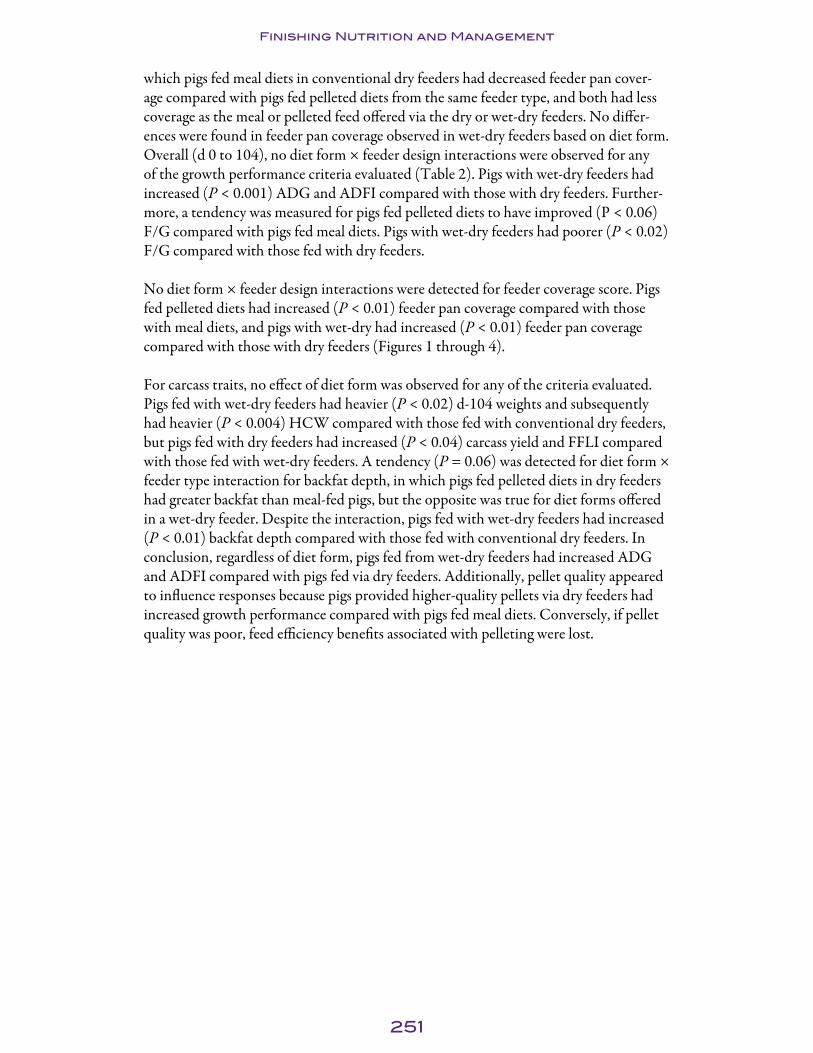
251
Finishing Nutrition and Management
which pigs fed meal diets in conventional dry feeders had decreased feeder pan cover-age compared with pigs fed pelleted diets from the same feeder type, and both had less coverage as the meal or pelleted feed offered via the dry or wet-dry feeders. No differ-ences were found in feeder pan coverage observed in wet-dry feeders based on diet form. Overall (d 0 to 104), no diet form × feeder design interactions were observed for any of the growth performance criteria evaluated (Table 2). Pigs with wet-dry feeders had increased (P < 0.001) ADG and ADFI compared with those with dry feeders. Further-more, a tendency was measured for pigs fed pelleted diets to have improved (P < 0.06) F/G compared with pigs fed meal diets. Pigs with wet-dry feeders had poorer (P < 0.02) F/G compared with those fed with dry feeders.
No diet form × feeder design interactions were detected for feeder coverage score. Pigs fed pelleted diets had increased (P < 0.01) feeder pan coverage compared with those with meal diets, and pigs with wet-dry had increased (P < 0.01) feeder pan coverage compared with those with dry feeders (Figures 1 through 4).
For carcass traits, no effect of diet form was observed for any of the criteria evaluated. Pigs fed with wet-dry feeders had heavier (P < 0.02) d-104 weights and subsequently had heavier (P < 0.004) HCW compared with those fed with conventional dry feeders, but pigs fed with dry feeders had increased (P < 0.04) carcass yield and FFLI compared with those fed with wet-dry feeders. A tendency (P = 0.06) was detected for diet form × feeder type interaction for backfat depth, in which pigs fed pelleted diets in dry feeders had greater backfat than meal-fed pigs, but the opposite was true for diet forms offered in a wet-dry feeder. Despite the interaction, pigs fed with wet-dry feeders had increased (P < 0.01) backfat depth compared with those fed with conventional dry feeders. In conclusion, regardless of diet form, pigs fed from wet-dry feeders had increased ADG and ADFI compared with pigs fed via dry feeders. Additionally, pellet quality appeared to influence responses because pigs provided higher-quality pellets via dry feeders had increased growth performance compared with pigs fed meal diets. Conversely, if pellet quality was poor, feed efficiency benefits associated with pelleting were lost.

252
Finishing Nutrition and Management
Table 1: Composition of diets, (as-fed basis), Exp. 11
Item Phase 1 Phase 2 Phase 3 Phase 4 Phase 5Ingredient, %
Corn 59.55 62.77 65.43 68.54 66.16Soybean meal (46.5% CP) 18.54 15.36 12.78 9.70 22.21Dried distillers grains with solubles 20.00 20.00 20.00 20.00 10.00Limestone 1.00 0.98 0.95 0.95 0.95Salt 0.35 0.35 0.35 0.35 0.35Vitamin-trace mineral premix 0.10 0.09 0.08 0.08 0.08Liquid lysine, 60% 0.45 0.45 0.40 0.38 0.23Phytase2 0.01 0.01 0.01 0.01 0.01Ractopamine HCl3 --- --- --- --- 0.03
Total 100 100 100 100 100
Calculated analysisStandardized ileal digestible amino acids,%Lysine 0.95 0.87 0.78 0.69 0.90Isoleucine:lysine 69 69 72 73 74Methionine:lysine 31 32 34 37 31Met & Cys:lysine 64 66 71 76 64Threonine:lysine 62 63 66 68 66Tryptophan:lysine 17.7 17.4 17.6 17.6 19.8Total lysine, % 1.10 1.01 0.91 0.82 1.03CP, % 19.5 18.3 17.2 16.1 18.8ME kcal/lb 1,527 1,528 1,529 1,530 1,526Ca, % 0.47 0.45 0.43 0.42 0.46P, % 0.44 0.42 0.41 0.40 0.41Available P,% 0.28 0.28 0.26 0.24 0.211 Phase 1, 2, 3, 4, and 5 diets were fed from 84 to 123, 123 to 154, 154 to 187, 187 to 254, and 254 to 284 lb BW, respectively. All dietary phases were fed in both diet forms to each feeder type. 2 OptiPhos 2000 (Enzyvia LLC, Sheridan, IN).3 Ractopamine HCl (Paylean, Elanco Animal Health, Greenfield, IN) was added at 6.75 g/ton.

253
Fin
ish
ing
Nu
tr
itio
n a
nd
Ma
na
ge
me
nt
Table 2. Effects of diet form and feeder design on finishing pig performance1
Conventional dry Wet-dry P < Item Meal Pellet Meal Pellet SEM Diet form × feeder Diet form Feederd 0 to 28
ADG, lb 1.45 1.28 1.48 1.39 0.04 0.27 0.01 0.06ADFI, lb 3.20a 3.17a 3.45b 3.69c 0.07 0.06 0.14 0.0001F/G 2.12 2.49 2.33 2.68 0.06 0.55 0.001 0.02Fines, %2 --- 39.6 --- 39.6 --- --- --- ---PDI3 --- 87.2 --- 87.2 --- --- --- ---
d 28 to 42ADG, lb 2.13 2.22 2.24 2.23 0.04 0.27 0.33 0.17ADFI, lb 4.87 5.07 5.18 5.12 0.11 0.23 0.53 0.10F/G 2.30 2.29 2.32 2.30 0.04 0.88 0.73 0.73Fines, % --- 3.9 --- 3.9 --- --- --- ---PDI --- 89.8 --- 89.8 --- --- --- ---Feeder coverage score, %4 52.4 67.2 63.8 78.8 6.38 0.98 0.02 0.06
d 42 to 86ADG, lb 2.12a 2.28b 2.31b 2.34b 0.03 0.02 0.01 0.001ADFI, lb 6.18 6.15 6.81 6.52 0.09 0.14 0.08 0.001F/G 2.91 2.70 2.94 2.79 0.03 0.27 0.001 0.03Fines, % --- 4.4 --- 4.4 --- --- --- ---PDI --- 93.5 --- 93.5 --- --- --- ---Feeder coverage score, % 54.8 60.8 58.5 70.6 6.38 0.62 0.15 0.28
d 86 to 104ADG, lb 1.89 1.92 1.97 1.92 0.08 0.62 0.83 0.59ADFI, lb 5.99 5.60 6.19 5.78 0.23 0.96 0.09 0.41F/G 3.18 2.94 3.14 3.03 0.09 0.48 0.04 0.75Fines, % --- 16.8 --- 16.8 --- --- --- ---PDI --- 93.8 --- 93.8 --- --- --- ---Feeder coverage score, % 31.3a 56.2b 70.1b 72.0b 6.38 0.07 0.03 0.001
continued
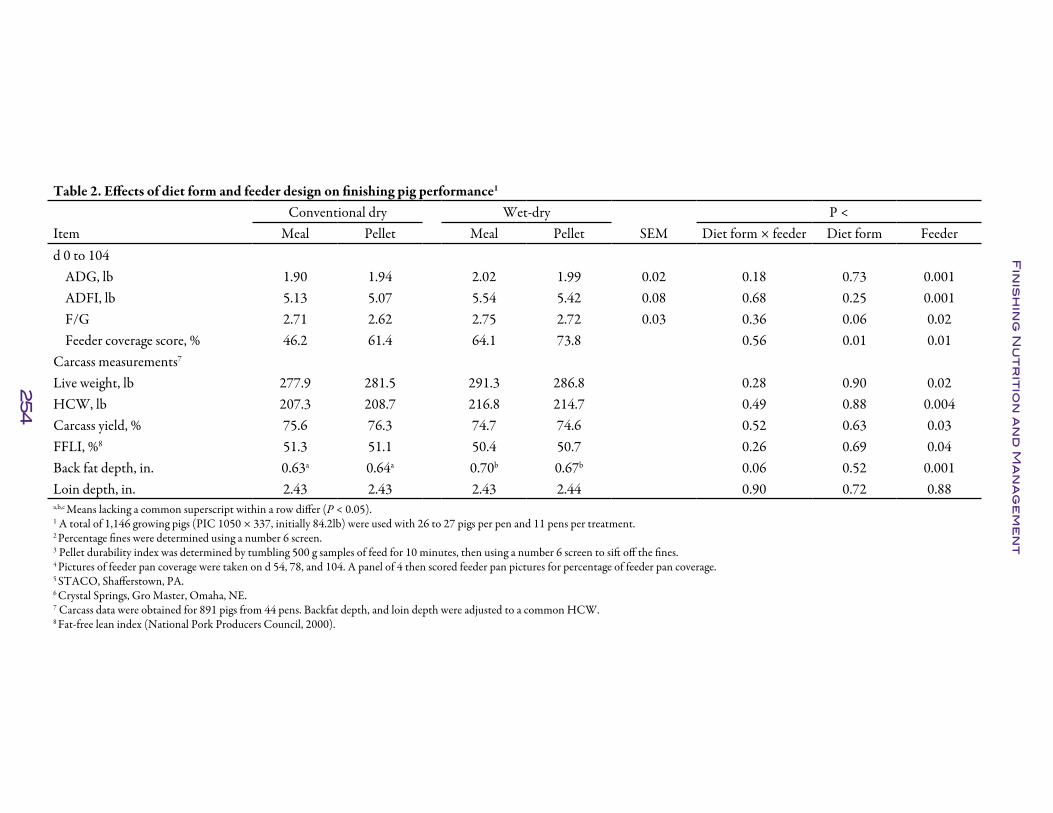
254
Fin
ish
ing
Nu
tr
itio
n a
nd
Ma
na
ge
me
nt
Table 2. Effects of diet form and feeder design on finishing pig performance1
Conventional dry Wet-dry P < Item Meal Pellet Meal Pellet SEM Diet form × feeder Diet form Feederd 0 to 104
ADG, lb 1.90 1.94 2.02 1.99 0.02 0.18 0.73 0.001ADFI, lb 5.13 5.07 5.54 5.42 0.08 0.68 0.25 0.001F/G 2.71 2.62 2.75 2.72 0.03 0.36 0.06 0.02Feeder coverage score, % 46.2 61.4 64.1 73.8 0.56 0.01 0.01
Carcass measurements7
Live weight, lb 277.9 281.5 291.3 286.8 0.28 0.90 0.02HCW, lb 207.3 208.7 216.8 214.7 0.49 0.88 0.004Carcass yield, % 75.6 76.3 74.7 74.6 0.52 0.63 0.03FFLI, %8 51.3 51.1 50.4 50.7 0.26 0.69 0.04Back fat depth, in. 0.63a 0.64a 0.70b 0.67b 0.06 0.52 0.001Loin depth, in. 2.43 2.43 2.43 2.44 0.90 0.72 0.88a,b,c Means lacking a common superscript within a row differ (P < 0.05). 1 A total of 1,146 growing pigs (PIC 1050 × 337, initially 84.2lb) were used with 26 to 27 pigs per pen and 11 pens per treatment. 2 Percentage fines were determined using a number 6 screen.3 Pellet durability index was determined by tumbling 500 g samples of feed for 10 minutes, then using a number 6 screen to sift off the fines. 4 Pictures of feeder pan coverage were taken on d 54, 78, and 104. A panel of 4 then scored feeder pan pictures for percentage of feeder pan coverage. 5 STACO, Shafferstown, PA.6 Crystal Springs, Gro Master, Omaha, NE.7 Carcass data were obtained for 891 pigs from 44 pens. Backfat depth, and loin depth were adjusted to a common HCW.8 Fat-free lean index (National Pork Producers Council, 2000).

255
Finishing Nutrition and Management
Figure 1. Conventional dry feeder with meal diets averaging 46% feeder pan coverage, Exp. 2.
Figure 2. Conventional dry feeder with pelleted diets averaging 61% feeder pan coverage, Exp. 2.
Figure 3. Wet-dry feeder with meal diets averaging 64% feeder pan coverage, Exp. 2.

256
Finishing Nutrition and Management
Figure 4. Wet-dry feeder with pelleted diets averaging 74% feeder pan coverage, Exp. 2.

257
Finishing Nutrition and Management
The Effects of Feeder Design (Conventional Dry vs. Wet-Dry) in the Nursery and in the Finisher on Growth Performance of Finishing Pigs1
S. Nitikanchana2, S. S. Dritz2, M. D. Tokach, J. M. DeRouchey, R. D. Goodband, and J. L. Nelssen
SummaryA total of 1,296 pigs (PIC 1050 × 337; initially 36 lb) were used in a 102-d study to determine the effects of feeder type (conventional dry vs. wet-dry) on nursery and finishing pig growth performance for pigs reared under commercial conditions. In the nursery, pigs were housed in rooms with either conventional dry or wet-dry feeders. At movement to the finisher, 312 barrows and 336 gilts from a room with conven-tional dry feeders and an equal number of pigs from a room with wet-dry feeders were randomly selected and distributed to have a similar number of barrows and gilts in each finisher pen. At the start of the trial, pens of pigs were weighed and randomly allotted to the 2 feeder types in finishing barn to arrange the treatments as a 2 × 2 factorial with main effects of feeder type in nursery and feeder type in finisher.
All pigs were fed the same corn-soybean meal diets containing 20 to 40% dried distill-ers grains with solubles (DDGS) during 6 dietary phases. For the finisher period (d 0 to 102), pigs fed with the conventional dry feeder during the nursery phase and wet-dry feeder during the finisher phase tended to have greater ADG (P < 0.01) compared with pigs fed with the other feeder regimens. An interaction (P = 0.03) occurred between nursery and finisher feeder type for F/G. Within pigs provided feed with the conven-tional dry feeder in the nursery phase, pigs provided feed with the conventional dry feeder in the finisher phase had poorer (P < 0.01) F/G compared with those fed with the wet-dry feeder. In contrast, for pigs provided feed with the wet-dry feeder in the nursery phase, F/G during the finisher phase was the same regardless of feeder type in the finisher phase. Pigs previously fed using a conventional dry feeder in the nursery had greater ADG and ADFI (P = 0.03, P = 0.02) compared with those on wet-dry feeder in the nursery phase regardless of the effect of feeder types in finishing period. Pigs fed with wet-dry feeders in the finisher phase had greater (P < 0.01) finisher ADG and improved (P = 0.02) F/G compared with those fed with conventional dry feeders in the finishing period. Also, the final BW of finishing pigs previously fed using conven-tional dry feeders in the nursery was greater (P < 0.01) than those previously fed on wet-dry feeders; however, pigs fed using wet-dry feeders in finisher phase had greater (P < 0.01) final BW compared with those fed with conventional dry feeders. These results indicated that using dry feeder in nursery and wet-dry feeder in finisher gave the most benefit in terms of growth performance.
Key words: conventional dry feeder, wet-dry feeder, finishing pig
1 Appreciation is expressed to New Horizon Farms for use of pigs and facilities and to Richard Brobjorg,Scott Heidebrink, and Marty Heintz for technical assistance.2 Department of Diagnostic Medicine/Pathobiology, College of Veterinary Medicine, Kansas State University.

258
Finishing Nutrition and Management
IntroductionRecent studies have demonstrated that finishing pigs fed using wet-dry feeders had improved weight gain, feed intake, and final BW (Bergstrom et al., 20103), but little research is available comparing conventional dry feeders and wet-dry feeders in the nursery phase. Also, very little data is available to analyze the influence of feeder type used in the nursery on subsequent finishing pig performance.
Thus, the objective of this study was to evaluate the effects of feeder type (conventional dry vs. wet-dry) in the nursery and the potential interaction with feeder type (conven-tional dry vs. wet-dry) in the finisher on the growth performance of growing-finishing pigs.
ProceduresThe Kansas State University Institutional Animal Care and Use Committee approved the protocol used in this experiment. The study was conducted at a commercial research-finishing barn in southwestern Minnesota. The barns were naturally venti-lated and double-curtain-sided. Pens had completely slatted flooring and deep pits for manure storage. Twenty-four pens were equipped with conventional dry stainless steel feeders (STACO, Inc., Schaefferstown, PA) with 5 holes and a cup waterer in each pen for ad libitum access to feed and water. The remaining 24 pens were equipped with a double-sided wet-dry feeder (Crystal Springs, GroMaster, Inc., Omaha, NE) where the feeder was the only source of water. Daily feed additions to each pen were accomplished through a robotic feeding system (FeedPro; Feedlogic Corp., Willmar, MN) capable of providing and measuring feed amounts for individual pens.
A total of 1,296 pigs (PIC 1050 × 337) with an initial BW of 36 lb were used in this study. During the nursery phase, pigs were housed in a room with either conventional dry feeders or in a room with wet-dry feeders. When moved to the finisher, 312 barrows and 336 gilts from the conventional dry feeder room and an equal number from the wet-dry feeder room in nursery phase were randomly selected to distribute a similar number of barrows and gilts (13 barrows and 14 gilts) to each finisher pen. Thus, 24 pens contained pigs previously fed using a conventional dry feeder in nursery and the remaining 24 pens contained those previously fed using a wet-dry feeder. At start of the trial, pens of pigs were weighed and randomly allotted to the 2 feeder types in finishing barn treatments, which were arranged as a 2 × 2 factorial with main effects of feeder type in nursery and feeder type in finisher. All pigs were fed the same corn-soybean meal-based diets containing 20 to 40% DDGS during 6 dietary phases from 36 to 75 lb, 75 to 120 lb, 120 to 170 lb, 170 to 205 lb, 205 to 240 lb, and 240 lb to market (Table 1). The last phase diet contained 4.5 g/ton of Ractopamine HCl (Paylean; Elanco Animal Health, Greenfield, IN). Pens of pigs were weighed and feed disappearance was recorded at d 13, 27, 49, 69, 88, and 102 to determine ADG, ADFI, and F/G.
The experimental data were analyzed using the MIXED procedure of SAS (SAS insti-tute, Inc., Cary, NC). Pen was the experimental unit for all data and significance and tendencies were set at P < 0.05 and P < 0.12, respectively. Data were analyzed for the main effects of nursery feeder type on finisher performance, finisher feeder type, and interaction between nursery and finisher feeder types.
3 Bergstrom et al., Swine Day 2010, Report of Progress 1038, pp. 178-189.

259
Finishing Nutrition and Management
Results and DiscussionFor the overall period (d 0 to 102), pigs fed with the conventional dry feeder during the nursery phase and wet-dry feeder during the finisher phase tended to have greater ADG (P < 0.01; Table 2) compared with pigs fed with the other feeder regimens. An interac-tion (P = 0.03) was observed between nursery and finisher feeder type for F/G. Within pigs provided feed with the conventional dry feeder in the nursery phase, pigs provided feed with the conventional dry feeder in the finisher phase had poorer (P < 0.01) F/G compared with those fed with the wet-dry feeder. In contrast, for pigs provided feed with the wet-dry feeder in the nursery phase, F/G during the finisher phase was the same regardless of feeder type in the finisher phase and was similar to pigs provided feed with a dry feeder during the nursery and wet-dry feeder during the finisher phase. As a result of the tendency for increased finisher growth rate, pigs fed with the conventional dry feeder in the nursery phase and wet-dry feeder in the finisher phase had the heaviest final BW compared with those fed with the other 3 regimens.
Pigs previously fed using a conventional dry feeder in the nursery had greater ADG and ADFI (P = 0.03, P = 0.02; Table 3) compared with those on wet-dry feeder in the nurs-ery phase regardless of the effect of feeder types in finishing period. Pigs fed with wet-dry feeders in the finisher phase had higher finisher ADG and better F/G (P < 0.01, P = 0.02) compared with those fed with conventional dry feeders in finishing period. Also, the final BW of finishing pigs previously fed using conventional dry feeder in nursery was greater (P < 0.01) than those previously fed on wet-dry feeder, but pigs fed using wet-dry feeder in the finisher phase had greater (P < 0.01; Table 3) final BW compared with those fed on conventional dry feeder. Pigs fed with dry feeders in the nursery also had greater (P < 0.01) BW at the beginning of the finisher phase (d 0); however, more research needs to be done to determine if this difference was caused by nursery feeder or a random effect due to the random sample of pigs chosen from the two nursery rooms.
In this experiment, pigs fed using a wet-dry feeder during the finisher phase had a greater growth rate, which agrees with data reported by Bergstorm et al. (20104), where pigs fed with a wet-dry feeder had increased ADG and final BW compared with those fed with a conventional dry feeder. In that trial, feed efficiency was not affected regard-less the adjustment strategies; however, in this experiment we found an improvement in F/G for pigs fed with wet-dry feeders in the finisher when they had been previously fed with conventional dry feeders in the nursery.
In conclusion, pigs fed using conventional dry feeders in the nursery period had advan-tages in ADG and ADFI in the finishing period, and pigs fed using wet-dry feeders in the finishing period had the greatest growth rate and best feed efficiency. Therefore, these results indicate that using conventional dry feeders in nursery and wet-dry feeders in finisher gave the most benefit in terms of growth performance.
4 Bergstrom et al., Swine Day 2010, Report of Progress 1038, pp. 178-189.

260
Finishing Nutrition and Management
Table 1. Composition of diets (as-fed basis)1
Item Phase 1 Phase 2 Phase 3 Phase 4 Phase 5 Phase 6Ingredient, %
Corn 47.40 41.75 44.95 50.50 68.10 58.80Soybean meal (46.5% CP) CP) CP 18.30 14.55 11.35 7.40 10.10 19.35DDGS2 30.00 40.00 40.00 40.00 20.00 20.00Choice white grease 2.00 1.50 1.50 --- --- ---Limestone 1.15 1.15 1.15 1.15 1.00 1.00Salt 0.35 0.35 0.35 0.35 0.35 0.35Vitamin premix 0.10 0.10 0.10 0.09 0.09 0.09L-Threonine 0.025 --- --- --- --- ---L-Lysine sulfate 0.65 0.60 0.55 0.53 0.35 0.35Phytase3 0.01 0.01 0.01 0.01 0.01 0.01Ractopamine HCl, 9 g/lb4 --- --- --- --- --- 0.025
Total 100 100 100 100 100 100
Calculated analysisStandadized ileal digestible (SID) amino acids, %
Lysine 0.79 0.79 0.79 0.79 0.79 0.79 Isoleucine:lysine 62 68 73 73 79 84Leucine:lysine 158 191 224 174 207 240Methionine:lysine 28 33 39 31 36 42Met & Cys:lysine 57 68 79 63 74 85Threonine:lysine 65 65 69 65 71 78Tryptophan:lysine 16.5 16.5 16.5 20.0 20.0 20.0Valine:lysine 74 83 93 85 94 103Phenylalanine:lysine 77 88 98 89 100 110Tyrosine:lysine 55 63 72 64 72 81
Total lysine, % 0.88 0.92 0.96 0.90 0.93 0.97 ME, kcal/lb 1,523 1,526 1,527 1,522 1,525 1,526SID lysine:ME, g/Mcal 2.35 2.35 2.35 2.35 2.35 2.35CP, % 14.4 16.8 19.2 16.2 18.6 21.0Ca, % 0.50 0.50 0.50 0.50 0.50 0.50P, % 0.41 0.41 0.48 0.43 0.43 0.50Available P, % 0.23 0.26 0.35 0.23 0.26 0.361 The 6 diets were fed from 36 to 75 lb, 75 to 120 lb, 120 to 170 lb, 170 to 205 lb, 205 to 240 lb, and 240 lb to market.2 Dried distillers grains with solubles from Vera-Sun (Aurora, SD).3 OptiPhos 2000 (Enzyvia LLC, Sheridan, IN).4 Ractopamine HCl (Paylean; Elanco Animal Health, Greenfield, IN) at 4.5 g/ton was added.
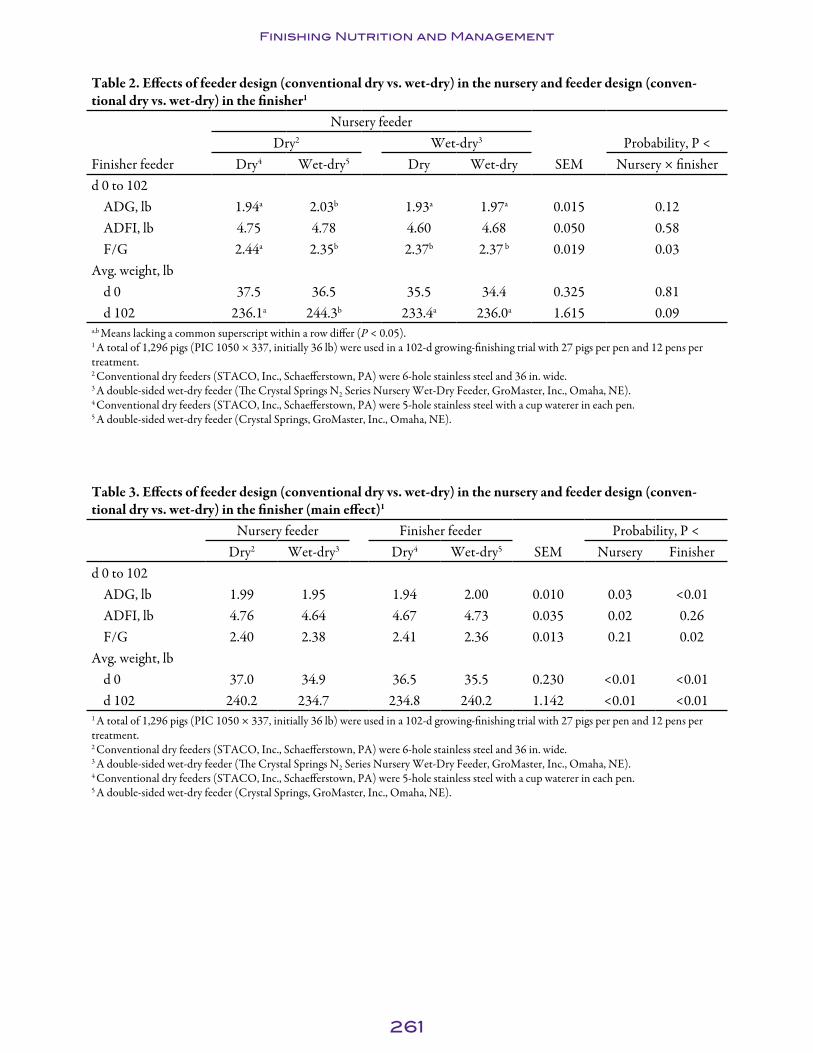
261
Finishing Nutrition and Management
Table 2. Effects of feeder design (conventional dry vs. wet-dry) in the nursery and feeder design (conven-tional dry vs. wet-dry) in the finisher1
Nursery feederDry2 Wet-dry3 Probability, P <
Finisher feeder Dry4 Wet-dry5 Dry Wet-dry SEM Nursery × finisherd 0 to 102
ADG, lb 1.94a 2.03b 1.93a 1.97a 0.015 0.12ADFI, lb 4.75 4.78 4.60 4.68 0.050 0.58F/G 2.44a 2.35b 2.37b 2.37 b 0.019 0.03
Avg. weight, lbd 0 37.5 36.5 35.5 34.4 0.325 0.81d 102 236.1a 244.3b 233.4a 236.0a 1.615 0.09
a,b Means lacking a common superscript within a row differ (P < 0.05). 1 A total of 1,296 pigs (PIC 1050 × 337, initially 36 lb) were used in a 102-d growing-finishing trial with 27 pigs per pen and 12 pens per treatment.2 Conventional dry feeders (STACO, Inc., Schaefferstown, PA) were 6-hole stainless steel and 36 in. wide. 3 A double-sided wet-dry feeder (The Crystal Springs N2 Series Nursery Wet-Dry Feeder, GroMaster, Inc., Omaha, NE).4 Conventional dry feeders (STACO, Inc., Schaefferstown, PA) were 5-hole stainless steel with a cup waterer in each pen.5 A double-sided wet-dry feeder (Crystal Springs, GroMaster, Inc., Omaha, NE).
Table 3. Effects of feeder design (conventional dry vs. wet-dry) in the nursery and feeder design (conven-tional dry vs. wet-dry) in the finisher (main effect)1
Nursery feeder Finisher feeder Probability, P <Dry2 Wet-dry3 Dry4 Wet-dry5 SEM Nursery Finisher
d 0 to 102ADG, lb 1.99 1.95 1.94 2.00 0.010 0.03 <0.01ADFI, lb 4.76 4.64 4.67 4.73 0.035 0.02 0.26F/G 2.40 2.38 2.41 2.36 0.013 0.21 0.02
Avg. weight, lbd 0 37.0 34.9 36.5 35.5 0.230 <0.01 <0.01d 102 240.2 234.7 234.8 240.2 1.142 <0.01 <0.01
1 A total of 1,296 pigs (PIC 1050 × 337, initially 36 lb) were used in a 102-d growing-finishing trial with 27 pigs per pen and 12 pens per treatment.2 Conventional dry feeders (STACO, Inc., Schaefferstown, PA) were 6-hole stainless steel and 36 in. wide.3 A double-sided wet-dry feeder (The Crystal Springs N2 Series Nursery Wet-Dry Feeder, GroMaster, Inc., Omaha, NE).4 Conventional dry feeders (STACO, Inc., Schaefferstown, PA) were 5-hole stainless steel with a cup waterer in each pen.5 A double-sided wet-dry feeder (Crystal Springs, GroMaster, Inc., Omaha, NE).
262
Finishing Nutrition and Management
Effects of Stocking Density on Lightweight Pig Performance Prior to Marketing1
M. L. Potter2, S. S. Dritz3, M. D. Tokach, J. L. Nelssen, J. R. Bergstrom4, R. D. Goodband, and J. M. DeRouchey
SummaryA total of 336 finishing gilts (initially 258 lb) were used in a 21-d growth trial to evalu-ate the effects of increasing stocking density on performance of pigs classified in the slower-growing fraction of the pig population. Pens of gilts were blocked to minimize variation associated with barn location and the diet fed for the 14 d prior to the start of this trial. Within each block, pens of pigs were randomly allotted to treatments (6 pens per treatment). Treatments included stocking pens with 8, 12, 16, or 20 pigs per pen, allowing 22.5, 15.0, 11.3, and 9.0 ft2/pig, respectively. Pens were weighed and feed intake determined on d 0, 7, 14, and 21 to calculate ADG, ADFI, and F/G. Pigs were fed a common diet with the inclusion of 4.5 g/ton Ractopamine HCl (RAC) (Paylean; Elanco Animal Health, Greenfield, IN) for the duration of the trial.
Overall, as the number of pigs per pen increased, ADG and ADFI decreased (ADG and ADFI: linear, P < 0.01; ADFI: quadratic, P = 0.01), but no differences were measured in F/G. These performance differences resulted in numeric differences in pig weights (8 pigs: 316.6 lb, 12 pigs: 308.8 lb, 16 pigs: 310.9 lb, and 20 pigs: 307.0 lb) on d 21. These data indicate that in this commercial finishing barn, finisher pig ADG and ADFI improved as the number of pigs in each pen decreased. These findings suggest that as pigs are held in barns for extra days to add weight, their growth rates may be affected by stocking density.
Key words: growth, lightweight pig, stocking density
IntroductionStrategic planning is often necessary to manage the lightweight pig population in finish-ing barns around the time of marketing. Management practices to improve the growth rate of these slower-growing pigs and allow them to reach market weight in the avail-able amount of time are primarily limited to dietary modifications, altering pen stock-ing density, and avoiding excessive pig movements. For the majority of the finishing phase, the recommendations for finishing pig stocking density vary from 6.0 to 9.0 ft2/pig, but these recommendations depend on whether the producer wishes to optimize growth rate or economic return. These recommendations also are guidelines for barn-loading strategies. For determining barn-unloading strategies, especially strategies to manage the tail-end, lightweight pigs, data are limited. Often as pigs are marketed from finisher barns, pens will become empty, but not in a uniform manner. Previous work has indicated that mixing pigs prior to market will not be detrimental to pig perfor-
1 Appreciation is expressed to J-Six Enterprises, Seneca, KS, for their assistance and for providing the pigs and facilities used in this experiment.2 Abilene Animal Hospital, PA, Abilene, KS.3 Department of Diagnostic Medicine and Pathobiology, Kansas State University.4 DSM Nutritional Products North America, Parsippany, NJ.
263
Finishing Nutrition and Management
mance as long as pigs are given at least 2 weeks in their new environment.5 In these trials, the expected impact of remixing the lightweight tail-end pigs on growth rate and feed intake was less than expected, and the effect of stocking density was greater than expected. Therefore, moving and reorganizing pen structures could be a viable option for producers if an optimum stocking density was identified. This technique may be especially useful in multiple barn sites where additional grow-out days can be achieved for the lightweight pigs while other barns on the site are being cleaned. The objective of this trial was to determine the effects of moving pigs to different stocking densities (22.5, 15.0, 11.3, and 9.0 ft2/pig) on pig performance prior to market.
ProceduresThe Kansas State University Institutional Animal Care and Use Committee approved the procedures used in this study. This experiment was conducted in a standard, double-curtain-sided, research finishing barn in northeast Kansas. All pens had slatted concrete flooring, were 10 ft by 18 ft, and were equipped with a single-sided dry, 3-hole, stainless steel feeder (AP-3WFS-QA; Automated Production Systems, Assumption, IL) and a dual swinging water source (Trojan Plastic Waterswing; Trojan Specialty Products, Dodge City, KS), allowing pigs to have ad libitum access to feed and water. Each hole in the conventional dry feeder was 14 in. long. The barn was equipped with an automated feeding system (FeedPro; Feedlogic Corp., Willmar, MN) to allow recording of feed delivery to individual pens.
A total of 336 market age but lightweight commercial gilts (approximately 28 wk of age and 258 lb) were used to determine the effects of increasing pen-stocking density on pig performance prior to marketing. On d 0, 24 test pens were blocked to account for barn location and diet previously fed and allotted to 1 of 4 stocking density treatments (6 pens per treatment). Treatments were stocking pens with 8, 12, 16, or 20 pigs per pen, allowing 22.5, 15.0, 11.3, and 9.0 ft2/pig and 5.3, 3.5, 2.6, and 2.1 in. of feeder length per pig, respectively.
A simple protocol was followed to stock the new test pens with pigs from pens previ-ously occupied in the barn (original pens). From the original occupied pens within the barn, pigs were identified by the diet fed for the previous 14 d (gilts fed a diet without added RAC; gilts fed a diet without RAC for 7 d then fed a diet with 4.5 g/ton RAC for 7 d, or gilts fed a diet with 4.5 g/ton RAC for 14 d). Within each diet group, gilts were gate-cut (randomly selected) from their original pens to the new test pens accord-ing to the block and treatment assignments of the new pens. Test pens consisted of gilts from a minimum of 2 original pens, forcing each pen of gilts to establish a new social structure. Once on test, all pigs were fed a common diet with the inclusion of 4.5 g RAC/ton of complete feed.
Pens of pigs were weighed and feed intake was determined on d 0, 7, 14, and 21. Due to severe lameness, 1 pig from a single pen of 20 pigs was removed during the trial. Although weight and pig days associated with this removed pig were accounted for in the data analysis, no adjustment was made in the pen during the trial to account for the additional space per pig remaining in the pen.
5 Potter et al., Swine Day 2010. Report of Progress 1038, pp. 223-226.

264
Finishing Nutrition and Management
Data were analyzed as a randomized complete block design with stocking density treat-ment as a fixed effect and block as a random effect using the GLIMMIX procedure in SAS (SAS Institute, Inc., Cary, NC). Pen was the experimental unit for the analysis. The effects of increasing stocking density on performance were determined by linear and quadratic polynomial contrasts.
Results and DiscussionStocking density affected ADFI (linear, P < 0.001; Table 1) and ADG (linear, P < 0.001) but not F/G within the first 7 d of this trial. From d 7 to 14 and d 14 to 21, stocking density did affect ADFI (linear, P ≤ 0.01; d 14 to 21: quadratic, P < 0.01) but not growth rate (linear and quadratic, P ≥ 0.41). The only tendency for an effect of stocking density on F/G was from d 14 to 21, when F/G improved (linear; P = 0.06) as the number of pigs per pen increased.
Overall, decreasing stocking density increased ADG (linear, P < 0.01) and ADFI (linear, P < 0.001; quadratic, P = 0.01) but did not influence F/G. These performance differences throughout the trial resulted in numeric differences in final weight on d 21, with pigs stocked at 8 pigs per pen (316.6 lb) numerically heavier than pigs stocked at 12 (308.8 lb), 16 (310.9 lb), or 20 (307.0 lb) pigs per pen.
These results indicate that the number of pigs per pen had an impact on pig perfor-mance prior to marketing even when the pigs were classified as the slower-growing lightweight fraction of pigs in the barn. Findings from a previous study evaluating different stocking densities along with mixing status also suggested that the stocking density of the pen had a larger impact on performance than the mixing status.6 In that study, pigs were stocked with either 12 or 20 pigs per pen.
Our study provides additional evidence that lightweight pig performance is influenced by stocking density. The effect was most pronounced during the first week after mixing; however, the improvements in growth rate and feed intake demonstrated by pigs in pens stocked with 8 pigs suggest that the stocking density to maximize lightweight pig performance just prior to marketing has not yet been established and may be achieved by providing pigs with at least 22.5 ft2/pig.
Additionally, other factors known to affect pig performance also were altered as stock-ing density changed in this trial, including feeder length and access per pig, water access per pig, and floor space available per pig. The improvements seen in this trial with the reduction in number of pigs per pen may be a result of just one of these factors or may have occurred as a result of a combination of these factors. However, from a practical standpoint, our procedures mimic how remixing would occur in typical production conditions because additional water or feeder access would not be provided.
Nevertheless, these results indicate that as the number of pigs per pen was reduced, feed consumption and subsequent growth rate was increased. Stocking pigs at lower densi-ties will improve performance of lightweight pigs prior to marketing and potentially result in less time necessary for slower-growing pigs to reach the targeted market weight.
6 Potter et al., Swine Day 2010. Report of Progress 1038, pp. 223-226.
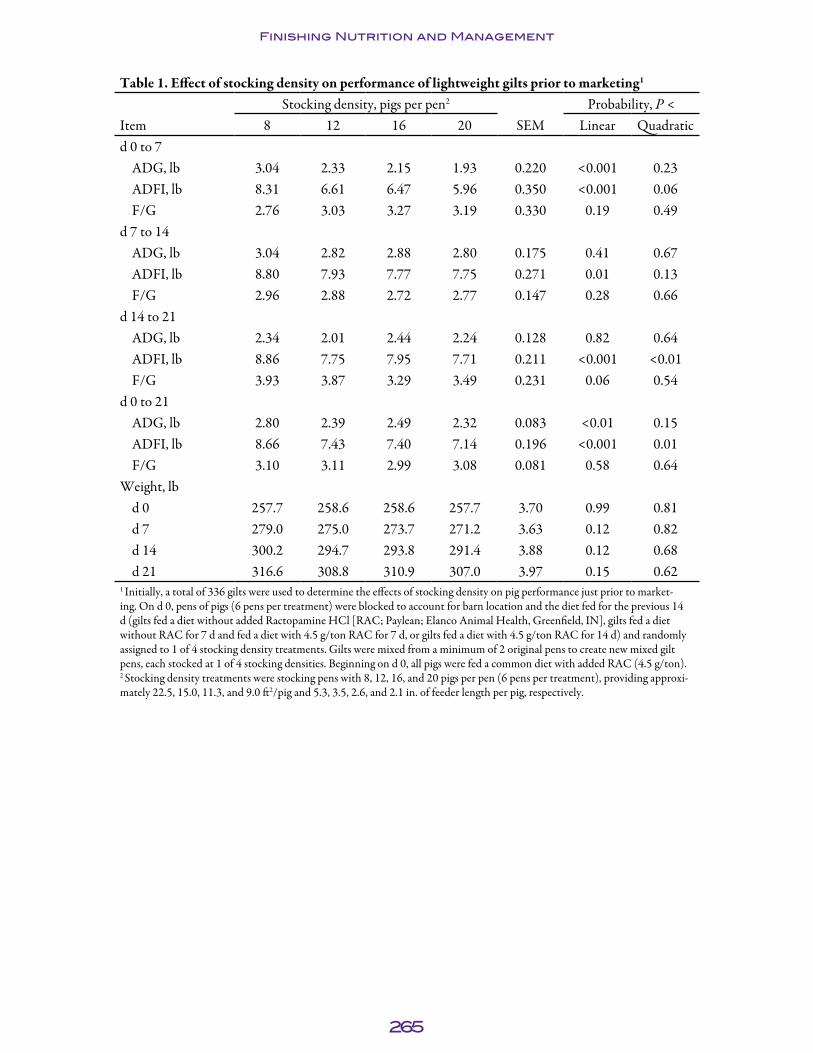
265
Finishing Nutrition and Management
Table 1. Effect of stocking density on performance of lightweight gilts prior to marketing1
Stocking density, pigs per pen2 Probability, P <Item 8 12 16 20 SEM Linear Quadraticd 0 to 7
ADG, lb 3.04 2.33 2.15 1.93 0.220 <0.001 0.23ADFI, lb 8.31 6.61 6.47 5.96 0.350 <0.001 0.06F/G 2.76 3.03 3.27 3.19 0.330 0.19 0.49
d 7 to 14ADG, lb 3.04 2.82 2.88 2.80 0.175 0.41 0.67ADFI, lb 8.80 7.93 7.77 7.75 0.271 0.01 0.13F/G 2.96 2.88 2.72 2.77 0.147 0.28 0.66
d 14 to 21ADG, lb 2.34 2.01 2.44 2.24 0.128 0.82 0.64ADFI, lb 8.86 7.75 7.95 7.71 0.211 <0.001 <0.01F/G 3.93 3.87 3.29 3.49 0.231 0.06 0.54
d 0 to 21ADG, lb 2.80 2.39 2.49 2.32 0.083 <0.01 0.15ADFI, lb 8.66 7.43 7.40 7.14 0.196 <0.001 0.01F/G 3.10 3.11 2.99 3.08 0.081 0.58 0.64
Weight, lbd 0 257.7 258.6 258.6 257.7 3.70 0.99 0.81d 7 279.0 275.0 273.7 271.2 3.63 0.12 0.82d 14 300.2 294.7 293.8 291.4 3.88 0.12 0.68d 21 316.6 308.8 310.9 307.0 3.97 0.15 0.62
1 Initially, a total of 336 gilts were used to determine the effects of stocking density on pig performance just prior to market-ing. On d 0, pens of pigs (6 pens per treatment) were blocked to account for barn location and the diet fed for the previous 14 d (gilts fed a diet without added Ractopamine HCl [RAC; Paylean; Elanco Animal Health, Greenfield, IN], gilts fed a diet without RAC for 7 d and fed a diet with 4.5 g/ton RAC for 7 d, or gilts fed a diet with 4.5 g/ton RAC for 14 d) and randomly assigned to 1 of 4 stocking density treatments. Gilts were mixed from a minimum of 2 original pens to create new mixed gilt pens, each stocked at 1 of 4 stocking densities. Beginning on d 0, all pigs were fed a common diet with added RAC (4.5 g/ton).2 Stocking density treatments were stocking pens with 8, 12, 16, and 20 pigs per pen (6 pens per treatment), providing approxi-mately 22.5, 15.0, 11.3, and 9.0 ft2/pig and 5.3, 3.5, 2.6, and 2.1 in. of feeder length per pig, respectively.

266
Finishing Nutrition and Management
Evaluation of Ractopamine HCl Feeding Programs on Growth Performance and Carcass Characteristics of Finishing Pigs1
W. Ying, J. M. DeRouchey, M. D. Tokach, S. S. Dritz2, R. D. Goodband, and J. L. Nelssen
SummaryA total of 934 barrows and gilts (PIC 337 × 1050, initially 240 lb) were used in a 26-d experiment to evaluate the effect of different Ractopamine HCl (RAC) feeding programs on growth and carcass traits of finishing pigs. Treatments included a basal diet with (1) no RAC for 26 d (control), (2) 7.5 ppm RAC for 26 d (constant), (3) 5 ppm RAC for d 0 to 14 and 10 ppm for d 14 to 26 (step-up), and (4) RAC concentration increased daily from 5 ppm on d 0 to 10 ppm on 26 d by using the FEEDPro (Feedlogic Corp., Willmar, MN) system (curve). Each treatment had 10 pens with a similar number of barrows and gilts in each pen. From d 0 to 14, pigs fed diets containing RAC had greater (P < 0.001) ADG and better (P < 0.001) F/G than those fed the control diet. Pigs fed the constant or step-up RAC feeding methods had greater (P < 0.04) ADFI compared with those fed the control diet. From d 14 to 26, all RAC-fed pigs had greater (P < 0.001) ADG and better (P < 0.001) F/G than control pigs.
Overall, pigs fed diets containing RAC had improved (P < 0.001) ADG and better F/G than pigs fed the control diet. Pigs fed the step-up RAC program had greater (P = 0.01) ADG and better (P = 0.02) F/G than the constant RAC program. Pigs marketed on d 14 and 26 had heavier (P < 0.001) HCW when fed diets containing RAC compared with control pigs. Pigs fed constant RAC had greater (P = 0.002) carcass yield than control pigs. Pigs fed the constant RAC program also had greater (P = 0.03) loin depth on d 14 than control pigs. No differences were found in carcass traits among RAC treatments. Feeding RAC improved performance regardless of feeding method, but few differences were present among the RAC feeding programs in carcass weights or measurements.
Key words: feeding program, finishing pig, growth, Ractopamine HCl
IntroductionRactopamine HCl (RAC; Paylean; Elanco Animal Health, Greenfield, IN) has been widely used to improve growth and carcass characteristics of late-finishing pigs. The maximal growth responses to feeding RAC occur during the initial feeding period, but these responses decline over time. The cause of the reduced performance to RAC over time is thought to be down-regulation of beta receptors. Although different RAC feed-ing strategies have been studied, data are not consistent on the ideal approach between a constant or step-up feeding method. With the application of automatic feeding system
1 Appreciation is expressed to New Horizon Farms for use of pigs and facilities and to Richard Brobjorg, Marty Heintz, and Scott Heidebrink for technical assistance.2 Department of Diagnostic Medicine/Pathobiology, College of Veterinary Medicine, Kansas State University.

267
Finishing Nutrition and Management
in swine barns, pigs can be fed following a curve, slowly increasing the RAC dosage through time. We hypothesized that gradually increasing RAC dosage on a daily basis may provide for an improved growth and economic return compared to constant or step-up feeding.
ProceduresAll experimental procedures were approved by the Kansas State University Animal Care and Use Committee. The experiment was conducted in a commercial research finishing barn in southwestern Minnesota. The barn was naturally ventilated and double-curtain-sided. Pens had completely slatted flooring and deep pits for manure storage. Each pen was equipped with a 5-hole, stainless steel, dry self-feeder and a cup waterer for ad libitum access to feed and water. The barn had an automated feeding system (FeedPro; Feedlogic Corp., Willmar, MN) capable of delivering and measuring feed amounts added on an individual pen basis.
A total of 934 barrows and gilts (PIC 337 × 1050) averaging approximately 240 lb were used in a 26-d experiment with 22 to 24 pigs per pen and 10 pens per treatment. Pens were ranked by average pig weight, then allotted to 1 of 4 experimental treatments in a randomized design. Pigs had ad libitum access to feed and water. Treatments included a basal diet (Table 1) with (1) no RAC for 26 d (control), (2) 7.5 ppm RAC for 26 d (constant), (3) 5 ppm RAC from d 0 to 14 and 10 ppm from d 14 to 26 (step-up), and (4) RAC dosage increased daily from 5 ppm on d 0 to 10 ppm on 26 d by using the FeedPro system (curve). Average daily gain, ADFI, and F/G were determined by weigh-ing pigs and measuring feed disappearance every 7 d.
According to the normal marketing procedure of the farm, the 9 heaviest pigs (deter-mined visually) were topped from each pen on d 14 of trial. The rest of pigs, except cull (6 with umbilical rupture, 2 with tail bites, and 2 lame pigs) and light pigs (BW less than 200 lb; 4 pigs) that didn’t meet the minimum acceptable packing plant specifica-tions, were marketed on d 26. All pigs were tattooed with a specific pen identity to attribute carcass data back to the specific pen. All pigs were transported to JBS Swift and Company (Worthington, MN) for processing and data collection. Carcass yield, backfat, lean percentage, and loin depth were collected with pen as the experimental unit.
All data were analyzed using the MIXED procedure of SAS (SAS Institute, Inc., Cary, NC) with pen as the experimental unit for analysis. Pen was the experimental unit for backfat, loin depth, and lean percentage, for which HCW was used as a covariate. The main effects of different RAC feeding methods were compared.
Results and DiscussionFrom d 0 to 14, pigs fed diets containing RAC had improved (P < 0.001) ADG and F/G compared with control pigs (Table 2). In addition, constant and step-up RAC feeding programs had greater (P < 0.04) ADFI than the control fed pigs. No significant differences in growth performance were observed among the RAC feeding programs.
From d 14 to 26, regardless of feeding program, pigs fed diets containing RAC had better (P < 0.001) ADG and F/G than control-fed pigs; however, differences in
268
Finishing Nutrition and Management
growth performance were observed among RAC treatments. Pigs fed the step-up RAC program (10 ppm) had greater (P < 0.001) ADG and better (P = 0.005) F/G compared with those fed the constant RAC program (7.5 ppm); pigs fed the curve RAC program were intermediate.
Overall (d 0 to 26), pigs fed RAC had improved (P < 0.001) ADG and F/G. Addition-ally, pigs fed the step-up RAC program had greater (P = 0.01) ADG and better (P = 0.02) F/G than those fed the constant RAC program. No differences in growth were observed between pigs fed the RAC step-up and curve treatments. Due to the improved ADG for pigs fed RAC, final BW was heavier (P < 0.001) than pigs fed the control diet at the end of the trial.
For carcass characteristics, pigs fed diets containing RAC had heavier (P < 0.001) HCW than control pigs on d 14, 26, and for the combined data (Table 3). Addition-ally, pigs fed the constant RAC program had greater (P = 0.002) carcass yield compared with control pigs. Pigs marketed on d 14 had greater (P = 0.03) loin depth when fed Ractopamine than control pigs. Carcass traits among the 3 RAC feeding programs did not differ.
In conclusion, regardless of feeding method, pigs fed diets containing RAC had improved growth performance compared with those fed the control diet. Pigs fed the step-up RAC program had improved ADG and F/G from d 14 to 26 compared with pigs fed the constant RAC program. Pigs fed the RAC curve program had similar growth performance compared with other RAC feeding programs. In addition, feeding RAC resulted in heavier HCW, and pigs fed the constant RAC diet showed improved carcass yield compared with the control pigs.

269
Finishing Nutrition and Management
Table 1. Composition of basal diet (as-fed basis)1
ItemIngredient, %
Corn 62.40Soybean meal (46.5% CP) 20.60Dried distillers grains with solubles 15.00Limestone 1.025Salt 0.35Vitamin and trace mineral premix 0.09L-Threonine 0.06Biolys (50% Lys) 0.475Phytase2 0.005
Total 100.00
Calculated analysisStandardized ileal digestible (SID) amino acids, %
Lysine 1.00Isoleucine:lysine 66Leucine:lysine 164Methionine:lysine 29Met & Cys:lysine 59Threonine:lysine 65Tryptophan:lysine 17.5Valine:lysine 78
Total lysine, % 1.14ME, kcal/lb 1,527SID lysine:ME, g/Mcal 2.97CP, % 19.4Ca, % 0.48Available P, % 0.211 Ractopamine HCl (Paylean; Elanco Animal Health, Greenfield, IN) was added to provide the control diet (none), 7.5 ppm RAC for 26 d (constant), 5 ppm RAC for d 0 to 14 and 10 ppm for d 14 to 26 (step-up), and RAC concentration increased daily from 5 ppm on d 0 to 10 ppm on d 26 (curve).2 OptiPhos 2000 (Enzyvia LLC, Sheridan, IN) provided 0.12% available P.

270
Finishing Nutrition and Management
Table 2. Effect of Ractopamine HCl (RAC) feeding program on growth performance of finishing pigs1
Feeding program2
Item Control Constant Step-up Curve SEMd 0 to14
ADG, lb 1.83a 2.33b 2.38b 2.40b 0.06ADFI, lb 5.40a 5.74b 5.74b 5.48ab 0.15F/G 2.97a 2.47b 2.42b 2.30b 0.10
d 14 to 26ADG, lb 1.96a 2.19b 2.56c 2.39bc 0.10ADFI, lb 6.54 6.14 6.27 6.45 0.21F/G 3.37a 2.83b 2.46c 2.72b 0.13
d 0 to 26ADG, lb 1.87a 2.29b 2.44c 2.40bc 0.06ADFI, lb 5.79 5.88 5.92 5.81 0.15F/G 3.11a 2.57b 2.43c 2.44bc 0.07
BW3, lbd 0 240.2 240.3 240.4 240.4 3.5d 14 (before topping) 265.8a 273.0b 273.7b 274.0b 3.3d 26 277.8a 288.7b 294.7b 292.8b 4.2
a,b,c Means on the same row with different superscripts differ (P < 0.05).1 A total of 934 pigs (PIC 337 × 1050, initially 240 lb) were used with 22 to 24 pigs per pen and 10 pens per treat-ment. Nine pigs were marketed per pen on d 14 of the experiment.2 Control = no RAC for 26 d; constant = 7.5 ppm RAC for 26 d; step-up = 5 ppm RAC from d 0 to 14 and 10 ppm from d 14 to 26; curve = RAC concentration increased daily from 5 ppm on d 0 to 10 ppm on d 26 using the FeedPro system.3 BW was obtained at farm site.

271
Finishing Nutrition and Management
Table 3. Effect of Ractopamine HCl (RAC) feeding program on carcass traits of finish-ing pigs1
Feeding program2
Item Control Constant Step-up Curve SEMd 14 marketing
Live wt, lb3 270.8 277.6 275.0 276.7 2.3HCW, lb 201.4a 208.6b 206.0b 207.0b 1.7Yield, %4 74.4a 75.1b 74.9ab 74.8ab 0.2Backfat, in.5 0.67 0.67 0.69 0.66 0.02Loin depth, in.5 2.20a 2.39b 2.24ab 2.24ab 0.05Lean, %5 55.2 55.8 55.0 55.5 0.4
d 26 marketing6
Live wt, lb3 269.3a 280.0b 281.3b 281.0b 2.5HCW, lb 200.0a 211.3b 210.2b 210.1b 2.2Yield, %4 74.3a 75.4b 74.7ab 74.8ab 0.3Backfat, in.5 0.63 0.57 0.60 0.61 0.02Loin depth, in.5 2.55 2.57 2.57 2.64 0.03Lean, %5 56.9 57.0 56.7 57.0 0.6
Overall marketing7
Live wt, lb3 270.0a 279.1b 278.8b 279.4b 2.1HCW, lb 200.6a 210.2b 208.6b 208.9b 1.8Yield, %4 74.3a 75.3b 74.8ab 74.8ab 0.2Backfat, in.5 0.64 0.61 0.63 0.63 0.02Loin depth, in.5 2.42 2.49 2.43 2.49 0.04Lean, %5 56.3 56.5 56.0 56.4 0.4
a,b,c Means on the same row with different superscripts differ (P < 0.05).1A total of 904 pigs (PIC 337 × 1050, initially 240 lb) were used for obtaining carcass data with 9 pigs per pen marketed on d 14 and the remaining pigs marketed on d 26.2 Control = no RAC for 26 d; constant = 7.5 ppm RAC for 26 d; step-up = 5 ppm RAC for d 0 to 14 and 10 ppm for d 14 to 26; curve = RAC concentration increased daily from 5 ppm on d 0 to 10 ppm on d 26 using the FeedPro system.3 Live wt was obtained at packing plant.4 Percentage yield was calculated by dividing HCW by live wt obtained at the packing plant.5 Values are adjusted to a common carcass weight.6 All pigs were marketed, except 14 cull or light pigs that included 4 pigs from treatment A, 5 pigs from treatment B, 3 pigs from treatment C, and 2 pigs from treatment D.7 Overall marketing data combines data from marketing group on d 14 and d 26.

272
Finishing Nutrition and Management
Effects of Diet Mix Time on Growth Performance of Finishing Pigs Fed Ractopamine HCl
C. B. Paulk, L. J. McKinney1, J. D. Hancock, S. M. Williams, S. Issa, and T. L. Gugle
SummaryTwo experiments were conducted to determine the effects of mix uniformity for diets with Ractopamine HCl (RAC) (Paylean; Elanco Animal Health, Greenfield, IN) when fed to finishing pigs. In Exp. 1, a total of 200 pigs (PIC TR4 × 1050; average BW of 198.4 lb) were used in a 33-d growth assay arranged in a randomized complete-block design with 5 pigs per pen and 8 pens per treatment. Treatments were a corn-soybean meal-based control diet mixed for 360 sec and the mixed control diet with 9 g/ton RAC added before additional mixing for 0, 30, 120, and 360 sec. Thus, this experiment was designed to determine the effects of nutrient utilization from a thoroughly mixed diet with a potential non-uniform distribution of RAC. Pigs fed diets with RAC had improved (P < 0.05) ADG, F/G, final BW, HCW, dressing percentage, backfat thick-ness, loin depth, and percentage carcass lean compared with control pigs. Increasing mix time from 0 to 360 sec decreased CV for Chromium (Cr) from 67 to 12%, but had no effect on the response to RAC for any growth or carcass measurement.
In Exp. 2, a total of 160 pigs (PIC TR4 × 1050; average BW of 205 lb) were used in a 27-d growth assay arranged in a completely randomized design with 2 pigs per pen and 16 pens per treatment. Treatments were a corn-soybean meal-based control mixed for 360 sec and control diets with 9 g/ton RAC mixed for 0, 30, 120, and 360 sec. Thus, this experiment was designed to determine the combined effects of potentially non-uniform distribution of both nutrients and RAC. The use of RAC increased (P < 0.01) ADG, F/G, final BW, HCW, dressing percentage, percentage lean, and loin depth. Increasing mix times from 0 to 360 sec decreased CV for salt from 51 to 12% with no significant effect on ADG, F/G, HCW, dressing percentage, backfat thickness, loin depth, or percentage lean.
In conclusion, increasing mix time of diets from 0 to 360 sec did not significantly affect the response of finishing pigs to RAC, but in Exp. 2 a mix time of 120 sec for the complete diet and RAC (CV of 15%) resulted in the numerically lowest (quadratic, P < 0.15) F/G.
Key words: diet CV, mix time, finishing pig, Ractopamine HCl
IntroductionThe goal of mixing a diet is to ensure that each animal receives the intended daily intake of nutrients. The proposed industry standard to represent a homogenous mixture is a diet mixed long enough to ensure a CV of 10% for the concentration of salt in
1 Grain Science Department, Kansas State University.

273
Finishing Nutrition and Management
10 random samples taken from the batch of feed. Previous research at Kansas State University has reported no effects on growth performance, carcass characteristics, or bone strength in finishing pigs fed diets with CV for salt of 40 to 50% (Traylor et al., 19942); however, concern is growing about the importance of mixing with the increased use of low inclusion level ingredients.
Ractopamine HCl is a feed additive used in late finishing swine diets to improve growth performance and carcass leanness. A quite low inclusion of only 4.5 to 9 g/ton of RAC for the last 45 to 90 lb of gain is recommended by the manufacturer. For maximum performance in pigs consuming diets with RAC, much attention is given to dietary factors such as increasing the concentration of protein and amino acids, but a factor that has not been addressed is the importance of mixing time for diets with RAC; therefore, our objective was to determine the effects of dietary mix uniformity on the response to RAC in finishing pigs.
Materials and MethodsGeneral. This experimental protocol was approved by the Kansas State University Insti-tutional Animal Care and Use Committee.
Diets were mixed in a 3,000-lb-capacity horizontal ribbon mixer (DS30, Davis and Sons Manufacturing Company, Bonner Springs, KS) at the K-State Animal Science Feed Mill. Batch size was 2,000 lb and batches were mixed separately. Mix times were the amount of time the mixer was turned on before opening the discharge gate. The mixer discharge time is approximately 60 to 100 sec. After mix times were completed, the feed was discharged via a 8.2-ft-long screw conveyor, dropped into a bucket elevator, elevated 96.8 ft, and dropped 36.1 ft into a bin. The feed then was carried 36.1 ft hori-zontally via a round-bottom conveyor and dropped 42.7 ft into a surge bin to be bagged. Each bag of feed was labeled and a sample was collected from every fourth bag (a total of 10 samples) as the feed was added to individual feeders.
Pigs and feeders were weighed at first and final day of the growth assay to allow for calculation of ADG, ADFI, and F/G. The pigs were tattooed and shipped to a commer-cial abattoir (Farmland Foods Inc., Crete, NE) and HCW, carcass yield, backfat thick-ness, loin depth, and percentage fat-free lean index (FFLI) were recorded.
All data were analyzed as a randomized complete block design for Exp. 1 and a completely randomized design for Exp. 2 using the MIXED procedure of SAS (SAS Institute Inc., Cary, NC). Pen was the experimental unit with the shape of the response to increasing mix time characterized using polynomial regression for unequally spaced treatments. For Exp. 2, initial BW was used as a covariate. Hot carcass weight was used as a covariate for analyses of backfat thickness, loin depth, and FFLI. Means were considered significant at P < 0.05 and trends at P < 0.15.
Experiment 1. Two hundred finishing pigs (TR4 × PIC 1050, initially 198.4 lb) were used in a 33-d growth assay to determine the effects of mix time of diets with RAC on growth performance. The pigs were weighed, blocked by BW, and allotted to pens based on sex and ancestry. Pigs were assigned to 10-ft by 5-ft pens with concrete slatted floor-
2 Traylor et al., Swine Day 1994, Report of Progress 717, pp. 175.

274
Finishing Nutrition and Management
ing and a nipple waterer and single-hole self-feeder to allow ad libitum consumption of feed and water. Each pen had 5 pigs per pen and each treatment had 8 pens.
All diets (Table 1) were formulated to 16% CP, 1.01% total lysine, 0.65% Ca, 0.56% total P, and to meet or exceed all other nutrient requirements suggested by the National Research Council (NRC, 19983) for 176- to 265-lb pigs. To prepare the diets, the major ingredients (corn and soybean meal) were augured into the stopped mixer, the micro ingredients (monocalcium phosphate, limestone, synthetic amino acids, salt, vitamins, and minerals) were added, and the complete diet was mixed for 360 sec.
The control diet was corn-soybean meal-based and mixed for 360 sec. Other treat-ments were the control diet mixed for 360 sec, 9 g/ton of RAC and 0.5% chromic oxide added, and the diet mixed for an additional 0, 30, 120, and 360 sec. A CV was calcu-lated by expressing the standard deviation for Cr concentration in the 10 samples as a percentage of the grand mean.
Experiment 2. One hundred and sixty finishing pigs (TR4 × PIC 1050, initially 205 lb) were used in a 27-d growth assay. The pigs were weighed and allotted to pens based on weight, sex, and ancestry. Pigs were assigned to 10-ft by 5-ft pens with concrete slatted flooring and nipple waterer and single-hole self-feeder to allow ad libitum consump-tion of feed and water. There were a total of 80 pens with 2 pigs per pen and 16 pens per treatment.
All diets (Table 1) were formulated the same as in Exp. 1. To prepare the diets, the major ingredients (corn and soybean meal) were augured into the stopped mixer, the micro ingredients (monocalcium phosphate, limestone, synthetic amino acids, salt, vitamins, and minerals) were added, and the complete diet was mixed for 360 sec.
The control diet was a corn-soybean meal-based and mixed for 360 sec. Other treat-ments were the same formulation as the control with 9 g/ton RAC. These diets were mixed for 0, 30, 120, and 360 sec. In contrast with Exp. 1, mix uniformity was deter-mined using Quantab Cl titrators (low range 0.005 to 0.1% as NaCl; Environmental Test Systems) to measure the concentration of salt.
Results and DiscussionExperiment 1. Pigs fed diets with RAC had greater (P < 0.01) ADG, improved (P < 0.01) F/G, and decreased (P < 0.002) ADFI compared with pigs fed the control diet (Table 2). HCW and carcass yield improved (P < 0.05) when pigs were fed diets with RAC compared with those fed the control diet. In addition to the improvements in HCW and carcass yield for the pigs in our experiment, pigs fed diets with RAC had decreased (P < 0.005) backfat thickness compared to those fed the control diet. Finally, loin depth (P < 0.003) and percentage FFLI (P < 0.002) were greater for pigs fed diets with RAC.
As additional mix time increased from 0 to 360 sec, CV for Cr decreased from 67 to 12%. The majority of this improvement in uniformity occurred during the first 30 sec
3 NRC. 1998. Nutrient Requirements of Swine. 10th ed. Natl. Acad. Press, Washington, DC.

275
Finishing Nutrition and Management
of mixing, with CV dropping from 67 to 37, and an additional 360 sec of mix time needed to decrease the CV further to 12%.
As for the effect of these changes in CV on animal performance, increasing mix time of diets after addition of RAC had no effect on ADG, ADFI, or F/G. Furthermore, increasing mix time from 0 to 360 sec yielded no differences in HCW or loin depth. A quadratic response (P < 0.03) was observed for backfat thickness and a tendency (P < 0.07) was found for this same quadratic response in carcass yield and percentage carcass lean, but these effects did not indicate a positive effect of increased mix time.
Experiment 2. As in Exp. 1, pigs fed diets with RAC had improved (P < 0.001) ADG and F/G (Table 3). Pigs fed diets with RAC had greater (P < 0.05) HCW, carcass yield, loin depth, and percentage FFLI. A trend was measured toward a decrease (P < 0.07) in backfat thickness among pigs fed RAC vs. the control.
Resulting CV for salt were decreased from 51 to 12% as mix time was increased from 0 to 360 sec. The lowest CV for a diet with RAC was 12% with 360 sec of mixing, which compares favorably with the CV for the control (without RAC), also mixed for 360 sec. As in Exp. 1, the majority of improvement in diet uniformity was achieved with the first 30 sec of mixing with CV dropping from 51 to 19, and an additional 330 sec of mix time was needed to decrease the CV further to 12%. Increasing mix time of diets with RAC from 0 to 360 sec had no effect on ADG and ADFI; however, a numeric trend occurred for an improvement (quadratic, P > 0.11) in F/G, with a 5% decrease in F/G as mix time was increased from 0 to 120 sec (CV from 51 to 13%). Carcass charac-teristics did not differ (P > 0.10) when mixed time was increased from 0 to 360 sec.
In conclusion, addition of 9 g/ton RAC to diets for finishing pigs resulted in improved ADG, F/G, HCW, carcass yield, loin depth, and percentage FFLI in both of our experi-ments. Increasing the mix times from 0 to 360 sec reduced CV for Cr (Exp. 1) from 67 to 12% and CV for salt (Exp. 2) from 51 to 12%. These decreases in CV had no significant effect on growth performance or carcass measurements, but in Exp. 2, a mix time of 120 sec for the complete diet and RAC (CV of 15%) resulted in the numerically best F/G.

276
Finishing Nutrition and Management
Table 1. Composition of diets, Exp. 1 and 2 (as-fed basis)1,2
ItemIngredient, %
Corn 76.50Soybean meal (46.5% CP) 20.4L-Lysine HCl 0.25DL-Methionine 0.03L-Threonine 0.09L-Tryptophan 0.01Monocalcium P (21% P) 0.96Limestone 1.11Salt3 0.35Vitamin premix 0.15Mineral premix 0.15
Calculated analysis, %Standardized ileal digestible (SID) lysine 0.90SID methionine 0.27Ca 0.65Available P 0.27
1 Experimental treatments contained 9 g/ton of Ractopamine HCl (Paylean; Elanco Animal Health, Greenfield, IN). 2 In Exp. 1, 10 lb/ton of chromic oxide was added as a marker for determination of mix uniformity.3 In Exp. 2, salt was used as a marker for determination of mix uniformity.

277
Finishing Nutrition and Management
Table 2. Effects of a thoroughly mixed diet with a potentially non-uniform distribution of Ractopamine HCl (RAC) on finishing pig performance (Exp. 1)1
Additional mixing time of RAC, sec P-value
Item Control 0 30 120 360 SEControl
vs others2 Linear3 Quadratic3
CV for chromium, %4 15 67 37 24 12 3 0.43 0.001 0.001ADG, lb 2.54 2.66 2.73 2.70 2.74 0.06 0.02 0.49 0.91ADFI, lb 8.56 7.56 7.69 7.81 7.79 0.22 0.001 0.37 0.40F/G 3.37 2.85 2.81 2.90 2.85 0.06 0.001 0.85 0.45
Carcass measurementsHCW, lb 209.0 214.7 219.1 214.0 217.3 5.8 0.001 0.66 0.31Carcass yield, % 73.3 74.8 74.6 74.1 74.8 0.4 0.001 0.72 0.07Backfat thickness, in.5 1.00 0.86 0.92 0.95 0.88 0.04 0.005 0.88 0.03Loin depth, in.5 2.33 2.51 2.52 2.61 2.59 0.06 0.003 0.17 0.18FFLI, %5,6 47.7 50.0 49.3 49.0 49.8 0.5 0.002 0.69 0.08
1 A total of 200 finishing pigs (PIC TR4 × 1050, average initial BW of 198.4 lb, 5 pigs per pen and 8 pens per treatment) were used in a 33-d growth assay.2 Control without RAC compared to the average of the 4 treatments containing RAC.3 Polynomial regression for increasing the additional mix time of RAC from 0 to 360 sec.4 Coefficient of variation for chromium concentration was determined from ten samples, taken from every fourth bag, for each batch of feed.5 HCW used as a covariate.6 Fat-free lean index.
Table 3. Effects of potentially non-uniform distribution of both nutrients and Ractopamine HCl (RAC) on finishing pig performance (Exp. 2)1
Mixing times of diets containing RAC, sec P-value
Item Control 0 30 120 360 SEControl
vs. others2 Linear3 Quadratic3
CV for salt, %4 11 51 19 15 12 7 0.90 0.04 0.05ADG, lb5 2.37 2.75 2.72 2.83 2.76 0.05 0.001 0.69 0.20ADFI, lb5 7.86 7.80 7.62 7.64 7.51 0.14 0.18 0.22 0.77F/G5 3.33 2.84 2.81 2.70 2.72 0.06 0.001 0.13 0.15Carcass measurementsHCW, lb5 195.8 206.2 206.7 209.5 208.5 1.5 0.001 0.30 0.19Carcass yield, % 5 72.7 73.7 74.3 74.2 74.5 0.4 0.001 0.28 0.73Backfat thickness, in.6 0.85 0.76 0.80 0.76 0.79 0.03 0.07 0.83 0.64Loin depth, in. 6 2.43 2.75 2.64 2.64 2.79 0.06 0.001 0.18 0.10FFLI, %6,7 50.4 52.0 51.2 51.9 51.7 0.5 0.05 0.92 0.871 A total of 160 finishing pigs (PIC TR4 × 1050, average initial BW of 205 lb, 2 pigs per pen and 16 pens per treatment) were used in a 27-d growth assay.2 Control without RAC compared with the average of the 4 treatments containing RAC.3 Polynomial regression for increasing the mix time of the diet containing RAC from 0 to 360 sec.4 Average coefficient of variation for salt concentration was determined from 2 batches per treatment, 10 samples per batch, and samples taken from every fourth bag.5 Initial BW used as a covariate.6 HCW used as a covariate.7 Fat-free lean index.

278
Finishing Nutrition and Management
Effects of Abrupt Changes between Mash and Pellet Diets on Growth Performance in Finishing Pigs
C. B. Paulk, J. D. Hancock, J. C. Ebert1, and J. J. Ohlde1
SummaryA total of 200 finishing pigs (average initial BW of 132.3 lb) were used in a 58-d growth assay to determine the effects of an abrupt change from mash to pellets and pellets to mash on growth performance and carcass measurements. The experiment was designed as a randomized complete block with 5 pigs per pen and 10 pens per treatment. There were 4 treatments with 2 phases of diets utilized. Treatments were mash to mash, mash to pellets, pellets to mash, and pellets to pellets for Phases 1 and 2 of the experiment. For Phase 1 (d 0 to 36), pigs fed the pelleted diet had 4% greater (P < 0.06) ADG and F/G was improved (P < 0.03) by 8% compared to pigs fed mash. For Phase 2 (d 36 to 58) and overall (d 0 to 58), pigs fed the mash diet had poorer (P < 0.01) F/G than pigs fed the pelleted treatments. Indeed, pigs fed pellets the entire experiment had ADG and F/G 5 and 8% better (P < 0.01), respectively, than pigs fed mash the entire experiment. Pigs fed mash during Phase 1 then pellets during Phase 2 had improved (P < 0.01) ADG and F/G for Phase 2 compared with pigs fed pellets then mash. Overall pigs fed pellets for either Phase 1 or 2, but not both, tended to have poorer (P < 0.10) ADG and F/G compared with pigs fed pellets for the entire experiment. With HCW used as a covariate, no differences (P > 0.15) were observed in dressing percentage, fat thickness, loin depth, or percentage fat-free lean index (FFLI). Pigs fed pellets tended to have the greatest growth performance, pigs fed mash the worst, with pigs fed pellets for only part of the grow-finish phase rating intermediate.
Key words: meal, pelleting, finishing pig
IntroductionCorn is a major cereal grain fed to swine in the United States. The recent price of corn has reached record highs and pushed swine producers to try to maximize efficiency of gain. Moreover, producers are turning to feed processing technologies to maximize feed utilization. Adding the necessary infrastructure to allow for pelleting entails a high initial cost along with decreasing production rates and increasing energy usage, which leads to higher feed cost for the producer; however, this extra cost for pelleting may provide more economic return.
Inability to achieve adequate production rates could be a problem for some feed manu-factures and swine producers who are looking for ways to cut costs while still achiev-ing optimum efficiencies of gain. Also, feeding pelleted diets can lead to an increase in stomach ulcers, leading producers to switch to mash diets to reduce ulcers; however, little data have been produced on the effects of switching from mash to pelleted diets and vice versa and if feeding pellets throughout the entire grower and finisher stage is necessary to achieve benefits from pelleting. Therefore, our objective was to determine 1 Key Feeds, Clay Center, Kansas.
279
Finishing Nutrition and Management
the effects of abrupt changes between mash and pellet diets on growth performance in finishing pigs.
ProceduresThe Kansas State University Institutional Animal Care and Use Committee approved this experimental protocol.
All feed processing was completed at Key Feeds (Clay Center, KS). For all diets, corn was milled through a hammer mill (Jacobson P24209 Series 2) with a screen size of 1/8 in. (full circle screen). Pelleted treatments were pelleted in a 125 horsepower pellet mill (Century, California Pellet Mill, San Francisco, CA) and the die had 3/16-in. openings. Pellet durability index (PDI) was determined using the standard tumbling-box technique. A modified PDI was also determined by adding 5 hexagonal nuts into the tumbling box.
A total of 200 finishing pigs (PIC TR4 × 1050, initially 132.3 lb) were used in a 58-d growth assay. The pigs were weighed prior to the experiment, blocked by BW, and allotted by sex and ancestry. Pigs were then assigned to pens with concrete slatted flooring that were 5 ft × 8 ft. Each pen consisted of two nipple waterers and single-hole self-feeder allowing ad libitum consumption of feed and water. The experiment used a total of 40 pens with 5 pigs per pen and 10 pens per treatment. All diets (Table 1) were the same formulation fed in either mash or pellet form. Diets were fed in 2 phases and formulated to 0.88% standardized ileal digestible (SID) lysine, 0.55% Ca, and 0.21% available P for d 0 to 36, and 0.76% SID lysine, 0.50% Ca, and 0.17% available P for d 36 to 58. All other nutrients met or exceeded NRC recommendations (NRC, 19982). Treatments were mash to mash, mash to pellets, pellets to mash, and pellets to pellets for Phases 1 and 2 of the experiment. Pigs and feeders were weighed on day 0, 36, and 58 to determine ADG, ADFI, and F/G. On d 58 of the experiment, pigs (average BW of 282.2 lb) were tattooed and shipped to a commercial abattoir (Farmland Foods Inc., Crete, NE) for collection of HCW, percentage yield, backfat, loin depth, and percent-age FFLI.
Data were analyzed as a randomized complete block design using the MIXED proce-dure of SAS (v9.1; SAS Institute Inc., Cary, NC) with initial weight and location as the blocking criteria and pen as the experimental unit. Initial BW was used as a covariate for analyses of growth performance. Orthogonal contrasts were used to separate treat-ment means with comparisons of: (1) mash for Phase 1 and 2 vs. pellets for Phase 1 and 2, (2) control vs. pelleted treatments, (3) treatments pelleted for the entire experiment vs. treatments pelleted for either Phase 1 or 2 but not both, and (4) treatments fed in pelleted form for Phase 1 and mash form for Phase 2 vs. treatments fed in mash form for Phase 1 and pelleted form for Phase 2. For analyses of backfat thickness, loin depth, and percentage lean, HCW was used as a covariate.
Results and DiscussionFor pellet quality, pelleted diets in Phase 1 and Phase 2 had PDI of 86 and 87% and modified PDI of 80 and 77%, respectively. The average mean particle size for corn was 433 μm. 2 NRC. 1998. Nutrient Requirements of Swine. 10th ed. Natl. Acad. Press, Washington, DC.

280
Finishing Nutrition and Management
For Phase 1 (d 0 to 36), pigs fed the pelleted diet had 4% greater (P < 0.06) ADG and 8% improved (P < 0.03) F/G compared with pigs fed mash (Table 2). For Phase 2 (d 36 to 58) and overall (d 0 to 58), pigs fed the mash diet had poorer (P < 0.02) F/G than pigs fed the pelleted treatments. Pigs fed mash during Phase 1 then pellets during Phase 2 had improved (P < 0.002) ADG and F/G for Phase 2 compared with pigs fed pellets then mash. Pigs fed pellets for either Phase 1 or 2, but not both, tended to have poorer (P < 0.10) ADG and F/G compared to those fed pellets for the entire experi-ment. Indeed, pigs fed pellets the entire experiment had a 5% improvement (P < 0.06) in ADG and an 8% improvement (P < 0.001) in F/G compared with pigs fed mash the entire experiment. Pigs fed the mash diet for the entire experiment had decreased (P < 0.03) final BW and HCW compared with those fed treatments that were pelleted for the entire experiment; however, a tendency was observed for pigs fed the pelleted diet for the entire experiment to have an increased (P < 0.07) final BW and HCW compared with those fed treatments that were pelleted for only Phase 1 or 2. Pigs fed the diets pelleted for the entire experiment resulted in a numerically heavier (P < 0.07) final BW compared with those fed pelleted diets during only Phase 1 or Phase 2. No differences (P > 0.15) were observed in percentage carcass yield, fat thickness, loin depth, or percentage FFLI. In conclusion, pigs fed pellets tended to have the greatest growth performance, pigs fed mash the worst, and pigs fed pellets for only part of the growing-finishing phase fell in between.
Table 1. Composition of diets (as-fed basis)Ingredient, % Phase 11 Phase 22
Corn 79.25 84.70Soybean meal (47.5% CP) 17.15 11.90Choice white grease 1.00 1.00L-Lysine HCl 0.34 0.35DL-Methionine 0.07 0.05L-Threonine 0.12 0.11L-Tryptophan 0.02 0.04Monocalcium phosphate (21% P) 0.72 0.54Limestone 0.91 0.89Salt 0.25 0.25Vitamin premix 0.08 0.08Mineral premix 0.04 0.04Antibiotic3 0.05 0.05
Calculated analysis,%Standardized ileal digestible lysine 0.88 0.76Ca 0.55 0.50P 0.49 0.43Available P 0.21 0.17
1 Diets fed in meal or pelleted form from d 0 to 36.2 Diets fed in meal or pelleted form from d 36 to 58.3 Provided 44 g/ton tylosin.

281
Finishing Nutrition and Management
Table 2. Effects of abrupt change between mash and pellet diets on growth performance in finishing pigs1
Phase 1: Mash Mash Pellet Pellet Probability, P <2
Phase 2: Mash Pellet Mash Pellet SE 1 2 3 4d 0 to 36
ADG,lb 2.46 2.49 2.57 2.57 0.06 0.06 N/A3 N/A N/AADFI, lb 6.36 6.31 6.07 6.11 0.16 0.10 N/A N/A N/AF/G 2.59 2.52 2.36 2.37 0.03 0.001 N/A N/A N/A
d 36 to 58ADG, lb 2.56 2.71 2.46 2.73 0.05 0.02 0.21 0.02 0.002ADFI, lb 7.79 7.61 7.52 7.74 0.18 0.79 0.29 0.30 0.66F/G 3.04 2.81 3.06 2.83 0.05 0.003 0.01 0.08 0.001
d 0 to 58ADG, lb 2.50 2.57 2.53 2.63 0.05 0.01 0.06 0.08 0.39ADFI, lb 6.89 6.80 6.62 6.73 0.16 0.27 0.16 0.91 0.25F/G 2.76 2.63 2.62 2.55 0.03 0.001 0.001 0.10 0.72
BW, lbD 0 lb 132.1 133.3 133.4 132.0 3.0 0.94 0.60 0.39 0.96D 36 lb 221.3 222.4 225.4 225.2 2.1 0.06 0.07 0.44 0.15D 58 lb 278.6 282.0 279.5 285.4 2.7 0.02 0.12 0.07 0.38
Carcass measurementsHCW, lb 208.0 209.5 208.7 212.2 1.9 0.03 0.15 0.06 0.68Carcass yield, % 74.6 74.3 74.3 74.4 0.3 0.71 0.41 0.60 0.97Backfat thickness, in.4 0.75 0.78 0.77 0.77 0.03 0.47 0.34 0.91 0.90Loin depth, in.4 2.63 2.65 2.68 2.65 0.03 0.55 0.34 0.74 0.42FFLI, %4,5 52.0 51.7 51.7 51.7 0.5 0.59 0.47 0.93 0.93
1 A total of 200 pigs (average initial BW of 132.3 lb) were used in a 58-d growth assay.2 Contrast statements: (1) mash for Phase 1 and 2 vs. pellets for Phase 1 and 2, (2) mash vs. others, (3) pellets for entire experiment vs. pellets fed for only part of experiment, (4) mash to pellet vs. pellet to mash. 3 Not applicable. 4 HCW used as a covariate.5 Fat-free lean index.
282
Finishing Nutrition and Management
Effects of Sorghum Particle Size on Milling Characteristics, Growth Performance, and Carcass Characteristics in Finishing Pigs
C. B. Paulk, J. D. Hancock, A. C. Fahrenholz1, J. M. Wilson1, L. J. McKinney1, and K. C. Benhke1
SummaryA total of 200 finishing pigs (PIC TR4 × 1050; average initial BW of 103.2 lb) were used in a 69-d growth assay to determine the effects of sorghum particle size on growth performance. Pigs were sorted by sex and ancestry and balanced by BW, with 5 pigs per pen and 10 pens per treatment. Treatments were a corn-soybean meal-based control with the corn milled to a target mean particle size of 600 μm, and sorghum diets milled to a target mean particle size of 800, 600, or 400 μm. Actual mean particle sizes were 555 μm for corn, and 724, 573, and 319 μm for sorghum, respectively. Feed and water were offered on an ad libitum basis until the pigs were slaughtered (average final BW of 271 lb) at a commercial abattoir. Reducing sorghum particle size improved (linear, P < 0.01) F/G, and we observed a tendency for decreased (P < 0.06) ADFI. Reducing sorghum particle size from 724 to 319 μm had no effects on HCW, backfat thickness, loin depth, or percentage fat-free lean index (FFLI), but tended to increase (P < 0.06) carcass yield. Pigs fed the sorghum-based diets had no difference in growth performance or carcass characteristics compared with those fed the control diet, except carcass yield, which was numerically greater (P < 0.07) for pigs fed the sorghum-based diets. When using a regression equation, we determined that sorghum must be ground to 513 μm to achieve a F/G equal to that of a corn-based diet, with corn ground to 550 μm. In conclusion, linear improvements in F/G and carcass yield were demonstrated with the reduction of sorghum particle size to 319 μm. In this experiment, sorghum should be ground 42 μm finer than corn to achieve a similar feeding value.
Key words: corn, particle size, sorghum, finishing pig
IntroductionWith the continuous increase in corn prices, swine producers are utilizing alterna-tive feedstuffs to reduce diet cost. Sorghum is a cereal grain that can be an economical replacement for corn; its attributes, such as resistance to heat stress and drought, make it favorable to produce in certain regions worldwide.
Through the years, the nutritional value of sorghum has been enhanced through genetic selection of sorghum grains and by applying feed processing strategies. The most common feed manufacturing practice used to enhance swine performance is the grind-ing of cereal grains; however, the particle size necessary to make the feeding value of sorghum equal to that of corn is not well defined. Thus, we designed an experiment to determine the effects of reducing sorghum particle size on milling inputs and growth
1 Department of Grain Sciences and Industry, Kansas State University.

283
Finishing Nutrition and Management
performance, and to develop a sorghum particle size necessary to achieve the same performance as corn when fed to growing and finishing pigs.
ProceduresThe Kansas State University Institutional Animal Care and Use Committee approved the protocol used in this experiment. The experiment was completed at the K-State Swine Teaching and Research Center in Manhattan, KS.
A total of 200 pigs (PIC line TR4 × 1050; average initial BW of 103.2 lb) were sorted by sex and ancestry, balanced by BW, and assigned to treatments, with 5 barrows per pen or 5 gilts per pen and 10 pens per treatment. Pigs were housed in an environmen-tally controlled finisher with pens (10 ft × 5 ft) that had concrete slatted floors. Each pen contained a self-feeder and 2 nipple waterers to allow ad libitum consumption of feed and water.
The control diet was corn-based with the corn milled to a target geometric mean particle size of 600 μm. Treatments were sorghum-based with sorghum milled to a targeted mean particle size of 800, 600, or 400 μm. For the control, corn was milled using a hammer mill (Jacobson P240D) with a screen size of ¼ in. (“teardrop” full circle screen). For the 400 μm treatment, sorghum was milled using the same hammer mill (Jacobson P240D) with a screen size of 1/16 in. (“teardrop” full circle screen). For the 800- and 600-μm treatments, sorghum was milled using a three-high roller mill (1:1, 1.5:1, 1.5:1 differential drives; 3.2, 4.7, and 6.3 corrugations per cm; and 0, 8.3, and 8.3 cm of spiral/meter of roller, Model K, Roskamp Manufacturing, Cedar Falls, IA). All diets were pelleted in a 30 horsepower pellet mill (30 HD Master Model, California Pellet Mill, San Francisco, CA) with a 1 ¼-in.-thick die that had 5/32-in. openings. Pellets were analyzed for pellet durability index (PDI) and modified PDI. PDI was determined using the standard tumbling-box technique and modified PDI by alter-ing the procedure by adding 5 hexagonal nuts prior to tumbling. An amp-volt meter (Model DM-II, Amprobe Instrument, Lynbrook, NY) was used to calculate energy used during grinding and pelleting.
The experimental treatments (Table 1) were fed in 3 phases, with Phase 1 fed from d 0 to 28, Phase 2 from d 28 to 48, and Phase 3 from d 48 to 69. All diets were formulated to meet or exceed NRC (19982) recommendations. Pigs and feeders were weighed on d 0, 20, 41, and 69 to calculate ADG, ADFI, and F/G. On d 69, pigs were harvested (average final BW of 271 lb) at a commercial abattoir (Farmland Foods, Inc.; Crete, NE) and HCW, carcass yield, backfat thickness, loin depth, and percentage FFLI were recorded.
The MIXED procedure (SAS Inst. Inc., Cary, NC) was used to perform the statisti-cal analysis. All growth data were analyzed as a completely randomized design with pen as the experimental unit. For analyses of backfat thickness, loin depth, and FFLI, HCW was used as a covariate. The corn treatment was compared with the average of the 3 sorghum particle sizes, and the shape of the response to decreasing particle size of sorghum was characterized using polynomial regression. Results were considered signifi-cant at P ≤ 0.05 and considered a trend at P ≤ 0.15.
2 NRC. 1998. Nutrient Requirements of Swine. 10th ed. Natl. Acad. Press, Washington, DC.
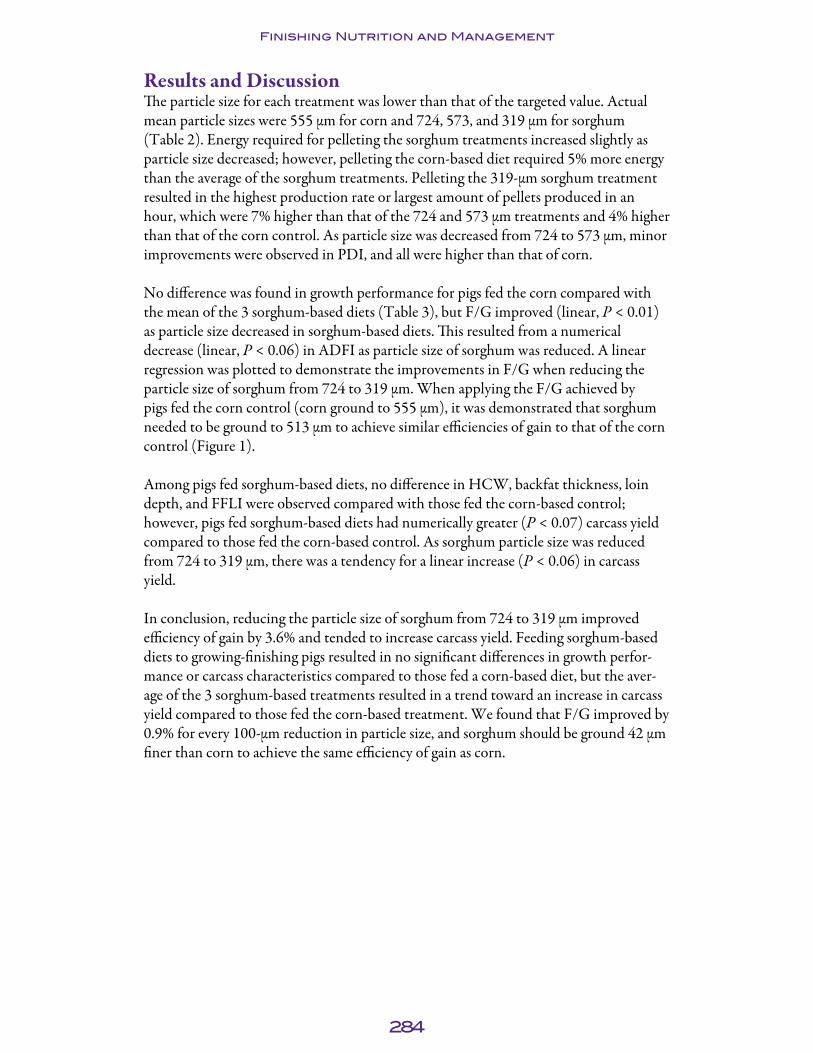
284
Finishing Nutrition and Management
Results and DiscussionThe particle size for each treatment was lower than that of the targeted value. Actual mean particle sizes were 555 μm for corn and 724, 573, and 319 μm for sorghum (Table 2). Energy required for pelleting the sorghum treatments increased slightly as particle size decreased; however, pelleting the corn-based diet required 5% more energy than the average of the sorghum treatments. Pelleting the 319-μm sorghum treatment resulted in the highest production rate or largest amount of pellets produced in an hour, which were 7% higher than that of the 724 and 573 μm treatments and 4% higher than that of the corn control. As particle size was decreased from 724 to 573 μm, minor improvements were observed in PDI, and all were higher than that of corn.
No difference was found in growth performance for pigs fed the corn compared with the mean of the 3 sorghum-based diets (Table 3), but F/G improved (linear, P < 0.01) as particle size decreased in sorghum-based diets. This resulted from a numerical decrease (linear, P < 0.06) in ADFI as particle size of sorghum was reduced. A linear regression was plotted to demonstrate the improvements in F/G when reducing the particle size of sorghum from 724 to 319 μm. When applying the F/G achieved by pigs fed the corn control (corn ground to 555 μm), it was demonstrated that sorghum needed to be ground to 513 μm to achieve similar efficiencies of gain to that of the corn control (Figure 1).
Among pigs fed sorghum-based diets, no difference in HCW, backfat thickness, loin depth, and FFLI were observed compared with those fed the corn-based control; however, pigs fed sorghum-based diets had numerically greater (P < 0.07) carcass yield compared to those fed the corn-based control. As sorghum particle size was reduced from 724 to 319 μm, there was a tendency for a linear increase (P < 0.06) in carcass yield.
In conclusion, reducing the particle size of sorghum from 724 to 319 μm improved efficiency of gain by 3.6% and tended to increase carcass yield. Feeding sorghum-based diets to growing-finishing pigs resulted in no significant differences in growth perfor-mance or carcass characteristics compared to those fed a corn-based diet, but the aver-age of the 3 sorghum-based treatments resulted in a trend toward an increase in carcass yield compared to those fed the corn-based treatment. We found that F/G improved by 0.9% for every 100-μm reduction in particle size, and sorghum should be ground 42 μm finer than corn to achieve the same efficiency of gain as corn.

285
Finishing Nutrition and Management
Table 1. Composition of experimental diets (as-fed basis)1
Phase 1 Phase 2 Phase 3Item Corn Sorghum Corn Sorghum Corn SorghumIngredient, %
Corn 76.22 — 78.60 — 80.67 —Sorghum — 76.21 — 78.60 — 80.64Soybean meal (46.5% CP) 21.5 21.5 19.5 19.5 17.5 17.5L-Lysine HCl 0.21 0.23 0.14 0.16 0.074 0.096DL-Methionine 0.03 0.04 — 0.002 — —L-Threonine 0.06 0.04 0.018 0.002 — —Monocalcium P (21% P) 0.70 0.70 0.50 0.50 0.51 0.51Limestone 0.88 0.88 0.85 0.85 0.86 0.86Salt 0.25 0.25 0.25 0.25 0.25 0.25Vitamin premix 0.04 0.04 0.04 0.04 0.04 0.04Mineral premix 0.06 0.06 0.06 0.06 0.06 0.06Antibiotic2 0.05 0.05 0.05 0.05 0.05 0.05
Total 100.00 100.00 100.00 100.00 100.00 100.00
Calculated analyses,%CP 16.6 17.3 15.7 16.5 15.0 15.6SID lysine3 0.88 0.88 0.78 0.78 0.68 0.68Ca 0.55 0.55 0.50 0.50 0.50 0.50Available P 0.21 0.22 0.17 0.18 0.17 0.18
1 Experimental treatments were fed in pelleted form. 2 Provided (per kilogram of diet) 9.1 mg/kg of tylosin.3 Standardized ileal digestible.
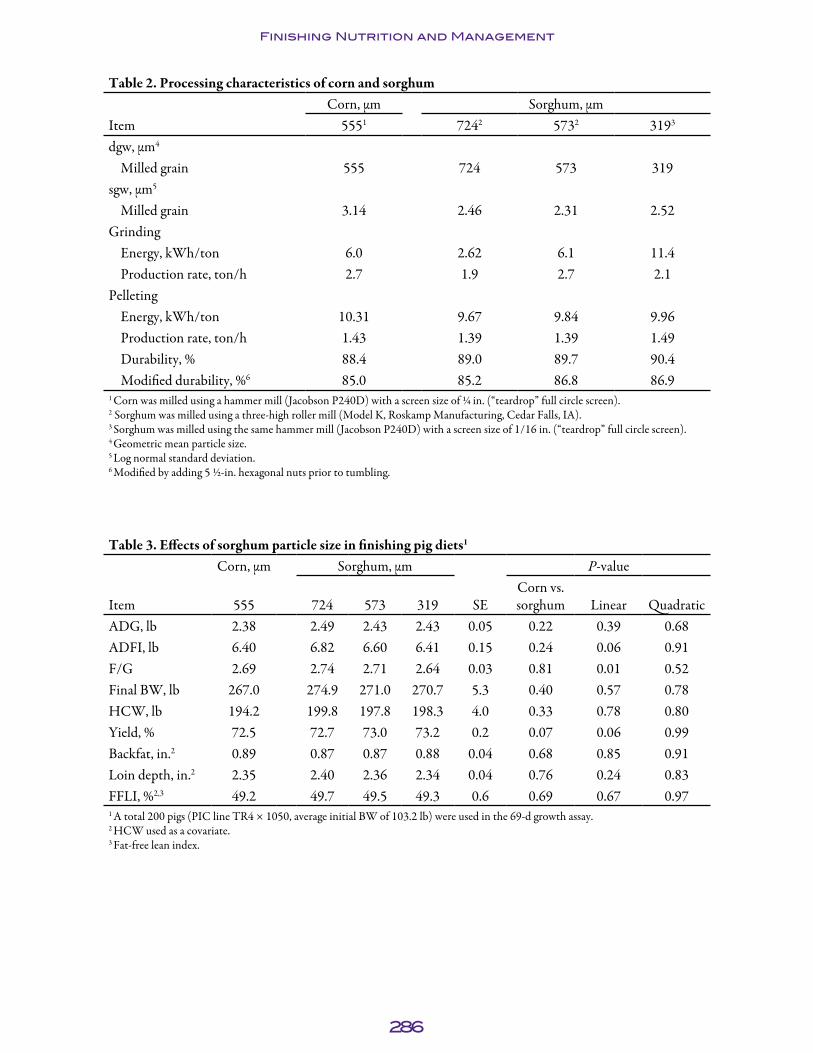
286
Finishing Nutrition and Management
Table 2. Processing characteristics of corn and sorghum Corn, μm Sorghum, μm
Item 5551 7242 5732 3193
dgw, μm4
Milled grain 555 724 573 319sgw, μm5
Milled grain 3.14 2.46 2.31 2.52 Grinding
Energy, kWh/ton 6.0 2.62 6.1 11.4Production rate, ton/h 2.7 1.9 2.7 2.1
PelletingEnergy, kWh/ton 10.31 9.67 9.84 9.96Production rate, ton/h 1.43 1.39 1.39 1.49Durability, % 88.4 89.0 89.7 90.4Modified durability, %6 85.0 85.2 86.8 86.9
1 Corn was milled using a hammer mill (Jacobson P240D) with a screen size of ¼ in. (“teardrop” full circle screen).2 Sorghum was milled using a three-high roller mill (Model K, Roskamp Manufacturing, Cedar Falls, IA).3 Sorghum was milled using the same hammer mill (Jacobson P240D) with a screen size of 1/16 in. (“teardrop” full circle screen).4 Geometric mean particle size.5 Log normal standard deviation.6 Modified by adding 5 ½-in. hexagonal nuts prior to tumbling.
Table 3. Effects of sorghum particle size in finishing pig diets1
Corn, μm Sorghum, μm P-value
Item 555 724 573 319 SECorn vs. sorghum Linear Quadratic
ADG, lb 2.38 2.49 2.43 2.43 0.05 0.22 0.39 0.68ADFI, lb 6.40 6.82 6.60 6.41 0.15 0.24 0.06 0.91F/G 2.69 2.74 2.71 2.64 0.03 0.81 0.01 0.52Final BW, lb 267.0 274.9 271.0 270.7 5.3 0.40 0.57 0.78HCW, lb 194.2 199.8 197.8 198.3 4.0 0.33 0.78 0.80Yield, % 72.5 72.7 73.0 73.2 0.2 0.07 0.06 0.99Backfat, in.2 0.89 0.87 0.87 0.88 0.04 0.68 0.85 0.91Loin depth, in.2 2.35 2.40 2.36 2.34 0.04 0.76 0.24 0.83FFLI, %2,3 49.2 49.7 49.5 49.3 0.6 0.69 0.67 0.971 A total 200 pigs (PIC line TR4 × 1050, average initial BW of 103.2 lb) were used in the 69-d growth assay.2 HCW used as a covariate.3 Fat-free lean index.

287
Finishing Nutrition and Management
F/G
3.00
2.90
2.80
2.70
2.60
2.50
2.40
200300500700800
Particle size, µm
600 400
Corn (555 µm)
Sorghum (513 µm)
y = 0.00025728x + 2.56014519
Figure 1. Particle size of sorghum required to obtain an efficiency of gain equal to that of corn.

288
Finishing Nutrition and Management
Effects of Adding Cracked Corn to a Pelleted Supplement for Nursery and Finishing Pigs
C. B. Paulk, J. D. Hancock, A. C. Fahrenholz1, J. M. Wilson1, D. D. Cook1, L. J. McKinney1, K. C. Benhke1, J. C. Ebert2, J. J. Ohlde2, and J. C. Nietfeld3
SummaryThree experiments were conducted to determine the effects of supplementing cracked corn into diets of nursery and finishing pigs. In Exp. 1, 144 pigs were used in a 28-d trial. Pigs (PIC TR4 × 1050; initially 16.5 lb) were weaned and allotted with 6 pigs per pen (3 barrows and 3 gilts) and 6 pens per treatment. All pigs were fed a common diet for 7 d postweaning and the experimental diets for the next 28 d. Treatments were corn-soybean meal-based in the form of mash, pellets, and pellets with 100% of the corn either ground (618 μm) or cracked (3,444 μm) and blended into the diet after the rest of the formulation (the supplement) had been pelleted. Overall (d 0 to 28), ADG and F/G improved when pigs were fed the mash control compared to the pelleted diets (P < 0.001); however, this response was caused by the poor performance of pigs fed the supplement treatments, with the pigs fed the complete pellets having improved (P < 0.01) ADG and F/G compared with pigs fed the pelleted supplement blended with ground and cracked corn. Finally, pigs fed the supplement blended with cracked corn had numerically lower (P < 0.11) ADG and poorer (P < 0.001) F/G compared to those fed the supplement blended with ground corn.
In Exp. 2, 224 nursery pigs (initially 16.3 lb) were used with 7 barrows or 7 gilts per pen and 8 pens per treatment. Treatments were corn-soybean meal-based and fed as mash, pellets, and pellets with 50% of the corn either ground (445 μm) or cracked (2,142 μm) and blended with the pelleted supplement. Pigs fed mash had improved (P < 0.03) ADG and F/G compared with pigs fed the other treatments; however, this resulted from adding ground or cracked corn outside the pellets (complete pellets vs. pelleted supplement with corn, P < 0.01).
In Exp. 3, 252 finishing pigs (initially 88.2 lb) were used with 7 pigs per pen and 9 pens per treatment. The treatments were the same as Exp. 2. Pigs fed mash had lower (P < 0.004) ADG compared with pigs fed diets with pellets. Pigs fed complete pellets had improved (P < 0.03) ADG and F/G compared with pigs fed corn and the pelleted supplement. Also, pigs fed the supplement blended with cracked corn had greater (P < 0.02) ADG than pigs fed the supplement blended with ground corn. Pelleting the diet led to an increase (P < 0.05) in ulceration scores; however, these negative effects on ulcer scores were reduced (P < 0.001) by cracking 50% of the corn and adding it post-pellet.
Key words: corn, cracked corn, feed processing, pelleting, nursery pig, finishing pig1 Department of Grain Science and Industry, Kansas State University.2 Key Milling, Clay Center, Kansas.3 Department of Diagnostic Medicine/Pathobiology, College of Veterinary Medicine, Kansas State University.

289
Finishing Nutrition and Management
IntroductionFrom 2008 to present, historically high grain prices have pressured swine producers to strive for maximizing efficiency of gain by pigs as never before. An effective means of reducing high feed costs is improving nutrient utilization through feed processing. Previous research at Kansas State University has demonstrated that grinding and pellet-ing grains leads to improvements in nutrient digestibility and efficiency of gain in pigs; however, these feed manufacturing practices also have negative impacts. Fine grinding of cereals decreases bulk density, production rate, and flowability of feed while also increasing dustiness and the amount of energy required for processing. Pelleting can be used to reduce or eliminate bridging and dustiness and restore bulk density, but it adds energy costs for feed processing and often becomes the limiting factor in feed mill throughput. Additionally, fine grinding and pelleting have been shown to increase the incidence and severity of ulceration of the pars esophagea region of the pigs’ stomach.
Colleagues in the poultry industry have suggested that feeding whole and cracked grain can improve gut health and reduce milling cost without negatively affecting growth performance in broilers. Thus, we designed 3 experiments to determine the effects of adding cracked corn to diets on growth performance and milling efficiency while preparing diets for nursery and finishing pigs.
ProceduresAll animal use in these experiments was approved by the Kansas State University Animal Care and Use Committee.
Experiment 1. A total of 144 pigs (PIC TR4 × 1050, initially 16.5 lb) were weaned at 21 d of age, sorted by sex and ancestry, blocked by weight, and assigned to pens, with 3 barrows and 3 gilts per pen and 6 pens per treatment. The pigs were housed in an environmentally controlled nursery with pens (4 ft × 5 ft) having woven wire floor-ing. Animal level temperature was initially 90°F and was decreased by 3°F each week. Each pen had a self-feeder and nipple water to allow ad libitum consumption of feed and water. Pigs were fed a common pelleted diet (Rapid Start N/T; Suther Feeds Inc., Frankfort, KS) for the first 7 d postweaning, then used in a 28-d growth assay. Treat-ments were corn-soybean meal-based and fed in the form of mash, pellets, and pellets with 100% of the corn (ground or cracked) blended into the diet after the rest of the formulation (the supplement) had been pelleted. The experimental diets (Table 1) were fed in 2 phases, with Phase 1 fed from d 0 to 14 and Phase 2 from d 14 to 28 of the experiment. All diets were formulated to meet or exceed the nutrient requirement estimates suggested by the National Research Council (NRC, 19984). Pigs and feeders were weighed on d 0, 14, and 28 of the experiment to allow calculation of ADG, ADFI, and F/G.
All feed processing was completed at the K-State Grain Science Pilot Feed Mill. The corn was milled using a three-high roller mill (1:1, 1.5:1, 1.5:1 differential drives; 3.2, 4.7, and 6.3 corrugations per centimeter; and 0, 8.3, and 8.3 cm of spiral per meter of roller, Model K, Roskamp Manufacturing, Cedar Falls, IA). Particle size of the ground and cracked corn was determined using Tyler sieves (numbers 6, 8, 10, 14, 20, 28, 35, 48, 65, 100, 150, 200, 270, and a pan) and Ro-Tap shaker (W. S. Tyler, Mentor, OH).
4 NRC. 1998. Nutrient Requirements of Swine.10th ed. Natl. Acad. Press, Washington, DC.

290
Finishing Nutrition and Management
One hundred-gram samples were sifted for 10 min and the weight of the residue on each screen was used to calculate geometric mean particle size (dgw) and the log normal standard deviation (sgw). A 30 horsepower pellet mill (30 HD Master Model, Califor-nia Pellet Mill, San Francisco, CA) equipped with a 5/32-in. × 7/8-in. die was used to pellet the complete pellets and the pelleted supplement. Feed was steam conditioned to approximately 160 and 180°F prior to pelleting for Phase 1 and 2, respectively. To preserve pellet quality, added fat exceeding 2% was applied postpellet. Pellet durabil-ity index (PDI) was determined using the standard tumbling-box technique. Finally, an amp-volt meter (Model DM-II, Amprobe Instrument, Lynbrook, NY) was used to calculate energy consumption during the grinding and pelleting processes.
Experiment 2. A total of 224 pigs (PIC TR4 × 1050, initially 16.3 lb) were weaned at 21 d of age, sorted by sex and ancestry, blocked by weight, and assigned to pens, with 7 barrows and 7 gilts per pen and 8 pens per treatment. Animal housing and manage-ment were identical to procedures used in Exp. 1. Treatments were corn-soybean meal-based and fed as mash, pellets, and pellets with 50% of the corn (ground or cracked) blended into the diet after the rest of the formulation (the supplement) had been pelleted. The experimental treatments (Table 1) were fed in 2 phases, with Phase 1 d 0 to 13 of the experiment and Phase 2 d 13 to 28. All diets were formulated to meet or exceed the nutrient concentrations suggested by the National Research Council (NRC, 1998).
Pigs and feeders were weighed on d 0, 13, and 28 of the experiment to allow calcula-tion of ADG, ADFI, and F/G. All feed processing was completed at the K-State Grain Science Pilot Feed Mill. All diets were processed as in Exp. 1, but added fat exceeding 5% was applied postpellet in Exp. 2. Grain particle size, PDI, and energy consumption were also determined as described for Exp. 1. A modified PDI was also determined by adding 5 hexagonal nuts into the tumbling box.
Experiment 3. Two hundred fifty-two finishing pigs (PIC TR4 × 1050; average initial BW of 88.8 lb) were sorted by weight, sex, and ancestry and assigned to pens and treat-ments were randomly assigned. Pigs were housed in an environmentally controlled finishing facility with a complete slatted concrete floor and adjustable gates to allow for 10 ft2/pig. Each pen contained a self-feeder and cup waterer to allow ad libitum consumption of feed and water. An automated feeding system (FeedPro; Feedlogic Corp., Willmar, MN) was used to feed individual pens and record feed weights for each pen. The 80-d experiment had 7 pigs per pen (4 barrows and 3 gilts) and 9 pens per treatment. Treatments were the same as described in Exp. 2. The automated feeding system was used to blend ground or cracked corn with the pelleted supplement. Diets were fed in 3 phases (Table 3). Diets were formulated to meet or exceed all nutrient requirement estimates by the National Research Council (NRC, 1998).
Feed processing was completed at a commercial feed mill (Key Feeds, Clay Center, KS). For the complete mash, complete pellet, and pelleted supplement with ground corn treatments, corn was milled through a hammer mill (Jacobson P24209 series 2) equipped with a full circle screen with 1/8-in.-diameter openings. For the cracked corn treatment, the corn was processed using a 40 horsepower two-high roller mill (1.5:1, 1.5:1 differential drives; 1.55 and 1.55 corrugations per centimeter; and 6 and 16 cm of spiral/meter of roller, Ferrell Ross 10 × 36, Hereford, TX). The geometric mean
291
Finishing Nutrition and Management
particle size, log normal standard deviation, PDI, modified PDI, and energy consump-tion were determined as described in Exp. 1. The complete pellet and the pelleted supplement were pelleted in a 125 horsepower pellet mill (Century, California Pellet Mill, San Francisco, CA) with 3/16-in. die. All supplemental fat was added in the mixer before conditioning with steam at 167°F before pelleting.
Pigs and feeders were weighed on day 0, 26, 54, and 80 to allow calculation of ADG, ADFI, and F/G. On d 80, the pigs were tattooed and shipped to a commercial abat-toir (Farmland Foods Inc., Crete, NE) for collection of carcass data and stomachs. The esophageal region of the stomachs was removed and scored for ulcers and keranitization by a trained veterinary pathologist. For keratinization, the non-glandular mucosa of the esophageal region that was not ulcerated was scored on the scale of 1 = none (normal or no keratinization), 2 = mild (keratin covering < 25% of the non-glandular mucosa), 3 = moderate (keratin covering 25 to 75% of the non-glandular mucosa), and 4 = severe (keratin covering > 75% of the non-glandular mucosa). Because keratinization is a precursor to ulceration, stomachs that were fully ulcerated and thus had no remaining squamous epithelium were assumed to have been fully keratinized prior to ulcer devel-opment and given a score of 4 for keratinization. For ulceration, the esophageal region was scored as 1 = none, 2 = mild (ulceration present but affecting < 25% of the non-glandular mucosa), 3 = moderate (ulceration of 25-75% of the non-glandular mucosa), and 4 = severe (ulceration of > 75% of non-glandular mucosa).
Statistical analysis. Data in Exp. 1 and 2 were analyzed as a randomized complete block design and data in Exp. 3 were analyzed as a completely randomized design using the MIXED procedure of SAS (v9.2; SAS Institute Inc., Cary, NC). In Exp. 1, BW at d 7 (the initiation of the growth assay) was used as a covariate. Orthogonal contrasts were used to separate treatment means in all experiments with comparisons of: (1) mash vs. treatments with pellets, (2) complete pellets vs. pelleted supplement with ground and cracked corn, and (3) pelleted supplement with ground vs. cracked corn. Results were considered significant at P ≤ 0.05 and considered a trend at P ≤ 0.15.
For Exp. 3, HCW was used as a covariate for analyses of backfat thickness, loin depth, and fat-free lean index (FFLI).
Results and DiscussionExperiment 1. The particle sizes of the ground and cracked corn were 618 and 3,444 μm, respectively. The difference in milling procedure resulted in 7.6 times more energy (6.8 vs. 0.9 kWh/ton) required to fine-grind corn in the hammermill vs. cracking corn in the roller mill. Fine-grinding corn in the hammer mill also reduced throughput from 4.3 to 1.1 ton/h compared with cracking corn in the roller mill.
Energy required for pelleting the complete pellet and the pelleted supplement was 14.3 and 13.0 kWh/ton, respectively (Table 3). The supplement and complete diet for Phase 1 had similar PDI, but for Phase 2 the PDI for the supplement was 7% points greater than the PDI for the complete diet.
Grinding and pelleting the complete diet required 5 times more energy (17.3 vs 3.5 kWh/ton) than simply grinding the mash (Table 4); however, total energy required to
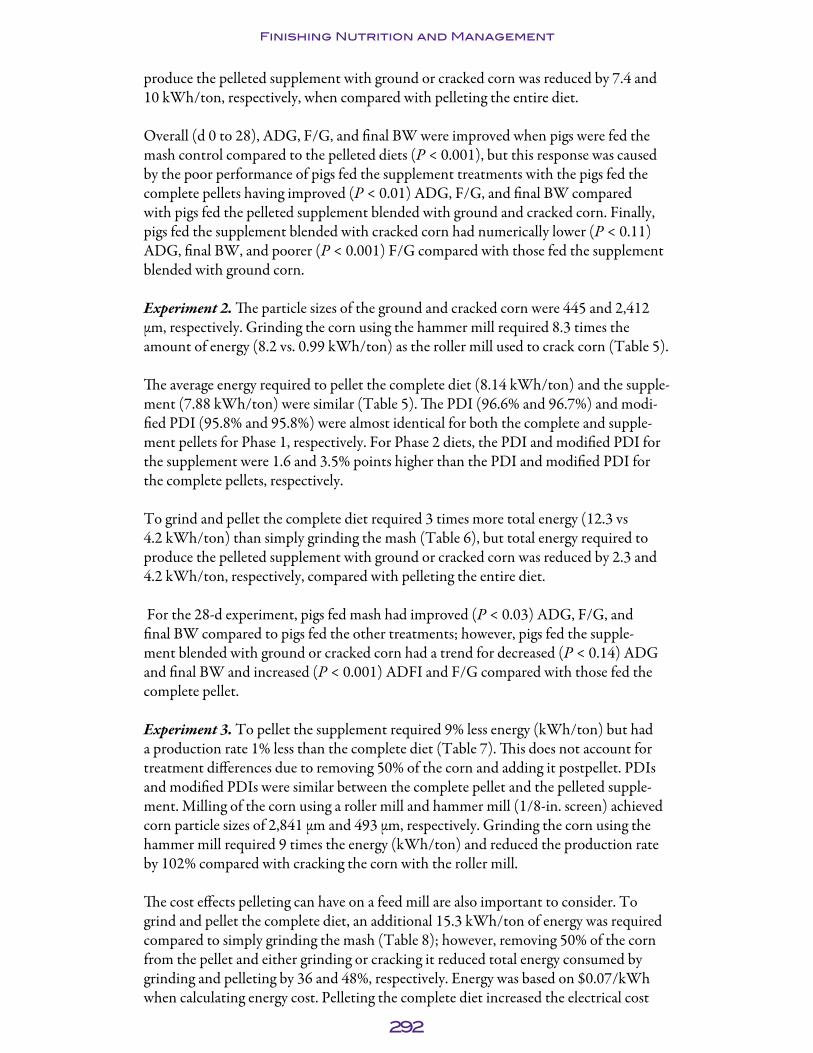
292
Finishing Nutrition and Management
produce the pelleted supplement with ground or cracked corn was reduced by 7.4 and 10 kWh/ton, respectively, when compared with pelleting the entire diet.
Overall (d 0 to 28), ADG, F/G, and final BW were improved when pigs were fed the mash control compared to the pelleted diets (P < 0.001), but this response was caused by the poor performance of pigs fed the supplement treatments with the pigs fed the complete pellets having improved (P < 0.01) ADG, F/G, and final BW compared with pigs fed the pelleted supplement blended with ground and cracked corn. Finally, pigs fed the supplement blended with cracked corn had numerically lower (P < 0.11) ADG, final BW, and poorer (P < 0.001) F/G compared with those fed the supplement blended with ground corn.
Experiment 2. The particle sizes of the ground and cracked corn were 445 and 2,412 μm, respectively. Grinding the corn using the hammer mill required 8.3 times the amount of energy (8.2 vs. 0.99 kWh/ton) as the roller mill used to crack corn (Table 5).
The average energy required to pellet the complete diet (8.14 kWh/ton) and the supple-ment (7.88 kWh/ton) were similar (Table 5). The PDI (96.6% and 96.7%) and modi-fied PDI (95.8% and 95.8%) were almost identical for both the complete and supple-ment pellets for Phase 1, respectively. For Phase 2 diets, the PDI and modified PDI for the supplement were 1.6 and 3.5% points higher than the PDI and modified PDI for the complete pellets, respectively.
To grind and pellet the complete diet required 3 times more total energy (12.3 vs 4.2 kWh/ton) than simply grinding the mash (Table 6), but total energy required to produce the pelleted supplement with ground or cracked corn was reduced by 2.3 and 4.2 kWh/ton, respectively, compared with pelleting the entire diet.
For the 28-d experiment, pigs fed mash had improved (P < 0.03) ADG, F/G, and final BW compared to pigs fed the other treatments; however, pigs fed the supple-ment blended with ground or cracked corn had a trend for decreased (P < 0.14) ADG and final BW and increased (P < 0.001) ADFI and F/G compared with those fed the complete pellet.
Experiment 3. To pellet the supplement required 9% less energy (kWh/ton) but had a production rate 1% less than the complete diet (Table 7). This does not account for treatment differences due to removing 50% of the corn and adding it postpellet. PDIs and modified PDIs were similar between the complete pellet and the pelleted supple-ment. Milling of the corn using a roller mill and hammer mill (1/8-in. screen) achieved corn particle sizes of 2,841 μm and 493 μm, respectively. Grinding the corn using the hammer mill required 9 times the energy (kWh/ton) and reduced the production rate by 102% compared with cracking the corn with the roller mill.
The cost effects pelleting can have on a feed mill are also important to consider. To grind and pellet the complete diet, an additional 15.3 kWh/ton of energy was required compared to simply grinding the mash (Table 8); however, removing 50% of the corn from the pellet and either grinding or cracking it reduced total energy consumed by grinding and pelleting by 36 and 48%, respectively. Energy was based on $0.07/kWh when calculating energy cost. Pelleting the complete diet increased the electrical cost

293
Finishing Nutrition and Management
alone from $0.39 to $1.46 compared with simply grinding the mash, but removing 50% of the corn from the pellet and cracking it can reduce diet cost by $0.70/ton compared with the pelleted complete diet.
Adding 50% of the corn after pelleting can reduce cost from $1.46/ton (complete pellet) to $0.93/ton (pelleted supplement with ground corn) or it can be further reduced to $0.76/ton (pellet supplement with cracked corn). A feed mill with the capa-bility of producing 6 tons of pellets/h and running 50 h/wk could produce 300 ton/wk. Pelleting the complete diet would increase electrical cost from $117 to $438 per week, costing them an extra $321/wk for electrical cost alone. If 50% of the corn is removed from the pellet and cracked, it could reduce electrical cost from $438 (complete pellet) to $279 (pelleted supplement with ground corn) or $228 (pelleted supplement with cracked corn)/wk, saving the feed mill $159 or $210/wk, respectively. Applying this scenario to an integrated feed mill producing 10,000 ton/wk would reduce the electri-cal cost per week from $14,600 (complete pellet) to $9,300 (pellet supplement with ground corn) or $7,600 (pellet supplement with cracked corn), saving the feedmill $5,300 or $7,000/wk, respectively. However, energy is not the only factor that effects cost in the feed mill.
Throughput is another key factor that affects milling cost. Pelleting is the limiting factor in feed mill production rates, so it will be the only thing considered when calculat-ing the treatment effects on production rates. Key Feeds was able to pellet 6 ton/h. If a feed mill producing 6 ton/h needed to produce 300 ton/wk, the pellet mill would be required to run for 50 h/wk. Pulling 50% of the corn from the finishing pig diet resulted in an average of 60% of the diet as the pelleted supplement and 40% of the diet as corn outside of the pellet. Removing 50% of the corn would reduce the amount of pellets required from 300 ton/wk to 180 ton/wk, which would require the feed mill to run 30 h/wk instead of 50 h/wk. Assuming a feed mill of this size would cost $175/h to run, reducing the operating time by 20 h would save the feed mill approximately $3,500/wk.
For the overall experiment (d 0 to 80), pigs fed the diets with pellets had increased (P < 0.02) ADG and ADFI, with no difference in F/G compared with those fed the mash (Table 9); however, pigs fed the pelleted supplement with ground or cracked corn had poorer (P < 0.03) ADG and F/G and a trend for increased ADFI (P < 0.08) compared with those fed the complete pellet, with the pelleted supplement and ground corn causing the decrease (P < 0.02; the supplement plus ground corn vs. the supple-ment plus cracked corn) in ADG. Although the contrast statements did not directly compare the complete pellet with the mash, we observed a 6 and 4% improvement in ADG and F/G, respectively, when pigs were fed the complete diets in the pellet form compared with the mash form. No differences were measured in F/G when feeding the pelleted supplement with either ground or cracked corn. The difficulty of feeder management and sorting of feed was notably increased when adding either ground or cracked corn postpellet, but due to particle size of the cracked corn, it blended better with the supplement than the ground corn, which provided for easier feeder manage-ment and less sorting of feed than the ground corn plus the pelleted supplement treat-ment. We believe this is the reason feed efficiency was not better for the supplement with ground corn compared with cracked corn, but this conclusion was based on obser-vation alone; feed wastage was not measured.

294
Finishing Nutrition and Management
No differences were found in HCW, backfat thickness, or percentage FFLI among treatments (Table 9). Pigs fed the pelleted treatments had reduced (P < 0.02) percent-age yield compared with those fed the mash, and pigs fed the pelleted supplement with cracked corn had decreased (P < 0.002) percentage yield compared with pelleted supplement with ground corn. Pigs fed the complete diet had decreased (P < 0.03) loin depth compared with those fed the pellet supplement and corn either ground or cracked.
Pigs fed the pelleted diets had similar keratinization scores as those fed the mash diet (Table 10), but pigs fed the pelleted supplement plus corn had improved (P < 0.02) stomach keratinization scores, with a majority of this reduction caused by adding cracked corn postpellet (P < 0.004; pellet supplement plus ground corn vs. pellet supplement plus cracked corn). Pelleting the diet led to an increase (P < 0.05) in ulcer-ation scores; however, these negative effects on ulcer scores were reduced (P < 0.001) by cracking 50% of the corn and adding it postpellet, which resulted in the lowest stomach ulcer scores.
In conclusion, pelleting the complete diet for nursery pigs improved efficiency of gain in 1 of the 2 experiments, but adding a percentage of the corn after pelleting is not a viable option for nursery pigs. In finishing pigs, pelleting the complete diet led to improve-ments in performance, but pelleting the diet increased feed mill energy consumption and increased the incidence of pars esophageal lesions in the stomach. The negative effects of pelleting on stomach morphology and feed mill cost were alleviated by crack-ing 50% of the corn and adding it postpellet. Although finishing pigs fed the cracked corn achieved maximum rates of gain, feed efficiency was reduced by 6% compared with pigs fed the complete pellet; therefore, due to high feed cost, feeding cracked corn is not a viable option unless it is necessary for mortality reasons or to meet production rates.

295
Finishing Nutrition and Management
Table 1. Composition of experimental diets (Exp. 11 and 22; as-fed basis)Item Phase 1 Phase 2Ingredient, %
Corn 44.50 57.82Soybean meal (46.5% CP) 29.00 33.10Spray-dried whey 15.00 —Spray-dried plasma 2.50 —Menhaden fishmeal 3.00 —Soybean oil 3.00 5.00Monocalcium phosphate (21% P) 0.63 1.31Limestone 0.86 1.11Salt 0.30 0.37L-Lysine HCl 0.21 0.32DL-Methionine 0.13 0.13L-Threonine 0.03 0.10Vitamin premix 0.25 0.25Mineral premix 0.15 0.15Zinc oxide 0.19 —Copper sulfate — 0.09Antibiotic3 0.25 0.25
Calculated analysis, %Standardized ileal digestible lysine 1.45 1.27Ca 0.82 0.78Available P 0.43 0.35
1 Experimental treatments were fed as mash, pellets, and pellets with 100% of the corn (ground or cracked) blended into the diet after the rest of the formulation (the supplement) had been pelleted.2 Experimental treatments were fed as mash, pellets, and pellets with 50% of the corn (ground or cracked) blended into with the pelleted supplement.3 To provide 154 g/ton oxytetracycline and 154 g/ton neomycin.

296
Finishing Nutrition and Management
Table 2. Composition of experimental diets (Exp. 3; as-fed basis)1
Item Phase 1 Phase 2 Phase 3Ingredient, %
Corn 74.04 79.25 84.70Soybean meal (46.5% CP) 22.00 17.15 11.90Choice white grease 1.00 1.00 1.00L-Lysine HCl 0.35 0.34 0.35DL-Methionine 0.074 0.070 0.048L-Threonine 0.110 0.117 0.110L-Tryptophan 0.019 0.023 0.037Monocalcium phosphate (21% P) 0.91 0.720 0.540Limestone 1.08 0.91 0.89Salt 0.25 0.25 0.25Vitamin premix 0.08 0.08 0.08Mineral premix 0.04 0.04 0.04Antibiotic2 0.05 0.050 0.05
Calculated analysis, %Standardized ileal digestible lysine 1.00 0.88 0.76Ca 0.70 0.55 0.50Available P 0.30 0.21 0.17
1 Experimental treatments were fed as mash, pellets, and pellets with 50% of the corn (ground or cracked) blended into the diet after the rest of the formulation (the supplement) had been pelleted.2 Provided (per kilogram of diet) 9.1 mg/kg of tylosin.

297
Finishing Nutrition and Management
Table 3. Processing characteristics (Exp. 1)Item Complete pellet Supplement pellet Ground corn1 Cracked corn1
GrindingEnergy, kWh/t N/A2 N/A 6.8 0.9Production rate, t/h N/A N/A 1.1 4.3
Particle sizedgw, μm3 N/A N/A 618 3,444sgw, μm4 N/A N/A 2.16 1.4
PelletingPhase 2
Energy, kWh/ton 14.3 13.0 N/A N/AProduction rate, ton/h 0.75 0.85 N/A N/APDI, %5 97 98 N/A N/A
Phase 3Energy, kWh/ton 13.3 13.0 N/A N/AProduction rate, ton/h 0.83 0.85 N/A N/APDI,%5 87 94 N/A N/A
1 Corn was milled using a three-high roller mill (Model K, Roskamp Manufacturing, Cedar Falls, IA).2 Not applicable.3 Geometric mean particle size.4 Log normal standard deviation.5 Pellet durability index.
Table 4. Effects of replacing 100% of ground corn in pellets with cracked corn in nursery pig diets (Exp. 1)1
Complete mash
Complete pellet
Ground corn +
supplement
Cracked corn +
supplementContrasts2
Item SE 1 2 3Energy kWh/ton3 3.5 17.3 9.9 7.3d 0 to 28
ADG, lb 1.09 1.04 0.98 0.93 0.03 0.001 0.01 0.11ADFI, lb 1.45 1.37 1.43 1.43 0.03 0.16 0.10 0.93F/G 1.33 1.32 1.46 1.55 0.06 0.001 0.001 0.001
Final BW, lb 46.0 44.5 43.0 41.5 0.3 0.001 0.01 0.111 A total 144 pigs (PIC TR4 × 1050, average initial BW of 16.5 lb) were used in the 28-d growth assay with 6 pigs per pen and 6 pens per treat-ment.2 Contrast were: (1) mash vs. treatments with pellets, (2) complete pellets vs. pellet supplement with ground or cracked corn, and (3) ground corn plus pellet supplement vs. cracked corn plus pellet supplement.3 Energy (kWh/ton) = (corn % * grinding energy (kWh/ton)) + (supplement % * pelleting energy (kWh/ton)).

298
Finishing Nutrition and Management
Table 5. Processing characteristics (Exp. 2)Item Complete pellet Supplement pellet Ground corn1 Cracked corn2
GrindingEnergy, kWh/ton N/A3 N/A 8.20 0.99Production rate, ton/h N/A N/A 2.30 5.01
Particle sizedgw, μm4 N/A N/A 445 2,412sgw, μm5 N/A N/A 2.63 2.14
PelletingPhase 2
Energy, kWh/ton 6.20 5.51 N/A N/AProduction rate, ton/h 1.55 1.46 N/A N/APDI, %6 96.6 96.7 N/A N/AModified PDI, %7 95.8 95.8 N/A N/A
Phase 3Energy, kWh/ton 10.08 10.25 N/A N/AProduction rate, ton/h 1.00 1.00 N/A N/APDI, %6 88.9 90.5 N/A N/AModified PDI, %7 82.6 86.1 N/A N/A
1 Corn was milled using a hammer mill (Jacobson P240D) with a screen size of 1/8 in. (teardrop full circle screen). 2 Corn was milled using a three-high roller mill (Model K, Roskamp Manufacturing, Cedar Falls, IA).3 Not applicable.4 Geometric mean particle size.5 Log normal standard deviation.6 Pellet durability index.7 Modified by adding 5 ½-in. hexagonal nuts prior to tumbling.
Table 6. Effects of replacing 50% of ground corn in pellets with cracked corn in nursery pig diets (Exp. 2)
Complete mash
Complete pellet
Ground corn + pelleted
supplement
Cracked corn +
pelleted supplement
Contrasts2
Item SE 1 2 3Energy kWh/ton3 4.2 12.3 9.98 8.1d 0 to 28ADG, lb 1.12 1.10 1.07 1.04 0.03 0.03 0.12 0.26ADFI, lb 1.56 1.45 1.63 1.62 0.04 0.96 0.001 0.78F/G 1.39 1.32 1.52 1.56 0.03 0.01 0.001 0.25Final BW, lb 48.03 47.09 46.18 45.61 1.29 0.03 0.14 0.531 A total 224 pigs (PIC TR4 × 1050, average initial BW of 16.5 lb) were used in the 28-d growth assay with 7 pigs per pen and 8 pens per treat-ment.2 Contrasts were: (1) mash vs. treatments with pellets, (2) complete pellets vs. pellet supplement with ground or cracked corn, and (3) ground corn plus pelleted supplement vs. cracked corn plus pelleted supplement.3 Energy (kWh/ton) = (corn % * grinding energy (kWh/ton)) + (supplement % * pelleting energy (kWh/ton)).

299
Finishing Nutrition and Management
Table 7. Processing characteristics of grinding or cracking corn and pelleting the complete diet or supplement (Exp. 3)
ItemComplete
pelletSupplement
pellet Ground corn1Cracked
corn2
GrindingEnergy, kWh/ton N/A3 N/A 6.95 0.76Production rate, ton/h N/A N/A 6.0 13.2dgw, μm4 N/A N/A 493 2,841sgw, μm5 N/A N/A 2.64 1.97
PelletingEnergy, kWh/ton 15.27 13.91 N/A N/AProduction rate, ton/h 6.05 5.98 N/A N/APDI, %6 89.3 90.4 N/A N/AModified PDI, %7 84.9 85.5 N/A N/A
1 Corn was milled using a hammer mill (JacobseenP24209 Series 2) with a screen size of 1/8 in. (full circle screen). 2 Corn was milled using a two-high roller mill (Ferrell Ross 10 × 30, Hereford, TX).
3 Not applicable.4 Geometric mean particle size. 5 Log normal standard deviation.6 Pellet durability index.7 Modified by adding 5 ½-in. hexagonal nuts prior to tumbling.
Table 8. Electrical consumption and cost for experimental treatments (Exp. 3)
ItemComplete
mashComplete
pellet
Ground corn + pelleted
supplement
Cracked corn + pelleted
supplementEnergy, kWh/ton1 5.5 20.8 13.3 10.9Electrical cost, $/ton2 0.39 1.46 0.93 0.76
Hammer mill 0.39 0.39 0.39 0.20Roller mill 0.00 0.00 0.00 0.02Pellet mill 0.00 1.07 0.54 0.54
1 Energy (kWh/ton) = (corn % * grinding energy (kWh/ton)) + (supplement % * pelleting energy (kWh/ton)).2 Energy cost was based on $0.07/kWh.

300
Finishing Nutrition and Management
Table 9. Effects of replacing 50% of ground corn in pellets with cracked corn in finishing pig diets (Exp. 3)1
Complete mash
Complete pellet
Ground corn +
pelleted supplement
Cracked corn +
pelleted supplement
Contrast2
Item SE 1 2 3d 0 to 80
ADG, lb 2.30 2.44 2.33 2.41 0.03 0.004 0.03 0.02ADFI, lb 5.86 5.99 6.07 6.36 0.10 0.02 0.08 0.06F/G 2.55 2.46 2.61 2.64 0.04 0.62 0.001 0.61
Carcass characteristicsHCW, lb 204.2 210.8 205.4 208.3 2.4 0.17 0.19 0.41Carcass yield, % 74.4 74.0 74.4 73.7 0.1 0.02 0.78 0.001Backfat thickness, in.3 0.73 0.79 0.78 0.74 0.02 0.15 0.33 0.22Loin depth, in.3 2.69 2.60 2.70 2.66 0.03 0.29 0.03 0.36FFLI, %3,4 52.39 51.51 51.64 52.12 0.32 0.10 0.37 0.29
1 A total 252 pigs (PIC TR4 × 1050, average initial BW of 89 lb) were used in the 80-d growth assay.2 Contrasts are: (1) mash vs. treatments with pellets, (2) complete pellets vs. pelleted supplement with ground and cracked corn, and (3) pelleted supplement with ground vs. pelleted supplement with cracked corn. 3 HCW used as a covariate.4 Fat-free lean index.
Table 10. Effects of cracked corn on stomach morphology in finishing pigs (Exp. 3) 1
Complete mash
Complete pellet
Ground corn + pellet
supplement
Cracked corn + pellet
supplementContrast2
Item SE 1 2 3Stomach keratinization3
No. observations 44 41 45 46Normal 8 3 3 16Mild 11 13 12 14Moderate 12 2 10 4Severe 13 23 20 12Mean 2.67 3.22 3.08 2.25 0.26 0.43 0.02 0.004
Stomach ulceration4
No. observations 44 41 45 46Normal 29 16 19 36Erosions 8 15 12 6Ulcers 6 5 12 2Severe ulcers 1 5 2 2Mean 1.53 2.05 2.02 1.36 0.12 0.05 0.02 0.001
1 A total 252 pigs were used in the 80-d growth assay with an average initial BW of 89 lb and an average final BW of 279 lb.2 Contrasts are: (1) mash vs. treatments with pellets, (2) complete pellets vs. pelleted supplement with ground and cracked corn, and (3) pelleted supplement with ground vs. cracked corn.3 Scored on scale: 1 = none, 2 = mild, 3 = moderate, and 4 = severe.4 Scored on scale: 1 = none, 2 = mild, 3 = moderate, and 4 = severe.
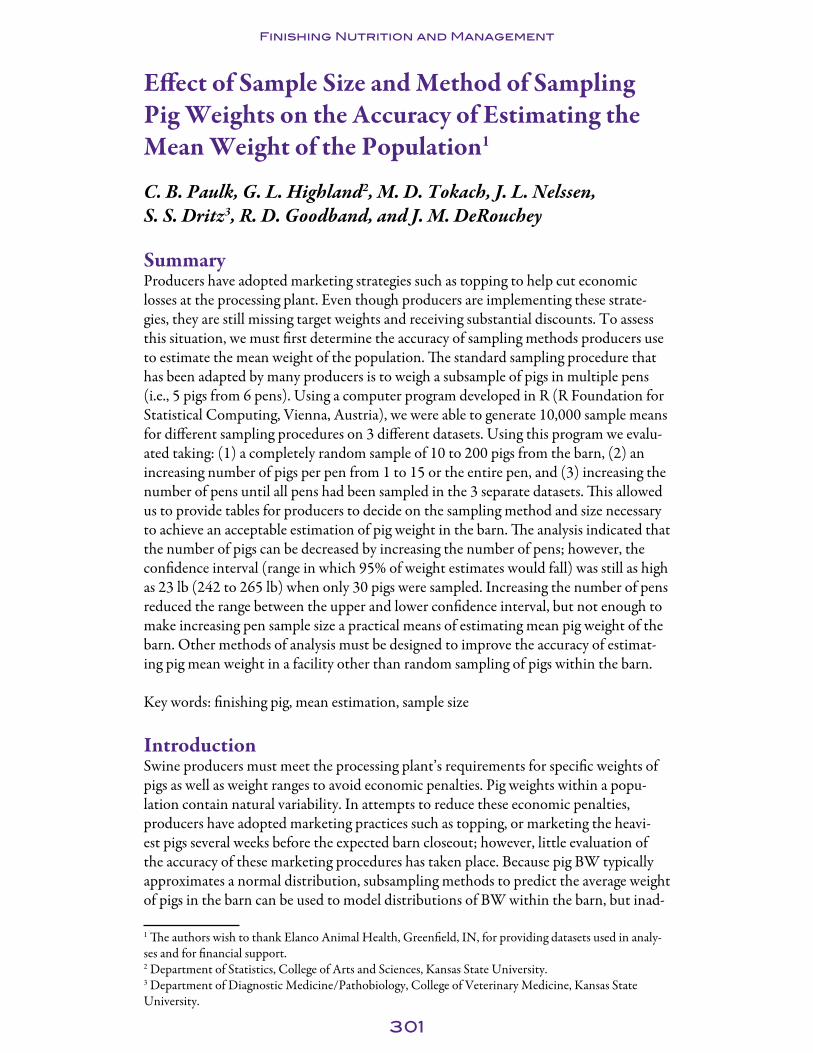
301
Finishing Nutrition and Management
Effect of Sample Size and Method of Sampling Pig Weights on the Accuracy of Estimating the Mean Weight of the Population1
C. B. Paulk, G. L. Highland2, M. D. Tokach, J. L. Nelssen, S. S. Dritz3, R. D. Goodband, and J. M. DeRouchey
SummaryProducers have adopted marketing strategies such as topping to help cut economic losses at the processing plant. Even though producers are implementing these strate-gies, they are still missing target weights and receiving substantial discounts. To assess this situation, we must first determine the accuracy of sampling methods producers use to estimate the mean weight of the population. The standard sampling procedure that has been adapted by many producers is to weigh a subsample of pigs in multiple pens (i.e., 5 pigs from 6 pens). Using a computer program developed in R (R Foundation for Statistical Computing, Vienna, Austria), we were able to generate 10,000 sample means for different sampling procedures on 3 different datasets. Using this program we evalu-ated taking: (1) a completely random sample of 10 to 200 pigs from the barn, (2) an increasing number of pigs per pen from 1 to 15 or the entire pen, and (3) increasing the number of pens until all pens had been sampled in the 3 separate datasets. This allowed us to provide tables for producers to decide on the sampling method and size necessary to achieve an acceptable estimation of pig weight in the barn. The analysis indicated that the number of pigs can be decreased by increasing the number of pens; however, the confidence interval (range in which 95% of weight estimates would fall) was still as high as 23 lb (242 to 265 lb) when only 30 pigs were sampled. Increasing the number of pens reduced the range between the upper and lower confidence interval, but not enough to make increasing pen sample size a practical means of estimating mean pig weight of the barn. Other methods of analysis must be designed to improve the accuracy of estimat-ing pig mean weight in a facility other than random sampling of pigs within the barn.
Key words: finishing pig, mean estimation, sample size
IntroductionSwine producers must meet the processing plant’s requirements for specific weights of pigs as well as weight ranges to avoid economic penalties. Pig weights within a popu-lation contain natural variability. In attempts to reduce these economic penalties, producers have adopted marketing practices such as topping, or marketing the heavi-est pigs several weeks before the expected barn closeout; however, little evaluation of the accuracy of these marketing procedures has taken place. Because pig BW typically approximates a normal distribution, subsampling methods to predict the average weight of pigs in the barn can be used to model distributions of BW within the barn, but inad-
1 The authors wish to thank Elanco Animal Health, Greenfield, IN, for providing datasets used in analy-ses and for financial support.2 Department of Statistics, College of Arts and Sciences, Kansas State University.3 Department of Diagnostic Medicine/Pathobiology, College of Veterinary Medicine, Kansas State University.

302
Finishing Nutrition and Management
equate data exist on the precision of subsampling methods. Therefore, we developed a method to determine the precision and bias of pig mean weight estimates for varying sample sizes and sampling methods.
ProceduresA total of 3 datasets (A, B, and C) were used to evaluate sample size and method of sampling on the precision of estimating the pig mean weight of the barn. The first method of sampling tested was a completely random sample of the barn, disregarding pen arrangements. Samples of different sizes were taken (10, 20, 30, etc.). The second method of sampling tested was comparing the number of pigs (1 to 15 pigs or the entire pen) sampled from an increasing number of pens until the various number of pigs had been selected from all of the pens.
Dataset A was derived from Groesbeck et al., 20074. For dataset A (Figure 1), there was a total of 1,260 pigs with 23 to 28 pigs per pen and a total of 48 pens. The mean, median, standard deviation, and CV of the population were 253.0 lb, 254 lb, 32.8 lb, and 13.0%, respectively. Datasets B and C were obtained from research trials conducted by Elanco Animal Health. Notably, a portion of the heaviest and lightest pigs were removed from the barn prior to starting the studies for experimental design purposes, which could lead to a reduction in the variation of the barn. For dataset B (Figure 2), there was a total of 1,696 pigs with 16 to 23 pigs per pen and a total of 84 pens. The mean, median, standard deviation, and CV of the population were 275.0 lb, 277 lb, 27.1 lb, and 9.8%, respectively. For dataset C (Figure 3), there was a total of 950 pigs with 19 to 21 pigs per pen and a total of 48 pens. The mean, median, standard devia-tion, and CV of the population were 209.6 lb, 209 lb, 19.4 lb, and 9.3%, respectively.
A program was coded using R to demonstrate the error that varying sample sizes and methods of selecting pig weights to sample have on the estimation of the mean weight of the population. For the first method of sampling, the program was designed to take a completely random sample of the designated sample size, disregarding pen arrange-ments, and calculate the mean of this sample. The program then conducts this sampling technique 10,000 times, generating 10,000 sample means for each sample size (10, 20, 30, etc.) by randomly selecting the desired number of pig weights from the population. The 10,000 sample means for each sample size are sorted from least to greatest, and a 95% confidence interval (CI) is generated by selecting the 9,751st observation, the upper CI, and the 250th observation, the lower CI. The distances between the upper and lower CI represent the range of the mean estimations. Figures 4, 5, and 6 display a reference line for the upper and lower CI, and the line drawn down the middle repre-sents the mean of the population. A similar code was conducted using R for the second method, but the second sampling method tested the sampling error among a varying number of pigs within varying numbers of pens, with 1 to 15 pigs or the entire pen sampled from 1 to all of the pens. Figures 7, 8, and 9 represent the range between the upper and lower limits associated with the varying number of pigs per pen and varying numbers of pens, and the following Tables (2, 3, and 4) list the range values.
4 Groesbeck, G. N., G. Armbuster, M. D. Tokach, R. D. Goodband, J. M. DeRouchey, and J. L. Nelssen. 2007. Influence of Pulmotil, Tylan, and Paylean on pig growth performance and weight variation. Am. Assoc. Swine Vet. Proc., pp. 235-238.

303
Finishing Nutrition and Management
Results and DiscussionIt is important to note that the random samples were generated using a computer program, that samples taken from the barn are not truly random, and that bias can be generated. When increasing the sample size of a completely random sample from 10 to 200 pigs, the range between the upper and lower CI was reduced when estimating the mean (Figures 4, 5, and 6) for all 3 datasets. A majority of the improvement in the precision of the estimation occurred when the sample size was increased from 10 to 90 pigs (Table 1). The difference in accuracy of sample size between the different datasets is also important to note. This could result from the difference in the standard deviation of each dataset along with the distribution of each dataset (Figures 1, 2, and 3). Any removal of lightweight pigs prior to starting pigs on test may have altered the variation of pigs within the dataset, which may be particularly evident in datasets B and C.
As both the number of pigs and the number of pens were increased when sampling, the range or distance between the upper and lower CI decreased (Figures 7, 8, 9 and Tables 2, 3, and 4). For the barn with the most variation, increasing the number of pens sampled while keeping the total number of pigs sampled constant led to a reduction in range between the upper and lower CI (Table 5). For dataset A, when sampling 15 pigs from 2 pens the estimated range between the upper and lower CI was 32 lb, but when sampling 1 pig from 30 pens the range between the upper and lower CI was to be 23.1 lb. Therefore, increasing the number of pens used when sampling the barn can improve the range between the upper and lower CI by 28%; however, this improvement was not observed in datasets B and C. The decreased variation in datasets B and C due to allotment for experimental design purposes allowed for a smaller effect or no effect on the range by increasing the number of pens sampled. Because dataset A is typical for a commercial barn and no negative effects were observed from increasing the number of pens on datasets B and C, taking a random sample from an increasing number of pens is recommended when estimating the mean of the barn.
In conclusion, sample size, method, variation, and distribution of pigs within a barn can substantially affect the precision of estimating the mean weight of all pigs in the barn. Producers should take this into consideration when weighing pigs prior to topping to make marketing decisions. Finding ways to improve the ability to accurately estimate the mean weight of pigs without drastically increasing workload could provide great benefits for producers in making marketing decisions.
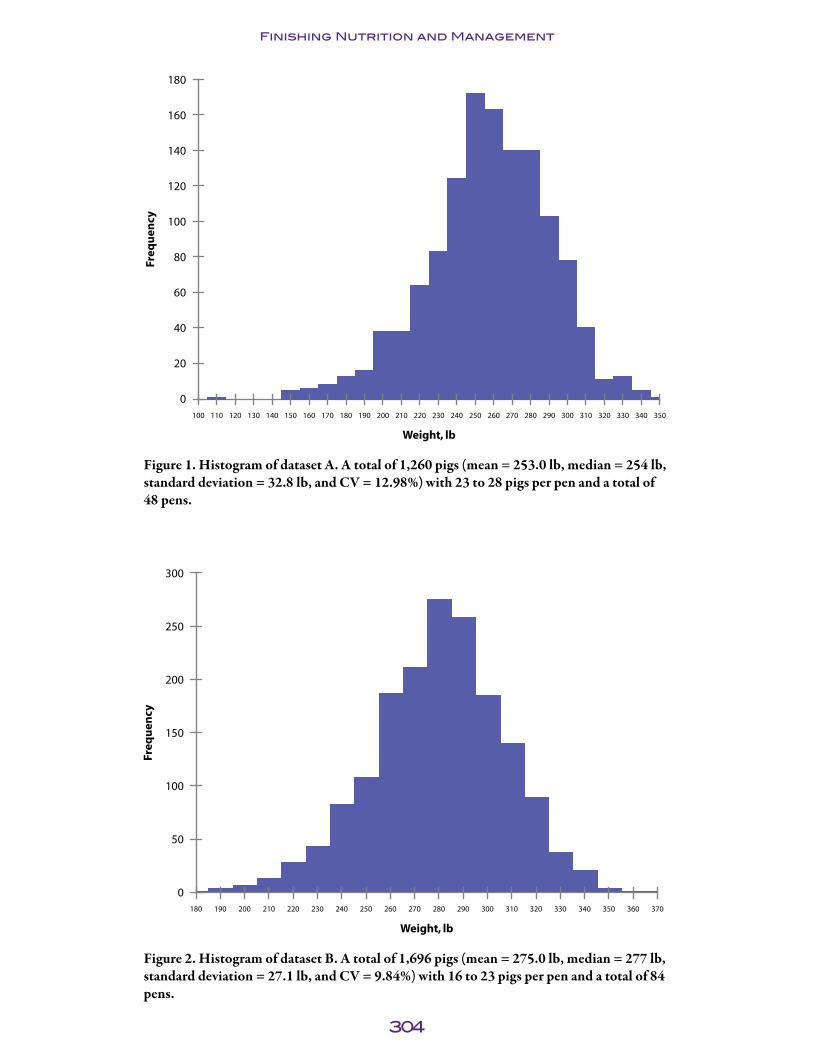
304
Finishing Nutrition and Management
Freq
uen
cy
180
160
140
120
100
80
60
40
20
0
Weight, lb
340330320310300290280270260250240230220210200190180170160150140130120110 350100
Figure 1. Histogram of dataset A. A total of 1,260 pigs (mean = 253.0 lb, median = 254 lb, standard deviation = 32.8 lb, and CV = 12.98%) with 23 to 28 pigs per pen and a total of 48 pens.
Freq
uen
cy
300
250
200
150
100
50
0
Weight, lb
340330320310300290280270260250240230220210200190180 370360350
Figure 2. Histogram of dataset B. A total of 1,696 pigs (mean = 275.0 lb, median = 277 lb, standard deviation = 27.1 lb, and CV = 9.84%) with 16 to 23 pigs per pen and a total of 84 pens.
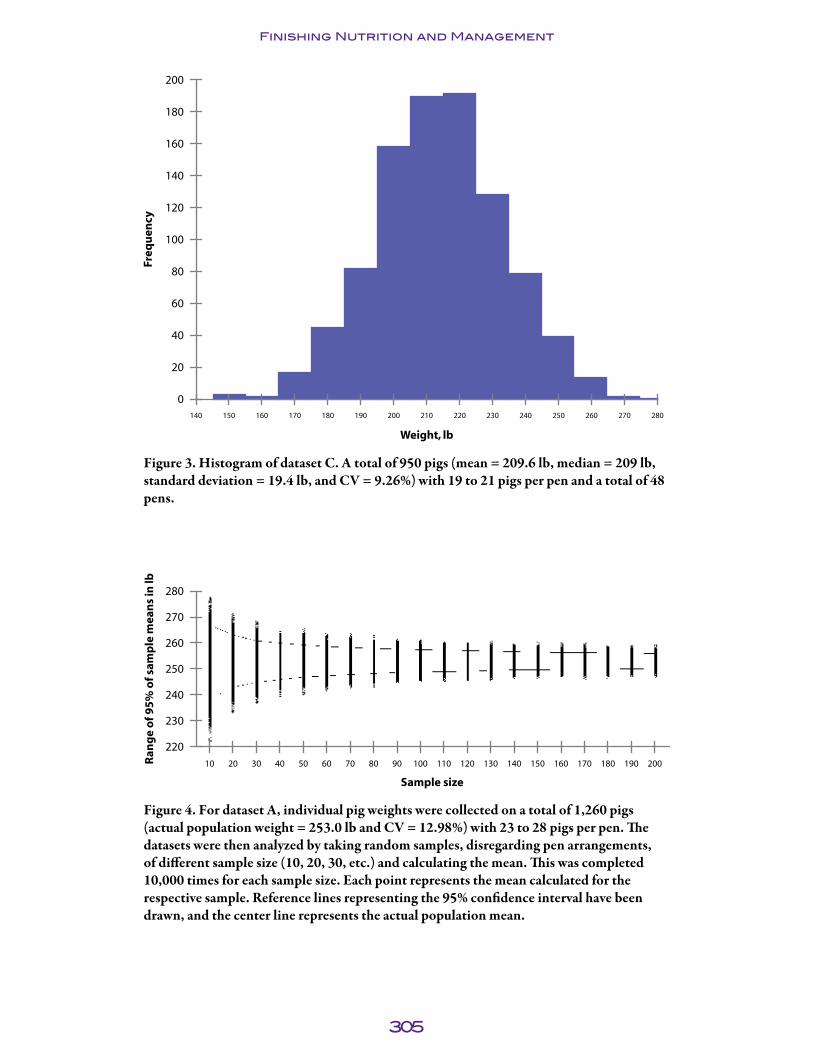
305
Finishing Nutrition and Management
Freq
uen
cy
200
180
160
140
120
100
80
60
40
20
0
Weight, lb
140 280270260250240230220210200190180170160150
Figure 3. Histogram of dataset C. A total of 950 pigs (mean = 209.6 lb, median = 209 lb, standard deviation = 19.4 lb, and CV = 9.26%) with 19 to 21 pigs per pen and a total of 48 pens.
Ran
ge
of 9
5%
of s
amp
le m
ean
s in
lb
280
270
260
250
240
230
220
Sample size
10 2001401301201101009080706050403020 190180170160150
Figure 4. For dataset A, individual pig weights were collected on a total of 1,260 pigs (actual population weight = 253.0 lb and CV = 12.98%) with 23 to 28 pigs per pen. The datasets were then analyzed by taking random samples, disregarding pen arrangements, of different sample size (10, 20, 30, etc.) and calculating the mean. This was completed 10,000 times for each sample size. Each point represents the mean calculated for the respective sample. Reference lines representing the 95% confidence interval have been drawn, and the center line represents the actual population mean.
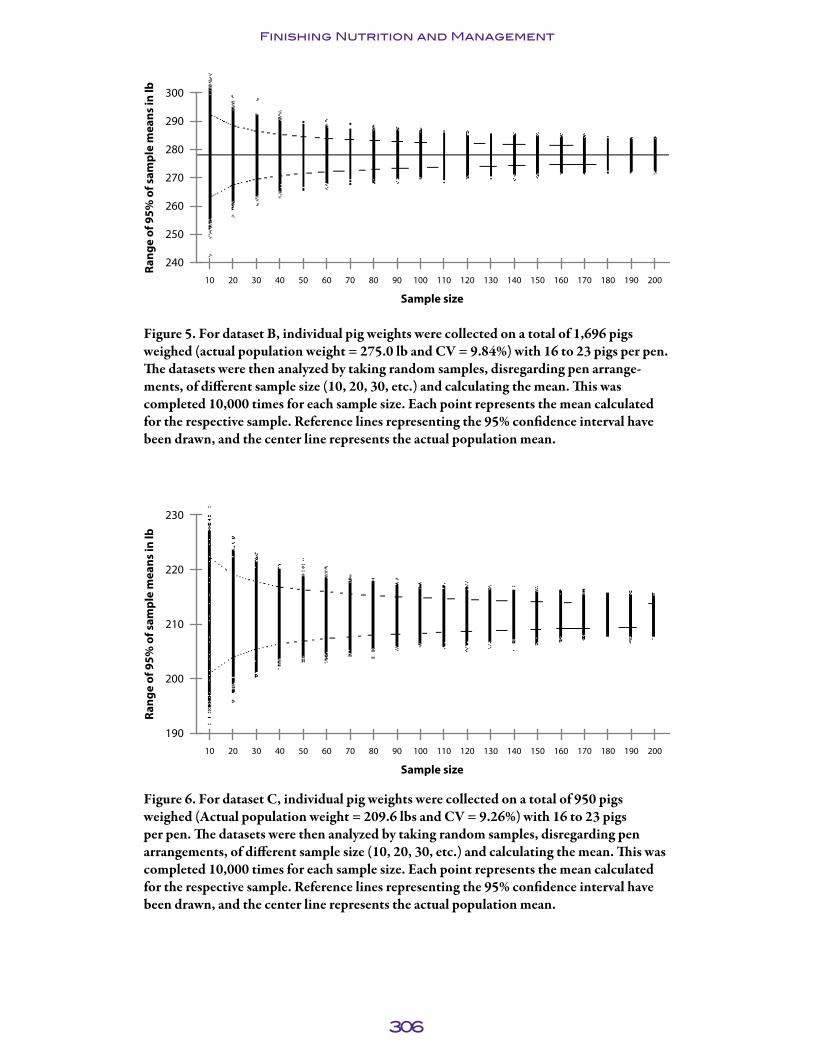
306
Finishing Nutrition and Management
Ran
ge
of 9
5%
of s
amp
le m
ean
s in
lb 300
290
280
270
260
250
240
Sample size
10 2001401301201101009080706050403020 190180170160150
Figure 5. For dataset B, individual pig weights were collected on a total of 1,696 pigs weighed (actual population weight = 275.0 lb and CV = 9.84%) with 16 to 23 pigs per pen. The datasets were then analyzed by taking random samples, disregarding pen arrange-ments, of different sample size (10, 20, 30, etc.) and calculating the mean. This was completed 10,000 times for each sample size. Each point represents the mean calculated for the respective sample. Reference lines representing the 95% confidence interval have been drawn, and the center line represents the actual population mean.
Ran
ge
of 9
5%
of s
amp
le m
ean
s in
lb
230
220
210
200
190
Sample size
10 2001401301201101009080706050403020 190180170160150
Figure 6. For dataset C, individual pig weights were collected on a total of 950 pigs weighed (Actual population weight = 209.6 lbs and CV = 9.26%) with 16 to 23 pigs per pen. The datasets were then analyzed by taking random samples, disregarding pen arrangements, of different sample size (10, 20, 30, etc.) and calculating the mean. This was completed 10,000 times for each sample size. Each point represents the mean calculated for the respective sample. Reference lines representing the 95% confidence interval have been drawn, and the center line represents the actual population mean.

307
Finishing Nutrition and Management
Table 1. The mean upper confidence interval (CI), lower confidence interval, and range of estimates when taking a completely random sample of 30, 60, 90, or 120 pigs from dataset A, B, or C
Sampling methodMean of
10,000 simulations Upper CI Lower CI RangeDataset A1
30 pigs 253.0 264.2 241.2 22.9560 pigs 252.9 261.0 244.7 16.2590 pigs 253.0 259.4 246.6 12.83120 pigs 253.0 258.6 247.2 11.36
Dataset B2
30 pigs 275.2 284.7 265.4 19.3060 pigs 275.0 281.6 268.3 13.2890 pigs 275.0 280.5 269.7 10.81120 pigs 275.0 279.8 270.3 9.44
Dataset C3
30 pigs 209.6 216.4 202.7 13.7360 pigs 209.6 214.5 204.9 9.5890 pigs 209.6 213.3 205.7 7.61120 pigs 209.5 212.8 206.3 6.48
1 A total of 1,260 pigs (mean = 253.0 lb, median = 254 lb, standard deviation = 32.8 lb, and CV = 12.98%) with 23 to 28 pigs per pen and a total of 48 pens.2 A total of 1,696 pigs (mean = 275.0 lb, median = 277 lb, standard deviation = 27.1 lb, and CV = 9.84%) with 16 to 23 pigs per pen and a total of 84 pens.3 A total of 950 pigs (mean = 209.6 lb, median = 209 lb, standard deviation = 19.4 lb, and CV = 9.26%) with 19 to 21 pigs per pen and a total of 48 pens.

308
Finishing Nutrition and Management
1
141312111098765432
15Pigs
Pens
46
41
36
3126
2116
116
1
100.0110.0120.0130.0140.0
50.060.070.080.090.0
10.020.030.040.0
130.0 - 140.0
120.0 - 130.0
110.0 - 120.0
100.0 - 110.0
90.0 - 100.0
80.0 - 90.0
70.0 - 80.0
60.0 - 70.0
50.0 - 60.0
40.0 - 50.0
30.0 - 40.0
20.0 - 30.0
10.0 - 20.0
0.0 - 10.0
Range
Figure 7. For dataset A, individual pig weights were collected on a total of 1,260 pigs (actual population weight = 253.0 lb and CV = 12.98%) with 23 to 28 pigs per pen. The dataset was analyzed by estimating the overall mean using different sampling methods. These methods explored different numbers of pigs selected within pens, and total number of pens sampled. This was completed 10,000 times for each sampling method and the range or difference between the upper and lower confidence interval was calculated. Each point on this graph shows the range between the upper and lower confidence interval, represented in pounds.
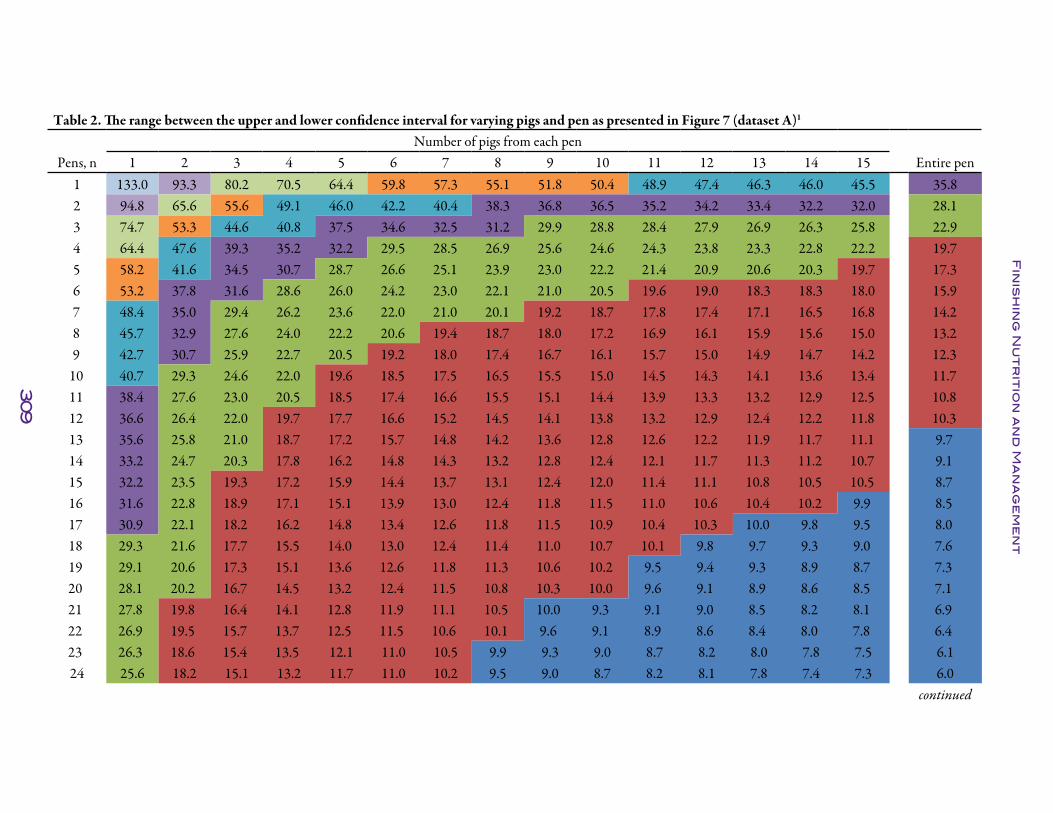
309
Fin
ish
ing
Nu
tr
itio
n a
nd
Ma
na
ge
me
nt
Table 2. The range between the upper and lower confidence interval for varying pigs and pen as presented in Figure 7 (dataset A)1
Number of pigs from each pen Pens, n 1 2 3 4 5 6 7 8 9 10 11 12 13 14 15 Entire pen
1 133.0 93.3 80.2 70.5 64.4 59.8 57.3 55.1 51.8 50.4 48.9 47.4 46.3 46.0 45.5 35.82 94.8 65.6 55.6 49.1 46.0 42.2 40.4 38.3 36.8 36.5 35.2 34.2 33.4 32.2 32.0 28.13 74.7 53.3 44.6 40.8 37.5 34.6 32.5 31.2 29.9 28.8 28.4 27.9 26.9 26.3 25.8 22.94 64.4 47.6 39.3 35.2 32.2 29.5 28.5 26.9 25.6 24.6 24.3 23.8 23.3 22.8 22.2 19.75 58.2 41.6 34.5 30.7 28.7 26.6 25.1 23.9 23.0 22.2 21.4 20.9 20.6 20.3 19.7 17.36 53.2 37.8 31.6 28.6 26.0 24.2 23.0 22.1 21.0 20.5 19.6 19.0 18.3 18.3 18.0 15.97 48.4 35.0 29.4 26.2 23.6 22.0 21.0 20.1 19.2 18.7 17.8 17.4 17.1 16.5 16.8 14.28 45.7 32.9 27.6 24.0 22.2 20.6 19.4 18.7 18.0 17.2 16.9 16.1 15.9 15.6 15.0 13.29 42.7 30.7 25.9 22.7 20.5 19.2 18.0 17.4 16.7 16.1 15.7 15.0 14.9 14.7 14.2 12.3
10 40.7 29.3 24.6 22.0 19.6 18.5 17.5 16.5 15.5 15.0 14.5 14.3 14.1 13.6 13.4 11.711 38.4 27.6 23.0 20.5 18.5 17.4 16.6 15.5 15.1 14.4 13.9 13.3 13.2 12.9 12.5 10.812 36.6 26.4 22.0 19.7 17.7 16.6 15.2 14.5 14.1 13.8 13.2 12.9 12.4 12.2 11.8 10.313 35.6 25.8 21.0 18.7 17.2 15.7 14.8 14.2 13.6 12.8 12.6 12.2 11.9 11.7 11.1 9.714 33.2 24.7 20.3 17.8 16.2 14.8 14.3 13.2 12.8 12.4 12.1 11.7 11.3 11.2 10.7 9.115 32.2 23.5 19.3 17.2 15.9 14.4 13.7 13.1 12.4 12.0 11.4 11.1 10.8 10.5 10.5 8.716 31.6 22.8 18.9 17.1 15.1 13.9 13.0 12.4 11.8 11.5 11.0 10.6 10.4 10.2 9.9 8.517 30.9 22.1 18.2 16.2 14.8 13.4 12.6 11.8 11.5 10.9 10.4 10.3 10.0 9.8 9.5 8.018 29.3 21.6 17.7 15.5 14.0 13.0 12.4 11.4 11.0 10.7 10.1 9.8 9.7 9.3 9.0 7.619 29.1 20.6 17.3 15.1 13.6 12.6 11.8 11.3 10.6 10.2 9.5 9.4 9.3 8.9 8.7 7.320 28.1 20.2 16.7 14.5 13.2 12.4 11.5 10.8 10.3 10.0 9.6 9.1 8.9 8.6 8.5 7.121 27.8 19.8 16.4 14.1 12.8 11.9 11.1 10.5 10.0 9.3 9.1 9.0 8.5 8.2 8.1 6.922 26.9 19.5 15.7 13.7 12.5 11.5 10.6 10.1 9.6 9.1 8.9 8.6 8.4 8.0 7.8 6.423 26.3 18.6 15.4 13.5 12.1 11.0 10.5 9.9 9.3 9.0 8.7 8.2 8.0 7.8 7.5 6.124 25.6 18.2 15.1 13.2 11.7 11.0 10.2 9.5 9.0 8.7 8.2 8.1 7.8 7.4 7.3 6.0
continued

310
Fin
ish
ing
Nu
tr
itio
n a
nd
Ma
na
ge
me
nt
Table 2. The range between the upper and lower confidence interval for varying pigs and pen as presented in Figure 7 (dataset A)1
Number of pigs from each pen Pens, n 1 2 3 4 5 6 7 8 9 10 11 12 13 14 15 Entire pen
25 25.1 18.0 14.6 12.9 11.5 10.6 9.8 9.5 8.8 8.4 8.1 7.8 7.5 7.3 7.0 5.626 24.8 17.6 14.5 12.5 11.3 10.3 9.7 9.1 8.6 8.2 7.8 7.5 7.4 7.0 6.8 5.427 24.0 17.6 14.2 12.3 11.0 10.0 9.4 8.8 8.3 8.0 7.6 7.4 7.1 6.9 6.6 5.328 23.7 16.8 14.0 12.0 10.7 9.9 9.1 8.7 8.1 7.8 7.4 7.0 6.8 6.6 6.4 5.029 23.2 16.6 13.3 11.7 10.4 9.5 8.8 8.2 7.8 7.5 7.1 6.9 6.5 6.4 6.2 4.830 23.1 16.4 13.0 11.5 10.5 9.2 8.7 8.2 7.7 7.3 7.0 6.8 6.5 6.3 5.9 4.531 22.5 15.8 13.0 11.0 10.1 9.2 8.4 7.9 7.4 7.2 6.8 6.5 6.1 6.1 5.8 4.332 22.1 15.7 12.6 10.9 9.9 8.9 8.2 7.8 7.2 6.8 6.4 6.3 6.1 5.8 5.6 4.233 21.5 15.4 12.5 10.7 9.7 8.8 8.1 7.6 7.0 6.7 6.5 6.2 5.9 5.6 5.4 3.934 21.3 15.1 12.1 10.6 9.4 8.7 8.0 7.3 6.9 6.5 6.2 5.9 5.7 5.4 5.2 3.735 20.9 14.7 12.0 10.5 9.4 8.4 7.7 7.3 6.7 6.4 6.2 5.8 5.5 5.3 5.0 3.636 20.5 14.3 11.8 10.1 9.0 8.3 7.6 7.1 6.6 6.2 5.8 5.6 5.3 5.1 4.9 3.537 20.6 14.5 11.7 10.0 8.9 8.0 7.5 6.9 6.3 6.0 5.7 5.5 5.2 5.0 4.7 3.238 19.9 14.2 11.3 9.7 8.7 7.9 7.2 6.7 6.2 5.8 5.5 5.2 5.0 4.8 4.6 3.039 19.7 14.1 11.4 9.6 8.5 7.7 7.1 6.5 6.1 5.7 5.4 5.1 4.9 4.7 4.4 2.940 19.6 13.7 11.4 9.4 8.4 7.5 6.8 6.3 5.9 5.5 5.2 4.9 4.7 4.4 4.2 2.641 19.4 13.4 10.8 9.3 8.2 7.4 6.7 6.3 5.8 5.4 5.1 4.8 4.5 4.3 4.0 2.442 18.8 13.3 10.8 9.1 8.0 7.1 6.7 6.0 5.7 5.2 5.0 4.7 4.4 4.1 3.9 2.243 18.8 13.1 10.4 9.0 7.8 7.1 6.4 5.9 5.5 5.1 4.9 4.6 4.3 4.0 3.7 2.044 18.6 12.7 10.3 8.9 7.9 7.0 6.3 5.7 5.4 5.0 4.7 4.3 4.1 3.9 3.7 1.845 18.2 12.9 10.2 8.7 7.8 6.7 6.2 5.7 5.3 4.8 4.5 4.2 3.9 3.6 3.5 1.546 17.9 12.4 10.2 8.7 7.3 6.7 6.1 5.5 5.2 4.7 4.4 4.1 3.8 3.5 3.4 1.247 17.8 12.5 9.9 8.4 7.4 6.5 6.0 5.3 5.0 4.5 4.3 4.0 3.6 3.4 3.2 0.848 17.8 12.4 9.8 8.4 7.2 6.5 5.8 5.4 4.9 4.6 4.2 3.8 3.5 3.3 3.0 0.0
1 Colors match the color scheme in Figure 7, representing a range of 10 lb for each color.

311
Finishing Nutrition and Management
1
141312111098765432
15Pigs
Pens
64
57
5043
3629
2215
81
100.0
110.0
120.0
50.0
60.0
70.0
80.0
90.0
10.0
20.0
30.0
40.0
110.0 - 120.0
100.0 - 110.0
90.0 - 100.0
80.0 - 90.0
70.0 - 80.0
60.0 - 70.0
50.0 - 60.0
40.0 - 50.0
30.0 - 40.0
20.0 - 30.0
10.0 - 20.0
0.0 - 10.0
Range
71
78
Figure 8. For dataset B, individual pig weights were collected on a total of 1,696 pigs weighed (actual population weight = 275.0 lb and CV = 9.84%) with 16 to 23 pigs per pen. The dataset was analyzed by estimating the overall mean using different sampling meth-ods. These methods explored different numbers of pigs selected within pens, and total number of pens sampled. This was completed 10,000 times for each sampling method and the range or difference between the upper and lower confidence interval was calculated. Each point on this graph shows the range between the upper and lower confidence inter-val, represented in pounds.

312
Fin
ish
ing
Nu
tr
itio
n a
nd
Ma
na
ge
me
nt
Table 3. The range between the upper and lower confidence interval for varying pigs and pen as presented in Figure 8 (dataset B)1
Number of pigs from each penPens, n 1 2 3 4 5 6 7 8 9 10 11 12 13 14 15 Entire pen
1 111.0 77.0 64.7 58.8 52.8 49.2 46.6 44.0 42.1 40.5 39.6 38.4 36.8 36.1 35.4 32.072 74.5 55.3 46.2 39.9 36.9 34.5 32.6 30.9 30.1 29.3 28.0 27.2 26.5 26.1 25.2 23.773 61.0 44.2 36.9 33.2 30.0 28.0 26.7 25.8 24.4 23.8 23.0 22.1 21.8 21.2 20.9 19.404 53.8 38.1 32.3 28.5 26.4 24.4 22.8 21.7 21.1 20.7 19.6 19.0 18.4 18.5 17.7 16.885 47.0 34.1 29.0 25.4 23.0 21.6 20.6 19.7 18.9 18.1 17.7 17.0 16.8 16.6 16.0 14.816 43.7 31.5 26.4 23.2 21.2 19.8 18.9 18.0 17.1 16.6 16.1 15.5 15.3 14.8 14.5 13.487 40.1 28.6 24.2 21.4 19.9 18.3 17.0 16.6 15.6 15.2 14.8 14.4 14.0 13.8 13.4 12.558 37.6 27.1 22.8 20.0 18.3 17.0 15.9 15.0 14.5 14.2 13.7 13.2 12.9 12.7 12.7 11.539 35.0 25.6 21.5 19.1 17.5 16.0 15.4 14.6 13.9 13.1 13.0 12.6 12.2 12.0 11.6 11.00
10 33.4 24.5 19.7 17.8 16.1 15.1 14.3 13.7 13.1 12.7 12.1 12.0 11.6 11.3 11.0 10.0611 31.7 23.2 19.0 17.0 15.6 14.3 13.7 13.1 12.4 12.1 11.5 11.0 10.9 10.7 10.5 9.8012 30.8 22.1 18.2 15.8 14.8 13.9 13.1 12.4 11.7 11.7 11.1 10.8 10.4 10.2 10.0 9.2213 29.2 21.2 17.7 15.6 14.2 13.1 12.7 11.6 11.4 10.7 10.5 10.3 9.8 9.8 9.5 8.7914 27.6 20.4 16.7 15.1 13.5 13.0 12.1 11.4 10.9 10.4 10.1 9.9 9.5 9.4 9.2 8.4215 27.6 19.6 16.1 14.3 13.0 12.2 11.6 10.9 10.5 10.0 9.6 9.4 9.1 9.0 8.7 8.0016 26.3 19.1 15.8 14.1 12.6 11.8 10.9 10.3 9.8 9.5 9.6 9.0 9.0 8.6 8.4 7.8317 25.5 18.7 15.3 13.5 12.3 11.4 10.6 10.1 9.7 9.3 8.9 8.7 8.6 8.2 8.1 7.4618 24.5 17.9 14.9 13.2 11.9 10.9 10.4 9.8 9.4 9.0 8.6 8.5 8.2 8.0 7.8 7.2019 24.2 17.6 14.5 12.5 11.5 10.8 9.9 9.4 9.1 8.9 8.5 8.3 8.0 7.8 7.5 6.9320 23.5 16.9 13.8 12.1 11.0 10.3 9.9 9.1 8.8 8.5 8.3 7.9 7.7 7.4 7.3 6.8221 23.0 16.4 13.7 12.0 10.9 10.0 9.5 9.0 8.5 8.2 8.0 7.7 7.6 7.2 7.1 6.5722 22.4 16.0 13.4 11.7 10.7 9.7 9.3 8.9 8.2 8.0 7.7 7.4 7.3 7.0 7.0 6.1923 21.9 15.7 13.1 11.5 10.3 9.6 9.0 8.5 8.1 7.8 7.6 7.1 7.1 7.0 6.7 6.1024 21.2 15.7 12.7 11.2 10.2 9.4 8.8 8.3 7.9 7.5 7.3 7.0 6.8 6.8 6.7 5.9325 20.8 15.0 12.3 10.7 10.0 9.3 8.6 8.0 7.8 7.3 7.1 6.8 6.8 6.5 6.4 5.8026 21.0 14.8 12.2 10.6 9.6 8.9 8.2 7.9 7.6 7.3 7.0 6.8 6.5 6.4 6.2 5.6127 20.3 14.5 12.0 10.4 9.4 8.7 8.2 7.8 7.4 7.0 6.9 6.6 6.5 6.2 6.0 5.3728 19.9 14.3 11.6 10.2 9.4 8.5 8.0 7.6 7.1 6.9 6.6 6.4 6.2 6.0 5.8 5.25
continued
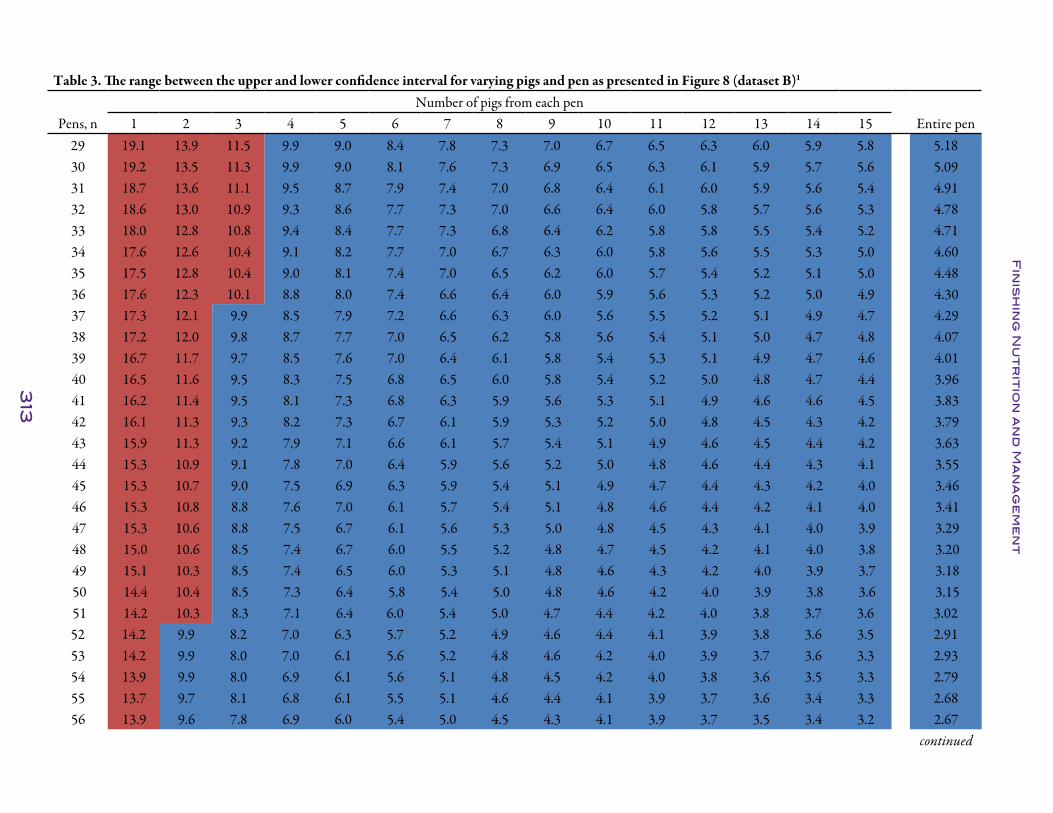
313
Fin
ish
ing
Nu
tr
itio
n a
nd
Ma
na
ge
me
nt
Table 3. The range between the upper and lower confidence interval for varying pigs and pen as presented in Figure 8 (dataset B)1
Number of pigs from each penPens, n 1 2 3 4 5 6 7 8 9 10 11 12 13 14 15 Entire pen
29 19.1 13.9 11.5 9.9 9.0 8.4 7.8 7.3 7.0 6.7 6.5 6.3 6.0 5.9 5.8 5.1830 19.2 13.5 11.3 9.9 9.0 8.1 7.6 7.3 6.9 6.5 6.3 6.1 5.9 5.7 5.6 5.0931 18.7 13.6 11.1 9.5 8.7 7.9 7.4 7.0 6.8 6.4 6.1 6.0 5.9 5.6 5.4 4.9132 18.6 13.0 10.9 9.3 8.6 7.7 7.3 7.0 6.6 6.4 6.0 5.8 5.7 5.6 5.3 4.7833 18.0 12.8 10.8 9.4 8.4 7.7 7.3 6.8 6.4 6.2 5.8 5.8 5.5 5.4 5.2 4.7134 17.6 12.6 10.4 9.1 8.2 7.7 7.0 6.7 6.3 6.0 5.8 5.6 5.5 5.3 5.0 4.6035 17.5 12.8 10.4 9.0 8.1 7.4 7.0 6.5 6.2 6.0 5.7 5.4 5.2 5.1 5.0 4.4836 17.6 12.3 10.1 8.8 8.0 7.4 6.6 6.4 6.0 5.9 5.6 5.3 5.2 5.0 4.9 4.3037 17.3 12.1 9.9 8.5 7.9 7.2 6.6 6.3 6.0 5.6 5.5 5.2 5.1 4.9 4.7 4.2938 17.2 12.0 9.8 8.7 7.7 7.0 6.5 6.2 5.8 5.6 5.4 5.1 5.0 4.7 4.8 4.0739 16.7 11.7 9.7 8.5 7.6 7.0 6.4 6.1 5.8 5.4 5.3 5.1 4.9 4.7 4.6 4.0140 16.5 11.6 9.5 8.3 7.5 6.8 6.5 6.0 5.8 5.4 5.2 5.0 4.8 4.7 4.4 3.9641 16.2 11.4 9.5 8.1 7.3 6.8 6.3 5.9 5.6 5.3 5.1 4.9 4.6 4.6 4.5 3.8342 16.1 11.3 9.3 8.2 7.3 6.7 6.1 5.9 5.3 5.2 5.0 4.8 4.5 4.3 4.2 3.7943 15.9 11.3 9.2 7.9 7.1 6.6 6.1 5.7 5.4 5.1 4.9 4.6 4.5 4.4 4.2 3.6344 15.3 10.9 9.1 7.8 7.0 6.4 5.9 5.6 5.2 5.0 4.8 4.6 4.4 4.3 4.1 3.5545 15.3 10.7 9.0 7.5 6.9 6.3 5.9 5.4 5.1 4.9 4.7 4.4 4.3 4.2 4.0 3.4646 15.3 10.8 8.8 7.6 7.0 6.1 5.7 5.4 5.1 4.8 4.6 4.4 4.2 4.1 4.0 3.4147 15.3 10.6 8.8 7.5 6.7 6.1 5.6 5.3 5.0 4.8 4.5 4.3 4.1 4.0 3.9 3.2948 15.0 10.6 8.5 7.4 6.7 6.0 5.5 5.2 4.8 4.7 4.5 4.2 4.1 4.0 3.8 3.2049 15.1 10.3 8.5 7.4 6.5 6.0 5.3 5.1 4.8 4.6 4.3 4.2 4.0 3.9 3.7 3.1850 14.4 10.4 8.5 7.3 6.4 5.8 5.4 5.0 4.8 4.6 4.2 4.0 3.9 3.8 3.6 3.1551 14.2 10.3 8.3 7.1 6.4 6.0 5.4 5.0 4.7 4.4 4.2 4.0 3.8 3.7 3.6 3.0252 14.2 9.9 8.2 7.0 6.3 5.7 5.2 4.9 4.6 4.4 4.1 3.9 3.8 3.6 3.5 2.9153 14.2 9.9 8.0 7.0 6.1 5.6 5.2 4.8 4.6 4.2 4.0 3.9 3.7 3.6 3.3 2.9354 13.9 9.9 8.0 6.9 6.1 5.6 5.1 4.8 4.5 4.2 4.0 3.8 3.6 3.5 3.3 2.7955 13.7 9.7 8.1 6.8 6.1 5.5 5.1 4.6 4.4 4.1 3.9 3.7 3.6 3.4 3.3 2.6856 13.9 9.6 7.8 6.9 6.0 5.4 5.0 4.5 4.3 4.1 3.9 3.7 3.5 3.4 3.2 2.67
continued

314
Fin
ish
ing
Nu
tr
itio
n a
nd
Ma
na
ge
me
nt
Table 3. The range between the upper and lower confidence interval for varying pigs and pen as presented in Figure 8 (dataset B)1
Number of pigs from each penPens, n 1 2 3 4 5 6 7 8 9 10 11 12 13 14 15 Entire pen
57 13.6 9.6 7.7 6.6 6.0 5.3 4.9 4.6 4.2 4.0 3.9 3.5 3.4 3.2 3.1 2.5558 13.4 9.3 7.8 6.6 5.9 5.3 4.8 4.5 4.2 3.9 3.7 3.5 3.3 3.2 3.0 2.5059 13.3 9.4 7.5 6.5 5.8 5.2 4.7 4.5 4.1 3.8 3.6 3.5 3.2 3.2 3.0 2.4760 13.1 9.2 7.6 6.2 5.7 5.1 4.7 4.4 4.1 3.8 3.6 3.5 3.2 3.1 2.9 2.3961 13.1 9.2 7.3 6.3 5.6 4.9 4.6 4.2 4.1 3.7 3.5 3.3 3.1 3.0 2.9 2.3262 12.9 9.0 7.3 6.2 5.6 4.9 4.6 4.2 4.0 3.7 3.5 3.3 3.1 2.9 2.8 2.2263 12.9 9.0 7.3 6.3 5.5 4.9 4.5 4.2 3.9 3.7 3.4 3.2 3.0 2.9 2.8 2.1964 12.6 9.0 7.0 6.2 5.4 4.9 4.4 4.1 3.8 3.6 3.4 3.2 3.0 2.8 2.7 2.1065 12.7 8.9 7.0 6.2 5.4 4.8 4.4 4.0 3.8 3.5 3.3 3.2 2.9 2.8 2.6 2.0266 12.6 8.8 7.0 6.0 5.3 4.8 4.4 4.0 3.7 3.4 3.2 3.0 2.8 2.7 2.5 1.9667 12.6 8.7 7.0 5.9 5.2 4.6 4.3 3.9 3.6 3.3 3.2 2.9 2.8 2.7 2.5 1.8768 12.3 8.6 7.0 5.8 5.2 4.6 4.2 3.8 3.7 3.4 3.1 2.9 2.7 2.6 2.4 1.8269 12.1 8.4 6.9 5.9 5.1 4.5 4.2 3.8 3.6 3.3 3.1 2.8 2.7 2.5 2.4 1.7870 12.1 8.5 6.7 5.7 5.0 4.5 4.1 3.7 3.5 3.3 3.0 2.8 2.6 2.5 2.3 1.6771 12.0 8.4 6.7 5.8 5.1 4.4 4.1 3.7 3.4 3.1 2.9 2.8 2.6 2.5 2.2 1.5972 11.9 8.3 6.6 5.6 5.0 4.4 4.0 3.6 3.4 3.2 2.9 2.7 2.5 2.4 2.2 1.5373 11.7 8.3 6.5 5.6 4.9 4.4 3.9 3.6 3.3 3.1 2.9 2.6 2.5 2.3 2.1 1.4574 11.7 8.4 6.7 5.6 4.9 4.3 3.9 3.7 3.3 3.1 2.8 2.6 2.4 2.3 2.1 1.3775 11.9 8.0 6.5 5.5 4.9 4.3 3.9 3.6 3.2 2.9 2.7 2.5 2.3 2.2 2.0 1.3176 11.8 8.1 6.4 5.4 4.8 4.2 3.8 3.4 3.1 2.9 2.7 2.5 2.3 2.1 1.9 1.2477 11.5 7.9 6.3 5.5 4.7 4.2 3.8 3.4 3.1 2.9 2.7 2.4 2.3 2.1 1.9 1.1478 11.6 8.0 6.3 5.3 4.7 4.1 3.7 3.4 3.1 2.7 2.6 2.4 2.2 2.0 1.8 1.0679 11.4 8.0 6.3 5.3 4.6 4.0 3.7 3.3 3.0 2.8 2.5 2.3 2.1 2.0 1.8 0.9480 11.4 7.8 6.1 5.2 4.6 4.1 3.6 3.3 3.0 2.7 2.5 2.2 2.1 1.9 1.7 0.8481 11.2 7.7 6.1 5.2 4.5 4.0 3.6 3.2 2.9 2.7 2.4 2.2 2.0 1.8 1.7 0.7182 11.0 7.7 6.1 5.0 4.5 3.9 3.5 3.1 2.8 2.7 2.4 2.2 1.9 1.8 1.6 0.5883 10.8 7.6 6.0 5.2 4.4 3.9 3.5 3.1 2.8 2.6 2.3 2.1 1.9 1.7 1.5 0.3984 10.9 7.6 5.9 5.0 4.3 3.8 3.4 3.1 2.8 2.5 2.3 2.1 1.8 1.6 1.5 0.00
1 Colors match the color scheme in Figure 8, representing a range of 10 lb for each color.

315
Finishing Nutrition and Management
1
141312111098765432
15Pigs
Pens
4137
2925
2117
139
51
50.0
60.0
70.0
80.0
10.0
20.0
30.0
40.0
70.0 - 80.0
60.0 - 70.0
50.0 - 60.0
40.0 - 50.0
30.0 - 40.0
20.0 - 30.0
10.0 - 20.0
0.0 - 10.0
Range
45
33
Figure 9. For dataset C, individual pig weights were collected on a total of 950 pigs weighed (actual population weight = 209.6 lb and CV = 9.26%) with 16 to 23 pigs per pen. The dataset was analyzed by estimating the overall mean using different sampling meth-ods. These methods explored different numbers of pigs selected within pens, and total number of pens sampled. This was completed 10,000 times for each sampling method and the range or difference between the upper and lower confidence interval was calculated. Each point on this graph shows the range between the upper and lower confidence inter-val, represented in pounds.

316
Fin
ish
ing
Nu
tr
itio
n a
nd
Ma
na
ge
me
nt
Table 4. The range between the upper and lower confidence interval for varying pigs and pen as presented in Figure 9 (dataset C)1 Number of pigs from each pen
Pens, n 1 2 3 4 5 6 7 8 9 10 11 12 13 14 15 Entire pen1 78.0 54.0 43.3 37.3 33.0 29.8 27.3 25.6 23.9 22.4 21.2 20.1 18.8 18.1 17.4 14.12 53.5 37.8 30.3 26.4 22.6 20.8 19.4 17.5 16.5 15.7 14.8 13.8 13.2 12.5 12.0 9.73 44.3 30.7 24.6 21.3 18.9 17.1 15.5 14.3 13.4 12.6 11.7 11.2 10.6 10.0 9.6 7.74 38.3 26.6 21.4 18.1 16.3 14.9 13.2 12.4 11.7 10.9 10.2 9.7 9.0 8.7 8.2 6.75 33.8 23.8 19.1 16.5 14.8 13.1 11.8 11.3 10.1 9.6 9.1 8.7 8.2 7.7 7.3 6.06 31.0 21.8 17.8 15.0 13.3 12.1 11.0 10.1 9.1 8.9 8.2 7.7 7.4 7.0 6.7 5.37 28.6 19.8 16.3 13.9 12.4 10.9 10.2 9.4 8.6 8.1 7.6 7.2 6.8 6.3 6.1 4.98 26.9 18.9 15.0 13.0 11.5 10.3 9.3 8.8 8.0 7.5 7.1 6.6 6.3 6.0 5.7 4.59 25.4 17.6 14.3 12.1 10.9 9.7 8.8 8.1 7.6 7.1 6.6 6.1 5.9 5.5 5.3 4.2
10 24.1 16.9 13.5 11.6 10.1 9.1 8.4 7.6 7.2 6.6 6.1 6.0 5.6 5.3 5.0 3.911 23.0 16.2 12.8 11.0 9.6 8.8 7.9 7.3 6.8 6.4 5.9 5.6 5.2 5.0 4.7 3.712 21.9 15.3 12.1 10.4 9.2 8.3 7.5 6.9 6.4 6.0 5.6 5.3 5.0 4.8 4.5 3.513 21.0 14.7 11.8 9.9 8.9 8.0 7.3 6.6 6.3 5.7 5.5 5.1 4.8 4.4 4.2 3.314 20.4 14.2 11.3 9.6 8.5 7.7 7.0 6.4 5.9 5.5 5.1 5.0 4.5 4.3 4.1 3.115 19.3 13.3 10.9 9.4 8.1 7.4 6.6 6.2 5.8 5.4 4.9 4.7 4.3 4.1 3.9 2.916 18.8 13.2 10.6 9.0 7.9 7.2 6.5 6.0 5.6 5.1 4.8 4.5 4.1 4.0 3.8 2.917 18.4 12.6 10.2 8.7 7.6 6.9 6.3 5.8 5.3 4.9 4.6 4.3 4.0 3.8 3.6 2.718 17.8 12.6 10.1 8.6 7.3 6.8 6.1 5.5 5.1 4.8 4.5 4.3 3.9 3.7 3.4 2.619 17.3 12.2 9.7 8.3 7.1 6.5 5.9 5.4 4.9 4.6 4.3 4.1 3.8 3.5 3.3 2.520 16.8 11.8 9.5 8.0 7.1 6.4 5.7 5.3 4.8 4.5 4.1 3.8 3.7 3.4 3.2 2.321 16.6 11.5 9.3 7.9 6.9 6.0 5.5 5.0 4.7 4.4 4.1 3.8 3.5 3.3 3.1 2.322 16.0 11.1 9.0 7.7 6.6 6.0 5.5 5.0 4.6 4.2 3.9 3.7 3.4 3.2 3.0 2.223 15.4 10.9 8.8 7.4 6.5 5.9 5.3 4.9 4.4 4.1 3.8 3.6 3.3 3.1 2.9 2.124 15.3 10.8 8.7 7.3 6.4 5.7 5.2 4.8 4.4 4.0 3.7 3.5 3.3 3.0 2.8 2.025 15.1 10.4 8.3 7.1 6.3 5.6 5.0 4.6 4.3 3.9 3.6 3.3 3.1 2.9 2.7 1.926 14.8 10.3 8.2 7.0 6.1 5.4 5.0 4.5 4.1 3.7 3.5 3.3 3.1 2.9 2.7 1.827 14.8 10.1 8.1 6.9 5.9 5.3 4.8 4.3 4.0 3.7 3.4 3.2 3.0 2.8 2.6 1.828 14.1 9.9 7.8 6.7 5.9 5.1 4.7 4.4 3.9 3.6 3.4 3.2 2.9 2.7 2.5 1.7
continued

317
Fin
ish
ing
Nu
tr
itio
n a
nd
Ma
na
ge
me
nt
Table 4. The range between the upper and lower confidence interval for varying pigs and pen as presented in Figure 9 (dataset C)1 Number of pigs from each pen
Pens, n 1 2 3 4 5 6 7 8 9 10 11 12 13 14 15 Entire pen29 14.0 9.7 7.7 6.5 5.8 5.1 4.7 4.3 3.9 3.5 3.3 3.1 2.8 2.6 2.4 1.630 13.6 9.6 7.5 6.5 5.6 5.0 4.5 4.2 3.8 3.5 3.2 3.0 2.7 2.5 2.3 1.631 13.5 9.2 7.4 6.4 5.6 4.9 4.4 4.1 3.7 3.4 3.1 2.9 2.6 2.5 2.3 1.532 13.3 9.2 7.4 6.3 5.5 4.9 4.4 4.0 3.6 3.3 3.1 2.9 2.6 2.4 2.2 1.433 13.1 8.9 7.3 6.2 5.4 4.7 4.2 3.9 3.6 3.2 3.0 2.8 2.6 2.3 2.2 1.434 12.9 8.9 7.2 6.0 5.4 4.6 4.2 3.8 3.5 3.2 2.9 2.7 2.5 2.3 2.1 1.335 12.6 8.9 7.0 5.8 5.3 4.5 4.1 3.7 3.4 3.1 2.8 2.6 2.4 2.2 2.0 1.236 12.8 8.5 6.9 5.8 5.1 4.6 4.1 3.7 3.4 3.1 2.8 2.6 2.4 2.2 2.0 1.137 12.6 8.6 6.8 5.8 4.9 4.4 4.1 3.6 3.3 3.0 2.8 2.5 2.3 2.1 2.0 1.138 12.1 8.3 6.8 5.6 4.9 4.4 3.9 3.6 3.3 2.9 2.7 2.5 2.3 2.0 1.9 1.039 11.9 8.2 6.6 5.6 4.9 4.3 3.8 3.5 3.2 2.9 2.6 2.4 2.2 2.0 1.8 1.040 11.8 8.2 6.5 5.5 4.8 4.2 3.8 3.4 3.2 2.8 2.6 2.4 2.2 2.0 1.7 0.941 11.4 8.0 6.4 5.5 4.7 4.2 3.8 3.4 3.1 2.8 2.5 2.3 2.1 1.9 1.7 0.842 11.6 7.9 6.4 5.4 4.7 4.1 3.7 3.3 3.0 2.8 2.5 2.2 2.1 1.9 1.7 0.843 11.5 7.8 6.2 5.3 4.6 4.0 3.6 3.3 3.0 2.7 2.5 2.2 2.0 1.8 1.6 0.744 11.5 7.8 6.1 5.2 4.5 4.0 3.6 3.2 2.9 2.6 2.4 2.2 2.0 1.8 1.6 0.645 11.2 7.6 6.2 5.2 4.5 4.0 3.5 3.2 2.8 2.6 2.3 2.1 1.9 1.8 1.5 0.546 11.1 7.6 6.0 5.1 4.3 3.9 3.5 3.1 2.8 2.6 2.3 2.1 1.9 1.7 1.5 0.447 11.1 7.5 6.0 5.0 4.4 3.9 3.4 3.1 2.7 2.5 2.3 2.0 1.8 1.6 1.4 0.348 11.0 7.4 5.9 4.9 4.4 3.7 3.4 3.0 2.7 2.4 2.2 2.0 1.8 1.6 1.4 0.0
1 Colors match the color scheme in Figure 9, representing a range of 10 lb for each color.

318
Finishing Nutrition and Management
Table 5. The resulting mean, upper confidence interval (CI), lower CI, and range when sampling a varying number of pigs and pens to give a total sample size of 30 pigs
Sampling methodMean of
10,000 simulations Upper CI Lower CI RangeDataset A1
15 pigs from 2 pens 253.2 268.6 236.6 32.010 pigs from 3 pens 253.1 267.1 238.4 28.86 pigs from 5 pens 253.1 266.0 239.4 26.65 pigs from 6 pens 253.0 265.6 239.7 26.03 pigs from 10 pens 253.1 265.2 240.7 24.62 pigs from 15 pens 253.1 264.7 241.2 23.51 pig from 30 pens 253.0 264.3 241.2 23.1
Dataset B2
15 pigs from 2 pens 275.3 288.3 263.1 25.210 pigs from 3 pens 275.4 287.7 263.9 23.86 pigs from 5 pens 275.3 286.2 264.6 21.65 pigs from 6 pens 275.4 285.9 264.7 21.23 pigs from 10 pens 275.3 285.2 265.5 19.72 pigs from 15 pens 275.3 285.1 265.5 19.61 pig from 30 pens 275.4 284.9 265.7 19.2
Dataset C3
15 pigs from 2 pens 209.5 215.9 203.9 12.010 pigs from 3 pens 209.6 215.9 203.4 12.66 pigs from 5 pens 209.6 216.1 203.0 13.15 pigs from 6 pens 209.6 216.3 203.0 13.33 pigs from 10 pens 209.5 216.2 202.7 13.52 pigs from 15 pens 209.6 216.2 202.9 13.31 pig from 30 pens 209.6 216.4 202.8 13.6
1 A total of 1,260 pigs (mean = 253.0 lb, median = 254 lb, standard deviation = 32.8 lb, and CV = 12.98%) with 23 to 28 pigs per pen and a total of 48 pens.2 A total of 1,696 pigs (mean = 275.0 lb, median = 277 lb, standard deviation = 27.1 lb, and CV = 9.84%) with 16 to 23 pigs per pen and a total of 84 pens.3 A total of 950 pigs (mean = 209.6 lb, median = 209 lb, standard deviation = 19.4 lb, and CV = 9.26%) with 19 to 21 pigs per pen and a total of 48 pens.

319
Finishing Nutrition and Management
Effects of Dietary L-Carnitine and DDGS on Growth, Carcass Characteristics, and Loin and Fat Quality of Growing-Finishing Pigs1
W. Ying, J. M. DeRouchey, M. D. Tokach, S. S. Dritz2, R. D. Goodband, T. A. Houser, and J. L. Nelssen
SummaryA total of 1,104 barrows and gilts (PIC 337 × 1050, initially 80 lb) were used in a 109-d study to evaluate the effects of dietary L-Carnitine and dried distillers grains with solubles (DDGS) on growth, carcass traits, and loin and fat quality. Pigs were blocked by weight and randomly assigned to 1 of 6 treatments with 7 replications per treatment. Treatments were arranged as a 2 × 3 factorial with main effects of added DDGS (0 or 30% in Phases 1, 2, and 3 and 20% in Phase 4) and L-Carnitine (0, 50, or 100 ppm). Dietary treatments were corn-soybean meal-based and fed in 4 phases. Overall (d 0 to 109), dietary L-Carnitine improved (P < 0.02) ADG, which resulted in greater (P < 0.02) final BW with the response tending to be linear (P < 0.07). For F/G, a DDGS × L-Carnitine interaction (quadratic, P < 0.01) was observed. This was the result of pigs fed 50 ppm L-Carnitine, with no DDGS having better F/G than pigs fed 0 or 100 ppm, but in diets containing DDGS, pigs fed 50 ppm L-Carnitine had worse F/G compared with those fed 0 or 100 ppm.
In carcass traits, pigs fed dietary L-Carnitine had greater (P < 0.02) HCW compared with those not fed dietary L-Carnitine. Also, increasing dietary L-Carnitine increased carcass weight (quadratic, P < 0.03), carcass yield (quadratic, P < 0.07), and backfat (quadratic, P < 0.04), with the maximum response observed from pigs fed 50 ppm dietary L-Carnitine. In loin quality, feeding dietary L-Carnitine increased (P < 0.04) purge loss compared with pigs fed no L-Carnitine, with the response being linear (P < 0.03). In jowl fat fatty acid profile, as expected, feeding dietary DDGS increased (P < 0.001) Linoleic acid, total polyunsaturated fatty acids (PUFA), the ratio of unsatu-rated fatty acids to saturated fatty acids, and iodine value (IV) compared with feeding no dietary DDGS; however, feeding L-Carnitine did not alter jowl fatty acid composi-tion.
Feeding dietary L-Carnitine improved ADG and carcass weight, with the maximal response observed at 50 ppm, but dietary L-Carnitine did not affect loin or fat quality.
Key words: carcass characteristics, DDGS, fatty acid, iodine value, L-Carnitine, loin
1 Appreciation is expressed to Lonza, Inc., Allendale, NJ, for their financial support of the project. The authors also thank New Horizon Farms for use of pigs and facilities and to Richard Brobjorg, Marty Heintz, and Scott Heidebrink for technical assistance.2 Department of Diagnostic Medicine/Pathobiology, College of Veterinary Medicine, Kansas State University.
320
Finishing Nutrition and Management
IntroductionThe primary role of carnitine in intermediary metabolism is tightly related to the β-oxidation of fatty acids. Previous research suggested that feeding dietary L-Carnitine affected metabolism, which stimulated fatty acid oxidation and the utilization of fat for energy (Owen et al., 20013). Although L-Carnitine had mixed effects on growth perfor-mance in previous studies, feeding dietary L-Carnitine during the growing-finishing phase resulted in increased longissimus muscle area and decreased backfat thickness of pigs (Owen et al., 19924). Similarly, Owen et al. (19945) suggested that feeding 50 ppm dietary L-Carnitine during the growing-finishing phase provided the optimum response for carcass composition characteristics.
Dried distillers grains with solubles (DDGS) is currently a common ingredient in swine diets; however, it can have negative effects on carcass quality because DDGS contains 10 to 11% fat, a high proportion of which is unsaturated fatty acids. Because L-Carni-tine is involved within the energy metabolism in the body, it is theorized that dietary L-Carnitine may increase the dietary energy utilization in DDGS diets fed to pigs and improve fat quality.
Therefore, the objective of this study was to investigate the effects of dietary L-Carni-tine and DDGS on growth performance, carcass characteristics, and fat and loin quality of finishing pigs.
ProceduresThe Kansas State University Institutional Animal Care and Use Committee approved the procedures used in this study.
The experiment was conducted in a commercial research finishing barn in southwestern Minnesota. The barn was double-curtain-sided and naturally ventilated. Each pen (10 ft by 18 ft) had completely slatted flooring over a deep pit for manure storage. Each pen was equipped with a 5-hole stainless steel, dry self-feeder and cup waterer for ad libitum access to feed and water. The barn had an automated feeding system (FeedPro; Feedlogic Corp., Willmar, MN) that was capable of delivering and measuring feed amounts added on an individual pen basis.
A total of 1,104 barrows and gilts (PIC 337 × 1050, initially 80 lb) were used in a 109-d study with 26 pigs per pen and 7 pens per treatment in a randomized design. Pigs were housed mixed gender within pen. Pens were ranked by average pig weight then allotted randomly to 1 of 6 dietary treatments. Dietary treatments were corn-soybean meal-based diets and were fed in 4 phases. Treatments were arranged as a 2 × 3 factorial with main effects of added DDGS (0 or 30% in Phases 1, 2, and 3 and 20% in Phase 4) and L-Carnitine (0, 50, or 100 ppm). All diets were fed in meal form and balanced to the same standardized ileal digestible (SID) lysine:ME ratio within each phase (Table 1).
3 Owen, K. Q., H. Jit, C. V. Maxwell, J. L. Nelssen, R. D. Goodband, M. D. Tokach, G. C. Tremblay and S. I. Koo. 2001. Dietary L-Carnitine suppresses mitochondrial branched-chain keto acid dehydrogenase activity and enhances protein accretion and carcass characteristics of swine. J. Anim. Sci. 79:3104-3112.4 Owen et al., Swine Day 1992, Report of Progress 667, pp. 122-126.5 Owen et al., Swine Day 1994, Report of Progress 717, pp. 165-168.

321
Finishing Nutrition and Management
Pigs from each pen were weighed as a group and feed disappearance was determined every 2 wk to determine ADG, ADFI, and F/G. On d 83 of the experiment, the 3 heaviest pigs from each pen (determined visually) were topped and sold in accor-dance with the farm’s normal marketing procedure. These pigs were not included in the carcass data presented. On d 97 of the experiment, 1 barrow and 1 gilt were randomly selected from each pen, tattooed according to gender and pen number for collection of jowl fat and whole loins, and shipped to Sioux-Preme Packing Co. (Sioux City, IA).
After slaughter, the whole boneless loins and approximately 0.5 lb of jowl were collected from the right side of each carcass. The whole loins were individually vacuum-packaged, and each jowl sample was packed in a Ziploc plastic bag. After packing, all loins and jowl samples were transported and stored at the K-State Meat Laboratory at 32 to 38°F.
On d 11 postmortem, loin quality (purge loss, drip loss, shear force, pH, color, and marbling) was evaluated. Purge loss was measured by weighing the whole loin in the packing bag, removing the loin and blotting it dry, and reweighing the loin and dried packing bag. Percentage purge loss was calculated as 100 × (initial loin weight – pack-ing bag weight – final loin weight) / (initial loin weight – packing bag weight). After measuring purge loss, several 1-in. center-cut chops were obtained from each loin. The pH was determined using pH Meter (Model HI9025, HANNA Instruments, Woon-socket, RI). Objective measures of chop color were determined using a HunterLab Miniscan XE Plus spectrophotometer (Model 45/0 LAV, 2.54-cm-diameter aperture, 10˚ standard observer, Illuminant D65, Hunter Associates Laboratory, Inc., Reston, VA) and reported as L* (lightness, black = 0 to white = 100), a* (redness, a larger value indicates a more red color), and b* (yellowness, a larger value indicates a more yellow color). Visual color and marbling were evaluated by using the National Pork Producers Council’s color and marbling standards (NPPC, 19996).
One chop from each loin was weighed and placed into a plastic bag and sealed imme-diately following fabrication. After storage at 32-38°F for 24 h, each chop was removed from the bag, blotted dry with paper towels, and reweighed to measure percentage drip loss.
Chops for Warner-Bratzler Shear Force (WBSF) were frozen (-40°F) on d 11 post-mortem. Chops were thawed at 32-36°F for about 24 h then cooked to 104°F, turned, and cooked to a final internal temperature of 158°F in a Blodgett oven (model number DFC-102; The G.S. Blodgett Co., Burlington, VT) preheated to 325°F. Chop tempera-tures were monitored with thermocouple wires (30-gauge copper and constantan; Omega Engineering, Stamford, CT) inserted into the approximate geometric center of each chop and attached to a Doric temperature recorder (model 205; Vas Engineering, San Francisco, CA). The chops were then covered with plastic wrap and refrigerated at 37-39°F for 24 h. Six round cores (0.5-in diameter) were obtained from each chop parallel to the long axis of the muscle fibers using a 0.5-in. corer (G-R Manufacturing Co., Manhattan, KS) attached to an electric drill (Craftsman 3/8-in. Electric Drill; Sears, Hoffman Estates, IL). Each core was sheared once perpendicular to the direction of the muscle fibers using a Warner-Bratzler V-shaped blunt blade (G-R Manufacturing Co.) attached to an Instron Universal Testing Machine (model 4201, Instron Corp.,
6 NPPC. 1999. Pork Quality Standards. National Pork Producers Council, Des Moines, IA.
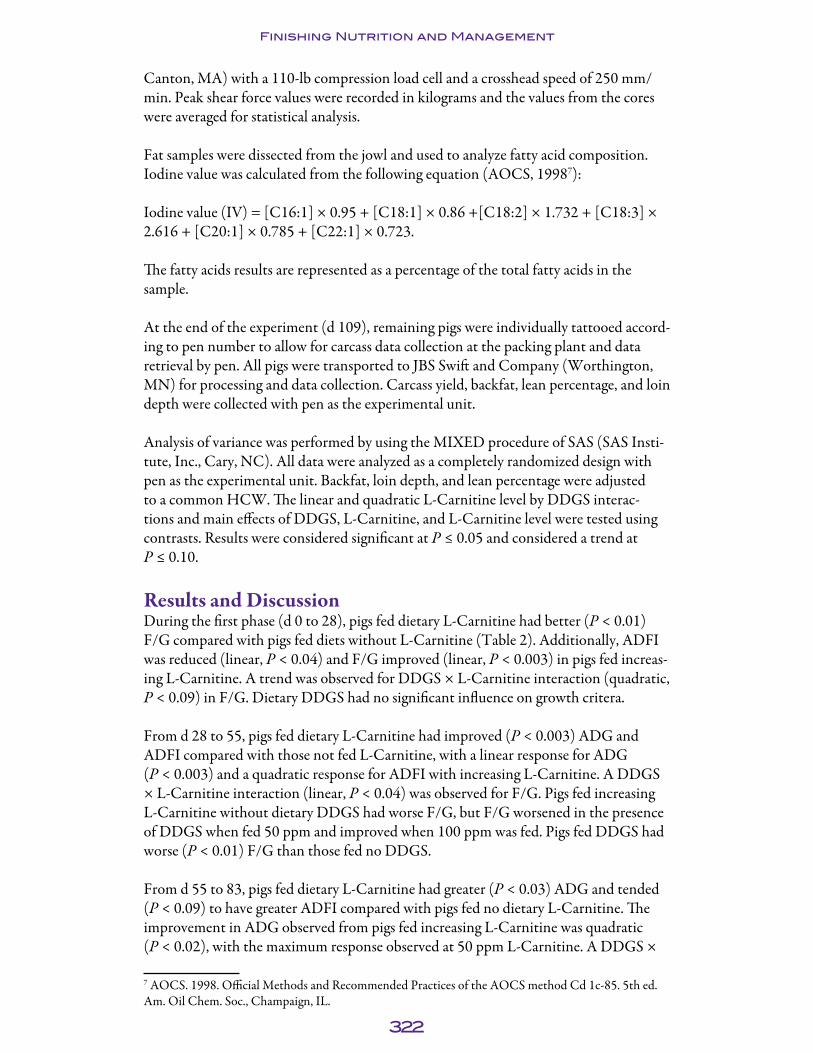
322
Finishing Nutrition and Management
Canton, MA) with a 110-lb compression load cell and a crosshead speed of 250 mm/min. Peak shear force values were recorded in kilograms and the values from the cores were averaged for statistical analysis.
Fat samples were dissected from the jowl and used to analyze fatty acid composition. Iodine value was calculated from the following equation (AOCS, 19987):
Iodine value (IV) = [C16:1] × 0.95 + [C18:1] × 0.86 +[C18:2] × 1.732 + [C18:3] × 2.616 + [C20:1] × 0.785 + [C22:1] × 0.723.
The fatty acids results are represented as a percentage of the total fatty acids in the sample.
At the end of the experiment (d 109), remaining pigs were individually tattooed accord-ing to pen number to allow for carcass data collection at the packing plant and data retrieval by pen. All pigs were transported to JBS Swift and Company (Worthington, MN) for processing and data collection. Carcass yield, backfat, lean percentage, and loin depth were collected with pen as the experimental unit.
Analysis of variance was performed by using the MIXED procedure of SAS (SAS Insti-tute, Inc., Cary, NC). All data were analyzed as a completely randomized design with pen as the experimental unit. Backfat, loin depth, and lean percentage were adjusted to a common HCW. The linear and quadratic L-Carnitine level by DDGS interac-tions and main effects of DDGS, L-Carnitine, and L-Carnitine level were tested using contrasts. Results were considered significant at P ≤ 0.05 and considered a trend at P ≤ 0.10.
Results and DiscussionDuring the first phase (d 0 to 28), pigs fed dietary L-Carnitine had better (P < 0.01) F/G compared with pigs fed diets without L-Carnitine (Table 2). Additionally, ADFI was reduced (linear, P < 0.04) and F/G improved (linear, P < 0.003) in pigs fed increas-ing L-Carnitine. A trend was observed for DDGS × L-Carnitine interaction (quadratic, P < 0.09) in F/G. Dietary DDGS had no significant influence on growth critera.
From d 28 to 55, pigs fed dietary L-Carnitine had improved (P < 0.003) ADG and ADFI compared with those not fed L-Carnitine, with a linear response for ADG (P < 0.003) and a quadratic response for ADFI with increasing L-Carnitine. A DDGS × L-Carnitine interaction (linear, P < 0.04) was observed for F/G. Pigs fed increasing L-Carnitine without dietary DDGS had worse F/G, but F/G worsened in the presence of DDGS when fed 50 ppm and improved when 100 ppm was fed. Pigs fed DDGS had worse (P < 0.01) F/G than those fed no DDGS.
From d 55 to 83, pigs fed dietary L-Carnitine had greater (P < 0.03) ADG and tended (P < 0.09) to have greater ADFI compared with pigs fed no dietary L-Carnitine. The improvement in ADG observed from pigs fed increasing L-Carnitine was quadratic (P < 0.02), with the maximum response observed at 50 ppm L-Carnitine. A DDGS ×
7 AOCS. 1998. Official Methods and Recommended Practices of the AOCS method Cd 1c-85. 5th ed. Am. Oil Chem. Soc., Champaign, IL.

323
Finishing Nutrition and Management
L-Carnitine interaction (quadratic, P < 0.02) was observed for F/G during this period. This was due to pigs fed 50 ppm dietary L-Carnitine having the best F/G in diets with no DDGS, but having the worst F/G in diets containing 30% DDGS.
In the last phase (d 83 to 109), there was a significant DDGS × L-Carnitine interaction for F/G (quadratic, P < 0.04) and a trend for ADG (quadratic, P < 0.07). These were the result of pigs fed 50 ppm L-Carnitine no-DDGS-added diets having better ADG and F/G than the other no-DDGS treatments; however, pigs fed 50 ppm L-Carnitine in diets containing DDGS had lower ADG and worse F/G compared with the other added-DDGS treatments. Pigs fed dietary DDGS tended (P < 0.06) to increase ADFI compared with no DDGS treatments. A trend (linear, P < 0.06) was observed for DDGS × L-Carnitine interaction in ADFI due to pigs fed increasing L-Carnitine in diets with DDGS having increased feed consumption; in contrast, ADFI did not change in diets without DDGS.
Overall (d 0 to 109), feeding dietary L-Carnitine improved (P < 0.02) ADG, which resulted in greater (P < 0.02) final BW with the responses tending to be linear, (P < 0.07). For F/G, a DDGS × L-Carnitine interaction (quadratic, P < 0.01) was observed. This was the result of pigs fed 50 ppm L-Carnitine with no dietary DDGS having better feed efficiency than pigs fed 0 or 100 ppm, but in diets containing DDGS pigs fed diets containing 50 ppm L-Carnitine had worse F/G compared with those fed 0 or 100 ppm. Finally, the inclusion of DDGS did not affect growth performance.
For carcass characteristics, no DDGS × L-Carnitine interactions were observed for any carcass traits (Table 3). Pigs fed dietary L-Carnitine had greater (P < 0.02) HCW compared with those not fed dietary L-carnitine. Also, increasing the dietary level of L-Carnitine increased carcass weight (quadratic, P < 0.03), and backfat (quadratic, P < 0.04) and tended to increase carcass yield (quadratic, P < 0.07), with the maximum response observed from pigs fed 50 ppm dietary L-carnitine. Pigs fed diets with DDGS tended (P < 0.09) to have less loin depth compared with pigs fed no dietary DDGS.
In loin quality, pigs fed dietary L-Carnitine had greater (P < 0.04) purge loss compared with pigs fed no L-Carnitine with the response being linear (P < 0.03; Table 4). There were DDGS × L-Carnitine interactions for WBSF (quadratic, P < 0.01) and visual color (linear, P < 0.03). Loins from pigs fed 50 ppm L-Carnitine with DDGS had a lower WBSF value compared with either 0 or 100 ppm with DDGS; however, loins from pigs fed no DDGS changed very little regardless of L-Carnitine level. Feeding dietary DDGS tended (P < 0.06) to decrease visual marbling score of loin compared with pigs fed no DDGS. A trend (quadratic, P < 0.09) for DDGS × L-Carnitine inter-action was observed for b* value (yellowness, a larger value indicates a more red color). Loins obtained from pigs fed 50 ppm L-Carnitine with no DDGS had the greatest b* value, but this same L-Carnitine level had the lowest b* value when fed with dietary DDGS.
For jowl fatty acid characteristics, compared with pigs fed no DDGS diets, feeding dietary DDGS increased (P < 0.001) the proportions of C18:2n-6, C18:3n-3, C20:2, C20:4n-6, total PUFA content, the ratio of unsaturated fatty acids to saturated fatty acids, and the calculated IV. In addition, pigs fed DDGS had decreased (P < 0.001) C14:0, C16:0, C16:1, C18:0, C18:1 cis-9, C18:1n-7, total monounsaturated fatty

324
Finishing Nutrition and Management
acids, and total saturated fatty acids compared with those not fed DDGS (Table 5). DDGS × L-Carnitine interactions occurred for proportions of C18:2n-6 (linear, P < 0.01) and C20:2 (linear, P < 0.04). The level of C18:2n-6 and C20:2 were decreased when addition of L-Carnitine in DDGS diets, compared with feeding dietary DDGS without L-carnitine. In addition, the proportion of C20:0 tended (linear, P < 0.07) to be increased when increasing inclusion of L-carnitine; however, iodine value and PUFA content of jowl fat were not affected by feeding dietary L-carnitine.
In conclusion, dietary DDGS did not affect the growth performance and, as expected, led to more unsaturation of jowl fat, which led to increased IV. Pigs fed 50 ppm dietary L-Carnitine had improved ADG and carcass weight, but added L-Carnitine did not improve the loin quality and fatty acid saturation. Thus, these data indicate that feeding 50 ppm L-Carnitine in diets for growing and finishing pigs will improve growth rate without altering loin and fat quality.

325
Finishing Nutrition and Management
Table 1. Diet composition (as-fed basis)1
Dried distillers grains with solubles (DDGS), %Phase 1 Phase 2 Phase 3 Phase 4
Item 0 30 0 30 0 30 0 20Ingredient, %
Corn 76.65 52.30 80.95 56.55 84.60 60.15 85.75 69.50Soybean meal(46.5% CP) 20.85 15.45 16.75 11.25 13.30 7.80 12.40 8.75DDGS -- 30.00 -- 30.00 -- 30.00 -- 20.00Monocalcium P (21% P) 0.55 -- 0.4 -- 0.33 -- 0.25 --Limestone 0.95 1.25 0.98 1.23 0.95 1.15 0.93 1.08Salt 0.35 0.35 0.35 0.35 0.35 0.35 0.35 0.35Vitamin-trace mineral premix 0.10 0.10 0.10 0.10 0.09 0.09 0.09 0.09L-Threonine 0.06 0.04 -- 0.03 -- -- --Biolys2 0.45 0.55 0.395 0.50 0.35 0.455 0.195 0.265Phytase3 0.01 0.005 0.01 0.003 0.01 0.002 0.01 0.0045L-Carnitine4 -- -- -- -- -- -- -- --
Total 100.0 100.0 100.0 100.0 100.0 100.0 100.0 100.0
Calculated analysisStandardized ileal digestible (SID) amino acids, %
Lysine 0.95 0.95 0.82 0.82 0.71 0.71 0.61 0.61 Isoleucine:lysine 62 69 64 71 65 74 73 80Methionine:lysine 28 33 29 36 30 39 34 41Met & Cys:lysine 55.8 67 59 73 61 80 70 84Threonine:lysine 61 63 61 66 63 70 66 75Tryptophan:lysine 17.0 17.0 17.0 17.0 17.0 17.0 19.0 19.0
Total lysine, % 1.06 1.11 0.92 0.97 0.80 0.86 0.70 0.73 ME, kcal/lb 1,519 1,524 1,521 1,525 1,523 1,527 1,525 1,527SID lysine:ME, g/Mcal 2.84 2.83 2.44 2.44 2.11 2.11 1.81 1.81CP, % 16.6 20.2 15.0 18.6 13.7 17.2 13.2 15.6Ca, % 0.56 0.56 0.53 0.53 0.49 0.49 0.47 0.47P, % 0.47 0.47 0.43 0.45 0.40 0.44 0.38 0.40Available P, % 0.28 0.28 0.25 0.25 0.23 0.23 0.21 0.211 Phase 1 diets were fed from 80 to 135 lb. Phase 2 diets were fed from 135 to 185 lb. Phase 3 diets were fed from 185 to 240 lb. Phase 4 diets were fed from 240 to 280 lb.2 Biolys contains 50.7% L-lys.3 OptiPhos 2000 (Enzyvia LLC, Sheridan, IN).4 Carniking 10 (Lonza, Inc., Allendale, NJ) replaced corn to provide 50 or 100 ppm L-Carnitine.

326
Fin
ish
ing
Nu
tr
itio
n a
nd
Ma
na
ge
me
nt
Table 2. Effect of dietary L-Carnitine and dried distillers grains with solubles (DDGS) on growth performance1
Probability, P <No DDGS × carnitine DDGS × carnitine DDGS × carnitine Main effects Carnitine
0 50 100 0 50 100 SEM Linear Quadratic DDGS Carnitine Linear Quadraticd 0 to 28
ADG, lb 1.99 2.02 2.02 1.98 2.00 1.94 0.03 0.25 0.72 0.22 0.72 0.84 0.28ADFI, lb 4.68 4.62 4.61 4.65 4.68 4.36 0.08 0.22 0.17 0.29 0.18 0.04 0.30F/G 2.36 2.29 2.29 2.34 2.34 2.24 0.03 0.61 0.09 0.90 0.01 0.003 0.78
d 28 to 55ADG, lb 1.82 1.88 1.90 1.76 1.86 1.88 0.03 0.64 0.70 0.31 0.003 0.003 0.33ADFI, lb 4.82 5.12 5.21 5.06 5.40 5.12 0.11 0.13 0.28 0.10 0.006 0.04 0.03F/G 2.66 2.73 2.73 2.88 2.91 2.72 0.05 0.04 0.42 0.01 0.98 0.43 0.16
d 55 to 83ADG, lb 1.69 1.82 1.76 1.78 1.84 1.79 0.04 0.48 0.47 0.12 0.03 0.25 0.02ADFI, lb 5.74 5.77 5.97 5.73 6.08 5.91 0.13 0.86 0.13 0.45 0.09 0.13 0.43F/G 3.42 3.17 3.40 3.23 3.31 3.29 0.07 0.54 0.02 0.40 0.63 0.72 0.12
d 83 to 109ADG, lb 1.65 1.77 1.71 1.76 1.71 1.77 0.05 0.65 0.07 0.32 0.40 0.43 0.74ADFI, lb 6.05 6.03 6.13 6.51 6.49 5.98 0.16 0.06 0.27 0.06 0.37 0.16 0.51FG 3.69 3.43 3.60 3.71 3.82 3.38 0.13 0.35 0.04 0.55 0.23 0.12 0.79
d 0 to 109ADG, lb 1.79 1.88 1.86 1.82 1.86 1.85 0.02 0.50 0.46 0.83 0.02 0.07 0.07ADFI, lb 5.28 5.34 5.44 5.43 5.61 5.30 0.09 0.12 0.10 0.20 0.38 0.86 0.15F/G 2.94 2.84 2.93 2.98 3.02 2.86 0.04 0.24 0.01 0.19 0.20 0.13 0.93
Final Wt, lb 268.5 277.2 274.9 272 275.8 275.6 2.7 0.62 0.46 0.68 0.02 0.07 0.121 A total of 1,104 barrows and gilts (PIC 337 × 1050, initial BW 80 lb) were used in a 109-d experiment with 27 pigs per pen and 7 pens per treatment.

32
7
Fin
ish
ing
Nu
tr
itio
n a
nd
Ma
na
ge
me
nt
Table 3. Effect of dietary L-Carnitine and dried distillers grains with solubles (DDGS) on carcass traits1
Probability, P <No DDGS × carnitine DDGS × carnitine DDGS × carnitine Main effects Carnitine
Item 0 50 100 0 50 100 SEM Linear Quadratic DDGS Carnitine Linear QuadraticLive wt, lb2 272.7 276.8 273.9 272.0 276.0 275.8 2.6 0.63 0.75 0.95 0.16 0.35 0.23HCW, lb 203.5 210.0 205.4 203.9 207.5 207.2 1.9 0.70 0.28 0.95 0.02 0.17 0.03Yield, %3 74.7 75.9 75.0 75.0 75.2 75.1 0.3 0.84 0.17 0.80 0.14 0.52 0.07Backfat, in.4 0.66 0.69 0.68 0.65 0.68 0.65 0.01 0.44 0.87 0.14 0.13 0.56 0.04Loin depth, in.4 2.50 2.52 2.50 2.45 2.44 2.45 0.04 0.94 0.74 0.09 0.98 0.92 0.91Lean, %4 56.3 55.9 56.0 56.3 55.9 56.3 0.2 0.48 0.79 0.76 0.20 0.56 0.111 A total of 775 pigs were used for obtaining carcass data.2 Live weight was obtained at packing plant.3 Percentage yield was calculated by dividing HCW by live weight obtained at the packing plant.4 Values were adjusted to a common carcass weight by using carcass weight as a covariate in the model.

328
Fin
ish
ing
Nu
tr
itio
n a
nd
Ma
na
ge
me
nt
Table 4. Effect of dietary L-Carnitine and dried distillers grains with solubles (DDGS) on loin qualityProbability, P <
No DDGS × carnitine DDGS × carnitine DDGS × carnitine Main effects CarnitineItem a,b 0 50 100 0 50 100 SEM Linear Quadratic DDGS Carnitine Linear QuadraticPurge loss, % 2.71 3.38 3.47 2.46 2.92 3.45 0.38 0.76 0.63 0.45 0.04 0.03 0.70Drip loss, % 1.08 1.24 1.36 1.33 0.95 1.35 0.16 0.41 0.14 0.90 0.89 0.34 0.17WBSF1, kg 3.16 3.33 3.34 3.55 2.90 3.52 0.16 0.53 0.01 0.74 0.57 0.64 0.05pH 5.57 5.57 5.53 5.58 5.59 5.57 0.02 0.57 0.82 0.17 0.54 0.25 0.43NPPC color score2 3.5 3.5 3.3 3.1 3.4 3.5 0.1 0.03 0.94 0.54 0.16 0.29 0.34NPPC marbling score3 1.9 2.1 1.8 1.7 1.8 1.6 0.2 0.91 0.73 0.06 0.87 0.65 0.27L* (lightness)4 53.6 55.1 54.3 54.5 55.3 55.2 0.6 0.97 0.51 0.21 0.10 0.28 0.14a* (redness)5 8.4 8.1 7.4 7.9 7.4 8.1 0.4 0.12 0.23 0.55 0.27 0.32 0.63b* (yellowness)6 15.5 15.9 14.9 15.7 15.4 15.8 0.3 0.31 0.09 0.51 0.67 0.38 0.49a Values represent the mean of 84 observations.b Above values are adjusted by using gender as a covariate in the model.1 Warner-Bratzler Shear Force.2 1 = pale pinkish gray to white, 2 = grayish pink, 3 = reddish pink, 4 = dark reddish pink, 5 = purplish red, 6 = dark purplish red (NPPC, 1999).3 Visual scale, which approximates the percentage of intramuscular fat content (NPPC, 1999).4 L* = measure of darkness to lightness (black = 0 to white = 100).5 a* = measure of redness (a larger value indicates a more red color).6 b* = measure of yellowness (a larger value indicates a more yellow color).

329
Fin
ish
ing
Nu
tr
itio
n a
nd
Ma
na
ge
me
nt
Table 5. Effect of dietary L-Carnitine and dried distillers grains with solubles (DDGS) on jowl fatty acid profileProbability, P <
No DDGS × carnitine DDGS × carnitine DDGS × carnitine Main effects CarnitineItema,b 0 50 100 0 50 100 SEM Linear Quadratic DDGS Carnitine Linear QuadraticMyristic acid (14:0), % 1.45 1.44 1.40 1.35 1.40 1.35 0.03 0.38 0.46 0.007 0.93 0.46 0.15Palmitic acid (16:0), % 22.70 22.56 22.21 20.65 21.23 20.95 0.22 0.07 0.39 <0.001 0.72 0.66 0.15Palmitoleic acid (16:1), % 3.29 3.36 3.10 2.76 2.80 2.81 0.15 0.41 0.55 <0.001 0.96 0.64 0.49Margaric acid (17:0), % 0.45 0.40 0.51 0.48 0.46 0.48 0.02 0.24 0.19 0.28 1.00 0.16 0.02Stearic acid (18:0), % 9.35 9.30 9.39 8.33 8.55 8.71 0.23 0.45 0.79 <0.001 0.44 0.34 0.91Oleic acid (18:1 cis-9), % 40.99 41.30 41.24 38.13 38.44 37.81 0.42 0.49 0.69 <0.001 0.70 0.93 0.36Vaccenic acid (18:1n-7), % 4.65 4.78 4.65 4.13 4.17 4.18 0.12 0.86 0.59 <0.001 0.61 0.84 0.51Linoleic acid (18:2n-6), % 12.57 13.97 14.41 18.58 16.34 16.62 0.83 0.03 0.24 <0.001 0.74 0.95 0.59α-Linoleic acid (18:3n-3), % 0.51 0.51 0.51 0.64 0.61 0.65 0.02 0.96 0.28 <0.001 0.68 0.74 0.17Arachidic acid (20:0), % 0.20 0.21 0.22 0.19 0.19 0.22 0.01 0.84 0.55 0.42 0.20 0.07 0.59Eicosadienoic acid (20:2), % 0.67 0.67 0.72 0.95 0.91 0.89 0.03 0.04 0.74 <0.001 0.50 0.68 0.52Arachidonic acid (20:4n-6), % 0.10 0.09 0.10 0.11 0.10 0.10 0.003 0.09 0.85 0.001 0.12 0.37 0.12Total SFA, %1 35.12 34.77 34.75 32.07 32.73 32.71 0.35 0.14 0.40 <0.001 0.62 0.69 0.77Total MUFA, %2 49.88 50.33 49.98 45.93 46.31 45.66 0.53 0.72 0.90 <0.001 0.71 0.87 0.31Total PUFA, %3 13.73 13.72 13.92 20.61 19.67 20.24 0.55 0.60 0.48 <0.001 0.54 0.87 0.35Total TFA, %4 0.34 0.32 0.36 0.39 0.34 0.40 0.01 0.69 0.28 0.02 0.43 0.45 0.01UFA:SFA ratio5 1.82 1.85 1.84 2.08 2.02 2.02 0.03 0.13 0.37 <0.001 0.52 0.52 0.87PUFA:SFA ratio6 0.39 0.40 0.40 0.65 0.60 0.62 0.02 0.35 0.39 <0.001 0.38 0.62 0.38Iodine value, g/100g7 66.50 66.85 66.89 74.66 73.33 73.95 0.64 0.38 0.29 <0.001 0.54 0.80 0.44a Values represent the mean of 84 observations.b Percentage of total fatty acid content. 1 Total saturated fatty acids = {[C8:0] + [C10:0] + [C12:0] + [C14:0] + [C16:0] + [C17:0] + [C18:0] + [C20:0] + [C22:0] + [C24:0]}, where the brackets indicate concentration.2 Total monounsaturated fatty acids = {[14:1] + [C16:1] + [C18:1c9] + [C18:1n7] + [C20:1] +[C24:1]}, where the brackets indicate concentration.3 Total polyunsaturated fatty acids = {[C18:2n-6] + [C18:3n-3] + [C18:3n-6] + [C20:2] + [C20:4n6]}, where the brackets indicate concentration.4 Total trans fatty acids = {[C18:1t] + [C18:2t] + [C18:3t]}, where the brackets indicate concentration.5 UFA:SFA ratio = [Total MUFA + Total PUFA]/Total SFA.6 PUFA:SFA = Total PUFA/Total SFA.7 Calculated as iodine value = [C16:1] × 0.95 + [C18:1] × 0.86 +[C18:2] × 1.732 + [C18:3] × 2.616 + [C20:1] × 0.785 + [C22:1] × 0.723, where the brackets indicate concentration.

330
Finishing Nutrition and Management
Effects of Dietary Astaxanthin and Ractopamine HCl on the Growth and Carcass Characteristics of Finishing Pigs and the Color Shelf-Life of Longissimus Chops from Barrows and Gilts1
J. R. Bergstrom, G. R. Skaar, J. L. Nelssen, T. A. Houser, M. D. Tokach, R. D. Goodband, J. M. DeRouchey, and S. S. Dritz2
SummaryA total of 160 pigs (initially 198 lb) were used to evaluate the effects of increasing dietary astaxanthin (AX, from Xanthophyllomyces dendrorhous yeast) and Ractopamine HCl (RAC) on the growth and carcass characteristics of finishing pigs as well as the color shelf-life of longissimus muscle (LM) chops from barrows and gilts. Pigs were weighed and randomly allotted to 1 of 8 dietary treatments fed for approximately 26 d preharvest. Dietary treatments consisted of a corn-soybean meal-based control diet, the control diet with 7.5, 15, 30, 60, or 120 ppm AX, and a corn-soybean meal-based diet with 10 ppm RAC and 7.5 or 20 ppm AX. Each treatment had 10 pens, with 2 pigs (1 barrow and 1 gilt) in each pen. A split-plot design with repeated measures was used to compare color characteristics of LM chops from individual barrows and gilts.
Overall, pigs fed RAC had increased (P < 0.01) ADG and final BW and improved F/G compared with pigs not fed RAC. Among pigs not fed RAC, F/G improved (quadratic, P < 0.05) and a trend (quadratic, P < 0.06) was observed for increased ADG with increasing AX to 60 ppm. For carcass characteristics, pigs fed RAC had greater (P < 0.03) HCW, 10th-rib LM area, 24-h LM pH, and fat-free lean index (FFLI) than those not fed RAC treatments. Among pigs not fed RAC, a trend (quadratic, P < 0.07) occurred for increased yield with increasing AX. During 6 d of retail display, the initial (d 0) NPPC color score of LM chops from gilts was greater (P < 0.03) than that of chops from barrows. Subjective discoloration scores of LM chops did not differ initially, but increased (linear, P < 0.01) daily and were greater (P < 0.02) on d 6 for chops from barrows and pigs not fed RAC than chops from gilts and pigs fed RAC, respectively (gender × d and treatment × d interactions, P < 0.04). The CIE a* (redness) and CIE b* (yellowness) of LM chops decreased (linear, P < 0.01) during retail display, and chops from gilts and pigs fed RAC had lower (P < 0.04) CIE b* than chops from barrows and pigs not fed RAC, respectively, especially on d 0 (gender × d and treatment × d interac-tion, P < 0.01). Overall (d 0 to 6), discoloration scores and changes in objective total color were lower (P < 0.02) for LM chops from gilts and pigs fed RAC. These observa-tions suggest that color shelf-life was extended for chops from gilts and pigs fed RAC.
Key words: astaxanthin, carcass characteristics, finishing pig, pork color, Ractopamine HCl
1 Appreciation is expressed to IGENE Biotechnology, Columbia, MD, for providing the Nāturxan astax-anthin and partial funding of the trial.2 Department of Diagnostic Medicine/Pathobiology, College of Veterinary Medicine, Kansas State University.

331
Finishing Nutrition and Management
IntroductionAstaxanthin is a carotenoid without potential for vitamin A activity in mammals that exists naturally in various plants, algae, and seafood. Its unique molecular structure as a xanthophyll may make it a potent antioxidant (Yuan et al., 20113). Although used primarily for the pigmentation of farmed salmonids, astaxanthin may also improve their growth, immunity, and survival (Christiansen et al., 19954). Research and interest in the potential benefits of astaxanthin for human health has increased, and environmentally friendly technologies can produce large quantities of natural astaxanthin.
Little information is available on the effects of dietary astaxanthin on pig performance and fresh pork color and quality. Yang et al. (20065) reported a linear reduction in 10th-rib backfat depth and increases in carcass yield and LM area with the addition of 1.5 and 3 ppm dietary astaxanthin for 14 d preharvest; however, they did not observe any differences in measures of fresh pork color or quality. Using higher levels of astaxanthin, other researchers have reported improved growth, carcass, and pork quality characteris-tics for pigs fed 48 ppm for 90 d preharvest (Kim et al., 20086) and improved pork color shelf-life for pigs fed 66.7 ppm for 42 d preharvest (Carr et al., 20107).
The effects of Ractopamine HCl and gender on the color shelf-life of fresh pork have not been clarified. Despite observing an increased polyunstaturated fatty acid:saturated fatty acid (PUFA:SFA) ratio and iodine value for backfat samples from pigs fed 10 mg/kg Ractopamine HCl, Apple et al. (20088) reported that the LM quality of these pigs may have been enhanced during 5 d of retail display. Additionally, studies that differen-tiate the color shelf-life characteristics of fresh pork from barrows and gilts are lacking.
Therefore, we conducted an experiment to determine the effects of feeding various levels of astaxanthin, either with or without Ractopamine HCl, on growth and carcass characteristics of finishing pigs and color shelf-life characteristics of LM chops from barrows and gilts during simulated retail display.
ProceduresThe Kansas State University Institutional Animal Care and Use Committee approved the protocol used in this experiment. The project was conducted at the K-State Swine Teaching and Research Farm. Pigs were housed in an environmentally controlled
3 Yuan, J., J. Peng, K. Yin, and J. Wang. 2011. Potential health-promoting effects of astaxanthin: a high-value carotenoid mostly from microalgae. Mol. Nutr. Food Res. 55:150-165.4 Christiansen, R., Ø. Lie, and O. J. Torrissen. 1995. Growth and survival of Atlantic salmon, Salmo salar L., fed different dietary levels of astaxanthin. First feeding fry. Aqua. Nutr. 1:189-198.5 Yang, Y. X., Y. J. Kim, Z. Jin, J. D. Lohakare, C. H. Kim, S. H. Ohh, S. H. Lee, J. Y. Choi, and B. J. Chae. 2006. Effects of dietary supplementation of astaxanthin on production performance, egg quality in layers and meat quality in finishing pigs. Asian-Aust. J. Anim. Sci. 19(7):1019-1025.6 Kim, K., J. Lim, M. Shin, Y. Choi, S. Lee, and S. Cho. 2008. Effect of dietary combined probiotics (Any-Lac) supplementation contained with Phaffia rhodozyma on the growth performance and meat quality of pigs. Kor. J. Anim. Sci. Technol. 50(5):657-666.7 Carr, C. C., D. D. Johnson, J. H. Brendemuhl, and J. M. Gonzalez. 2010. Fresh pork quality and shelf-life characteristics of meat from pigs supplemented with natural astaxanthin in the diet. Prof. Anim. Sci. 26:18-25.8 Apple, J. K., C. V. Maxwell, B. R. Kutz, L. K. Rakes, J. T. Sawyer, Z. B. Johnson, T. A. Armstrong, S. N. Carr, and P. D. Matzat. 2008. Interactive effect of Ractopamine and dietary fat source on pork quality characteristics of fresh pork chops during simulated retail display. J. Anim. Sci. 86:2711-2722.

332
Finishing Nutrition and Management
finishing building with pens over a totally slatted floor that provided approximately 10 ft2/pig. Each pen was equipped with a dry self-feeder and a nipple waterer to provide ad libitum access to feed and water. The facility was a mechanically ventilated room with a pull-plug manure storage pit.
A total of 80 barrows and 80 gilts (TR4 × C22, PIC, Hendersonville, TN) with an initial BW of 198 lb were used in this study. Pigs were weighed and allotted to 1 of 9 dietary treatments, with 1 barrow and gilt per pen and 10 pens for each of 8 dietary treatments. Dietary treatments consisted of a corn-soybean meal-based control diet formulated to 0.66% SID lysine; the control diet formulated to contain 7.5, 15, 30, 60, and 120 ppm astaxanthin from Xanthophyllomyces dendrorhous yeast (formerly Phaffia rhodozyma; Nāturxan, IGENE Biotechnology, Columbia, MD); and 2 diets formulated to contain 0.95% SID lysine and 10 ppm Ractopamine HCl with 7.5 and 20 ppm astax-anthin from Xanthophyllomyces dendrorhous yeast (Table 1). Experimental diets were fed in meal form, and astaxanthin and/or Ractopamine HCl were added to the control diet at the expense of corn to achieve the dietary treatments. The diets were formulated to meet or exceed the nutrient requirements for pigs of this genotype (NRC, 19989). Pigs and feeders were weighed weekly and approximately 18 h before harvest to deter-mine ADG, ADFI, F/G, and BW.
To ensure that the harvest procedures would occur in accordance with IACUC standards and the capabilities of the K-State University Meats Laboratory, 6 pigs per treatment on d 23, 7 pigs per treatment on d 28, and 7 pigs per treatment on d 30 were transported to the abattoir for humane slaughter. This resulted in a mean feeding duration of 26 d, with all pigs harvested approximately 27 d after the initiation of the experiment.
Immediately after evisceration, the heart, kidneys, liver, and spleen of every pig were weighed and inspected for abnormalities by a veterinarian from the Department of Diagnostic Medicine/Pathobiology in the College of Veterinary Medicine at K-State, and HCW was recorded. First-rib, 10th-rib, last-rib, and last-lumbar backfat depth, as well as the LM area and mean of 2 pH readings obtained at the 10th- and 11th-rib inter-face, were collected from the left side of each pig carcass 24 h postmortem. After obtain-ing carcass measurements, an 8-in. section of the LM caudal to the 10th- and 11th-rib interface was removed from the carcass of both pigs (1 barrow and 1 gilt) from each of 9 pens per treatment, vacuum-packaged, and refrigerated at 40ºF.
After 7 d of refrigerated storage, two 1-in.-thick boneless LM chops were fabricated from each LM section. One LM chop was placed on simulated retail display for 6 d as in Exp. 2. The second chop was vacuum-packaged and frozen at -20ºC immediately after fabrication. After 6 d of display, the chops were vacuum-packaged and frozen at -20ºC prior to shipping both chops from each carcass to an outside laboratory (IGENE Biotechnology, Columbia, MD) for the determination of astaxanthin concentration in the LM.
On d 0 to 6 of retail display, objective measures of lean color were determined daily from 2 locations of the lean surface of each sample package using a HunterLab Minis-
9 NRC. 1998. Nutrient Requirements of Swine. 10th ed. Natl. Acad. Press, Washington DC.
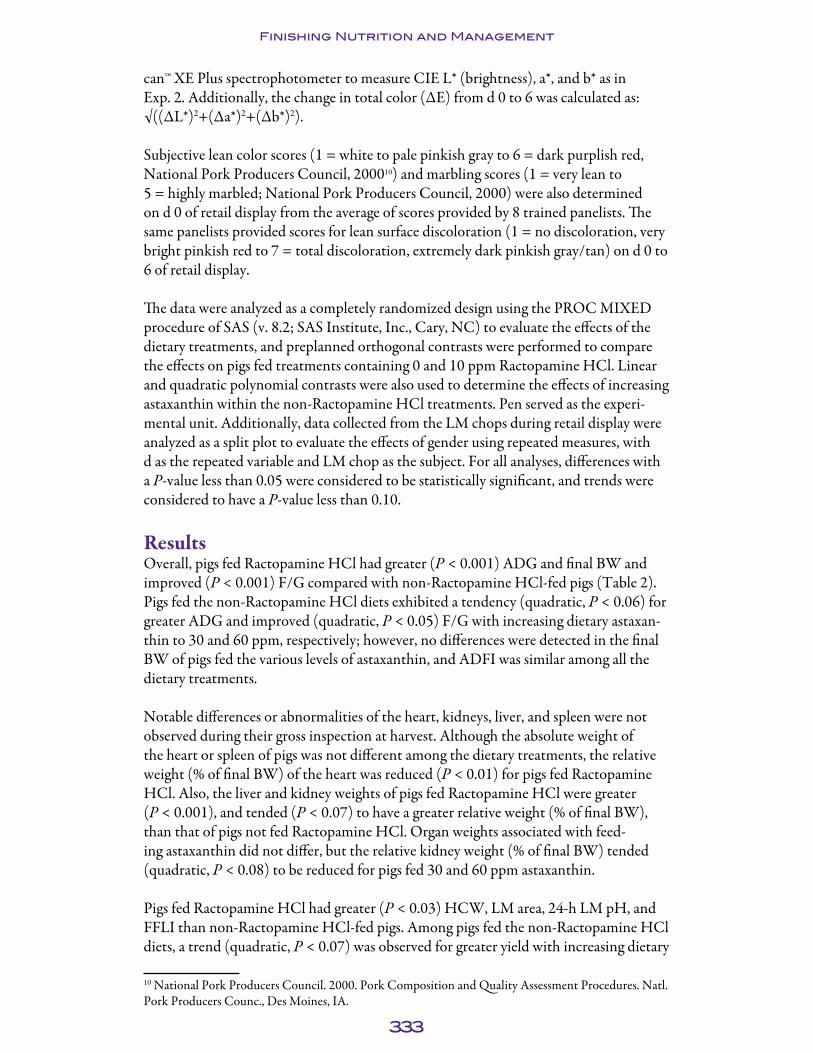
333
Finishing Nutrition and Management
can™ XE Plus spectrophotometer to measure CIE L* (brightness), a*, and b* as in Exp. 2. Additionally, the change in total color (∆E) from d 0 to 6 was calculated as: √((∆L*)2+(∆a*)2+(∆b*)2).
Subjective lean color scores (1 = white to pale pinkish gray to 6 = dark purplish red, National Pork Producers Council, 200010) and marbling scores (1 = very lean to 5 = highly marbled; National Pork Producers Council, 2000) were also determined on d 0 of retail display from the average of scores provided by 8 trained panelists. The same panelists provided scores for lean surface discoloration (1 = no discoloration, very bright pinkish red to 7 = total discoloration, extremely dark pinkish gray/tan) on d 0 to 6 of retail display.
The data were analyzed as a completely randomized design using the PROC MIXED procedure of SAS (v. 8.2; SAS Institute, Inc., Cary, NC) to evaluate the effects of the dietary treatments, and preplanned orthogonal contrasts were performed to compare the effects on pigs fed treatments containing 0 and 10 ppm Ractopamine HCl. Linear and quadratic polynomial contrasts were also used to determine the effects of increasing astaxanthin within the non-Ractopamine HCl treatments. Pen served as the experi-mental unit. Additionally, data collected from the LM chops during retail display were analyzed as a split plot to evaluate the effects of gender using repeated measures, with d as the repeated variable and LM chop as the subject. For all analyses, differences with a P-value less than 0.05 were considered to be statistically significant, and trends were considered to have a P-value less than 0.10.
ResultsOverall, pigs fed Ractopamine HCl had greater (P < 0.001) ADG and final BW and improved (P < 0.001) F/G compared with non-Ractopamine HCl-fed pigs (Table 2). Pigs fed the non-Ractopamine HCl diets exhibited a tendency (quadratic, P < 0.06) for greater ADG and improved (quadratic, P < 0.05) F/G with increasing dietary astaxan-thin to 30 and 60 ppm, respectively; however, no differences were detected in the final BW of pigs fed the various levels of astaxanthin, and ADFI was similar among all the dietary treatments.
Notable differences or abnormalities of the heart, kidneys, liver, and spleen were not observed during their gross inspection at harvest. Although the absolute weight of the heart or spleen of pigs was not different among the dietary treatments, the relative weight (% of final BW) of the heart was reduced (P < 0.01) for pigs fed Ractopamine HCl. Also, the liver and kidney weights of pigs fed Ractopamine HCl were greater (P < 0.001), and tended (P < 0.07) to have a greater relative weight (% of final BW), than that of pigs not fed Ractopamine HCl. Organ weights associated with feed-ing astaxanthin did not differ, but the relative kidney weight (% of final BW) tended (quadratic, P < 0.08) to be reduced for pigs fed 30 and 60 ppm astaxanthin.
Pigs fed Ractopamine HCl had greater (P < 0.03) HCW, LM area, 24-h LM pH, and FFLI than non-Ractopamine HCl-fed pigs. Among pigs fed the non-Ractopamine HCl diets, a trend (quadratic, P < 0.07) was observed for greater yield with increasing dietary
10 National Pork Producers Council. 2000. Pork Composition and Quality Assessment Procedures. Natl. Pork Producers Counc., Des Moines, IA.

334
Finishing Nutrition and Management
astaxanthin. Other carcass characteristics of pigs fed increasing dietary astaxanthin were not different from those fed the control diet.
No treatment × gender interactions were observed for any of the simulated retail display criteria, and negligible amounts of astaxanthin were detected in the assayed samples of LM chops. The initial subjective color scores were reduced (quadratic, P < 0.01) for LM chops from pigs fed increasing levels of astaxanthin in the diets without Ractopamine HCl (Table 3). Also, LM chops from gilts had a slightly greater (P < 0.03) initial color score than those from barrows, but no differences were observed in the initial color score of chops from pigs fed 0 and 10 ppm Ractopamine HCl. The marbling score was slightly greater (P < 0.05) for LM chops from pigs fed Ractopamine HCl, but no differences were observed between barrows and gilts or with increasing dietary astaxanthin. Discoloration scores of the LM chops increased (linear, P < 0.001) from d 0 to 6 of simulated retail display. Although the discoloration scores were not different among the dietary treatments or genders on d 0, the discoloration scores of LM chops from gilts were lower (d × gender, P < 0.001; barrow vs. gilt, P < 0.001) than those of barrows on d 4 to 6 of retail display and overall. Also, the discoloration scores of chops from pigs fed Ractopamine HCl were lower (d × treatment, P < 0.001; Racto-pamine HCl vs. non-Ractopamine HCl, P < 0.001) than those of pigs not fed Ractopa-mine HCl on d 3 to 6 and overall. No differences in discoloration scores were observed in LM chops from pigs fed increasing levels of astaxanthin without Ractopamine HCl.
When comparing the objective color measurements of LM chops, CIE L* increased (quadratic, P < 0.01) for chops from pigs fed increasing astaxanthin in diets with-out Ractopamine HCl throughout the simulated retail display (Table 4). No gender differences occurred in the CIE a* of LM chops, but the CIE a* of chops from pigs fed Ractopamine HCl decreased (P < 0.02) compared with chops from pigs fed non-Racto-pamine HCl diets. Although the CIE a* of chops from all pigs decreased (quadratic, P < 0.001) from d 0 to 6 of retail display, the change in CIE a* was greater (d × treat-ment and d × gender, P < 0.02) for chops from pigs fed non-Ractopamine HCl diets and barrows. The CIE b* of LM chops was lower (P < 0.04) for chops from pigs fed Ractopamine HCl and gilts, but these differences were greater (d × treatment and d × gender, P < 0.02) on d 0 of retail display than on d 6. No differences were detected in the CIE a* or CIE b* values of LM chops from pigs fed increasing astaxanthin with-out Ractopamine HCl. Overall, the differences and changes in the CIE L*, a*, and b* of LM chops from d 0 to 6 of simulated retail display resulted in differences in the change in total color (∆E, d 0 to 6). Chops from pigs fed Ractopamine HCl and gilts had a lower (P < 0.01) ∆E than pigs fed non-Ractopamine HCl diets and barrows, respec-tively.
DiscussionAlthough few studies have reported on the effects of feeding diets with added astax-anthin on the growth performance of finishing pigs, these results generally agree with observations from previous studies. Yang et al. (2006) reported no differences in the growth performance of finishing pigs fed 0, 1.5, and 3 ppm dietary astaxanthin during 14 d preharvest. More recently, Carr et al. (2010) indicated no differences in the growth performance of pigs fed 0 and 66.7 ppm of natural astaxanthin from Haemato-coccus pluvialis algae for 42 d preharvest. Kim et al. (2008) suggested feeding a probiotic

335
Finishing Nutrition and Management
mixture that provided 48 ppm of astaxanthin from Xanthophyllomyces dendrorhous yeast for 90 d improved the growth performance of finishing pigs. They observed similar improvements in ADG and F/G as those obtained for pigs fed 30 and 60 ppm astaxanthin from Xanthophyllomyces dendrorhous in the current experiment. Whether the improvements in F/G observed in these studies resulted from improved intestinal health, digestibility from the astaxanthin of Xanthophyllomyces dendrorhous yeast, or the yeast itself is not clear.
Pork producers, processors, and food companies are interested in technologies that will improve consumer acceptance of pork products. The appearance and color shelf-life of pork products are important criteria affecting both consumer and retailer preferences. The shelf-life of pork is most limited by the development of brown or gray discolor-ation during retail display, which generally occurs long before it has spoiled. A grow-ing number of consumers are also interested in minimally processed products that are enhanced “naturally.” Astaxanthin from Xanthophyllomyces dendrorhous yeast may qualify as a natural feed ingredient, and is currently used in diets for other food animals in other parts of the world.
As expected, the days of retail display affected subjective and objective measures of the lean color of LM chops. The subjective discoloration scores provided by the trained panel increased during 6 d of retail display. Although differences in the initial subjec-tive color scores were not large, the lean color of chops from gilts and pigs fed Racto-pamine HCl became discolored more slowly. This agreed with the reduction in the objective measure of total color change from d 0 to 6 for chops from gilts and pigs fed Ractopamine HCl. Changes in the objective measure of lean color during the 6 d of display involved reductions in the CIE a* and CIE b* measurements. The CIE a* and CIE b* measurements were also initially lower for chops from pigs fed Ractopamine HCl. Collectively, the reduced discoloration and change in total color observed for chops from gilts and pigs fed Ractopamine HCl suggest that their color shelf-life was improved.
In conclusion, although there were no differences in the color of fresh longissimus chops to indicate any consumer preferences initially, the color shelf-life was improved during retail display for chops from pigs fed Ractopamine HCl approximately 26 d preharvest. Also, LM chops from gilts had improved color shelf-life compared with chops from barrows. Although modest differences in the color of chops from pigs fed astaxanthin from Xanthophyllomyces dendrorhous yeast were observed, color shelf-life was not significantly influenced by the addition of dietary astaxanthin in this study.

336
Finishing Nutrition and Management
Table 1. Composition of the experimental diets1
Ingredient, % Control diet Ractopamine HCl dietCorn2 83.80 70.71Soybean meal (46.5% CP) 12.30 25.44Soybean oil 2.00 2.00Monocalcium P (21% P) 0.225 0.10Limestone 0.90 0.90Salt 0.35 0.35L-Lysine HCl 0.20 0.15L-Threonine 0.025 0.025Vitamin premix 0.10 0.10Trace mineral premix 0.10 0.10Ractopamine HCl, 20 g/kg2 --- 0.05Nāturxan (10,000 ppm astaxanthin)3 --- 0.075
Total 100.00 100.00
Calculated analysisStandardized ileal digestible (SID) amino acids, %
Lysine, % 0.66 0.95Isoleucine:lys, % 67 69Leucine:lysine, % 176 155Methionine:lysine, % 31 30Met & Cys:lysine, % 63 60Threonine:lysine, % 64 63Tryptophan:lysine, % 17 19Valine:lysine, % 80 78
Total lysine, % 0.74 1.07CP, % 13.0 18.0ME, kcal/lb 1,568 1,566SID lysine:ME, g/Mcal 1.91 2.75Ca, % 0.45 0.48P, % 0.37 0.40Available P, % 0.21 0.211 Experimental diets were fed for approximately 26 d before slaughter.2 Astaxanthin (Nāturxan, 10,000 ppm from Xanthophyllomyces dendrorhous, IGENE Biotechnology, Columbia, MD) replaced corn in the control diet to achieve dietary treatments with added astaxanthin (7.5, 15, 30, 60, and 120 ppm).3 Provided 10 ppm Ractopamine HCl in the complete diet (Paylean, Elanco Animal Health, Greenfield, IN).4 Additional astaxanthin (Nāturxan, 10,000 ppm from Xanthophyllomyces dendrorhous, IGENE Biotechnology, Columbia, MD) replaced corn in the Ractopamine HCl diet containing 7.5 ppm astaxanthin to achieve the dietary treatment with 20 ppm astaxanthin.

33
7
Fin
ish
ing
Nu
tr
itio
n a
nd
Ma
na
ge
me
nt
Table 2. Growth performance, selected organ weights, and carcass characteristics of finishing pigs fed various levels of astaxanthin with or without Ractopa-mine HCl1
P <
Ractopamine HCl, ppm2Astaxanthin within 0 ppm Ractopamine
HCl
Ractopamine HCl vs. non-Ractopamine
HCl0 10
Astaxanthin, ppm3: 0 7.5 15 30 60 120 7.5 20 SEM Linear QuadraticPreharvest growth performance, 26 d
ADG, lb 2.14 2.09 2.11 2.30 2.26 2.19 2.63 2.64 0.066 ---4 0.06 0.001ADFI, lb 6.21 6.23 6.14 6.38 6.21 6.22 6.45 6.15 0.174 --- --- ---F/G 2.91 3.00 2.94 2.78 2.75 2.85 2.47 2.34 0.065 --- 0.05 0.001Final BW, lb 255.3 254.3 254.6 259.7 258.6 256.5 267.8 268.4 2.71 --- --- 0.001
Postharvest organ weightsHeart, lb 0.95 0.91 0.92 0.95 0.93 0.92 0.92 0.92 0.020 --- --- ---Heart, % of BW 0.37 0.36 0.36 0.37 0.36 0.36 0.34 0.34 0.007 --- --- 0.01Kidney, lb 0.39 0.37 0.38 0.37 0.37 0.37 0.42 0.41 0.010 --- --- 0.001Kidney, % of BW 0.15 0.15 0.15 0.14 0.14 0.15 0.15 0.15 0.003 --- 0.08 0.06Liver, lb 3.62 3.59 3.64 3.76 3.70 3.67 3.91 4.00 0.083 --- --- 0.001Liver, % of BW 1.42 1.41 1.43 1.45 1.43 1.43 1.46 1.49 0.026 --- --- 0.07Spleen, lb 0.41 0.40 0.41 0.44 0.42 0.45 0.44 0.46 0.022 --- --- ---Spleen, % of BW 0.16 0.16 0.16 0.17 0.16 0.17 0.16 0.17 0.008 --- --- ---
Carcass characteristicsHCW, lb 183.5 183.7 186.2 189.1 186.7 186.3 195.0 195.7 2.12 --- --- 0.001Yield, % 71.9 72.3 73.1 72.8 72.2 72.6 72.8 72.9 0.36 --- 0.07 ---Avg. backfat depth, in. 0.88 0.93 0.90 0.88 0.90 0.92 0.87 0.87 0.029 --- --- ---10th-rib backfat depth, in. 0.76 0.80 0.79 0.74 0.78 0.82 0.73 0.72 0.039 --- --- ---10th-rib LM area, sq. in. 7.67 7.32 7.45 7.74 7.39 7.46 8.14 8.30 0.191 --- --- 0.00110th-rib LM pH, 24 h 5.50 5.49 5.47 5.50 5.49 5.52 5.57 5.53 0.015 --- --- 0.001FFLI5 54.7 53.9 54.0 54.8 54.0 53.6 55.4 55.7 0.66 --- --- 0.03
1 A total of 160 barrows and gilts (PIC, TR4 × C22, Hendersonville, TN; initially 198 lb) were used with 2 pigs per pen (1 barrow and gilt) and 10 pens per treatment to evaluate the effects of various levels of dietary astaxanthin with or without 10 ppm Ractopamine HCl.2 Paylean, Elanco Animal Health, Greenfield, IN.3 Nāturxan (astaxanthin from Xanthophyllomyces dendrorhous), IGENE Biotechnology, Columbia, MD.4 Not significant (P > 0.10).5 Fat-free lean index.
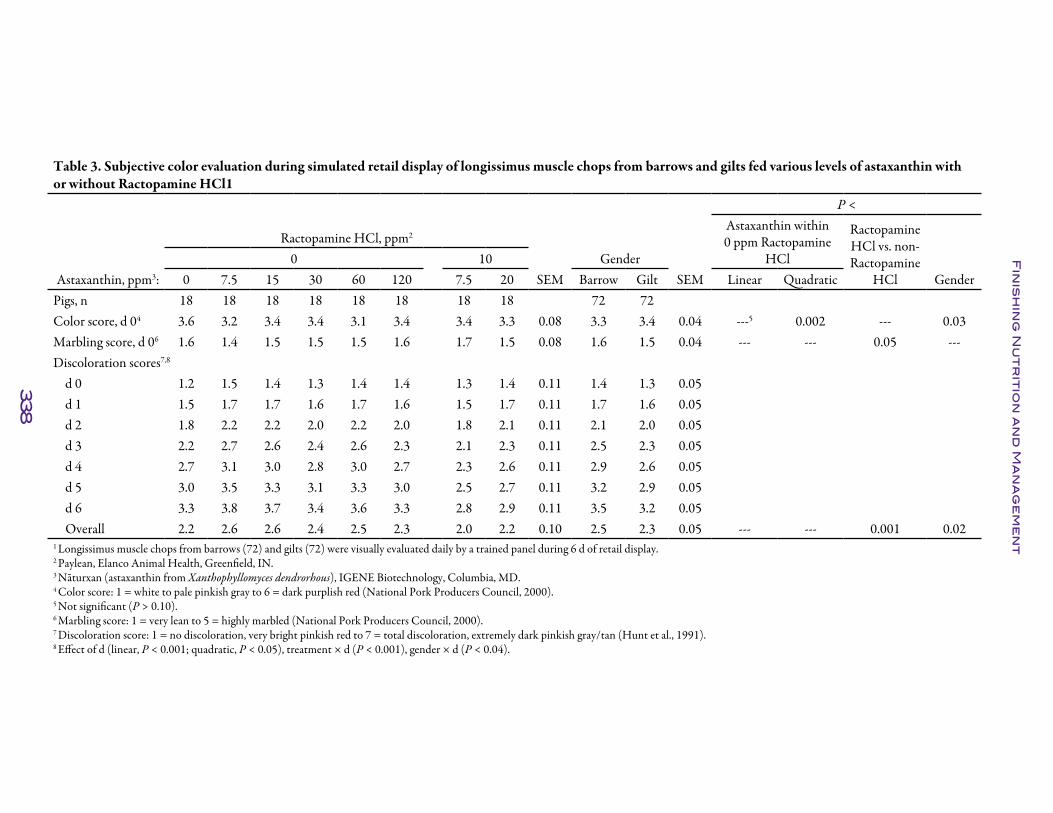
338
Fin
ish
ing
Nu
tr
itio
n a
nd
Ma
na
ge
me
nt
Table 3. Subjective color evaluation during simulated retail display of longissimus muscle chops from barrows and gilts fed various levels of astaxanthin with or without Ractopamine HCl1
P <
Ractopamine HCl, ppm2Astaxanthin within 0 ppm Ractopamine
HCl
Ractopamine HCl vs. non-Ractopamine
HCl0 10 Gender
Astaxanthin, ppm3: 0 7.5 15 30 60 120 7.5 20 SEM Barrow Gilt SEM Linear Quadratic GenderPigs, n 18 18 18 18 18 18 18 18 72 72Color score, d 04 3.6 3.2 3.4 3.4 3.1 3.4 3.4 3.3 0.08 3.3 3.4 0.04 ---5 0.002 --- 0.03Marbling score, d 06 1.6 1.4 1.5 1.5 1.5 1.6 1.7 1.5 0.08 1.6 1.5 0.04 --- --- 0.05 ---Discoloration scores7,8
d 0 1.2 1.5 1.4 1.3 1.4 1.4 1.3 1.4 0.11 1.4 1.3 0.05d 1 1.5 1.7 1.7 1.6 1.7 1.6 1.5 1.7 0.11 1.7 1.6 0.05d 2 1.8 2.2 2.2 2.0 2.2 2.0 1.8 2.1 0.11 2.1 2.0 0.05d 3 2.2 2.7 2.6 2.4 2.6 2.3 2.1 2.3 0.11 2.5 2.3 0.05d 4 2.7 3.1 3.0 2.8 3.0 2.7 2.3 2.6 0.11 2.9 2.6 0.05d 5 3.0 3.5 3.3 3.1 3.3 3.0 2.5 2.7 0.11 3.2 2.9 0.05d 6 3.3 3.8 3.7 3.4 3.6 3.3 2.8 2.9 0.11 3.5 3.2 0.05Overall 2.2 2.6 2.6 2.4 2.5 2.3 2.0 2.2 0.10 2.5 2.3 0.05 --- --- 0.001 0.02
1 Longissimus muscle chops from barrows (72) and gilts (72) were visually evaluated daily by a trained panel during 6 d of retail display.2 Paylean, Elanco Animal Health, Greenfield, IN.3 Nāturxan (astaxanthin from Xanthophyllomyces dendrorhous), IGENE Biotechnology, Columbia, MD.4 Color score: 1 = white to pale pinkish gray to 6 = dark purplish red (National Pork Producers Council, 2000).5 Not significant (P > 0.10).6 Marbling score: 1 = very lean to 5 = highly marbled (National Pork Producers Council, 2000).7 Discoloration score: 1 = no discoloration, very bright pinkish red to 7 = total discoloration, extremely dark pinkish gray/tan (Hunt et al., 1991).8 Effect of d (linear, P < 0.001; quadratic, P < 0.05), treatment × d (P < 0.001), gender × d (P < 0.04).

339
Fin
ish
ing
Nu
tr
itio
n a
nd
Ma
na
ge
me
nt
Table 4. Objective color measurements during simulated retail display of longissimus muscle chops from barrows and gilts fed various levels of astaxanthin with or without Ractopamine HCl1
P <
Ractopamine HCl, ppm2Astaxanthin within 0 ppm Ractopamine
HCl
Ractopamine HCl vs. non-Ractopamine
HCl0 10 Gender
Astaxanthin, ppm3: 0 7.5 15 30 60 120 7.5 20 SEM Barrow Gilt SEM Linear Quadratic GenderPigs, n 18 18 18 18 18 18 18 18 72 72CIE L*4,5
d 0 56.4 59.3 58.3 58.3 59.0 57.7 57.2 58.6 0.52 58.6 57.6 0.26d 1 56.4 59.2 58.6 58.5 59.1 58.0 57.4 58.8 0.52 58.7 57.8 0.26d 2 56.3 59.2 58.3 58.5 59.1 58.0 57.4 59.0 0.52 58.5 57.8 0.26d 3 56.8 59.5 58.7 58.6 59.3 58.2 57.5 59.0 0.52 58.8 58.1 0.26d 4 56.6 59.2 58.4 58.5 59.1 58.0 57.4 58.7 0.52 58.5 58.0 0.26d 5 56.7 59.3 58.4 58.5 59.2 57.9 57.5 58.6 0.52 58.5 58.0 0.26d 6 57.1 59.4 58.6 58.9 59.3 58.3 57.8 59.0 0.52 58.8 58.3 0.26Overall 56.6 59.3 58.5 58.5 59.2 58.0 57.5 58.8 0.51 58.6 58.0 0.25 ---6 0.01 --- 0.06
CIE a*7,8
d 0 10.9 10.6 10.7 10.4 10.4 10.6 9.3 9.0 0.25 10.4 10.1 0.13d 1 11.1 10.6 10.7 10.6 10.4 10.7 9.9 9.5 0.25 10.4 10.4 0.13d 2 10.6 9.9 10.0 10.0 9.8 10.2 9.7 9.2 0.25 9.9 10.0 0.13d 3 9.9 9.2 9.5 9.4 9.2 9.6 9.3 8.8 0.25 9.3 9.4 0.13d 4 9.5 8.7 8.9 8.9 8.7 9.0 9.1 8.5 0.25 8.8 9.0 0.13d 5 9.0 8.2 8.5 8.5 8.2 8.7 8.8 8.3 0.25 8.4 8.6 0.13d 6 8.5 7.7 8.0 8.0 7.8 8.2 8.6 7.8 0.25 7.9 8.2 0.13Overall 9.9 9.3 9.5 9.4 9.2 9.6 9.2 8.7 0.23 9.3 9.4 0.12 --- 0.10 0.02 ---
continued

340
Fin
ish
ing
Nu
tr
itio
n a
nd
Ma
na
ge
me
nt
Table 4. Objective color measurements during simulated retail display of longissimus muscle chops from barrows and gilts fed various levels of astaxanthin with or without Ractopamine HCl1
P <
Ractopamine HCl, ppm2Astaxanthin within 0 ppm Ractopamine
HCl
Ractopamine HCl vs. non-Ractopamine
HCl0 10 Gender
Astaxanthin, ppm3: 0 7.5 15 30 60 120 7.5 20 SEM Barrow Gilt SEM Linear Quadratic GenderCIE b*8,9
d 0 17.2 17.5 17.4 17.2 17.2 17.1 16.3 16.5 0.16 17.2 16.8 0.08d 1 17.2 17.5 17.4 17.1 17.1 17.0 16.5 16.7 0.16 17.2 17.0 0.08d 2 16.9 17.2 17.2 16.9 17.0 16.8 16.4 16.5 0.16 17.0 16.8 0.08d 3 16.6 17.0 16.9 16.7 16.8 16.6 16.3 16.3 0.16 16.8 16.5 0.08d 4 16.6 17.0 17.0 16.7 16.8 16.6 16.4 16.3 0.16 16.8 16.6 0.08d 5 16.5 17.0 16.9 16.6 16.6 16.6 16.3 16.4 0.16 16.7 16.5 0.08d 6 16.3 16.8 16.8 16.5 16.6 16.4 16.3 16.2 0.16 16.6 16.4 0.08Overall 16.8 17.1 17.1 16.8 16.9 16.7 16.4 16.4 0.15 16.9 16.6 0.07 --- --- 0.001 0.02
∆E, d 0 to 610 3.0 3.2 3.0 2.8 3.0 3.0 1.5 1.7 0.23 2.9 2.4 0.12 --- --- 0.001 0.011 Longissimus muscle chops from barrows (72) and gilts (72) were measured daily for objective lean color analysis (CIE L*, a*, and b*) during 6 d of simulated retail display using a HunterLab Miniscan XE Plus spectrophotometer (Model 45/0 LAV, 2.54-cm-diameter aperture, 10º standard observer, Illuminant D65, Hunter Associates Laboratory, Inc., Reston, VA).2 Paylean, Elanco Animal Health, Greenfield, IN.3 Nāturxan (astaxanthin from Xanthophyllomyces dendrorhous), IGENE Biotechnology, Columbia, MD.4 CIE L* = measure of darkness to lightness (black = 0 to white = 100).5 Effect of d (linear, P < 0.01).6 Not significant (P > 0.10).7 CIE a* = measure of redness (a larger value indicates a more red color).8 Effect of d (a* quadratic, P < 0.001; b* linear, P < 0.001), treatment × d (P < 0.02), gender × d (P < 0.01).9 CIE b* = measure of yellowness (a larger value indicates a more yellow color).10 ΔE = total color change, calculated as √((d 0 L*- d 6 L*)2 + (d 0 a* - d 6 a*)2 + (d 0 b* - d 6 b*)2) (Minolta, 1998).
341
Meat Quality
Effect of Sorghum Dried Distillers Grains with Solubles on Composition, Retail Stability, and Sensory Attributes of Ground Pork from Barrows and Gilts1
G. R. Skaar, T. A. Houser, K. M. Sotak, R. D. Goodband, B. L. Goehring, A. Stickel, B. M. Gerlach, and K. Steele
SummaryA total of 288 finishing pigs (PIC TR4 × 1050, initially 129.6 lb) were utilized as part of a 73-d feeding study to determine the effects of sorghum dried distillers grains with solubles (S-DDGS) in sorghum- or corn-based diets on ground pork quality. The dietary treatments included sorghum-based diets with 0, 15, 30, or 45% S-DDGS, a sorghum-based diet with 30% corn DDGS (C-DDGS), and a corn-based diet with 30% C-DDGS. Shoulders from 24 barrow and 24 gilt carcasses were ground, packaged, and evaluated for proximate and fatty acid composition, iodine value (IV), objective color and oxidation shelf-life, and sensory attributes. Finishing diet and gender did not interact to affect composition, fatty acid profile, color, or oxidative rancidity (P > 0.05). Pork from gilts contained less fat and more moisture (P < 0.001), was less saturated with a greater IV and total percentage of polyunsaturated fatty acids (P < 0.01), and was also darker (P < 0.001) and more red (P = 0.004) than pork from barrows. Gender did not affect (P > 0.05) total color change from 0 to 120 h, oxidative rancidity, or sensory attributes of ground pork. Finishing diet had no effect on total fat, moisture, or protein composition. Increasing S-DDGS resulted in a linear (P < 0.001) decrease in saturated and monounsaturated fatty acids (MUFA) and an increase (P < 0.01) in polyunsatu-rated fatty acids (PUFA) and pork IV. Pork from pigs fed 30% S-DDGS had a greater percentage of MUFA, a lower percentage of PUFA, and reduced IV compared with pork from pigs fed 30% C-DDGS. Diet did not affect oxidative rancidity (P = 0.37) or objective color CIE L* (brightness), a* (redness), or b* (yellowness) values (P ≥ 0.09), but was shown to influence total color change (P = 0.01), with pork from pigs fed sorghum grain and 30% S-DDGS showing less total change than all other dietary treat-ments. All pork products were characterized with similar sensory descriptors.
Overall, increasing S-DDGS during finishing resulted in ground pork with a more unsaturated fatty acid profile. Utilization of S-DDGS compared with an equal level of C-DDGS resulted in pork with a more saturated fatty acid profile and reduced IV; however, product differences were not carried through to alter oxidative rancidity or sensory attributes.
Key words: DDGS, gender, pork quality, sensory attributes, sorghum
IntroductionDried distillers grains with solubles, largely processed from corn (C-DDGS), have been a popular feed ingredient in swine diets in the past decade due to their increas-
1 The authors thank the United Sorghum Checkoff Program for partial financial support.
342
Meat Quality
ing availability and the opportunity for diet cost savings. The use of sorghum grains in ethanol has grown to include 30 to 35% of the domestically grown sorghum, making their role in livestock production of interest to those in plains states such as Kansas (USCP, 20112). In general, DDGS are fed at 20 to 30% of the diet because many studies have shown this level is not detrimental to growth performance, but feeding at these levels has been shown to hinder pork quality and result in a more unsaturated fatty acid profile and therefore increases in iodine value (IV), PUFA such as linoleic acid (C18:2), and total percentage PUFA. This leads to softer fat, fabrication difficul-ties, reduced bacon yields, unattractive products, and reduced shelf-life (NPPC, 20003). Although many diets fed are corn-soybean meal-based, Benz et al. (20114) found pigs fed sorghum-based diets to have a lower IV than pigs fed corn. Because sorghum grains are largely recognized as a replacement for corn in finishing diets that does not affect growth performance, they may offer an opportunity to assist in the control of pork fat quality issues and allow for the inclusion of DDGS at higher, more economically preferred levels. Additionally, the work detailing the influence of DDGS on consumer-evaluated quality issues such as color and sensory attributes is not extensively detailed. Therefore, the objective of this study was to determine the effects of increasing sorghum DDGS (S-DDGS) in sorghum- or corn-based diets on ground pork composition, fatty acid profile, and sensory attributes as well as retail display objective color and oxidative rancidity.
ProceduresThe Kansas State University Institutional Animal Care and Use Committee approved procedures used in this experiment. The K-State Institutional Review Board accepted sensory panel studies used in this experiment.
A total of 288 finishing pigs (PIC TR4 × 1050, initially 129.6 lb) were utilized as part of a 73-d feeding study to determine the effects of increasing S-DDGS in sorghum- or corn-based diets on finishing pig performance. Results of the growth performance portion of the trial can be found on page 182 of this report (see “The Effects of Sorghum Dried Distillers Grains with Solubles on Finishing Pig Growth Performance, Carcass Characteristics, and Fat Quality”). The dietary treatments included sorghum-based diets with S-DDGS included at 0, 15, 30, or 45%; a sorghum-based diet with 30% C-DDGS; and a corn-based diet with 30% C-DDGS. Our results report the effects of sorghum DDGS or corn DDGS on the resulting ground pork composition, sensory attributes, and retail display life.
At the conclusion of the feeding trial, the heaviest barrow and gilt were selected from each pen with 1 pig humanely harvested on each of 2 dates at the K-State Meat Labora-tory. Pigs were allocated to harvest dates so an equal number of barrows and gilts came from each diet.
2 USPC (United Sorghum Checkoff Program). 2011. Sorghum 101. Accessed June 3, 2011. http://www.sorghumcheckoff.com/sorghum-101.3 NPPC. 2000. Pork Composition & Quality Assessment Procedures. Natl. Pork Prod. Counc., Des Moines, IA.4 Benz, J. M., M. D. Tokach, S. S. Dritz, J. L. Nelssen, J. M. DeRouchey, R. C. Sulabo, and R. D. Good-band. 2011. Effects of increasing choice white grease in corn- and sorghum- based diets on growth perfor-mance, carcass characteristics, and fat quality characteristics of finishing pigs. J. Anim. Sci. 89:773-782.

343
Meat Quality
A total of 48 carcasses were used for production of ground pork to be utilized in all subsequent evaluations. Twenty-four pigs were randomly selected from each of the 2 harvest dates, so within a single harvest date a total of 4 pigs were from each diet (2 barrows and 2 gilts), with each pig sourced from a different original finishing pen.
Approximately 48 h postmortem, Institutional Meat Purchase Specifications (IMPS) No. 403 pork shoulders were separated from the right and left carcass halves, fabricated to remove bones, trimmed to an external average fat thickness of 0.25 in., and placed in storage (< 37°F). Approximately 72 h post mortem, shoulders were simultaneously trimmed of any noticeable blood splash then ground to a diameter of 0.5 in., mixed thoroughly by hand, and ground to a final diameter of 0.13 in. Final product grind temperature ranged from 40 to 43°F. Following the final grind, pH was recorded for each meat block before 7 1.0-lb packages were prepared for retail display; 2.0 lb of prod-uct was removed for sensory evaluation, vacuum-packaged, and stored (-20°F), and 1.0 lb was removed and submitted to the K-State Analytical Services Lab for compositional analysis.
For composition, approximately 0.5 lb of each sample was frozen in liquid nitrogen and pulverized. Duplicate samples were evaluated for moisture and crude fat (AOAC Official Method: PVM-1:2003 Meat), CP (AOAC Official Method: 990.03), and fatty acid profile (Sukhija and Palmquist, 19885). Fatty acid profile data are reported as a percentage of the total fatty acid content. Additionally, iodine value (IV) was calculated according to (AOCS, 19986) using: [C16:1] × 0.95 + [C18:1] × 0.86 + [C18:2] × 1.732 + [C18:3] × 2.616 + [C20:1] × 0.785 + [C22:1] × 0.72, where brackets indicate concentration.
Retail display packages were prepared by placing 1.0 lb of product on a stryrofoam tray with an absorbent pad and overwrapping with a polyvinyl chloride (PVC) film. Imme-diately after packaging, all products were removed from light and held below 40°F for no more than 1 h before display placement.
During display, 2 identical, open-top retail cases (Model DMF8, Tyler Refrigeration Corp., Niles, MI) were used. One case was equipped with fluorescent lighting (Sylva-nia/F032/835/Eco, 3500K; Osram-Sylvania, Danvers, MA) and the other with LED lighting (Energyled E1N5KLHC3-S4, 3500K; Altair Exchange Corp., Canoga Park, CA). Both sets of lights were of an equivalent color temperature (3,500 K) and were adjusted above the cases to emit a light intensity of 2,152 ± 108 lux. Case temperature during display ranged from 33 to 45°F.
From the 7 packages of ground pork retained from each pig, 1 was randomly allocated to be sampled at 0 h and not placed in retail display, with the other 6 randomly split between the 2 cases. Specifically, from the 3 samples within each case, 1 package was evaluated for objective color at 12 and 24 h, then removed; the second was evaluated at 36, 48, 60 and 72 h, then removed; and the third was evaluated at 84, 96, 108, and 120 h of display at which point it was removed. Remaining packages were rotated after each
5 Sukhija, P. S., and D. L. Palmquist. 1988. Rapid method for determination of total fatty acid content and composition of feedstuffs and feces. J. Agric. and Food Chem. 36:1202-1206.6 AOCS. 1998. Official Methods and Recommended Practices of the AOCS. 5th ed. Am. Oil Chem. Soc., Champaign, IL.

344
Meat Quality
evaluation. CIE L*, a*, and b* values from a spectral reflectance range of 400 to 700 nm were obtained using a HunterLab Miniscan EZ colorimeter (Model 4500L, 1.25-in.-diameter aperture, 10° standard observer, Illuminant A10, Hunter Associates Labora-tory, Inc., Reston, VA). Additionally, total color change from 0 to 120 h was calculated according to Minolta (19987) as follows: √[(ΔL*)2 + (Δa*)2 + (Δb*)2].
Oxidative rancidity was evaluated on all retail packages after frozen storage (-112°F) following the conclusion of the second display repetition. Thiobarbituric acid-reactive substances (TBARS) were performed as described by Buege and Aust (19788) and modified according to the American Meat Science Association (AMSA). Duplicate 0.02-oz samples were weighed and thoroughly mixed with 2.5 mL of thiobarbituric acid (TBA) stock solution containing 0.375% TBA, 15% trichloroacetic acid, and 0.25N hydrochloric acid. Samples, including a blank standard tube containing only 2.5 mL of TBA stock solution, were then boiled (212°F), cooled in tap water, and centrifuged at 5000 × g. Samples were then filtered and the supernatant absorbance was read at 532 nm (A532) against the blank solution with a spectrophotometer. TBARS values (mg malo-naldehyde (MDA)/kg of meat) were calculated using an extraction coefficient of 156,000 M-1 cm-1 (Sinhuber and Yu, 19589) as follows:
TBA(mg/kg) = sample A532
×1 M chromagen
×1 mol/L
×0.003 L
×72.07 g MDA
×1000 mg
×1000 g
156,000 M 0.5 g meat mole g kg
Sensory analysis utilized 6 to 8 trained panelists per session. Ground pork from each of the 24 pigs selected within a harvest date was randomly allocated to 1 of 4 panels such that 6 pigs were evaluated during a single session, 1 from each dietary treatment and 3 of each gender. After thawing, four 0.25-lb, 0.5-in.-thick ground pork patties (GPPs) were formed and simultaneously cooked to an internal temperature of 160°F. Cooked GPPs from a single pig were each cut into 6 equal pieces and held in individual double-boiler pans during sampling. Panelists were asked to evaluate each GPP sample on a numerical scale from 1 to 8 for the following attributes, scoring to the 0.5 increment: Pork aroma (1= extremely weak, 8 = extremely strong); off-aroma (1= none, 8 = abun-dant); pork flavor (1= extremely bland, 8 = extremely intense); juiciness (1= extremely dry, 8= extremely juicy); texture (1= extremely soft, 8 = extremely hard); off-flavor (1= none, 8 = abundant).
Data analyses were conducted utilizing the MIXED procedure of SAS (SAS Insti-tute Inc., Cary, NC). Color and oxidative rancidity data were analyzed as a random-ized complete block with a split-plot. Pig served as the whole-plot experimental unit, and package served as the split-plot experimental unit. Sensory data were analyzed as a randomized incomplete block with pig serving as the experimental unit. Data for pH, moisture, crude fat, CP, and percentage total fatty acid profile were analyzed as a randomized complete block with pig serving as the experimental unit. Main and
7 Minolta. 1998. Precise Color Communication: Color Control from Perception to Instrumentation. Minolta Corp., Ramsey, NJ.8 Buege, J. A., and Aust, S. D. 1978. Microsomal lipid peroxidation. Methods in Enzymology, 52, 306.9 Sinhuber, R. O., and Yu, T. C. 1958. 2-Thiobarbituric acid method for the measurement of rancidity in fishery products. II. The quantitative determination of malonaldehyde. Food Tech. 12(1):9-12.

345
Meat Quality
interactive effects for diet and gender were interpreted as significant when differences resulted in a P-value < 0.05.
Results and DiscussionNo diet × gender interactive effects were observed for ground pork percentage mois-ture, protein, or fat, fatty acid profile, or ultimate pH. Additionally, the inclusion and increase of S-DDGS in the diet had no effect (P > 0.05) on percentage fat, moisture, or protein (Table 1). Finishing diet was shown to significantly affect levels of several fatty acids (Table 2), calculated as a percentage of the total fatty acid content. Of those fatty acids found to be influenced by diet (P < 0.05), pork from pigs finished on both diets containing 30% C-DDGS, had equivalent (P > 0.05) levels of all fatty acids, ratios, and IV with the exception of myristic acid (C14:0), which was slightly higher (P < 0.05) in pork from the sorghum grain-based diet. This suggests that use of sorghum grain does not result in a fatty acid profile advantage compared with corn grain when finish-ing with an equal level of C-DDGS. Next, we compared diets containing S-DDGS vs. C-DDGS at 30%. In this case, ground pork from pigs fed with S-DDGS had a higher (P < 0.0001) percentage of oleic acid (C18:1n9c) and total percentage of MUFA, and a lower (P < 0.001) percentage of total C18:2, percentage PUFA, PUFA:saturated fatty acid (SFA) ratio, and a lower IV than pork from pigs finished with 30% corn DDGS. Linear trends (P < 0.05) in conjunction with an increasing percentage of S-DDGS from 0 to 45% were observed for many fatty acids, including % increases in linoleic (C18:2n6c), α-Linolenic acid (C18:3n3), eicosadienoic acid, (C20:2), total PUFA, and IV, as well as percentage decreases in palmitic acid (C16:0), palmitoleic acid (C16:1), oleic acid (C18:1n9c), vaccenic acid (C18:1n7), total SFAs, and total MUFA. Overall, increasing S-DDGS during finishing resulted in a more unsaturated fatty acid profile. Furthermore, utilization of S-DDGS compared with an equal amount of C-DDGS results in pork with a more desirable saturated fatty acid profile.
Gender also affected composition, with ground pork from barrows containing more fat and less moisture (P < 0.001) than product from gilts (Table 1). Barrows also contained a more saturated fatty acid profile compared with gilts; pork from barrows contained a higher (P ≤ 0.01) percentage of palmitic acid (C16:0), oleic acid (C18:1n9c), and total MUFA, as well as a lower (P ≤ 0.01) percentage of linoleic acid (C18:2n6c), total C18:2 fatty acids, α-Linolenic acid (C18:3n3), total PUFA, and IV (Table 3). In general, pork from barrows was more saturated than ground pork sourced from gilts. Pigs with a greater amount of fat deposition have been shown to have a reduced carcass fat IV (Bergstrom et al., 201010). Because barrows were fatter than gilts, as expected, these findings agree with the expectation that pork from barrows should be more satu-rated than product from gilts.
No 2- or 3-way interactive effects were observed between retail display hour, finishing diet, and gender regarding ground pork color or oxidation during 120 h of retail display. As expected, a linear (P < 0.0001) decrease occurred over time (Table 4) in ground pork L*, a*, and b*. Additionally, ground pork oxidation according to TBARS was dependent on h of storage, with the least oxidation observed at 24 h and the most at 120 h. Both finishing diet and gender were found to have no effect (P = 0.37 and 0.08, respectively) on overall ground pork oxidation (Table 5), suggesting that the use of sorghum grain
10 Bergstrom et al., Swine Day 2010, Report of Progress 1038, pp. 119-135.

346
Meat Quality
and the use of S-DDGS does not alter final product oxidation when compared with corn grain and C-DDGS. Although finishing diet did not influence CIE L*, a*, or b* values of ground pork, diet was found to influence (P = 0.01) total color change (ΔE), with pork from pigs fed sorghum grain and 30% S-DDGS having a more preferred, lower total color change over the period of retail display when compared with all other diets. Compared with corn grain and the use of C-DDGS, sorghum and S-DDGS does not alter retail color life. Additionally, gender of pigs did not affect ΔE from 1 to 120 h; however, pork from gilts was found to be darker (P < 0.001), more red (P = 0.004), and slightly less yellow.
In sensory attributes, diet was shown to interact with gender to affect (P = 0.01) only pork aroma (Table 6). Although significant, interactive pork aroma mean scores ranged only from 5.4 to 5.8, categorizing all products as having a similar, “slightly strong” pork aroma. Independently, gender had no effect on sensory attributes, whereas diet was found to influence only texture and off-aroma (P ≤ 0.05; Table 7). Ground pork patties from those pigs finished on 0, 15, 30, and 45% S-DDGS were described as “slightly soft” for texture, and GPPs from pigs finished on diets containing 30% C-DDGS were scored only slightly lower and categorized as “moderately soft.” Pork sourced from all finish-ing diets was evaluated as having no off-flavor, with GPPs from pigs fed 15 and 30% S-DDGS having the least off-flavor. Overall, although some small significant differences in sensory attributes were noted, the use of sorghum grain in addition to the inclusion of 0 to 45% S-DDGS when compared with corn grain or C-DDGS did not alter the flavor profile of ground pork patties. Product from all pigs was predominantly described as having a “slightly strong” pork aroma with no off-aroma, a “slightly intense” pork flavor with no off-flavor, and being “slightly” juicy with a “slightly soft” texture.
In summary, fatty acid profile differences were noted according to the inclusion and increase of S-DDGS in the swine finishing diet; however, these alterations did not carry through to affect final ground pork quality attributes concerning oxidative rancidity and trained panel sensory analysis. We conclude that sorghum grain and S-DDGS can be fed to result in high-quality ground pork.

34
7
Me
at
Qu
al
ity
Table 1. Effect of dietary grain and dried distillers grains with solubles (DDGS) source or gender on ground pork composition1
DietGrain source Sorghum Sorghum Sorghum Sorghum Sorghum Corn
DDGS source - Sorghum Sorghum Sorghum Corn Corn Gender P-valueDDGS level 0% 15% 30% 45% 30% 30% SE Barrow Gilt SE Diet Gender
ItemMoisture, % 62.2 63.4 62.1 63.9 61.5 62.6 0.94 60.7 64.6 0.69 0.27 < 0.001CP, % 18.6 18.8 18.0 18.8 18.3 18.1 0.28 18.1 18.8 0.16 0.18 < 0.01Crude fat, % 17.9 16.8 18.8 16.1 19.2 18.0 1.15 20.3 15.3 0.81 0.25 < 0.001pH 5.8 5.9 6.0 5.9 5.9 5.9 0.06 5.9 5.9 0.05 0.46 0.46
1 Ground pork was made from both shoulders from each of 48 pigs, 8 per dietary treatment (4 barrows and 4 gilts).

348
Me
at
Qu
al
ity
Table 2. Effect of dietary grain and dried distillers grains with solubles (DDGS) source on ground pork fatty acid profile1
DietGrain source Sorghum Sorghum Sorghum Sorghum Sorghum Corn
DDGS source - Sorghum Sorghum Sorghum Corn Corn P-valueItem2 DDGS level 0% 15% 30% 45% 30% 30% SE Diet Linear3
Myristic acid (C14:0), % 1.46 1.42 1.42 1.36 1.43 1.35 0.02 < 0.05 0.01Palmitic acid (C16:0), % 24.60 24.00 24.13 23.04 23.78 23.13 0.23 < 0.001 < 0.0001Palmitoleic acid (C16:1), % 2.77 2.72 2.43 2.35 2.40 2.31 0.10 < 0.01 0.001Margaric acid (C17:0), % 0.44 0.45 0.47 0.49 0.52 0.46 0.03 0.29 0.14Stearic acid (C18:0), % 12.78 12.34 12.72 11.79 12.29 12.04 0.31 0.20 0.07Oleic acid (C18:1n9c), % 40.83 39.68 39.40 38.33 37.71 38.05 0.40 < 0.0001 < 0.001Vaccenic acid (C18:1n7), % 4.00 3.91 3.65 3.62 3.48 3.44 0.09 < 0.0001 < 0.001Linoleic acid (C18:2n6c), % 9.40 11.39 11.89 14.71 14.25 15.11 0.54 < 0.0001 < 0.0001Total C18:2 fatty acids, %4 9.54 11.56 12.03 14.87 14.40 15.24 0.55 < 0.0001 < 0.0001α-Linolenic acid (C18:3n3), % 0.57 0.63 0.61 0.77 0.63 0.64 0.03 0.01 < 0.001Arachidic acid (C20:0), % 0.20 0.21 0.21 0.20 0.21 0.20 0.01 0.83 0.92Eicosenoic acid (C20:1), % 0.76 0.78 0.78 0.78 0.75 0.77 0.03 0.95 0.58Eicosadienoic acid (C20:2), % 0.48 0.57 0.59 0.69 0.69 0.73 0.03 < 0.0001 < 0.0001Arachidonic acid (C20:4n6), % 0.10 0.11 0.10 0.13 0.10 0.11 0.01 0.04 0.02Other fatty acids, % 1.47 1.62 1.46 1.58 1.59 1.54 0.07 0.38 0.55Total SFA, %5 39.88 38.88 39.36 37.32 38.68 37.61 0.45 < 0.01 < 0.001Total MUFA, %6 48.99 47.76 46.88 45.74 45.00 45.17 0.49 < 0.0001 < 0.0001Total PUFA, %7 11.13 13.37 13.76 16.94 16.32 17.22 0.62 < 0.0001 < 0.0001UFA:SFA, ratio8 1.51 1.58 1.54 1.68 1.59 1.66 0.03 < 0.01 < 0.01PUFA:SFA, ratio9 0.28 0.35 0.35 0.46 0.42 0.46 0.02 < 0.0001 < 0.0001Iodine value (IV)10 60.2 62.8 62.7 67.1 65.3 66.9 0.80 < 0.0001 < 0.00011 Ground pork was made from both shoulders of each of 48 pigs, 8 per dietary treatment (4 barrows and 4 gilts).2 All items calculated as a percentage of the total fatty acid content.3 Increase of sorghum DDGS from 0 to 45%.4 Total C18:2 fatty acids = [% C18:2n6t] + [% C18:2n6c] + [% C18:2, 9c11t] + [% C18:2, 10t12c] + [% C18:2, 9c11c] + [% C18:2, 9t11t].5 Total saturated fatty acids = [% C10:0] + [% C11:0] + [% C12:0] + [% C14:0] + [% C15:0] + [% C16:0] + [% C17:0] + [% C18:0] + [% C20:0] + [% C21:0] + [% C22:0] + [% C24:0].6 Total monounsaturated fatty acids = [% 14:1] + [% 15:1] + [% 16:1] + [% 17:1] + [% 18:1n9t] + [% 18:1n9c] + [% 18:1n7] + [% 20:1] + [% 24:1].7 Total polyunsaturated fatty acids = [% 18:2n6t] + [% 18:2n6c] + [% C18:2 9c,11t] + [% C18:2 10t,12c] + [% C18:2 9c,11c] + [% C18:2 9t,11t] + [% 18:3n6] + [% 18:3n3] + [% 20:2] +[% 20:3n6] + [% 20:4n6] + [% 20:5n3] + [% 22:5n3] + [% 22:5n6].8 UFA:SFA ratio = [Total MUFA+ Total PUFA] / Total SFA.9 PUFA:SFA ratio = Total PUFA / Total SFA.10 Iodine value = [% C16:1] × 0.95 + [% C18:1] × 0.86 + [% C18:2] × 1.732 + [% C18:3] × 2.616 + [% C20:1] × 0.785 + [% C22:1] × 0.723.

349
Meat Quality
Table 3. Effect of gender on ground pork fatty acid profile1
GenderItem2 Barrow Gilt SE P-valueMyristic acid (C14:0), % 1.43 1.39 0.01 0.04Palmitic acid (C16:0), % 24.14 23.42 0.13 < 0.001Palmitoleic acid (C16:1), % 2.58 2.41 0.06 0.04Margaric acid (C17:0), % 0.47 0.48 0.02 0.66Stearic acid (C18:0), % 12.29 12.36 0.18 0.79Oleic acid (C18:1n9c), % 39.44 38.56 0.23 0.01Vaccenic acid (C18:1n7), % 3.73 3.64 0.06 0.15Linoleic acid (C18:2n6c), % 12.00 13.59 0.31 < 0.001Total C18:2 fatty acids, %3 12.15 13.73 0.32 < 0.01α-Linolenic acid (C18:3n3), % 0.60 0.68 0.02 0.01Arachidic acid (C20:0), % 0.20 0.21 0.01 0.73Eicosenoic acid (C20:1), % 0.79 0.75 0.02 0.14Eicosadienoic acid, (C20:2), % 0.59 0.66 0.02 < 0.01Arachidonic acid (C20:4n6), % 0.10 0.12 0.01 < 0.01Other fatty acids, % 1.49 1.60 0.04 0.03Total SFA, %4 38.95 38.29 0.26 0.08Total MUFA, %5 47.17 46.01 0.29 0.01Total PUFA, %6 13.87 15.71 0.36 0.001UFA:SFA, ratio7 1.57 1.62 0.18 0.08PUFA:SFA, ratio8 0.36 0.41 0.01 < 0.01Iodine value (IV)9 63.2 65.2 0.5 < 0.011 Ground pork was made from both shoulders of each of 48 pigs, 24 barrows and 24 gilts.2 All items calculated as a percentage of the total fatty acid content.3 Total C18:2 fatty acids = [% C18:2n6t] + [% C18:2n6c] + [% C18:2, 9c11t] + [% C18:2, 10t12c] + [% C18:2, 9c11c] + [% C18:2, 9t11t].4 Total saturated fatty acids = [% C10:0] + [% C11:0] + [% C12:0] + [% C14:0] + [% C15:0] + [% C16:0] + [% C17:0] + [% C18:0] + [% C20:0] + [% C21:0] + [% C22:0] + [% C24:0].5 Total monounsaturated fatty acids = [% 14:1] + [% 15:1] + [% 16:1] + [% 17:1] + [% 18:1n9t] + [% 18:1n9c] + [% 18:1n7] + [% 20:1] + [% 24:1].6 Total polyunsaturated fatty acids = [% 18:2n6t] + [% 18:2n6c] + [% C18:2 9c,11t] + [% C18:2 10t,12c] + [% C18:2 9c,11c] + [% C18:2 9t,11t] + [% 18:3n6] + [% 18:3n3] + [% 20:2] + [% 20:3n6] + [% 20:4n6] + [% 20:5n3] + [% 22:5n3] + [% 22:5n6].7 UFA:SFA ratio = [Total MUFA+ Total PUFA] / Total SFA.8 PUFA:SFA ratio = Total PUFA / Total SFA.9 Iodine value = [% C16:1] × 0.95 + [% C18:1] × 0.86 + [% C18:2] × 1.732 + [% C18:3] × 2.616 + [% C20:1] × 0.785 + [% C22:1] × 0.723.

350
Me
at
Qu
al
ity
Table 4. Ground pork oxidation and color from 0 to 120 h of retail display1
Hour P-valueItem 0 12 24 36 48 60 72 84 96 108 120 SE Hour LinearTBARS2
(mg MDA/ kg)3 0.374 - 0.269 - - - 0.377 - - - 0.492 0.039 < 0.0001 < 0.0001Objective color
CIE L*4 63.4 61.8 61.9 61.0 60.3 59.8 59.4 59.7 59.8 59.2 60.6 0.61 < 0.0001 < 0.0001CIE a*5 22.5 20.1 19.1 18.1 17.9 17.7 17.2 16.6 16.0 15.8 15.1 0.12 < 0.0001 < 0.0001CIE b*6 19.0 18.0 17.5 17.7 17.4 17.6 17.5 17.5 17.2 17.3 16.6 0.23 < 0.0001 < 0.0001
1 Two sets of 3 packages from each of 48 pigs, 8 per diet (4 barrows and 4 gilts) were held in retail display for 5 d (120 h).2 Thiobarbituric acid-reactive substances; a measure of oxidative rancidity.3 Unit = mg of malonaldehyde per kilogram of meat; higher values indicates greater oxidative rancidity.4 Measure of lightness; 0 = black, 100 = white.5 Higher positive values indicate greater redness; negative values indicate greenness.6 Higher positive values indicate greater yellowness; negative values indicate blueness.
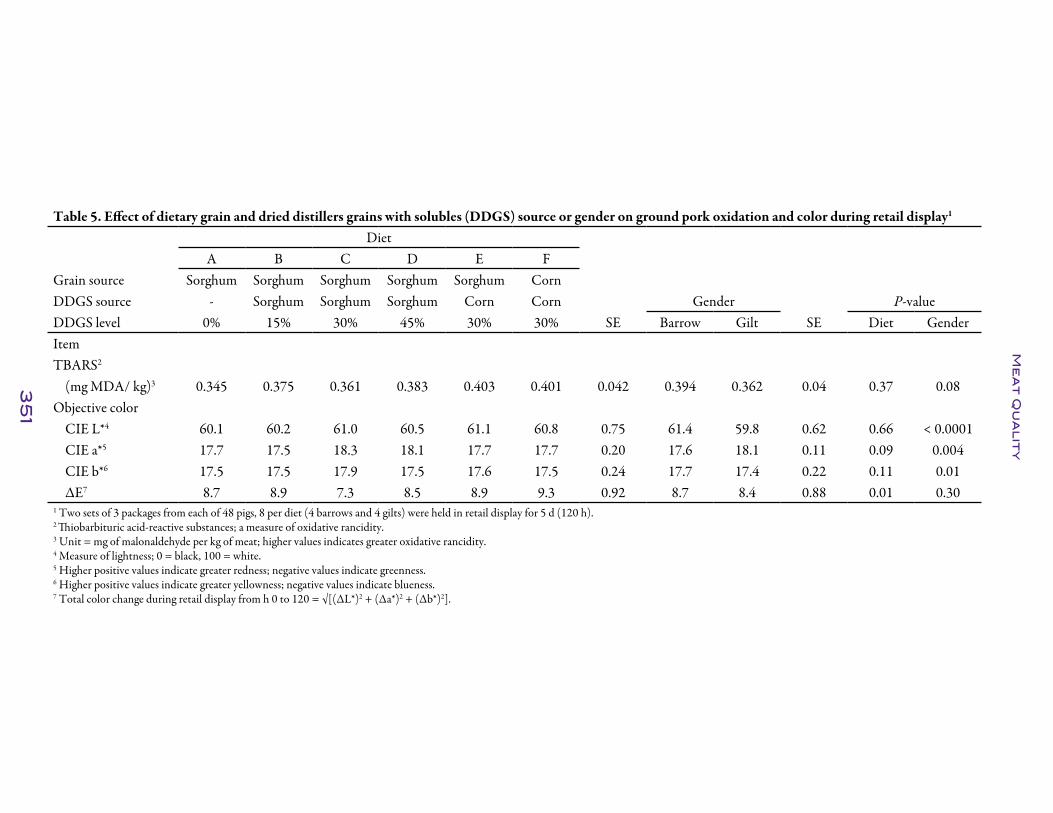
35
1
Me
at
Qu
al
ity
Table 5. Effect of dietary grain and dried distillers grains with solubles (DDGS) source or gender on ground pork oxidation and color during retail display1
DietA B C D E F
Grain source Sorghum Sorghum Sorghum Sorghum Sorghum CornDDGS source - Sorghum Sorghum Sorghum Corn Corn Gender P-valueDDGS level 0% 15% 30% 45% 30% 30% SE Barrow Gilt SE Diet GenderItemTBARS2
(mg MDA/ kg)3 0.345 0.375 0.361 0.383 0.403 0.401 0.042 0.394 0.362 0.04 0.37 0.08Objective color
CIE L*4 60.1 60.2 61.0 60.5 61.1 60.8 0.75 61.4 59.8 0.62 0.66 < 0.0001CIE a*5 17.7 17.5 18.3 18.1 17.7 17.7 0.20 17.6 18.1 0.11 0.09 0.004CIE b*6 17.5 17.5 17.9 17.5 17.6 17.5 0.24 17.7 17.4 0.22 0.11 0.01ΔE7 8.7 8.9 7.3 8.5 8.9 9.3 0.92 8.7 8.4 0.88 0.01 0.30
1 Two sets of 3 packages from each of 48 pigs, 8 per diet (4 barrows and 4 gilts) were held in retail display for 5 d (120 h).2 Thiobarbituric acid-reactive substances; a measure of oxidative rancidity.3 Unit = mg of malonaldehyde per kg of meat; higher values indicates greater oxidative rancidity.4 Measure of lightness; 0 = black, 100 = white.5 Higher positive values indicate greater redness; negative values indicate greenness.6 Higher positive values indicate greater yellowness; negative values indicate blueness.7 Total color change during retail display from h 0 to 120 = √[(ΔL*)2 + (Δa*)2 + (Δb*)2].

352
Me
at
Qu
al
ity
Table 6. Effect of dietary grain and dried distillers grains with solubles (DDGS) source with gender on ground pork sensory attributes1
Grain source Sorghum Sorghum Sorghum Sorghum Sorghum CornDDGS source - Sorghum Sorghum Sorghum Corn Corn
DDGS level 0% 15% 30% 45% 30% 30%Gender2 B G B G B G B G B G B G SE P-value
Sensory attributePork aroma3 5.8 5.6 5.4 5.7 5.7 5.6 5.8 5.7 5.7 5.8 5.5 5.8 0.10 0.01Off-aroma4 1.1 1.2 1.1 1.2 1.1 1.2 1.2 1.2 1.3 1.1 1.5 1.2 0.11 0.28Pork flavor5 5.5 5.3 5.4 5.5 5.6 5.7 5.8 5.4 5.5 5.4 5.4 5.5 0.17 0.28Juiciness6 5.5 5.3 5.4 5.8 5.5 5.8 5.8 5.5 5.7 5.9 5.7 5.7 0.15 0.21Texture7 4.3 4.3 4.1 4.0 4.1 4.0 4.1 4.2 4.0 3.8 3.8 3.9 0.13 0.86Off-flavor8 1.3 1.2 1.0 1.3 1.2 1.2 1.4 1.5 1.5 1.3 1.6 1.3 0.10 0.24
1 Ground pork from each of 48 pigs, 8 per diet (4 barrows and 4 gilts), were analyzed during 8 trained panel sessions.2 Gender: B = barrow, G = gilt.3 Scale of 1-8: 1= extremely weak, 8 = extremely strong.4 Scale of 1-8: 1= none, 8 = abundant.5 Scale of 1-8: 1= extremely bland, 8 = extremely intense.6 Scale of 1-8: 1= extremely dry, 8= extremely juicy.7 Scale of 1-8: 1= extremely soft, 8 = extremely hard.8 Scale of 1-8: 1= none, 8 = abundant.

353
Me
at
Qu
al
ity
Table 7. Effect of dietary grain and dried distillers grains with solubles (DDGS) source or gender on ground pork sensory attributes1
DietA B C D E F
Grain source Sorghum Sorghum Sorghum Sorghum Sorghum CornDDGS source - Sorghum Sorghum Sorghum Corn Corn Gender P-value
DDGS level 0% 15% 30% 45% 30% 30% SE Barrow Gilt SE Diet GenderSensory attribute
Pork aroma2 5.7 5.6 5.6 5.8 5.7 5.7 0.09 5.7 5.7 0.08 0.09 0.41Off-aroma3 1.1 1.1 1.2 1.2 1.2 1.3 0.09 1.2 1.2 0.07 0.29 0.69Pork flavor4 5.4 5.4 5.6 5.6 5.5 5.4 0.14 5.5 5.5 0.11 0.60 0.92Juiciness5 5.4 5.6 5.7 5.6 5.7 5.7 0.12 5.6 5.7 0.08 0.25 0.32Texture6 4.3 4.1 4.0 4.1 3.9 3.9 0.10 4.1 4.0 0.07 0.02 0.81Off-flavor7 1.3 1.2 1.2 1.4 1.4 1.4 0.07 1.3 1.3 0.04 0.05 0.57
1 Ground pork from each of 48 pigs, 8 per diet (4 barrows and 4 gilts), were analyzed during 8 trained panels.2 Scale of 1-8: 1= extremely weak, 8 = extremely strong.3 Scale of 1-8: 1= none, 8 = abundant.4 Scale of 1-8: 1= extremely bland, 8 = extremely intense.5 Scale of 1-8: 1= extremely dry, 8= extremely juicy.6 Scale of 1-8: 1= extremely soft, 8 = extremely hard.7 Scale of 1-8: 1= none, 8 = abundant.

354
Index of Key WordsPage numbers in parentheses
25(OH)D3 (35)aerosols (6)amino acids (174)amino acid ratio (138, 155, 168)antimicrobials (57)astaxanthin (330)Bacillus (240)by-products (240)carcass characteristics (319, 330)choice white grease (130)circovirus (13)conventional dry feeder (257)copper (57)corn (119, 182, 282, 288)corn DDGS (119)cracked corn (288)crystalline amino acids (75)DDGS (155, 162, 168, 182, 197, 203, 216,
319, 341)deoxynivalenol (91, 97, 106)diet CV (272)disease elimination (13)fatty acid (319)fecal consistency (240)feed processing (197, 288)feeder (247)feeding program (266)fiber (203, 216, 227)finishing pig (155, 162, 168, 174, 182, 197,
203, 216, 228, 240, 247, 257, 266, 272, 278, 282, 288, 301, 330)
fish meal (70, 81)gender (342)growth (162, 247, 262, 266)growth promoters (57)iodine value (319)isoleucine (145)L-Carnitine (319)large neutral amino acids (174)lightweight pig (262)liquid energy (130)loin (319)
lysine (70, 138, 155, 168, 174)meal (278)mean estimation (301)mix time (272)NDF (203, 216)nonessential amino acids (70, 75)nursery pig (35, 46, 57, 70, 75, 81, 91, 97,
106, 114, 119, 130, 138, 145, 288)particle size (197, 282)PCV2 (13)pelleting (91, 97, 106, 247, 278, 288)Peptone 50 (81)PEP2+ (81)PEP-NS (81)pork color (330)pork quality (341)protein source (75)PRRSV (1, 6)PRRSV control and elimination (1)Ractopamine HCl (266, 272, 330)sample size (301)sensory attributes (341)SID tryptophan:lysine ratio (162)sodium metabisulfite (91, 97, 106)sorghum (119, 182, 282, 341)sorghum DDGS (119)spray-dried animal plasma (81)stocking density (262)sulfate (46)swine (13)tryptophan (138, 145, 155, 162, 168, 174)vaccine (13)vitamin D (35)vomitoxin (91, 97, 106)wash time (240)water (46)wet-dry feeder (257)wheat middlings (114, 203, 216)withdrawal (203)xylanase (227)zeolite (46)
355
AcknowledgmentsAppreciation is expressed to these organizations for assisting with swine research atKansas State University.
Abilene Animal Hospital, Abilene, KSADM, Decatur, ILAjinomoto Heartland LLC, Chicago, ILDirect Biologicals, Crofton, NEDSM Nutritional Products,
Parsippany, NJDanisco Animal Nutrition, St. Louis, MOElanco Animal Health, Indianapolis, INFeedlogic Corporation, Willmar, MNHenry’s LTD, Longford, KSHubbard Feeds, Mankato, MNIGENE – Astaxanthin Partners, Ltd.,
Columbia, MOILC Resources, Urbandale, IA J-Six Farms, Seneca, KSKansas Ethanol, LLC, Lyons, KSKansas Pork Association, Manhattan, KSKansas Swine Alliance, Abilene, KSKeesecker Agri Business, Washington, KSKey Milling, Clay Center, KSKyodo Shiryo,Yokohama, Kanagawa, JapanLivestock and Meat Industry Council,Manhattan, KSLonza, Inc., Allendale, NJ
N & N Farms, St. George, KSNational Pork Board, Des Moines, IANew Fashion Pork, Jackson, MNNew Horizon Farms, Pipestone, MNNovartis Animal Health,
Greensboro, NCPfizer Animal Health, New York, NYPIC USA, Franklin, KYPrairie Horizon Agri Energy,
Phillipsburg, KSProtein Resources LLC, West Bend, IAPurco, Pipestone, MNSuidae Health and Production,
Algona, IATech-Mix, Stewart, MNTriumph Foods, St. Joseph, MOUnited Sorghum Checkoff Program,
Lubbock, TXWestern Plains Energy, Colby, KSWhite Energy-Russell, Russell, KSXFE Products, Des Moines, IAZenith Project, Geneseo, KSZephyr Project, Geneseo, KSZoltenko Farms Inc., Hardy, NE
We especially appreciate the assistance and dedication of Kansas State Universityemployees: Jon Bergstrom, Lyle Figge, Frank Jennings, Mark Nelson, and Theresa Rathbun. We also wish to thank J-Six farms, Seneca, KS; Joe, Jim, Jeff, Janie, and John Kramer; Dan and Jenny Gerety; Kirk Sturbota; Scott Holthaus; and Bob Boden for their technical assistance. Appreciation is also expressed to Richard Brobjorg, Scott Heidebrink, Marty Heintz, and Bob Taubert, New Horizon Farms, Pipestone, MN, for their dedicated support.
Swine Industry Day CommitteeJim Nelssen, ChairmanDuane DavisMike Tokach
Joel DeRoucheyBob Goodband
Steve DritzJoe Hancock
356
The Livestock and Meat Industry Council, Inc.The Livestock and Meat Industry Council, Inc. (LMIC) is a nonprofit charitable organization supporting animal agriculture research, teaching, and education. This is accomplished through the support of individuals and businesses that make LMIC a part of their charitable giving.
Tax-deductible contributions can be made through gifts of cash, appreciated securi-ties, real estate, life insurance, charitable remainder trusts, and bequests as well as many other forms of planned giving. LMIC can also receive gifts of livestock, machinery, or equipment. These types of gifts, known as gifts-in-kind, allow the donor to be eligible for a tax benefit based on the appraised value of the gift.
Since its inception in 1970, LMIC has provided student scholarships, research assis-tance, capital improvements, land, buildings, and equipment to support students, faculty, and the industry of animal agriculture. If you would like to be a part of this mission or would like additional information, please contact the Livestock and Meat Industry Council/Animal Sciences and Industry, Weber Hall, Manhattan, Kansas 66506 or call 785-532-1227.
LMIC Board MembersKyle BauerJerry BohnJoe DowneyGalen FinkRandy FisherMark GardinerCraig GoodLyle GraySam Hands
Bernie HansenGreg HendersonPatsy HoughtonSteven HuntSteve IrsikJustin JanssenDan JohnsonLarry JonesMark Knight
Pat KoonsKelly LechtenbergJan LyonsGina MillerTom PerrierLee ReeveKen StielowWarren Weibert
Royal Board MembersDell AllenRichard ChaseMax DeetsCalvin DrakeStan Fansher
Henry GardinerDon GoodKenny KnightPhil PharHarland Priddle
Don SmithMikel StoutDuane Walker

Kansas State University Agricultural Experiment Station and Cooperative Extension Service
SRP 1056 November 2011 K-State Research and Extension is an equal opportunity provider and employer.
Copyright 2011 Kansas State University Agricultural Experiment Station and Cooperative Extension Service. Contents of this publication may be freely reproduced for educational purposes. All other rights reserved. In each case, give credit to the author(s), Swine Day 2011, Kansas State University, November 2011. Contribution no. 12-064-S from the Kansas Agricultural Experiment Station.
Brand names appearing in this publication are for product identification purposes only. No endorsement is intended, nor is criticism implied of similar products not mentioned.
Publications from Kansas State University are available at: www.ksre.ksu.edu
SWINEDAY
2011