sri international and subsidiaries
TRANSCRIPT
SRI International andSubsidiariesConsolidated Financial Statements andConsolidating InformationDecember 31, 2011 and December 25, 2010

SRI International and SubsidiariesIndexDecember 31, 2011 and December 25, 2010
Page(s)
Report of Independent Auditors ...............................................................................................................1
Consolidated Financial Statements
Balance Sheets ............................................................................................................................................2
Statements of Activities and Unrestricted Net Assets..................................................................................3
Statements of Cash Flows ...........................................................................................................................4
Notes to Financial Statements ...............................................................................................................5–21
Consolidating Supplementary Schedules Information
Balance Sheet ......................................................................................................................................22–23
Statement of Activities and Unrestricted Net Assets ...........................................................................24–25
Cash Flow ............................................................................................................................................26–27

PricewaterhouseCoopers LLP, Three Embarcadero Center, San Francisco, CA 94111-4004T: (415) 498 5000, F: (415) 498 7100, www.pwc.com/us
Report of Independent Auditors
To the Board of Directors
SRI International
In our opinion, the accompanying consolidated balance sheets and the related consolidated statements of
activities and unrestricted net assets and cash flows present fairly, in all material respects, the financial
position of SRI International and its subsidiaries (“SRI”) at December 31, 2011 and December 25, 2010,
and the change in their net assets and their cash flows for the years then ended in conformity with
accounting principles generally accepted in the United States of America. These financial statements are
the responsibility of SRI’s management. Our responsibility is to express an opinion on these financial
statements based on our audits. We conducted our audits of these statements in accordance with
auditing standards generally accepted in the United States of America. Those standards require that we
plan and perform the audit to obtain reasonable assurance about whether the financial statements are
free of material misstatement. An audit includes examining, on a test basis, evidence supporting the
amounts and disclosures in the financial statements, assessing the accounting principles used and
significant estimates made by management, and evaluating the overall financial statement presentation.
We believe that our audits provide a reasonable basis for our opinion.
Our audits were conducted for the purpose of forming an opinion on the basic financial statements taken
as a whole. The information included on pages 22 to 27 is presented for the purposes of additional
analysis and is not a required part of the basic financial statements. Such information has been subjected
to the auditing procedures applied in the audits of the basic financial statements and, in our opinion, is
fairly stated in all material respects in relation to the basic financial statements taken as a whole.
April 25, 2012

SRI International and SubsidiariesConsolidated Balance SheetsDecember 31, 2011 and December 25, 2010
The accompanying notes are an integral part of these consolidated financial statements.
2
December 31, December 25,
2011 2010
Assets
Current assets
Cash and cash equivalents 83,804,000$ 91,754,000$
Restricted cash and cash equivalents 1,352,000 9,039,000
Investments 12,712,000 11,056,000
Receivables (including contractual retentions and deferred
billings: $72,958,000 in 2011 and $63,274,000 in 2010;
less allowance for uncollectible accounts: $2,828,000 in 2011
and $3,189,000 in 2010) 116,274,000 97,779,000
Inventory 3,868,000 2,005,000
Prepaid expenses and other assets 5,940,000 7,518,000
Total current assets 223,950,000 219,151,000
Property and equipment, net 110,073,000 109,729,000
Other noncurrent assets, net 10,335,000 11,277,000
Total assets 344,358,000$ 340,157,000$
Liabilities and Unrestricted Net Assets
Current liabilities
Accounts payable and accrued expenses 77,522,000$ 80,016,000$
Line of credit - 10,962,000
Client advances and credits 27,904,000 14,544,000
Current portion of capital lease obligations 394,000 404,000
Current installments of long-term debt 33,825,000 35,149,000
Total current liabilities 139,645,000 141,075,000
Long-term portion of capital lease obligations 2,253,000 2,682,000
Long-term debt, excluding current installments 2,957,000 3,026,000
Other noncurrent liabilities 9,468,000 18,167,000
Total liabilities 154,323,000 164,950,000
Commitments and contingencies (see Note 11)
Unrestricted net assets 190,035,000 175,207,000
Total liabilities and unrestricted net assets 344,358,000$ 340,157,000$

SRI International and SubsidiariesConsolidated Statements of Activities and Unrestricted Net AssetsYears Ended December 31, 2011 and December 25, 2010
The accompanying notes are an integral part of these consolidated financial statements.
3
December 31, December 25,
2011 2010
Project revenue 577,502,000$ 494,982,000$
Royalty revenue 7,728,000 7,771,000
Net revenue 585,230,000 502,753,000
Direct project costs (361,898,000) (291,606,000)
Excess of net revenue over direct project costs 223,332,000 211,147,000
Indirect expenses
Salaries, wages, and benefits 130,942,000 130,382,000
Property and equipment 40,939,000 41,065,000
Materials, services, travel, and other 33,994,000 34,789,000
Internal research programs 13,181,000 7,958,000
Total indirect expenses 219,056,000 214,194,000
Other income (expense)
Interest income 291,000 398,000
Interest expense (404,000) (805,000)
Stanford University separation expense (2,092,000) (1,791,000)
Realized gains on investments 1,983,000 29,865,000
Restructuring costs - (4,768,000)
Other, net 6,163,000 3,714,000
Total other income (expense), net 5,941,000 26,613,000
10,217,000 23,566,000
Equity in earnings from affiliates - (678,000)
Unrealized gains on investments 1,680,000 465,000
Income before income taxes 11,897,000 23,353,000
Income tax benefit 2,931,000 6,076,000
Change in unrestricted net assets 14,828,000 29,429,000
Unrestricted net assets - beginning of year 175,207,000 145,778,000
Unrestricted net assets - end of year 190,035,000$ 175,207,000$

SRI International and SubsidiariesConsolidated Statements of Cash FlowsYears Ended December 31, 2011 and December 25, 2010
The accompanying notes are an integral part of these consolidated financial statements.
4
December 31, December 25,
2011 2010
Cash flows from operating activities
Change in unrestricted net assets 14,828,000$ 29,429,000$
Adjustments to reconcile change in unrestricted net assets
to net cash provided by operating activities
Depreciation and amortization 18,415,000 16,179,000
Provision for doubtful accounts (361,000) (969,000)
(Gain) loss on investments (3,663,000) (30,464,000)
Equity in earnings from affiliates - 678,000
Loss on sale of property and equipment 23,000 (19,000)
Deferred tax expense - (5,513,000)
Changes in operating assets and liabilities
Restricted cash and cash equivalents 7,687,000 (8,041,000)
Receivables, net (16,965,000) 1,660,000
Inventory (1,863,000) (261,000)
Prepaid expenses and other assets 1,061,000 (1,717,000)
Other assets, net 194,000 782,000
Accounts payable and accrued expenses 1,129,000 10,777,000
Client advances and credits 13,360,000 (2,427,000)
Other noncurrent liabilities (7,198,000) (4,216,000)
Net cash provided by operating activities 26,647,000 5,878,000
Cash flows from investing activities
Purchase of investments (100,000) (225,000)
Sale and maturity of investments 2,007,000 31,906,000
Capital expenditures (18,784,000) (24,032,000)
Proceeds from sale of property and equipment 2,000 210,000
Net cash (used in) provided by investing activities (16,875,000) 7,859,000
Cash flows from financing activities
Proceeds from issuance of long-term debt 55,000 15,753,000
Principal payments of long-term debt (1,584,000) (3,950,000)
Payments under capital lease (439,000) (705,000)
Change in bank overdraft (4,792,000) (365,000)
(Payments) proceeds from line of credit, net (10,962,000) 10,962,000
Net cash (used in) provided by financing activities (17,722,000) 21,695,000
Net (decrease) increase in cash and cash equivalents (7,950,000) 35,432,000
Cash and cash equivalents
Beginning of year 91,754,000 56,322,000
End of year 83,804,000$ 91,754,000$
Supplemental disclosures of cash flow information
Cash paid during the year for
Interest, net of amount capitalized 88,000$ 269,000$
Noncash transactions
Insurance claims paid to claimants directly by insurance company 331,000 4,299,000

SRI International and SubsidiariesNotes to Consolidated Financial StatementsDecember 31, 2011 and December 25, 2010
5
1. Nature of Organization and Summary of Significant Accounting Policies
Description of BusinessSRI International (“SRI”), a nonprofit corporation, is one of the largest contract research technologydevelopment and consulting organizations in the world. SRI’s main business units, together with itsconsolidated subsidiaries, provide scientific research, development, and technology/managementconsulting to businesses and governments worldwide. The U.S. government, foreign governments,and some of the world’s largest companies have been long-standing, major clients of SRI. Itserves these clients by providing an extremely wide range of scientific and professional expertise.Work encompasses the entire cycle of research and development – from basic research to problemsolving to the full spectrum of engineering sciences; systems engineering; physical and lifesciences; social, economic, and political science; and business management consulting andmarket/technology studies and analysis. SRI is headquartered in Menlo Park, California, withmajor facilities in Arlington and Harrisonburg, Virginia; State College, Pennsylvania; Princeton, NewJersey; St. Petersburg, Florida and other offices throughout the United States and overseas.
SRI uses a fiscal year that ends on the last Saturday in December. The fiscal years endedDecember 31, 2011 and December 25, 2010 included 53 and 52 weeks of operations, respectively.SRI’s subsidiary, Averatek Corporation (“Averatek”) and former subsidiaries, Sarnoff Corporation(“Sarnoff”) and SRI Holdings use a fiscal year that ends on December 31.
Principles of ConsolidationThe accompanying consolidated financial statements have been prepared on the accrual basis ofaccounting in accordance with accounting principles generally accepted in the United States ofAmerica and include the accounts of SRI and its subsidiary, Averatek in which SRI has a majorityinterest. Effective January 1, 2011, upon dissolution of Sarnoff and SRI Holdings, the assets,liabilities and operations of these subsidiaries were transferred to SRI. All material intercompanybalances and transactions have been eliminated in consolidation.
Investments in other affiliated companies over which SRI has significant influence are accountedfor on the equity method and are reflected as other noncurrent assets.
Unrestricted Net AssetsRevenues are reported as increases in unrestricted net assets unless use of the related assets islimited by donor-imposed restrictions. To date, SRI has not received significant donor contributionsand therefore all net assets are considered unrestricted. Expenses are reported as decreases inunrestricted net assets. Gains or losses on investments and other assets or liabilities are reportedas increases or decreases in unrestricted net assets unless their use is restricted by explicit donorstipulation or by law.
Measure of OperationsSRI considers all revenues and expenses related to operations except equity income or loss frominvestee companies and unrealized gains or losses from investments.
RevenueProject revenue consists principally of services performed in accordance with federal awards and isrecognized based upon applicable input or output measures such as costs incurred under costreimbursable or fixed price contract arrangements and product sales. Periodic reviews are madeas work progresses and a provision for uncollectible project revenue is made for any estimatedunrecoverable amounts or estimated losses. Certain of the project revenue arrangements providefor contractual restrictions such as ceilings on rates and costs.

SRI International and SubsidiariesNotes to Consolidated Financial StatementsDecember 31, 2011 and December 25, 2010
6
SRI receives royalties on certain technology on which it holds patents or copyrights. Royaltyincome, net of amounts shared with inventors and employees, is recorded when due under theapplicable technology transfer agreements and when collectibility is reasonably assured.
Cash EquivalentsCash equivalents consist of short-term highly liquid investments with an original maturity of threemonths or less when purchased.
Restricted Cash and Cash EquivalentsRestricted cash and cash equivalents consist primarily of funds that are contractually restricted forcertain purposes, including unspent bond proceeds, funds deposited for future bond redemptionand unspent funds from a contract with the State of Florida that are contractually restricted forcertain purposes.
InvestmentsInvestments consist solely of equity securities with readily determinable fair values and arereported at fair value based upon quoted market prices.
Fair Value of Financial Assets and LiabilitiesAccounting Standards Codification (“ASC”) 820, Fair Value Measurements, defines fair value asthe exchange price that would be received for an asset or paid to transfer a liability (an exit price) inthe principal or most advantageous market for the asset or liability in an orderly transactionbetween market participants on the measurement date. ASC 820 also establishes a fair valuehierarchy which requires an entity to maximize the use of observable inputs and minimize the useof unobservable inputs when measuring fair value. The standard describes three levels of inputsthat may be used to measure fair value:
Level 1 - Quoted prices in active markets for identical assets or liabilities.
Level 2 - Observable inputs other than Level 1 prices such as quoted prices for similar assetsor liabilities; quoted prices in markets that are not active; or other inputs that areobservable or can be corroborated by observable market data for substantially thefull term of the assets or liabilities.
Level 3 - Unobservable inputs that are supported by little or no market activity and that aresignificant to the fair value of the assets or liabilities.
SRI’s financial instruments include cash and cash equivalents, receivables, investments, accountspayable, client advances and credits and long-term debt.
The carrying amounts of cash and cash equivalents, receivables, accounts payable, and clientadvances and credits approximate fair value because of the short-term maturity of these financialinstruments. The carrying value of SRI’s long-term debt approximates fair value because interestrates reflect current market rates offered by lending institutions for loans with similar terms tocompanies with comparable credit risk.

SRI International and SubsidiariesNotes to Consolidated Financial StatementsDecember 31, 2011 and December 25, 2010
7
Credit RiskSubstantially all the revenues for SRI are generated from U.S. government contracts with a varietyof government agencies. Other revenues consist primarily of contracts with private entities andforeign governments which are widely dispersed. While SRI believes there is minimal credit riskgiven the nature of its customers, significant changes in levels of federal research funding couldimpact SRI.
InventoryInventory consists of product in inventory for sale to customers, as well as supplies used inresearch activities and project related equipment. Product inventory consist of raw material parts,work-in-process and finished goods. Inventories are valued at the lower of cost or market value,cost being determined by a method that approximates the first-in, first-out method.
Property and EquipmentPurchased property and equipment are recorded at cost. Donated property and equipment arerecorded at their fair value at date of gift. Assets acquired under both federal and nonfederalawards in which title does not ultimately transfer to SRI is not recorded as property and equipment.
Depreciation of property and equipment is provided over the estimated useful lives of therespective assets. Buildings and improvements are depreciated over various lives, ranging from 10to 40 years, principally by the straight-line method. Equipment is depreciated over various lives,ranging from 3 to 20 years, by the straight-line method. Leasehold improvements are amortizedover the shorter of the term of the respective lease by the straight-line method or their economiclife.
Property and equipment under capital leases is recorded at the present value of the minimum leasepayments at the inception of the leases and is amortized on the straight-line method over theshorter of the lease term or the estimated useful life of the asset. The amortization of assetsrecorded under capital leases is included in depreciation and amortization expense in theaccompanying consolidated statements of activities and unrestricted net assets. Interest costsincurred on borrowed funds during the period of construction of capital assets is capitalized as acomponent of the cost of acquiring these assets.
During 2011 and 2010, SRI capitalized approximately $14,000 and $20,000 respectively, of interestexpense related to various construction projects. Repairs and maintenance expenditures areexpensed as incurred.
IntangiblesExternal incremental costs of obtaining patents on SRI’s intellectual property are expensed asincurred due to the inability to reasonably forecast future cash flows from the patents developed.
SRI amortizes its goodwill and intangibles over their estimated lives. In addition, SRI evaluatesgoodwill and intangibles for impairment annually or whenever events or changes in circumstancesindicate that goodwill or intangibles might be impaired.

SRI International and SubsidiariesNotes to Consolidated Financial StatementsDecember 31, 2011 and December 25, 2010
8
Impairment of Long-Lived AssetsLong-lived assets are reviewed for impairment whenever events or changes in circumstancesindicate that the carrying amount of an asset may not be recoverable. Recoverability of assets tobe held and used is measured by a comparison of the carrying amount of an asset to future netcash flows expected to be generated by the asset. If such assets are considered to be impaired,the impairment to be recognized is measured by the amount by which the carrying amount of theassets exceeds the fair value of the assets. There were no impairment losses for the years endedDecember 31, 2011 and December 25, 2010.
Client Advances and CreditsClient advances and credits represent funds received from customers in advance of performingservices and recording revenue.
Asset Retirement Costs and ObligationsAsset retirement costs and obligations (“AROs”) are recognized as liabilities when incurred, withinitial measurement at fair value. These liabilities are accreted to full value over time throughcharges to income. Accretion expense for 2011 and 2010 was $340,000 and $296,000,respectively. In addition, an asset retirement cost is capitalized as part of the related asset’scarrying value and is depreciated over the asset’s useful life. Estimated AROs of $6,560,000 and$6,284,000 are included in other noncurrent liabilities in the consolidated balance sheets atDecember 31, 2011 and December 25, 2010, respectively.
Income TaxesSRI is a nonprofit corporation and is tax exempt under Section 501 (c)(3) of the Internal RevenueCode. Activities that generate unrelated business income, as defined by the Internal RevenueService, are subject to income taxes. Averatek is a taxable corporation. Income taxes areaccounted for under the asset and liability method. Deferred tax assets and liabilities arerecognized for the future tax consequences attributable to differences between the financialstatement carrying amounts of existing assets and liabilities and their respective tax bases andoperating loss and tax credit carryforwards. Deferred tax assets and liabilities are measured usingenacted tax rates expected to apply to taxable income in the years in which those temporarydifferences are expected to be recovered or settled. The effect on deferred tax assets andliabilities of a change in tax rates is recognized in income in the period that includes the enactmentdate.
Use of EstimatesThe preparation of the consolidated financial statements in conformity with accounting principlesgenerally accepted in the United States of America requires management to make estimates andassumptions that affect the reported amounts of assets and liabilities and disclosure of contingentassets and liabilities at the date of the consolidated financial statements and the reported amountsof revenues and expenses during the reporting period. Actual results differ from those estimates.
ReclassificationsAn amount in the consolidating balance sheet (related to certain receivables) in the 2010 financialstatements was reclassified to conform to the 2011 financial statement presentation. Thisreclassification had no impact on previously reported total consolidated assets, liabilities,unrestricted net assets, or the statements of activities and cash flows.
SRI International and SubsidiariesNotes to Consolidated Financial StatementsDecember 31, 2011 and December 25, 2010
9
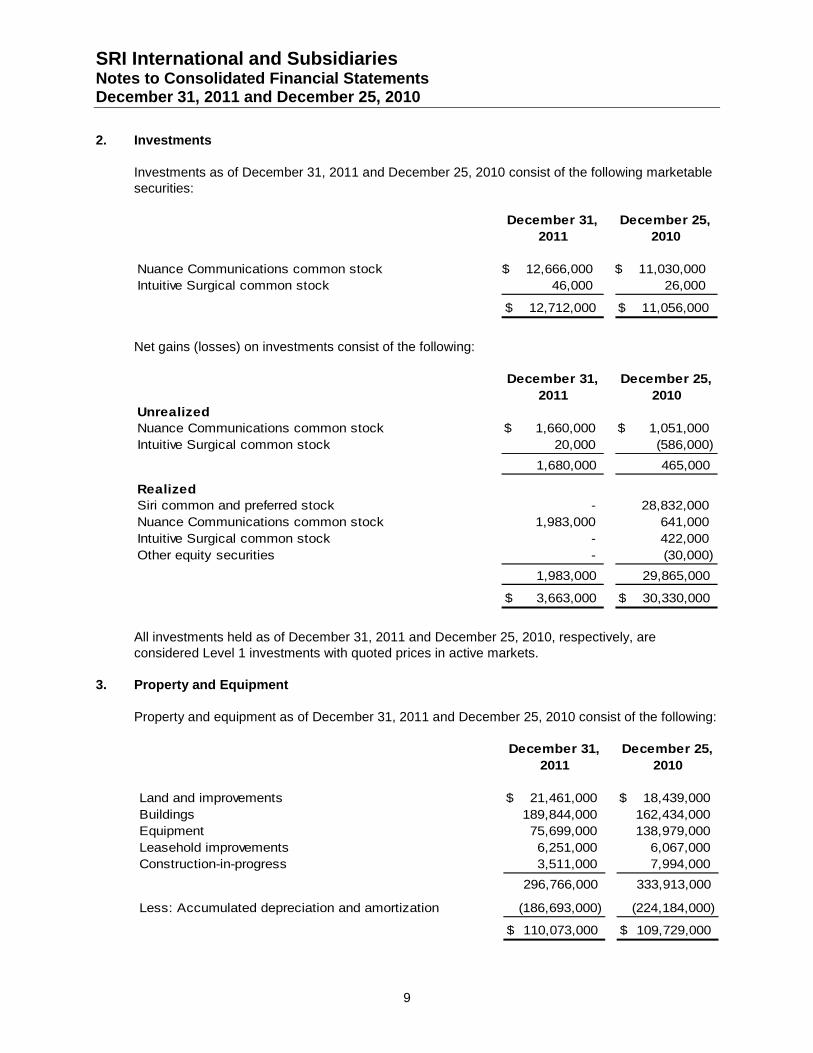
2. Investments
Investments as of December 31, 2011 and December 25, 2010 consist of the following marketablesecurities:
Net gains (losses) on investments consist of the following:
All investments held as of December 31, 2011 and December 25, 2010, respectively, areconsidered Level 1 investments with quoted prices in active markets.
3. Property and Equipment
Property and equipment as of December 31, 2011 and December 25, 2010 consist of the following:
December 31, December 25,
2011 2010
Nuance Communications common stock 12,666,000$ 11,030,000$
Intuitive Surgical common stock 46,000 26,000
12,712,000$ 11,056,000$
December 31, December 25,
2011 2010
Unrealized
Nuance Communications common stock 1,660,000$ 1,051,000$
Intuitive Surgical common stock 20,000 (586,000)
1,680,000 465,000
Realized
Siri common and preferred stock - 28,832,000
Nuance Communications common stock 1,983,000 641,000
Intuitive Surgical common stock - 422,000
Other equity securities - (30,000)
1,983,000 29,865,000
3,663,000$ 30,330,000$
December 31, December 25,
2011 2010
Land and improvements 21,461,000$ 18,439,000$
Buildings 189,844,000 162,434,000
Equipment 75,699,000 138,979,000
Leasehold improvements 6,251,000 6,067,000
Construction-in-progress 3,511,000 7,994,000
296,766,000 333,913,000
Less: Accumulated depreciation and amortization (186,693,000) (224,184,000)
110,073,000$ 109,729,000$

SRI International and SubsidiariesNotes to Consolidated Financial StatementsDecember 31, 2011 and December 25, 2010
10
Depreciation and amortization expense for the years ended December 31, 2011 and December 25,2010 was $18,415,000 and $16,179,000, respectively. Depreciation expense for the years endedDecember 31, 2011 and December 25, 2010 was $17,419,000 and $15,105,000, respectively.
As of December 31, 2011, SRI held $90,364,000 of fully depreciated assets.
4. Other Noncurrent Assets
Other noncurrent assets as of December 31, 2011 and December 25, 2010 consist of the following:
In April 2010, SRI finalized the sale of its equity investments in Siri. SRI received proceeds ofapproximately $33,400,000 (net of distributions to employees in accordance with its royalty andequity sharing policy), resulting in a gain of $28,832,000.
5. Accounts Payable and Accrued Expenses
Accounts payable and accrued expenses as of December 31, 2011 and December 25, 2010consist of the following:
December 31, December 25,
2011 2010
Accounts payable 36,058,000$ 35,366,000$
Accrued payroll, vacation and other employee related
accruals 34,673,000 31,870,000
Bank overdraft - 4,792,000
Stanford separation expense (Note 12) 2,092,000 1,791,000
Accrued insurance 3,006,000 2,881,000
Other 1,693,000 3,316,000
77,522,000$ 80,016,000$
December 31, December 25,
2011 2010
Contractual retention and fee withhold receivable 8,500,000$ 8,412,000$
Goodwill 129,000 221,000
Other intangible assets, net 921,000 921,000
Investments in affiliates, net 372,000 272,000
Insurance receivable - 900,000
Other 413,000 551,000
10,335,000$ 11,277,000$

SRI International and SubsidiariesNotes to Consolidated Financial StatementsDecember 31, 2011 and December 25, 2010
11
6. Long-Term Debt
Long-term debt as of December 31, 2011 and December 25, 2010 consists of the following:
Series 2003A BondsIn September 2003, the California Infrastructure and Development Bank issued $25 millionTax-Exempt Variable Rate Demand Revenue Bonds (the “Series 2003A”) on behalf of SRI. Theproceeds from this bond issuance were used for the financing or refinancing of the acquisition,construction, installation, improvement, renovation, remodeling, replacement, furnishing andequipping of certain research facilities owned and operated by SRI and located at SRI’s maincampus in Menlo Park.
Series 2010 BondsIn March 2010, the California Infrastructure and Economic Development Bank issued $15 millionTax-Exempt Variable Rate Demand Revenue Bonds (the “Series 2010”) on behalf of SRI. Theproceeds from this bond issuance were for the financing or refinancing of the acquisition,construction, installation, improvement, renovation, remodeling, replacement, furnishing andequipping of certain research facilities owned and operated by SRI and located at SRI’s maincampus in Menlo Park.
December 31, December 25,
2011 2010
California Infrastructure and Development Bank Revenue
Bond Series 2003A Tax-exempt Variable Rate Demand
Revenue Bonds ("Series 2003A Bonds"), payable through
2028 interest at 0.08% at December 31, 2011 and 0.33%
at December 25, 2010 19,559,000$ 20,268,000$
California Infrastructure and Development Bank Revenue
Bond Series 2010 Tax-exempt Variable Rate Demand
Revenue Bonds ("Series 2010 Bonds"); interest at 0.08%
at December 31, 2011 and 0.33% at December 25, 2010 14,075,000 14,486,000
Note payable from Sarnoff to bank, collateralized by
equipment, interest at 7.75% on $138,000 and interest
at 8.5% on $63,000, matured in August 2011. - 201,000
Notes payable from Averatek to its minority investor, CSL,
interest at 4.73% on $674,000, 3.2% on $672,000, 2.87%
on $297,000, 2.66% on $72,000, 2.64% on $48,000,
2.82% on $206,000, 2.7% on $266,000, 1.59% on
$102,000, 1.53% on 239,000 and 2.0% on $55,000. 2,631,000 2,494,000
Notes payable from Averatek to bank, collateralized by
equipment, interest at 5.99% payable in monthly
installments through 2014 517,000 726,000
Total principal amounts 36,782,000 38,175,000
Less: Current installments 33,825,000 35,149,000
Long-term debt, excluding current installments 2,957,000$ 3,026,000$

SRI International and SubsidiariesNotes to Consolidated Financial StatementsDecember 31, 2011 and December 25, 2010
12
The Series 2003A bonds and Series 2010 bonds are subject to optional and mandatory sinkingfund redemption and optional and mandatory tender for purchase at any time they remain at avariable interest rate. The bonds are subject to conversion to a term interest rate and mandatorytender upon such conversion. The Series 2003A bonds are subject to mandatory redemption bylot, from sinking fund payments on September 1, annually through 2028. The Series 2010 bondsare subject to mandatory redemption by lot, from sinking fund payments on September 1, 2011through 2031.
SRI has no obligation to make any direct payments with respect to bonds tendered for purchase.The purchase price of bonds tendered is payable only from the proceeds of the remarketing ofsuch bonds and from amounts from bank letters of credit, currently with Wells Fargo bank. Theletters of credit were issued to ensure payment of the bonds to the holders and to enhance thecredit rating and marketability of the bonds. Under the bank letters of credit agreements SRI wouldbe obligated to reimburse Wells Fargo for any bonds tendered to Wells Fargo. The available bankletter of credit is $20,288,000 on the Series 2003A bonds and $14,776,000 on the Series 2010bonds with no amounts drawn against either letter of credit at December 31, 2011 and 2010. Theletters of credit expire on September 1, 2012. SRI is required to present its bond obligations as acurrent liability because the letters of credit contains a subjective acceleration clause.
Under the terms of the various agreements entered into in connection with the issuance of thebonds, SRI must comply with certain covenants including maintenance of corporate existence;maintenance of records and filing of financial statements; payment of taxes, utilities and othercharges; maintenance of tax-exempt status of interest on the bonds. In addition, Wells Fargo canaccelerate the debt in the event of any breach of material terms, covenants or agreements, anyimpairment of the collateral or proceeds or any material adverse change that Wells Fargo believesimpairs or is substantially likely to impair repayment or performance by SRI. At December 31,2011, SRI is in compliance with its covenants.
Line of CreditAs of December 31, 2011 and December 25, 2010, SRI has an available line of credit of$20,217,000 and $12,300,000, respectively, with Wells Fargo Bank. There was no amountoutstanding as of December 31, 2011 and $10,962,000 outstanding as of December 25, 2010.Borrowings under the line are collateralized by real property. The interest rate on the line of creditas of December 31, 2011 and December 25, 2010 was LIBOR plus 1.5%. The line of creditexpires on September 1, 2012.
SRI’s line of credit contains restrictive covenants which require, among other items, themaintenance of defined levels of capital, liabilities to total capital, net excess of revenues overexpenses, and earnings. In addition, these covenants limit capital expenditures, loans, advancesand investments. At December 31, 2011, SRI is in compliance with its covenants.
Based on the borrowing rates currently available to SRI for loans with similar terms and averagematurities, the carrying value of long term debt approximated fair value as of December 31, 2011and December 25, 2010, respectively.

SRI International and SubsidiariesNotes to Consolidated Financial StatementsDecember 31, 2011 and December 25, 2010
13
Maturities of debt as of December 31, 2011 were as follows:
7. Other Noncurrent Liabilities
Other noncurrent liabilities as of December 31, 2011 and December 25, 2010 consist of thefollowing:
2012 33,825,000$
2013 219,000
2014 107,000
2015 -
2016 -
Thereafter 2,631,000
36,782,000$
December 31, December 25,
2011 2010
Insurance claim payable -$ 900,000$
Long term asset retirement obligation 6,560,000 6,284,000
Unrecognized tax benefits - 2,867,000
Long term lease obligation 2,690,000 2,960,000
Client advances 218,000 4,480,000
Liability under deferred benefit plan - 159,000
Other - 517,000
9,468,000$ 18,167,000$
SRI International and SubsidiariesNotes to Consolidated Financial StatementsDecember 31, 2011 and December 25, 2010
14
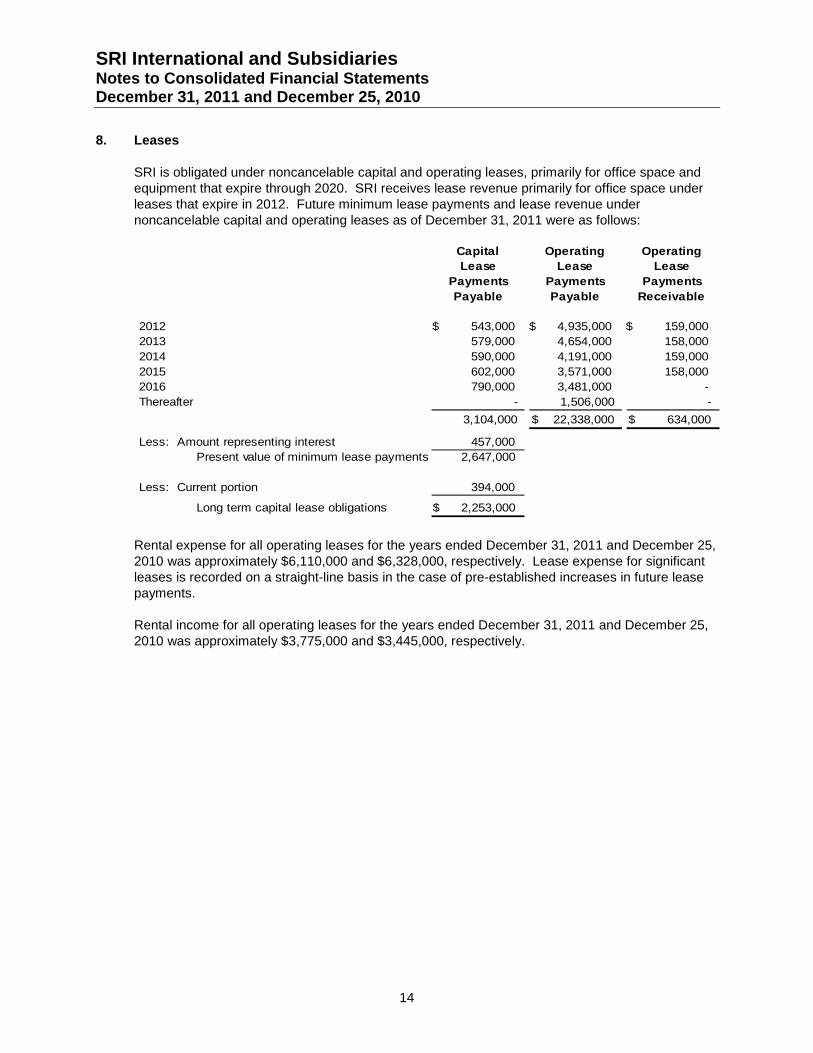
8. Leases
SRI is obligated under noncancelable capital and operating leases, primarily for office space andequipment that expire through 2020. SRI receives lease revenue primarily for office space underleases that expire in 2012. Future minimum lease payments and lease revenue undernoncancelable capital and operating leases as of December 31, 2011 were as follows:
Rental expense for all operating leases for the years ended December 31, 2011 and December 25,2010 was approximately $6,110,000 and $6,328,000, respectively. Lease expense for significantleases is recorded on a straight-line basis in the case of pre-established increases in future leasepayments.
Rental income for all operating leases for the years ended December 31, 2011 and December 25,2010 was approximately $3,775,000 and $3,445,000, respectively.
Capital Operating Operating
Lease Lease Lease
Payments Payments Payments
Payable Payable Receivable
2012 543,000$ 4,935,000$ 159,000$
2013 579,000 4,654,000 158,000
2014 590,000 4,191,000 159,000
2015 602,000 3,571,000 158,000
2016 790,000 3,481,000 -
Thereafter - 1,506,000 -
3,104,000 22,338,000$ 634,000$
Less: Amount representing interest 457,000
Present value of minimum lease payments 2,647,000
Less: Current portion 394,000
Long term capital lease obligations 2,253,000$

SRI International and SubsidiariesNotes to Consolidated Financial StatementsDecember 31, 2011 and December 25, 2010
15
9. Income Taxes
Income tax benefit (expense) consists of:
The income tax expense attributable to pre-tax income differs from the amounts computed byapplying the U.S. federal income tax rate of 34% to pretax income primarily as a result of theportions of SRI income exempt from income taxes and changes in the deferred tax valuationallowance. Substantially all income tax expense and deferred tax assets and liabilities are relatedto Sarnoff.
December 31, December 25,
2011 2010
Current
U.S. federal 8,000$ 384,000$
State 56,000 (72,000)
Foreign 2,867,000 250,000
2,931,000 562,000
Deferred
U.S. federal - 4,385,000
State - 1,129,000
- 5,514,000
Total income tax benefit (expense) 2,931,000$ 6,076,000$

SRI International and SubsidiariesNotes to Consolidated Financial StatementsDecember 31, 2011 and December 25, 2010
16
Deferred tax assets and deferred tax liabilities consist of the following as of December 31, 2011and December 25, 2010:
As of December 25, 2010, Sarnoff has net operating loss carryforwards for federal and stateincome tax purposes of approximately $40,720,000 and $42,884,000, respectively, which areavailable to offset future taxable income, if any, and expire beginning in 2011. The dissolution ofSarnoff and transfer of assets into SRI resulted in utilization of $6,396,000 of net operating losscarryforwards and approximately $34,375,000 from Sarnoff operations remain available to SRI. AtDecember 31, 2011, SRI, including those transferred from Sarnoff, has net operating losscarryforwards for federal and state income tax purposes of approximately $91,172,000 and$23,395,000, respectively, which are available to offset future taxable income, if any, and expirebeginning in 2013. SRI has determined, based upon the weight of available evidence, that it ismore likely than not that a significant portion of the net deferred tax assets will not be realized and,accordingly, have provided a valuation allowance. During the years ended December 31, 2011and December 25, 2010 the valuation allowance decreased by $2,268,000 and $9,155,000,respectively, on a consolidated basis.
SRI recognizes interest and penalties as incurred within income tax expense in the consolidatedstatements of activities and unrestricted net assets. During the years ended December 31, 2011and December 25, 2010, SRI’s liability for unrecognized tax benefits decreased by $269,000 andincreased by $131,000, respectively, for interest costs.
As of December 31, 2011, Sarnoff and SRI Holdings are no longer a part of SRI’s consolidatedgroup for income tax reporting purposes. Tax attributes associated with the Sarnoff merger areabsorbed by the consolidated group.
December 31, December 25,
2011 2010
Net operating loss carryforwards 33,254,000$ 35,507,000$
Patents 3,483,000
Investments 116,000
Vacation provision 255,000
Accounts receivable 85,000
Inventory 275,000
Property, plant, and equipment 1,493,000 1,569,000
Other liabilities 1,505,000
Tax credits and carryforwards 340,000
Total gross deferred tax assets 34,747,000 43,135,000
Valuation allowance (34,747,000) (37,015,000)
Deferred tax assets - 6,120,000
Less: Deferred tax liabilities
Property and equipment 5,514,000
Other 606,000
Deferred tax liabilities - 6,120,000
Net deferred tax liabilities -$ -$
SRI International and SubsidiariesNotes to Consolidated Financial StatementsDecember 31, 2011 and December 25, 2010
17
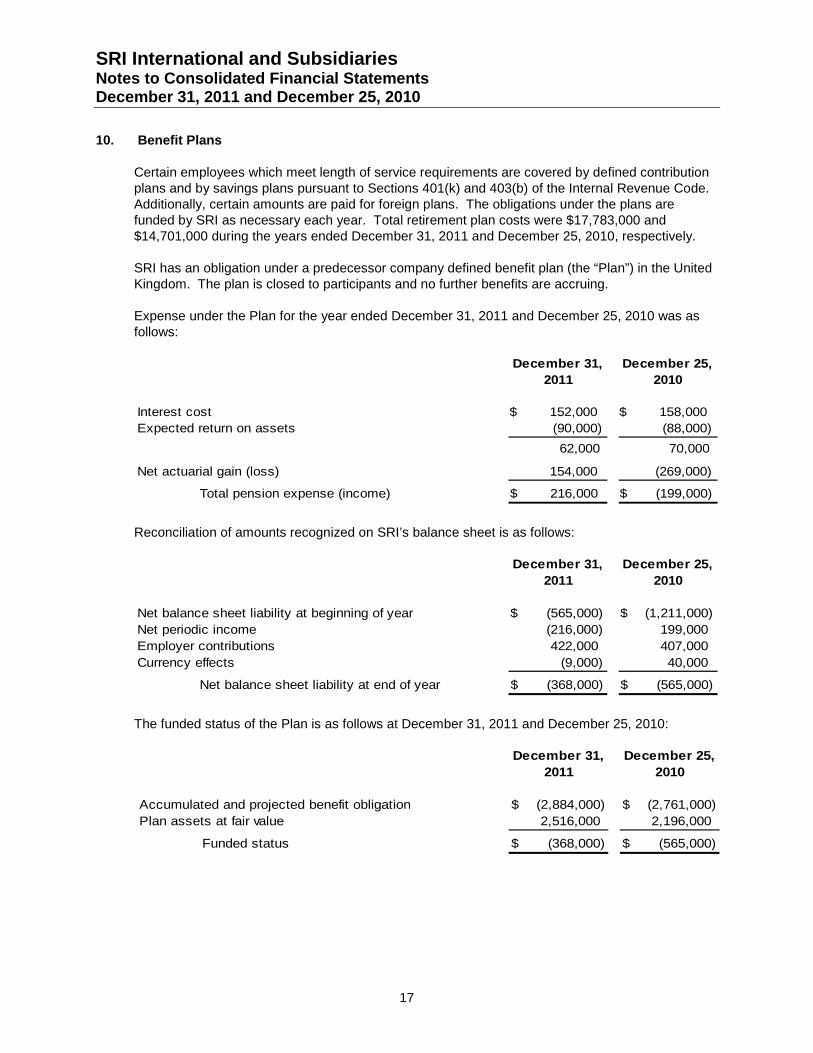
10. Benefit Plans
Certain employees which meet length of service requirements are covered by defined contributionplans and by savings plans pursuant to Sections 401(k) and 403(b) of the Internal Revenue Code.Additionally, certain amounts are paid for foreign plans. The obligations under the plans arefunded by SRI as necessary each year. Total retirement plan costs were $17,783,000 and$14,701,000 during the years ended December 31, 2011 and December 25, 2010, respectively.
SRI has an obligation under a predecessor company defined benefit plan (the “Plan”) in the UnitedKingdom. The plan is closed to participants and no further benefits are accruing.
Expense under the Plan for the year ended December 31, 2011 and December 25, 2010 was asfollows:
Reconciliation of amounts recognized on SRI’s balance sheet is as follows:
The funded status of the Plan is as follows at December 31, 2011 and December 25, 2010:
December 31, December 25,
2011 2010
Interest cost 152,000$ 158,000$
Expected return on assets (90,000) (88,000)
62,000 70,000
Net actuarial gain (loss) 154,000 (269,000)
Total pension expense (income) 216,000$ (199,000)$
December 31, December 25,
2011 2010
Net balance sheet liability at beginning of year (565,000)$ (1,211,000)$
Net periodic income (216,000) 199,000
Employer contributions 422,000 407,000
Currency effects (9,000) 40,000
Net balance sheet liability at end of year (368,000)$ (565,000)$
December 31, December 25,
2011 2010
Accumulated and projected benefit obligation (2,884,000)$ (2,761,000)$
Plan assets at fair value 2,516,000 2,196,000
Funded status (368,000)$ (565,000)$
SRI International and SubsidiariesNotes to Consolidated Financial StatementsDecember 31, 2011 and December 25, 2010
18
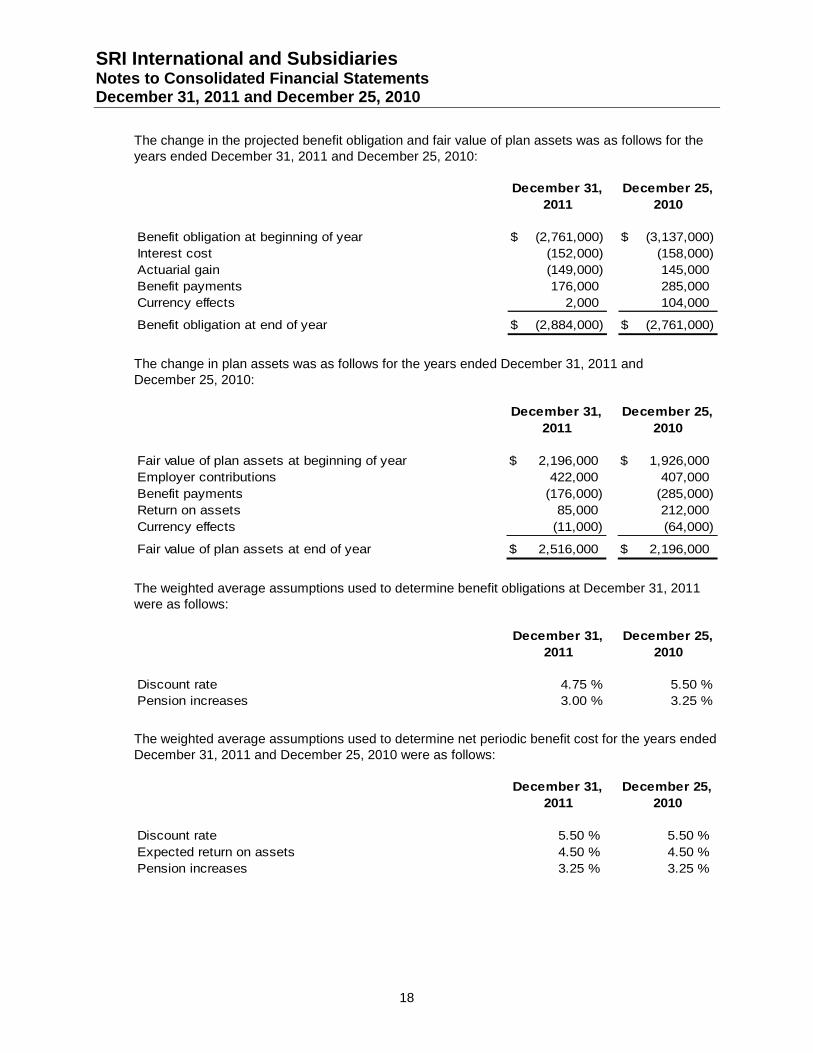
The change in the projected benefit obligation and fair value of plan assets was as follows for theyears ended December 31, 2011 and December 25, 2010:
The change in plan assets was as follows for the years ended December 31, 2011 andDecember 25, 2010:
The weighted average assumptions used to determine benefit obligations at December 31, 2011were as follows:
The weighted average assumptions used to determine net periodic benefit cost for the years endedDecember 31, 2011 and December 25, 2010 were as follows:
December 31, December 25,
2011 2010
Benefit obligation at beginning of year (2,761,000)$ (3,137,000)$
Interest cost (152,000) (158,000)
Actuarial gain (149,000) 145,000
Benefit payments 176,000 285,000
Currency effects 2,000 104,000
Benefit obligation at end of year (2,884,000)$ (2,761,000)$
December 31, December 25,
2011 2010
Fair value of plan assets at beginning of year 2,196,000$ 1,926,000$
Employer contributions 422,000 407,000
Benefit payments (176,000) (285,000)
Return on assets 85,000 212,000
Currency effects (11,000) (64,000)
Fair value of plan assets at end of year 2,516,000$ 2,196,000$
December 31, December 25,
2011 2010
Discount rate 4.75 % 5.50 %
Pension increases 3.00 % 3.25 %
December 31, December 25,
2011 2010
Discount rate 5.50 % 5.50 %
Expected return on assets 4.50 % 4.50 %
Pension increases 3.25 % 3.25 %

SRI International and SubsidiariesNotes to Consolidated Financial StatementsDecember 31, 2011 and December 25, 2010
19
Plan assets consist of equity and debt securities and are considered Level 1 investments. Theactual and target allocations were as follows as of December 31, 2011 and December 25, 2010:
Expected benefit payments as of December 31, 2011 and December 25, 2010 are as follows:
The Plan’s investment strategy involves investing in a mix of UK and overseas equity and debtsecurities to fully fund plan commitments over the next ten years. Expected returns are derivedbased upon the existing allocation and historical results of the Plan assets.
11. Commitments and Contingencies
SRI has outstanding standby letters of credit as performance bonds in the amount of $39,493,000and $37,616,000 as of December 31, 2011 and December 25, 2010, respectively.
Substantial amounts are received and expended by SRI under federal awards and are subject toaudit by governmental agencies. The regulations governing federal awards are complex and canbe subject to varying interpretations. Indirect costs are recorded based upon provisional ratesthroughout the year and are adjusted based upon actual audited costs and have been approvedthrough 2005. Audits of incurred costs by governmental agencies have been completed through2006, although final resolution has not been received from the applicable awarding agency. SRIrecently became aware that, in certain instances, its system of internal control may not have fullycomplied with the requirements to monitor subrecipients. It is possible that certain subrecipientcosts may not be allowable if the subrecipient did not comply with the applicable federalrequirements.
Actual % Target % Actual % Target %
Equity 77.0 % 25.0 % 31.0 % 30.0 %
Debt 22.0 75.0 68.0 70.0
Other 1.0 0.0 1.0 0.0
100.0 % 100.0 % 100.0 % 100.0 %
December 31,
2011December 25,
2010
December 31, December 25,
2011 2010
Year ending December,
2012 176,000$ 175,000$
2013 181,000 179,000
2014 655,000 184,000
2015 193,000 684,000
2016 519,000 196,000
2017–2021 1,709,000 1,903,000
SRI International and SubsidiariesNotes to Consolidated Financial StatementsDecember 31, 2011 and December 25, 2010
20
SRI has made provisions for known and estimable exposures related to federal awards. However,given the inherent complexities in administering federal awards, it is possible that theaforementioned matters could result in disallowances in excess of the amounts provided, and thatthese differences could be material.
SRI is also involved in various claims and legal actions arising in the ordinary course of business.In the opinion of management, the ultimate disposition of these matters will not have a materialeffect on SRI’s consolidated financial position.
SRI enters into guarantees and provides limited indemnifications in the ordinary course ofbusiness, such as to its Board in connection with their service on the Board. Based upon thenature of indemnifications provided, management has determined they have minimal value. AsSRI has not entered into significant guarantees, no amounts have been provided in theaccompanying financial statements.
Under the terms of an indemnification agreement dated March 31, 1987 between SRI and GeneralElectric (“GE”), SRI and Sarnoff were indemnified for all claims, losses, damages or expenseswhich resulted from the operation of Sarnoff prior to March 31, 1987. One environmental matterexists that may require SRI to pursue its indemnification with GE. In particular, SRI is aware of alaboratory incinerator ash dump area that may require remediation at some future date. Estimatesof the cost of remediation range from $1,000,000 to $8,000,000. As the pollution on this siteoccurred prior to the March 31, 1987 donation agreement, SRI believes that GE, through theindemnification, or through other claims, will be held accountable for this remediation.Management of SRI cannot estimate the potential outcome of other environmental matters on theproperty.
12. Related Party Transactions
Under a separation agreement with Stanford University (“Stanford”), SRI is required to payStanford one half of 1% of its (and its subsidiaries’) gross revenue from operations, less certainexclusions. Expense to Stanford under the separation agreement amounted to $2,092,000 and$1,791,000 for the years ended December 31, 2011 and December 25, 2010, respectively, ofwhich $2,092,000 and $1,791,000 were outstanding at year end, respectively. Receivables fromStanford amounted to $146,000 and $87,000 as of December 31, 2011 and December 25, 2010,respectively. In addition, for the year ended December 31, 2011, awards amounting to $2,387,000and $1,346,000 were made to and received from Stanford. Additionally, awards amounting to$2,070,000 and $968,000 were made to and received from Stanford for the year ended December25, 2010. SRI has a lease arrangement through 2012 with Stanford for research space. Leaseincome for the year ended December 31, 2011 and December 25, 2010 amounted to $1,868,000and $1,868,000, respectively. SRI has a common board member with Stanford.
SRI also has a common board member with Nuance Communications and held shares of Nuancestock valued at $12,666,000 and $11,030,000 as of December 31, 2011 and December 25, 2010,respectively.

SRI International and SubsidiariesNotes to Consolidated Financial StatementsDecember 31, 2011 and December 25, 2010
21
SRI had contract revenue of approximately $29,000 and $161,000 from investee companies for theyears ended December 31, 2011 and December 25, 2010, respectively, with a related receivablebalance of $51,000 as of December 25, 2010 and no receivable outstanding at December 31,2011. Agile TV (Promptu Systems) leases space from the Menlo Park office of SRI. SRI receivedrental and other service income from Agile TV totaling $170,000 and $167,000 for the years endedDecember 31, 2011 and December 25, 2010, respectively. SRI also has an investment in thisentity of $40,000 as of December 31, 2011 and December 25, 2010. During 2010, Sarnoff had acommon board member with Agile TV.
13. Subsequent Events
SRI has evaluated subsequent events through April 25, 2012, which is the date the consolidatedfinancial statements were available to be issued.
Supplementary Schedules of Consolidating Information

SRI International and SubsidiariesConsolidating Schedule – Balance Sheet InformationDecember 31, 2011
22
Consolidated
SRI Averatek Eliminations Total
Assets
Current assets
Cash and cash equivalents 83,741,000$ 63,000$ -$ 83,804,000$
Restricted cash and cash equivalents 1,352,000 - - 1,352,000
Investments 12,712,000 - - 12,712,000
Receivables, net 116,055,000 219,000 - 116,274,000
Inventory 3,868,000 - - 3,868,000
Prepaid expenses and other assets 5,929,000 11,000 - 5,940,000
Total current assets 223,657,000 293,000 - 223,950,000
Property and equipment, net 108,809,000 1,264,000 - 110,073,000
Other noncurrent assets, net 9,414,000 921,000 - 10,335,000
Total assets 341,880,000$ 2,478,000$ -$ 344,358,000$
Liabilities and Unrestricted Net Assets
Current liabilities
Accounts payable and accrued expenses 77,371,000$ 151,000$ -$ 77,522,000$
Client advances and credits 27,904,000 - - 27,904,000
Current portion of capital lease obligations 394,000 - - 394,000
Current installments of long-term debt 33,634,000 191,000 - 33,825,000
Total current liabilities 139,303,000 342,000 - 139,645,000
Long-term portion of capital leases obligations 2,253,000 - - 2,253,000
Long-term debt, excluding current installments 3,502,000 5,638,000 (6,183,000) 2,957,000
Other noncurrent liabilities 9,468,000 - - 9,468,000
Total liabilities 154,526,000 5,980,000 (6,183,000) 154,323,000
Unrestricted net assets 187,354,000 (3,502,000) 6,183,000 190,035,000
Total liabilities and net assets 341,880,000$ 2,478,000$ -$ 344,358,000$

SRI International and SubsidiariesConsolidating Schedule – Balance Sheet InformationDecember 25, 2010
23
Consolidated
SRI SRI Holdings Averatek Sarnoff Eliminations Total
Assets
Current assets
Cash and cash equivalents 83,431,000$ 6,000$ 379,000$ 7,938,000$ -$ 91,754,000$
Restricted cash and cash equivalents 9,039,000 - - - - 9,039,000
Investments 11,056,000 - - - - 11,056,000
Receivables, net 90,851,000 - - 10,801,000 (3,873,000) 97,779,000
Inventory 446,000 - - 1,559,000 - 2,005,000
Prepaid expenses and other assets 4,551,000 - 91,000 2,876,000 - 7,518,000
Total current assets 199,374,000 6,000 470,000 23,174,000 (3,873,000) 219,151,000
Investments in subsidiaries 38,031,000 - - - (38,031,000) -
Property and equipment, net 78,169,000 - 1,731,000 29,829,000 - 109,729,000
Other noncurrent assets, net 7,275,000 - 921,000 3,081,000 - 11,277,000
Total assets 322,849,000$ 6,000$ 3,122,000$ 56,084,000$ (41,904,000)$ 340,157,000$
Liabilities and Unrestricted Net Assets
Current liabilities
Accounts payable and accrued expenses 68,040,000$ -$ 11,000$ 15,838,000$ (3,873,000)$ 80,016,000$
Line of credit 10,962,000 - - - - 10,962,000
Client advances and credits 14,487,000 - - 57,000 - 14,544,000
Current portion of capital lease obligations 404,000 - - - - 404,000
Current installments of long-term debt 34,754,000 - 194,000 201,000 - 35,149,000
Total current liabilities 128,647,000 - 205,000 16,096,000 (3,873,000) 141,075,000
Long-term portion of capital lease obligations 2,682,000 - - - - 2,682,000
Long-term debt, excluding current installments 42,047,000 39,403,000 5,567,000 - (83,991,000) 3,026,000
Other noncurrent liabilities 16,210,000 - - 1,957,000 - 18,167,000
Total liabilities 189,586,000 39,403,000 5,772,000 18,053,000 (87,864,000) 164,950,000
Unrestricted net assets 133,263,000 (39,397,000) (2,650,000) 38,031,000 45,960,000 175,207,000
Total liabilities and net assets 322,849,000$ 6,000$ 3,122,000$ 56,084,000$ (41,904,000)$ 340,157,000$
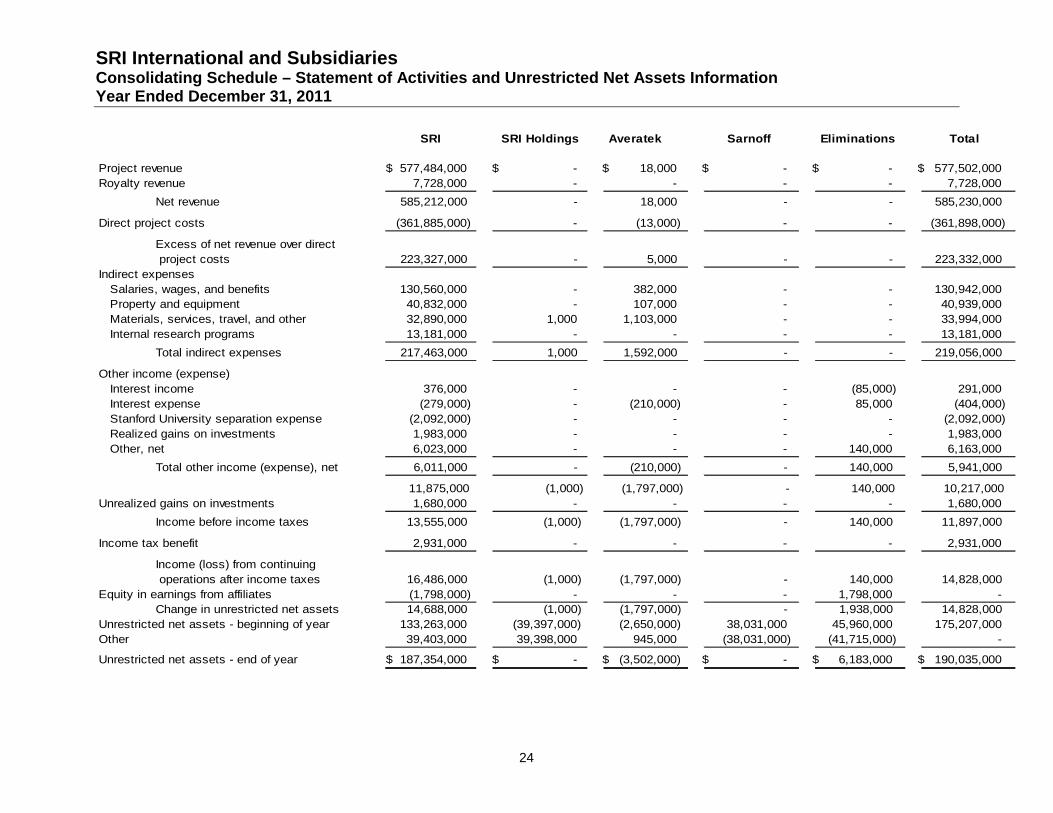
SRI International and SubsidiariesConsolidating Schedule – Statement of Activities and Unrestricted Net Assets InformationYear Ended December 31, 2011
24
SRI SRI Holdings Averatek Sarnoff Eliminations Total
Project revenue 577,484,000$ -$ 18,000$ -$ -$ 577,502,000$
Royalty revenue 7,728,000 - - - - 7,728,000
Net revenue 585,212,000 - 18,000 - - 585,230,000
Direct project costs (361,885,000) - (13,000) - - (361,898,000)
Excess of net revenue over direct
project costs 223,327,000 - 5,000 - - 223,332,000
Indirect expenses
Salaries, wages, and benefits 130,560,000 - 382,000 - - 130,942,000
Property and equipment 40,832,000 - 107,000 - - 40,939,000
Materials, services, travel, and other 32,890,000 1,000 1,103,000 - - 33,994,000
Internal research programs 13,181,000 - - - - 13,181,000
Total indirect expenses 217,463,000 1,000 1,592,000 - - 219,056,000
Other income (expense)
Interest income 376,000 - - - (85,000) 291,000
Interest expense (279,000) - (210,000) - 85,000 (404,000)
Stanford University separation expense (2,092,000) - - - - (2,092,000)
Realized gains on investments 1,983,000 - - - - 1,983,000
Other, net 6,023,000 - - - 140,000 6,163,000
Total other income (expense), net 6,011,000 - (210,000) - 140,000 5,941,000
11,875,000 (1,000) (1,797,000) - 140,000 10,217,000
Unrealized gains on investments 1,680,000 - - - - 1,680,000
Income before income taxes 13,555,000 (1,000) (1,797,000) - 140,000 11,897,000
Income tax benefit 2,931,000 - - - - 2,931,000
Income (loss) from continuing
operations after income taxes 16,486,000 (1,000) (1,797,000) - 140,000 14,828,000
Equity in earnings from affiliates (1,798,000) - - - 1,798,000 -
Change in unrestricted net assets 14,688,000 (1,000) (1,797,000) - 1,938,000 14,828,000
Unrestricted net assets - beginning of year 133,263,000 (39,397,000) (2,650,000) 38,031,000 45,960,000 175,207,000
Other 39,403,000 39,398,000 945,000 (38,031,000) (41,715,000) -
Unrestricted net assets - end of year 187,354,000$ -$ (3,502,000)$ -$ 6,183,000$ 190,035,000$

SRI International and SubsidiariesConsolidating Schedule – Statement of Activities and Unrestricted Net Assets InformationYear Ended December 25, 2010
25
SRI SRI Holdings Averatek Sarnoff Eliminations Total
Project revenue 401,058,000$ -$ -$ 94,532,000$ (608,000)$ 494,982,000$
Royalty revenue 7,491,000 - - 280,000 - 7,771,000
Net revenue 408,549,000 - - 94,812,000 (608,000) 502,753,000
Direct project costs (251,963,000) - (11,000) (40,240,000) 608,000 (291,606,000)
Excess of net revenue over direct
project costs 156,586,000 - (11,000) 54,572,000 - 211,147,000
Indirect expenses
Salaries, wages, and benefit 97,742,000 - 769,000 31,871,000 - 130,382,000
Property and equipment 29,394,000 - 70,000 11,827,000 (226,000) 41,065,000
Materials, services, travel, and other 21,938,000 1,000 618,000 12,232,000 - 34,789,000
Internal research programs 7,958,000 - - - - 7,958,000
Total indirect expenses 157,032,000 1,000 1,457,000 55,930,000 (226,000) 214,194,000
Other income (expense)
Interest income 492,000 - - 1,000 (95,000) 398,000
Interest expense (488,000) - (194,000) (218,000) 95,000 (805,000)
Stanford University separation expense (1,604,000) - - (187,000) - (1,791,000)
Restructuring expense (3,562,000) - - (1,206,000) - (4,768,000)
Other, net 32,840,000 (3,000) - 310,000 432,000 33,579,000
Total other income (expense), net 27,678,000 (3,000) (194,000) (1,300,000) 432,000 26,613,000
27,232,000 (4,000) (1,662,000) (2,658,000) 658,000 23,566,000
Equity in earnings from affiliates (678,000) - - - - (678,000)
Unrealized gains on investments 465,000 - - - - 465,000
Income before income taxes 27,019,000 (4,000) (1,662,000) (2,658,000) 658,000 23,353,000
Income tax benefit (expense) 250,000 (1,000) - 5,827,000 - 6,076,000
Income (loss) from continuing
operations after income taxes 27,269,000 (5,000) (1,662,000) 3,169,000 658,000 29,429,000
Equity in earnings from affiliates 1,502,000 - - - (1,502,000) -
Change in unrestricted net assets 28,771,000 (5,000) (1,662,000) 3,169,000 (844,000) 29,429,000
Unrestricted net assets - beginning of year 104,492,000 (39,627,000) (1,583,000) 34,862,000 47,634,000 145,778,000
Other - 235,000 595,000 - (830,000) -
Unrestricted net assets - end of year 133,263,000$ (39,397,000)$ (2,650,000)$ 38,031,000$ 45,960,000$ 175,207,000$

SRI International and SubsidiariesConsolidating Schedule – Cash Flow InformationYear Ended December 31, 2011
26
2011
Consolidated
SRI SRI Holdings Averatek Eliminations Balance
Cash flows from operating activities
Change in unrestricted net assets 14,688,000$ (1,000)$ (1,797,000)$ 1,938,000$ 14,828,000$
Adjustments to reconcile change in unrestricted net assets
to net cash provided by (used in) operating activities
Equity in earnings of affiliates 1,798,000 - - (1,798,000) -
Depreciation and amortization 17,946,000 - 469,000 - 18,415,000
Provision for doubtful accounts (361,000) - - - (361,000)
Gain on investments (3,663,000) - - - (3,663,000)
Loss on sale of property and equipment 23,000 - - - 23,000
Changes in operating asset and liabilities
Restricted cash and cash equivalents 7,687,000 - - - 7,687,000
Receivables, net (16,746,000) - (219,000) - (16,965,000)
Inventories and consumable supplies (1,863,000) - - - (1,863,000)
Prepaid expenses and other assets 981,000 - 80,000 - 1,061,000
Other noncurrent assets, net 194,000 - - - 194,000
Accounts payable and accrued expenses 989,000 - 140,000 - 1,129,000
Clients’ advances and credits 13,360,000 - - - 13,360,000
Other noncurrent liabilities (7,282,000) - 169,000 (85,000) (7,198,000)
Net cash provided by (used in) operating activities 27,751,000 (1,000) (1,158,000) 55,000 26,647,000
Cash flows from investing activities
Purchase of investments (100,000) - - - (100,000)
Sale and maturity of investments 2,007,000 - - - 2,007,000
Capital expenditures (18,782,000) - (2,000) - (18,784,000)
Proceeds from sale of property and equipment 2,000 - - - 2,000
Net cash provided by (used in) investing activities (16,873,000) - (2,000) - (16,875,000)
Cash flows from financing activities
Proceeds from issuance of long-term debt - - 110,000 (55,000) 55,000
Principal payments of long-term debt (1,373,000) - (211,000) - (1,584,000)
Payments under capital lease (439,000) - - - (439,000)
Change in bank overdraft (4,792,000) - (4,792,000)
(Payments) proceeds from line of credit , net (10,962,000) - - (10,962,000)
Capital contribution (940,000) (5,000) 945,000 -
Net cash provided by (used in) financing activities (18,506,000) (5,000) 844,000 (55,000) (17,722,000)
Net increase (decrease) in cash and cash equivalents (7,628,000) (6,000) (316,000) - (7,950,000)
Cash and cash equivalents, beginning of year 91,369,000 6,000 379,000 91,754,000
Cash and cash equivalents, end of year 83,741,000$ -$ 63,000$ -$ 83,804,000$
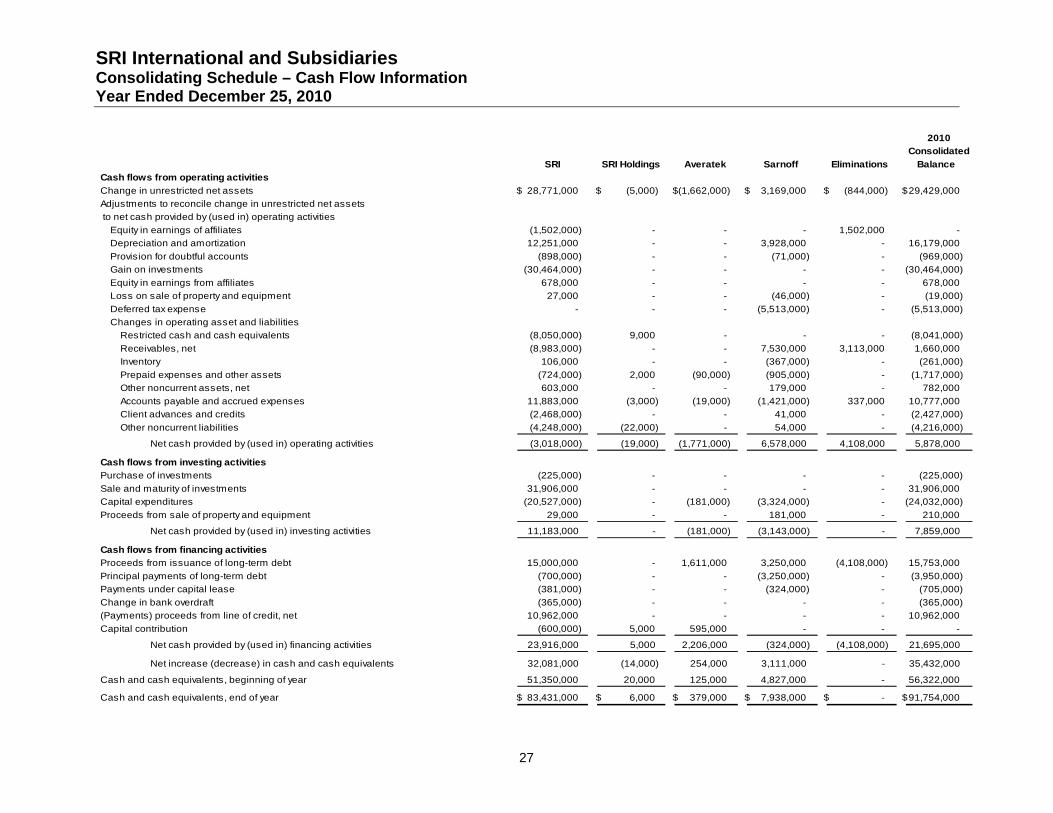
SRI International and SubsidiariesConsolidating Schedule – Cash Flow InformationYear Ended December 25, 2010
27
2010
Consolidated
SRI SRI Holdings Averatek Sarnoff Eliminations Balance
Cash flows from operating activities
Change in unrestricted net assets 28,771,000$ (5,000)$ (1,662,000)$ 3,169,000$ (844,000)$ 29,429,000$
Adjustments to reconcile change in unrestricted net assets
to net cash provided by (used in) operating activities
Equity in earnings of affiliates (1,502,000) - - - 1,502,000 -
Depreciation and amortization 12,251,000 - - 3,928,000 - 16,179,000
Provision for doubtful accounts (898,000) - - (71,000) - (969,000)
Gain on investments (30,464,000) - - - - (30,464,000)
Equity in earnings from affiliates 678,000 - - - - 678,000
Loss on sale of property and equipment 27,000 - - (46,000) - (19,000)
Deferred tax expense - - - (5,513,000) - (5,513,000)
Changes in operating asset and liabilities
Restricted cash and cash equivalents (8,050,000) 9,000 - - - (8,041,000)
Receivables, net (8,983,000) - - 7,530,000 3,113,000 1,660,000
Inventory 106,000 - - (367,000) - (261,000)
Prepaid expenses and other assets (724,000) 2,000 (90,000) (905,000) - (1,717,000)
Other noncurrent assets, net 603,000 - - 179,000 - 782,000
Accounts payable and accrued expenses 11,883,000 (3,000) (19,000) (1,421,000) 337,000 10,777,000
Client advances and credits (2,468,000) - - 41,000 - (2,427,000)
Other noncurrent liabilities (4,248,000) (22,000) - 54,000 - (4,216,000)
Net cash provided by (used in) operating activities (3,018,000) (19,000) (1,771,000) 6,578,000 4,108,000 5,878,000
Cash flows from investing activities
Purchase of investments (225,000) - - - - (225,000)
Sale and maturity of investments 31,906,000 - - - - 31,906,000
Capital expenditures (20,527,000) - (181,000) (3,324,000) - (24,032,000)
Proceeds from sale of property and equipment 29,000 - - 181,000 - 210,000
Net cash provided by (used in) investing activities 11,183,000 - (181,000) (3,143,000) - 7,859,000
Cash flows from financing activities
Proceeds from issuance of long-term debt 15,000,000 - 1,611,000 3,250,000 (4,108,000) 15,753,000
Principal payments of long-term debt (700,000) - - (3,250,000) - (3,950,000)
Payments under capital lease (381,000) - - (324,000) - (705,000)
Change in bank overdraft (365,000) - - - - (365,000)
(Payments) proceeds from line of credit, net 10,962,000 - - - - 10,962,000
Capital contribution (600,000) 5,000 595,000 - - -
Net cash provided by (used in) financing activities 23,916,000 5,000 2,206,000 (324,000) (4,108,000) 21,695,000
Net increase (decrease) in cash and cash equivalents 32,081,000 (14,000) 254,000 3,111,000 - 35,432,000
Cash and cash equivalents, beginning of year 51,350,000 20,000 125,000 4,827,000 - 56,322,000
Cash and cash equivalents, end of year 83,431,000$ 6,000$ 379,000$ 7,938,000$ -$ 91,754,000$