spices form the basis of food pairing in indian cuisine › pdf › 1502.03815.pdf · other...
TRANSCRIPT

1
Spices form the basis of food pairing in Indian cuisine
Anupam Jaina,†, Rakhi N Kb,† and Ganesh Baglerb,*
Affiliations: aCentre for System Science, Indian Institute of Technology Jodhpur, Jodhpur, Rajasthan 342011,
India.
bCentre for Biologically Inspired System Science, Indian Institute of Technology Jodhpur,
Jodhpur, Rajasthan 342011, India.
†These authors contributed equally to this work *Corresponding author: E-mail: [email protected], [email protected]
Abstract
Culinary practices are influenced by climate, culture, history and geography. Molecular
composition of recipes in a cuisine reveals patterns in food preferences. Indian cuisine
encompasses a number of diverse sub-cuisines separated by geographies, climates and cultures. Its
culinary system has a long history of health-centric dietary practices focused on disease prevention
and promotion of health. We study food pairing in recipes of Indian cuisine to show that, in contrast
to positive food pairing reported in some Western cuisines, Indian cuisine has a strong signature
of negative food pairing; more the extent of flavor sharing between any two ingredients, lesser
their co-occurrence. This feature is independent of recipe size and is not explained by ingredient
category-based recipe constitution alone. Ingredient frequency emerged as the dominant factor
specifying the characteristic flavor sharing pattern of the cuisine. Spices, individually and as a
category, form the basis of ingredient composition in Indian cuisine. We also present a culinary
evolution model which reproduces ingredient use distribution as well as negative food pairing of
the cuisine. Our study provides a basis for designing novel signature recipes, healthy recipe
alterations and recipe recommender systems.
Introduction
Culinary practices are shaped by complex interplay of culture, climate, geography
and genetics (1–6). These factors influence food preferences and recipe composition, thereby
altering the fabric of cuisine. Recipe composition pattern in a cuisine provides a means for
investigating its gastronomic history and molecular constitution. The shift to cooked diet has been
proposed to be a trigger for increased brain size in humans (7). Indian culinary system has
traditionally developed dietary practices where food has nutritional as well as medicinal value (8–
10). Ayurveda, the classic medicinal system of India, proposes that food has as much therapeutic
value as drugs and even uses similar processing techniques for their preparation (11, 12).
2
In this study, we analyzed the recipe composition as well as flavor compound constitution of the
Indian cuisine in search of its quintessential features. Specifically, we quantified the food pairing
pattern and built models to identify features that explain statistical properties of the cuisine. The
flavor constitution of the Indian cuisine was explored for ingredient composition and food pairing
at the levels of cuisine, sub-cuisines, recipes and ingredient pairs. We built controls to probe for
the role of factors that may be crucial in shaping recipes and hence the cuisine. Further we
developed models to explain evolution of cuisine and its characteristic features. Our study
illustrates application of data analysis and modeling for exploring chemical basis of a cuisine.
Results
The Indian cuisine. The traditional recipes of Indian cuisine are documented in the form of books
(2) and lately through online repositories. We compiled the recipes data from TarlaDalal (13)
(http://www.tarladalal.com, November 2014), one of the largest, most extensive online repertoires
of original Indian recipes (SI Text). After curation, the Indian cuisine contained 2543 recipes from
following eight sub-cuisines: Bengali, Gujarati, Jain, Maharashtrian, Mughlai, Punjabi, Rajasthani
and South Indian. These sub-cuisines span diverse geographies, climates and cultures of Indian
subcontinent. After aliasing ingredient names, the recipes comprised of 194 unique ingredients (SI
Text and Dataset S1). The ingredients belong to following 15 categories: spice, vegetable, fruit,
plant derivative, nut/seed, cereal/crop, dairy, plant, pulse, herb, meat, fish/seafood, beverage,
animal product, and flower. Certain pulses (millets), lentils, spices and vegetables, seldom used in
other cuisines, were common to Indian cuisine (SI Text).
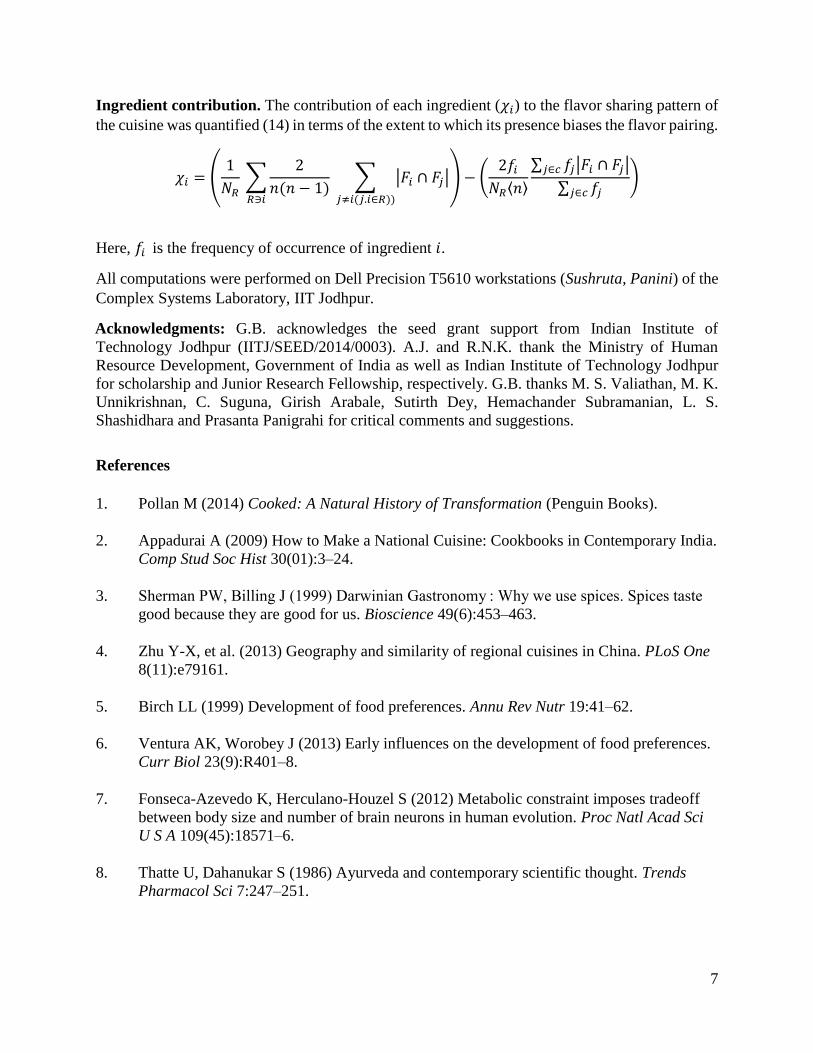
Recipe size distribution reflects the ingredient richness of recipes in the cuisine. Similar to other
cuisines (4, 14, 15), the recipe size distribution of Indian cuisine is bounded, varying between 1
and 40 with an average size of 7 (Fig. 1A). Mughlai sub-cuisine, with a royal lineage, had bimodal
distribution with exceptionally large recipe sizes. Ingredient frequency when plotted against rank,
by ordering ingredients according to their prevalence in the cuisine, reflects bias in use of
ingredients. The frequency-rank distribution of the Indian cuisine varies over three orders of
magnitude following a scale-free distribution (Fig. 1B). All sub-cuisines have strikingly similar
profiles, indicative of generic culinary growth mechanisms (Fig 1B, inset). A few ingredients are
excessively used, indicating either their inherent ‘fitness’ or possible accidental lock-in (15).
Knowing that many cuisines share this property (4, 14, 15), the question is whether pattern of use
of ingredients has any role in rendering the profile of a cuisine.
Food pairing is measured in terms of overlap of flavor profiles. The composition of recipes in
a cuisine could be studied in terms of co-occurrence of ingredients (14, 16). One of the notions
associated with ingredient co-occurrence is positive food pairing hypothesis— ingredients sharing
flavor compounds are more likely to taste well together than ingredients that do not (14, 17). While
this hypothesis holds true for some cuisines (North American, Western European and Latin
American), it does not hold for a few others (Southern European and East Asian) that have negative
food pairing (14). Thus, beyond following generic statistical patterns in recipe sizes as well as
ingredient use, skewed food pairing seems to be a unique feature representing molecular basis of
3
ingredient combinations dominant in a cuisine. Towards the aim of quantifying the pattern of
ingredient composition of recipes, we studied food pairing (sharing of flavor compounds) in Indian
cuisine.
While food sensation is a result of interplay between various aspects of ingredients, such as texture,
color, temperature and sound, flavor plays a dominant role in specifying culinary fitness of
ingredients and their combinations (18, 19). Flavor mediated food perception, primarily involving
molecular interactions with olfactory and gustatory receptors, is crucial in developing food
preferences in humans, and has coevolved with nutritional needs (20). Molecular composition of
food dictates the sensation of flavor (21). Each ingredient is characterized by a set of chemical
compounds which forms its flavor profile. Flavor profile provides us an effective tool for exploring
patterns in ingredient composition of recipes. We obtained the flavor profiles for all ingredients in
the Indian cuisine with the help of previously published data (14), a resource of flavor ingredients
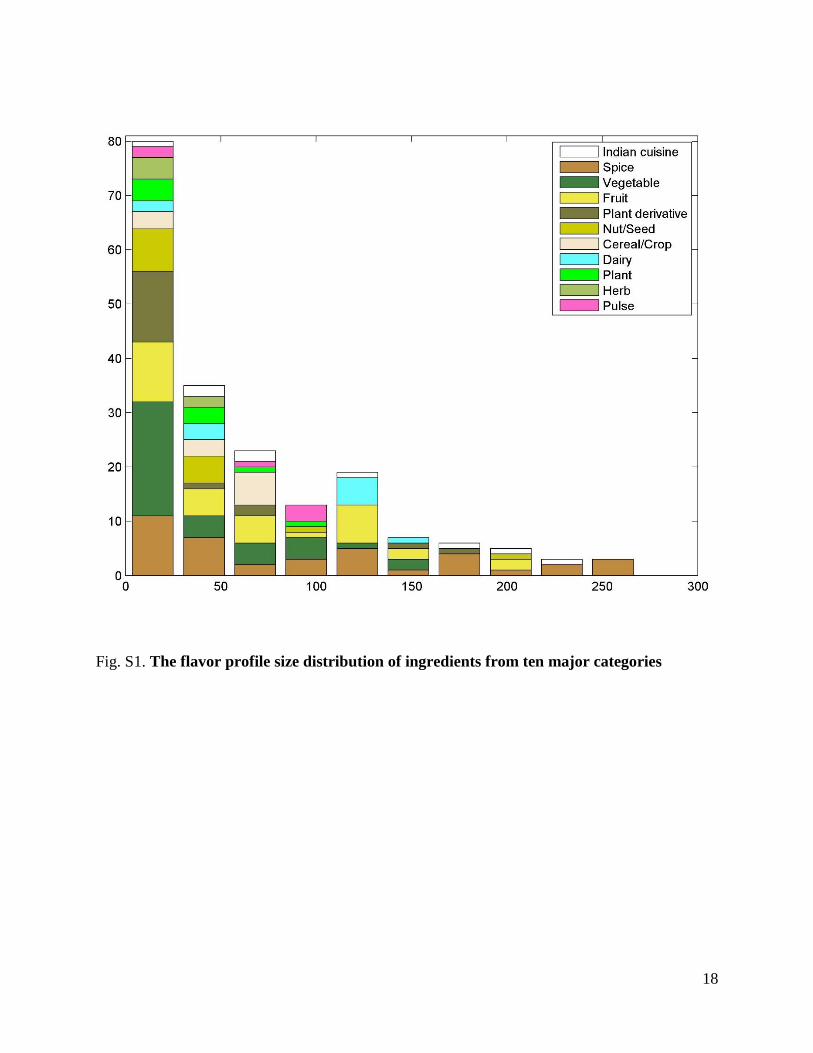
(21) and by extensive literature search (SI Text, Dataset S2). The flavor profiles, comprising of a
total of 1170 unique compounds, had a size range of 270. Across this range of profile size,
ingredient category representation was fairly uniform (Fig. S1).
The interrelationship among ingredients by virtue of shared flavor compounds could be
represented as a flavor graph that illustrates the underlying topology of flavor sharing (Fig. S2 and
S3). The ingredients have dominant intra-category flavor sharing indicating significant overlap of
flavor profiles within the category (Fig. S4). We quantified flavor sharing in a recipe (𝑁𝑠𝑅) and
average flavor sharing of the cuisine (𝑁𝑠̅̅ ̅) by comparing profiles of ingredient pairs and their joint
occurrence in recipes. Figure 2 illustrates this quantification procedure starting from data of recipes
and flavor profiles
Indian cuisine is characterized with strong negative food pairing. We found that average flavor
sharing in Indian cuisine was significantly lesser than expected by chance (Fig. 3A). When
computed for all recipes in the cuisine, average flavor sharing for Indian cuisine was found to be
5.876, as compared to that of 9.442 for a randomized cuisine, which was constructed by randomly
picking the ingredients while maintaining the recipe size distribution. This reflects a strong
signature of non-random ingredient co-occurrence (∆𝑁𝑠 = �̅�𝑠𝐼𝐶 − �̅�𝑠
𝑅𝑎𝑛𝑑 = -3.566 and Z-score of
-54.727) skewed towards negative food pairing (Fig.3B). This is corroborated by the pattern of
extent of flavor sharing between pairs of ingredients and their co-occurrence in the cuisine (Fig.
4A). More the extent of flavor sharing between any two ingredients in the Indian cuisine, lesser is
their co-occurrence. The extent of food pairing bias in the Indian cuisine is much stronger than
reported earlier for any other cuisine (14, 22) and is persistent regardless of the recipe size (Fig.
3A). Our analysis also showed that each of the sub-cuisines independently displayed negative food
pairing, highlighting it as an invariant feature of the Indian cuisine (Fig. 3B). Thus, we conclude
that the Indian cuisine is characterized with a strong negative food pairing.
We further explored the origin of this characteristic pattern by controlling for category and
frequency of use of ingredients. The former is a recipe-level control that generates a cuisine by
preserving category composition of each recipe, whereas the latter is a cuisine-level control that
generates recipes by preserving frequency of occurrence of each ingredient. Interestingly, we
observed that controlling only for the ingredient frequency leads to food pairing pattern similar to
4
that of real-world cuisine (Fig. 3A, Fig. S5 and Fig. 4B). On the other hand, controlling only for
ingredient category led to a pattern similar to that of a randomized cuisine. A randomized control
that combines category-composition as well as ingredient frequency also reproduced the food
pairing pattern. Thus, ingredient frequency emerged as the dominant factor specifying the
characteristic flavor sharing pattern of the Indian cuisine. Considering the biased use of
ingredients, we investigated the role of top ranked ingredients by randomly swapping the top ten
ingredients with the rest. We found that indeed the highly ranked ingredients play a key role in
shaping the negative food pairing pattern of the cuisine, in contrast to ingredients with poor ranking
(Fig. S6).
A copy-mutate model of the Indian cuisine explains the negative ingredient pairing. Over the
years, the present repertoire of recipes in Indian cuisine would have evolved from a much smaller
primitive set of recipes. To probe for mechanisms and factors that may have influenced the cuisine,
we implemented the copy-mutate model proposed by Kinouchi et. al.(15). This model imitates
evolution of the cuisine to incorporate duplication and modification of recipes. The model with
randomly ascribed ingredient fitness reproduced the frequency-rank distribution (Fig. 5A), but had
food pairing similar to a random cuisine (𝑁𝑠̅̅ ̅ = 8.784, Fig. 5C). On the other hand, the cuisine
generated using a modified copy-mutate model, in which the ingredient fitness was scaled to its
occurrence, acquired the characteristic flavor sharing pattern of real-world cuisine, reproducing
the negative food pairing (𝑁𝑠̅̅ ̅ = 6.183, Fig. 5 C and D). Interestingly, our model also suggests that
the pattern of frequency-rank distribution may be a persistent feature throughout the evolution of
the cuisine, with presence of a few dominant ingredients (Fig. 5B). The fitness parameter in our
model could represent ingredient availability, flavor, nutritional value, cost and versatility (15).
Spices are uniquely placed in the recipes. Negative food pairing in the Indian cuisine is a
cumulative result of individual ingredient contributions by virtue of pairing with other ingredients
in recipes. To investigate the importance of individual ingredients and their categories in the
composition of recipes, we randomized ingredients of each category independently, while
maintaining the category as well as frequency of occurrence of the rest. We found that randomizing
ingredients in any of the categories, except spices, does not affect negative food pairing pattern,
thereby implying their insignificance (Fig. 6A). Spices, on the other hand, when swapped
selectively, randomize the negative food pairing significantly (Fig. 6A and B, ∆𝑁𝑠𝑠𝑝𝑖𝑐𝑒 = 4.229
and Z-score of -61.524). This implies that each of the spices is uniquely placed in its recipe to
shape the flavor sharing pattern with rest of the ingredients, and is sensitive to replacement even
with other spices, which is noteworthy given that the extent of flavor sharing is high among spices
(Fig. S4 A).
Spices are key contributors to the negative ingredient pairing. Beyond global statistical
features, we identified the ingredients that make key contributions towards the food pairing by
computing the extent to which their presence affects the magnitude of average food pairing (𝜒) .
We found that the key ingredients that contribute to negative food pairing of Indian cuisine were
spices (Fig. 6C). Among the top ten ingredients whose presence bias flavor sharing pattern of the
Indian cuisine towards negative pairing, nine were spices: cayenne, green bell pepper, coriander,
garam masala, tamarind, ginger garlic paste, ginger, clove, and cinnamon (SI Text and Dataset S3).

5
We surmise that this pivotal role of spices carries the evidence of historical practice of health-
centric diet in Indian subcontinent.
Discussion. Our study reveals that spices occupy a unique position in the ingredient composition
of Indian cuisine and play a major role in defining its characteristic profile. Spices, individually
and as a category, emerged as the most critical contributors to the negative food pairing.
Historically, they have been used as functional foods to serve multiple purposes such as coloring
and flavoring agents, preservatives, and additives (23). Spices also find mention as medicines in
Ayurveda as described in texts such as Charaka Samhita (11, 12, 24). One of the strongest
rationales for the use of spices is the antimicrobial hypothesis— spices are primarily used due to
their activity against food spoilage bacteria (3, 25). A few of the most potent antimicrobial spices
(26) are commonly used in Indian cuisine. Spices also serve as antioxidant, anti-inflammatory,
chemopreventive, antimutagenic, and detoxifying agents (24, 27). Our recent studies have shown
the beneficial role of capsaicin, an active component in cayenne which was revealed to be the most
critical ingredient in rendering the food pairing of the cuisine (28). The significance of spices in
Indian cuisine is also highlighted by the fact that its recipes have many derived ingredients that are
spice combinations (SI Text). Archeological evidences have suggested to the fact that lentils,
millets and spices, especially turmeric and garlic were used as ingredients in ancient Indus
civilizations (29, 30). We conclude that the evolution of cooking driven by medicinal beliefs would
have left its signature on traditional Indian recipes.
Traditionally, recipes have been passed down the generations via oral renditions. Documentation
of recipes in the form of cookbooks enable preservation of culinary practices (2). Our copy-mutate
model of culinary evolution incorporates aspects central to diversification of the cuisine and
closely reproduces its flavor sharing characteristics at the level of cuisine, recipes as well as
ingredient pairs. While we have examined Indian cuisine on the basis of one of the most
comprehensive resources, there is ample scope to enhance the analysis with enriched data. The
flavor profiles of ingredients are limited by the availability of data. Also, our study does not
account for the fact that certain flavor compounds may undergo changes in the process of cooking.
The study of molecular basis of the cuisine has potential to be extended into nutritional genomics
to explore the role of dietary chemicals in health (31, 32). Beyond revealing the characteristic food
pairing of Indian cuisine, our study could potentially lead to methods for creating novel Indian
signature recipes, healthy recipe alterations and recipe recommender systems.
Methods
Flavor sharing. We enumerated the flavor sharing (14) pattern among the ingredients that co-
occur in a recipe, starting from the set of 2,543 (𝑁𝑅) traditional Indian recipes comprising of 194
(𝑁𝐼) ingredients (SI Text). We computed average number of shared compounds in each recipe 𝑁𝑠𝑅
and further calculated a representative average flavor sharing index 𝑁𝑠̅̅ ̅ (= ∑ 𝑁𝑠
𝑅 𝑁𝑅)⁄𝑅 of the
cuisine. Figure 2 presents a graphic illustration of this procedure. For a recipe R with n ingredients
𝑁𝑠𝑅 is defined as,
𝑁𝑠𝑅 =
2
𝑛(𝑛 − 1)∑ |𝐹𝑖 ∩ 𝐹𝑗|
𝑖,𝑗𝜖𝑅,𝑖≠𝑗
6
where 𝐹𝑖 represents the flavor profile of ingredient 𝑖 (a set of compounds).
Average flavor sharing in Indian cuisine was compared with a corresponding randomized cuisine
to assess its statistical relevance by computing ∆𝑁𝑠 = �̅�𝑠𝐼𝐶 − �̅�𝑠
𝑅𝑎𝑛𝑑, where ‘IC’ and ‘Rand’
indicate Indian cuisine and corresponding random cuisine, respectively. Five types of randomized
cuisines were created by maintaining the recipe size distribution of the original Indian cuisine: a
randomized control where ingredients were chosen uniformly (20,000 recipes); a frequency-
preserved control in which frequency of use of ingredients was preserved (20,000 recipes); a
category-preserved control in which while the category composition of the recipe was preserved,
ingredients were randomly chosen from each constituent category (8 sets of control cuisines,
20,344 recipes); a frequency-and-category-preserved control where the category composition was
maintained and each ingredient was chosen with probability consistent with its frequency in Indian
cuisine (8 sets of control cuisines, 20,344 recipes); a frequency-preserved randomized control
where the top 10 ranked ingredients in the Indian cuisine were randomly swapped with low ranked
(rank ≥ 11) ingredients (10 sets of control cuisines, 200,000 recipes). The statistical significance
of ∆Ns was measured with Z-score, 𝑍 = √𝑁𝑅𝑎𝑛𝑑(�̅�𝑠
𝐼𝐶− �̅�𝑠𝑅𝑎𝑛𝑑)
𝜎𝑅𝑎𝑛𝑑 . Here NRand and 𝜎𝑅𝑎𝑛𝑑 represent
total number of recipes in the randomized cuisine and standard deviation, respectively.
Copy-mutate model. Copy-mutate model (15) imitates evolution of a cuisine to incorporate
duplication and modification of recipes. It was started with an initial set of recipes (𝑅0 = 20) of
size 𝐾 (= 7) each, by random selection of ingredients from a randomly populated ingredient pool.
This initial set was evolved by copying a recipe randomly, mutating it 𝐿(= 2) times and adding
this mutated recipe back to the set. For every mutation an ingredient was randomly chosen from
the recipe and was replaced with another ingredient chosen randomly from the pool, only if the
latter had higher fitness value than the former. New ingredients were introduced for maintaining
the size ratio of ingredient pool and recipe pool (𝑀 = 0.0762, consistent with that of Indian
cuisine). This process was repeated to obtain 61,032 recipes comprising 24 sets of cuisines
generated through copy-mutate model. While one of the models was implemented with the strategy
of Kinouchi et. al. (15) with randomly ascribed fitness values to ingredients (‘fitness random’), a
derivative of the same had fitness values scaled to ingredient frequency in the Indian cuisine
(‘fitness ranked’).
Ingredient uniqueness. Uniqueness of an ingredient of a given category by virtue of flavor
sharing pattern with other ingredients in the recipe was computed by replacing it with a randomly
chosen ingredient from the same category. Deviation in the average flavor sharing of the
randomized recipes (8 sets of control cuisines, 20,344 recipes) from that of the original cuisine
was measured, for 10 major categories (depicted in Fig. S4).
∆𝑁𝑠𝑐𝑎𝑡 = |�̅�𝑠
𝐼𝐶 − �̅�𝑠𝑐𝑎𝑡| ∀ 𝑠 ≥ 2
Here, cat stands for ingredient category. This index enumerates contribution of ingredients of a
given category towards the flavor sharing pattern of the cuisine. The statistical significance of
∆𝑁𝑠𝑐𝑎𝑡 was measured with the Z-score.
7
Ingredient contribution. The contribution of each ingredient (𝜒𝑖) to the flavor sharing pattern of
the cuisine was quantified (14) in terms of the extent to which its presence biases the flavor pairing.
𝜒𝑖 = (1
𝑁𝑅 ∑
2
𝑛(𝑛 − 1)𝑅∋𝑖
∑ |𝐹𝑖 ∩ 𝐹𝑗|
𝑗≠𝑖(𝑗.𝑖∈𝑅))
) − (2𝑓𝑖
𝑁𝑅⟨𝑛⟩
∑ 𝑓𝑗|𝐹𝑖 ∩ 𝐹𝑗|𝑗∈𝑐
∑ 𝑓𝑗𝑗∈𝑐)
Here, 𝑓𝑖 is the frequency of occurrence of ingredient 𝑖.
All computations were performed on Dell Precision T5610 workstations (Sushruta, Panini) of the
Complex Systems Laboratory, IIT Jodhpur.
Acknowledgments: G.B. acknowledges the seed grant support from Indian Institute of
Technology Jodhpur (IITJ/SEED/2014/0003). A.J. and R.N.K. thank the Ministry of Human
Resource Development, Government of India as well as Indian Institute of Technology Jodhpur
for scholarship and Junior Research Fellowship, respectively. G.B. thanks M. S. Valiathan, M. K.
Unnikrishnan, C. Suguna, Girish Arabale, Sutirth Dey, Hemachander Subramanian, L. S.
Shashidhara and Prasanta Panigrahi for critical comments and suggestions.
References
1. Pollan M (2014) Cooked: A Natural History of Transformation (Penguin Books).
2. Appadurai A (2009) How to Make a National Cuisine: Cookbooks in Contemporary India.
Comp Stud Soc Hist 30(01):3–24.
3. Sherman PW, Billing J (1999) Darwinian Gastronomy : Why we use spices. Spices taste
good because they are good for us. Bioscience 49(6):453–463.
4. Zhu Y-X, et al. (2013) Geography and similarity of regional cuisines in China. PLoS One
8(11):e79161.
5. Birch LL (1999) Development of food preferences. Annu Rev Nutr 19:41–62.
6. Ventura AK, Worobey J (2013) Early influences on the development of food preferences.
Curr Biol 23(9):R401–8.
7. Fonseca-Azevedo K, Herculano-Houzel S (2012) Metabolic constraint imposes tradeoff
between body size and number of brain neurons in human evolution. Proc Natl Acad Sci
U S A 109(45):18571–6.
8. Thatte U, Dahanukar S (1986) Ayurveda and contemporary scientific thought. Trends
Pharmacol Sci 7:247–251.
8
9. Govindarajan R, Vijayakumar M, Pushpangadan P (2005) Antioxidant approach to disease
management and the role of “Rasayana” herbs of Ayurveda. J Ethnopharmacol
99(2):165–178.
10. Pande GS, Chunekar KC (2002) Bhavprakash Nighantu (Chaukhambha Bharti Academy,
Varanasi).
11. Atridevji Gupt (1948) Swami Agnivesha’s Charaka Samhita (Bhargav Pustakalay,
Banaras). 2nd Ed.
12. Valiathan MS (2010) The Legacy of Caraka (Universities Press).
13. Dalal T (2014) Tarla Dalal. Available at: http://www.tarladalal.com.
14. Ahn Y-Y, Ahnert SE, Bagrow JP, Barabási A-L (2011) Flavor network and the principles
of food pairing. Sci Rep 1:196.
15. Kinouchi O, Diez-Garcia RW, Holanda AJ, Zambianchi P, Roque AC (2008) The non-
equilibrium nature of culinary evolution. New J Phys 10(7):073020.
16. Teng C-Y, Lin Y-R, Adamic LA (2012) Recipe recommendation using ingredient
networks.
17. Blumenthal H (2008) The big fat duck cookbook (Bloomsbury Publishing PLC).
18. Spence C, Hobkinson C, Gallace A, Fiszman BP (2013) A touch of gastronomy. Flavour
2(1):15.
19. Spence C (2012) Auditory contributions to flavour perception and feeding behaviour.
Physiol Behav 107(4):505–15.
20. Breslin PAS (2013) An evolutionary perspective on food and human taste. Curr Biol
23(9):409–418.
21. Burdock GA (2010) Fenaroli’s Handbook of Flavor Ingredients (CRC Press). 6th Ed.
22. Varshney KR, Varshney LR, Wang J, Myers D (2013) Flavor Pairing in Medieval
European Cuisine : A Study in Cooking with Dirty Data. Proc. Int. Joint Conf. Artif.
Intell. Workshops, pp 3–12.
23. Aggarwal BB, Kunnumakkara AB (2009) Molecular Targets and Therapeutic Uses of
Spices (World Scientific Publishing, Singapore).
24. Tapsell LC, et al. (2006) Health benefits of herbs and spices: the past, the present, the
future. Med J Aust 185(4):S1–S24.

9
25. Billing J, Sherman PW (1998) Antimicrobial functions of spices: why some like it hot. Q
Rev Biol 73(1):3–49.
26. Rakshit M, Ramalingam C (2010) Screening and Comparision of Antibacterial Activity of
Indian Spices. J Exp Sci 1(7):33–36.
27. Krishnaswamy K (2008) Traditional Indian spices and their health significance. Asia Pac
J Clin Nutr 17 Suppl 1:265–268.
28. Perumal S, et al. (2014) Capsaicin inhibits collagen fibril formation and increases the
stability of collagen fibers.
29. Kashyap A, Steve W (2010) Harappan plant use revealed by starch grains from Farmana.
Antiquity 84(326).
30. Lawler A (2012) The Ingredients for a 4000-Year-Old Proto-Curry. Science (80- )
337(6092):288.
31. Kaput J, Rodriguez RL (2004) Nutritional genomics: the next frontier in the postgenomic
era. Physiol Genomics 16(2):166–77.
32. Ahnert SE (2013) Network analysis and data mining in food science : the emergence of
computational gastronomy. Flavour 2(4).
10
Figures
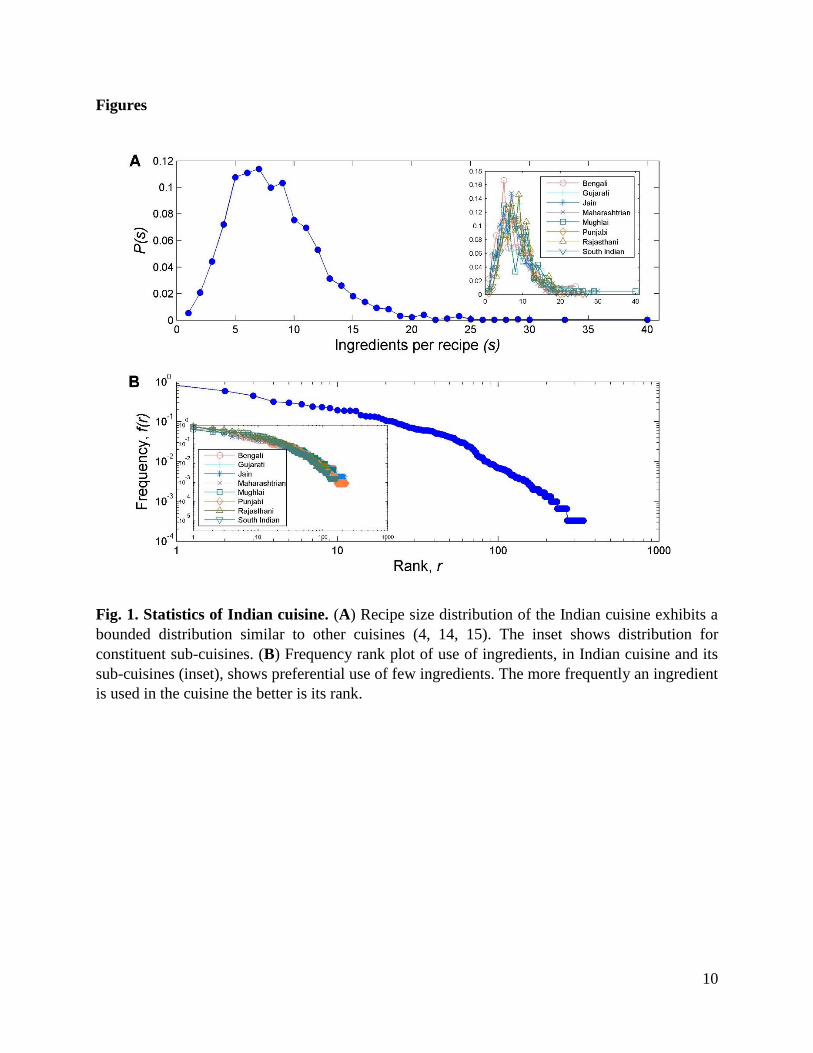
Fig. 1. Statistics of Indian cuisine. (A) Recipe size distribution of the Indian cuisine exhibits a
bounded distribution similar to other cuisines (4, 14, 15). The inset shows distribution for
constituent sub-cuisines. (B) Frequency rank plot of use of ingredients, in Indian cuisine and its
sub-cuisines (inset), shows preferential use of few ingredients. The more frequently an ingredient
is used in the cuisine the better is its rank.

11
Fig. 2. Illustration of procedure used for computation of average food pairing of a cuisine.
Starting from the cuisine data and flavor profiles of ingredients, average number of shared
compounds in each recipe was computed. The average food pairing of a recipe set was further
computed to enumerate flavor sharing.

12
Fig. 3. Strong negative food pairing in Indian cuisine and constituent sub-cuisines. (A) The
Indian cuisine is characterized by strong negative flavor sharing, when compared to its random
control. The pattern of negative food pairing is independent of the recipe size (𝑠) and is statistically
significant. While all 2,543 recipes are included for enumeration at cut-off of two, only around 3%
(80) and 0.6% (15) recipes are considered at cut-off of 15 and 20, respectively. While the recipes
set controlled only for ingredient category did not explain the negative food pairing, controlling
for frequency of use of ingredient reproduces the characteristic profile. (B) Strong negative food
pairing emerged as an invariant feature of all sub-cuisines as measured in terms of average food
pairing and its statistical significance.
13
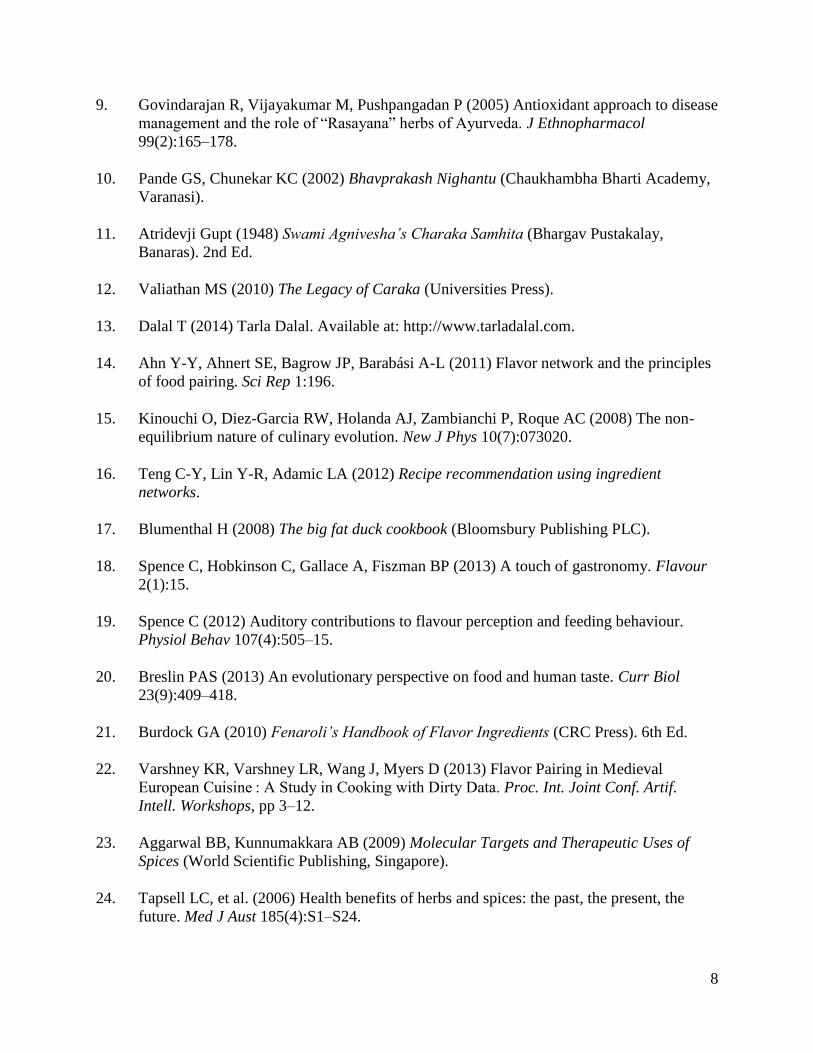
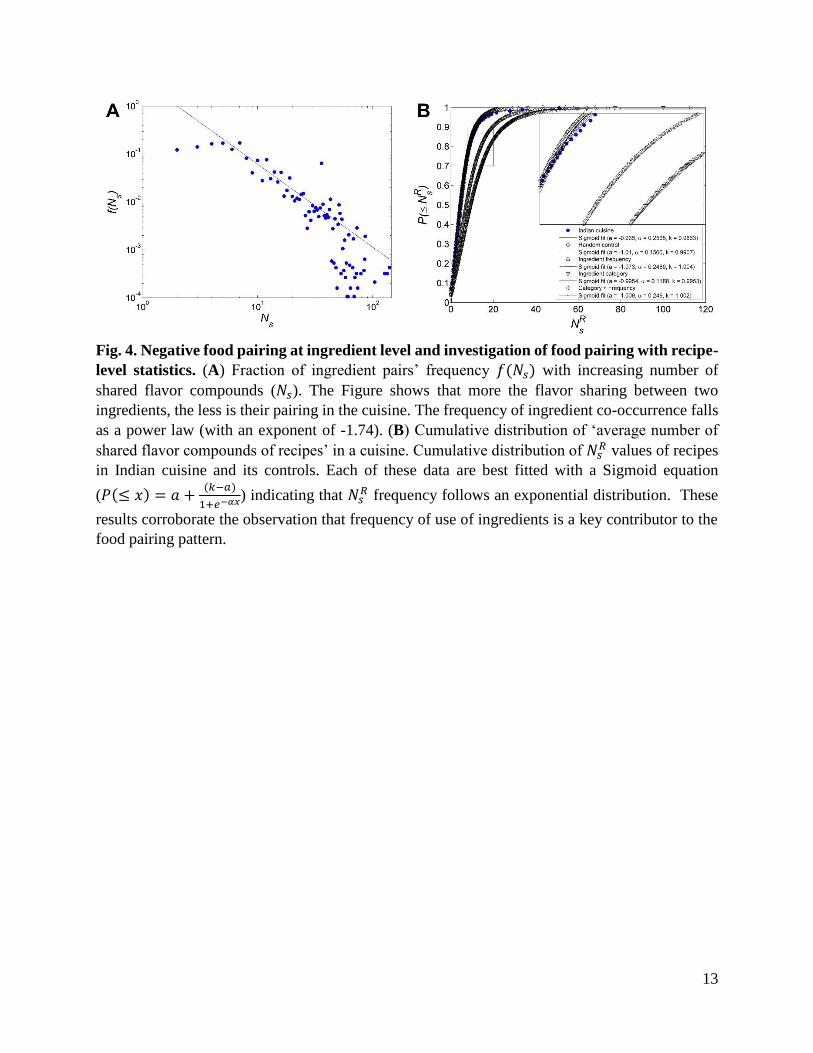
Fig. 4. Negative food pairing at ingredient level and investigation of food pairing with recipe-
level statistics. (A) Fraction of ingredient pairs’ frequency 𝑓(𝑁𝑠) with increasing number of
shared flavor compounds (𝑁𝑠). The Figure shows that more the flavor sharing between two
ingredients, the less is their pairing in the cuisine. The frequency of ingredient co-occurrence falls
as a power law (with an exponent of -1.74). (B) Cumulative distribution of ‘average number of
shared flavor compounds of recipes’ in a cuisine. Cumulative distribution of 𝑁𝑠𝑅 values of recipes
in Indian cuisine and its controls. Each of these data are best fitted with a Sigmoid equation
(𝑃(≤ 𝑥) = 𝑎 +(𝑘−𝑎)
1+𝑒−𝛼𝑥) indicating that 𝑁𝑠𝑅 frequency follows an exponential distribution. These
results corroborate the observation that frequency of use of ingredients is a key contributor to the
food pairing pattern.

14
Fig. 5. The modified copy-mutate model of Indian cuisine explains various aspects of negative
food pairing. (A) Frequency-rank distribution of ingredients generated by copy-mutate models of
Indian cuisine. Both variants of the evolutionary model (one with random fitness value assignment
and other with frequency scaled values of fitness) generated ingredient usage pattern closely
matching that of Indian cuisine. The ingredient combinations of recipes generated by the latter
model reflected the negative food pairing of the real-world cuisine. (B) The model suggests that
the cuisine may have had similar pattern of rank distribution at different stages of its evolution.
(C) The food pairing pattern is reproduced with the modified copy-mutate model. (D) The model
also reflects the decline in frequency of ingredient pair occurrence with increasing overlap in their
flavor profile.
15
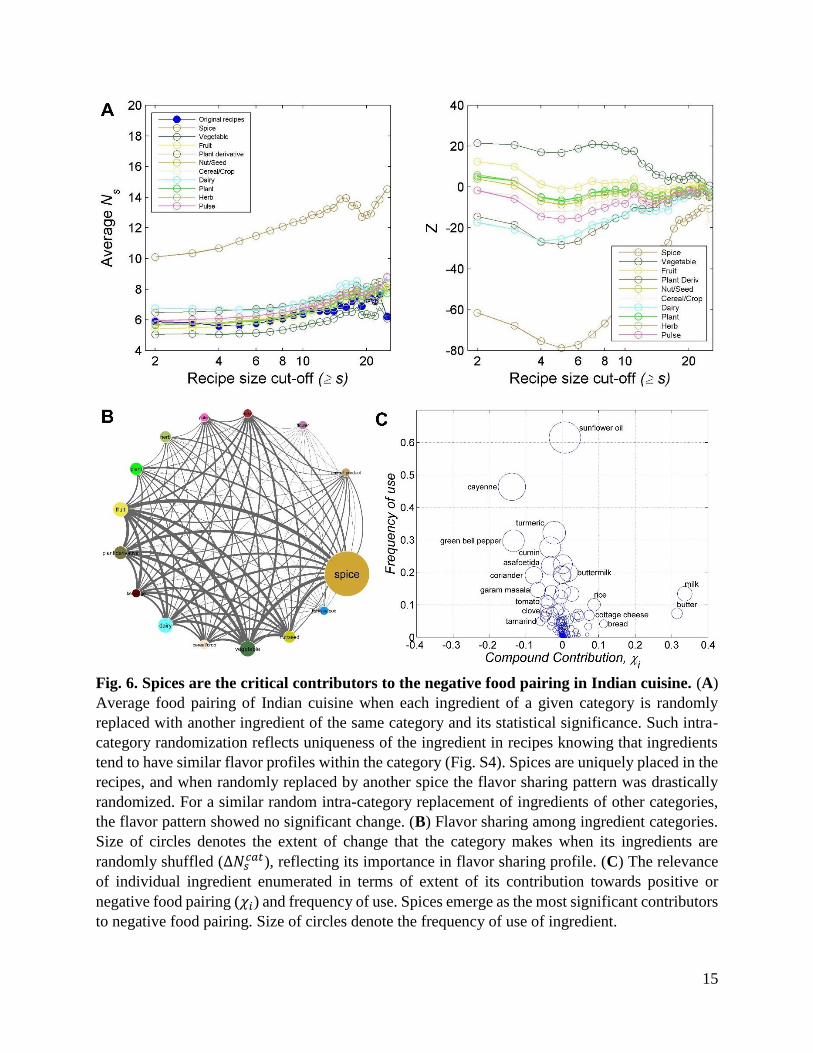
Fig. 6. Spices are the critical contributors to the negative food pairing in Indian cuisine. (A)
Average food pairing of Indian cuisine when each ingredient of a given category is randomly
replaced with another ingredient of the same category and its statistical significance. Such intra-
category randomization reflects uniqueness of the ingredient in recipes knowing that ingredients
tend to have similar flavor profiles within the category (Fig. S4). Spices are uniquely placed in the
recipes, and when randomly replaced by another spice the flavor sharing pattern was drastically
randomized. For a similar random intra-category replacement of ingredients of other categories,
the flavor pattern showed no significant change. (B) Flavor sharing among ingredient categories.
Size of circles denotes the extent of change that the category makes when its ingredients are
randomly shuffled (∆𝑁𝑠𝑐𝑎𝑡), reflecting its importance in flavor sharing profile. (C) The relevance
of individual ingredient enumerated in terms of extent of its contribution towards positive or
negative food pairing (𝜒𝑖) and frequency of use. Spices emerge as the most significant contributors
to negative food pairing. Size of circles denote the frequency of use of ingredient.

16
Supplementary Information
Spices form the basis of food pairing in Indian cuisine
Anupam Jaina,†, Rakhi N Kb,† and Ganesh Baglerb,*
1. Materials and methods
1.1 Data source selection
Our data on Indian cuisine was obtained from one of the leading cookery websites in India,
tarladalal.com. Among the various online resources available for recipes from Indian cuisines,
TarlaDalal (http://www.tarladalal.com) was found to be the best in terms of authentic recipes,
cuisine annotations and coverage across major regional subtypes. The website has 3330 recipes
from 8 Indian cuisines. Among others online sources, Sanjeev Kapoor
(http://www.sanjeevkapoor.com) has 3399 recipes from 23 Indian cuisines. NDTV Cooks
(http://cooks.ndtv.com) has 667 Indian recipes across 15 cuisines. Manjula’s Kitchen
(http://www.manjulaskitchen.com) is restricted to 730 Indian vegetarian recipes across 19 food
categories. Recipes Indian (http://www.recipesindian.com) has 891 recipes from around 16 food
categories. All Recipes (http://www.allrecipes.com) has only 449 recipes from 6 food categories.
In comparison to these sources, Tarladalal.com is the best source of recipes for Indian cuisine. The
statistics of sub cuisines, their recipes and ingredients is provided in Table S1.
1.2. Data collection and curation: Recipes
We started with the data containing 3330 recipes. This number was reduced after pruning to
remove duplicates and other inconsistencies, to obtain 3037 recipes. Recipes containing any of the
ingredients for which no flavor profile was available (349) were removed from the data, leaving
us with 2688 recipes. For the purpose of flavor sharing analysis,we removed ingredients from
‘snack’ and ‘additive’ categories, as their flavor profiles could not be determined. Finally, all
recipes having single ingredient were removed to obtain a final set of 2543 recipes.
The Indian cuisine from TarlaDalal comprise of 588 ingredients. For the purpose of mapping the
ingredients to their flavor profiles (list of volatileflavor compounds present in that ingredient),
these ingredient names were aliased to 339 source ingredients. These ingredients were categorised
into seventeen ingredient categories based on the nature of ingredients. Out of these 339 aliased
ingredients, we could obtain flavor profiles for 194 ingredients. By aliasing we mean, removing
the redundant terms in ingredient names. For instance, canned pineapple was aliased as pineapple.
Ingredient names in Hindi were translated to English. For instance anardaana was renamed as
pomegranate. Further we aliased some of the ingredient names for the purpose of matching our
ingredient names with their data. For instance bay leaf was named bay laurel. By crosschecking
with dataset of Ahn et al (1), ingredients unique to Indian cuisine were identified. A full list of
ingredient aliases, their categories and other details are provided in Dataset S1.

17
1.3. Compilation of the flavor profiles data
Our data of Indian cuisine as well as flavor compounds is not exhaustive. The original ingredient
number had to be drastically reduced as flavor profiles of some of the ingredients could not be
identified. Our main source of flavor compounds was obtained from the data made available by
Ahn et al(1). Out of 194 ingredients with flavor profiles, 146 were obtained from dataset of Ahn
et al(1). Ingredients for which the flavor data could not be obtained from either of these sources
(31), flavor profile were compiled by extensive literature survey. All the flavor profiles were cross
checked with those in 6th edition (latest) of Fenaroli’s Handbook of Flavor Compounds (2) so that
their names are used consistently. Chemical Abstract Service numbers were also used as unique
identifiers to bring consistency in nomenclature of flavor molecules. Detailed information of all
the ingredients and their flavor profile are provided in Dataset S2.
18
Fig. S1. The flavor profile size distribution of ingredients from ten major categories
19
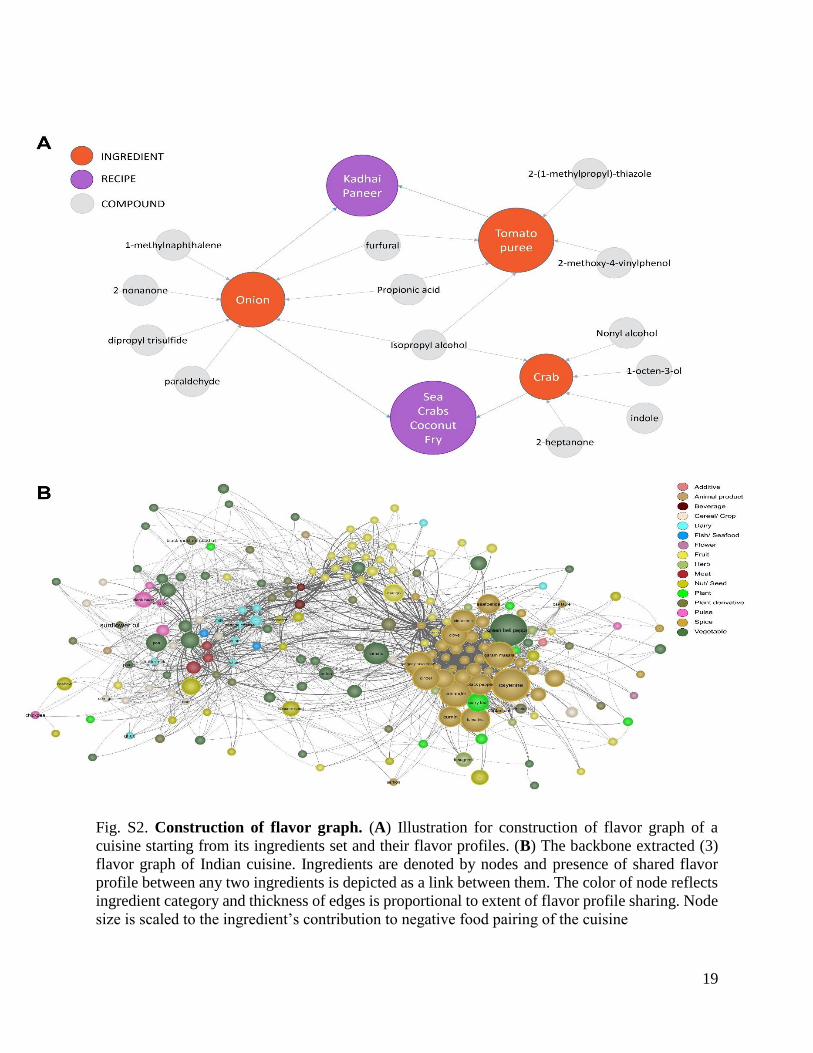
Fig. S2. Construction of flavor graph. (A) Illustration for construction of flavor graph of a
cuisine starting from its ingredients set and their flavor profiles. (B) The backbone extracted (3)
flavor graph of Indian cuisine. Ingredients are denoted by nodes and presence of shared flavor
profile between any two ingredients is depicted as a link between them. The color of node reflects
ingredient category and thickness of edges is proportional to extent of flavor profile sharing. Node
size is scaled to the ingredient’s contribution to negative food pairing of the cuisine
20
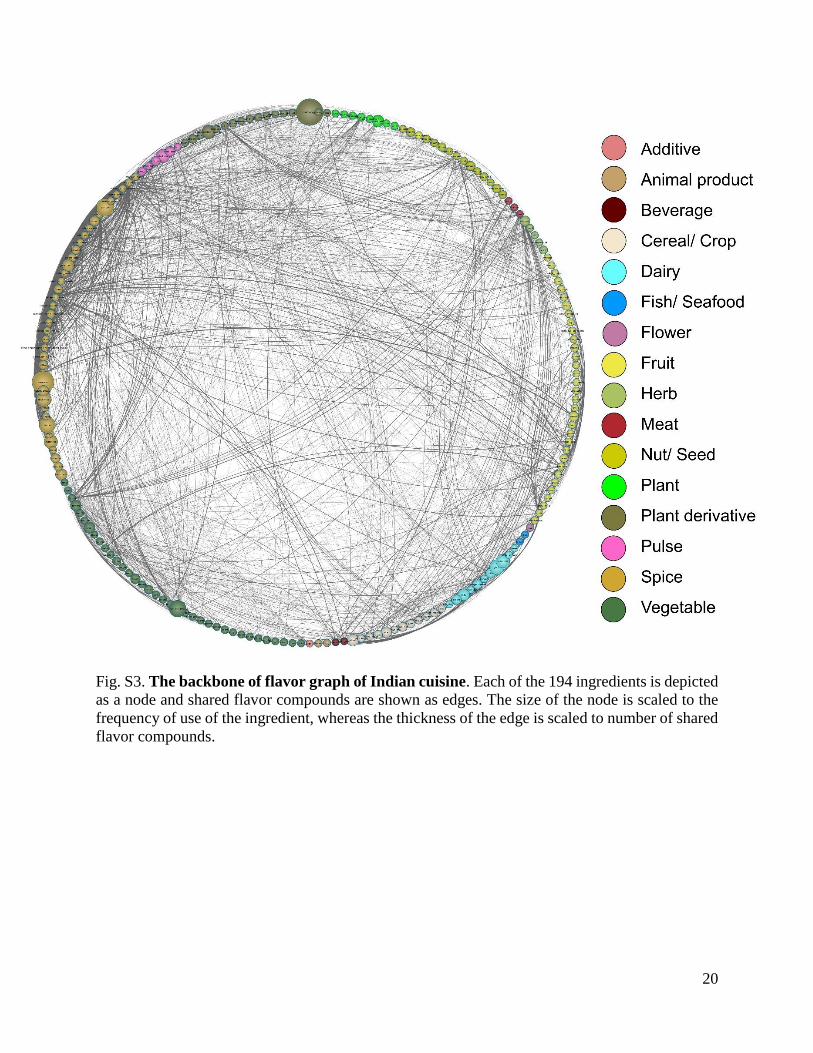
Fig. S3. The backbone of flavor graph of Indian cuisine. Each of the 194 ingredients is depicted
as a node and shared flavor compounds are shown as edges. The size of the node is scaled to the
frequency of use of the ingredient, whereas the thickness of the edge is scaled to number of shared
flavor compounds.
21
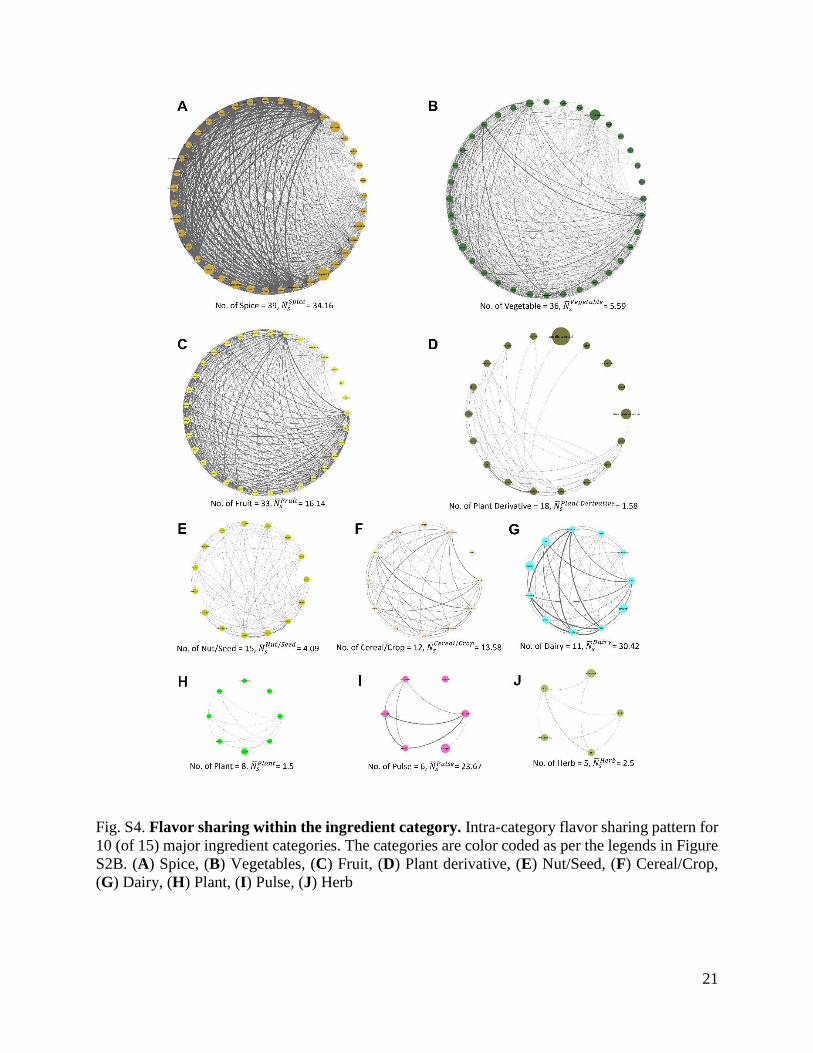
Fig. S4. Flavor sharing within the ingredient category. Intra-category flavor sharing pattern for
10 (of 15) major ingredient categories. The categories are color coded as per the legends in Figure
S2B. (A) Spice, (B) Vegetables, (C) Fruit, (D) Plant derivative, (E) Nut/Seed, (F) Cereal/Crop,
(G) Dairy, (H) Plant, (I) Pulse, (J) Herb

22
Fig. S5. Ingredient rank profiles of Indian cuisine and controls. (A) Random control when
compared to Indian cuisine. (B) Control with ingredient frequency preserved. (C) Control that
preserved only the ingredient category composition of a recipe. (D) Control in which, both, the
frequency of use of ingredients as well as the category composition were preserved
23
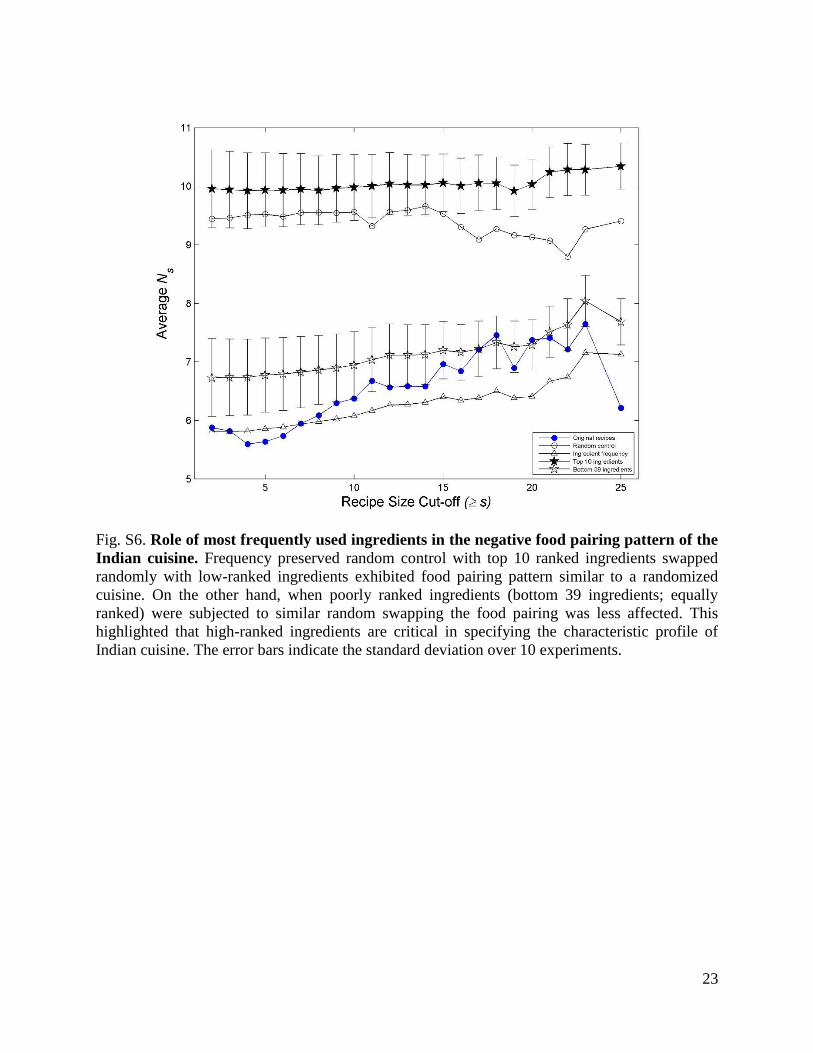
Fig. S6. Role of most frequently used ingredients in the negative food pairing pattern of the
Indian cuisine. Frequency preserved random control with top 10 ranked ingredients swapped
randomly with low-ranked ingredients exhibited food pairing pattern similar to a randomized
cuisine. On the other hand, when poorly ranked ingredients (bottom 39 ingredients; equally
ranked) were subjected to similar random swapping the food pairing was less affected. This
highlighted that high-ranked ingredients are critical in specifying the characteristic profile of
Indian cuisine. The error bars indicate the standard deviation over 10 experiments.
24
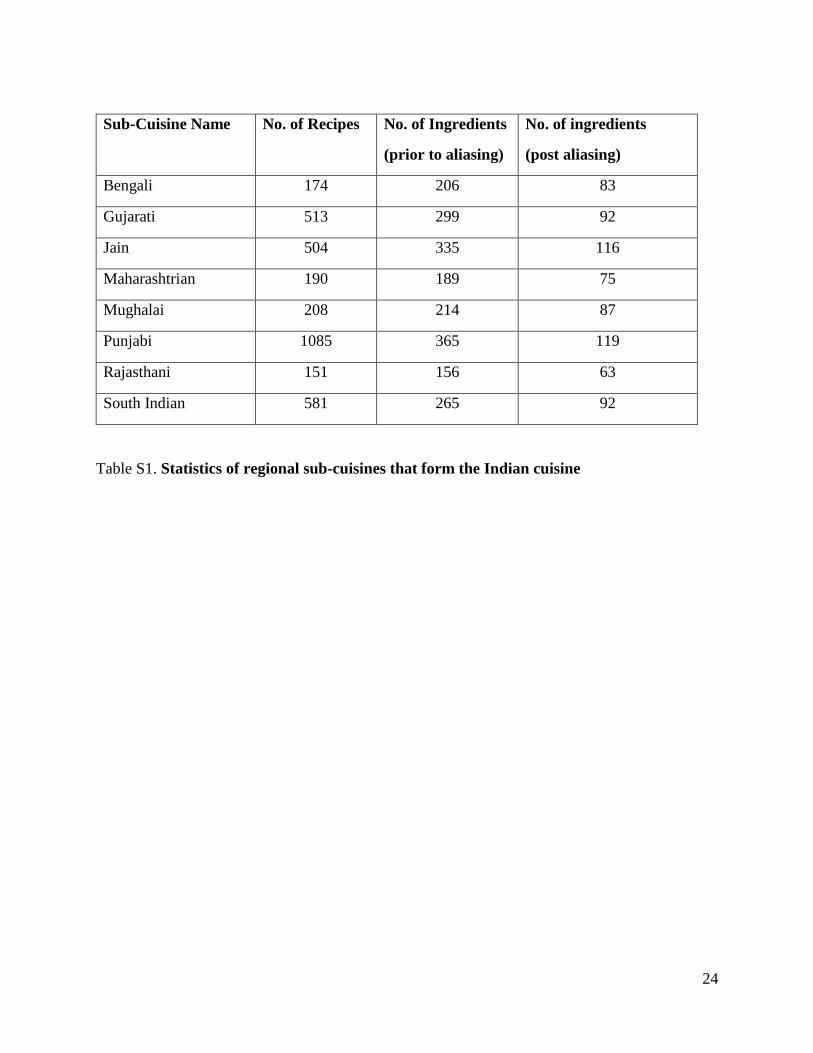
Sub-Cuisine Name No. of Recipes No. of Ingredients
(prior to aliasing)
No. of ingredients
(post aliasing)
Bengali 174 206 83
Gujarati 513 299 92
Jain 504 335 116
Maharashtrian 190 189 75
Mughalai 208 214 87
Punjabi 1085 365 119
Rajasthani 151 156 63
South Indian 581 265 92
Table S1. Statistics of regional sub-cuisines that form the Indian cuisine
25
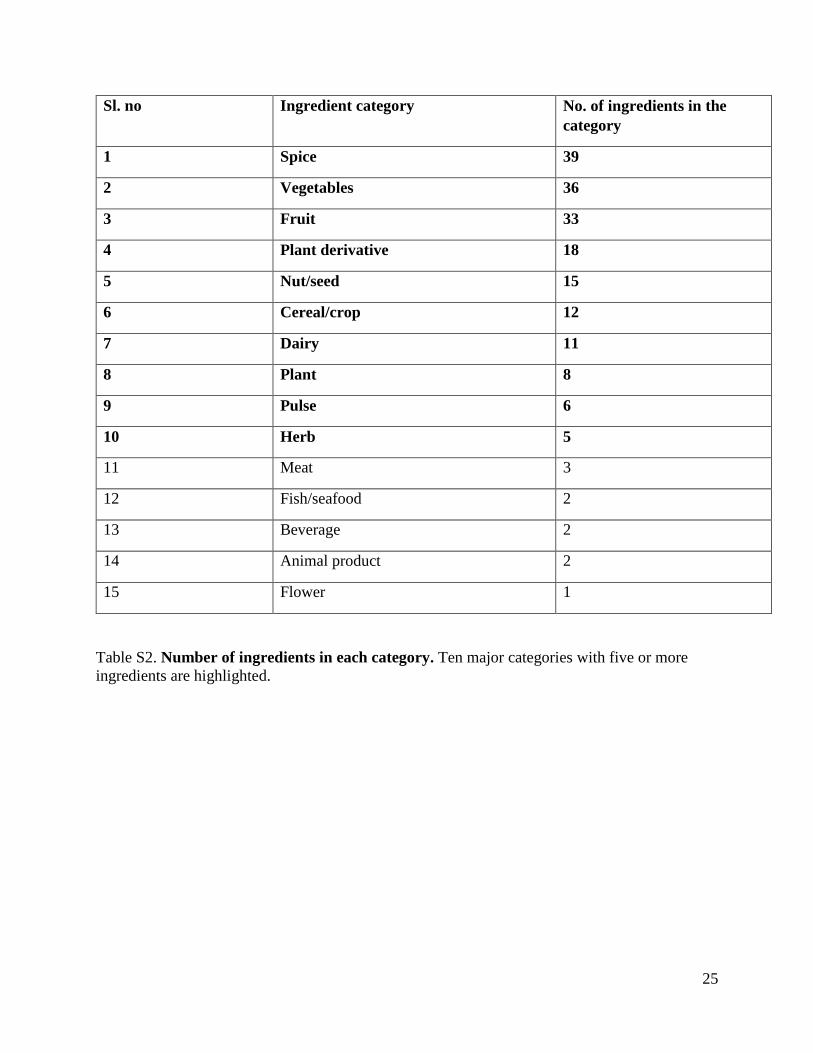
Sl. no Ingredient category No. of ingredients in the
category
1 Spice 39
2 Vegetables 36
3 Fruit 33
4 Plant derivative 18
5 Nut/seed 15
6 Cereal/crop 12
7 Dairy 11
8 Plant 8
9 Pulse 6
10 Herb 5
11 Meat 3
12 Fish/seafood 2
13 Beverage 2
14 Animal product 2
15 Flower 1
Table S2. Number of ingredients in each category. Ten major categories with five or more
ingredients are highlighted.

26
Sl.no Ingredient name Category Frequency of occurrence
1 Ghee Diary 573
2 Asafoetida Spice 561
3 Garam masala Spice 372
4 Curry leaf Spice 349
5 Ginger garlic paste Spice 166
6 Carom seed Spice 111
7 Pigeon pea Pulse 90
8 Coriander cumin seeds powder Spice 87
9 Chat masala Spice 86
10 Poppy seed nut/seed 83
11 Rice basmati cereal/crop 69
12 Nigella seed nut/seed 53
13 Egg plant Vegetable 51
14 Spinach Vegetable 41
15 Pomegranate Fruit 38
16 Sambar powder Spice 22
17 Bitter gourd Vegetable 15
18 Bottle gourd Vegetable 15
19 Chole masala Spice 15
20 Colocasia Plant 11
21 Pandanus fasicularis Fruit 11
22 Rasam powder Spice 11
23 White pepper Spice 11
Table S3. List of major ingredients not reported in other cuisines and are commonly used in
Indian cuisine
27
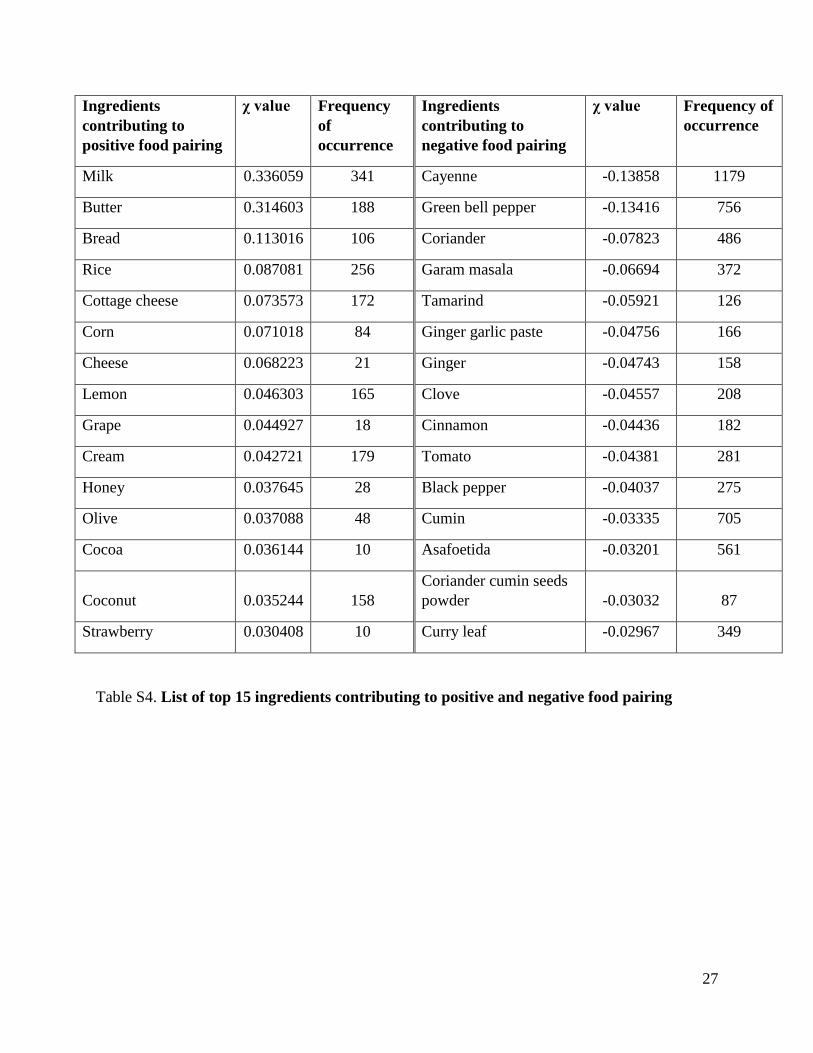
Ingredients
contributing to
positive food pairing
χ value Frequency
of
occurrence
Ingredients
contributing to
negative food pairing
χ value Frequency of
occurrence
Milk 0.336059 341 Cayenne -0.13858 1179
Butter 0.314603 188 Green bell pepper -0.13416 756
Bread 0.113016 106 Coriander -0.07823 486
Rice 0.087081 256 Garam masala -0.06694 372
Cottage cheese 0.073573 172 Tamarind -0.05921 126
Corn 0.071018 84 Ginger garlic paste -0.04756 166
Cheese 0.068223 21 Ginger -0.04743 158
Lemon 0.046303 165 Clove -0.04557 208
Grape 0.044927 18 Cinnamon -0.04436 182
Cream 0.042721 179 Tomato -0.04381 281
Honey 0.037645 28 Black pepper -0.04037 275
Olive 0.037088 48 Cumin -0.03335 705
Cocoa 0.036144 10 Asafoetida -0.03201 561
Coconut 0.035244 158
Coriander cumin seeds
powder -0.03032 87
Strawberry 0.030408 10 Curry leaf -0.02967 349
Table S4. List of top 15 ingredients contributing to positive and negative food pairing
28
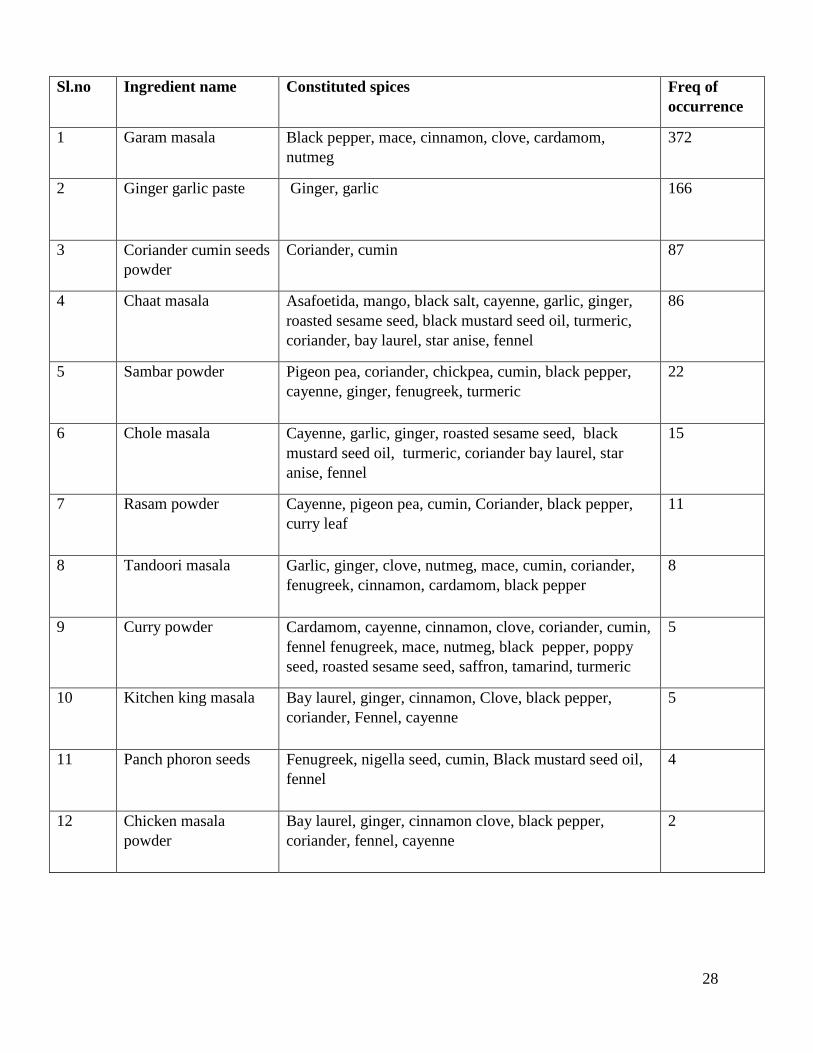
Sl.no Ingredient name Constituted spices Freq of
occurrence
1 Garam masala Black pepper, mace, cinnamon, clove, cardamom,
nutmeg
372
2 Ginger garlic paste
Ginger, garlic 166
3 Coriander cumin seeds
powder
Coriander, cumin 87
4 Chaat masala
Asafoetida, mango, black salt, cayenne, garlic, ginger,
roasted sesame seed, black mustard seed oil, turmeric,
coriander, bay laurel, star anise, fennel
86
5 Sambar powder
Pigeon pea, coriander, chickpea, cumin, black pepper,
cayenne, ginger, fenugreek, turmeric
22
6 Chole masala
Cayenne, garlic, ginger, roasted sesame seed, black
mustard seed oil, turmeric, coriander bay laurel, star
anise, fennel
15
7 Rasam powder
Cayenne, pigeon pea, cumin, Coriander, black pepper,
curry leaf
11
8 Tandoori masala
Garlic, ginger, clove, nutmeg, mace, cumin, coriander,
fenugreek, cinnamon, cardamom, black pepper
8
9 Curry powder
Cardamom, cayenne, cinnamon, clove, coriander, cumin,
fennel fenugreek, mace, nutmeg, black pepper, poppy
seed, roasted sesame seed, saffron, tamarind, turmeric
5
10 Kitchen king masala
Bay laurel, ginger, cinnamon, Clove, black pepper,
coriander, Fennel, cayenne
5
11 Panch phoron seeds
Fenugreek, nigella seed, cumin, Black mustard seed oil,
fennel
4
12 Chicken masala
powder
Bay laurel, ginger, cinnamon clove, black pepper,
coriander, fennel, cayenne
2

29
Table S5. List of derived ingredients which are combinations of spices.
13 Goda masala
Cardamom, cinnamon, clove, Bay laurel, roasted sesame
seed, Coriander, roasted coconut, Cassia, white pepper,
Black pepper
2
14 Madras curry powder
Cardamom, cayenne, cinnamon, Clove, coriander,
cumin, fennel, fenugreek, mace, nutmeg, black pepper,
poppy seed, saffron, tamarind, turmeric
1
15 Jal jeera powder
Black salt, mango, cumin, citric acid, mint, black pepper
ginger, asafoetida
1
16 Kebab masala
Bay laurel, ginger, cinnamon, clove, black pepper,
coriander, fennel, cayenne
1
17 Grind ginger garlic
and coriander leaves
Ginger, garlic, coriander 1
18 Pulao masala
Black pepper, white pepper, clove, cumin, cinnamon,
cardamom, coriander
1
19 Dabeli masala Cayenne, coriander, cinnamon, clove, cumin 1
30
Additional Datasets S1-S3 (separate files)
Dataset1 Recipes and Ingredients data of Indian cuisine
Dataset 2 Ingredients and their respective flavor compounds
Dataset 3 Ingredient contributions to negative and positive food pairing
References:
1. Ahn Y-Y, Ahnert SE, Bagrow JP, Barabási A-L (2011) Flavor network and the principles
of food pairing. Sci Rep 1:196.
2. Burdock GA (2010) Fenaroli’s Handbook of Flavor Ingredients (CRC Press). 6th Ed.
3. Serrano MÁ, Boguñá M, Vespignani A (2009) Extracting the multiscale backbone of
complex weighted networks. Proc Natl Acad Sci 106(16):6483–6488.