speech production and sociolinguistic perception in a …
TRANSCRIPT

SPEECH PRODUCTION AND SOCIOLINGUISTIC PERCEPTION IN A ‘NON-NATIVE’ SECOND
LANGUAGE CONTEXT: A SOCIOPHONETIC STUDY OF KOREAN LEARNERS
OF ENGLISH IN THE PHILIPPINES
ROWLAND ANTHONY S. IMPERIAL (B.A. (Hons.), NUS)
A THESIS SUBMITTED FOR THE DEGREE OF MASTER OF ARTS
DEPARTMENT OF ENGLISH LANGUAGE & LITERATURE NATIONAL UNIVERSITY OF SINGAPORE
2016

i
DECLARATION PAGE
“Declaration I hereby declare that this thesis is my original work and it has been written by me in its entirety. I have duly acknowledged all the sources of information which have been used in the thesis. This thesis has also not been submitted for any degree in any university previously.”
_________________________________ ROWLAND ANTHONY S. IMPERIAL
9 December 2016

ii
ACKNOWLEDGEMENTS
I would like to thank Dr. Rebecca Starr for her constant encouragement and unwavering support, for being the most awesome thesis supervisor and mentor, and for always replying to my email queries at incredible lightning speed. I am grateful to work with her on a research topic that has opened many academic opportunities for me.
I would also like to thank A/P Mie Hiramoto for her kindness and overall amazing-ness. She has been a great pillar of support throughout my two and a half years as a graduate student in the ELL Department.
Thanks to the academic and administrative staff at the University of Baguio and MONOL International Educational Institute for letting me into their school grounds, following and chasing after their students like a stalker fan. I would also like to thank my cousin Romana, and Ate Niña, Tita Abette, and Tito Jojo, for helping me out during my three-month stay in Baguio. Without them, this research would not have been possible.
Thanks to everyone else in the Department who helped me through school work and admin-related matters (since I’m so bad at admin stuff), and made grad school fun-filled and awesome. Special thanks go out to my awesome grad research roommates and drinking buddies Raymund Vitorio, Nicola Mah, Wang Tianxiao, and Jennifer Ong.
Thanks to Edwin Lee Hye Sung for translating my language background questionnaires in Korean. Thanks to Sam Fang and Joe Sibayan for proofreading my chapters. Also, many thanks to my non-linguist friends, old and new, from various circles – Pinoy 1skolars Batch 7, Opus Danes, Singapore Survivors, Marvel+Steam Bros., Angry Bird! Pack, among many others. Thanks for putting up with me.
Finally, I would like to thank my family, for bearing with me through this arduous, time-consuming (thesis extension), and sometimes questionable (is it even worth it?) process called graduate school. I dedicate this Master’s thesis to Mama, who paid for my house rent in the last five months of my writing because I went super broke, and Papa, whom we miss dearly. I hope I’ve made you proud.

iii
TABLE OF CONTENTS
DECLARATION PAGE .................................................................................. i
ACKNOWLEDGEMENTS ........................................................................... ii
ABSTRACT ..................................................................................................... vi
LIST OF ABBREVIATIONS ..................................................................... viii
LIST OF TABLES .......................................................................................... ix
CHAPTER 1: INTRODUCTION ................................................................... 1
1.1 Language situation in the Philippines .................................................. 2
1.2 Language education in the Philippines ................................................ 5
1.3 The Philippine ESL industry ................................................................ 8
1.3.1 The influx of Korean ESL learners ................................................... 8
1.3.2 Baguio City: a popular choice for Korean ESL learners ................ 10
1.4 Statement of the problem .................................................................... 12
1.5 Research questions and hypothesis .................................................... 13
CHAPTER 2: REVIEW OF RELATED LITERATURE .......................... 15
2.1 Sociolinguistic variation in second language acquisition ................. 15
2.2 Theoretical frameworks and concepts in L2 speech acquisition ..... 19
2.2.1 Early Labovian approaches to SLA research .................................. 19
2.2.2 Cognitive models of L2 speech acquisition .................................... 25
2.2.3 Phonetic drift and sound change in L2 speech acquisition ............. 29
2.3 Differences between Korean and English: VOT and f0 onset .......... 39
2.3.1 Korean ............................................................................................. 39
2.3.2 English and PhilE ............................................................................ 42
CHAPTER 3: METHODS ............................................................................ 46
3.1 Participants ........................................................................................... 46

iv
3.1.1 PHKor and FIL student participants ............................................... 46
3.1.2 SGKor participants .......................................................................... 48
3.2 Materials and Procedure ..................................................................... 49
3.2.1 Korean/Filipino language task ........................................................ 51
3.2.2 English wordlist and reading passage task ...................................... 52
3.2.3 Casual interview .............................................................................. 54
3.2.4 Sociolinguistic perception task ....................................................... 55
3.2.5 Language Background Questionnaire ............................................. 55
3.3 Acoustic Analysis ................................................................................. 55
3.4 Statistical analyses ............................................................................... 57
CHAPTER 4: L1 KOREAN AND L2 ENGLISH SPEECH PRODUCTION .............................................................................................. 58
4.1 Voice Onset Time (VOT) ..................................................................... 59
4.1.1 Variation according to phonation type and speech style ................ 59
4.1.2 Place of articulation ........................................................................ 64
4.1.3 Phonemic contrast ........................................................................... 65
4.1.4 Korean aspirated-lenis VOT merger ............................................... 67
4.1.5 Study program and Length of study (LOS) .................................... 67
4.1.6 Interim summary ............................................................................. 71
4.2 Fundamental frequency at vowel onset (f0 onset) ............................. 76
4.2.1 Variation according to phonation type and speech style ................ 76
4.2.2 Place of articulation ........................................................................ 79
4.2.3 Phonemic contrast ........................................................................... 81
4.2.4 Stops followed by PALM/START vowel ....................................... 82
4.2.5 Study program and Length of study (LOS) .................................... 86
4.2.5 Interim summary and discussion .................................................... 89
4.3 Linear mixed effects regression analysis ............................................ 91
4.3.1 Intra-speaker variation: modelling PHKor data .............................. 95
4.3.2 Inter-speaker variation: modelling PHKor v SGKor data ............... 99

v
4.4 General discussion of results ............................................................. 102
4.4.1 Internal factors of variation ........................................................... 102
4.4.2 External factors of variation .......................................................... 105
4.4.3 Conclusion .................................................................................... 110
CHAPTER 5: SOCIOLINGUISTIC PERCEPTION OF PHILIPPINE ENGLISH ..................................................................................................... 115
5.1 Learners’ perception of PhilE ........................................................... 116
5.1.1 Method and participants ................................................................ 116
5.1.2 Results ........................................................................................... 119
5.2 Relating speech production and sociolinguistic perception ........... 132
5.2.1 Statistical analysis ......................................................................... 132
5.2.2 Discussion and conclusion ............................................................ 138
CHAPTER 6: CONCLUSION ................................................................... 145
6.1 Summary of results ............................................................................ 145
6.2 Limitations of the study ..................................................................... 149
6.3 Directions for future research ........................................................... 152
6.4 Final remarks ..................................................................................... 154
BIBLIOGRAPHY ........................................................................................ 156
APPENDIXES .............................................................................................. 171
vi
ABSTRACT
Foreign nationals studying English as a Second Language (ESL) in the
Philippines encounter and learn Philippine English (PhilE), a norm-developing,
Outer Circle variety of English (Bolton, 2008; Kachru, 1992) that has
undergone various indigenization and nativization processes (Borlongan, 2011;
Schneider, 2003), most notably in its phonology. Recent contributions to
Philippine-based ESL and Second Language Acquisition research have
particularly paid attention to language teaching and pedagogy, language
ideologies, and foreign learners’ perceptions of and attitudes towards PhilE. In
this study, I attempt to advance research by studying L1 and L2 speech
production patterns and sociolinguistic perceptions of PhilE among Korean ESL
learners. Koreans account for one of the largest number of foreign students
enrolled in Philippine education institutions (D.-Y. Kim, 2015; Miralao, 2007),
making them an ideal case to study. This thesis presents perhaps the first study
that analyzes sociophonetic variation in second language acquisition in the
Philippines.
PhilE is a ‘non-native’ variety of English with a distinctive two-way stop
system characterized by negative-to-short Voice Onset Time (VOT). This type
of phonation feature is not common among native Korean speakers, whose L1
involves a three-way stop system combined with a significant degree of
tonal/vocalic interaction (to achieve maximal phonemic contrast). Because the
two stop systems are quite dissimilar from one another in terms of consonantal
and tonal/vocalic contrast, Korean students who exhibit varying lengths and/or
degrees of linguistic exposure to PhilE, and encounter different linguistic

vii
experiences during their L2 learning, would be expected to exhibit varying
degrees of or changes to their categorical assimilation of L1 and L2 sounds
(Flege, 1987, 1995) and phonetic drift patterns (Chang, 2012) in their
interlanguage.
The present analysis of variation in L1 and L2 speech production
focuses on two acoustic features: VOT and Fundamental Frequency at the onset
of the following vowel (f0 onset). VOT and f0 onset results reveal that
Philippine-based Korean (PHKor) students are (1) categorically assimilating
phonetic features of the PhilE stop system across segmental and subsegmental
levels; (2) exhibiting L1-to-L2 interference, evidenced by L2 stops that appear
to assimilate towards Korean production norms in certain phonological
environments; and (3) producing dissimilatory phonetic drift patterns in their
L1 sound system, indicating bi-directional sound change and development.
Moreover, PHKor students who are more aware of or better at
identifying and/or perceiving (Standard) PhilE are less likely to assimilate to
non-native L2 production norms during their L2 speech acquisition. This
highlights the importance of sociolinguistic perception and perceptual accuracy
to L2 speech acquisition.
The study also reveals that PHKor students now show more neutral-to-
positive attitudes towards PhilE as a medium of learning and instruction (cf.
Castro & Roh, 2013; Roh, 2010), but remain reluctant to acquire PhilE accent
features in their speech production. Even though Koreans are putting more
economic and social value into Philippine-based ESL education, many of them
continue to regard PhilE as a less prestigious, ‘non-native’ variety of English,
and still aspire to achieve ‘native-like’ English norms in speech.

viii
LIST OF ABBREVIATIONS
AmE American English BEP Bilingual Education Policy BrE British English DepEd Philippine Department of Education DOT Philippine Department of Tourism ESL English as a Second Language f0 Fundamental frequency f0 onset f0 at the onset of a following vowel F1 First formant F2 Second formant FIL Filipino (student participant) Hz Hertz IELTS International English Language Testing System IVE Indigenized Variety of English L1 First language L2 Second language LCB Later childhood bilingual LOR Length of residence (in years) LOS Length of study (in years) LT Long-term ms millisecond MT Mother Tongue MTB-MLE Mother Tongue-Based Multilingual Education NUS National University of Singapore PAM-L2 Perceptual Assimilation Model – L2 PhilE Philippine English PHKor Philippine-based Korean (student participant) SgE Singapore English SGKor Singapore-based Korean (student participant) SLA Second Language Acquisition SLM Speech Learning Model SSP Special Study Permit ST Short-term TOEIC Test of English for International Communication UB University of Baguio UG Universal Grammar VARBRUL Variable rule analysis VOT Voice Onset Time

ix
LIST OF TABLES
Table 1: Classification of the L1 and L2 stop system in the interlanguage of Korean-English bilinguals ....................................................................... 34
Table 2: Observed cases of L1 phonetic drift in the speech production of English learners of Korean ....................................................................... 35
Table 3: Mean Korean word-initial VOT (ms) and VOT range across the decades ..................................................................................................... 39
Table 4: Comparing mean Korean word-initial VOT data from various studies.................................................................................................................. 40
Table 5: Tonal correspondences between Korean and English, sorted by phonation type .......................................................................................... 44
Table 6: Student numbers for the individual testing sessions ......................... 48
Table 7: Word items in Korean and Tagalog whose tokens were sampled and analyzed in the present study ................................................................... 53
Table 8: Target word items in English whose tokens were sampled and analyzed in the present study ................................................................... 53
Table 9: Breakdown of all stop tokens in word-initial and [#s/ptk/_] positions examined in this study, sorted by participant group ................................ 56
Table 10: Comparing PHKor participants’ mean English word-initial VOT values (in ms) from the present study with native English VOT norms produced by American speakers of English ............................................. 63
Table 11: Comparison of the participants’ mean English word-initial f0 onset values (raw values, in Hz) across different phonation types, sorted by speech style .............................................................................................. 78
Table 12: Comparison of the participants’ mean English word-initial f0 onset values (raw values, in Hz) across different phonation types, sorted by gender ....................................................................................................... 78
Table 13: Comparison of the participants’ mean Korean word-initial f0 onset values (raw values, in Hz) across different phonation types, sorted by gender ....................................................................................................... 79
Table 14: Comparison of the participants’ mean English word-initial f0 onset values (raw values, in Hz) across different places of articulation, sorted by speech style ......................................................................................... 81
Table 15: Comparison of the participants’ mean English and Korean word-initial f0 onset values (raw values, in Hz) across different places of articulation, sorted by gender ................................................................... 81

x
Table 16: Comparison of the participants’ mean Korean word-initial f0 onset values (raw values, in Hz) for stops followed by /ɑ/, across different phonation types, sorted by gender ........................................................... 85
Table 17: Data sets and regression models used to analyze L2 English and L1 Korean VOT and f0 onset ........................................................................ 93
Table 18: Predictor variable assignments for the PHKor group regression models ...................................................................................................... 94
Table 19: Predictor variable assignments for the PHKor v SGKor regression models ...................................................................................................... 95
Table 20: Best step-down EngVOT1 model of L2 English VOT .................... 97
Table 21: Best step-down EngF01 model of L2 English f0 onset .................... 97
Table 22: Best step-down EngPALM1 model of L2 English f0 onset ............. 97
Table 23: Best step-down KorVOT1 model of L1 Korean VOT .................... 98
Table 24: Best step-up KorVOT1 model of L1 Korean VOT ......................... 98
Table 25: Best step-down KorF01 model of L1 Korean f0 onset ..................... 98
Table 26: Best step-down EngVOT2 model of L2 English VOT .................. 100
Table 27: Best step-up EngVOT2 model of L2 English VOT ...................... 100
Table 28: Best step-down EngF02 model of L2 English f0 onset .................. 101
Table 29: Best step-down EngPALM2 model of L2 English f0 onset ........... 101
Table 30: Best step-up KorF02 model of L1 Korean f0 onset ........................ 103
Table 31: Distribution of the participants according to the following variables: Gender, Dialect, Age (years), Interaction with Filipino peers, and Formal learning involvement ............................................................................. 109
Table 32: Observed cases of phonetic drift in the L1 and L2 speech production of Korean learners of English (PHKor group) ..................... 112
Table 34: Best step-down EngVOT3 model of L2 English VOT .................. 138
Table 35: Best step-down EngVOT4 model of L2 English VOT .................. 139

xi
LIST OF FIGURES
Figure 1: The 10 most widely spoken Philippine languages. Figures shown as a percentage of the total population ........................................................... 3
Figure 2: A map of the Philippines showing the geographical distribution of the major language groups ......................................................................... 4
Figure 3: Philippine urban centers with large concentrations of Korean students and residents .............................................................................. 11
Figure 4: Panoramic view of Aurora Hill, Baguio .......................................... 12
Figure 5: Mean English VOT values (ms) for word-initial stops produced by Philippine-based Korean (PHKor) and Filipino student participants in formal speech style .................................................................................. 44
Figure 6: Vowel charts for (General) American and Philippine English ....... 45
Figure 7: Mean VOT values (in ms) of SgE stops, sorted by ethnolinguistic affiliation .................................................................................................. 50
Figure 8: Mean word-initial L2 English and L1 Korean VOTs (in ms) across different phonation types ......................................................................... 60
Figure 9: Mean word-initial L2 English and L1 Korean mean VOT values (in ms) across different places of articulation ............................................... 66
Figure 10: Mean word-initial L2 English and L1 Korean VOT values (in ms) sorted by phoneme type ........................................................................... 68
Figure 11: LT and ST PHKor mean word-initial L2 English and L1 Korean VOT values (in ms) across different phonation types ............................. 69
Figure 12: PHKor mean word-initial L2 English and L1 Korean VOT values (in ms) across different phonation types .................................................. 72
Figure 13: Mean word-initial L2 English and L1 Korean f0 onset (in Bark normalized z-scores) across different phonation types ............................ 77
Figure 14: Mean word-initial L2 English and L1 Korean f0 onset (in Bark normalized z-scores) across different places of articulation .................... 80
Figure 15: Mean word-initial English f0 onset (Bark normalized z-values) for stops followed by /ɑ/, across different phonation types ........................... 83
Figure 16: Mean word-initial English f0 onset (Bark normalized z-values) for stops followed by /ɑ/, across different phonation types ........................... 85
Figure 17: PHKor mean word-initial L2 English (PALM) and L1 Korean f0 onset (in Bark normalized z-score) sorted by LOS (in years) .................. 88

xii
Figure 18: PHKor mean word-initial L2 English and L1 Korean VOT (in ms) across different frequencies of interaction with Filipino peers and involvement in formal L2 learning .......................................................... 94
Figure 19: Female and male PHKor students’ mean word-initial L1 Korean VOT values (in ms), sorted by phonation type ...................................... 106
Figure 20: PHKor mean word-initial L2 English VOT (in ms) based on age (in years) ................................................................................................ 108
Figure 21: PHKor, SGKor, and FIL students’ perception of Jack’s place of origin ...................................................................................................... 120
Figure 22: PHKor, SGKor, and FIL students’ perception of Jack’s occupation and socioeconomic class ........................................................................ 124
Figure 23: PHKor, SGKor, and FIL participants’ perception of Jack’s English................................................................................................................ 126
Figure 24: Mean word-initial L2 English VOT values (in ms) sorted by PHKor participants’ responses for ‘Place of origin’ .............................. 134
Figure 25: Mean word-initial L2 English VOT values (in ms) sorted by uninformed PHKor participants’ responses for ‘Socioeconomic class’ and ‘Occupation’ .......................................................................................... 135
Figure 26: Mean word-initial L2 English VOT values (in ms) sorted by the PHKor participants’ rating of Jack’s English accent, and responses for ‘Would you like Jack to be your English teacher?’ ............................... 136

1
CHAPTER 1
INTRODUCTION
The study of non-native or indigenized varieties of English (IVEs) has come a
long way since Sridhar and Sridhar (1986) had first drawn scholarly attention
to the apparent neglect of IVE studies in Second Language Acquisition (SLA)
research. We have seen the scholarship on non-native English varieties flourish
with the dawn of Kachruvian approaches to the study of World Englishes. Some
paradigms, however, remain relatively unexplored and understudied. This has
certainly been the case for Philippine English (PhilE), a norm-developing,
Outer Circle variety of English (Bolton, 2008; Kachru, 1992) that has
undergone various indigenization and nativization processes (Borlongan, 2011;
Schneider, 2003), most notably in its phonology.
Foreign nationals studying English as a Second Language (ESL) in the
Philippines encounter and learn a particular, distinct variety of English – PhilE
– through the very educational institutions they are enrolled in, the people they
interact with, and through their exposure to other types of ambient linguistic
settings outside the domain of formal learning. Recently, there have been
significant contributions to Philippine-based ESL and SLA research; these
studies have particularly paid attention to language teaching and pedagogy,
language ideologies, and foreign learners’ perceptions of and attitudes towards
PhilE. In this study, I attempt to advance research in those key areas by
providing a descriptive and statistical analysis of first language (L1) and second
language (L2) speech production, as well as L2 sociolinguistic perception
patterns among Philippine-based ESL learners. I focus on South Korean

2
nationals, who currently comprise one of the largest foreign student populations
in the country (Choe, 2016; D.-Y. Kim, 2015). This is perhaps the first study
that analyzes sociolinguistic variation in second language acquisition in the
Philippines.
PhilE is a ‘non-native’ variety of English with a distinctive two-way
consonantal stop system characterized by negative-to-short Voice Onset Time
(VOT). This type of voicing (or phonation) feature is not common among native
Korean speakers, whose L1 involves a three-way consonantal stop system
combined with a significant degree of tonal/vocalic interaction (to achieve
maximal phonemic contrast). Because the two stop systems are quite dissimilar
from one another, Philippine-based Korean (PHKor) learners of English who
exhibit varying lengths and/or degrees of linguistic exposure to PhilE and
encounter different linguistic experiences during their L2 learning, would be
expected to exhibit varying degrees of or changes to their categorical
assimilation of L1 and L2 sounds (Flege, 1987, 1995) and phonetic drift patterns
(Chang, 2012) in their interlanguage.
The present study is thus narrowed down to (1) the sociophonetic
analysis of both L1 and L2 consonantal stop production, focusing on patterns
of variation in VOT and Fundamental Frequency at the onset of the following
vowel (f0 onset), and (2) the sociolinguistic analysis of learner perceptions
towards PhilE. By doing so, I hope to shed light on important issues surrounding
L2 speech acquisition, language ideologies, and potential implications on
language learning, teaching, and pedagogy in the Philippines.
1.1 Language situation in the Philippines
The Philippines, an archipelago of at least 1,700 islands in Southeast Asia, is

3
Figure 1: The 10 most widely spoken Philippine languages. Figures shown as a percentage of the total population. Data was adopted from Gonzalez (1998) and based on the 1995 Census of Population and Housing.
home to approximately 101 million Filipinos (Philippine Statistics Authority,
2016a), and to an estimated 183 living individual languages, of which 175 are
indigenous and 8 are non-indigenous (Lewis, Simons & Fennig, 2016).1 Despite
the great ethnolinguistic diversity of the country, only ten of these languages
are considered to have majority status, i.e., spoken by at least 1 million speakers,
and have greater geographical reach and cultural significance. They are listed
in Figure 1 above.
The 1987 Philippine Constitution, however, declares only two official
languages – English and Filipino. English is an official language of the
government and an important medium of instruction and communication across
many domains of the Filipino society. Meanwhile, Filipino is a largely urban
language spoken in major cities as a second language along with their respective
1 Lewis et al.’s 2016 Ethnologue report put the total estimated number of languages in the Philippines at 187, of which 183 are living and 4 are extinct. The numbers, however, vary from one source to another; for instance, Macfarland (1993) claimed that there are approximately 120 indigenous languages in the Philippines, mostly belonging to the Austronesian or Malayo-Polynesian Group.
Philippine languages
Northern Philippine
Ilokano (9.31)
Kapampangan (2.98)
Pangasinense (1.81)
Meso- (Central) Philippine
Tagalog (29.29)
Cebuano Bisayan (21.17)
Cebuano Hiligaynon (9.11)
Waray (3.81)
Bikol (5.69)
Southern Philippine
Maranao (1.27)
Maguindanao (1.24)

4
Figure 2: A map of the Philippines showing the geographical distribution of the major language groups (adopted from Gonzalez, 1998). The actual, current ethnolinguistic landscape, however, is not as clear-cut. For example, Cebuano Bisayan (a Central Philippine language) is the lingua franca of Mindanao, a southern island. Gonzalez mentioned that this was the result of waves of southward migration of people from the Visayan Islands. Meanwhile, in the case of Tagalog (as the structural base of Filipino), nation-building strategies and large-scale language education policies in the post-WWII era, as well as promotion through all types of media and forms of communication (print, radio, television, and social network) have greatly extended its reach across the archipelago, more so than any other regional language or language variety. Regardless of these monumental social and political changes, however, the correlation between language identity and regional affiliation in the country remains positively strong (Enriquez, 2012).

5
regional languages. It is currently the lingua franca of Metro Manila, the largest
metropolitan area in the country, center of business, education, and culture, and
seat of government. The Filipino language is essentially Tagalog, which was
renamed Pilipino in 1959 “to make it more acceptable as the national language”
and Filipino in 1972 “so that the name of the language would represent all
Filipinos” (Thompson, 2003, p.33).
At the expense of English, the use of Filipino and Taglish – a language
switching variety involving Tagalog and English (Thompson, 2003) – has
rapidly gained traction in mass media; these are now the predominant and
preferred language varieties in almost all types of news and entertainment
program that are broadcast nationwide on TV and radio stations (Dayag, 2004;
Thompson, 2003). Today, the use of (Standard) English use is limited to
academia and formal language learning, some forms of media, and transactions
involving the domains of the government and the law, business, and overseas
work (Enriquez, 2012).
Nevertheless, despite the abovementioned downward trends in the use
of English, the nativization and indigenization processes involving the
formation of the PhilE variety have been steady and significant since the post-
WWII era and the implementation of the Filipino-English Bilingual Education
Policy (BEP) in 1974 (cf. Borlongan, 2011; Enaka, 2006; Schneider, 2003).
English, as Filipinos speak it, now exhibits a notably local flavor especially in
terms of the language’s lexical, phonetic, and phonological features. In fact,
PhilE is now widely recognized and accepted as a distinct variety of English.
1.2 Language education in the Philippines
The BEP paved the way for the official languages, English and Filipino, to be

6
integrated into the national education system and thus be formally taught to
Filipino students. The policy, however, has undergone numerous revisions
throughout the decades, and not without controversy (Enriquez, 2012). For
instance, it has been criticized for its lack of control and uniformity across all
education systems, as certain institutions (mostly private) have considerable
autonomy over language-related policy implementations at the school level. As
a student who studied in the Philippines, my own experience can attest to this
lack. I was taught Home Economics and Livelihood Education (HELE), as well
as Music, Arts, Physical Education and Health (MAPEH) in English in private
elementary school, but when I moved to a semi-private (i.e., partially publicly
funded) school for my secondary education, I had to learn both subjects in
Filipino. Nonetheless, despite the lack of standardization and uniformity across
the public and private education sectors, both sectors remain centered on
improving – or at least maintaining – the effectiveness of the Filipino-English
bilingual education program. Furthermore, except in a few private schools and
international academies, the overwhelming majority of the English teachers in
the Philippines are Filipinos (Enriquez, 2012); we would therefore expect that
the type of language input received by students of English in the Philippines
would more or less reflect the (standard) PhilE variety, which at this point in
time, is approaching stability in terms of its phonological (and lexical) features
(Borlongan, 2011; Gonzalez, 1998; Schneider, 2003).
However, major changes to language education in the Philippines are
expected to happen with the recent nationwide implementation of the Mother
Tongue-Based Multilingual Education (MTB-MLE) by the Department of
Education (or DepEd). The MTB-MLE is the government’s new banner

7
program for education under the umbrella of the K to 12 Basic Education
Program (DepEd, 2014). Officially known as the “Enhanced Basic Act of
2013”, K to 12 extends the now defunct 10-year basic education curriculum to
13 years to “provide sufficient time for mastery of concepts and skills, develop
lifelong learners, and prepare graduates for tertiary education, middle-level
skills development, employment, and entrepreneurship” (DepEd, n.d.).
Focusing on building proficiency through language, students are now taught
through their L1 (i.e., their regional language, or Mother Tongue / MT) in the
first three years of elementary school. English and Filipino are now taught as
language subjects starting Grade 1 “with focus on oral fluency”, and would be
gradually introduced as media of instruction in the latter half of their elementary
education (DepEd, n.d.). In School Year 2012-13, 12 MTs from various regions
were introduced as languages of instruction in the first three years of elementary
school.2
Despite the new major policy changes and implementations in the
country’s education system, the English language has remained and will remain
an indelible part of formal learning and a key medium of teaching instruction.
Also, the recent policy changes and implementations pose no direct or
immediate threat to the country’s ESL sector, a largely private, international
enterprise which has experienced phenomenal growth since the 1990s when
foreign students first started coming in large numbers (de Guzman, Albela,
Nieto, Ferrer & Santos, 2006).
2 The 12 MTs that have already been implemented as languages of instruction in formal classroom learning are: the 10 majority regional languages, Bahasa Sug (the language of the Tausug people in the southern island province of Sulu), and Chabacano (a Spanish-based creole spoken mainly in the province of Zamboanga in Mindanao, and in a few towns in the province of Cavite in Luzon). As stated by the DepEd, other local languages will be included in succeeding school years (DepEd, n.d.).

8
1.3 The Philippine ESL industry
Focusing on the post-colonial acquisition of English in the Philippines, earlier
works on second language acquisition (SLA) perceived Filipinos as ‘non-
native’ learners of English (e.g., Castillo, 1969). The Philippine language
situation today, however, is radically different and more complex than ever.
English is still eminently present in almost all domains of the Filipino society,
especially in education. Despite the recent implementation of the MTB-MLE
policy (which diminishes the instructional role of English in the classroom
during early language acquisition), formal learning of L2 English remains a
necessary component of the BEP, deeply embedded and well established in the
national education system. More importantly, the Philippines has a large,
young, and competent English-speaking workforce, which includes a growing
number of well-educated and well-trained Filipino English teachers in the
private education sector (Choe, 2016).
1.3.1 The influx of Korean ESL learners
The influx of Korean citizens to the Philippines began in the 1990s when South
Korea and the Philippines began intensifying trade relations, and rapidly
increased in the 2000s when studying abroad became an increasingly popular
trend among young Koreans (D.-Y. Kim, 2015; Miralao, 2007). Since then, the
Philippines has remained a top choice among Korean students for short-term
ESL programs, and even for long-term basic (elementary, high school) and
specialized (tertiary) education (Choe, 2016; de Guzman et al., 2006). Annually,
the country receives around 30,000 Korean students, of which 10% hold student
visas and are mostly enrolled as full-time students, while the remaining 90%
hold short-term Special Study Permits (SSPs) and are mainly enrolled in

9
English language academies (Choe, 2016).3
The phenomenal rise in the number of Korean students wanting to
embark on short-term, study abroad / language immersion programs has
resulted in hundreds of private, Korean-run language academies springing up in
the major cities and towns across the country. These language academies –
language tutoring centers or special education centers as some people call them
– offer a plethora of short-term yet intensive English language-based programs,
ranging from traditional ESL courses to customizable ones that cater to the
students’ wants and needs;4 courses on Business English; as well as specialized
classes designed to prepare students for international examinations such as the
International English Language Testing System (IELTS) and the Test of
English for International Communication (TOEIC).
Facing stiff competition from Korean entrepreneurs and investors,
public and private local and international schools nationwide have also begun
offering ESL programs. For example, on top of their mainstream classes, both
Brent International School branches in Manila and Baguio City now offer
specialist ESL courses that cater to the foreign students’ level of L2 proficiency
(Brent International School Manila, n.d.; Brent International School Baguio,
n.d.). Even colleges and universities with sizable foreign student populations
now offer supplementary ESL or remedial English classes to foreign students
who wish or are required to improve their English language proficiency.
3 SSPs are issued to international students studying non-degree special courses for a period not exceeding one year. (Choe, 2016, p. 2). 4 An example of a non-traditional ESL course is the Sparta Program (MONOL, n.d.) offered by the MONOL Education Institute, one of the fieldwork sites for my research. These programs operate in a somewhat clockwork fashion requiring military-like discipline, encouraging students to follow a very strict study timetable that involves attending regular ESL classes while fulfilling their planned and customized self-study sessions.

10
1.3.2 Baguio City: a popular choice for Korean ESL learners
The Philippine ESL industry has focused its growth and constrained its
expansion to the country’s largest urban centers, since it is within these areas
that large concentrations of Korean students can be found (see Figure 2 below).
One such urban center, Baguio City has the reputation for being one of the most
preferred places for ESL education, and even secondary and tertiary education
courses.
With approximately 345,000 residents, Baguio is a medium-sized city
of about 49 sq. km., situated in the northern part of the country in the island of
Luzon (Philippine Statistics Authority, 2016b). Despite its relatively small land
area, the city is populated by lush pine tree forests, sitting atop a plateau 1,400
meters above sea level. Dubbed as the “Summer Capital of the Philippines”, its
temperature averages 21ºC throughout the year – about 8ºC cooler than any
lowland place in the country (City Government of Baguio, n.d.). In a
quintessentially hot and humid tropical country situated near the equator,
Baguio’s high altitude, all-year-round cool climate, and pleasant environment
are without a doubt the main draw not only for tourists, but also for students and
especially parents who seek an ideal learning environment for their children.
Based on the 2010 Census of Population and Housing, student enrollees
made up about 100,000 of Baguio’s then 318,676 inhabitants (Philippine
Statistics Authority, 2013, 2014) – a fact that firmly establishes the city’s status
as the education hub of the North.5 Baguio is also host to more than 5,000
Korean students (Keith, 2015), and sizable communities of Korean immigrants
5 The abovementioned student population was obtained from the 2010 Census of Population’s demographic and household characteristics based on 20-percent sample households in Baguio City (Philippine Statistics Authority, 2014). The raw student population figure for the city in 2010 was estimated to be much higher at 150,000 (City Government of Baguio, n.d.).

11
and Christian missionary groups. With the recent drive by the Department of
Tourism (DOT) to boost the tourism industry through promoting and enhancing
the country’s ESL market (Andrade, 2016), it is safe to say that Baguio, billing
itself both as a tourist destination and an ESL education hub, should see a further
increase in tourist arrivals and foreign student intake in the next few years.
Figure 3: Philippine urban centers with large concentrations of Korean students and residents (Google Maps, 2016). Blue pins mark the location of the cities with the largest concentration of Korean students in the Philippines. They are Baguio, Angeles, Iloilo, Bacolod, Cagayan de Oro, and the metropolitan centers Manila, Cebu, and Davao.

12
Figure 4: Panoramic view of Aurora Hill, Baguio (picture taken by me). This is where I stayed for the entire duration of my fieldwork.
1.4 Statement of the problem
The Philippines has become the most preferred country for ESL learning for
East Asian and Southeast Asian students primarily due to its low tuition and
living costs, and well-trained Filipino ESL teachers (Choe, 2016). The ESL
industry boom, however, overshadows the complexity of the linguistic and
educational landscapes that influence and shape the use of PhilE, the de facto
medium of learning and instruction in the country. Despite boasting a
population of well-trained ESL teachers, many foreign students continue to
view Filipino-accented English – and PhilE in general – less favorably than its
more predominant and prestigious counterpart varieties such as American
English (AmE) and British English (BrE) (Castro & Roh, 2013; de Guzman et
al., 2006; Roh, 2010). Korean students also primarily view ESL learning in the
Philippines as a stepping-stone, or what Choe (2016) refers to as a bridge to
tertiary education in Inner Circle countries (in the Kachruvian sense). For many
Koreans, the English medium-based education in the Philippines serves as a
viable low-cost option for attaining an internationally acceptable level of
functional literacy and communicative competence in English (Gomez, 2013).
It can thus be seen from the outset that foreign learners of English in this part

13
of the world appear to be struggling with conflicting ideologies about language
learning in a non-native setting. At a time of ever-increasing globalization and
economic competitiveness, foreign learners of English are becoming more
eager to achieve native-like proficiency, but at the same time are searching for
alternative and more affordable ways to do so.
1.5 Research questions and hypothesis
From the more macro, socio-economic and perhaps even political perspective,
the rise of ESL industry in the Philippines demands a thorough examination and
analysis. The present study, however, wishes to first deal with the social and
linguistic aspects of the phenomenon, since this area has been largely
understudied. I also believe – given that my approach to the issue at hand is
primarily sociolinguistic in nature – that it is essential to investigate foreign
learners’ production patterns during L2 speech acquisition, since one of the
main objectives of ESL education is to help learners achieve communicative
competence in their L2.
Indeed, not much is known about the nature of sociolinguistic variation
in the Philippine ESL context. The majority of foreign nationals studying in the
Philippines embark on eight- or twelve-week immersion programs, but a
considerable number take the long-term track, spending at least six months or
even years studying English (or high school/college courses taught in English).
Given that PhilE is perceptibly distinct from the predominant and more
prestigious varieties of English (i.e., American English and British English), it
would be interesting to answer the following research questions:
1. Are Korean learners acquiring PhilE-like features in their L2 speech

14
production patterns? Is there any evidence of phonetic transfer from L1
to L2 (Kang & Guion, 2006; M.-R. Kim, 2012a), or vice-versa (cf.
Chang, 2012; Park, 2014)?
2. What sociophonetic factors are relevant to the learners’ production of
L1 and L2 consonantal stops in their course of L2 phonetic acquisition?
3. What do the variations in L1 or L2 speech production patterns (if any)
say about leaners’ perception and attitudes toward ESL learning in a
non-native English-speaking context such as the Philippines?
I hypothesize that Korean learners will display differing levels of PhilE-like
phonetic patterns in their production of stops based on their degree or length of
exposure to PhilE, as well as exhibit variation conditioned by several relevant
linguistic, social, and/or stylistic factors. With this, I proceed to my discussion
of works done by scholars of SLA, phonetics, and sociolinguistics that have
shaped and influenced the theoretical and conceptual underpinnings, as well as
the methodological approaches employed in the present study.

15
CHAPTER 2
REVIEW OF RELATED LITERATURE
2.1 Sociolinguistic variation in second language acquisition
Preston (1996, p. 1) summarized the two-fold importance of (variationist)
sociolinguistics to the study of SLA. First, second language contexts exhibit
systematic variation in the production, processing, and acquisition of language.
Second, such variation has both sociological and cognitive bases, and thus SLA
studies must concern themselves with the sociological and social-psychological
aspects of language. He also claimed, however, that sociolinguistic variationist
approaches to the study of SLA have not been popular in the field of SLA
research, primarily due to the persisting dichotomy between SLA research
(which is predominantly influenced by the generative paradigm, and is mainly
psycholinguistic in method and application), and sociolinguistics (in which
language studies are driven primarily by sociological, social psychological, and
anthropological aims). There also have been misunderstandings in the definition
of the variable rule among SLA researchers, e.g., Preston pointed out that Ellis’
(1985) definition (see quote below) was fallacious as it pertained to a context-
sensitive categorical rule (as opposed to a variable rule):
If it is accepted that learners perform differently in different situations, but that it is possible to predict how they will behave in specific situations, then the systematicity of their behavior can be captured by means of variable rules. These are ‘if… then’ rules. They state that if x conditions apply then y language forms will occur. (p. 9)
Given the scholarly beginnings of SLA research, Preston (1991) also succinctly
elucidated the ‘psycholinguistic puzzle’ for sociolinguistic studies:
(1) Variability arises when “social” situations activate realizations or even

16
frequencies of realizations of alternate items from a single underlying grammar. (2) Variability arises when “social” situations activate different underlying grammars, however minimally different those grammars may be. (p. 33)
Indeed, the main objectives of, and approaches to, SLA research remain largely
psycholinguistic in nature; the generative paradigm that is Universal Grammar
(UG) still resonates among some proponents of SLA theories.6 But as Preston
(1996) noted, variationist analysis does not necessarily pose a threat to UG
models of either native or second/foreign language linguistic competence since
variation has always been a central tenet to SLA research conceptually and
methodologically: it has been a fact of life in interlanguage and in language
acquisition research (Berdan, 1996, p. 206). (Interlanguage is the systematic
and rule governed speech of second language learners (Adamson, 1988). This
definition is a revision of Selinker’s (1972), which stated that L2 speech is
systematic only at the level of the individual.)
The above claims on interlanguage are echoed and exemplified by
Tsimpli (2006, p. 390), who argued that even though the ‘grammar approach’
to SLA builds mainly on syntactic theory and inevitably ignores performance
factors or other non-linguistic constraints on L2 performance, it is still possible
to analyze variation in the L2 speaker based on interactive models involving
parts of the language faculty and other aspects of cognitive or motor systems
that affect language performance. Variability is change (Labov, 1972); any
changes to the phonological patterning and acquisition in a second language
6 After decades of debate and accumulating evidence from research carried out by scholars from various academic (sub-) fields and disciplines, Ellis (2015) has finally omitted dealing with language universals and UG in his recently revised book, which was first published in 1985. He argued that purely linguistic theories have fallen out of favor, since proponents of such theories have been unable to provide an adequate account of how second languages are learned. He added that the two major developments in SLA research now and should primarily address the cognitive and social aspects of SLA.

17
context must warrant an investigation of sociolinguistic variation.
In his 2005 article, Bayley emphasized four key areas of study wherein
variationist, quantitative approaches can have potential and significant
contributions to SLA research: the effects of language transfer, the nature of the
target language, the nature of SLA processes, and the acquisition of
sociolinguistic competence. Bayley underscored the usefulness of variable rule
analysis – or VARBRUL (Sankoff, 1988) – in providing a systematic and
effective way to study potential transfer effects on L2 due to L1. He argued that
assessing the degree (if any) of language transfer could be measured by
performing several analyses, with a group of learners representing different first
languages combined, and with learners separated by first language (p. 4). If the
first group shows different language patterns (in the target L2) and if these
patterns reflect a linguistic difference in their respective L1s, then language
transfer effects may plausibly play a role in the given variation phenomenon.
Bayley also emphasized the importance of variationist approaches
because they can reveal the nature of the target language(s) that second language
learners are seeking to acquire. He also believed that studying different contexts
of variation in SLA (i.e., cross-linguistically, and involving various languages
and interlanguage situations) can help us better identify the nature of the
language transfer phenomenon in SLA.
Finally, Bayley emphasized how variationist approaches enable us to
study the acquisition of target language patterns of variability. What this means
is that incorporating variationist theories and methods can extend the aim of
SLA research from modeling language learners’ patterns and processes of
acquisition to examining the actual social ramifications of their (potentially)

18
acquired L2 features. In this view, combining SLA and variationist theories and
research methods enables us to know and understand how second language
learners use variable L2 features to index and/or negotiate their identities (or
personas), beliefs, language ideologies and attitudes.
It has been established that variability is fundamental to SLA, and that
variationist analyses inevitably must address larger issues relating to (1) the
cognition of human grammar (or grammars, in the case of interlanguage
phenomenon), and (2) the social context within which language acquisition
takes place. These issues are strongly exemplified in Ellis (2015), the recently
published second edition of his famous work, Understanding Second Language
Acquisition. Ellis argued that SLA scholars now should primarily turn to the
importance of cognitive psychology-based research to help explain the
mechanisms of cognitive processing of language input and output, and the role
they play in second-language development. He also placed equal importance to
the development and application of social theories to SLA research, openly
acknowledging the view that language acquisition is just as much social as it is
cognitive in nature.
From the outset and at first glance, SLA research and variationist
sociolinguistics appear to be two distinct, incompatible fields of knowledge
inquiry, separated and demarcated by their respective theoretical underpinnings,
methodological approaches, and overall research objectives. However, drawing
from what has been discussed so far, social variation is in fact essential and
crucial to interlanguage; there is no reason why we should not adopt
sociolinguistic methods in SLA research, nor why sociolinguistic theories
cannot inform theories of cognition and ultimately enrich our knowledge of

19
language acquisition.
While there are many studies that attempt to describe and model the
variation phenomenon in SLA based on the linguistic, cognitive, and/or social
aspects of language acquisition, the present study particularly pays attention to
the variation phenomenon involving (1) the PHKor learners’ speech production
patterns in their L1 and L2, and (2) their sociolinguistic perception of Filipino-
accented English, which I will generally refer to as the ‘PhilE accent’. In the
next few sections, I begin with a discussion of the earlier, but still prevailing,
theories and models that describe and explain linguistic variation and language
acquisition in second language contexts. I then further narrow down my
literature review to focus more on (rather) more recent theories and models of
L2 speech acquisition. Finally, I discuss relevant studies on the speech
production of stop consonants in Korean, English, and Filipino, and relevant
studies on the production and perception of IVEs/non-native Englishes and
foreign accents in general.
2.2 Theoretical frameworks and concepts in L2 speech acquisition
2.2.1 Early Labovian approaches to SLA research
L. Dickerson (1974) and W. Dickerson (1976) provided some of the earliest
quantitative, longitudinal variationist studies of SLA. In her dissertation, L.
Dickerson investigated the variables /z/, /s/, /ð/, /r/, and /l/ of Japanese learners
of English at the University of Illinois at Urbana-Champaign in the United
States and adopted Labov’s variable rule model of sound change (W. Dickerson
examined /r/ and /l/ using a much smaller sample of Japanese ESL learners).
Both studies showed that:

20
1) the linguistic environment is a predictor of variable occurrence, and 2) longitudinal (or apparent-time) treatment of data reveals the progress of linguistic change (in SLA, in the individual rather than in the system, although it may also be shown that such changes in ‘like’ individuals are systematic; that is, there is shared interlanguage development). (Cited in Preston, 1996, p. 8)
Other earlier models of SLA that have incorporated the Labovian paradigm
include Tarone’s (1979, 1982) Continuous Competence Model and Krashen’s
(1976, 1977, 1981, 1987) Monitor Model. Both adopt Labov’s (1972) attention
to speech model, but differ in terms of how they view style, as well as monitor
or attention to speech.7 For Tarone, style is a continuum within which the
language acquirer can exhibit varying degrees of monitoring or attention to
form. Krashen, on the other hand, believed that style is made up of two distinct
modules. He suggested that some few rules are easily represented and are
attained through conscious activity (learning), but most rules are in fact difficult
to describe (through explicit instruction) and are therefore attained through
unconscious means (acquisition).
Cazden, Cancino, Rosansky and Schumann (1975) and Hakuta (1976)
pioneered some of the first systematic studies on SLA, focusing on the
acquisition of English by non-native speakers. Looking at Cazden et al.’s study,
7 The concept of style here primarily draws from Labov’s earlier works in the 1960s. Although Labov has not explicitly defined what style is, he has provided five ‘methodological axioms’ or working principles of identifying, delineating, and measuring it (Labov, 1984, p. 29):
• There are no single style speakers: all individuals exhibit varying degrees of style shifting. This refers to any consistent change in linguistic forms used by a speaker, qualitative or quantitative, which can be associated with a change in topics, participants, channel, or the broader social context.
• Styles can range along a single dimension, measured by the amount of attention paid to speech: style shifting is influenced by the amount of attention that is paid to speech.
• The vernacular, in which the minimum attention is paid to speech, provides the most systematic data for linguistic analysis: Labov defined the “vernacular” as the mode of speech that is acquired early in life (pre-adolescence).
• Any systematic observation of a speaker defines a formal context where more than the minimum attention is paid to speech: the more formal the context of the conversation is, the more likely speakers are going to pay attention to their own speech (and therefore the less likely they are to shift to the vernacular style).
• Face-to-face interviews are the only means of obtaining the volume and quality of recorded speech that is needed for quantitative analysis.

21
they investigated the untutored acquisition of English in the USA by six native
speakers of Spanish (two children, two adolescents, and two adults, by
collecting speech samples in three different situations: spontaneous
conversations, elicitations (elicited conversations and experimental
elicitations), and pre-planned sociolinguistic interactions, roughly resembling
the template of Labovian sociolinguistic interviews.8 Their model of L2
acquisition suggests that when language learners pay attention to their L2, the
(grammatical) simplifications that occur in their L2 may be similar in form to
those that occur in their L1, but the motivations for their occurrence may be
different: for L1 learners, cases of such ‘simplification’ occur due to constraints
of cognitive development, but for L2 learners, they function as strategies of
communication. Simplification here refers to the participants’ attempts to use
prototypical lexico-grammatical items or patterns in the L2 based on their
knowledge of their L1. A classic example provided by Cazden et al. (1975, p.
84) involves wh-questions in English. The learners, during their course of L2
acquisition, should encounter both inverted (i.e., wh-fronted) and uninverted
(embedded) forms, which enable them to choose to either simplify their L2
grammar or use the L1 form. Simplifying the L2 grammar would prompt the
learners to produce uninverted (embedded) wh-constructions, e.g., *I know
where he is going? which are considered ‘incorrect’ forms. Such forms would
be eventually and accordingly corrected through the process of checking them
against their L2 knowledge, continuing to attend to L2 input, and revising their
L2 knowledge.
8 Experimental elicitations were a series of numerous elicitation tasks that required participants to provide specific answers to questions/instructions. Some of these include imitating utterances, negating statements, answering tag questions and wh- questions, translating English sentences into Spanish and vice-versa, transforming active sentences into passives, etc.

22
According to L. Dickerson (1974), “(a) homogenous system cannot
change through time; a variable system can” (p. 19). As shown by the studies I
have mentioned that incorporate Labovian theories and methods, variability is
critical and essential to understanding language acquisition. Indeed, once we
accept the assumption that language variation – and by extension, language
change – are inherent and inexorable, fundamental features of language
acquisition, the following key issues make better conceptual and
methodological sense under the variable rule paradigm:
• investigating how learners (young or adult) can acquire new
phonological features in their speech, and
• how existing or newly developed features can vary according to
linguistic environment, stylistic differences, or other potentially
significant internal/external factors.
Before I proceed to the next sub-section, wherein I elaborate on the
relevant and (relatively) more recent theories and models of L2 acquisition that
focus on phonological variation and change, I would like to discuss two more
studies on sociolinguistic variation in SLA. The first one is Beebe (1980), which
investigated the word-initial and final /ɹ/ production patterns of nine Thai ESL
learners living in New York and provided very interesting evidence of style
shifting in interlanguage phonology:
…the target language (English) acted as the superordinate rule system when the variable examined had no social meaning in the native language (Thai), but when the variable was in fact strongly marked for social value in Thai, the native language (Thai) was adopted as the superordinate rule system. The latter style shifting involved transfer of a socially appropriate variant. (p. 433)
Beebe’s findings provide some evidence to support Tarone’s (1979, 1983,
1989) claim that the rule system in the target language (i.e., L2 English)

23
‘permeates’ more in formal L2 situations such as elicitation tasks: Thai ESL
learners exhibited 72% accuracy in the pronunciation of word-final /ɹ/ in the
formal style (wordlist), but only 35% in the informal style (conversation). Data
on word-initial /ɹ/, however, showed that L1 phonetic interference was
significant in the L2 formal style, where Thai speakers exhibited 48% accuracy
in the pronunciation of word-initial /ɹ/ in conversation, but only 9% in listing.
Also, and more importantly, the most formal ‘r’ variant in Thai, /ř/, occurred
significantly (24.4%) in the L2 listing, indicating that the sociolinguistic pattern
of Thai learners in their L1 (Thai) formal style were being transferred to their
L2 (English) formal style. Beebe’s findings suggest that the system of
interlanguage phonology is more complex than previously thought: the transfer
of L1 social identity cues to the developing L2 phonology (in the case of the
Thai ESL learners, the transfer of the “highly conscious, learned social
meaning” (p. 444) indexed by the formal and socially appropriate formal Thai
phonetic variant /ř/ to English), shows that social contexts and socially assigned
values contribute to the variation in linguistic forms manifested during SLA.
Also in this case, we can see that the Labovian notion of ‘style shifting’ occurred
across styles not only within the same language but also in interlanguage.
The other study I would like to discuss is Eisenstein (1982), which
examined 74 adult ESL learners also living in New York but hailing from a
range of L1 backgrounds. This study was different not only because the setting
involved multiple L1s, but also because the research objective aimed to shed
light on social variation in adult speech perception (as opposed to production).
More specifically, Eisenstein’s study aimed to describe and explain the
development of dialect discrimination and identification of English dialect

24
stereotypes in New York City (i.e., New York English and Black English)
involving second language learners of English.9
Eisenstein integrated data from three tasks, i.e., dialect discrimination,
speaker evaluation, and personal interview, and concluded that beginning
learners could satisfactorily discriminate between dialects by their seventh
month of living in New York, although the type of dialect discrimination at this
stage primarily involves distinguishing standard norms from non-standard ones.
In other words, beginning learners remain largely unaware of non-standard
dialectal differences, which is what we would expect given that most of their
language learning and exposure is confined to formal learning environments.
Eisenstein also found that dialect discrimination of Black English among
advanced learners was closer to native speaker judgments, which is expected
given that their level of linguistic knowledge and exposure to the New York
speech community would have already increased their awareness of such dialect
variety. However, she also discovered that advanced learners were unable to
recognize the non-standard New York dialect due to the nature of its “wide
dispersion in both lower and middle classes and its prevalence among some
native students at the university”, which suggests that developing a high level
of dialect discrimination and second language proficiency “are not sufficient
conditions for the formulation of specific categories associated with cultural
attitudes and norms” (p. 388).
Over the decades, more studies on language attitudes and perception of
9 Native speakers of the following languages were included in the study: Spanish, Persian, Greek, Arabic, Chinese, French, French Creole, Hebrew, Hungarian, Indonesian, Italian, Japanese, Korean, Portuguese, Russian, Rumanian, and Thai. Meanwhile, the English dialects considered in the study were Black English, New York English, Hawaiian English, and Irish English. The first two English dialects were included because they are commonly encountered in daily New York life; the latter two dialects were added as control variables (Eisenstein, 1982).

25
L2 English learners have been published, detailing the sociolinguistic aspects
of L2 speech acquisition (for example, see McKenzie, 2007). These studies have
revealed that knowledge of dialect or regional variation is crucial to developing
native-like competence in second language learning. They have also shed light
on the importance of regional and social variation in the perception of different
varieties of English among L2 learners, which have serious implications on
(second) language pedagogy.
2.2.2 Cognitive models of L2 speech acquisition
In this sub-section, I elaborate on two, rather more recent frameworks of L2
acquisition that focus on phonological change and phonetic transfer: The
Speech Learning Model (SLM) developed by Flege and his colleagues (1995,
1996) and the Perceptual Assimilation Model-L2 (PAM-L2) developed by Best
and Tyler (2007). Although these speech models draw from a primarily
psycholinguistic approach, I believe that their implications on language transfer
and dynamics of interaction between first- and second-language phonological
systems prove useful and relevant to my study. I then proceed to Section 2.2.3
and discuss a few more relevant theoretical concepts, i.e., phonetic drift (Chang,
2012), polarization (Keating, 1984; Laeufer, 1986), and incrementation (Labov,
2007), before moving to the next sub-section, where I introduce the
sociophonetic theories and approaches to the study of linguistic variation and
language acquisition.
Drawing from the discussion in Section 2.2.1, earlier SLA research (e.g.,
Cazden et al., 1975) acknowledged the importance of examining various factors
influencing SLA but mostly concentrated on examining L1 interference on L2
acquisition (cf. Flege, 1995). The issue surrounding presumed L1 invariance

26
during second-language acquisition (Chang, 2012), however, has been brought
to light thanks to ever-increasing evidence of L2 to L1 language transfer in
various SLA contexts. The most extensively documented and notable research
of this kind was carried out by Flege (1987, 1995, 1996, 2002, 2007) at the
University of Alabama at Birmingham, which resulted in the development of
the Speech Learning Model (SLM). According to Flege, the SLM was
developed under the assumption that:
…phonetic systems used in the production and perception of vowels and consonants remain adaptive over the life span, and that phonetic systems reorganize in response to sounds encountered in an L2 through the addition of new phonetic categories, or through the modification of old ones. (1995, p. 233)
The SLM also postulates that the bilingual system accommodates L1 and L2
phonetic categories in a common phonological space, but constantly strives to
maintain contrast between them. Furthermore, the model makes categorical
distinctions of L1 and L2 sounds at the allophonic, and not phonemic, level,
which contrasts with phonological theories of SLA (e.g., Lado, 1957).
According to Flege, discerning cross-language phonetic differences is possible
even in fine-grained allophonic variations, provided that (1) there is sufficient
dissimilarity between a novel L2 sound and its closest L1 sound, and that (2)
the L2 sound transmitted to – and perceived by – the language acquirer carries
adequate ‘native-speaker’ information.
The above SLM postulates crucially trace back to the concept of
equivalence classification, defined by Flege (1987, p. 49) as “a basic cognitive
mechanism which permits humans to perceive constant categories in the face of
inherent sensory variability found in the many physical exemplars which may
instantiate a category”. In other words, it is a cognitive mechanism that allows
language learners to identify and classify a range of sounds produced by various

27
speakers or in different contexts (e.g., linguistic environment, speech style, etc.)
into the same (allophonic) category. He argued that this very mechanism, as age
of learning (AOL) increases, may cause phonetic convergence (category
assimilation). In this case, when an L2 learner is exposed to an L2 sound that is
phonetically ‘similar’ to an existing L1 sound in his phonological space,
equivalence classification prevents him from being able to perceive the fine-
grained cross-linguistic phonetic differences, resulting in the approximation of
the sounds in the interlanguage. In other words, the original L1 phonetic
category is modified to accommodate the ‘similar’ L2 sound, and the production
and perception of the L1 and L2 sounds in the interlanguage will reflect the
modification of the L1 phonetic category, potentially causing the L2 learner to
diverge from monolingual norms (Yeni-Komshian, Flege, & Liu, 2000).
Meanwhile, an L2 learner’s exposure to a ‘new’ L2 sound (one that is
unique or distinct to the L2 and not analogous to any existing, known L1 sound)
does not activate or avoids equivalence classification, which results in phonetic
divergence, i.e., category dissimilation, or the creation of a new phonetic
category in the interlanguage. The acquisition of a new sound may even affect
L1 pronunciation; the shared phonological space becomes ‘pressured’ to
maintain (and perhaps even maximize) phonological contrast between the
existing sound inventory from the L1 and the newly created one from the L2.10
This process, parallel to the case of phonetic assimilation, also causes the L2
learner to diverge from monolingual norms.
Another relevant, competing cognitive model of L2 speech acquisition
10 Keating (1984) referred to the phenomenon of maximizing contrast between two phonetic categories as polarization. (See p. 31 for a more in depth discussion.)

28
is Best & Tyler’s (2007) PAM-L2. This is a modification of the Perception
Assimilation Model (PAM), a theoretical framework designed to account for
non-native speech perception among naïve listeners (as opposed to the SLM,
which was developed based on SLA studies that involved experienced
listeners). The PAM-L2 differs from the SLM mainly in that it primarily
addressed the issue of equivalence classification at the (articulatory) gestural,
phonetic, and phonological levels. Best & Tyler claimed that:
Equivalence at the lexical-functional level means that the phonological category has a similar contrastive relationship to surrounding categories in the phonological space. It does not automatically imply equivalence or even perceived similarity at the phonetic level. (pp. 27-28)
They cited the perception of /r/ among English L2 learners of French as a case
of equivalence classification at the phonological level, arguing that French /r/
and English /r/ are not very ‘articulatorily’ and phonetically similar, yet learners
perceive the former as phonemically similar to the latter.11 Their essential
argument was that L2 learners are able to perceive and ultimately learn
articulatory gestures and phonological (and not just phonetic) information
during their L2 acquisition. (It must be noted that (Standard) French /r/ is
prototypically described as a uvular fricative [ʁ]; meanwhile, English /r/ is
classified as an alveolar approximant [ɹ], although this may vary across regional
varieties and dialects. For example, in Regala-Flores’ (2014) study of
(Basilectal) PhilE, the English /r/ sound is rendered differently, i.e., as a rolled
(trill) consonant [r] or a one-tap [ɾ]. However, in my experience of speaking and
11 (Standard) French /r/ is prototypically described as a uvular fricative [ʁ]. Meanwhile, English /r/ is classified as an alveolar approximant [ɹ], although this may vary across regional varieties and dialects. For example, in Regala-Flores’ (2014) study of (Basilectal) PhilE, the English /r/ sound is rendered differently, i.e., as a rolled (trill) consonant [r] or a one-tap [ɾ]. However, in my experience of speaking and listening to my Filipino student participants, I noticed that most of them use a rather perceptually more elongated, more retroflex version of the General AmE [ɹ].

29
listening to my Filipino student participants, I noticed that most of them use a
rather perceptually more elongated, more retroflex version of General AmE [ɹ].)
PAM-L2 provides a much more detailed account of predicting success
at L2 perceptual learning, but does not overtly explain how L2 perception can
potentially influence L1 production patterns. In this regard, SLM provides a
more holistic view of SLA, in that it provides a (more) bi-directional view of
language, i.e., phonetic, transfer. Both SLM and PAM-L2, however, cannot
comprehensively account for cross-linguistic perceptual relations beyond the
segmental level (Chang, 2012, p. 264). Nonetheless, both frameworks
acknowledge that L2 acquisition is guided by the perceptual similarity between
L1 and L2 sounds (Chang, 2012; Flege, 1996), and that the perceived relations
between these sounds in the interlanguage may change during naturalistic
learning (Flege, 1995, p. 237). They also both offer a way to help explain age-
related effects, suggesting that linguistic and language learning experience, and
not necessarily or primarily physical changes in the neurology of the brain (cf.
McLaughlin, 1977) play a much larger role in the rate of success (or decline) of
L2 speech acquisition.
2.2.3 Phonetic drift and sound change in L2 speech acquisition
In the discussion of the SLM (Flege, 1995), it was mentioned that perceptual
interference can occur in a ‘reverse’ manner, as in the case of phonetic
convergence when an L2 sound is approximated with (or assimilated to, in more
PAM-L2 terms) an existing, known L1 sound. Thus, I find it more appropriate
to use the term phonetic drift (Chang, 2012), which is a broader, more neutral
term that describes the (potentially) bi-directional process of language – more
specifically phonetic – transfer in the interlanguage. As implied by the term,

30
acoustic perceptual similarities between L1 and L2 sounds may influence (i.e.,
cause to change, in the affective sense) the production of the L2 sound, as well
as of the L1 sound. In either case, the resulting sound change could be either
assimilatory or dissimilatory.12
Assimilatory cases of phonetic drift in VOT have been observed in
several studies. In Harada’s (2003) study of Japanese-English bilinguals, it was
found that the speakers make a distinction between L1 and L2 VOT values
regardless of the place of articulation, thus successfully creating two different
phonetic categories for L1 and L2 VOT (p. 1087). However, Harada noted that
the speakers’ L1 phonetic category was different from monolingual norms,
since they produced significantly longer VOT values. Meanwhile, in the study
of early and late Korean-English bilinguals in Kang & Guion (2006), it was
found that while early Korean-English bilinguals manifested a clear distinction
between L1 and L2 phonetic categories, late bilinguals seemed to have
assimilated them, producing English voiced stops that were less dissimilar from
both Korean fortis and lenis stops in terms of VOT. They also produced Korean
stops that were significantly different from monolingual norms, which also
indicated assimilatory phonetic drift from L2 to L1. Other notable cases of
category assimilation were observed in late English-Spanish bilinguals in the
United States (Lord, 2008) and in early and late Italian-English bilinguals in
Canada (Mackay, Flege, Piske & Schirru, 2001).
Dissimilatory cases of phonetic drift also abound. In Mack’s (1990)
study of a single French-English bilingual child, it was observed that the boy
12 Category assimilation and category dissimilation are analogous to phonetic convergence and phonetic divergence, respectively.

31
produced both L1 and ‘new’ L2 VOT values that were much longer than French
and English monolingual norms. Meanwhile, a slightly different and
unexpected trend was observed in early Japanese-English child bilinguals by
Yusa, Nasukawa, Koizumi, Kim, Kimura and Emura (2010), who found that
exposure to English (which is characterized by relatively long-lag VOT) caused
the speakers to produce significantly shorter L1 VOT.13 Flege and Eefting
(1987a, b) also found cases of dissimilatory drift among (1) proficient and non-
proficient adult Dutch-English bilinguals, and (2) Spanish-English bilingual
children and adult, “later childhood bilinguals” or LCB (Flege & Eefting,
1987b, p. 71). In the former case, Dutch-English bilinguals produced
significantly shorter L1 /t/ to maintain phonological contrast with their newly
developed L2 phonetic category. This trend was observed mostly in adult (but
early) proficient Dutch-English bilinguals, which draws an interesting parallel
to Yusa et al.’s (2010) findings on early naïve Japanese-English bilinguals.
Meanwhile, in the latter case, Spanish-English bilinguals showed significantly
shorter VOT values for both L1 and L2 in comparison with age-matched
Spanish and English monolinguals.
Flege & Eefting’s (1987a, b) findings on category dissimilation
provided evidence supporting the principle of polarization, which states that
phonetic categories within a shared phonological space disperse to reach a
“maximal separation of the distributions of values” (Keating, 1984, p. 310; cf.
Liljencrants & Lindblom’s (1972) dispersion theory). The findings also
13 The L1 VOT findings by Yusa et al. (2010) contrast with those of Harada (2003). In this light, Chang (2012) argued that their findings were ambiguous based on the notion that children have comparably little L1 experience, and underdeveloped L1 representations that are still in the process of maturation. Thus, changes in the L1 phonetic category can be attributed to the normal process of language development.

32
suggested that the convergent L2 effect on L1 production (in Chang’s (2012)
terms, phonetic drift from L2 to L1) was brought about by the non-native nature
of the L2 input. In other words, the new L2 phonetic category acquired by the
speakers was systematically different from English monolingual norms
“because much of their L2 input was likely to have been Spanish-accented
English rather than the English spoken by English native speakers” (1987b, p.
67).
The studies I have mentioned present cases of assimilatory and
dissimilatory phonetic drift involving single, isolated phonetic features (i.e.,
VOT). However, analyzing phonetic drift becomes complicated and more
problematic when the process of sound change during L2 speech acquisition
involves (1) the interaction of two or more (segmental/suprasegmental) features
in the same phonetic category or (2) assimilatory modifications on a few
structural levels (Chang, 2012). The above conditions have been well
exemplified in the literature by cases of L2 speech acquisition contexts
involving Korean as either L1 or L2. Korean is an interesting object of study in
SLA due to its three-way stop system (Han & Weitzman, 1965, 1967, 1970; C-
W. Kim, 1965; Ladefoged, 2005; Lisker & Abramson, 1964), which involves
varying degrees of VOT length, and therefore aspiration, in speech production.
For instance, M.-R. Kim’s (2000, 2003, 2012a, b) extensive research on the
interlanguage of adult Korean-English bilinguals highlights the complexity of
consonantal (aspiration) and vocalic (tonal) feature interactions in bilingual
phonological systems, which has been difficult to account for with Flege’s
(1995) assimilation theory. Based on her findings, adult Korean-English
bilinguals were found to produce L2 voiced stops that significantly differed

33
from any of the Korean and English stop types as they exhibited some sort of
dual behavior in terms of two acoustic parameters: VOT, a consonantal feature,
and fundamental frequency at vowel onset (f0 onset), a vocalic/tonal feature –
see Table 1 below.
In terms of VOT, Table 1 below also shows that English voiced stops
are more comparable to Korean lenis stops, which are prototypically produced
with short-lag to intermediate VOT length (also see: C.-W. Kim, 1965). In terms
of f0 onset, however, English voiced stops are more comparable to Korean fortis
stops, which normally have intermediate to high f0 onset values. I would also
like to highlight M.-R. Kim’s #s/ptk/L2 label, which refers to English voiceless
stops in word-initial syllabic consonant clusters beginning with a voiceless
sibilant, i.e., /s/. Based on her findings, English stops in this phonetic
environment correspond to fortis stops in Korean in terms of VOT and f0 onset.
According to M.-R. Kim, L2 voiced stops also exhibited overall shorter
VOT and lower f0 onset, which were systematically different from Korean and
English monolingual production norms. She also argued that the cross-linguistic
patterns of VOT and f0 onset appear to be dissimilatory at first, but based on the
SLM it may not necessarily be so, since the likelihood of developing ‘new’
phonetic categories for L2 sounds diminishes with increasing age of learning
(Flege, 1995). She, however, noted a clear-cut assimilatory process of phonetic
drift from L1 to L2 in the case of L2 voiceless stops, which exhibited long-lag
VOT and high f0 onset values that strongly corresponded with their L1 aspirated
counterparts. Overall, Kim’s study highlighted the importance of interactional
effects in L2 speech acquisition, suggesting that examining one phonetic feature
alone (e.g., VOT) may not be sufficient to determine the nature and explain the

34
Table 1: Classification of the L1 and L2 stop system in the interlanguage of Korean-English bilinguals. Adopted from M.-R. Kim (2012a).
f0 onset
Low High
VOT
Short-lag Voiced L2 Fortis L1
and #s/ptk/ L2
Long-lag Lenis L1 Voiceless L2
And Aspirated L1
process of phonetic drift in the interlanguage. It was also interesting to entertain
the idea – despite the need for further evidence – of both assimilatory and
dissimilatory processes of phonetic drift potentially (and perhaps even
simultaneously) occurring in the phonological space.
Chang (2012) published perhaps one of the most extensive and in-depth
studies on phonetic drift in L2 speech acquisition involving the Korean
language. The study, set in Korea, examined both L1 and L2 stop consonantal
and vowel systems of 19 adult and “functionally monolingual” (Best & Tyler,
2007, p. 16) English speakers from the onset of their (short-term) formal
learning of L2 Korean until completion. Chang’s findings illustrated a complex
series of feature interactions and cross-language phonetic effects that occurred
at both segmental and subsegmental, as well as global/systemic levels of speech
production. The study thus revealed how phonetic drift can take place beyond
segment-to-segment cross-linguistic connections (p. 255), and manifest in
larger structures, e.g., in a global distribution of phonetic properties (f0 onset
following aspirated and fortis stops regardless of phonetic environment), or
even in a whole system of sounds, such as vowels. In Table 2 below, I have
summarized Chang’s (2012) findings on L2 to L1 phonetic drift based on the
phonetic feature involved and the level of phonological structure in which the

35
Table 2: Observed cases of L1 phonetic drift in the speech production of English learners of Korean. In this table, I have summarized Chang’s (2012) findings on L1 phonetic drift.
Phonetic feature
Level of phonological
structure
Categorical assimilation / linkages between L1 (English) and L2 (Korean)
VOT
Subsegmental L1 voiceless stops lengthened in approximation to the longer VOT of L2 aspirated stops
Segmental
L1 /t/ lengthened to a much lesser degree due to the segmental nature of L2 /th/ (it has the shortest mean VOT length among all L2 stop types based on Chang’s data).
f0 onset
Subsegmental
f0 onset following L1 voiced stops drifted upward, approximating the f0 onset of L2 fortis stops.
f0 onset following L1 voiceless stops also drifted upward, but this time approximating the f0 onset of L2 aspirated stops.
Global
Shared control mechanism for f0 modulation: L1 f0 onset in both stop-initial and vowel-initial words all experienced upward drift, approximating the higher f0 onset of Korean.
Vowel formants (F1 & F2)
Global Mean F1 value of the English vowel system approximated the mean F1 value of the Korean vowel system; little change in mean F2 value.
assimilatory procedures take place.
In accordance to the principles of the SLM and PAM-L2, Chang’s study
showed that variation or changes in L1 speech production could occur rapidly
even at the early stages of language acquisition. Chang’s findings also
highlighted (to a much greater extent) the importance of L2 perceptual input,
the linguistic background of the study participants, and the nature of the L2
learning environment – hence, the overall language setting and linguistic
experience during L2 speech acquisition. Thus, regarding the phonetic study of
L2 learners, he concluded:
The point to take away, however, is not that study participants should always be monolingual. Rather, the experiential characteristics of the study sample should accurately represent the population which the study means to investigate. (p. 266)
Chang explains that because experiential characteristics are crucial to language
36
acquisition, it is essential to conduct speech production research in the most
natural setting as possible. He proposed that work on cross-linguistic speech
production should consider phonetic drift in other types of linguistic
experiences, such as ambient L2 exposure and interactions with non-native
speakers. In the works of Flege and Eefting (1987b), for instance, we see the
importance of identifying the non-native nature of the L2 input received by the
Spanish-English bilingual speakers in determining the type of language transfer
(i.e., dissimilatory phonetic drift) that manifested in their speech production. In
fact, linguistic experience has always been a focal research topic in phonetics,
sociolinguistics, and SLA studies, tracing back to earlier works on speech
production (e.g., Flege, 1987) and even speech perception (e.g., Eisenstein,
1982; Liberman, Harris, Hoffman, & Griffith, 1957).
Chang (2013) also mentioned the importance of novel information in
systematic phonetic changes in the production of L1 sounds starting in the first
weeks of L2 learning. Studying eleven adult native AmE speakers who were
also experienced learners of L2 Korean, and comparing their L1 and L2 speech
production patterns with novice L2 learners in Chang (2012), Chang showed
that phonetic drift was greater in novice learners, supporting the hypothesis that
“experienced learners manifested less phonetic drift in their production of L1
stops and vowels than experienced learners” and suggesting that “progressive
familiarization with an L2 leads to reduced phonetic drift at later stages of L2
experience” (p. 520). Chang, however, emphasized that phonetic drift can still
be present among the more experienced L2 learners – they are simply less
influenced than learners who are new to the L2.

37
Phonetic variation and change in L2 speech acquisition manifest not
only in the actual production patterns of L2 speakers, but also in the perception
of L2 listeners. As a case in point, let us consider another study that involved
Korean as L2. Park (2014) investigated the effects of pitch on L2 learners’
categorical perception of Korean alveolar lenis and fortis stops, /t/ and /t*/. The
study, set in Korea, involved 13 native English speakers taking up an
introductory Korean language course at the University of Milwaukee. By
employing a listening, AX (same-different) discrimination task in two pairs of
stimuli – #CV (non-words) and #CVC (minimal pairs) – and artificially
manipulating the natural pitch of the sound input using Praat (Boersma &
Weenink, 2015), Park found that the learners were unable to discriminate
between Korean /t*/ and /t/ when the former’s natural pitch was reduced, but not
when the pitch contrast between the two stops was neutralized. This suggested
that the learners were sensitive to f0 (at onset) cues and not VOT cues, causing
them to primarily employ f0 cues to discriminate Korean /t/ and /t*/.
Park’s findings presented interesting key points pertaining to the nature
of categorical assimilation in L2 speech acquisition. First, they provide
evidence for the claim that L2 secondary cues play a greater role in category
assimilation during L2 speech acquisition, which was suggested by Llanos,
Dmitrieva, Shultz and Francis (2013) in their study of Spanish-English
bilinguals. Second, they show that learners of L2 Korean are following the same
recent shift from a predominantly VOT-based to f0-based categorical perception
(and speech production) of the Korean stop system found among monolingual
Korean speakers (M.-R. Kim, 2000, 2012a, b; more details on this in the next
subsection). The predominance of f0 cues also implies some categorical
38
assimilation potentially occurring at the global level, evident from Chang’s
(2012) study of L1 to L2 phonetic drift in English-Korean bilinguals (see also
Kim & Park, 2001).
Based on Chang’s works on L2-influenced phonetic drift in the L1 of
English learners of Korean, and on Park’s work on the categorical perception of
L2 among the same type of bilingual learners, I believe that it will be insightful
to view phonetic drift involving the English and Korean languages in a ‘flipped’
setting, in which Korean serves as the L1, and English the L2. From a
sociolinguistic point of view, it is also interesting to problematize the notion of
phonetic drift in non-native contexts. While this has been done in other studies
(e.g., Flege & Eefting, 1987a, b), there are virtually no in-depth studies of
sociolinguistic variation in the Philippine ESL context that look at both L1 and
L2 speech production and perception.
Overall, the theoretical concepts and frameworks discussed above have
been useful in revealing speech output patterns and learning developments in
L2 learners. However, as Leung (2012) stated, these frameworks fall short in
terms of integrating relevant factors in L2 speech acquisition like actual (L2)
language input, as well as a myriad of social and other affective factors.
Proponents of SLA research claim that in order to comprehensively describe
and explain the phenomenon of (second) language acquisition, one must
integrate the cognitive, psychological, and social aspects of acquisition (Ellis,
2010, 2015; Leung, 2011, 2012; Milroy & Preston, 1999; Niedzielski, 1999;
Ryan & Giles, 1982). Not much is known, however, about the sociolinguistics
of L2 speech acquisition in non-native settings such as the Philippines, where
foreign learners of English are exposed to PhilE through exposure in the

39
classroom and in the larger Filipino-English bilingual speech community. In
this regard, the present study seeks to fill the sociolinguistic gap in SLA research
by investigating the speech production and perception of Korean learners
through the application of sociophonetic theory and research methods.
2.3 Differences between Korean and English: VOT and f0 onset
2.3.1 Korean
Phonologically, the sound systems of Korean and PhilE differ in numerous
ways. In terms of consonants, the stop system of Korean is distinct from that of
PhilE. Stops are generally classified in terms of their Voice Onset Time (VOT),
which is defined as the period from the stop burst to the onset of vocal fold
pulsing (Lisker & Abramson, 1964; Thomas, 2011). VOT is further subdivided
into three distinct categories: lead/pre-voicing, where vocal fold pulsing occurs
before the stop burst; short-lag, in which the duration between the burst onset
and pulsation onset ranges from 0ms to less than 30ms; and long-lag, in which
the said duration exceeds 30ms. Based on this categorization, Korean is unique
among the world’s languages in that its three stop categories include only short-
lag and long-lag stops (see Flege, 1995; Han & Weitzman, 1965, 1967, 1970;
Table 3: Mean Korean word-initial VOT (ms) and VOT range across the decades (adopted from M.-R. Kim, 2012c; cited in Park, 2014, p. 28)
VOT duration / ms
Fortis Lenis Aspirated Mean difference (Aspirated – Lenis)
1960s – 1970s
Mean 11 32 104 68
Range 0-52 15-100 30-210
1990s – 2002s
Mean 14 49 91 42
Range 9-50 15-89 75-121 2004 – present
Mean 15 63 77 14 Range 2-26 17-171 22-196

40
Table 4: Comparing mean Korean word-initial VOT data from various studies (standard deviation values in parenthesis). VOT data is sorted by phonation type and gender. For the present study, the data presented below was drawn from the PHKor group. Note that the PHKor group exhibited the overall shortest mean VOT duration for lenis and aspirated stops.
VOT duration / ms Fortis Lenis Aspirated Females Males Females Males Females Males Silva (2006a) 10 (8) 11 (7) 67 (23) 63 (25) 76 (27) 71 (25) Oh (2011) 14 (9) 17 (9) 58 (21) 57 (21) 72 (21) 85 (20) Chang (2012) 11 (4) 17 (6) 64 (18) 55 (28) 90 (24) 97 (24)
Present study 11 (7) 13 (6) 55 (18) 40 (22) 70 (16) 60 (22)
M.-R. Kim, 2000; Lisker & Abramson, 1964). Korean short-lag stops /p*, t*, k*/
are called fortis (or tense) stops and are characterized by very short VOT values
(0 to less than 30ms). Korean long-lag stops /p, t, k/ and /ph, th, kh/ are
respectively called lenis (or lax) and aspirated. Lenis stops have intermediate
VOT values; aspirated stops have long ones.
The Korean stop system, however, has been undergoing a generational
change from below – in the Neogrammarian sense, incrementation (Beckman,
Li, Kong & Edwards, 2014) – in that younger speakers are producing lenis and
aspirated stops that are gradually merging or becoming neutralized (Choi, 2002;
Kang & Guion, 2008; Kang & Han, 2013; M.-R. Kim, 2008, 2011b, 2014; Oh,
2011; Silva, Choi & Kim, 2004; Silva 2006a; Wright, 2007). Moreover, the
apparent VOT merger has been accompanied by a contrastive shift in
fundamental frequency (f0), which is a measure of pitch and tone. As mentioned
in Section 2.2.3 earlier, f0 at vowel onset (f0 onset) following stops in word– or
syllable–initial position now increasingly functions as the primary cue in
distinguishing Korean lax stops from aspirated ones. This occurs in particular

41
at the beginning of a prosodic unit termed by Jun (1998) as the Accentual
Phrase, in which distinctions in the Korean stop system are made more apparent
by contrasting tone in the vowel onset of the initial syllable, instead of
contrasting the degree (length) of aspiration in the stop (Beckman et al., 2014).14
Apparent-time evidence of this phenomenon has also been gathered and
documented in various studies (Kang & Guion, 2008; Keating, 1984; M.-R.
Kim, 2000, 2008, 2012a, 2014; Kim, Beddor & Horrocks, 2002; Kim &
Duanmu, 2004; Kingston & Diehl, 1994; Silva, 2006a; Wright, 2007).
The Korean stop system has also been observed to exhibit dialect
variation following the geographical and demographical distribution of the
general Korean dialects. Cho (2004) investigated the production of word-initial
stops produced by Korean speakers from Seoul and from Daegu (in the
Gyeongsang Region) and found that Daegu speakers’ lenis stops had
significantly shorter VOTs than those of Seoul speakers, and had more fortis-
like quality. Holliday and Kong (2011) showed similar findings among young
adult Daegu speakers, observing gender effects on variation wherein males were
more likely to produce shorter VOTs for lenis stops. They also found that sound
change in the Korean stop system was more progressive among Seoul and Jeju
speakers as they produced near-merger VOT values for lenis and aspirated
stops, thus affirming Silva’s (2006a, b) claim that the Korean stop system is
gradually undergoing generational change (see also M.-R. Kim, 2014).15
Looking at the bigger picture of phonological acquisition and language
14 M.-R. Kim (2000) argued that the shift from consonantal to vocalic contrast in the Korean stop system provides evidence that Korean is gradually undergoing tonogenesis. 15 Dialect variation is also present in the production of sibilant fricatives /sh/ (lenis-aspirated) and /s*/ (fortis) by Seoul and Daegu speakers, where Seoul speakers produced significantly longer aspiration durations for both fricative types (see Lee, 2002; Holliday, 2012).

42
change, Beckman et al. (2014) gathered data from various synchronic and
diachronic studies on the Korean stop system and produced corroborating
evidence pointing to the generational transfer and regularity of the shift from
VOT to f0 contrast within the system. They viewed this systematic sound change
as a process of incrementation since it shows continuity between phonological
development (the shift from VOT to tonal contrast) and the age-related variation
observed in the speech community undergoing the change (p. 151). Beckman et
al. also observed gender-based variation in the process incrementation: when
Korean listeners were tasked with discriminating stop phonation types produced
by male speakers, they relied more on VOT cues than f0 cues; the opposite effect
occurred, however, when they were tasked to listen to female speakers. The
effect of gender suggests that the incrementation process in Korean is less
prevalent among male speakers (due to their rather conservative patterns of
phonological change), and more so among females (since their sound changes
are more advanced).
2.3.2 English and PhilE
English has a two-way stop system. The ‘native’, predominant varieties of
English like AmE and BrE are primarily characterized by phonation type, i.e.,
[±voice]. Voiced stops /b/, /d/, and /g/ are typically not very voiced, and instead
are released together with the vowel onset, resulting in a VOT duration of
approximately zero (Benkí, 2005). Voiceless stops /p/, /t/, and /k/ in utterance-
initial position are prototypically long-lag, with intermediate to long VOTs. In
non-native varieties, however, the distribution of voiced and voiceless stops can
vary (see M.-R. Kim, 2011a). For instance, voiceless stops in the PhilE variant
are prototypically unaspirated, even in utterance-initial position (Regala-Flores,

43
2014).
A descriptive analysis of Philippine-based Korean learners’ data from
the present study showed that the mean VOT of English aspirated stops in word-
initial position in formal speech style (i.e., wordlist + reading passage) is 56ms
(σ=23ms), which falls within the range of mean VOT values (54ms ~ 90ms) in
word-initial position produced by ‘native’ English speakers as described in
previous studies (e.g., Lisker & Abramson, 1964; Morris, McCrea & Herring,
2008). However, as far as my knowledge is concerned, no published study has
accounted for and quantitatively measured the VOT durations of stops in PhilE.
Based on the Filipino students’ wordlist data from the present study, voiceless
stops acoustically have very short VOT values regardless of their phonological
environments, and perceptibly sound like fortis stops in Korean. Meanwhile,
voiced stops exhibited mostly zero to lead (i.e., negative) VOT values that seem
comparable to those in Spanish (see Benkí, 2005). Figure 5 below provides a
summary of the mean VOT values for both Philippine-based Korean and
Filipino student participants.
Meanwhile, fundamental frequency (f0) can interact with stop phonation
to differentiate voicing cues (Haggard, Ambler & Callow, 1970), although it
plays a much less crucial role in creating phonemic distinctions in English. But
English exhibits similar control mechanisms for f0 modulation with Korean
(Chang, 2012; M.-R. Kim, 2012a), which is summarized in Table 5 below.
Chang, however, posited that the type of dialect in English may play a role in
L2 Korean-to-L1 English influence, since English dialects vary quite widely in
terms of their vowel positions in the F1 x F2. In the case of PhilE, the vowel
system is substantially different from that of General AmE, but is also similar

44
in that systemic variation exists in terms of regional (Regala-Flores, 2014) and
even lectal differences (see Tayao’s (2004) vowel charts in Figure 6 above).
Bearing this idea of systemic variation in mind, we should therefore expect the
Korean ESL learners’ production of English stops to be affected when they
become exposed to a non-native variety of English.
Table 5: Tonal correspondences between Korean and English, sorted by phonation type (adapted from M.-R. Kim, 2012a).
Korean English
Increasing f0 (tone) at vowel onset following
stop
Aspirated /ph th kh/
Voiceless /p t k/
Fortis /p* t* k*/
Voiceless unaspirated [#s/ptk/_]
Lenis /p t k/
Voiced /b d g/
Figure 5: Mean English VOT values (ms) for word-initial stops produced by Philippine-based Korean (PHKor) and Filipino student participants in formal speech style, i.e., wordlist + reading passage. Data was sorted by phonation type.
3
-25
29
19
56
26
-30
-20
-10
0
10
20
30
40
50
60
70
PHKor (18 participants) FIL (6 participants)
Mea
n VO
T/m
s
Group
Voiced /b d g/ Unaspirated [#s/ptk/] Voiceless /p t k/

45
Figure 6: Vowel charts for (General) American and Philippine English. Adopted from Tayao (2004). The PhilE vowel charts reflect the apparent influence of (socio-economic) lectal variation on PhilE phonology.
To summarize, VOT is primarily used in English to contrast voiced and
voiceless stops. For Korean, stop types are contrasted in terms of both f0 and
VOT. Since the present study concerns speech production in both L1 Korean
and L2 English, f0 and VOT values in both languages will be analyzed to
account for variation in the categorical assimilation of L2 sounds, as well as
changes in L1 and L2 phonetic drift during L2 speech acquisition (cf. Chang,
2012).

46
CHAPTER 3
METHODS
3.1 Participants
3.1.1 PHKor and FIL student participants
The majority of student participants included in the present study constitute part
of a larger pool of participants gathered during fieldwork research conducted in
Baguio City, Philippines from June to July 2015. This fieldwork involved the
collection of two main types of data: (1) audio-recordings of Korean learners
and their teachers in their daily ESL classroom interactions, and (2) individual
audio-recordings of Korean and Filipino student participants performing speech
elicitation and perception identification tasks. A total of 29 Koreans took part
in either or both recording sessions.
The present study, however, has only included and analyzed audio-
recorded data samples obtained from the individual testing sessions. The
individual participants involved in the analysis were divided into two distinct
groups: the main group, which comprises 18 Philippine-based Korean (PHKor)
students, and a comparison sample group of six Filipino (FIL) students. Table
6 below (p. 48) provides a breakdown of the student participant numbers for the
individual testing sessions.
The PHKor group comprises 10 female and 8 male students (µ=20.3
years; σ= 2.59). Of the 18 students, five males and seven females are still on
Long-Term (LT) stay (i.e., at the time of writing this dissertation), living and
studying as full-time undergraduate students at the University of Baguio (UB)

47
in Baguio City. Their mean length of study (LOS) in Baguio City is 5.35 years
(σ=4.84 years).
Six of the LT PHKor students signed up for a month-long English
remedial program offered by their university (these participants also
participated in the classroom recording sessions). Three of these LT students
live with at least one family member; the remaining ones currently live with
their Korean friends or schoolmates in the city’s residential areas, since the
university offers no campus accommodation. Even though the students mostly
hang out among themselves, they are regularly exposed to PhilE, mainly
through classroom- and school-level interactions.
Meanwhile, the remaining six PHKor students (two males and four
females) had enrolled on a short-term (ST), intensive in-house ESL program in
MONOL Educational Institute, a well-known Korean-owned and privately run
institution. Their mean LOS in Baguio City was 0.32 years (or 3.84 months,
σ=0.10 years). The school is well guarded and exclusive; it is also far away from
the city center. Living on campus was compulsory for all students, so the
participants’ exposure to PhilE was therefore limited primarily to their
classroom interactions with their Filipino ESL teachers.
The comparison sample group FIL was obtained from the same tertiary
institution as the LT students from the PHKor group, comprising 3 males and 9
females – all full-time undergraduates currently pursuing nursing or medical
technology courses (µ= 20.3 years, σ=0.82). During my fieldwork, I managed
to interview 12 Filipino students, but due to time constraints, I could analyze
audio-recorded data from only six of them (3 males, 3 females).

48
3.1.2 SGKor participants
The Singapore-based Korean (SGKor) group was collected so that the PHKor
group could be compared to a Korean-speaking group that had no prior exposure
to PhilE or formal teaching instruction from a Filipino-accented teacher of
English. I decided to collect this group in my home university, National
University of Singapore (NUS). The SGKor group comprises 3 female and 2
male students (µ=20.8, σ=1.17) who were on a four-month ST exchange
program in NUS. Data elicitation and perception tasks and audio-recording of
the SGKor students were carried out in March 2016, on the third month of their
student exchange program.
The SGKor students’ L1 Korean and L2 English production patterns,
however, need to be treated with caution. The sociolinguistic conditions for any
potential variation or rapid sound change in the interlanguage for SGKor
students are different; Singapore English (or SgE) is a distinct and nativized
regional variety of English (Hiramoto, 2012; Leimgruber, 2013), displaying
unique phonological and grammatical features (for a general overview of SgE
phonology, see Deterding, 2007).
Table 6: Student numbers for the individual testing sessions. The participants are sorted by their language/educational program (i.e., short-term, ST or long-term, LT).
Short-Term (ST) Long-Term (LT) Total
Philippine-based Korean students
(PHKor)
Female 4 6 10 Male 2 6 8
6 12 18
Filipino students (FIL)
Female 0 9 3 Male 0 3 3
0 12 12
Singapore-based Korean students
(SGKor)
Female 3 0 3 Male 2 0 2
5 0 5 Total 11 24 35

49
But compared to VOT trends in PhilE in Figure 5 (p. 43), and based on
Ng’s (2005) detailed study of SgE VOT patterns across five different
ethnolinguistic affiliations, bilingual Singaporeans generally produce English
stops with mean VOT values that are much less dissimilar from native English
speaker norms (see Figure 7 below for a summary of SgE speakers’ mean VOT
values). If we assume that Ng’s (2005) measurements are a good indication of
VOT norms for word-initial stops among Singaporean speakers of English, we
can expect that potential VOT variations or changes in the SGKor students’
interlanguage – brought about by their increased degree of exposure to SgE –
should be much less significant compared to say, VOT variations or changes in
the PHKor students’ interlanguage due to exposure to PhilE.
3.2 Materials and Procedure
For the individual testing sessions, the participants performed a series of tasks
– namely a perception (identification) task, and four types of production
(elicitation) tasks: word and phrase list tasks in Korean (in Filipino for the
Filipino student participants); a reading passage and a wordlist task, both in
English; and a short casual interview, also in English. Participants attended the
sessions at their respective institutions, usually during their free periods or after
school. Each session took approximately 30 to 40 minutes. All task instructions
were issued in English.
As the Principal Investigator, I successfully conducted audio-recordings
in both schools, but faced several logistical issues. MONOL Institute gave me
access to their school facilities – and while classrooms were always available
for audio-recording, daily constructions that were taking place around the
campus affected the quality of several audio-recording sessions. Meanwhile,

50
Figure 7: Mean VOT values (in ms) of SgE stops, sorted by ethnolinguistic affiliation (adopted from Ng, 2005). Note: asp = aspirated /ptk/; unasp = unaspirated stop /ptk/; vc = voiced stops /bdg/.
UB had a few psychology laboratories and a small sound recording studio – but
I was not granted access to these facilities. Eventually, I had to conduct the
testing sessions in classrooms and other open access areas that were less than
ideal for audio-recording due to their large glass windows and concrete walls
and flooring. There was also one case in which I had to record four LT students

51
(i.e., M5, M6, M7, and M8) on the same day, but no classrooms were available
for me to conduct testing sessions. It was their last day of English remedial
classes and they were free to take part in the testing sessions only on that day. I
had no choice but to conduct the testing sessions in the school cafeteria, which
unfortunately was a tad too noisy for high-quality sociolinguistic audio-
recording. I tried to mitigate potential recording problems by making the
abovementioned participants repeat portions of the task which I felt were not
adequately caught by the audio-recorder. Post-interview, tokens that did not
produce good spectrographs were discarded.
Despite all the above issues, sufficient sociophonetic data per participant
(and per stop consonant in each production and perception task) was gathered,
allowing for a feasible and detailed statistical analysis of VOT and f0 onset in
both Korean and English.
3.2.1 Korean/Filipino language task
The Korean participants were first tested on their L1 speech production through
a wordlist adopted from the Seoul dialect component of Cho, Jun and
Ladefoged’s (2002) speech material and a phrase list adopted from Kang and
Guion (2008). The words and phrases were designed to elicit all the phonemes
in the Korean stop system, /ph p p* th t t* kh k k*/. Overall, 27 Korean items (9
words and 18 phrases) were included in this task. Meanwhile, the FIL students
were asked to read out a wordlist containing words designed to elicit all the stop
phonemes in Filipino (Tagalog), /p t k b d g/.
For both the Korean and Filipino elicitation tasks, each word was
individually and twice displayed on PowerPoint slides that were played on a
MacBook Air 13-inch laptop. The participants were asked to utter the word on

52
each slide twice. All the elicitations were audio-recorded at 96kHz and 16bps
using a Zoom H1 Handy Recorder, Ver. 2.0, with a built-in microphone.
3.2.2 English wordlist and reading passage task
After performing a speaker identification task (see Section 3.2.4 below), all
participants were then tested on their L2 English speech production through two
formal elicitation tasks, a wordlist and a reading passage. The wordlist consisted
of 29 target English words with stops in word-initial position [#_V] and stops
after a voiceless alveolar sibilant, i.e., in [#s/ptk/_] position. Meanwhile, the
reading passage comprised three short paragraphs containing 35 target English
words with stops in word-initial, i.e., [#_V], and in [#s/ptk/_] positions.
Before I proceed with the presentation of my findings in the next
chapter, I must discuss several conceptual and methodological challenges that I
had encountered when I carried out the elicitation tasks in English. First, the
target words in both elicitation materials (wordlist and reading passage) were
not controlled for the following vowel. This was brought about by my initial
plan to include and vary vowel (following the stop consonant) as a linguistic
variable (I initially wanted to also investigate the L2 vowel system of Korean
learners of English, but I decided not to pursue it due to time and space
constraints).
Second, the present study initially included only voiceless stops in the
English wordlist (as they directly correspond to the Korean stop system), so
some of the participants’ wordlist data did not include the English voiced stops
/b d g/. (After I went back to Singapore from my Baguio fieldwork, I attempted
to mitigate this issue by including word- and syllable-initial /b d g/ in the
wordlists of the remaining Korean – that is, SGKor – participants.)

53
Table 7: Word items in Korean and Tagalog whose tokens were sampled and analyzed in the present study.
Korean Unique tokens, n=9
Tagalog Unique tokens, n=12
파다 /ˈphɑtɑ/ “to dig/excavate” pari /ˈparɪ/ “priest” 바다 /ˈpɑtɑ/ “sea” palay /ˈpalaɪ/ “rice plant” 빻다 /ˈp*ɑtɑ/ “to grind” bata /ˈbata/ “child” 타다 /ˈthɑtɑ/ “to ride” balak /ˈbalak/ “motive” 달다 /ˈtɑltɑ/ “to be sweet” tao /ˈtaʔɔ/ “person” 따다 /ˈt*ɑtɑ/ “to pick” tama /ˈtama/ “correct” 카드 /ˈkhɑtɨ/ “card” dagat /ˈdagat/ “sea” 가다 /ˈkɑtɑ/ “to go” daloy /ˈdaloɪ/ “flow” 까다 /ˈk*ɑtɑ/ “to peel” kama /ˈkama/ “bed”
kapit /ˈkapɪt/ “grip” gamit /ˈgamɪt/ “thing” gatas /ˈgatas/ “milk”
Table 8: Target word items in English whose tokens were sampled and analyzed in the present study. These words contain (in word- and syllable-initial position) all the stop phonemes found in American and British Englishes, and PhilE, namely /p b t d k g/.
Wordlist (unique tokens, n=23)
Reading Passage (unique tokens, n=35)
par dance parents time going pat dark party Tina got past car Paul to cake back cap pet Tom car
banter cast Peter toy cat bar gap basketball turn coming
basket gasp be two court bat guard birthday day Karl tar spark but do Kate tap skate buy give Kitty task stop talk go school dad telephone goes
Third, and finally, the reading passage did not equally account for all the
stop types in English (for the same reason stated above), causing some word-
initial voiced stops to have relatively fewer tokens. It also did not include
instances of voiceless stops in consonant cluster position, [#s/ptk/_], except for
[#sk_] in school. Considering these methodological issues, a few clarifications

54
should be noted before proceeding to the analytical chapters: (1) for the wordlist
speech data, only SGKor participants have all /b d g/ tokens; (2) for the reading
passage data, all participant groups do not have [#s/p/_] and [#s/t/_] tokens; (3)
due to the lack of certain stop tokens in the wordlist and in the reading passage,
I decided to collapse both wordlist and reading data sets into one category, i.e.,
formal speech style.
3.2.3 Casual interview
The final elicitation task involved a short casual interview that averaged around
three minutes per participant. The following three main questions were asked:
(1) Describe your favorite Korean food (for PHKor/SGKor participants) or
Filipino food (for FIL participants); (2) Describe an embarrassing moment that
happened to you; and (3) What do you like or do not like about studying English
in Baguio (for PHKor and FIL participants) / in Singapore (for SGKor
participants)? Furthermore, supplementary questions, feedback and/or
comments were included in cases when the participants had difficulty
understanding the main question or expressing themselves in English.
The target word tokens drawn from the conversation speech samples
included all cases of English stops in word-initial, i.e., [#_V], and [#s/ptk_]
positions. To ensure the naturalistic, ‘casual’ nature of the data, only tokens
found after the first minute of each casual interview were included in the data
analysis. Moreover, Korean proper nouns (e.g., Daegu, a city in South Korea’s
Gyeongsang region), as well as Korean words that have been well integrated
into English (e.g., food items like kimchi and bulgogi) were excluded, but not
PhilE words (e.g., Baguio, which is a proper name for a city in the Philippines).

55
3.2.4 Sociolinguistic perception task
All individual participants who performed the elicitation (speech production)
tasks also performed a short sociolinguistic perception task. Due to the
‘experimental’ nature of the testing session, the sociolinguistic perception task
was carried out in between the Korean and English elicitation tasks as a ‘break’
in between them to minimize potential order effects on L1 and L2 speech
production. The methods employed for this task are described and explained in
detail in Chapter 5, Section 5.1.1 (pp. 116-118).
3.2.5 Language Background Questionnaire
At the end of the testing session, each participant was asked to fill in a language
background questionnaire, in which some of the questions were adapted from
Roh (2010) (also cited in Castro & Roh, 2013). The questionnaire comprises
three parts. Part A was designed to gather participant demographic data, such
age, sex, and place, LOS in the Philippines or in Singapore, as well as length of
residence (henceforth LOR) in Korea. Part B included questions on the
participants’ language backgrounds and self-ratings on their L1 and L2
proficiency. In Part C, participants were encouraged to write down their
thoughts or opinions that may not have been covered in the previous sections.
The questionnaires are found in Appendixes 1-3 (pp. 171-185).
Participant responses are also provided in Appendixes 4-5 (pp. 186-189).
3.3 Acoustic Analysis
The dependent variables are VOT of the stop burst and f0 at onset of the
following vowel (henceforth f0 onset). All speech samples used for data analysis
were segmented and analyzed using Praat 5.4.01 (Boersma & Weenink, 2015).

56
Table 9: Breakdown of all stop tokens in word-initial and [#s/ptk/_] positions examined in this study, sorted by participant group.
Group L1 L2
Total Wordlist Wordlist Reading Conversation Subtotal
PHKor 328 705 756 607 2068 2,396 SGKor 87 467 230 145 842 929
FIL 274 346 252 199 797 1071 Total 689 1,518 1,238 951 3,707 4,396
Spectrographic data were manually segmented for VOT and f0 onset, however
all formant and duration measurements were automatically calculated using
FormantPro (Xu, 2007-2015). Tokens that involved anomalous pronunciations,
or showed unclear pulsations or stop bursts due to background noise, or creaky
or irregular phonation, were all discarded. Tables 7 and 8 above provides a
summary of all the tokens examined in the present study.
VOT is defined as the duration between the stop burst and the onset of
pulsation as shown on the waveform (Thomas, 2011). When the pulsation
markings were not clear, VOT boundary was demarcated by the onset of
periodicity in the waveform (Lisker & Abramson, 1964).
Meanwhile, f0 onset was measured from vibrations per unit time (f0 =
1000 x number of regular pulses / span of time in ms). Measurements were
calculated within the first five regular glottal pulses of the vowel. Then, they
were converted into values on a logarithmic (Bark) scale using Traunmüller’s
(1990) formula
Bark = #$.&'×)'*$+,)
− 0.53
where F is frequency in Hertz (Hz). But converting raw into log values does not
control for individual variation in the overall pitch of each of the participants’

57
voices. In effect, the log values were further converted into z-scores. Calculating
the individual z-scores for each participant was performed using the formula
z-score = ./12345678
where µ is the participant’s mean f0 onset, and σ the standard variation. Even
though raw f0 onset values in both English and Korean are presented in Chapter
4, Bark normalized z-scores are used in the descriptive and statistical analyses
of f0 onset.
It must be acknowledged that the present study does not control for the
vowel that follows a word-initial stop or a stop in [#s/ptk/_] position; in phonetic
studies involving an interlanguage, multiple phonetic inventories, or more than
one language/dialect variety, controlling for vowel is often carried out because
vowel correspondence can often vary from one vowel to another and even
among similar vowels across language/dialect varieties. Thus, to grasp a fair
comparison of results from previous works and the present study, all English
stops followed by /ɑ/ – PALM or START vowels, in Wells’ (1982) terms – were
singled out and analyzed separately (total n=673).
3.4 Statistical analyses
To examine L1 and L2 speech production data and sociolinguistic perception
data, various types of statistical analyses were performed, ranging from simple
statistical tests to fitting linear mixed effects regression models. Chapters 4 and
5 provide details of how production and perception data sets were modelled and
quantitatively analyzed for potentially significant patterns of variation based on
several internal (linguistic) and external (social, stylistic) variables and variable
interactions.

58
CHAPTER 4
L1 KOREAN AND L2 ENGLISH SPEECH PRODUCTION
This chapter provides a descriptive and statistical analysis of Voice Onset Time
(VOT) and Fundamental Frequency at the onset of the following vowel (f0
onset) for both L1 Korean and L2 English stops. Sections 4.1 and 4.2 will focus
on L1 and L2 stops in word-initial [#_V] or consonant-cluster [#s/ptk/_]
positions. In these sections, the bulk of the analysis of variation in L1 and L2
VOT and f0 onset will involve looking at relevant internal (linguistic) factors,
i.e., phonation (or voicing) and place of articulation, as well as a few external
factors, e.g., speech style, length of study, and type of study program. The last
section, 4.3, will introduce a series of linear mixed effects regression models
that aim to provide a more detailed view of the earlier findings and account for
other relevant social factors of variation not mentioned in the first three sections.
At this point, I would like to call attention to Sections 4.1 and 4.2. These
sections involve mostly simple and initial t-tests that are designed to illustrate
general points of comparison in the production of L1 Korean and L2 English
stops by the three participant groups; the t-tests themselves do not correct for
the multiple comparisons problem (the alpha level for statistical significance
have not been appropriately adjusted), nor for the problem of pseudoreplication
(Winter, 2011).16 I feel, however, that t-tests remain useful to the present study
and should be presented here, because of the three reasons. First, the tests
16 The present study does not address the problem of pseudoreduplication, since the t-tests used in the study does not make any assumption that all observations are truly independent. For the purposes of providing general patterns and trends in VOT and f0 onset (in both L1 Korean and L2 English),
59
provide an overview of the variation in L1 and L2 stop production among
PHKor, SGKor, and FIL groups. Second, the tests allow us to identify general
patterns and data trends in VOT and f0 onset for each specific internal/external
variable. Third, the tests provide a series of exploratory steps in the overall
analysis of L1 and L2 stop production, aiding in the design, and supplementing
the analysis, of the linear mixed effects regression models.
4.1 Voice Onset Time (VOT)
4.1.1 Variation according to phonation type and speech style
Figure 8 below illustrates the participant groups’ mean English and Korean
word-initial VOTs. English VOT data was sorted such that it corresponded with
the three-way stop distinction in Korean. But as mentioned in Chapter 2, English
features a two-way stop system; thus, to draw correspondence with the three-
way stop system of Korean, a separate category for voiceless unaspirated stops,
[#s/ptk/_], was created. (This cross-linguistic correspondence follows from M.-
R. Kim’s (2012a, b) analysis of L1 and L2 stops produced by Korean learners
of English.) Also, the English VOT data was separated into two sets and sorted
by speech style (i.e., formal and informal) since almost all available works in
the current literature focus on formally elicited English and Korean stop
productions in mostly controlled phonological environments (c.f. Kang and
Guion, 2006).
There were several interesting trends found in the English VOT data
when sorted by phonation type. Compared to the SGKor group, the PHKor
group produced significantly shorter mean VOT for voiceless stops
[t(1783)=4.31, p=0.00002] and significantly longer mean VOT for (voiceless)
unaspirated stops [t(367)=2.42, p=0.01597]. Moreover, FIL students exhibited

60
Figure 8: Mean word-initial L2 English and L1 Korean VOTs (in ms) across different phonation types. English VOT data comprises stop tokens produced in both formal and informal speech styles.
overall lead (i.e., negative) mean VOT for word-initial voiced stops at –18ms,
and relatively short mean VOTs for voiceless stops in word-initial position and
6 3
-18
2621 19
5460
25
12 12
4855
65
79
-30
-10
10
30
50
70
90
PHKor SGKor FIL
Mea
n VO
T/m
s
Group
Mean L2 English and L1 Korean VOT
Voiced Unaspirated Voiceless Fortis Lenis Aspirated
3 1
-25
29
19 20
5660
26
-30
-10
10
30
50
70
90
PHKor SGKor FIL
Mean L2 English VOT[formal speech]
Voiced Unaspirated Voiceless
913
-5
2026
15
48
58
21
-30
-10
10
30
50
70
90
PHKor SGKor FIL
Mean L2 English VOT[informal speech]
Voiced Unaspirated Voiceless

61
(voiceless) unaspirated stops in [#s/ptk/_] position (about 25ms and 19ms,
respectively). The empirical findings for VOT produced by the FIL group thus
support the claim that in PhilE, voiced stops exhibit very short to negative
VOTs, and voiceless stops are prototypically unaspirated in word-initial
position (cf. Regala-Flores, 2014).
More interesting trends in VOT, however, were observed when stylistic
variation was considered. In formal speech, the PHKor group produced
significantly longer mean VOT for voiced stops compared to the FIL group
[t(204)=9.22, p<0.0001]. On the other hand, no significant difference in mean
VOT for voiced stops was found between the PHKor and SGKor groups
[t(488)=0.51, p=0.60878]. In informal speech, the PHKor students also
produced a mean VOT value that was significantly longer than the FIL group,
assuming unequal variances t(100)=4.06, p=0.0001, but significantly shorter
than the SGKor students, assuming unequal variances t(194)=2.34, p=0.02035.
Stylistic variation was also observed regarding the production of
voiceless stops. In formal speech, the PHKor group produced voiceless stops
with a mean VOT that was significantly shorter by 4ms compared to the SGKor
group [PHKor: 56ms, SGKor: 60ms; t(590)=2.66, p=0.0081]. The difference
in mean VOT between the two groups was even greater in informal speech, i.e.,
10ms [PHKor: 48ms, SGKor: 58ms; t(398)=3.45, p=0.00062]. Meanwhile, in
comparison with the FIL group, the PHKor group produced significantly longer
mean VOT for voiceless stops in both speech styles [formal speech:
t(929)=26.94, p<0.0001; informal speech: t(416)=16.56, p<0.0001].
We now look at the effects of speech style on the production of
unaspirated stops. In formal speech, the PHKor group produced significantly

62
longer VOTs for unaspirated stops compared to the SGKor group [t(262)=3.65,
p=<0.0001]. This trend, however, was not observed in informal speech, wherein
no significant difference was found between the mean VOTs of the two
participant groups [t(25)=0.23, p=0.23454]. Speech style, however, did not
seem to affect the PHKor group’s variation in forms in comparison with the FIL
group, as it produced significantly longer mean VOTs in both formal
[t(213)=4.93, p=1.61871e-06] and informal speech [t(46)=2.44, p=0.01876].
We now turn to the effects of speech style in the variation in English
VOT within each group. In informal speech (compared to formal speech), the
PHKor group produced significantly shorter mean VOTs for voiceless stops
[t(1339)=5.63, p= p<0.0001] and unaspirated stops [t(190)=4.13, p= p<0.0001],
but longer mean VOT for voiced stops [t(436)=3.02, p=0.00264]. Interestingly,
the PHKor group’s differences in mean VOT across speech styles somewhat
mirrors that of the FIL group, who, in informal speech, also produced
significantly shorter mean VOTs for voiceless stops[t(311)=3.95, p=0.0001]
and unaspirated stops [t(35)=2.38, p=0.02265], and longer mean VOT for
voiced stops [t(195)=4.59, p<0.0001]. Contrastingly, in informal speech, the
SGKor group produced significantly longer mean VOTs for voiced stops
[t(281)=5.32, p<0.0001], but not for voiceless and unaspirated stops, where no
significant mean VOT differences were found across speech styles. (The
group’s mean VOT for voiceless stops was shorter by approximately 2ms,
which was statistically insignificant [t(442)=0.69, p=0.49055]. On the other
hand, the group’s mean VOT for unaspirated stops was longer by approximately
7ms, although this too was considered statistically insignificant [t(78)=1.51,
p=0.13463].)

63
Table 10: Comparing PHKor participants’ mean English word-initial VOT values (in ms) from the present study with native English VOT norms produced by American speakers of English (standard deviation values in parenthesis). Data for native English VOT norms was adopted from Morris et al. (2008) (cited in Chang, 2012). Voiceless unaspirated stops were produced in complex onset word-initial position, i.e., [#s/ptk/_].
Morris et al. (2008)
Present study (PHKor) [combined wordlist + reading]
Voiced Voiceless Voiced Unaspirated Voiceless
Female
Labial 12 (5) 54 (15) -5 (19) 21 (19) 53 (20) Coronal 16 (6) 69 (16) 4 (21) 20 (12) 58 (20)
Dorsal 22 (8) 63 (14) 19 (19) 35 (15) 66 (21) Combined 17 (6) 62 (15) 5 (22) 25 (16) 59 (21)
Male
Labial 13 (6) 53 (27) -10 (18) 30 (19) 44 (23) Coronal 16 (5) 58 (15) -8 (22) 26 (17) 50 (26)
Dorsal 24 (10) 62 (15) 16 (16) 41 (14) 62 (22) Combined 18 (7) 58 (19) 0 (22) 32 (18) 53 (25)
Extending the discussion to more fine-grained variations, it appears that
PHKor students are more likely to exhibit negative VOTs for word-initial
voiced stops in both formal and informal speech styles. Zooming into informal
speech, males produced mean VOTs of approximately –10ms and –8ms for /b/
and /d/; and in conversation, –8ms for /b/. Females also produced a negative
mean VOT for /b/ (approx. –5ms), but only in formal speech. Meanwhile in the
SGKor group, one male student (M9) had exceedingly negative mean VOT for
voiced stops (µ=–44ms), which was significantly even more negative than the
FIL group’s mean VOT of about –25ms.17 But based on the overall trends in
the data, the PHKor group’s mean VOT for voiced stops, which ranged from
17 SGKor student M9 was the only participant in the study that did not enroll in short-term intensive or long-term English classes in Korea and/or abroad. His stint as an exchange student in Singapore was therefore his first ‘full’ exposure to English language medium instruction. During the interview, he claimed that although English was taught in Korean schools, he had learned to speak the language mostly through self-taught methods, which relied heavily on online resources – and thus well away from the traditional teacher-led classroom instruction. During the formal elicitation tasks, his production of voiced stops perceptibly featured hypercorrections and (somewhat) exaggerated articulations. It is interesting to note, however, that the mean VOT values for his voiceless stops were well within the group average. For this reason, I have decided to nonetheless include his sample tokens in my data analysis.

64
very short (<30ms) to negative, were determined to be significantly much
shorter in comparison with the mean VOT measurements available in the
current literature (see Table 10 above).
The data presented in Figure 8 above also comes from the Korean
wordlist speech sample. Due to constraints in time and space, speech samples
from the phrase list adopted from Kang and Guion (2008) were excluded from
the analysis. Thus, only 415 Korean stop consonant tokens in total (PHKor
n=328; SGKor n=87) were analyzed. Nevertheless, a few notable trends were
observed. The mean VOT for lenis stops produced by the PHKor group was
shorter by approximately 7ms compared to the SGKor group; however, this
mean VOT difference was statistically insignificant [t(134)=1.39, p=0.1687]. A
similar trend was observed for fortis stops: the difference in mean VOT between
the two groups was also statistically insignificant [t(34)=0.19, p=0.8532].
Meanwhile, for aspirated stops, the PHKor group produced significantly shorter
mean VOT compared to the SGKor group [t(140)=3.37, p=0.00097]. This
finding is quite interesting because it seems to correspond to the PHKor group’s
apparent shortening of English voiceless stops in word-initial position.
4.1.2 Place of articulation
We now look at the patterns of variation in English VOT based on place of
articulation (see Figure 9 below). In comparison with the SGKor group, the
PHKor group produced significantly longer mean English VOT for dorsal stops
[t(403)=2.24, p=0.02585] and marginally longer VOT for labial stops
[t(482)=1.78, p=0.07593]. Vis-à-vis the FIL group, the PHKor group produced
significantly longer mean VOT values across all places of articulation.

65
Turning to the production of Korean stops (also see Figure 9 below), the
PHKor group produced overall shorter mean VOTs for compared to the SGKor
group for all places of articulation. Labial, coronal, and dorsal stops produced
by the former group were shorter by approximately 8, 7, and 6ms, respectively.
These mean differences, however, were not statistically significant – although
these could have been affected by the relatively small sample tokens of Korean
VOT data gathered from both the PHKor and SGKor groups (PHKor n=328;
SGKor n=87).
4.1.3 Phonemic contrast
I would now like to discuss more patterns of variation in L1 Korean and L2
English VOT among the Korean participants based on phonemic contrast,
which involves the interaction between phonation and place of articulation (see
Figure 10 below for the normalized z-scores). Comparing the English VOT data
from the PHKor and SGKor groups, their mean VOT difference was statistically
significant for only one phoneme, i.e., /t/, in which the mean VOT of the PHKor
group was significantly shorter compared to the SGKor group [t(589)=3.06,
p=0.00235]). Meanwhile, no significant differences in mean VOT were
observed for the rest of the phonemes: /p/ [t(321)=1.62, p=0.10555]; /k/
[t(162)=0.41, p=0.67921]; /b/ [t(205)=0.35, p=0.72419], /d/ [t(89)=0.31,
p=0.75837], and /g/ [t(135)=1.02, p=0.30803]. Based on these findings, and as
far as the mean VOTs of the PHKor and SGKor groups are concerned, it seems
that the most widespread inter-group variation in L2 English involves the
production of word-initial /t/.
We now turn to the variation in Korean VOT, which is also illustrated
in Figure 10 below. Compared to the SGKor group, the PHKor group produced

66
Figure 9: Mean word-initial L2 English and L1 Korean mean VOT values (in ms) across different places of articulation. English VOT data comprises stop tokens produced in both formal and informal speech styles.
significantly shorter mean VOT for /th/, aspirated stop in coronal position
[t(44)=2.23, p=0.03122].This finding was particularly interesting because it
2420
-4
4542
16
4742
28
57
4541
484954
-10
10
30
50
70
PHKor SGKor FIL
Mea
n VO
T/m
s
Group
Mean L2 English and L1 Korean VOT
Labial (E) Coronal (E) Dorsal (E) Labial (K) Coronal (K) Dorsal (K)
29
18
-6
47
41
18
53
42
32
-10
10
30
50
70
PHKor SGKor FIL
Mean L2 English VOT[formal speech]
Voiced Unaspirated Voiceless
11
27
6
40
52
13
35
41
14
-10
10
30
50
70
PHKor SGKor FIL
Mean L2 English VOT[informal speech]
Labial Coronal Dorsal

67
also appears to correspond to the previously mentioned VOT patterns of English
/t/, a voiceless stop that is also produced in coronal position. Meanwhile, no
significant differences in mean VOT were observed elsewhere, except in the
production of /p*/ (fortis labial stop), where the PHKor group produced
significantly longer mean VOT compared to the SGKor group [t(32)=3.50,
p=0.00138].
4.1.4 Korean aspirated-lenis VOT merger
I would now like to address one of notable features of the Korean stop system
discussed in Chapter 2, the aspirated-lenis VOT merger, which has been widely
considered to be an instantiation of language change. One of the main reasons
for obtaining Korean VOT data was to determine whether VOT merger was
present in either or both the PHKor and SGKor groups. Based on the findings,
VOT merger seemed unlikely for both groups since the mean VOTs for
aspirated stops were much significantly longer compared to mean VOTs for
lenis stops [PHKor: asp.: µ=65ms, lenis: µ=48ms, t(216)=6.22, p=2.56082e-09;
SGKor: asp.: µ=79ms, lenis stops: µ=55ms, t(58)=4.14, p=0.00011].
4.1.5 Study program and Length of study (LOS)
More interesting data trends were observed by looking at the variation in speech
production based on the study background of the participants. For instance,
English VOT production was seen to vary across study programs, i.e., whether
the students were studying long-term/LT (that is, full-time undergraduates in
university), or taking up intensive short-term/ST ESL courses. Based on the
VOT data illustrated in Figure 11 below, LT PHKor students were producing
significantly shorter mean VOTs for all phonation types compared to ST PHKor

68
Figu
re 1
0: M
ean
wor
d-in
itial
L2
Engl
ish
and
L1 K
orea
n VO
T va
lues
(in
ms)
sor
ted
by p
hone
me
type
. Pho
nem
ic c
ontra
st is
the
inte
ract
ion
betw
een
the
type
of
pho
natio
n an
d th
e pl
ace
of a
rticu
latio
n. L
2 En
glis
h VO
T da
ta c
ompr
ises
sto
p to
kens
pro
duce
d in
bot
h fo
rmal
and
info
rmal
spe
ech
styl
es.

69
Figure 11: LT and ST PHKor mean word-initial L2 English and L1 Korean VOT values (in ms) across different phonation types. English VOT data comprises stop tokens produced in formal and informal speech styles.
students. The LT students were also more likely to produce negative VOTs for
voiced stops.
The more notable trends, however, were observed in the production of
voiceless and unaspirated stops. ST and LT PHKor students varied significantly
in their production of English voiceless stops vis-à-vis the comparison group,
SGKor. While the ST PHKor group did not differ significantly from the SGKor
group based on their mean VOTs [t(884)=0.22, p=0.82767], the LT PHKor
group did, producing significantly shorter mean values [t(1074)=7.27,
p=6.82908e-13]. In the case of unaspirated stops, ST PHKor students produced
significantly longer mean VOT compared to the LT PHKor group [t(184)=2.51,
p=0.01308] and to the SGKor group [t(180)=3.23, p=0.00146]. In fact, based
on auditory perception alone, several ST (and even a few LT) PHKor students
12
1
30
24
60
51
13 11
5247
75
61
-10
10
30
50
70
Short-Term (ST) PHKor Long-Term (LT) PHKor
Mea
n VO
T/m
s
Group
Mean L2 English and L1 Korean VOT (PHKor group)
Voiced Unaspirated Voiceless Fortis Lenis Aspirated

70
were producing voiceless stops in [#s/ptk/_] position that showed more
aspiration relative to the SGKor group.
There was also some stylistic variation observed, in that PHKor students
produced aspirated stops in [#s/ptk/_] position more frequently and intensely in
formal speech than in informal speech [t(219)=4.07, p=0.00007]. Overall, the
above findings for English VOT are interesting because they suggest that ESL
learners enrolled in different second-language learning programs and in
different institutions (even if they are located within the same speech
community) may produce dissimilar or varying patterns of English stop
production.
Looking at the Korean VOT data (also see Figure 11 above), it was
observed that overall, the LT PHKor group produced shorter mean VOTs
compared to the ST PHKor group across all phonation types; however, the only
significant mean VOT difference observed was in the production of aspirated
stops [fortis: t(108)=0.99, p=0.3251; lenis: t(57)=1.12, p=0.26577; aspirated:
t(109)=3.83, p=0.00021]. Comparing the ST PHKor and SGKor groups, the
former produced shorter mean VOTs overall, although none of the mean VOT
differences between the groups were statistically significant [fortis: t(63)=0.60,
p=0.54943; lenis: t(63)=0.47, p=0.64234; aspirated: t(65)=0.83, p=0.41131]. In
fact, no other inter-speaker comparisons yielded significant mean VOT
differences, except the LT PHKor and SGKor groups’ production of aspirated
stops [t(104)=4.41, p=0.00003], and lenis stops, which exhibited marginally
significant difference [t(98)=1.78, p=0.07882].
We now turn to the variation in English VOT according to length of
study in years (LOS). In this case, no cross-group comparisons are possible,

71
since all SGKor students in Singapore were on short-term stay (i.e., < 6 months)
and all FIL students in the Philippines were born in the country and have been
studying there since kindergarten or elementary school. Based on the data in
Figure 12 below, the PHKor group’s overall mean VOT seemed to decrease
with increasing LOS (R=-0.11826, p<0.0001, R2=0.014, using the Pearson
correlation test). Although the variance explained is small, we can see that
students who were or have been studying in the Philippines for a much longer
time tended to produce English stops with comparatively shorter VOTs.
Turning to Korean VOT (also see Figure 12 below), no significant
change in overall mean VOT with increasing LOS was observed (R=-0.00208,
p=0.97006, R2=0, using the Pearson correlation test). There is, however, another
piece of apparent-time evidence – that is, the differences in mean VOTs
between LT versus ST PHKor students – which show that the PHKor students’
production of significantly shorter VOTs in Korean aspirated stops runs parallel
to, and in conjunction with, their production of significantly shorter English
voiceless stops. This suggests that some degree of L2-to-L1 interference not
primarily influenced by LOS-related factors could be occurring or have
occurred in the interlanguage of the ST PHKor students. In other words, the
development of such phonetic interference could have potentially arisen due to
other external factors, e.g., varying degrees of exposure to the ambient, non-
native L2 setting, and attention paid to L1 speech, among others.
4.1.6 Interim summary
Before I proceed with the interim summary and discussion of results, it must be
acknowledged that the data and results obtained for Korean VOT (and Korean
f0 onset, in Section 4.2) need to be cautiously interpreted since the sample size

72
Figure 12: PHKor mean word-initial L2 English and L1 Korean VOT values (in ms) across different phonation types. The average LOS for the PHKor group is 5.35 years (σ=4.84); however, one participant (i.e., F5) has been living and studying in the country for almost 18 years (z=3.12).
of Korean stop tokens was relatively small (total n=415). Nonetheless, there
were some interesting patterns of variation and significant trends in the PHKor
-100
-50
0
50
100
150
-1 -0.5 0 0.5 1 1.5 2 2.5 3 3.5Mea
n VO
T/m
s
Length of study (LOS, in years) normalized z-score
Mean L2 English VOT (PHKor group)
0
20
40
60
80
100
120
-1 -0.5 0 0.5 1 1.5 2 2.5 3 3.5
Mea
n VO
T/m
s
Length of study (LOS, in years) normalized z-score
Mean L1 Korean VOT (PHKor group)

73
students’ production of L1 (and L2) stops, which warrant further discussion and
explanation.
Compared to SGKor students in the present study, PHKor students
overall exhibited higher mean VOT for English word-initial voiced stops, but
produced significantly more stop tokens with zero to negative VOT (67% for
PHKor versus for 17% SGKor). Also, compared to Korean learners that had
already been observed in other studies, PHKor students produced significantly
shorter mean VOT for word-initial voiceless stops (see Table 1, p. 34 for a
comparison with Korean learners’ L2 English data in the current literature).
Also, compared to the SGKor students, PHKor students produced overall
shorter Korean VOT durations for all phonation types (fortis, lenis, and
aspirated) and in all places of articulation (labial, coronal, and dorsal). The data,
however, only showed a significant variation in VOT duration for Korean
aspirated stops, which seems to correspond to the production of English
voiceless stops. Nonetheless, the difference between the groups’ respective
mean VOT values for Korean aspirated stops was approximately 14-15ms,
which is perceptibly (in the auditory sense) and acoustically very salient. This
finding is also interesting because the PHKor group’s relatively shorter VOTs
could potentially imply that their exposure to PhilE (whose stop consonants are
characterized primarily by little to no aspiration at the burst onset), as both
medium of instruction and object of acquisition, may have influenced their
speech production patterns not only in their L2, but also in their L1.
The interaction between phonation and place of articulation revealed
some interesting trends in the variation in English VOT. For instance, PHKor
students exhibited significantly different (shorter) mean VOTs only for English

74
/t/; marginally longer VOT durations for Korean /p*/; and significantly shorter
VOT durations for Korean /th/. The latter finding is interesting as it parallels the
significant cross-group VOT differences found in the production of English /t/
in simple onset, word-initial position. As far as the current data and findings are
concerned, the shortening of VOT in Korean /th/ neatly parallels the production
patterns of English /t/, showing a similar effect in both languages. It is, however,
uncertain why PHKor students would significantly lengthen the VOT of Korean
/p*/, although a few explanations are plausible. One, there is probably a lack of
attention paid to Korean speech, since it is less frequently spoken in the ambient
L2 setting. Two, there might be a need for sufficient phonetic distance between
Korean /p*/and English /p/ to maintain phonemic contrast in the speech output,
since the auditory input received for /p/ in their ambient L2 (i.e., PhilE) setting
is more likely to be perceived as unaspirated.
The findings also showed that ST and LT PHKor students produced
varying patterns of English stop production. ST PHKor students, who enrolled
in an intensive in-house ESL program at a private institution, produced overall
longer mean English VOTs that seemed to differ from stop production norms
exhibited by both FIL and SGKor students. LT PHKor students, on the other
hand, produced mean VOTs that were significantly shorter compared to ST
PHKor students, and which appeared to assimilate more to FIL students’ stop
production norms.
Furthermore, ST PHKor students did not differ significantly from
SGKor students in their production of Korean aspirated and lenis stops (LT
PHKor students did so), suggesting that potential L2-to-L1 effects in the
interlanguage may not manifest strongly in the earlier stages of non-native L2

75
speech acquisition. There was, however, no evidence of aspirated-lenis merger
among the participants. To some extent, these findings challenge or provide
counterevidence to the general claim in the current literature that Korean
aspirated and lenis stops are undergoing merger in terms of VOT duration (cf.
Choi, 2002; Kang & Guion, 2008; M.-R. Kim, 2008, 2011b; Oh, 2011; Silva et
al., 2004, Silva, 2006a, b; Wright, 2007). But before any final conclusions can
be drawn from this observation, f0 onset findings must first be presented and
discussed in detail (see Section 4.2), since the Korean stop system involves both
variations and changes in terms of both consonantal and tonal contrasts.
As mentioned earlier in Chapter 2, Section 2.2.3 (p. 36), Chang (2013)
showed that phonetic drift was greater for novice learners of L2 Korean than for
more experienced learners. At this point, it is essential to note that the L1
Korean and L2 English VOT results obtained in the present study reveal a
somewhat different trend in phonetic drift in comparison with the findings
obtained by Chang: LT PHKor students – the more experienced learners of L2
English – showed greater phonetic drift in both L1 and L2 compared to their ST
PHKor counterparts. who, at that point in time, were newly exposed to the non-
native PhilE variety.
It thus seems, based on the apparent-time results of phonetic drift in the
interlanguage (that is, by contrasting short-term vs. long-term trends in L1 and
L2 VOT), that rapid phonetic drift in the L2 can potentially occur in a
dissimilatory manner at the early stages of non-native L2 speech acquisition,
which gradually becomes more assimilatory as it moves more closely to
community norms with prolonged exposure to, or increased degree of linguistic
interaction in, the ambient L2 setting.

76
4.2 Fundamental frequency at vowel onset (f0 onset)
4.2.1 Variation according to phonation type and speech style
Looking at overall trends in f0 onset (see Table 11 and Figure 13 below), the
PHKor group produced an overall mean f0 onset of 200Hz, which was higher
than the mean f0 onset values of 176Hz and 182Hz produced by the SGKor and
FIL groups, respectively. But based on the Bark normalized z-scores, the PHKor
group in fact produced lower overall mean f0 onset for English stops compared
to the SGKor group, although this difference was not statistically significant
[t(1634)=0.38, p=0.70159]. The PHKor group’s overall mean z-score, however,
remained higher compared to the FIL group, although the difference in their
values was also not significant [t(2863)=0.39, p=0.69976].
More fine details of variation were observed from the interaction
between phonation and speech style. In formal speech, the PHKor group
produced significantly lower mean f0 onset compared to the SGKor group for
all stop types; compared to the FIL group, they produced higher mean f0 onset
for voiced stops, but lower mean f0 onset values for voiceless and unaspirated
stops. Meanwhile, in informal speech, the PHKor group produced higher mean
f0 onset than the SGKor group for voiceless stops, but showed no significant
difference for voiced stops. Compared to the FIL group, they showed no
significant overall difference in mean f0 onset in the production of voiceless and
unaspirated stops.
We now turn to the variation in Korean f0 onset. Based on Table 13
below, the PHKor group produced a mean f0 onset of 202Hz for Korean stops
in word-initial position, about 6Hz higher than the 196Hz produced by the
SGKor group, and almost equivalent to the 200Hz average for English stops.

77
Figure 13: Mean word-initial L2 English and L1 Korean f0 onset (in Bark normalized z-scores) across different phonation types. English VOT data comprises stop tokens produced in both formal and informal speech styles.
But if we look at their normalized z-scores, the mean f0 onset values for
both groups (PHKor: z=0.00, σ=0.97, n=328; SGKor: z=0.01, σ=88, n=87) did
-0.7
1
-0.4
1 -0.2
8
0.06
-0.0
2
0.01
0.23
0.34
0.09
0.05
-0.0
2
-0.9
1
-0.5
8
0.83
0.59
-1
-0.8
-0.6
-0.4
-0.2
0
0.2
0.4
0.6
0.8
1
PHKor SGKor FIL
Mea
n f 0
onse
t/ms
(Bar
k no
rmal
ized
z-sc
ore)
Group
Mean L2 English and L1 Korean f0 onset
Voiced Unaspirated Voiceless Fortis Lenis Aspirated
-0.7
8
-0.3
9
-0.4
2
-0.0
1
0.23
-0.0
4
0.2
0.42
0.03
-1
-0.8
-0.6
-0.4
-0.2
0
0.2
0.4
0.6
0.8
1
PHKor SGKor FIL
Mean L2 English f0 onset[formal speech]
Voiced Unaspirated Voiceless
-0.6
3 -0.5
3
-0
.04
0.21
-0.7
2
0.290.
33
-0.0
3
0.31
-1
-0.8
-0.6
-0.4
-0.2
0
0.2
0.4
0.6
0.8
1
PHKor SGKor FIL
Mean L2 English f0 onset[informal speech]
Labial Coronal Dorsal

78
not differ significantly from one another [t(413)=0.09, p=0.92661]. Zooming
into phonation type, no significant differences in mean f0 onset were found for
fortis stops [t(135)=0.49, p=0.6271] and aspirated stops [t(140)=1.37,
p=0.17355], despite the PHKor group producing overall higher mean f0 onset
values for both phonation types. The PHKor group’s mean f0 onset for lenis
stops, however, was significantly lower [t(134)=3.05, p=0.00275] – a finding
that corresponds to the lowering of f0 onset in their English voiced stops.
Table 11: Comparison of the participants’ mean English word-initial f0 onset values (raw values, in Hz) across different phonation types, sorted by speech style. Unaspirated stops were produced in [#s/ptk/_] position.
Phonation type
Voiced Unaspirated [#s/ptk/_] Voiceless Combined
Formal speech
PHKor 179 (49) 197 (64) 204 (64) 199 (63) SGKor 169 (61) 184 (64) 182 (65) 177 (64)
FIL 170 (37) 183 (44) 186 (50) 182 (48)
Informal speech
PHKor 184 (53) 212 (53) 214 (57) 203 (57) SGKor 165 (61) 177 (62) 172 (68) 170 (65)
FIL 175 (52) 185 (42) 189 (46) 184 (43)
Combined PHKor 181 (51) 201 (62) 206 (63) 200 (61) SGKor 168 (61) 183 (63) 181 (66) 176 (64)
FIL 172 (37) 183 (43) 186 (49) 182 (46)
Table 12: Comparison of the participants’ mean English word-initial f0 onset values (raw values, in Hz) across different phonation types, sorted by gender.
Phonation type
Voiced Unaspirated [#s/ptk/_] Voiceless Combined
Female PHKor 218 (31) 241 (39) 250 (43) 242 (42) SGKor 213 (26) 228 (29) 236 (23) 226 (27)
FIL 205 (29) 222 (20) 220 (35) 217 (33)
Male PHKor 130 (18) 143 (40) 152 (33) 147 (33) SGKor 103 (29) 107 (10) 111 (15) 108 (21)
FIL 148 (20) 150 (26) 155 (40) 153 (34)
Combined PHKor 181 (51) 201 (62) 206 (63) 200 (61) SGKor 168 (61) 183 (63) 181 (66) 176 (64)
FIL 172 (37) 183 (43) 186 (49) 183 (46)

79
Table 13: Comparison of the participants’ mean Korean word-initial f0 onset values (raw values, in Hz) across different phonation types, sorted by gender.
Phonation type
Fortis Lenis Aspirated Combined
Female PHKor 254 (29) 217 (17) 274 (43) 249 (39) SGKor 237 (45) 215 (14) 264 (45) 239 (41)
Male PHKor 143 (21) 125 (12) 161 (26) 143 (25) SGKor 134 (20) 106 (10) 149 (19) 132 (24)
Combined PHKor 205 (61) 177 (49) 224 (67) 202 (62) SGKor 191 (63) 178 (54) 216 (68) 196 (63)
4.2.2 Place of articulation
We now examine the variation in English f0 onset according to place of
articulation, using normalized z-scores illustrated in Figure 14 below (see
Tables 14 and 15 below for the raw mean f0 onset values). It was found that the
PHKor and SGKor groups exhibited no significant differences in mean f0 onset
for word-initial English stops for all places of articulation [t(850)=0.30,
p=0.76489]. Moreover, when the PHKor group was compared with the FIL
group, a similar trend was observed except in the production of labial stops, in
which the mean f0 onset of the former group was deemed marginally higher
[t(646)=1.97, p=0.04944]. If we, however, look at the overall trends in the data,
all groups appear to exhibit rather similar patterns of L2 tonal contrast.
We now turn to the variation in Korean f0 onset. Raw mean f0 onset values
and normalized z-scores are respectively summarized in Table 15 and Figure 14
below. Based on the overall trends, no significant cross-group differences in
mean f0 onset were found for Korean stops across all places of articulation,
indicating that place of articulation may not be a significant predictor of
variation in L1 tonal contrast between the two groups.

80
Figure 14: Mean word-initial L2 English and L1 Korean f0 onset (in Bark normalized z-scores) across different places of articulation. English VOT data comprises stop tokens produced in both formal and informal speech styles.
-0.1
1
-0.0
9
-0.2
4
0.08
0.14
0.19
0.02
0.01
0.01
0
0.030.
05
-0.0
5
-0.0
5
0.04
-0.4
-0.2
0
0.2
0.4
PHKor SGKor FIL
Mea
n VO
T/m
s
Group
L2 English and L1 Korean mean f0 onset
Labial (E) Coronal (E) Dorsal (E) Labial (K) Coronal (K) Dorsal (K)
-0.0
6 -0
.02
-0.3
2
0.05
0.21
0.17
0.03 0.
06
-0.0
6
-0.4
-0.2
0
0.2
0.4
PHKor SGKor FIL
L2 English mean f0 onset [formal speech]
Labial Coronal Dorsal
-0.2
5
-0.3
9
0.04
0.14
-0.2
6
0.24
0
-0.2
1
0.24
-0.4
-0.2
0
0.2
0.4
PHKor SGKor FIL
L2 English mean f0 onset[informal speech]
Labial Coronal Dorsal

81
Table 14: Comparison of the participants’ mean English word-initial f0 onset values (raw values, in Hz) across different places of articulation, sorted by speech style.
Place of articulation
Labial Coronal Dorsal Combined
Formal speech
PHKor 197 (62) 201 (64) 199 (62) 199 (63) SGKor 176 (64) 179 (64) 177 (62) 177 (64)
FIL 174 (42) 189 (56) 182 (42) 182 (47)
Informal speech
PHKor 200 (57) 211 (55) 198 (58) 203 (57) SGKor 152 (63) 175 (65) 183 (63) 170 (65)
FIL 171 (35) 189 (48) 190 (41) 184 (43)
Combined PHKor 198 (61) 204 (62) 198 (61) 200 (61) SGKor 172 (64) 178 (64) 178 (62) 176 (64)
FIL 174 (40) 189 (54) 184 (42) 182 (46)
Table 15: Comparison of the participants’ mean English and Korean word-initial f0 onset values (raw values, in Hz) across different places of articulation, sorted by gender.
Place of articulation Labial Coronal Dorsal Combined
L2 E
nglis
h
Female PHKor 237 (42) 245 (42) 243 (40) 242 (41) SGKor 224 (36) 229 (26) 225 (26) 226 (30)
FIL 208 (30) 223 (36) 217 (29) 216 (33)
Male PHKor 143 (33) 148 (33) 146 (33) 146 (33) SGKor 107 (28) 108 (15) 107 (12) 107 (20)
FIL 147 (23) 159 (47) 154 (23) 153 (34)
Combined PHKor 198 (61) 204 (62) 198 (61) 200 (61) SGKor 172 (64) 178 (64) 178 (62) 176 (64)
FIL 174 (40) 189 (54) 184 (42) 182 (46)
L1 K
orea
n
Female PHKor 250 (40) 249 (36) 247 (43) 249 (39) SGKor 241 (53) 248 (30) 234 (41) 239 (41)
Male PHKor 143 (28) 145 (26) 141 (22) 143 (25) SGKor 132 (22) 131 (30) 132 (23) 132 (24)
Combined PHKor 205 (64) 202 (61) 199 (63) 202 (62) SGKor 184 (68) 192 (66) 205 (59) 196 (63)
4.2.3 Phonemic contrast
I would like to discuss more patterns of variation in English f0 onset based on
phonemic contrast, which involves the interaction between phonation and place
of articulation (see normalized z-scores in Figure 15 below). Comparing the
PHKor and SGKor groups, the former group produced significantly lower mean

82
f0 onset for /b/ [t(265)=2.15, p=0.0327], /d/ [t(149)=2.25, p=0.02609], as well
as /g/ [t(248)=3.49, p=0.00057]. Marginal difference in mean English f0 onset
was observed for /t/, a voiceless coronal stop [t(374)=1.82, p=0.06925]. The
latter finding is particularly interesting because one, /t/ was the only voiceless
stop produced by the PHKor group that showed substantial contrast in tone vis-
à-vis the SGKor group; two, the tonal contrast observed seems to parallel the
VOT contrast for the same phoneme (refer to Section 4.1.3, p. 65). Meanwhile,
comparing the PHKor group with the FIL group, no obvious pattern of variation
in mean f0 onset data was observed. But even within the FIL group, there is no
obvious or discernible pattern in f0 onset, suggesting that f0 onset might not play
any significant role in phonemic contrast in PhilE.
Turning to the variation in Korean f0 onset, the PHKor group (compared
to the SGKor group) produced significantly lower mean f0 onset values for only
/p/ [t(41)=3.72, p=0.0006] and /k/ [t(48)=2.20, p=0.0323]; no significant
differences in mean f0 onset were found for /t/ [t(41)=0.03, p=0.97903] and the
rest of the phonemes: fortis /p*/ [t(44)= 0.37, p=0.71355], /t*/ [t(41)=0.14,
p=0.88673], and /k*/ [t(13)=0.53, p=0.60265]; and aspirated /ph/ [t(9)=0.98,
p=0.3518], /th/ [t(44)= p=0.26102], and /kh/ [t (47)=0.18, p=0.86079].
4.2.4 Stops followed by PALM/START vowel
In phonetic studies involving an interlanguage, multiple phonetic inventories,
or more than one language/dialect variety, controlling for vowel is often carried
out because vowel correspondence can often vary from one vowel to another
and even among similar vowels across language/dialect varieties. For example,
in their investigation of tonal contrast in the Korean stop system, M.-R. Kim
(2012a, b) and Park (2014) designed controlled phonological environments for

83
Figu
re 1
5: M
ean
wor
d-in
itial
Eng
lish
f 0 on
set (
Bark
nor
mal
ized
z-v
alue
s) fo
r sto
ps fo
llow
ed b
y /ɑ
/, ac
ross
diff
eren
t pho
natio
n ty
pes.
Dat
a co
mpr
ises
sto
p to
kens
pr
oduc
ed in
form
al a
nd in
form
al s
peec
h st
yles
.

84
stop consonants by making use of mono- or di-syllabic Korean lexical items
comprising word-initial stop token each followed by an /ɑ/ vowel.
Chang (2012) noted that the vowels /i, ɪ, e, ɛ, ʊ, ʌ/ in English are, across
dialects, most similar to the same vowels in Korean in the F1 x F2 space, so the
potential influence of English is similar across dialects. The English /ɑ o u/
vowels, however, exhibit salient disparity across fronting and non-fronting
dialects, so they might influence or affect the way speakers of English acquire
L2 Korean. Similarly, we would expect Korean learners of L2 English to
manifest varying patterns of speech production, especially when exposed to
non-native varieties like PhilE. In terms of vowel positioning in the F1 x F2
space, PhilE is notable for its coalesced category /ɑ/ (Tayao, 2004), which
merges two General AmE phonemes, /æ/ (e.g., pass [pæs] is realized as [pɑs])
and /ʌ/ (e.g., cut [kʌt] is realized as [kɑt]) (refer to Figure 6, p. 45 for the
comparative vowel charts of PhilE and General AmE).
But it must be noted that the methodology and descriptive analysis of f0
onset employed by the present study did not control for Vowel. Thus, to grasp
a fair comparison of results from previous works and the present study, all
English stops followed by /ɑ/ – PALM or START vowels, in Wells’ (1982)
terms – were singled out and analyzed separately (total n=673). For ease of
reference, the PALM and START variants of /ɑ/ were collapsed under one
lexical set, PALM. Figure 16 and Table 16 below illustrate the mean f0 onset
values for English stops followed by PALM, categorized by phonation type.
Based on the normalized z-scores, the overall mean f0 onset for English
stops produced by the PHKor group (z=–0.06) was marginally lower compared
to the SGKor group (z=0.08) [t(490)=1.92, p=0.05604]. Zooming into each type

85
Figure 16: Mean word-initial English f0 onset (Bark normalized z-values) for stops followed by /ɑ/, across different phonation types. Data comprises stop tokens produced in formal and informal speech styles.
Table 16: Comparison of the participants’ mean Korean word-initial f0 onset values (raw values, in Hz) for stops followed by /ɑ/, across different phonation types, sorted by gender.
Phonation type
Voiced Unaspirated [#s/ptk/_]
Voiceless Combined
Female PHKor 220 (38) 229 (38) 250 (49) 243 (47) SGKor 212 (23) 238 (32) 238 (19) 230 (25)
FIL 222 (10) 216 (13) 215 (25 216 (22)
Male PHKor 130 (14) 142 (40) 145 (35) 143 (40) SGKor 98 (6) 110 (2) 109 (9) 106 (10)
FIL 159 (21) 145 (19) 140 (17) 144 (19)
Combined PHKor 166 (52) 192 (58) 197 (67) 194 (65) SGKor 170 (58) 191 (68) 184 (66) 180 (64)
FIL 176 (34) 181 (40) 177 (43) 178 (42)
of phonation, however, reveals that the PHKor group produced significantly
lower mean f0 onset values for voiceless [t(317)=3.79, p=0.00022] and
unaspirated stops [t(93)=2.83, p=0.00569], but not for voiced stops [t(22)=1.08,
p=0.29276]. And compared to the FIL group, the PHKor group produced
-0.5
1
-0.8
7
-0.6
2
0.310.
41
0.17
-0.0
2
-0.1
4
0.34
0.25
0.17
-0.2
3
-0.0
2 0.05
0.05
-0.5
8
-0.8
8
-0.9
2
0.59
0.83
0.83
-1
-0.8
-0.6
-0.4
-0.2
0
0.2
0.4
0.6
0.8
1
SGKo
r
Shor
t-Ter
m (S
T) P
HKor
Long
-Ter
m (L
T) P
HKor FIL
Mea
n f 0
onse
t/ms
(Bar
k no
rmal
ized
z-sc
ore)
Group
L2 English and L1 Korean mean f0 onset
Voiced Unaspirated Voiceless Fortis Lenis Aspirated

86
significantly different (lower) mean f0 onset for voiced [t(29)=2.67, p=0.01237]
and voiceless stops [t(313)=2.49, p=0.01347], but not for unaspirated stops
[t(119)=0.06, p=0.95484].
Turning to English f0 onset, stops preceding /ɑ/ showed rather more
clear-cut patterns of variation. Based on the raw mean f0 onset values in Table
16 above, the PHKor group produced marginally higher mean f0 onset values
for voiceless (197Hz) and unaspirated stops (192Hz) compared to the SGKor
group (184Hz and 191Hz, respectively). But if we look at the normalized z-
scores, the former group in fact exhibited overall lower L2 tonal contrast
patterns for the same types of stops.
4.2.5 Study program and Length of study (LOS)
The data in Figure 16 above also illustrates the variation in English f0 onset
between the ST and LT PHKor students. Based on the Bark normalized z-scores,
the ST PHKor group’s overall trends in mean f0 onset appeared to be more
similar to the SGKor group. In contrast, the LT PHKor group’s trends in f0 mean
onset for voiceless and unaspirated stops appeared to be more similar to the FIL
group, evidenced by their lower z-scores visa-à-vis the ST PHKor group.
Moreover, if we look at the LT PHKor group’s production of voiceless and
unaspirated stops, their f0 onset patterns appear to correspond to their VOT
patterns (the group’s lowering of f0 onset seems to be occurring or have occurred
in conjunction with their shortening of VOT).
We now turn to the differences in Korean f0 onset patterns between the
LT and ST PHKor groups (also see Figure 16 above). Based on the LT and ST
PHKor groups’ normalized z-scores, no significant differences in mean f0 onset
were found for all phonation types [fortis: t(90)=0.45, p=0.65495; lenis:

87
t(108)=0.02, p=0.98782; aspirated t(56)=0.02, p=0.98124]. Also, there were no
significant cross-group differences involving the SGKor group except in the
production of lenis stops, wherein the mean f0 onset values of both PHKor
groups were significantly lower [LT PHKor v SGKor: t(98)= 2.84, p=0.00551;
ST PHKor v SGKor: t(63)=2.54, p=0.01344].
Another interesting observation involves the production of Korean
aspirated stops produced by the LT and ST PHKor groups, since both their mean
f0 onset values were higher compared to the SGKor group. Although the mean
f0 onset differences were not statistically significant [LT PHKor v SGKor:
t(104)=1.37, p=0.17484; ST PHKor v SGKor: t(65)=1.04, p=0.30424], these
Korean f0 onset patterns did not correspond to the English ones (both LT and
ST PHKor students produced overall lower f0 onset for English voiceless stops).
Furthermore, these f0 onset patterns also do not seem to parallel the VOT
patterns observed for either English or Korean (PHKor students produced
shorter overall mean VOT for both English voiceless stops and Korean aspirated
stops).
We now look at the variation in English and Korean f0 onset according
to length of study in years (LOS). Like the VOT case, analysis of inter-speaker
variation in f0 onset was not possible with the SGKor and FIL groups. Based on
the PHKor group’s overall English f0 onset data, no significant changes with
increasing LOS were observed. But narrowing down the analysis to English
stops followed by a PALM vowel has revealed that the overall mean f0 onset
significantly decreased with increasing LOS (R=-0.1868, p<0.001, R2=0.0349)
see Figure 17 below). Although the variance explained is small, we can still
observe that students who were or have been studying in the Philippines for a

88
Figure 17: PHKor mean word-initial L2 English (PALM) and L1 Korean f0 onset (in Bark normalized z-score) sorted by LOS (in years). The average LOS for the PHKor group is 5.35 years (σ=4.84); however, one participant (i.e., F5) has been living and studying in the country for almost 18 years (z=3.12).
much longer time were not only producing shorter VOTs, but also lower f0
onset. For Korean f0 onset, however, no significant changes in mean f0 onset
-4
-3
-2
-1
0
1
2
3
-1 -0.5 0 0.5 1 1.5 2 2.5 3 3.5
Mea
n f 0
onse
t(B
ark
norm
alize
d z-
scor
e)
Length of Study (LOS, in years)normalized z-score
Mean L2 English f0 onset for stops followed by a PALM vowel (PHKor group)
-4
-3
-2
-1
0
1
2
3
-1 -0.5 0 0.5 1 1.5 2 2.5 3 3.5
Mea
n f 0
onse
t(B
ark
norm
alize
d z-
scor
e)
Length of Study (LOS, in years)normalized z-score
Mean L1 Korean f0 onset (PHKor group)

89
with increasing LOS were observed, based on the overall trend in the data (also
see Figure 17 above).
4.2.5 Interim summary and discussion
Inter-speaker variation in terms of overall mean f0 onset was not statistically
significant, suggesting that all participant groups were producing stops with
tonal contrast patterns that lie within a comparable pitch range. Nonetheless, the
PHKor group produced f0 onset values that were, on average, lower and higher
compared to the SGKor and FIL groups, respectively. Thus, the PHKor group’s
patterns of tonal contrast could be considered ‘intermediate’ and possibly
undergoing a state of flux (like the earlier findings in Section 4.1 on consonantal
contrast in English). In other words, the patterns of tonal contrast in the PHKor
group, relatively to the patterns exhibited by the SGKor and FIL groups, point
to a possible downward L2 phonetic drift, in approximation to the f0 onset of
stops in PhilE.
Looking at Korean f0 onset data, the PHKor group produced overall
higher raw mean f0 onset compared to the SGKor group; based on Bark
normalized z-scores, however, both groups did not differ significantly from one
another. In fact, f0 onset patterns only became apparent when data figures were
narrowed down to each phonation type, which showed that significant variation
in f0 onset occurred only in the production of lenis stops. While no other patterns
of variation were deemed significant, this finding is unique in that it corresponds
to the apparent-time lowering of f0 onset in English voiced stops – suggesting a
possible L2-to-L1 interference brought about by linguistic exposure to the
ambient PhilE setting.

90
As mentioned earlier, phonation and speech style had significant effects
on f0 onset. English voiced stops produced by PHKor students in formal speech
were found to diverge in relation to the voiced stops produced by both SGKor
and FIL groups, suggesting that downward but dissimilatory L2 phonetic drift
might be taking place. Interestingly, assimilatory L2 drift was also observed in
the case of voiceless and voiceless stops in informal speech, suggesting that
PHKor students were more likely to drift closer to PhilE pronunciation norms
when paying less attention to speech.
For both English and Korean data, place of articulation did not appear
to be significant to the variation in f0 onset since based on the overall trends, all
participant groups exhibited the same pitch range for each place of articulation.
This finding, however, is unsurprising given that in English, consonantal
articulatory features in the oral cavity play no direct role in vocalic/tonal
contrast because such contrast is principally achieved by varying the rate of
vibration of the vocal folds in the larynx.
In terms of phonemic contrast in English, the PHKor group exhibited
significant variation in f0 onset with the SGKor group but not with the FIL group
(primarily due to the FIL group exhibiting no systematic pattern of variation in
f0 onset). Compared to the SGKor group, the PHKor group produced marginally
lower mean f0 onset for /t/ – an interesting finding, since it appears to occur in
conjunction with their shortening of VOT for the same phoneme. Turning to the
variation in Korean f0 onset, the PHKor group also produced significantly lower
mean f0 onset for /p/ and /k/. This, however, seems more like a case of downward
phonetic drift at the level of phonation (as opposed to phoneme), since both /p/
and /k/ are lenis stops – they correspond to the much lower f0 onset of the FIL

91
group’s voiced stops.
Narrowing down the analysis to English stops preceding /ɑ/ yielded
more clear-cut patterns of variation in f0 onset. The PHKor group exhibited tonal
contrast patterns for voiceless and unaspirated stops that significantly differed
from the SGKor group, producing the stops at much lower f0 onset values.
Furthermore, the former group’s trends in f0 onset for voiceless and unaspirated
stops appeared to be more similar to the FIL group based on apparent time
evidence, i.e., LT PHKor students were producing lower mean f0 onset
compared to ST PHKor and SGKor students (see Figure 15 above). More
interestingly, the PHKor group’s lowering of mean f0 onset for voiceless and
unaspirated stops also appeared to parallel the apparent-time reduction in mean
VOT for the same stops. This finding suggests that LOS may also be a
significant predictor of changes or variations in f0 onset among Korean learners
of L2 English, although it must be acknowledged that if we consider all other
vowel types, the overall variation in tonal contrast (measured in f0 onset) does
not become as clear-cut anymore – not as clear-cut as variation in consonantal
(VOT) contrast.
4.3 Linear mixed effects regression analysis
This section hopes to provide a more comprehensive account of intra- and inter-
speaker variation in L1 and L2 speech production. Data from the Filipino
participants are not further analyzed in this section, since the main objective
here is to narrow down the discussion to the description and explanation of VOT
and f0 onset variation in the L1 and L2 stop systems of the Korean learners.
Four main data sets were collected. From these, 10 statistical models
were created and analyzed with linear mixed effects regression using rbrul

92
(Johnson, 2009), a software package specifically designed for analyzing
quantitative sociolinguistic data. rbrul is compatible with R (Venables & Smith,
2005), a language for statistical computing. Of the 10 statistical models, two
models of VOT (i.e., EngVOT1 and KorVOT1) and three models of f0 onset (i.e.,
EngF01, EngPALM1 and KorF01) were designed to investigate intra-speaker
variation in the PHKor group. The remaining five models, which combined both
PHKor and SGKor data (see Table 17 below), were created to point out
significant patterns of inter-speaker variation.
All models included the following predictor variables: Phonation,
Place, Gender, and the Phonation:Place interaction (i.e., phonemic contrast)
as fixed effects; Participant as a random effect; and Age as a continuous fixed
effect. All regression models used normalized z-scores for Age. The following
effects were then added, depending on the nature of the data set: Style, Dialect,
and Group as fixed effects; Length of study (LOS) as a fixed continuous effect,
with normalized z-scores; and Word as a random effect, to account for potential
lexical variation. Moreover, fixed interactions with Group and with Gender
were also added to models comprising both PHKor and SGKor data. Tables 18
and 19 below summarize the variable assignments for each regression model.
It must be noted that the categorical variable Program (Long-Term/LT
study vs Short-Term/ST study) – described in Chapter 3 and discussed quite
extensively in Sections 4.1 and 4.2 – was excluded from the regression analysis.
Removing the variable somehow mitigates the lack of categorical (i.e., LT v ST)
overlap between the group of intensive ESL PHKor students (all of whom were
on ST stay in the same Korean-run private school) and the group of tertiary
PHKor students (all of whom were on LT study at the same local university).

93
Another reason why Program was excluded was because it exhibited high, data-
based multicollinearity (v.i.f. > 5) with two factors of linguistic exposure,
namely Interaction with Filipino peers (how often they interacted with
Filipino friends/other peers) and Formal learning involvement (how actively
they participated/were involved in their formal L2 learning). These variables,
whose values were taken from the language background questionnaires, were
added to the regression models instead. (The questionnaires are found in
Appendixes 1-3, pp. 171-184.)
In fact, both Interaction and Involvement exhibited linguistic exposure
effects on both the PHKor students’ L1 and L2 speech production (see Figure
18 below). The overall data showed significant decrease in both mean English
and Korean VOTs with increasing level of interaction with Filipino peers.
Similar trends in both English and Korean VOTs were observed with increasing
frequency of involvement in formal L2 learning. Thus, based on these trends,
incorporating the variables to the PHKor regression models seemed more ideal
because they provide more clear-cut categorical measures of the degree of the
PHKor students’ exposure to their ambient, non-native L2 setting.
Table 17: Data sets and regression models used to analyze L2 English and L1 Korean VOT and f0 onset. *For models EngPALM1 and EngPALM2, only English stops followed by a PALM vowel were included. The subscript 1 refers to the first series of regression models, which involve PHKor data, while the subscript 2 refers to the second series involving both PHKor and SGKor data.
Regression models Data set PHKor group (Series #1) PHKor v SGKor (Series #2)
English VOT EngVOT1 EngVOT2
English f0 onset* EngF01
EngPALM1 EngF02
EngPALM2 Korean VOT KorVOT1 KorVOT2
Korean f0 onset KorF01 KorF02

94
Figure 18: PHKor mean word-initial L2 English and L1 Korean VOT (in ms) across different frequencies of interaction with Filipino peers and involvement in formal L2 learning. English VOT data comprises stop tokens produced in formal and informal speech styles.
Table 18: Predictor variable assignments for the PHKor group regression models.
Predictor variables Eng VOT1
Eng F01
Eng PALM1
Kor VOT1
Kor F01
Fixed
Phonation • • • • • Place • • • • •
Gender • • • • • Style • • •
Dialect • • • Interaction • • • • •
involvement • • • • •
Fixed interaction
Phonation Place • • • • •
Gender
Phonation • • • Place • • •
Dialect • • • Style • •
Fixed continuous
Age • • • • • LOS • • • • •
Random Participant • • • • •
Word • • •
47 47
4244
33
37
20
30
40
50
L2 English L1 Korean
Mea
n VO
T/m
s
Interaction with Filipino peers (PHKor group)
No interactionLess interactionMore interaction
5049
38
41
3032
20
30
40
50
L2 English L1 KoreanM
ean
VOT/
ms
Formal learning involvement(PHKor group)
SometimesMostlyAlways

95
Table 19: Predictor variable assignments for the PHKor v SGKor regression models.
Predictor variables Eng VOT2
Eng F02
Eng PALM2
Kor VOT2
Kor F02
Fixed
Phonation • • • • • Place • • • • •
Gender • • • • • Style • • •
Dialect • • • Group • • • • •
Fixed interaction
Phonation Place • • • • •
Group
Phonation • • • • • Place • • • • •
Gender • • • • • Dialect • • •
Gender
Phonation • • • Place • • •
Dialect • • • Style • •
Fixed continuous Age • • • • •
Random Participant • • • • •
Word • • •
4.3.1 Intra-speaker variation: modelling PHKor data
4.3.1.1 L2 English VOT and f0 onset
Tables 20 and 21 below provide a detailed summary of the best step-down
EngVOT1 and EngF01 models for the PHKor group’s English data. The best
step-down EngVOT1 model with a goodness-of-fit (R2) score of 0.672 revealed
two significant internal predictors of variation in English VOT, namely
Phonation (p=9.64e-40) and Place (p=1.8e-07). Three external predictors were
also deemed statistically significant: Age (p=0.00476) + Interaction (with
Filipino peers) (p=0.0114) + (Formal learning) Involvement (p=0.037).
Turning to the variation in English f0 onset, the best step-down EngF01
model differed significantly between males and females; so, fixed interactions
with Gender (i.e., Gender:Phonation, Gender:Place, and Gender:Dialect) were

96
considered in a post-hoc stepwise analysis. None of the resulting statistical
models, however, produced any significantly better fit to the data.
The findings in Section 4.2.4 showed a significant trend in the patterns
of tonal contrast involving English stop consonants followed by a PALM vowel.
Thus, to further examine the patterns of variation in f0 onset for these stops, all
these sample tokens were extracted and analyzed separately in rbrul. The best
step-down EngPALM1 model (R2=0.258, see Table 22 below) revealed three
significant predictors of variation in f0 onset, namely LOS (p=0.00129),
Phonation (0.00855), and Interaction (0.0365). No fixed interactions involving
Gender produced any significantly better fit to the data, based on a chi-square
test [𝜒2=5.97, d.f.=3, p=0.113].
4.3.1.2 L1 Korean VOT and f0 onset
A stepwise analysis of the Korean VOT data resulted in a mismatch between
the best step-up and step-down models. In this section, I discuss both. As shown
in Table 23 below, the best step-down KorVOT1 model (R2=0.767) suggested
three significant predictors of variation in Korean VOT: Phonation (p=7.53e-
93), Place (p=9.53e-11), and Involvement (0.0401). On the other hand, the best
step-up model with a goodness-of-fit (R2) score of 0.767 (see Table 24 below)
revealed the same significant predictors, namely Phonation (p=3.73e-85), Place
(p=9.62e-11), and Involvement (p=0.0401), but also included Gender
(p=0.0218). But since the analysis produced mismatched step-up and step-down
models, a chi-square test was performed to determine the KorVOT1 model that
produced a better fit to the data. Based on the test, the step-up regression
analysis produced the overall better-fit model with a significantly lower
deviance.

97
Table 20: Best step-down EngVOT1 model of L2 English VOT. Predictors: Participant [random, not tested] and Word [random, not tested] and Phonation (9.64e-40) + Place (1.8e-07) + Age (0.00476) + Interaction with Filipino peers (0.0114) + Formal learning involvement (0.037) [p-values dropping from full model]
Deviance=17837.004; Log likelihood=-8918.502; d.f.=13; Grand mean=40.092ms Predictor variable Coefficient Tokens Mean VOT
Phonation Voiceless 22.344 1341 54.375
Unaspirated -2.052 289 26.198 Voiced -20.292 438 5.528
Place Dorsal 5.138 730 47.417
Coronal 3.716 768 44.761 Labial -8.854 570 24.419
Interaction with Filipino
peers
No interaction 4.509 614 47.249 Less interaction 1.811 693 41.683 More interaction -6.320 761 32.868
Formal learning
involvement
Sometimes 7.076 496 49.752 Mostly -1.318 1365 41.683
Always -5.759 207 32.868 Age (continuous) +1 4.548
Table 21: Best step-down EngF01 model of L2 English f0 onset. Predictors: Participant [random, not tested] and Word [random, not tested] and Phonation (1.15e-17) + Style (0.000191) [p-values dropping from full model]
Deviance=5450.946; Log likelihood=-2725.473; d.f.=7; Grand mean=0.007 Predictor variable Coefficient Tokens Mean f0 onset
Phonation Voiceless 0.380 1341 0.231
Unaspirated 0.285 289 0.055 Voiced -0.664 438 -0.711
Style Informal 0.119 607 -0.008 Formal -0.119 1461 0.014
Table 22: Best step-down EngPALM1 model of L2 English f0 onset. Predictors: Participant [random, not tested] and Word [random, not tested] and LOS (0.00129) + Phonation (0.00855) + Interaction with Filipino peers (0.0365) [p-values dropping from full model]
Deviance=784.296; Log likelihood=-392.148; d.f.=9; Grand mean=-0.064 Predictor variable Coefficient Tokens Mean f0 onset
Phonation Voiceless 0.423 221 0.032
Unaspirated 0.088 76 -0.142 Voiced -0.511 20 -0.836
Interaction with Filipino
peers
Less interaction 0.187 98 0.112 No interaction -0.028 98 -0.021
More interaction -0.159 121 -0.242 LOS (continuous) +1 -0.221
Meanwhile, the best step-down KorF01 model for Korean f0 onset
(R2=0.529, see Table 25 below) only revealed one significant predictor of

98
variation in f0, Phonation (1.66e-54). Like the stepwise analysis of the EngF01
and EngPALM1 models, no significant gender effects were observed in the
KorF01 model, even when three fixed interactions with Gender
(Gender:Phonation, Gender:Place, and Gender:Dialect) were included.
Table 23: Best step-down KorVOT1 model of L1 Korean VOT. Predictors: Participant [random, not tested] and Phonation (7.53e-93) + Place (9.53e-11) + Formal learning involvement (0.0401) [p-values dropping from full model]
Deviance=2672.148; Log likelihood=-1336.074; d.f.=9; Grand mean=41.942ms Predictor variable Coefficient Tokens Mean VOT
Phonation Aspirated 23.941 111 65.454
Lenis 6.214 107 48.478 Fortis -30.154 110 11.858
Place Dorsal 7.285 108 48.661
Coronal -2.091 109 40.568 Labial -5.194 111 36.753
Formal learning involvement
Sometimes 8.325 72 48.961 Mostly 0.777 216 41.393
Always -9.101 40 32.269
Table 24: Best step-up KorVOT1 model of L1 Korean VOT. Predictors: Participant [random, not tested] and Phonation (3.73e-85) + Place (9.62e-11) + Formal learning involvement (0.0401) + Gender (0.0218) [p-values building from null model]
Deviance=2667.106; Log likelihood=-1333.553; d.f.=10; Grand mean=41.942ms Predictor variable Coefficient Tokens Mean VOT
Phonation Aspirated 23.937 111 65.454
Lenis 6.209 107 48.478 Fortis -30.146 110 11.858
Place Dorsal 7.297 108 48.661
Coronal -2.082 109 40.568 Labial -5.215 111 36.753
Formal learning involvement
Sometimes 8.528 72 48.961 Mostly 0.333 216 41.393
Always -8.861 40 32.269
Gender Female 3.739 183 45.263 Male -3.739 145 37.749
Table 25: Best step-down KorF01 model of L1 Korean f0 onset. Predictors: Participant [random, not tested] and Phonation (1.66e-54) [p-values dropping from full model]
Deviance=664.642; Log likelihood=-332.321; d.f.=5; Grand mean=0.00 Predictor variable Coefficient Tokens Mean f0 onset
Phonation Aspirated 0.838 111 0.827
Fortis 0.059 110 0.048 Lenis -0.897 107 -0.908

99
4.3.2 Inter-speaker variation: modelling PHKor v SGKor data
4.3.2.1 L2 English VOT and f0 onset
Performing a stepwise analysis with Phonation:Place as the only fixed
interaction produced the best step-down EngVOT2 model (R2=0.652) with only
two significant predictors, Phonation (p=1.78e-51) and Place (p=1.03e-06).
However, adding four fixed interactions involving Group (Group:Phonation,
Group:Place, Group:Style, and Group:Dialect) improved the analysis, but
produced a mismatch between the best step-up and step-down models. The
former model did not differ from the earlier one, having the same goodness-of-
fit (R2=0.652) dropping all pairwise interactions. But the latter model
(R2=0.658, see Table 26 below) revealed three significant fixed interactional
effects, namely Group:Style (p=1.56e-08), Group:Phonation (p=0.000104), and
Group:Place (p=0.0137). Thus, to determine the EngVOT2 model that produced
a better fit to the comparison English VOT data, a chi-square test was
performed. The result [𝜒2=57.36, d.f.=7, p=5.07e-10] suggested that the step-
down model produced a better fit, with a lower deviance of 25547.94 (d.f.=15).
Turning to the variation in English f0 onset, the best EngF02 model
(R2=0.301) with Phonation:Place as the only fixed interaction revealed three
significant predictors, namely Phonation (p=5.15e-17), Group (p=0.000133),
and Style (p=0.0249). The overall goodness-of-fit of the EngF02 model,
however, significantly improved (R2=0.313) when fixed interactions involving
Group were added, based on a chi-square test [𝜒2=52.68, d.f.=3, p=2.14e-11].
Based on Table 28 below, the significant predictors in this model were
Group:Style (p=3.6e-10) and Group:Phonation (p=7.06e-05). Fixed interactions
with Gender were also added, but were eventually dropped as they did not result

100
in any significant improvement to the overall goodness-of-fit to the data.
Table 26: Best step-down EngVOT2 model of L2 English VOT. Predictors: Participant [random, not tested] and Word [random, not tested] and Group:Style (1.56e-08) + Group:Phonation (0.000104) + Group:Place (0.0137) + Group [main effect, not tested] + Style [main effect, not tested] + Place [main effect, not tested] + Phonation [main effect, not tested] [p-values dropping from full model]
Deviance=25547.94; Log likelihood=-12773.97; d.f.=15; Grand mean=38.553ms
Predictor variable Coefficient Tokens Mean VOT
Group SGKor 1.7 842 34.775 PHKor -1.7 2068 40.092
Style Informal 2.658 752 32.799 Formal -2.658 2158 40.559
Place Dorsal 3.979 996 46.018
Coronal 3.426 1062 44.110 Labial -7.404 852 22.901
Phonation Voiceless 25.083 1785 55.768
Unaspirated -4.364 369 25.067 Voiced -20.719 756 4.490
Group:Place
PHKor:Dorsal 1.71 730 47.417 SGKor:Labial 1.32 282 19.832
SGKor:Coronal 0.39 294 42.410 PHKor:Coronal -0.39 768 44.761
PHKor:Labial -1.32 570 24.419 SGKor:Dorsal -1.71 266 42.179
Group:Phonation
PHKor:Unaspirated 2.950 289 26.198 SGKor:Voiceless 2.551 444 59.975
SGKor:Voiced 0.399 318 3.060 PHKor:Voiced -0.399 438 5.528
PHKor:Voiceless -2.551 1341 54.375 SGKor:Unaspirated -2.950 80 20.982
Group:Style
PHKor:Formal 3.015 1461 43.824 SGKor:Informal 3.015 145 39.876 PHKor:Informal -3.015 607 31.109 SGKor:Formal -3.015 697 33.714
Table 27: Best step-up EngVOT2 model of L2 English VOT. Predictors: Participant [random, not tested] and Phonation (3.23e-51) + Place (1.03e-06) [p-values building from null model]
Deviance=25605.3; Log likelihood=-12802.65; d.f.=8; Grand mean=38.553ms Predictor variable Coefficient Tokens Mean VOT
Place Dorsal 4.545 996 46.018
Coronal 2.894 1062 44.110 Labial -7.439 852 22.901
Phonation Voiceless 23.916 1785 55.768
Unaspirated -1.989 369 25.067 Voiced -21.927 756 4.490

101
Table 28: Best step-down EngF02 model of L2 English f0 onset. Predictors: Participant [random, not tested] and Word [random, not tested] and Group:Style (3.6e-10) + Group:Phonation (7.06e-05) + Group [main effect, not tested] + Style [main effect, not tested] + Phonation [main effect, not tested] [p-values building from null model]
Deviance=7550.86; Log likelihood=-3775.43; d.f.=11; Grand mean=0.012 Predictor variable Coefficient Tokens Mean f0 onset
Group PHKor 0.004 2068 0.007 SGKor -0.004 842 0.023
Style Formal 0.008 2158 0.037
Informal -0.008 752 -0.062
Phonation Voiceless 0.367 1785 0.259
Unaspirated 0.140 369 0.039 Voiced -0.507 756 -0.585
Group:Phonation
SGKor:Voiced 0.150 318 -0.411 PHKor:Unaspirated 0.110 289 0.055
PHKor:Voiceless 0.041 1341 0.231 SGKor:Voiceless -0.041 444 0.341
SGKor:Unaspirated -0.110 80 -0.020 PHKor:Voiced -0.150 438 -0.711
Group:Style
PHKor:Informal 0.151 607 -0.008 SGKor:Formal 0.151 697 0.087 PHKor:Formal -0.151 1461 0.014
SGKor:Informal -0.151 145 -0.287
Table 29: Best step-down EngPALM2 model of L2 English f0 onset. Predictors: Participant [random, not tested] and Word [random, not tested] and Voicing (9.19e-05) + LOS (0.00888) + Group (0.0256) [p-values building from null model]
Deviance=1205.1; Log likelihood=-602.55; d.f.=6; Grand mean=-0.009 Predictor variable Coefficient Tokens Mean f0 onset
Phonation Voiceless 0.401 342 0.41
Unaspirated 0.045 95 -0.031 Voiced -0.446 85 -0.590
Meanwhile, the best step-down EngPALM2 model with Phonation:Place
as the only fixed interaction (R2=0.332, see Table 29 above) revealed only one
significant predictor, Phonation (p=0.000177). While additional fixed pairwise
interactions were also considered, the model was not significantly improved.
Pairwise interactions involving Group were dropped; those involving Gender
showed no significant improvement to the overall goodness-of-fit based on a
chi-square test [𝜒2=7.87, d.f.=5, p=0.164].

102
4.3.2.2 PHKor v SGKor Korean VOT and f0 onset
A stepwise analysis of the comparison Korean VOT data (PHKor v SGKor)
resulted in a mismatch between the best step-up and step-down models. Based
on the data illustrated in Table 30 below, the best step-down KorVOT2 model
(R2=0.782) comprised two significant predictors of variation in Korean VOT,
namely Place (p=5.02e-12), and Group:Phonation (p=0.00244). Meanwhile, the
best step-up model (R2=0.774) also included Phonation (p=2.91e-10) and Place
(p=7.04e-12), but not Group. Between them, the step-down model was the
better model (with a significantly lower deviance and higher goodness-of-fit
score), based on a chi-square test [𝜒2=13.038, d.f.=3, p=0.00456].
Turning to the analysis of the comparison Korean f0 onset data, the best
step-down model with Phonation:Place as the only pairwise interaction
(R2=0.493) revealed only one significant predictor, Phonation:Place (or
Phoneme, p=0.00974). After adding pairwise interactions involving Group
(R2=0.501), the goodness-of-fit of the model improved (see Table 30 below),
based on a chi-square test [𝜒2=8.59, d.f.=3, p=0.0352]. Significant predictors in
this model were Phonation:Place (p=0.00857) and Group:Phonation
(p=0.0136).
4.4 General discussion of results
4.4.1 Internal factors of variation
4.4.1.1 Phonation type
Based on the discussion of results in Sections 4.1.1 and 4.2.1, and on the linear
mixed effects regression analysis of all 10 statistical models presented in
Section 4.3, phonation type was the most significant predictor of variation in

103
Table 30: Best step-up KorF02 model of L1 Korean f0 onset. Predictors: Participant [random, not tested] and Phonation:Place (0.00857) + Group:Phonation (0.0136) + Group [main effect, not tested] + Place [main effect, not tested] + Voicing [main effect, not tested] [p-values dropping from full model]
Deviance=943.442; Log likelihood=-421.721; d.f.=14; Grand mean=0.002 Predictor variable Coefficient Tokens Mean f0 onset
Group SGKor 0.003 87 0.011 PHKor -0.003 328 0.000
Place Coronal 0.025 132 0.033
Labial -0.007 136 0.007 Dorsal -0.017 147 -0.030
Phonation Aspirated 0.708 142 0.776
Fortis 0.034 137 0.035 Lenis -0.743 136 -0.838
Phonation:Place
/p*/ 0.188 46 0.221 /t/ 0.147 43 -0.860 /k/ 0.063 50 -0.774
/ph/ 0.022 47 0.620 /th/ 0.006 46 0.816 /kh/ -0.028 49 0.886 /k*/ -0.035 48 -0.190 /t*/ -0.153 43 0.087 /p/ -0.210 43 -0.892
Group:Phonation
SGKor:Lenis 0.155 29 -0.582 PHKor:Aspirated 0.132 111 0.827
PHKor:Fortis 0.023 110 0.048 SGKor:Fortis -0.023 27 -0.019
SGKor:Aspirated -0.132 31 0.591 PHKor:Lenis -0.155 107 -0.908
VOT and f0 onset for both L1 Korean and L2 English. Mean VOTs for each
phonation type reflected the archetypal trend in consonantal contrast for each
language: fortis < lenis < aspirated for Korean, and voiced < (voiceless)
unaspirated < voiceless for English. Similarly, the overall mean f0 onset values
reflected the conventional tonal contrast patterns in English and Korean, as well
as the tonal correspondences between them: lenis:voiced < fortis:unaspirated <
aspirated:voiceless.
While none of the participant groups produced VOT and f0 onset values
that drastically deviated from the abovementioned production norms, they did

104
exhibit statistically significant inter-speaker variation, evidenced by the
regression analysis of the VOT2 and F02 models. Compared to the SGKor group,
the PHKor group produced significantly shorter and longer mean VOTs for
English voiceless and unaspirated stops, respectively; shorter mean VOT for
Korean aspirated stops; and lower mean f0 onset for English voiceless and
unaspirated stops, and Korean lenis stops.
The PHKor group, however, was also found to produce longer mean
VOT for voiced stops – which was not expected, since it appears to dissimilate
from the rest of the VOT trends. A closer inspection of the data, however,
revealed that 67% of the PHKor group’s voiced stop tokens were produced with
zero to negative VOTs – a trend that more closely resembled the production
patterns of the FIL group.
4.4.1.2 Place of articulation
All participant groups followed the conventional trends in English and Korean
VOT based on place of articulation: labial < coronal < dorsal. There were
significant inter-speaker patterns of variation based on place of articulation,
albeit not as extensive as phonation type. Place was not a significant predictor
of intra-speaker (within the PHKor group) and inter-speaker variation in
English f0 onset, but it was for English VOT. Compared to the SGKor group,
the PHKor group produced longer overall mean VOTs for all places of
articulation; however, mean VOT difference was significant only for dorsal
stops, and marginally significant for labial stops.
Place was also a significant predictor of variation in Korean VOT and f0
onset; however, based on its pairwise interaction with Group (in the KorVOT2
model), the differences in mean VOT and in mean f0 onset between the PHKor

105
and SGKor groups did not appear to be significant.
4.4.1.3 Phonemic contrast
Based on the regression analysis in Section 4.3, the Phonation:Place pairwise
interaction was only statistically significant to the variation in Korean f0 onset.
The results described in Sections 4.1 and 4.2, however, revealed some
interesting trends in both English and Korean VOT and f0 onset. It was observed
that inter-speaker variation in VOT and f0 onset was only significant for specific
phonemes, or Phonation:Place pairwise interactions: PHKor students exhibited
significantly shorter mean VOT for English /t/ and Korean /th/, and marginally
longer VOT for Korean /p*/.
4.4.2 External factors of variation
This subsection provides only a summary of the following external (i.e.,
sociolinguistic) factors of variation in VOT and f0 onset: Style (of speech),
Gender, Dialect, Age, Length of Study, Interaction with Filipino peers, and
Formal learning involvement. Table 31 below (p. 109) provides a breakdown of
the participants based on the abovementioned variables, except for Style and
LOS. (To read more about the distribution of VOT and f0 onset values according
to Style, see Sections 4.1 and 4.2; to know more details on LOS and information
on the participants’ sociolinguistic background, see Appendixes 4 and 5).
4.4.2.1 Speech style
Sections 4.1 and 4.2 described the effects of speech style on English VOT and
f0 onset. The overall results showed that variation is more widespread in
informal speech, where the PHKor group produced significantly shorter mean
VOTs and higher mean f0 onset than the SGKor group. Results of the regression

106
analysis in Section 4.3 further corroborated the earlier findings, indicating that
the Group:Style pairwise interaction was significant in both the Eng VOT2 and
F02 models.
4.4.2.2 Dialect
Dialect – that is, whether the Korean speaker spoke a tonal or non-tonal dialect
– was tested for all regression models that involved f0 onset data. Based on the
results, the variable was found to have no significant effects on both English
and Korean.
4.4.2.3 Gender
Within the PHKor group, gender effects were found only in the production of
Korean VOT within the PHKor group (p=0.0218). As illustrated in Figure 19
below, female PHKor students exhibited significantly longer mean VOT for
lenis and aspirated stops. Meanwhile, at the level of inter-speaker variation, no
Figure 19: Female and male PHKor students’ mean word-initial L1 Korean VOT values (in ms), sorted by phonation type.
11 12
54
44
71
65
-10
10
30
50
70
Female Male
Mea
n VO
T/m
s
Group
Mean L1 Korean VOT (PHKor group)
Fortis Lenis Aspirated

107
significant Group:Gender pairwise interaction was observed for the English and
Korean VOT2 and F02 models. Moreover, it is interesting to note, based on the
normalized z-scores for f0 onset, that Gender was not a significant predictor of
variation in either English or Korean f0 onset, which indicates that female and
male Korean student participants in the present study were producing similar
tonal contrast patterns in both languages, despite having different glottal
physiologies.
4.4.2.4 Age and Length of Study (LOS)
There was not much variation observed based on age effects, since the majority
of students (across all participant groups) belonged within a rather narrow age
range (17-25 years) for a variation and L2 speech acquisition study of this type.
Despite this, Age appeared to be a significant predictor of variation in English
VOT within the PHKor group (p=0.00476, using normalized z-scores). Based
on the data shown in Figure 20 below, there was a significant increase in mean
VOT with increasing age (R2=0.00246). The sample data showed mean VOTs
of 32ms at minimum age (17 years), and 45ms at maximum age (25 years, with
overall average and median VOTs at 40ms and 39 ms, respectively.
Moreover, it is interesting to note at this point that Age is the only
predictor variable in the study whose effect resulted in an increasing overall
trend in mean English VOT; while this might be an effect of LOS (students
typically have longer LOS with increasing age), a simple multicollinearity test
produced a low variance inflation factor (v.i.f.) of 1.01, suggesting low
correlation between the two variables. Indeed, as discussed earlier in Sections
4.1 and 4.2, both mean English VOT and f0 onset (for stops followed by a PALM
vowel) decreased significantly with increasing LOS. If we, however, look at the

108
Figure 20: PHKor mean word-initial L2 English VOT (in ms) based on age (in years). The average age for the PHKor group is 20.3 years, σ= 2.59.
regression analysis in Section 4.3, LOS was only a significant predictor of
decreasing VOT (p=0.00129) and not f0 onset in English. The above results thus
suggest that while the decrease in mean English VOT is apparent with
increasing LOS, this trend might be affected more significantly by other
variables, i.e., by how much PHKor students were interacting with Filipino
peers, or their level of involvement in the classroom.
4.4.2.5 Interaction with Filipino peers
As illustrated in Figure 17 above (Section 4.3), the Interaction variable was
found to influence the patterns of variation in both English and Korean VOT
within the PHKor group. Regression analysis in Section 4.3, however, reveals
that this interactional effect was only statistically significant in the production
of English stops (p=0.0114).
R²=0.00246
-100
-50
0
50
100
150
-2 -1.5 -1 -0.5 0 0.5 1 1.5 2Mea
n VO
T/m
s
Age (in years)Normalized z-score
Mean L2 English VOT (PHKor group)

109
Table 31: Distribution of the participants according to the following variables: Gender, Dialect, Age (years), Interaction with Filipino peers, and Formal learning involvement. LOS values (in z-scores) are summarized in Appendix 4.
Participants Variables and their variants PHKor (18) SGKor (5) FIL (6)
Gender Female F1-F10 (10) F11-F13 (3) F14-F16 (3)
Male M1-M8 (8) M9, M10 (2) M11-M13 (3)
Dialect Tonal F4, F8, F10, M4, M5 (5) F13, M9, M10 (3) N/A
Non-tonal F1-F3; F5-F7; F9; M1-M3 (13) F11, F12 (2) N/A
Age (years) 17 M5, M6, M8, F10 (4) - -
18 M2 (1) - - 19 F9, M7 (2) F11 (1) F14 (1) 20 F3 (1) F13 (1) M12, F16 (2) 21 F2, F5, M1, M3 (4) M10 (1) M11, M13,
F15 (3) 22 F1, F4, F6 (3) F12, M9 (2) - 23 M4 (1) - - 24 F8 (1) - - 25 F7 (1) - -
Interaction with Filipino peers Always F1, M3, M5 (3) - N/A
Mostly F8, M1, M6, M7 (4) - N/A
Sometimes F3, F5, F6, F9, F10, M4 (6) F12, F13 (2) N/A
Never F2, F4, F7, M2, M8 (5) F11, M9, M10 (3) N/A
Formal learning involvement Always F5, M5 (2) - N/A
Mostly F1-F3, F6-F8, F10, M1, M3, M4, M6, M8 (12)
F11, F13, M9 (3) N/A
Sometimes F4, F9, M2, M7 (4) F12, M10 (2) N/A
Interestingly, a significant effect of Interaction was also observed in the
variation in f0 onset for English stops followed by a PALM vowel (p=0.0365),
based on Bark normalized z-scores. PHKor students who interacted more with
their Filipino peers were found to produce lower overall mean f0 onset (µ=-0.24)
than those who interacted less (µ=0.11) and who had no interaction at all (µ=-
0.02). (For the latter two groups, no significant differences in mean f0 onset were

110
observed, based on a two-tailed t-test for unequal variances t(187)=1.00,
p=0.31876.)
4.4.2.6 Formal learning involvement
As discussed in Section 4.3, the Involvement variable also significantly affected
the variation in both English and Korean VOT within the PHKor group.
Regression analysis of the English and Korean VOT1 models revealed that the
variable did have a significant influence in both patterns of variation [English
VOT: p=0.037; Korean VOT: p=0.0401]. Students who were least involved
during their formal L2 learning (those who indicated ‘Sometimes’ in the survey)
produced the longest mean VOTs for both languages, while students were most
involved (‘Always’) produced the shortest mean VOTs.
In summary, PHKor students who had the greatest linguistic exposure
effects – that is, those who interacted more often with Filipino peers and were
involved more in their formal L2 learning – produced overall shorter mean
English and Korean VOTs, as well as lower mean English f0 onset (for stops
followed by a PALM vowel).
4.4.3 Conclusion
Linguistic exposure to PhilE has raised interesting issues about perceptual
assimilation features and phonetic drift patterns in the interlanguage of these
learners during L2 speech acquisition, since their L1, Korean, features an
interesting three-way consonantal stop system combined with a significant
degree of tonal interaction (to achieve maximal phonemic contrast). Thus, the
main thrust of the present study was narrowed down to the analysis of both L1
and L2 consonantal stop production, focusing on patterns of variation in VOT

111
and f0 onset. Table 32 below provides a rough summary of the PHKor group’s
categorical assimilation (or dissimilation, in some cases) and linkages between
L2 English and L1 Korean, at various levels of phonological structure.
PHKor students were producing instantiations of English consonants
that were more ‘PhilE-like’, in the sense their overall word-initial VOT
durations, especially for voiceless and unaspirated stops, were significantly
shorter in comparison to non-Filipino varieties of English. Furthermore, they
were also producing consonants that perceptually were more ‘Korean-like’,
evidenced by L2 stops that appear to assimilate towards L1 production norms
in certain phonological environments, i.e., in [#s/ptk/_] position. Based on the
findings, there appears to be considerable L1-to-L2 transfer in the interlanguage
in the form of increased levels of aspiration that could be affecting patterns of
stop production at the earlier stages of L2 acquisition.
The results that have been obtained so far also highlight a potential
phonetic development in the interlanguage of Korean students during their L2
speech acquisition. There are substantial pieces of evidence to suggest that (1)
PHKor students are experiencing phonetic interference from their ambient non-
native linguistic setting and have acquired certain phonetic features of the PhilE
stop system, which, as the data from the FIL group has shown, manifests
significantly short to negative VOT duration; (2) PHKor learners are also
exhibiting L2 speech patterns that closely resemble Korean production norms,
suggesting the presence of L1-to-L2 interference; and (3) phonetic drift patterns
are present not only in their (still developing) L2 phonetic inventory, but also in
their (relatively developed) L1 sound system, indicating that their phonetic
development is bi-directional in nature. There is also apparent-time evidence

112
Table 32: Observed cases of phonetic drift in the L1 and L2 speech production of Korean learners of English (PHKor group).
Phonetic feature
Level of phonological
structure
Categorical assimilation/linkages between L2 English and L1 Korean
VOT
Subsegmental
Both L1 aspirated stops and L2 voiceless stops shortened in approximation to the shorter VOT of voiceless stops in the non-native L2 variety.
L2 unaspirated stops lengthened in approximation to the longer VOT of L1 lenis stops.
L2 voiced stops had a positive overall mean VOT, although 67% of the tokens had negative VOT values; they appear to be shortening in approximation to the zero-to-lead VOT of voiced stops in the non-native L2 variety.
Segmental
Both L1 /th/ and L2 /t/ significantly shortened in approximation to the shorter /t/ found in the non-native L2 variety.
L1 /p*/ lengthened marginally, dissimilating from L1 norms.
f 0 on
set
(all
vow
els)
Subsegmental
f0 onset following L2 voiced stops lowered in approximation to the lower f0 onset of L1 lenis stops.
In formal speech, f0 onset following L2 voiceless and unaspirated stops lowered in approximation to the lower f0 onset of voiceless and unaspirated stops in the non-native L2 variety.
In informal speech, f0 onset following L2 voiceless and unaspirated stops drifted upward, dissimilating from the lower f0 onset of voiceless and unaspirated stops in the non-native L2 variety.
Global Shared control mechanism for f0 modulation; overall L2 onset drifted lower in approximation to the lower f0 onset of the non-native L2 variety
f 0 on
set
(PA
LM) Subsegmental
f0 onset following L2 voiced stops lowered in approximation to the lower f0 onset of L1 lenis stops.
f0 onset following L2 voiceless and unaspirated stops lowered in approximation to the lower f0 onset of voiceless and unaspirated stops in the non-native L2 variety.
Global Shared control mechanism for f0 modulation; overall L2 f0 onset drifted lower in approximation to the lower f0 onset of the non-native L2 variety.

113
indicating that the nature of phonetic drift (assimilatory v dissimilatory) could
change depending on the nature of the language learning program, or the length
or degree of linguistic exposure in the ambient L2 setting.
Looking at the variation in f0 onset, PHKor students produced English
voiced stops that were more ‘Korean-like’, with mean f0 onset values that
seemed to approximate the lower f0 onset of Korean lenis stops. But they were
also producing English voiceless and unaspirated stops that were more ‘PhilE-
like’, in the sense that their f0 onset patterns resembled the FIL students’ f0 onset
patterns more closely, evidenced by the apparent downward drift in their f0 onset
values. This trend, however, was only observed in formal speech. In informal
speech, the mean f0 values of both stop types drifted up, dissimilating from the
lower f0 onset of the same stops produced by the FIL group. Thus, like the
English VOT data, the English f0 onset data present cases of both assimilatory
and dissimilatory phonetic drifts among Korean learners of English, which
highlight the bi-directional nature of phonetic drift in the learners during their
L2 speech acquisition.
By utilizing statistical tools to investigate sociolinguistic variation in L2
speech acquisition and to draw empirical relations between L1 and L2 speech
production patterns, and using Flege’s SLM to situate and frame the analysis of
such patterns, the present study has highlighted the importance not only of
linguistic internal factors to the variation phenomenon, but also linguistic
experience. The striking evidence in consonantal and tonal variation in stop
production with respect to several external factors (social, stylistic) show that
the interlanguage’s apparent state of flux during L2 speech acquisition is also

114
largely conditioned and motivated by the ambient linguistic environment in
which the development takes place.
The next chapter therefore aims to expand the discussion on linguistic
experience during L2 speech acquisition, particularly paying attention to the
learners’ sociolinguistic perception of PhilE. Studying sociolinguistic
perception patterns helps to shed light not only on what students think about
non-native accents and how they perceive them, but also how these perceptions
may (possibly) affect their L1 and L2 speech production patterns during their
L2 speech acquisition.

115
CHAPTER 5
SOCIOLINGUISTIC PERCEPTION OF PHILIPPINE ENGLISH
Existing Philippine-based studies on the acquisition of English as a second
language focus primarily on language perception, attitudes, and ideologies, with
little emphasis on actual speech production patterns. In a detailed study of
language attitudes towards Filipino speakers of English among Philippine-
based Korean students, Roh (2010; see also Castro & Roh, 2013) made Korean
students listen to a speaker’s recording of Filipino-accented English and asked
them to identify the features, and evaluate the quality, of her accent. The study
shown that majority of Korean learners poorly evaluated Filipino-accented
English, and had reservations about choosing the speaker as their English
teacher – only 23.3% of 75 respondents said yes, while 57.5% said no. The
study also revealed that AmE remains the most positively regarded English
variety.
In response to Castro and Roh’s (2013) suggestion to keep track of the
changing attitudes of Koreans towards PhilE, this paper also includes a speech
perception task, which has been modified to not only measure foreign learners’
language attitudes and preferences, but also the extent to which they can
correctly perceive Filipino-accented speakers of English, and PhilE in general.
This chapter combines both quantitative and qualitative analyses of
sociolinguistic perceptions of PhilE among the same three participant groups,
PHKor, SGKor and FIL. Section 5.1 presents data relevant to the learners’
perception of PhilE, while Section 5.2 cross-examines the perception data in
this chapter with the speech production results presented in Chapter 4.

116
5.1 Learners’ perception of PhilE
5.1.1 Method and participants
All individual participants who performed the elicitation (speech production)
tasks described in Chapter 4 also performed a short sociolinguistic perception
task. Due to the ‘experimental’ nature of the testing session, the sociolinguistic
perception task was carried out in between the Korean and English elicitation
tasks as a ‘break’ in between them to minimize potential order effects on L1 and
L2 speech production. They listened to a speech recording of a Filipino
individual under the pseudonym Jack (male, in his early 30s, middle-class, an
alumnus of a top tertiary institution in the Philippines, and demonstrates
distinguishable Standard PhilE features as described in the existing literature –
see Gonzalez (1985), Llamzon (1997), Tayao (2004), and Regala-Flores (2014).
The speech recording, which originally comes from the Speech Accent Archive
(SAA) website (Weinberger, 2015) was designed to be short in length and to
elicit most of the phonetic features of General AmE:18
Please call Stella. Ask her to bring these things with her from the store: six spoons of fresh snow peas, five thick slabs of blue cheese, and maybe a snack for her brother Bob. We also need a small plastic snake and a big toy frog for the kids. She can scoop these things into three red bags, and we will go meet her Wednesday at the train station.
Jack’s speech was audiotaped using the same recorder used for the production
task and at the same frequency and bit rate. The sound recording was stored and
during the testing sessions was played on the same computer, with the sound
output connected to a Creative® WoofTM external micro wireless speaker.
There was no limit to the number of times the participants could listen
to the recording. After the listening portion, a series of multiple-choice
18 The original speech recordings can be found here: http://accent.gmu.edu/index.php

117
questions pertaining to the sociolinguistic background of the speaker were
presented on the computer screen, which the participants were asked to answer.
The entire procedure was audiotaped with the same audio recorder used in the
production tasks (Zoom H1) at the same frequency and bit rate.
The identification task was carried out to test the participants’
sociolinguistic knowledge of PhilE, as well as their attitudes towards Filipino-
accented speakers of English. Note that this was not a speech perception task –
students were not required to identify specific phones or phonetic features in the
speech recording. The methodology, however, was modified to obtain more
information regarding the participants’ perception of PhilE accent features. For
each question in the sociolinguistic perception task, they were specifically asked
to comment on Jack’s pronunciation features.
After interviewing and testing my sixth participant, I realized that my
PHKor participants had been inevitably primed to perceive Jack as Filipino
speaker of English. I believed that this was theoretically and methodologically
problematic, since the aim of the identification task was to implicitly determine
to what extent foreign students could identify the sociolinguistic features
exhibited by Filipino-accented speakers of English.
The perception task was carried out before the L2 production task. So,
after a few testing sessions, it felt more necessary to check whether revealing
sociolinguistic information about a Filipino speaker of English in the perception
task would affect their production patterns in the L2 speech production task.
Because it was a tad too late to incorporate a matched guise experiment during
the limited time I was granted to conduct my fieldwork, I instead decided to add
another criterion, Place of origin (i.e., Philippines or Other) to the identification

118
task. Eventually, for the next 12 PHKor participants, six were (randomly)
selected and informed about the speaker’s nationality at the beginning of their
task, while the remaining ones were not. In the end, the PHKor students were
divided into two groups: the informed group, who were informed prior to the
task that Jack is a Filipino and from the Philippines, and the uninformed group,
who were required to identify Jack’s nationality/place of origin by answering
the question “Do you think Jack is Filipino/from the Philippines?” (Yes/No,
other) at the beginning of the perception task. When the uninformed group
participants identified Jack as non-Filipino (i.e. not originating from the
Philippines), I asked them to guess where he was from. These students were not
informed about Jack’s place of origin until the end of the session, in order not
to influence their answers to the next few questions. (Moreover, the present
study was also interested in investigating the extent to which learners of other
sociolinguistic or education backgrounds can identify (Standard) Filipino-
accented English. All FIL and SGKor students were, therefore, also asked to
identify Jack’s place of origin.)
After informing them about or asking them to identify Jack’s place of
origin, all participants were asked to answer a series of multiple-choice
questions. They were asked to judge the speaker’s social background based on
the following criteria: (1) Gender (Male, Female, or Other); (2) Profession
(Engineer, Doctor, Teacher, Office Worker, or Other); and (3) Socioeconomic
class (Poor, Middle-class, or Wealthy). Then, they were asked (4) to rate Jack’s
English skills (1–Poor, 2–Average, 3–Good, or 4–Very Good), and (5) if they
would like Jack to be their English teacher (Yes, No, or Maybe).

119
5.1.2 Results
5.1.2.1 General perception of PhilE
As mentioned earlier, six PHKor students were randomly selected and informed
about the speaker’s place of origin at the beginning of their task (hence, the
informed PHKor group), while the remaining 12 were not (the uninformed
PHKor group). In total, there were 23 ‘uninformed’ participants: 12 PHKor
students, and all five SGKor and six FIL students. Focusing on this group (see
Figure 21 below), no majority response was obtained; participants were
somewhat divided on the issue of origin. In fact, only a third of the students
(n=8) could correctly identify Jack’s place of origin. Six were uncertain and
unable to make a rough guess about it, and approximately the same number of
them (n=5) thought Jack sounded American (and therefore from the USA). The
remaining students gave other answers: UK, China, as well as broader
geographic areas like Asia (not including China or the Philippines), even South
America.
More interesting observations are found within each participant group.
Zooming into the PHKor group, it is worth mentioning that only four of the 11
students – F4, F9, M1, and M8 – could accurately identify Jack’s place of
origin. Four of these students reported that they made this identification because
of his pronunciation:
1. <Philippines> …pronounce some words like a Filipino. [M1, PHKor]
2. <Philippines> I think he's Filipino because his pronunciation is not like American… but it's more close to Filipino. [M8, PHKor]
One SGKor student, F12, also correctly identified Jack’s place of origin,
indicating stereotypical pronunciation and intonation features of PhilE, despite
not having any considerable length or degree of exposure to PhilE:

120
Figure 21: PHKor, SGKor, and FIL students’ perception of Jack’s place of origin.
3. F12; <Philippines> Because the "t" sound was kind of like "d"… yeah. Really strong and… just the tone? Sounded like ((Filipino)).
Interviewer; So you have knowledge of how Filipino accent sounds like? F12; Not really but just, just have a vague idea. Interviewer; Have you heard Filipinos speak before? F12; Once in Singapore. [F12, SGKor]
Based on the above conversation with F12, she was probably to inspired to
mention the Philippines because I am Filipino.
Meanwhile, all Korean students who perceived Jack as American
pointed out the speaker’s American-sounding accent:
4. <USA> When I was in school, we have listening test. There is ((a)) turn on like this… almost the same. [M2, PHKor]
5. <USA> I think pronounce… like American. [M6, PHKor]
6. <USA> He's not Filipino… because I think he's American, he's from America. [M7, PHKor]
7. <USA> Well I never think that kind of things but I don't think the person is Filipino. Like the person who's speaking right? I think like just normal American. [M10, PHKor]
Furthermore, students who gave guesses other than Filipino/American provided
4 4
10
3
1 1
1 1
1
3
1
2
0
2
4
6
8
Philippines USA UK China S. America Asia Not sure
No. o
f par
ticip
ants
Place of origin
Uninformed participants' responses for 'Place of origin'
PHKor (n=11) SGKor (n=5) FIL (n=6)

121
a variety of reasons for doing so. Several PHKor students noted that Jack’s
accent was different from PhilE accent norms, while a few SGKor students
could not identify whether the accent was Filipino-sounding – because they
have had little to no contact with PhilE or Filipino-accented English speakers:
8. <Not sure> He don't use the Philippine accent… but I'm not sure he's native. Actually I think he's not Filipino [M4, PHKor]
9. <Not sure> …because it's different pronunciation with Filipino. [M5, PHKor]
10. <China> Because their pronunciation is not Filipino, but also not American. [F10, PHKor]
11. <South America> I think he come from the South America. Because his accent like more Spanish... honestly I never heard a Filipino accent ((before)), that's why I cannot differentiate. [M9, SGKor]
12. <Not sure> I'm not sure but… not from America. [F13, SGKor]
13. <UK> I think he's from like United Kingdom… I think his accent is a little bit strong compared to the United States accent… I think um the United States accent is a little bit smoother than his accent. [F11, SGKor]
Focusing on the FIL group, it is interesting to note that only 3 of the 6 FIL
students could identify Jack as Filipino. This was a surprising finding because
we would expect Filipino speakers of English to easily identify a Standard PhilE
accent due to its distinctive features. Those who couldn’t correctly identify
Jack’s place of origin expressed uncertainty regarding the nature of accent:
14. <Asia> I guess other Asian country… in the Southeast Asian region, I think - um can I enumerate some? Maybe Thai, Thailand. Or Singapore, or English proficient Japanese. [M13, FIL]
15. <Not sure> If a Filipino speaks in English, parang, parang di siya, it's not really that twang… but I'm not sure.19 [F15, FIL]
16. F16, FIL; <Not sure> The way he speaks is different. A foreigner. It's different when you listen to it.
Interviewer; Can you describe the way he speaks? F16; The way he says the words it's different. Because when a
Filipino says those words there's an accent. [F16, FIL]
Based on the above findings, it is also important to note that uninformed PHKor
19The Tagalog phrase parang di siya has an equivalent English translation “it does not seem”.

122
students identified Jack as a Filipino at about the same rate as the FIL group, so
there is no evidence here that the Korean students are bad at the given task – in
fact, they seem about as good as Filipino speakers of English.
5.1.2.2 Perceptions of occupation and socioeconomic class
Data from the perception task suggests that the participants’ perception of
Jack’s sociolinguistic background was mostly accurate. Based on the findings
in Figure 22 below, 10 out of the 29 participants correctly identified the
speaker’s previous and current occupations, i.e., Teacher (4 PHKor, 2 SGKor,
and 4 FIL students), and Office worker (8 PHKor students). Some participants
who chose Teacher pointed out the speaker’s (relatively) slow speech rate and
instructional tone:
17. <Teacher> I think he =the way he speaks is like quite organized and yeah, and I don't know how to explain but that's ((how he sounds like))
[F8, PHKor] 18. <Teacher> It seems to me like he was saying something to his students with
slow ((pronunciation))… yeah. [F11, SGKor]
19. <Teacher> I think the way he speaks it's kind of… he do it slowly, and then um more of the deep =he is making some kind of details when he's pronouncing the words... [M11, FIL]
20. <Teacher> The way he says instructions, gives instructions, very detailed. [F16, FIL]
Meanwhile, some students were a little less certain of what response to give,
while others based their answers more on the content of the speech recording:
21. <Office worker> I don’t know actually, just feeling… [M3, PHKor]
22. <Office worker> I think he's not teaching in the report, so I think he's office worker. [M7, PHKor]
23. <Teacher> Because they let Stella buy some #, but they doctor they don't need like cheese… and also engineers, professor, student, office worker… but they… if the classroom has a party, like one student is birthday then I think they are preparing a birthday party. [F10, PHKor]
24. <Engineer> Just sounds like it. [F12, SGKor]
25. <Student> I think he’s just a student. [M12, FIL]

123
(It is clear from the interview excerpts above that the content of the speech
extract may have influenced some of the students’ perceptions of the speaker.
Nonetheless, the overall data does show a considerable range of responses,
suggesting that other students were searching for or paying attention to other
cues (linguistic or non-linguistic) that are not necessarily or directly related to
the nature of the content found in the sample speech extract. It is also highly
possible that other students interpreted the text differently, which yielded
different individual responses. These issues will be addressed in greater detail
in Chapter 6.)
The findings in Figure 22 below also show that Jack was perceived as
someone who belonged to the middle-class by 22 (76%) of the total 29
participants (13 PHKor, 4 SGKor, and 5 FIL). What is interesting about this
finding is that many of them chose Middle-class by benchmarking Jack’s
socioeconomic class against their expected notions of accent differences
between low-income and high-income socio-economic backgrounds. Several
students associated being poor with the lack of certain personality traits such as
confidence, elegance, and calmness; lack of education and fluency in speech;
and the strength and type of accent:
26. <Wealthy> …if poor, voice is very weak and pitiful. [F3, PHKor]
27. <Wealthy> From his voice… very was calm, and something is very comfortable… Yeah so I think the sound is from a rich person.
[M8, PHKor]
28. <Middle-class> I think not poor because his voice is not bad =I think the poor people um accent is a little strong. But accent is not strong, little American. But I don't know he is rich so I choose ((middle-class))
[F4, PHKor]
29. <Middle-class> Because his accent was not that strong. Usually people have really local sounds when they speak… but I think he kind of was educated a little bit about his pronunciation. [F12, SGKor]
30. <Middle-class> I think the rich =the wealthy =the sound is a bit higher and
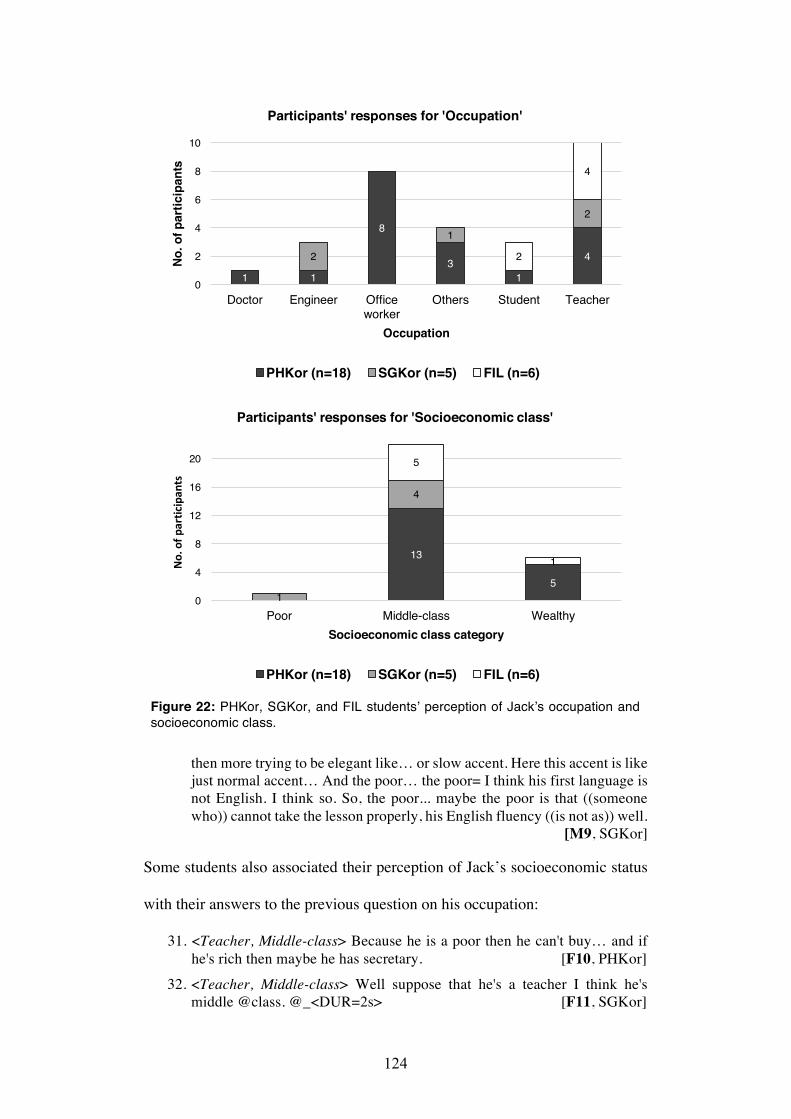
124
Figure 22: PHKor, SGKor, and FIL students’ perception of Jack’s occupation and socioeconomic class.
then more trying to be elegant like… or slow accent. Here this accent is like just normal accent… And the poor… the poor= I think his first language is not English. I think so. So, the poor... maybe the poor is that ((someone who)) cannot take the lesson properly, his English fluency ((is not as)) well.
[M9, SGKor]
Some students also associated their perception of Jack’s socioeconomic status
with their answers to the previous question on his occupation:
31. <Teacher, Middle-class> Because he is a poor then he can't buy… and if he's rich then maybe he has secretary. [F10, PHKor]
32. <Teacher, Middle-class> Well suppose that he's a teacher I think he's middle @class. @_<DUR=2s> [F11, SGKor]
1 1
8
31
42
1
2
2
4
0
2
4
6
8
10
Doctor Engineer Office worker
Others Student Teacher
No. o
f par
ticip
ants
Occupation
Participants' responses for 'Occupation'
PHKor (n=18) SGKor (n=5) FIL (n=6)
13
51
4
5
1
0
4
8
12
16
20
Poor Middle-class Wealthy
No.ofp
articipan
ts
Socioeconomic class category
Participants' responses for 'Socioeconomic class'
PHKor (n=18) SGKor (n=5) FIL (n=6)

125
FIL students were also likely to associate socio-economic differences with
certain personality traits and accent features:
33. <Middle-class> get the impression that the person is an average type. Like um, if wealthy people can have this vibe, that radiates from them. So, wealthy people have this specific vibe that you can interpret that they have some class… Like um rich voice, yeah... the quality, the diction, the intonation... yeah. [M13, FIL]
34. <Wealthy> Wealthy, the pronunciation is quite good. [F15, FIL]
35. <Middle class> Because maybe if it's a wealthy, the accent will be more =more like American or other not Filipino accent. [M12, FIL]
FIL participant M11’s response below is also worth noting. M11 believes that
many middle-class Filipinos are now able to speak like wealthy Filipinos,
thanks to (technological) advancement and education opportunities. He,
however, drew a line for lower-income Filipinos, implying that they may not
find it easy to assimilate English accent features commonly associated with
wealthy Filipinos – even if they are educated or have access to technology:
36. M11; <Middle class> …when it comes to my perspective maybe um he is a wealthy man… But um in today's era many middle-class persons can speak the way he speak also and=
Interviewer; =Why do you think so? M11; Because um, it's kind of like today we're advanced and then
we can we can learn for example, I'm a middle-class person and then I can um... maybe the status kind of status not a hindrance to when it comes to learning.
Interviewer: It doesn't matter whether you are rich, or middle class, or poor?
M11; Poor? @Maybe @so-so. @_<DUR=2s> [M11, FIL]
5.1.2.3 Rating (Philippine) English accent
Data from the perception task shows that the participants overall exhibited a
positive response towards Jack’s English accent (see Figure 23 below for a
summary of the findings). 26 (90%) of the total 29 participants rated the
speaker’s English accent as Good (12 PHKor, 5 SGKor, and 4 FIL) and Very
Good (3 PHKor and 2 SGKor). Meanwhile, the remaining three participants (all

126
Figure 23: PHKor, SGKor, and FIL participants’ perception of Jack’s English.
PHKor) gave an Average rating. PHKor students who gave Jack an Average
rating had various reasons for doing so. For instance, M3, who was in his sixth
and final month of intensive short-term ESL at the time of our interview, pointed
out the ‘non-nativeness’ of Jack’s English accent:
37. M3; <Average> I can understand… Interviewer; But why is just average =what makes good English? M3; I think his pronunciation, his phrasing... just not good. Interviewer; What do you think a good pronunciation is like? M3; Similar to a native speaker. Interviewer; What native speakers, from where?
3
12
3
5
4
2
0
4
8
12
16
20
Poor Average Good Very Good
No. o
f par
ticip
ants
Rating
Participants' rating of Jack's English accent
PHKor (n=18) SGKor (n=5) FIL (n=6)
41
133
2
1
5
0
4
8
12
16
20
No Maybe Yes
No. o
f par
ticip
ants
Response
Participants' responses for 'Would you like Jack to be English teacher?'
PHKor (n=18) SGKor (n=5) FIL (n=6)

127
M3; Ah, some part of America, British. Those two kind. [M3, PHKor]
Meanwhile M8, who has been living and studying full-time in Baguio City for
five years, gave a rather more general comment on the comprehensibility or
intelligibility of an English accent:
38. <Average> Because if somebody very good at speaking English, really I can understand. But I cannot understand this one. And I don't think he's poor but average. [M8, PHKor]
M8 already exhibits a considerable level of proficiency in L2 English given his
length of exposure to the language; to him, the onus is on the speaker to produce
an English accent that is intelligible and comprehensible to his interlocutor.
Meanwhile, students who gave a Good or Very Good rating generally
liked Jack’s English accent:
39. <Good> He can say very clearly, and I can listen and understand. That's why… or grammar, grammar is good. [F1, PHKor]
40. <Good> Because his pronunciation is already trained, and… I can understand and I think better than Korea =Korean. [F2, PHKor]
41. <Good> I can hear his voice very well, and I like to watch movie =American movie. So he's same with American =American (movie) stars.
[M7, PHKor]
42. <Very Good> I think I answered =I answered he is a professor ((teacher)) and he is wealthy so maybe I think his English is good, I mean very good.
[F8, PHKor]
43. <Very Good> Pronunciation is like American. [M6, PHKor]
44. <Very Good> I can understand easily… I think his pronounce =“pronounciation” ((is good)). [M4, SGKor]
We can surmise from these responses that the students gave positive ratings due
to a variety of reasons. For example, participants M6 and M7 – unlike M3 –
perceived Jack as having an US English accent, which made them give the
speaker positive ratings. On the other hand, some participants (e.g., F2) gave
Jack a positive rating primarily because it sounded better than Korean-accented
English. Furthermore, just as participants F10 and F11 drew associations

128
between Jack’s occupation and socio-economic status, some participants (e.g.,
F8) gave ratings based on Jack’s perceived sociolinguistic background.
While the responses towards Jack’s English accent were positive
overall, they didn’t come without reservations. Several students pointed out the
presence of a somewhat different ‘accent’, and expressed doubts on the
‘naturalness’ of this accent:
45. <Good> When he speak English, uh he don't want… ((he is not)) afraid. His pronunciation also good but not very natural. [F4, PHKor]
46. <Good> He had some accent, but his speaking skills are good. [M1, PHKor]
47. <Good> …especially Filipinos' pronunciation, they =“apple” is [ɑ:pəl]… and Korean can't pronunciation well ((the)) "r"… but he spoke well, like, not really American but they # like English pronunciation. [F10, PHKor]
48. <Good> Because I cannot feel the accent of like really weird something like really strong accent compared to Indian or Singaporean. So I thought his accent was really similar to normal Standard English. So accent is good.
[M10, SGKor]
Meanwhile, several students who gave a Good rating focused on intelligibility
issues:
49. <Good> Some parts I couldn't understand. So it's just good. [M2, PHKor]
50. <Good> Because um I didn't pick Very Good because I didn't understand some words… It can be my problem but I think uh pronunciation was not that accu– clear to me. [F11, SGKor]
51. <Good> …I don't know well but hmm… his pronunciation was not the exact. [F13, SGKor]
Looking at the FIL group, the students gave mainly positive ratings (3
Good and 2 Very Good), and generally expressed the view that his accent was
good, but not flawless:
52. <Good> He's good… because for me um… speaking English is about the content of what he's speaking. And then um, it's more of the... if we understand what he's saying, I =maybe I can say he's a good speaker of English. [M11, PHKor]
53. <Good> From my perception, he can pronounce the words well, but not that good. [M11, PHKor]

129
54. <Good> …the pronunciation is quite good, but it is not that… that quite fast. When you speak in English you are quite sure what you're saying.
[F15, FIL]
55. <Very Good> He pronounce it well, every word. And it's a nice accent even though it's Filipino. [M12, FIL]
FIL students thought Jack’s English accent was good, but also expressed certain
reservations. Participants M13 and F15 echoed several of the Korean
participants’ opinions, pointing out that Jack’s accent was good – but not good
enough, and associating fluency with increased speech rate. M11, however,
gave a rather different response. Instead of pointing out Jack’s pronunciation or
accent features, M11 chose to focus on the actual content of his speech, arguing
that content was more important. He suggested that it does not matter whether
an accent is good if it is comprehensible or intelligible to the hearer, a view that
appears to stand in opposition with PHKor M8’s (see above).
Moving on to the participants’ responses regarding whether they would
like Jack to be their English teacher, only 19 (66%) of the total 29 students said
Yes (12 PHKor, 2 SGKor, and 5 FIL). Meanwhile, eight students (5 PHKor, 3
SGKor, and 1 FIL) said No, for reasons being due mainly to the speaker’s
accent:
56. <No> Because he has some accent. I know what he's saying but he has some accent… [M1, PHKor]
57. <No> Just very slow. [M8, PHKor]
58. <No> Cause like… I think… maybe it's hard to =sometimes it's hard to understand to what he's saying cause like accent is a bit different from what I'm saying, used ((to))… I'm not sure what kind of thing I can take or I can learn from him. [M9, SGKor]
M9’s response is further exemplified by F11, who believes that her language
teacher’s accent is important because it will affect her learning and
development, especially in terms of speaking the language:

130
59. <No> Because… as I said before the pronunciation was not clear to me. Even though he was good at English. So if he's a teacher to me, I think he should be like more clear. Yeah. To understand =to make me understand more. And I will definitely follow his accent if he is a teacher to me. Yeah, then it will definitely affect my pronunciation as well. [F11, SGKor]
M12, a FIL participant, also highlighted that importance not only of the
teacher’s accent, but also his/her knowledge of the language:
60. M12; <No> Maybe there's someone better. Interviewer; So you think that this person's accent is very good but if you
have someone who speaks with a better accent, you would choose that over this person?
M12; Not just the accent, but of course if English teacher, more knowledge about English. [M12, FIL]
Based on the statement above, M12 regarded Jack’s accent positively, but
rejected him as a teacher because there are better and more qualified people than
him. On the other hand, F9, who initially answered Maybe, changed her mind
and said No when asked about Jack’s pronunciation. She expressed an even
stronger view, rejecting Jack as a potential English teacher because his
pronunciation sounded Filipino:
61. F9; <Maybe> Maybe, because I want to =I like this person to be my English teacher because I think he knows about the English grammar or words, something like that.
Interviewer; How about the way he sounds like, would you want this person to be your teacher, listening to him?
F9; <No> Oh I'm gonna say that I don't want this person to be my teacher because of his pronunciation... because it sounds really @Filipino. @_<DUR=1s> [F9, PHKor]
M10 also expressed a similar view, describing his idea of a “really good”
English teacher:
62. M10, SGKor; <No> Because I really wanna be educated by really like upper class person who speaks really good English.
Meanwhile, most of the students who wanted Jack to be their English teacher
positively regarded Jack’s pronunciation and overall voice quality. There is a
general indication that the speaker has the potential to teach or explain things

131
well:
63. <Yes> He can deliver well and I... the important in language is to deliver what they think and the thoughts. [F1, PHKor]
64. <Yes> First I understand his meaning, and pronunciation and accent. When I heard his voice and his personality, I feel kind and not uh bad.
[F4, PHKor]
65. <Yes> Maybe he's good in teaching and his pronunciation is better than mine, yes… and maybe he's good in explaining grammars, something like that. [F8, PHKor]
66. <Yes> Because his voice, I like that voice… Not so difficult, not so easy. [M2, PHKor]
67. <Yes> He can show her - his knowledge. Can easily explain, explain easily. [M4, PHKor]
A few participants also pointed out that they would like Jack to be their English
teacher because he sounds like a native speaker of English:
68. <Yes> Good voice, and he can speak =he can speak like American. [M7, PHKor;]
69. <Yes> I think he's from the country ((of)) English users… so it's better for @me. @_<DUR=2s> [F13, SGKor]
Based on the present study’s findings, we can say that all three participant
groups (PHKor, SGKor, and FIL) are good at perceiving and identifying Jack’s
sociolinguistic background. Focusing on the PHKor group, of the total 18
students, eight identified Jack as an office worker, and four identified him as a
teacher. Moreover, 13 of these 18 participants thought he belonged to the
middle-class; and of these 13 participants, 10 (56%) correctly identified both
Jack’s previous/current occupation and socioeconomic class.
The three participant groups also expressed overall positive views
towards Jack’s English accent. 26 (90%) of the total 29 participants rated the
speaker’s English accent as Good (12 PHKor, 5 SGKor, and 4 FIL) and Very
Good (3 PHKor and 2 SGKor), while the remaining three participants (all
PHKor) gave an Average rating. Focusing on the PHKor group, of the total 18

132
participants, 15 gave Good (n=12) and Very Good (n=3) ratings. These positive
ratings, however, did not come without reservations. Several participants noted
that Jack’s accent was good but sounded either different or unnatural. Some
participants also found it difficult to follow or understand the spoken text due
to Jack’s accent. These disinclinations towards Jack’s non-native (but Standard)
PhilE accent were also further seen in some of the participants’ responses when
they were asked whether they would like Jack to be their English teacher.
5.2 Relating speech production and sociolinguistic perception
5.2.1 Statistical analysis
It has been established in Chapter 4, based on the descriptive and statistical
analyses of PHKor, SGKor, and FIL L2 speech production patterns, that
phonation type is the most salient and significant feature that distinguishes the
PhilE stop system from ‘native’ varieties of English (e.g., AmE and BrE), and
even from Korean. The PhilE stop system is primarily characterized by
significantly short aspiration for voiceless stops, and very short to negative
voicing for voiced stops. Bearing these in mind, how do the PHKor group’s
phonation patterns in L2 English stop production relate to their sociolinguistic
perception of PhilE?
Linear regression analyses of VOT were performed with fixed predictor
variables drawn from both speech production and sociolinguistic perception
data. Like the regression analyses performed in Chapter 4, FIL data was
excluded since the main objective of the present study is to analyze the speech
production and perception patterns of Korean learners of English. Two
regression models were carried out – EngVOT3, which involves VOT tokens
from all PHKor students (both informed and uninformed), and EngVOT4, which

133
included only VOT tokens produced by the uninformed PHKor group. (The
subscripts 3 and 4 respectively refer to the third and fourth series of VOT
models used in the present study.) The six PHKor students who were informed
of Jack’s nationality/place of origin were excluded from the second VOT model
as they produced empty cells in the data spreadsheet (they were not asked the
question “Do you think Jack is Filipino/from the Philippines?”).
The following predictor variables for the two English VOT regression
models are: Profession (Teacher/Office Worker or Other); Socioeconomic
class (Middle-class or Wealthy); participants’ Rating of Jack’s English accent
(Low or High); and whether they would like him to be their English teacher
(Yes or No). The variable Informed/Uninformed was added to EngVOT3 to
account for any variation in VOT between informed and uninformed PHKor
students. Meanwhile, the variable Place of origin (Philippines or Other) was
added to EngVOT4. The most significant predictor variable based on the
regression models in Chapter 4, Phonation, was also included in both EngVOT3
and EngVOT4 models. Fixed interactions between Phonation and each of the
other predictors were factored in during the stepwise analysis of the models. (It
must be noted Gender was excluded from all regression models since all
participants identified Jack as male.) Finally, Participant was added as a
random variable in both regression models.
Before I present the regression models and the results of the stepwise
analyses of these models, allow me to first provide a detailed account of the
variation in English VOT based on the fixed pairwise interactions involving
Phonation and the predictor variables drawn from the sociolinguistic perception
data.

134
Figure 24: Mean word-initial L2 English VOT values (in ms) sorted by PHKor participants’ responses for ‘Place of origin’. The data is further distributed by Phonation type. L2 English VOT data comprises stop tokens produced in both formal and informal speech styles.
An initial series of simple t-tests revealed that mean English VOTs
varied significantly for each predictor variable except Place of origin, wherein
no significant difference was found between participants who thought Jack was
Filipino/from the Philippines (µ=40.52, σ=32.50) and participants who did not
think so (µ=40.76, σ=32.50) [t(917)=0.13292, p=0.89428].20 More insightful
patterns of variation, however, were found in the interactions of Phonation type
with each of the other predictor variables. Based on the findings summarized in
Figure 24 above, PHKor students who thought Jack was from the Philippines
produced significantly longer English voiceless stops than those who did not
think so [t(944)=2.01, p=0.02244]. Between the two sub-groups, however,
mean VOT differences in the production of voiced stops and unaspirated stops
were deemed only marginally significant [voiced: t(130)=1.85, p=0.06664;
unaspirated: t(194)=1.7024, p=0.09028].
20 Due to the small number of tokens for each variant of Place of origin, the variants were collapsed and recoded into two main sub-categories, namely Philippines and Other.
-1
27
56
41
5
31
53
41
10
20
56
39
-10
0
10
20
30
40
50
60
Voiced Unaspirated Voiceless Overall
VOT/
ms
Distribution of mean L2 English VOT according to participants' responses to 'Place of origin'
Filipino/Philippines Other Informed

135
Figure 25: Mean word-initial L2 English VOT values (in ms) sorted by uninformed PHKor participants’ responses for ‘Socioeconomic class’ and ‘Occupation’. The data is further distributed by Phonation type. L2 English VOT data comprises stop tokens produced in both formal and informal speech styles.
Because I wanted to check whether revealing sociolinguistic
information about a Filipino speaker of English in the perception task would
affect their production patterns in the elicitation tasks, the variable
Informed/Uninformed was added. Based on the t-test results, the uninformed
PHKor group did not produce significantly different overall mean VOT from
the informed PHKor group [t(2066)=1.29, p=0.19757], although the production
3
29
60
1
29
42
0
10
20
30
40
50
60
Voiced Unaspirated Voiceless
VOT/
ms
Socioeconomic class category
Distribution of mean L2 English VOTs according to uninformed participants responses to 'Socioeconomic
class'
Middle-class Wealthy
5
29
56
0
29
51
0
10
20
30
40
50
60
Voiced Unaspirated Voiceless
VOT/ms
Occupation
Distribution of mean L2 English VOTs according to uninformed participants' responses to 'Occupation'
Teacher/Office worker Others

136
Figure 26: Mean word-initial L2 English VOT values (in ms) sorted by the PHKor participants’ rating of Jack’s English accent, and responses for ‘Would you like Jack to be your English teacher?’. The data is further distributed by Phonation type. L2 English VOT data comprises stop tokens produced in both formal and informal speech styles.
of voiceless stops was marginally so [t(829)=1.70, p=0.08908]. The findings
suggest that voiceless stops with significantly longer mean VOTs (compared to
uninformed PHKor students who did not think Jack was from the Philippines)
were also produced by informed PHKor students. (In fact, these students even
produced significantly longer mean VOTs for voiced stops [t(436)=3.41,
p=0.00071] and unaspirated stops [t(287)=4.61, p<0.0001].)
2
28
47
3
33
55
0
10
20
30
40
50
60
Voiced Unaspirated Voiceless
VOT/
ms
Phonation type
Distribution of mean L2 English VOTs according to uninformed participants' rating of Jack's English accent
Low High
6
29
55
-7
29
48
-10
0
10
20
30
40
50
60
Voiced Unaspirated Voiceless
VOT/
ms
Phonation type
Distribution of mean L2 English VOTs according to uninformed participants' responses to 'Would you like Jack
to be your English teacher?'
Yes No

137
Overall, English voiceless stops with significantly longer mean VOTs
were produced by PHKor students who (1) correctly identified Jack’s place of
origin, or (2) who had prior knowledge of his nationality. Based on these overall
trends, it appears that students who are made aware of or are more sensitive to
the features of the PhilE accent are less likely to assimilate to PhilE norms in
their L2 speech production.
Interestingly, the findings summarized in Figure 25 above also show that
uninformed students who correctly identified Jack’s socioeconomic class
produced significantly longer mean VOTs for English voiceless stops
[t(883)=12.60, p<0.0001]. A similar trend was also observed in the interaction
between Phonation and Occupation [t(944)=2.71, p=0.00679]. Furthermore, as
seen in Figure 26 above, significantly longer mean VOTs for English voiceless
stops were observed among PHKor students who gave Jack’s English accent a
High rating (Good and Very Good) [t(944)=4.31, p<0.0001]. PHKor students
who expressed willingness to have Jack as their English teacher also produced
longer mean VOTs for voiceless stops [t(408)=4.04, p<0.0001], and even
voiced stops [t(79)=3.33, p=0.00133].21
We now look at the regression models EngVOT3 and EngVOT4.
Stepwise analysis of the EngVOT3 model produced a mismatch between the
best step-up and step-down models, with the latter model (R2=0.59) showing a
significantly better fit [𝜒2=26.73, d.f.=3, p<0.0001]. In the step-down model,
the significant predictor variables were Participant [random, not tested] and the
21 Later in this section, for the purposes of modelling English VOT data using Rbrul, variants of the predictor variable Rating were collapsed into two categories, i.e., High (Good and Very Good) and Low (Poor and Average). Similarly, for the predictor variable English teacher, VOT tokens from Participant F1, who answered Maybe to the question ‘Would you like Jack to be your English teacher?’, were added into the ‘Yes’ column in the Rbrul spreadsheet.

138
Table 33: Best step-down EngVOT3 model of L2 English VOT. Predictors: Participant [random, not tested] and Phonation:Informed/Uninformed (1.51e-06) + Phonation:Socioeconomic class (1.32e-05) + Socioeconomic class [main effect, not tested] + Informed/Uninformed [main effect, not tested] + Phonation [main effect, not tested] [p-values dropping from full model]
Deviance=18502.87; Log likelihood=-9251.435; d.f.=11; Grand mean=40.092ms
Predictor variable Coefficient Tokens Mean VOT
Phonation Voiceless 25.069 1341 54.375
Unaspirated --3.083 289 26.198 Voiced -21.985 438 5.528
Socioeconomic class
Middle-class 3.365 1462 42.620 Wealthy -3.365 606 33.992
Informed/ Uninformed
No 0.195 1409 40.675 Yes -0.195 659 38.845
Phonation: Socioeconomic
class
Voiceless:Middle-class 3.218 941 58.378 Voiced:Wealthy 1.0802 118 3.546
Unaspirated:Wealthy 1.416 88 24.972 Unaspirated:Middle-
class -1.416 201 26.734
Voiced:Middle-class -1.802 320 6.259 Voiceless:Wealthy -3.218 400 44.959
Phonation:Informed/ Uninformed
Unaspirated:Uninformed 4.565 198 29.198 Voiced:Informed 3.735 173 9.822
Voiceless:Informed 0.829 395 55.974 Voiceless: Uninformed -0.829 946 53.708
Voiced:Uninformed -3.735 265 2.726 Unaspirated:Informed 4.565 91 19.669
interactions of Phonation with Socioeconomic class and with the
Informed/Uninformed variable [both p<0.0001]. Meanwhile, the best step-
down EngVOT4 model revealed Participant to be a significant predictor
[random, not tested], as well as the interactions of Phonation with English
teacher and Place of origin [p<0.0001].
5.2.2 Discussion and conclusion
The regression models corroborate the earlier observation that patterns of L2
English stop production vary across participants who manifest a range of
perceptions or attitudes towards (non-native) speakers of English. Students who
were better at identifying or perceiving accent features that index sociolinguistic

139
Table 34: Best step-down EngVOT4 model of L2 English VOT. Predictors: Participant [random, not tested] and Phonation:Socioeconomic class (1.04e-06) + Phonation:English teacher (1.23e-06) + Phonation:Place of origin (8.52e-06) + Socioeconomic class [main effect, not tested] + English teacher [main effect, not tested] + Place of origin [main effect, not tested] + Voicing [main effect, not tested]
Deviance=12,5633.966; Log likelihood=-6281.983; d.f.=14; Grand mean=40.675ms Predictor variable Coefficient Tokens Mean VOT
Phonation Voiceless 22.685 946 53.708
Unaspirated 4.349 198 29.198 Voiced -27.034 265 2.726
Socioeconomic class
Middle-class 3.499 936 44.296 Wealthy -3.499 473 33.510
English teacher Yes 4.338 1078 42.547 No -4.338 331 34.577
Place of origin Filipino/Philippines 2.397 492 40.523
Other -2.397 917 40.756
Phonation: Socioeconomic
class
Voiceless:Middle-class 4.215 619 59.754 Voiced:Wealthy 2.868 79 1.150
Unaspirated:Wealthy 1.347 67 28.953 Unaspirated:Middle-
class -1.347 131 29.323
Voiced:Middle-class -2.868 186 3.395 Voiceless:Wealthy -4.215 327 41.262
Phonation: English teacher
Unaspirated:No 9.012 51 29.407 Voiced:Yes 4.618 200 5.919
Voiceless:Yes 4.394 731 55.268 Voiceless:No -4.394 215 48.404
Voiced:No -4.618 65 -7.100 Unaspirated:Yes -9.012 147 29.152
Phonation: Place of origin
Unaspirated:Other 7.178 118 30.765 Voiceless:Filipino 4.350 320 55.913
Voiced:Filipino 2.828 92 -1.147 Voiced:Other -2.828 173 4.785
Voiceless:Other -4.350 626 52.581 Unaspirated:Filipino -7.178 80 26.887
features like socioeconomic class or occupation, or those who expressed more
positive attitudes towards the non-native accent (regardless of whether they
were aware of it), produced significantly longer VOTs across all phonation
types. Moreover, stepwise analysis of the EngVOT3 model showed that patterns
of stop production, primarily of voiced and unaspirated stops, vary significantly
between the informed and uninformed PHKor groups; there was even
significant variation within the uninformed PHKor students themselves, in their
140
production of voiceless stops.
Overall, English voiceless stops with significantly longer mean VOTs
were produced by PHKor students who had prior knowledge of or correctly
perceived and/or identified Jack’s accent. Based on the empirical evidence
gathered from both speech production and speech perception data, and the
positive correlation between accuracy of L2 speech perception and L2 VOT
production, it seems tempting to conclude at this stage of the present study that
students who are more aware or better at identifying and/or perceiving
Standard PhilE are less likely to assimilate to non-native L2 norms during their
L2 speech acquisition. Nonetheless, if we are to accept this claim and discuss it
further, some important ramifications relating to Flege’s SLM and theories of
L2 speech acquisition must be addressed.
First, PHKor students were just good as FIL students at identifying
accent features that index certain sociolinguistic backgrounds, like
socioeconomic class or occupation; they were also just as good at detecting the
presence of a foreign (i.e., non-native) English accent, or “divergences from
English phonetic norms” (Flege, 1995, p. 233), even overtly expressing their
awareness and understanding that regional varieties of English differ in terms
of their accent features. The findings reflect Flege’s (1984) observation that
even with short speech samples, phonetically untrained listeners can identify
foreign accents. But the majority of participants failed to correctly identify or
distinguish Jack’s Standard PhilE accent from non-native regional varieties or
even (General) AmE norms. It is important to note, however, that PHKor
students identified Jack as a Filipino at about the same rate as the FIL group, so
there is no evidence here that the Korean students are bad at the given task – in

141
fact, they seem about as good as Filipino speakers of English.
Second, the SLM postulates that higher rates of perceptual accuracy of
L2 speech norms positively correlate with lower rates of L2 speech production
errors. Given the nature of the data collected and participants involved in the
present study, we would expect the PHKor group’s L2 speech production
patterns (i.e., the L2 they acquire in Philippine-based ESL context, PhilE), to
correlate with their rate of perceptual accuracy of PhilE speech norms.
Considering this, PHKor students who are better at identifying and/or
perceiving the L2 accent (Standard PhilE) should produce speech patterns that
assimilate closer to that L2 variety. VOT data from the PHKor group, however,
suggests otherwise; PHKor students were producing L2 speech patterns that
dissimilated from PhilE production norms even with increasing perceptual
accuracy of the Standard PhilE accent. There are several plausible reasons as to
why this might be happening; I surmise that they involve deeply-rooted
language learning and teaching ideologies. First, although PHKor students
generally show neutral-to-positive dispositions or attitudes towards PhilE most
of them, like participants F1 and F7 (see their excerpts below), would not want
to acquire it, since they aspire to acquire inner-circle norms and achieve native-
like proficiency:
70. If I stay with Korean students, I follow their accent when I speak English. So I watch English movies and study more vocabulary. [F1, PHKor]
71. If I can speak English well, I can go to abroad with confidence because I can talk with abroad people. Also, we can get a good job we want. Our choice can be wide. [F7, PHKor]
72. How to remove Korean accent? [M1, PHKor]
Even if PhilE is now increasingly being regarded as a ‘native’ variety by many
speakers (especially Filipinos), most Koreans studying ESL do not think that is

142
the case. SGKor students like F13 also share similar sentiments regarding
prestige differences between inner-circle and outer-circle English varieties:
73. I think it is important to live in countries which use English to learn real English. [F13, SGKor]
Second, hegemonic ideologies of native-speakerism that permeate Philippine-
based English language education continue to complicate the nature of non-
native L2 speech acquisition: pedagogically, General AmE remains the target
language of acquisition, even though Standard PhilE is the main perceptual
input (as most teachers of English are Filipinos). In this setting, L2 speech
production errors are inevitably viewed as deviances or divergences from
General AmE norms. It could be the case that, while most PHKor students wish
to avoid acquiring PhilE, the students who are better at identifying and/or
perceiving PhilE accent features were better able to avoid acquiring PhilE
features in their English speech production.
Regarding the idea of ‘avoidance’ of PhilE features in L2 speech, it may
be useful to view it under the notion of phonetic talent (Lewandowski, 2012)
which is:
...composed of a bundle of abilities, some located at the input processing stage - starting with undisturbed auditory abilities as a premise and the capacity to notice important linguistic information and tell it apart from mere noise or blur - to the more central processing stages of encoding and storage, and ending with the output stage, where stored phonetic information needs to be retrieved from memory. (p. 65)
Summarizing, Lewandowski claims that phonetic talent bears a direct influence
on the mechanism of phonetic convergence, with possible underlying
attentional and memory components (p. 205); in a dialog, phonetic talent
becomes a decisive factor in the amount of phonetic convergence that non-
native speakers display toward their native speaking partners. Bearing in mind

143
this notion, we would expect students who are better able to avoid acquiring
PhilE features in their L2 to be more talented – that is, more attentive to (and
perhaps more careful and cautious about) their speech production – because
they might hesitate or be reluctant to sound ‘Filipino’.22
Third, and finally, the potential influence of L1 in the interlanguage
during L2 speech acquisition should not be ignored. The SLM postulates that
given two L2 sounds, the sound that is less dissimilar from an existing L1 sound
in their phonetic inventory should be acquired by L2 learners more easily in the
short term.23 Since VOTs for Korean aspirated, lenis, and fortis stops are less
dissimilar from VOTs for native English voiceless, unaspirated, and lenis stops
(L1 Korean and (General) AmE stops have significantly longer mean VOTs
than PhilE stops), Korean ESL learners should be able to acquire the stop system
of a native English variety like AmE more easily than the stop system of PhilE.
But as mentioned earlier, PHKor students are much less exposed to native
English accents since the speech perceptual input in their ambient formal
learning environment is almost always PhilE. Hence, drawing from the SLM
perspective, it is conceivable that L1 transfer has a greater effect on PHKor
students who are better at identifying and/or perceiving Standard PhilE, thus
accounting for the difference between the ST and LT PHKor groups.
This chapter has highlighted the importance of language perception in
L2 speech acquisition, and has utilized statistical tools to draw empirical
22 This invites a plethora of other related research questions that involve other issues in language acquisition research, such as attention and even motivation during (second) language acquisition. In the case of the PHKor students, who are exposed to a non-native ambient learning environment, such issues are crucial and equally important; however, they lie beyond the scope of the present study. 23 In the long-term, the SLM posits the opposite namely, that the less dissimilar / more similar sound will be harder to acquire to a native-like level, because it continues to be influenced inappropriately by the phonetic norms of a close L1 sound.

144
relations between L2 speech production and speech perception patterns,
situating and framing the analysis within Flege’s SLM. It has also attempted to
raise several issues addressing Flege’s caveat regarding his initial version of the
SLM: that is, that “not all L2 production errors are perceptually motivated”
(1995, p. 238). For example, strong and deeply-rooted language learning and
teaching ideologies involving prestige differences between Inner and Outer
Circle varieties of English, and between native- and non-native English
speakers, were proposed to exert a strong influence on how Korean L2 learners
perceive and even acquire PhilE.
In the next and final chapter, I provide an overall summary of the results
presented in Chapters 4 and 5, and attempt to further address the key theoretical
and conceptual issues surrounding L1 and L2 speech production and
sociolinguistic perception of non-native varieties of English; discuss the
strengths and limitations of the present study; provide suggestions for further
research; and present ideas on how sociophonetic approaches can be utilized in
the Philippines, a potentially rich site of language data, to advance and integrate
the fields of sociolinguistics, SLA, ESL, and applied linguistics.

145
CHAPTER 6
CONCLUSION
In this study, I attempted to advance sociolinguistic variationist and SLA
research by providing a descriptive and statistical analysis of L1 and L2 speech
production and L2 sociolinguistic perception patterns among Philippine-based
ESL learners. This is perhaps the first research of its kind that analyzes
sociolinguistic variation in second language acquisition in the Philippines.
6.1 Summary of results
In Chapter 4, analysis of L1 and L2 VOT and f0 onset reveals that PHKor
students are (1) assimilating phonetic features of the PhilE stop system across
segmental and subsegmental levels; (2) exhibiting L1-to-L2 interference,
evidenced by L2 stops that appear to assimilate towards Korean production
norms in certain phonological environments; and (3) producing dissimilatory
phonetic drift patterns in their L1 sound system, indicating bi-directional sound
change and development. For a summary of the L1 and L2 categorical
assimilation/linkages at the segmental and subsegmental levels, please refer to
Table 31 in Chapter 4, Section 4.4.3.
There is apparent-time evidence of significant stylistic variation in
English f0 onset with respect to differences in speech style, as well as evidence
that phonetic drift can vary or even change (e.g., from assimilatory to
dissimilatory) depending on the nature of the language learning program, or
degree of linguistic exposure in the ambient L2 setting. In fact, PHKor students
who experienced greater linguistic exposure effects – that is, those who

146
interacted more often with Filipino peers and were involved more in their formal
L2 learning – produced overall shorter English and Korean VOTs across all
types of phonation, as well as lower mean English f0 onset (for stops followed
by a PALM vowel). These findings suggest that phonetic drift during L2 speech
acquisition may be environmentally conditioned and motivated, echoing
Dickerson’s (1974, p. 12) observation that phonetic variability is sensitive to
not only style differences, but also to social differences of various kinds.
The results of the present study differ from other studies in several ways.
First, there is no evidence of L1 aspirated-lenis merger among the Korean
participants. To some extent, these findings challenge or provide
counterevidence to the general claim in the current literature that Korean
aspirated and lenis stops are undergoing merger in terms of VOT duration (cf.
Choi, 2002; Kang & Guion, 2008; M.-R. Kim, 2008, 2011b; Oh, 2011; Silva et
al., 2004, Silva, 2006a, b; Wright, 2007). Perhaps the lack of merger could be
attributed to the general shortening of VOT in L1 stops due to assimilation to
stops in the non-native L2 variety.
Second, significant gender effects were not observed in many cases,
except in the production of L1 Korean VOT within the PHKor group
(p=0.0218), wherein female PHKor students exhibited significantly longer
mean VOT for lenis and aspirated stops. This finding also deviates from Oh’s
(2011) study, which revealed that females producing significantly shorter VOTs
for aspirated stops (and therefore exhibiting greater aspirated-lenis merger).
It is also interesting to note, based on the normalized z-scores for f0
onset, that gender is not a significant predictor of variation in either English or
Korean f0 onset, suggesting that female and male Korean student participants in

147
the present study were producing similar tonal contrast patterns in both
languages, despite having different glottal physiologies. In fact, speech style is
found to be a more significant predictor of the variation in f0 onset: PHKor
students were approximating tonal contrast patterns in their L2 to the tonal
contrast patterns in the non-native L2 variety in a particular style.
Third, age is the only predictor variable in the study whose effect
resulted in an increasing overall trend in mean English VOT. I believe that this
has potentially relevant implications on ESL teaching based on Flege’s
theoretical assumptions in SLM, which was primarily created to provide an
explanatory account of age-related effects in L2 speech acquisition (Chang,
2012). Assuming one of Flege’s SLM postulates is correct – that older learners
are more like to assimilate various sounds to the same phonetic category – then
it makes sense for older PHKor learners to be more likely to assimilate non-
native L2 stops to corresponding L1 sounds in their existing L1 phonetic
inventory, causing them to produce longer English VOTs.
Overall, adopting a variationist perspective on second language
acquisition and examining sociophonetic data from PhilE-based ESL contexts
have revealed the importance of what Chang (2012, p. 251) refers to as
“linguistic experience” during L2 speech acquisition. When measuring phonetic
variation and change during SLA, age of learning or AOL (Chang, 2012; Flege,
1995) is generally used as the yardstick for linguistic experience; however, as
the present study has revealed, socially-conditioned factors not necessarily
related to age can also serve as proxies for linguistic experience, individually
and interactively affecting categorical assimilation processes and phonetic drift
patterns with varying levels of significance. Focusing particularly on the PHKor

148
group, the overall shortening of their L2 VOT and lowering of their L2 f0 onset
have been positively correlated with the length and degree of their linguistic
exposure to the non-native L2 variety, illustrating that the nature of the ambient
sociolinguistic environment (on top of age-related effects) during L2 speech
acquisition is a crucial and necessary condition for examining variation or
change in the categorical assimilation of L2 sounds and phonetic drift patterns
in the interlanguage.
Chapter 5 has revealed that students who are more aware of or better at
identifying and/or perceiving Standard PhilE are less likely to assimilate to
non-native L2 production norms during their L2 speech acquisition. This
highlights the importance of sociolinguistic perception and perceptual accuracy
to L2 speech acquisition.
The present study utilized empirical data to draw relations between L2
speech production and speech perception patterns, situating and framing the
analysis within Flege’s SLM. It has also identified other key areas of potential
significance to variation in L2 speech production that may or may not be
necessarily, directly, nor intrinsically related to their perception of L2 sounds –
addressing Flege’s caveat on his initial version of the SLM, i.e., that “not all L2
production errors are perceptually motivated” (1995, p. 238).
Considering the SLM framework, however, a detailed and
comprehensive account of the relationship between speech production and
speech perception requires a combination of compatible elicitation and phone
perception tasks. Such methods have been incorporated by several notable
studies on speech perception (see Best & Tyler, 2007; Choi et al., 2013; Flege
& Eefting, 1987a, b; Liberman et al., 1957; and Nearey & Rochet, 1994). The

149
perception task adopted in this study, however, was sociolinguistic – and not
specifically phonetic – in nature, as it was designed to determine how foreign
learners perceive and identify the sociolinguistic background of a speaker with
a non-native but standard PhilE accent. There were no tasks specifically
designed to perceptually identify non-native L2 phones (even L1 phones), or
discriminate one phone from another.
Thus, from a methodological perspective, relating PHKor production
trends in VOT and f0 onset of say, English /p/ to the results of a phone perception
task involving the identification or discrimination of similar phones, i.e., non-
native English /p/ and even Korean word-initial /p* p and ph/, would yield a
potentially more accurate interpretation of the learners’ categorical assimilation
processes and phonetic drift patterns.
6.2 Limitations of the study
In this section, I outline key issues surrounding the present study that need to
be addressed. I focus on the limitations of my research design, particularly
paying attention to the methodology and data collection employed during my
three-month fieldwork in Baguio City, Philippines.
Although the testing sessions yielded significant trends in English and
Korean VOT and f0 onset, and revealed interesting sociolinguistic perceptual
patterns, there are certain aspects of the research design that can be improved
upon. First, while there were three elicitation tasks – and therefore data from
three speech styles – for English (wordlist, reading passage, and casual
interview), there was only one for Korean (a wordlist).24 Adding more elicitation
24 There were in fact two Korean elicitation tasks conducted during the testing sessions, the second one being a phrase list task adopted from Kang and Guion’s (2008) clear speech

150
tasks for Korean should be considered for further research. Second, English stop
tokens were unevenly distributed in the wordlist and reading elicitation tasks.
This project initially began as a study of voiceless stop production patterns in
English, so there were significantly more voiceless stop tokens in the elicitation
tasks for the first few testing sessions (English voiced and unaspirated stop
tokens were initially included as word-initial stops in filler word tokens). It was
only after a few sessions that I decided to modify the wordlist and reading
passage text to add more tokens of word-initial voiced stops and unaspirated
stops in [#s/ptk/_] position, after noticing interesting trends in their VOT and f0
onset. Third, and as already mentioned earlier in Section 6.1, the perception task
was sociolinguistic in nature, so perceptual assimilation of certain L1 and L2
stops could not be quantitatively measured and benchmarked against the
learners’ actual production of the same/similar L1 and L2 stops. Moreover, a
series of matched guise sociolinguistic and/or perception tasks should be able
to yield better results; having the participants listen to more PhilE speakers or
types of (PhilE) accent can provide a more detailed picture of foreign learners’
perceptions and attitudes towards PhilE.
In terms of the nature of data collected and how data collection
procedures were conducted, there are certain aspects that can also be improved
upon. First, all participants in the study were university students aged 17-25;
while they fit well into Flege’s SLM participant criteria (relatively older L2
learners with considerable linguistic experience and L2 language proficiency),
it would have been more beneficial to obtain data from a wider age range,
material. Due to time constraints, however, not all tokens from the phrase list were measured for VOT and f0 onset, so the data set was eventually excluded from the analysis. I would also like to mention that because I could not speak nor understand Korean, I was not able to conduct a similar sociolinguistic casual interview in their L1.

151
involving younger L2 learners (children and adolescents) and perhaps even
older ones (adults in their 30s, and middle-aged to senior ones), to identify not
only if there are age differences in L2 speech acquisition, but also to determine
the extent to which the Korean stop system is undergoing generational change.
Second, despite collecting language data from both short-term (ST) and long-
term (LT) PH-based Korean students, the synchronic nature of the study limits
our understanding of the potential rapid effects of categorically assimilated or
newly acquired L2 English sounds on L1 Korean sound change during the early
stages of L2 speech acquisition (cf. Chang, 2012). Collecting longitudinal data
of both speech production and perception patterns from ST and LT L2 learners
would shed better light on the nature of L2 speech acquisition. Third, the
comparison sample group, SGKor, comprised only five participants (three
females and two males) – it would have been helpful if data from more SGKor
students were collected to balance the two Korean participant groups in terms
of length of study (LOS, in years), language proficiency, and L1 and L2
language background.
It would have been more ideal to compare the current PHKor group with
a Korean-English bilingual group that was exposed to General AmE (the target
language of instruction in Philippine-based ESL) instead of Singapore English
(SgE). Indeed, one might raise several issues regarding the potential rapid
effects of exposure to SgE on the L2 speech production patterns among SGKor
students. This is a valid concern, since SgE is an entirely different English
variety with its own distinct phonological inventory (to know more about SgE
phonology, see Deterding’s (2007) book, Singapore English). But as mentioned
in Ng (2005), bilingual Singaporeans generally produce English stops with

152
mean VOT values comparable to native English speaker norms (for mean SgE
VOT values, see Figure 7, p. 50). Thus, if we assume that exposure to SgE has
brought about rapid and/or short-term exposure effects to the SGKor
participants’ L1 and/or L2 stop production patterns, changes in VOT duration
would be less perceptible.
One final point: the present study did not account for variation in L2
speech production among the PHKor participants’ ESL teachers, who are all
Filipinos with perceptibly distinct (Standard) PhilE accent features. It is highly
possible that variation in speech and/or pronunciation teaching styles can
significantly influence and even overtly alter students’ L2 speech production
patterns (this is particularly relevant to the ST PHKor learners, whose L2 input
came mostly from their ESL teachers due to the intensive nature of the school’s
in-house teaching program that requires the students to live on campus).
Moreover, Filipino ESL teachers can also significantly influence their students’
perceptions of PhilE and acquisition of sociolinguistic knowledge of PhilE
accent features through their teaching and discourse practices (cf. Starr, 2011).
6.3 Directions for future research
The most important step to advancing the present study would be to embark on
longitudinal research of L2 speech acquisition in Philippine-based language
learning contexts, addressing one or all the following key areas:
• L1 and L2 speech production and speech perception patterns, and
• sociolinguistic perceptions, language attitudes, and language-related
ideologies towards PhilE.
This type of research should cover a larger sample population size of foreign
learners. Also, depending on the main research objectives and the timeframe for

153
conducting fieldwork, the following criteria for participant collection may be
considered:
• Collection of foreign student participants from various types of language
programs other than ESL, e.g., language preparation courses for
examinations like IELTS and TOEIC; courses in Business English or
English Communication; and/or general education/university courses
taken up by full-time foreign students in local institutions.
• Collection of foreign student participants from ESL educational settings
in major Philippine urban centers, where most of them reside (see Figure
2, p. 10).
• Collection of immigrant population samples. In general, we would
expect immigrants, who are more likely to have already assimilated or
integrated into Filipino society, to speak a variety of English that closely
resembles PhilE. Immigrants are also more likely to be able to speak
Tagalog and, depending on their place of residence, another Philippine
language variety and/or dialect.
Another potentially relevant topic regarding SLA in Philippine-based ESL
contexts is phonological variation in teacher speech. As already mentioned, it is
highly possible that variation in speech and/or pronunciation teaching styles can
significantly influence and even overtly alter students’ L2 speech production
patterns. Teachers, as active speaker agents, can exploit the social meanings of
standard and non-standard variants to construct styles appropriate to different
classroom tasks (Starr, 2011, p. 293); however, in the case of English language
education in Outer Circle countries like the Philippines, such styles continue to
perpetuate hegemonic ideologies of native-speakerism, which may contribute

154
to why foreign learners of English are still expressing reluctance towards
acquiring non-native production norms, despite the general increase in neutral-
to-positive dispositions or attitudes towards non-native English varieties.
Finally, the present study has only investigated a small part of the
interlanguage; phonetic drift manifests across segmental and subsegmental
levels, and can vary from one acoustic correlate to another. While tonal contrast
has been investigated in this study, the production and perception of L1 and L2
vowels – which are more prone to synchronic variation and generational change
– during L2 speech acquisition is worth investigating in the context of
Philippine-based ESL learning.
6.4 Final remarks
The current predominant narrative on Philippine-based ESL education is that
the Philippines is an ideal place to learn English mainly because it is a good
“first step in preparing for school in English-speaking countries down the road”
(Strother, 2015). Choe (2016) refers to Philippine-based ESL learning as a
bridge to tertiary education in the Inner Circle countries. Furthermore, the
Philippines has become a viable low-cost option for ESL education (Gomez,
2013), since school rates and overall living expenses are cheaper than in Korea
and in other English-speaking countries (Jamir, 2015). Taking a sociolinguistic
perspective and incorporating sociophonetic approaches to SLA research,
however, the present study has revealed that Korean ESL learners now show
more neutral-to-positive attitudes towards PhilE as a medium of learning and
instruction (cf. Castro & Roh, 2013; Roh, 2010), but remain reluctant to acquire
PhilE accent features in their speech production. Even though Koreans are
putting more economic and social value into Philippine-based ESL education,

155
many of them continue to regard PhilE as a less prestigious, ‘non-native’ variety
of English, and still aspire to achieve ‘native-like’ English norms in speech.
It is my hope that this research has illuminated several important issues
surrounding L2 speech acquisition, language ideologies, and language teaching
and pedagogy in the Philippines. I wish that the results of this study can provide
key industry players – Filipino English teachers and curriculum planners,
foreign and local education think-tanks and investors, and most importantly, the
L2 English learners themselves – important insights on the role of (Standard)
Philippine English as a medium of instruction; and ways to reimagine,
reposition, or even challenge predominant language ideologies, while providing
avenues to help students improve their language proficiency skills.

156
BIBLIOGRAPHY
Andrade, J. (2016, June 24). DOT eyes 6 new markets. Philippine Daily
Inquirer. Retrieved from http://newsinfo.inquirer.net/792197/dot-eyes-6-
new-markets
Adamson, H. D. (1988). Variation theory and second language acquisition.
Washington D.C.: Georgetown University Press.
Barros, M. E. M. P. (2006, October 26-29). The Koreanization of Baguio: Issues
of Acculturation. Proceedings from Asia Culture Forum 2006. Kwangju
City, South Korea: Korean Ministry of Culture and Tourism, Asia’s Future
Initiative.
Bayley, R. (2005). Second language acquisition and sociolinguistic variation.
Intercultural Communication Studies, 14(2), 1-14.
Beckman, M. E., Li, F., Kong, E.-J., & Edwards, J. (2014). Aligning the
timelines of phonological acquisition and change. Laboratory Phonology,
5(1), 151-194.
Beebe, L. M. (1980). Sociolinguistic variation and style shifting in second
language acquisition. Language Learning, 30(1), 433-447.
Benkí, J. (2005). Perception of VOT and First Formant Onset by Spanish and
English Speakers. In J. Cohen, K. T. McAllister, K. Rolstad, & J. MacSwan
(Eds.). Proceedings from the 4th International Symposium on Bilingualism.
Somerville, MA: Cascadilla Press, 240–248.
Berdan, R. (1996). Disentangling language acquisition from language variation.
In: R. Bayley & D. R. Preston (Eds.), Second language acquisition and
linguistic variation (pp. 203-244). Amsterdam: John Benjamins.
Best, C. T., & Tyler, M. D. (2007). Nonnative and second-language speech
perception: Commonalities and complementarities. In: O.-S. Bohn, & M. J.
Munro (Eds.), Language experience in second language speech learning:
In honor of James Emil Flege (pp. 13-34). Amsterdam: John Benjamins.
Boersma, P. & Weenink, P. (2015). PRAAT. Doing Phonetics by Computer

157
(Version 5.4.22) [Computer program]. Available from http://www.praat.org
Bolton, K. (2008). World English Today. In: B. B. Kachru, Y. Kachru, & C. L.
Nelson (Eds.), The Handbook of World Englishes (pp. 240-269). Oxford:
Wiley-Blackwell.
Borlongan, A. M. (2011). Relocating Philippine English in Schneider’s
dynamic model. Paper presented at the 17th Annual Conference of the
International Association for World Englishes. Melbourne, Australia.
Brent International School Baguio (n.d.). English as a Second Language.
Retrieved from http://www.brentbaguio.edu.ph/home/?page_id=1414
Brent International School Manila (n.d.). English as a Second Language (ESL).
Retrieved from http://brent.edu.ph/academics/esl/
Bureau of Immigration (2014, May 29). Koreans dominate foreign student
admissions at Philippine universities. Bureau of Immigration. Retrieved
from http://www.immigration.gov.ph/faqs/83-may-2014-press-
releases/630-koreans-dominate-foreign-student-admissions-at-philippine-
universities
Castillo, E. (1969). A study of the roles of aptitude, attitude, and motivation in
second language acquisition. Master’s Thesis. Manila, Philippines:
Philippine Normal College.
Castro, M. C., & Roh, T. R. D. (2013). The Effect of Language Attitudes on
Learner Preferences: A Study on South Koreans’ Perceptions of the
Philippine English Accent. ELTWorldOnline.com, 5, 1-22.
Cazden, C. B., Cancino, H., Rosansky, E. B., & Schumann, J. H. (1975). Second
language acquisition sequences in children, adolescents, and adults. Final
report, National Institute of Education (Grant no. NE-6-00-3-0024). ERIC
Number: ED121115.
Chang, C. (2012). Rapid and multifaceted effects of second-language learning
on first-language speech production. Journal of Phonetics, 40(2), 249-68.
Chang, C. (2013). A novelty effect in phonetic drift of the native language.
Journal of Phonetics, 41, 520-533.

158
Cho, M. (2004). An acoustic study of the stops of the Seoul and Daegu dialects.
MA Thesis. Seoul: Korea University.
Cho, T., Jun, S.-A., & Ladefoged, P. (2002). Acoustic and aerodynamic
correlates of Korean stops and fricatives. Phonetics, 29, 155-190.
Choe, H. (2016). Identity formation of Filipino ESL teachers teaching Korean
students in the Philippines. English Today, 32(1), 5-11.
Choi, H. (2002). Acoustic cues for the Korean stop contrast: dialectal variation.
ZAS Papers in Linguistics, 28, 1-12.
Choi, T-H., Kim, G.-H., Han, J.-I. (2013). Perception and production of English
stops by tonal and non-tonal Korean dialect speakers. Journal of Acoustical
Society of America, 134(6), 1-6.
City Government of Baguio. (n.d.). About Baguio City. The City Government
of Baguio Official Website. Retrieved from http://122.55.59.3:8008/about-
baguio-city
Dayag, D. (2004). The English-language media in the Philippines. World
Englishes, 23(1), 33-45.
Dayag, D. (2012). Philippine English. In: E. L. Low & A. Hashim (Eds.),
English in Southeast Asia (pp. 91-100). Amsterdam: John Benjamins
Publishing Company.
de Guzman, A. B., Albela, E. J. A., Ferre, J. B. F., Nieto, D. R. D. & Santos, R.
N. (2006). English language learning difficulty of Korean students in a
Philippine multidisciplinary university. Asia Pacific Education Review,
7(2), 152-161.
Department of Education (2014). K to 12 Basic Education Curriculum:
MTBMLE Curriculum Framework. K to 12 Curriculum Guide: Mother
Tongue (Grade 1 to Grace 10). Retrieved from
http://www.deped.gov.ph/sites/default/files/Final%20Mother%20Tongue
%20Grades%201-3%2001.21.2014_.pdf
Department of Education (n.d.). What is K to 12 Program? The K to 12 Basic
Education Program. Official Gazette of the Republic of the Philippines.
Retrieved from http://www.gov.ph/k-12/

159
Deterding, D. (2007). Singapore English. Edinburgh University Press.
Dickerson, L. (1974). Internal and external patterning of phonological
variability in the speech of Japanese learns of English: toward a theory of
second language acquisition. PhD dissertation. Champaign, IL: University
of Illinois at Urbana-Champaign.
Dickerson, W. (1976). The psycholinguistic unity of language learning and
language change. Language Learning (26), 215-31.
Eckert, P. (2008). Variation and the indexical field. Journal of Sociolinguistics,
12, 453-476.
Eisenstein, M. (1982). A study of social variation in adult second language
acquisition. Language Learning, 32(2), 367-391.
Ellis, R. (1985). Understanding second language acquisition. Oxford: Oxford
University Press.
Ellis, R. (2010). Theoretical pluralism in SLA: Is there a way forward? In: P.
Seedhouse, S. Walsh, and C. Jenks (Eds.), Conceptualising learning in
applied linguistics (pp. 23-51). Basingstoke, Hampshire: Palgrave
Macmillan.
Ellis, R. (2015). Understanding second language acquisition (2nd ed.). Oxford:
Oxford University Press.
Enaka, H. (2006). Language planning and bilingual education in the
Philippines: A historical approach. PhD dissertation. Jawa Timur,
Indonesia: Universitas Merdeka Malang.
Enriquez, M. A. (2012). Philippine English and Taglish from a Language
Contact Perspective. PhD Dissertation. Singapore: National University of
Singapore.
Flege, J. E. (1984). The detection of French accent by American listeners.
Journal of the Acoustical Society of America, 76, 692–707.
Flege, J. E. (1987). The production of “new” and “similar” phones in a foreign
language: Evidence for the effect of equivalence classification. Journal of
Phonetics, 15(1), 47-65.

160
Flege, J. E. (1995). Second-language speech learning: Theory, findings, and
problems. In: W. Strange (Ed.), Speech Perception and Linguistic
Experience (pp. 233-277). Timonium, MD: New York Press.
Flege, J. E. (1996). English vowel productions by Dutch talkers: More evidence
for the “similar” vs. “new” distinction. In: A. James & J. Leather (Eds.),
Second-language speech: Structure and process (pp. 11-52). Berlin:
Mouton de Gruyter.
Flege, J. E., & Eefting, W. (1987a). Cross-language switching in stop consonant
perception and production by Dutch speakers of English. Speech
Communication, 6(3), 185-202.
Flege, J. E., & Eefting, W. (1987b). Production and perception of English stops
by native Spanish speakers. Journal of Phonetics, 15(1), 67-83.
Flege, J. E. (2002). Interactions between the native and second-language
phonetic systems. In: P. Burmeister, T. Piske, & A. Rohde (Eds.), An
integrated view of language development: Papers in honor of Henning
Wode (pp. 217–244). Trier, Germany: Wissenschaftlicher Verlag.
Flege, J. E. (2007). Language contact in bilingualism: Phonetic system
interactions. In: J. Cole, & J. I. Hualde (Eds.), Laboratory phonology, Vol.
9 (pp. 353–382). Berlin, Germany: Walter de Gruyter.
Francis, A. L., Ciocca, V., Wong, V. K. M., & Chan, J. K. L. (2006). Is
fundamental frequency a cue to aspiration in initial stops? Journal of
Acoustical Society of America, 120(5), 2884-2895.
Gomez, J. E. (2013, February 11-13). The Korean Diaspora in Philippine Cities
– Amalgamation or Invasion? In: J. Hou & J. L. Roberts (Eds.), Proceedings
from the Transcultural Cities Symposium. Seattle, WA: University of
Washington.
Gonzalez, A. (1985). Studies on Philippine English. Singapore: SEAMEO
Regional Language Centre.
Gonzalez, A. (1998). The language planning situation in the Philippines.
Journal of Multilingual and Multicultural Development, 19(5), 487-525.
Google Maps (2016). Map of the Philippines. Retrieved December 1 2016 from

161
https://www.google.com.sg/maps/place/Philippines/@11.555752,113.5588
757,5z/data=!3m1!4b1!4m5!3m4!1s0x324053215f87de63:0x784790ef7a2
9da57!8m2!3d12.879721!4d121.774017
Haggard, M., Ambler, S., & Callow, M. (1970). Pitch as voicing cue. Journal
of the Acoustical Society of America, 47(2B), 613.
Hakuta, K. (1976). A case study of a Japanese child learning English as a second
language. Language Learning 26, 321-251.
Han, M. S., & Weitzman, R.S. (1965). Acoustic characteristics of Korean stop
consonants. Studies in the Phonology of Asian Languages (Vol. 3). Los
Angeles: University of Southern California.
Han, M. S., & Wietzman, R. S. (1967). Acoustic features in the manner-
differentiation of Korean stop consonants. Studies in the Phonology of
Asian Languages (Vol. 5). Los Angeles: University of Southern California.
Han, M. S., & Weitzman, R. S. (1970). Acoustic features of Korean /P, T, K/,
/p, t, k/ and /ph, th, kh/. Phonetica, 22, 112-128.
Harada, T. (2003). L2 influence on L1 speech in the production of VOT. In M.-
J. Solé, D. Recasens, & J. Romero (Eds.), Proceedings from the 15th
International Congress of Phonetic Sciences (pp. 1085-1088). Barcelona,
Spain: Causal Productions.
Hiramoto, M. (2012) Pragmatics of the sentence-final uses of Can in Colloquial
Singapore English. Journal of Pragmatics, 44(6-7), 890-906.
Holliday, J., & Kong, E.-J. (2011, August 17-21). Dialectal variation in the
acoustic correlates of Korean stops. Proceedings from the 17th International
Congress of Phonetic Sciences. 878-881.
Holliday, J. J. (2012). The acoustic realization of the Korean sibilant fricative
contrast in Seoul and Daegu, Speech and Speech Science (말소리와
음성과학), 4(1), 67-74.
Jamir, R. (2015, April 18). Koreans Say Philippines still the best place to learn
English. CNN Philippines. Retrieved from
http://cnnphilippines.com/videos/2015/04/17/Koreans-say-Philippines-

162
still-the-best-place-to-learn-English.html
Johnson, D. E. (2009). Getting off the GoldVarb standard: Introducing Rbrul
for mixed-effects variable rule analysis. Language and Linguistics
Compass, 3(1), 359-383.
Jun, S.-A. (1998). The accentual phrase in the Korean prosodic hierarchy.
Phonology, 15(2), 189-226.
Kachru, B. B. (1992). World Englishes: approaches, issues and resources.
Language Teaching, 25(1), 1-14.
Kang, K., & Guion, S. G. (2006). Phonological systems in bilinguals: age of
learning effects on the stop consonant systems of Korean-English
bilinguals. Journal of Acoustical Society of America, 119(3), 1672-1683.
Kang, K., & Guion, S. G. (2008). Clear speech production of Korean stop:
Changing phonetic targets and enhancement strategies. Journal of
Acoustical Society of America, 124(6), 3909- 3917.
Kang, Y., & Han, S. (2013). Tonogenesis in Contemporary Seoul Korean: A
longitudinal case study. Lingua, 134, 62-74.
Keating, P. (1984). Phonetic and phonological representation of stop consonant
phonation. Language, 60(2), 286-319.
Keith, G. B. (2015). SK students lift Baguio’s economy. The Manila Times.
Retrieved from http://www.manilatimes.net/sk-students-lift-baguios-
economy/184332/
Kim, C.-W. (1965). On the autonomy of the tensity feature in stop classification.
Word, 21, 339-359.
Kim, D.-Y. (2015). Korea-Philippine relations: From blood-tied alliance to
strategic partnership. In C. L. Lee, S.-J. Hong, & D.-Y. Youn (Eds.),
ASEAN-Korean Relations: Twenty-five years of partnership and friendship
(pp. 674-723). Nulmin: Seoul.
Kim, M.-R. (2000). Segmental and tonal interactions in English and Korean: A
phonetic and phonological study. PhD dissertation. Ann Arbor, MI: The
University of Michigan.

163
Kim, M.-R. (2003). Segmental effects on f0 contour in English in comparison
with Korean. Korea Journal of Linguistics, 28(2), 271-294.
Kim, M.-R. (2008). Lax stops in Korean revisited: VOT neutralization. Studies
in Phonetics, Phonology and Morphology, 14(2), 3-20.
Kim, M.-R. (2011a). Native and non-native English speakers’ VOT production
of stops. The Linguistic Association of Korea Journal, 19(1), 97-116.
Kim, M.-R. (2011b). The relationship between cross-language phonetic
influences and L2 proficiency in terms of VOT. Speech Sciences, 37(2),
243-283.
Kim, M.-R. (2012a). L1-L2 transfer and f0 production by Korean English
learners: L1 sound change and L2 stop production. Journal of the Korean
society of speech sciences, 4(3), 31-41.
Kim, M.-R. (2012b, October 22-26). The effects of first-language sound change
on second-language speech production. Proceedings from the 164th
Meeting of the Acoustical Society of America. doi:10.1121/1.477430
Kim, M.-R. (2012c). The [voice] system of Korean stops revisited with special
reference to the aspirated-lax merger. Studies in Phonetics, Phonology, and
Morphology, 18(2), 211-243.
Kim, M.-R. (2014). Ongoing sound change in the stop system of Korean: A
three- to two-way categorization. Studies in Phonetics, Phonology and
Morphology, 20(1), 51-82.
Kim, M.-R., Beddor, P. S., & Horrocks, J. (2002). The contribution of
consonant and vocalic information to the perception of Korean initial stops.
Journal of Phonetics, 30, 77-100.
Kim, M.-R. & Duanmu, S. (2004). Tense and lax stops in Korean. Journal of
East Asian Linguistics, 13, 59-104.
Kim, M.-R. & Park, K.-J. (2001). A Korean consonant-tone transfer in L2
(English) acquisition. Journal of the Pan-Pacific Association of Applied
Linguistics, 13, 59-104.
Kingston, J., & Diehl, R. (1994). Phonetic knowledge. Language, 70(3), 419-

164
453.
Kong, E. J., Beckman, M. E., & Edwards, J. (2011). Why are Korean tense stops
acquired so early: The role of acoustic properties. Journal of Phonetics,
39(2), 196–211.
Krashen, S. D. (1976). Formal and informal linguistic environments in language
acquisition and language learning. TESOL Quarterly, 10(2), 157-168.
Krashen, S. D. (1977). Some issues relating to the Monitor Model. In: H.
Brown, C. Yorio, and R. Crymes (Eds.), On TESOL ‘77 (pp. 144-158).
Washington, D.C.: Teachers of English to Speakers of Other Languages.
Krashen, S. D. (1981). Second language acquisition and second language
learning. Oxford: Pergamon.
Krashen, S. D. (1987). Applications of psycholinguistic research to the
classroom. In: M. H. Long & J. C. Richards (Eds.), Methodology in TESOL:
Book of Reading (pp. 33-44). New York: Newbury House.
Ladefoged, P. (2005). Vowels and consonants (2nd ed.). Malden, MA: Blackwell
Publishing.
Labov, W. (1972). The social stratification or (r) in New York City Department
Stores. In: W. Labov (Ed.), Sociolinguistic patterns (43-54). Philadelphia,
PA: University of Pennsylvania Press.
Labov, W. (1984). Field methods of the project on linguistic change and
variation. In: J. Baugh & J. Scherzer (Eds.), Language in use (pp. 28-53).
Englewood Cliffs, NJ: Prentice Hall.
Labov, W. (2007). Transmission and diffusion. Language 83(2), 344-387.
Lado, R. (1957). Linguistics across culture. Ann Arbor, MI: University of
Michigan Press.
Laeufer, C. (1986). Towards a typology of bilingual phonological systems. In:
A. James, & J. Leather (Eds.), Second-language speech: Structure and
process (pp. 325-342). Berlin: Mouton de Gruyter.
Lee, K. (2002). Comparison of acoustic characteristics between Seoul and
Busan dialect on fricatives. Speech Sciences, 9(2), 223-235.

165
Leung, A. H.-C. (2011). Bad influence? – An investigation into the purported
negative influence of foreign domestic helpers on children’s second
language English acquisition. Journal of Multilingual and Multicultural
Development, 33(2), 133-148.
Leung, A. H.-C. (2012). Child L2 phonology acquisition under the influence of
multiple varieties. PhD Dissertation. Newcastle upon Tyne: Newcastle
University.
Lewandowski, N. (2012). Talent in nonnative phonetic convergence. PhD
Dissertation. Stuttgart University: Institute for Natural Language
Processing.
Lewis, M. P., Simons, G. F., & Fennig, C. D. (Eds.). (2016). Ethnologue:
Languages of the World (19th ed.). Dallas, Texas: SIL International.
Retrieved from http://www.ethnologue.com
Liberman, A. M., Harris, K. S., Hoffman, H. S., & Griffith, B. C. (1957). The
discrimination of speech sounds within and across phoneme boundaries.
Journal of Experimental Psychology, 54(5), 358-368.
Liljencrants, J., & Lindblom, B. (1972). Numerical simulation of vowel quality
systems: The role of perceptual contrast. Language, 48(4), 839-862.
Lisker, L. & Abramson, A. S. (1964). A cross-language study of phonation
initial stops: Acoustic measurements. Word, 21, 384-422.
Llamzon, T. (1997). The phonology of Philippine English. In: M. L. S. Bautista
(Ed.), English is an Asian Language: The Philippine context (pp. 41-48).
Manila, Philippines: The Macquarie Library.
Llanos, F., Dmitrieva, O., Shultz, A., & Francis, A. L. (2013). Auditory
enhancement and second language experience in Spanish and English
weighting of secondary phonation cues. Journal of the Acoustical society of
America, 134(3), 2213-2224.
Lord, G. (2008). Second language acquisition and first language phonological
modification. In: J. B. de Garavito, & E. Valenzuela (Eds.), Selected
proceedings of the 10th Hispanic linguistics symposium (pp. 184-193).

166
Somerville, MA: Cascadilla Proceedings Project.
McFarland, C. D. (1993). Subgrouping and number of Philippine
languages. Manila: Prepared for the Secretary of Education, Culture and
Sports, Republic of the Philippines, Pasig, Metro Manila.
Mack, M, (1990). Phonetic transfer in a French-English bilingual child. In: P.
H. Nelde (Ed.), Language attitudes and language conflict (pp. 107-124).
Bonn, Germany: Dümmler.
Mackay, I. R. A., Flege, J. E., Piske, T., & Schirru, C. (2001). Category
restructuring during second language acquisition. Journal of the Acoustical
Society of America, 110, 516-528.
McKenzie, R. M. (2007). A quantitative study of the attitudes of Japanese
learners towards varieties of English speech: Aspects of the sociolinguistics
of English in Japan. PhD dissertation. Edinburgh: University of Edinburgh.
McLaughlin, B. (1977). Second-language learning in children. Psychological
Bulletin, 84, 438-459.
Milroy, L., & Preston, D. R. (Eds.). (1999). Attitudes, perception, and linguistic
features. Journal of Language and Social Psychology, 18(1), 1-112.
Miralao, V. A. (Ed.). (2007). Understanding the Korean diaspora in the
Philippines. In: Exploring transnational communities in the Philippines (pp.
24-39). Quezon City: Philippine Migration Research Network and
Philippine Social Science Council.
MONOL. (n.d.). Sparta and Self Sparta Program. MONOL Educational
Institute. Retrieved from http://mymonol.com/student-life/self-
study/sparta-self-sparta/.
Morris, R. J., McCrea, C. R., & Herring, K. D. (2008). Voice onset time
differences between adult males and females: Isolated syllables. Journal of
Phonetics, 36(2), 308-317.
Nearey, T. M., & Rochet, B. L. (1994). Effects of place of articulation and
vowel context on VOT production and perception for French and English
stops. Journal of the International Phonetic Association, 24(1), 1-18.

167
Ng, S. (2005). 'Method in the madness?': VOT in Singaporean native languages
and English. Master’s Thesis. Singapore: National University of Singapore.
Niedzielski, N. (1999). The effect of social information on the perception of
sociolinguistic variables. In: L. Milroy & D. R. Preston (Guest Eds.),
Journal of Language and Social Psychology, 18(1), 62-85.
Oh, E. (2011). Effects of speaker gender on voice onset time in Korean stops.
Journal of Phonetics, 39(1), 59-67.
Park, H.-E. (2014). The effects of pitch on second language learners’ categorical
perception of Korean alveolar lax and tense stops. Proceedings of the 9th
Purdue Linguistics Association Symposium. Lafayette, IN: Purdue
Linguistics Association, Purdue University.
Philippine Statistics Authority (2013, July 12). Population of 319 thousand was
recorded in Baguio City (Results from the 2010 Census of Population and
housing). Retrieved August 23, 2016 from
https://psa.gov.ph/content/population-319-thousand-was-recorded-baguio-
city-results-2010-census-population-and-housing
Philippine Statistics Authority (2014, July 31). Statistical tables on sample
variables from the results of the 2010 Census of Population and Housing –
Benguet. Retrieved September 12, 2016 from
http://psa.gov.ph/content/statistical-tables-sample-variables-results-2010-
census-population-and-housing-benguet
Philippine Statistics Authority (2016a, May 19). Highlights of the Philippine
Population 2015 Census of Population. Retrieved May 23, 2016 from
http://psa.gov.ph/content/highlights-philippine-population-2015-census-
population
Philippine Statistics Authority (2016b, June 1). Population of the Cordillera
Administrative Region (Based on the 2015 Census of Population).
Retrieved September 12, 2016 from http://psa.gov.ph/content/population-
cordillera-administrative-region-based-2015-census-population
Preston, D. R. (1991). Sorting out the variables in sociolinguistic theory.
American Speech, 66(1), 33-56.

168
Preston, D. R. (1996). Variationist perspectives on second language acquisition.
In: R. Bayley & D. R. Preston (Eds.), Second language acquisition and
linguistic variation (pp. 1-45). Amsterdam: John Benjamins.
Regala-Flores, E. (2014). Phonological features of Basilectal Philippine
English: An exploratory study. International Journal of English and
Literature, 5(6), 128-140.
Roh, T. R. D. (2010). A study of language attitudes through English accent
evaluations by Koreans in the Philippines. Master’s Thesis. Diliman,
Quezon City: University of the Philippines Diliman.
Ryan, E. B., & Giles, H. (Eds.). (1982). An integrative perspective for the study
of attitudes toward language variation. In: Attitudes towards language
variation: Social and applied contexts (pp. 1-19). London: Edward Arnold.
Sankoff, D. (1988). Variable rules. In: U. Ammon, N. Dittmar, & K. J. Matthier
(Eds.), Sociolinguistics: Vol. 2. An international handbook of the science of
language and society (pp. 984-997). Berlin: Mouton de Gruyter.
Schneider, E. W. (2003). The Dynamics of New Englishes: From Identity
Construction to Dialect Birth. Language, 79(2): 233-81.
Selinker, L. (1972). Interlanguage. International Review of Applied Linguistics,
10, 209-231.
Silva, D. J. (2006a). Variation in voice onset time for Korean stops: A case for
recent sound change. Korean Linguistics, 13, 1-16.
Silva, D. J. (2006b). Acoustic evidence for the emergence of tonal contrast in
contemporary Korean. Phonology, 23, 287-308.
Silva, D. J., Choi, Y., & Kim, J.-E. (2004). Diachronic shift in VOT values for
Korean stop consonants. Harvard Studies in Korean Linguistics, 10, 173–
185.
Sridhar, K. K., & Sridhar, S. N. (1986). Bridging the paradigm gap: second
language acquisition theory and indigenized varieties of English. World
Englishes, 5(1), 3-14.
Starr, R. (2011). Acquisition of sociolinguistic knowledge in a Mandarin-

169
English dual immersion school. PhD Dissertation. Stanford, CA: Stanford
University.
Strother, J. (2015, February 27). Koreans get more bang for buck learning
English in Philippines. The Wall Street Journal. Retrieved July 27, 2015
from http://blogs.wsj.com/korearealtime/2015/02/27/koreans-seek-more-
bang-for-their-bucklearning-english-in-the-philippines/
Tarone, E. (1979). Interlanguage as chameleon. Language Learning, 29(2),
181-91.
Tarone, E. (1982). Systematicity and attention in interlanguage. Language
Learning, 32(1).
Tarone, E. (1983). On the variability of interlanguage systems. Applied
Linguistics, 4(2), 142-164.
Tarone, E. (1989). On chameleons and monitors. In: M. R. Eisenstein (Ed.), The
dynamic interlanguage (pp. 3-15). New York & London: Plenum Press.
Tayao, M. L. G. (2004). The evolving study of Philippine English phonology.
World Englishes (Special Issue of Philippine English: Tensions and
Transitions), 23(1), 77-90.
Thomas, E. R. (2011). Sociophonetics: An introduction. New York: Palgrave
Macmillan.
Thompson, R. M. (2003). Filipino English and Taglish: language switching
from multiple perspectives. Amsterdam/Philadelphia: John Benjamins.
Traunmüller, H. (1990). Analytical expressions for the tonotopic sensory scale.
Journal of the Acoustical Society of America, 88, 97-100.
Tsimpli, I. M. (2006). Variation in Second Language Acquisition. In: E. K.
Brown (Ed.), Encyclopedia of language and linguistics (2nd ed.) (pp. 387-
394). Oxford: Elsevier.
Venables, W. N., & Smith, D. M. (2005). An introduction to R. R Development
Core Team.
Weinberger, S. (2015). Speech Accent Archive. George Mason University.
Retrieved from http://accent.gmu.edu

170
Wells, J. (1982). Accents of English. Cambridge: Cambridge University Press.
Winter, B. (2011). Pseudoreplication in phonetic research. In W.-S. Lee & E.
Zee (Eds.), Proceedings of the 17th International Congress of Phonetic
Sciences (pp. 2137-2140). Hong Kong: City University of Hong Kong.
Wright, J. (2007). Laryngeal contrast in Seoul Korean. PhD Dissertation.
Philadelphia, PA: University of Pennsylvania.
Xu, Y. (2007-2015). FormantPro.praat. Retrieved from
http://www.phon.ucl.ac.uk/home/yi/FormantPro/
Yeni-Komshian, G. H., Flege, J. E., & Liu, S. (2000). Pronunciation proficiency
in the first and second languages of Korean-English bilinguals.
Bilingualism: Language and Cognition, 3(2), 131-149.
Yusa, N., Nasukawa, K., Koizumi, M., Kim, J., Kimura, N., & Emura, K.
(2010). Unexpected effects of the second language on the first. In: K.
Dziubalska-Kołaczyk, M. Wrembel, & M. Kul (Eds.), New Sounds 2010:
Proceedings of the 6th International symposium on the acquisition of second
language speech (pp. 580-584). Poznań, Poland: Adam Mickiewicz
University.

171
APPENDIXES
Appendix 1. Language background questionnaire (LBQ) for Philippine-based Korean student participants 언어환경 설문지 Contact Information (연락처 정보)
Name(성함) _____________________
Email (이메일) ________________
Mobile No. (핸드폰번호)
_____________________
Today’s date (오늘 날짜) ________________
PART A 1. Sex (성별) _______ 2. Date of birth (생년월일) _______ (year 년) ________(month 월) ______(day 일) 3. Nationality (국적) _______________________ 4. Native Language (모국어) ________________ 5. Highest education attainment (최종학력):
Elementary school (초등학) ☐ Middle school (중학) ☐ High school (고등학) ☐ University (대학) ☐ Others (기타): _______________________________________
6. Please state your current address in Baguio City. (바기오 내 주소를 기입해 주세요) ____________________________________________________________________ 7. How long have you been living in the Philippines? ______ (years) ______(months) (필리핀에서 얼마 동안 사셨습니까?) (년) (개월) 8. List all the countries you have lived in for six months or more. Also indicate the duration (in number of years and months) of your stay in each country. (6개월 이상 거주했던 모든 도시를 기입해주세요. 각 나라에 거주했던 기간도 기입바랍니다.)
Duration (거주기간) Country (국가) Years (년) Months (개월)
_________________________ _______ _______ _________________________ _______ _______ _________________________ _______ _______
9a. Where is your family living right now? _________________________________ (현재 당신의 가족들은 어디에서 살고 있습니까?)
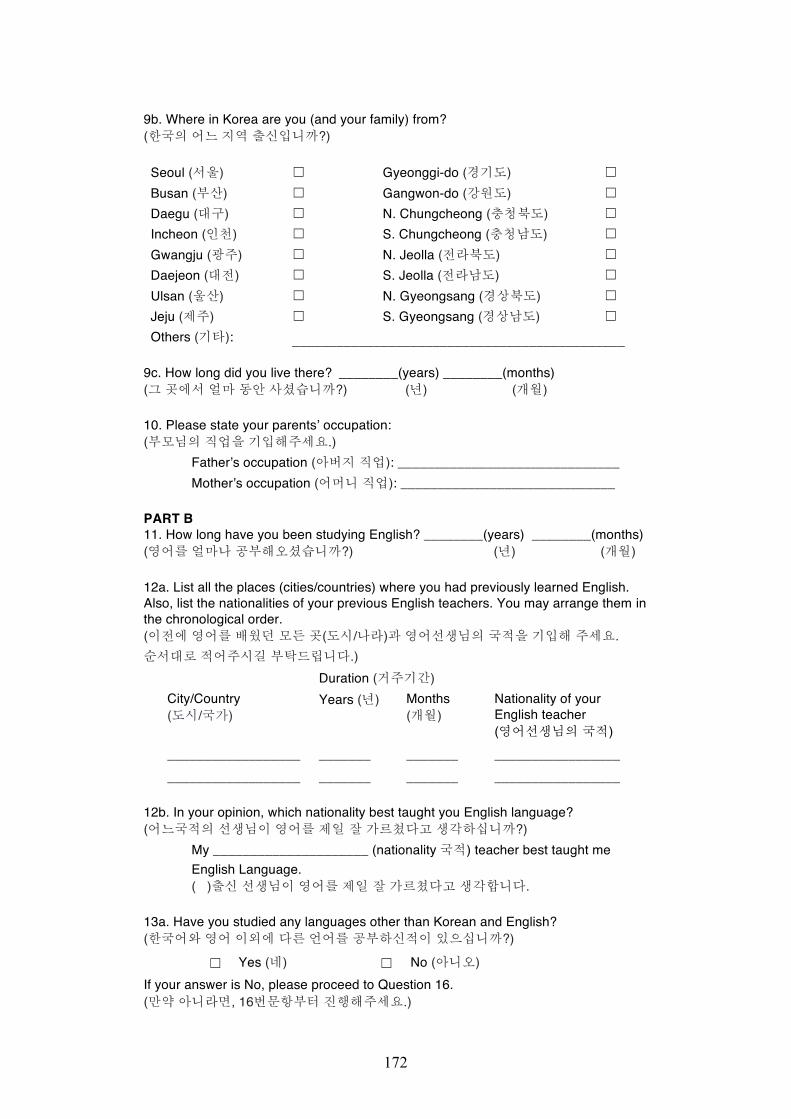
172
9b. Where in Korea are you (and your family) from? (한국의 어느 지역 출신입니까?) Seoul (서울) ☐ Gyeonggi-do (경기도) ☐ Busan (부산) ☐ Gangwon-do (강원도) ☐ Daegu (대구) ☐ N. Chungcheong (충청북도) ☐ Incheon (인천) ☐ S. Chungcheong (충청남도) ☐ Gwangju (광주) ☐ N. Jeolla (전라북도) ☐ Daejeon (대전) ☐ S. Jeolla (전라남도) ☐ Ulsan (울산) ☐ N. Gyeongsang (경상북도) ☐ Jeju (제주) ☐ S. Gyeongsang (경상남도) ☐ Others (기타): _____________________________________________
9c. How long did you live there? ________(years) ________(months) (그 곳에서 얼마 동안 사셨습니까?) (년) (개월) 10. Please state your parents’ occupation: (부모님의 직업을 기입해주세요.) Father’s occupation (아버지 직업): ______________________________
Mother’s occupation (어머니 직업): _____________________________ PART B 11. How long have you been studying English? ________(years) ________(months) (영어를 얼마나 공부해오셨습니까?) (년) (개월) 12a. List all the places (cities/countries) where you had previously learned English. Also, list the nationalities of your previous English teachers. You may arrange them in the chronological order. (이전에 영어를 배웠던 모든 곳(도시/나라)과 영어선생님의 국적을 기입해 주세요. 순서대로 적어주시길 부탁드립니다.)
Duration (거주기간) City/Country (도시/국가)
Years (년) Months (개월)
Nationality of your English teacher (영어선생님의 국적)
__________________ _______ _______ _________________ __________________ _______ _______ _________________
12b. In your opinion, which nationality best taught you English language? (어느국적의 선생님이 영어를 제일 잘 가르쳤다고 생각하십니까?)
My _____________________ (nationality 국적) teacher best taught me English Language.
( )출신 선생님이 영어를 제일 잘 가르쳤다고 생각합니다. 13a. Have you studied any languages other than Korean and English? (한국어와 영어 이외에 다른 언어를 공부하신적이 있으십니까?)
☐ Yes (네) ☐ No (아니오) If your answer is No, please proceed to Question 16. (만약 아니라면, 16번문항부터 진행해주세요.)

173
13b. Please list the other languages you have studied and rate your language ability for each. (당신이 할 수 있는 다른외국어의 종류와 능력정도를 기입하여 주시기 바랍니다.)
Language (언어)
Poor (부족함)
Average (보통)
Good (잘함)
Very Good (매우 잘함)
1. _________ ☐ ☐ ☐ ☐ 2. _________ ☐ ☐ ☐ ☐
14. How have you been learning English up to this point?
(지금의 수준까지 영어를 배우기까지 어떻게 영어를 배우셨습니까?) 15a. Please rate your English Language skills: (당신의 영어능력 정도를 표기해 주세요) Skill (능력)
Poor (부족함)
Average (보통)
Good (잘함)
Very Good (매우 잘함)
1. Reading (읽기) ☐ ☐ ☐ ☐ 2. Writing (쓰기) ☐ ☐ ☐ ☐ 3. Speaking (말하기) ☐ ☐ ☐ ☐ 4. Listening (듣기) ☐ ☐ ☐ ☐
15b. What do you think is the most important skill that you want to develop? You may rank the choices below, 1 – highest; 4 – lowest.
Always (항상)
Most of the time (대부분)
Sometimes (가끔)
Never (전혀)
Formal classroom instruction (정규 학교 수업) ☐ ☐ ☐ ☐
Learning independently using textbooks/educational materials (교과서와 교육자료로 개인적으로 공부함)
☐ ☐ ☐ ☐
Interacting with my family (부모님과 함께) ☐ ☐ ☐ ☐
Interacting with my Korean friends (한국 친구와 함께) ☐ ☐ ☐ ☐
Interacting with my Filipino friends (필리핀 친구와 함께) ☐ ☐ ☐ ☐
Through the Internet: (인터넷을 통해)
SNS (Kakao Talk, Facebook, Naver, etc.) (SNS (카카오톡, 페이스북, 네이버 등)
☐ ☐ ☐ ☐
Reading websites written in English (영어로 쓰여진 웹사이트를 읽으며) ☐ ☐ ☐ ☐
Through online English learning websites (온라인 인터넷 강의를 통해)
☐ ☐ ☐ ☐

174
(어떠한 능력을 개발하는데 가장 중요하다고 생각하십니까? 1위부터 4위까지 숫자로 표기해 주세요)
Reading (읽기) ______ Writing (쓰기) ______ Speaking (말하기) ______ Listening (듣기) ______
16a. Please rate your Korean Language skills: (당신의 한국어구사 능력을 표기해 주세요)
Skill (능력)
Poor (부족함)
Average (보통)
Good (잘함)
Very Good (매우 잘함)
1. Reading (읽기) ☐ ☐ ☐ ☐ 2. Writing (쓰기) ☐ ☐ ☐ ☐ 3. Speaking (말하기) ☐ ☐ ☐ ☐ 4. Listening (듣기) ☐ ☐ ☐ ☐
16b. Do you think your Korean accent is good? (당신의 한국어 억양은 좋다고 생각하십니까?)
Poor (부족함)
Average (보통)
Good (잘함)
Very Good (매우 잘함)
☐ ☐ ☐ ☐ 17a. Do you think you have a Korean accent in your English? If so, please rate the strength of your accent according to the following scale: (당신의 한국어 억양이 영어를 말할 때 반영된다고 생각하십니까? 만약 그렇다면 얼마나 많이 반영이 된다고 생각하는지 표기해 주시기 바랍니다.)
No accent (한국어억양 없음)
Very Little (거의 없음)
A Little (조금)
Intermediate (중간)
Heavy (많이)
Very Heavy (아주 많이)
☐ ☐ ☐ ☐ ☐ ☐ 17b. Do you think you have a Filipino accent in your English? If so, please rate the strength of your accent according to the following scale: (필리핀 발음 억양이 영어를 말할 때 반영되있다고 생각하십니까? 만약 그렇다면 얼마나 많이 반영이 되었다고 생각하는지 표기해 주시기 바랍니다.)
No accent (한국어억양 없음)
Very Little (거의 없음)
A Little (조금)
Intermediate (중간)
Heavy (많이)
Very Heavy (아주 많이)
☐ ☐ ☐ ☐ ☐ ☐ 18. What are your reasons for studying English? Please check the appropriate response. (영어를 공부하는 목적이 무엇입니까? 적절한 답변을 체크해 주시기 바랍니다.)
Strongly disagree
(절대 동의하지 않음)
Disagree (동의하지 않음)
Agree (동의함)
Strongly agree (매우 공감)
I need English to speak with anybody from anywhere in the world. ☐ ☐ ☐ ☐

175
(나는 세계각지의 여러 사람과 이야기하기 위해 영어공부를 한다.) I need English to get high grades in school. (나는 학교에서 좋은 성적을 받기 위해 영어공부를 한다.)
☐ ☐ ☐ ☐
I need English to enter a good school and to get a better job. (나는 좋은 학교에 들어가고 좋은 직업을 갖기 위해 영어공부를 한다.)
☐ ☐ ☐ ☐
I need English because I enjoy talking to foreign friends. (나는 외국인 친구들과 대화하는 것을 좋아해서 영어공부를 한다.)
☐ ☐ ☐ ☐
I don’t know why I need English. (나는 영어가 왜 필요한지 모르겠다.) ☐ ☐ ☐ ☐
Other reasons? (기타 이유) _________________________________ 19. What are your reasons for studying in Baguio? Please check the appropriate response. (바기오에서 공부하는 이유가 무엇입니까? 적절한 답변을 체크해 주시기 바랍니다.)
Strongly disagree
(절대 동의하지 않음)
Disagree (동의하지 않음)
Agree (동의함)
Strongly agree (매우 공감)
The schools are good in Baguio. 여기의 학교가 좋아서 ☐ ☐ ☐ ☐
It is a good escape from Manila and other busy cities/towns in the country. 마닐라나 다른 복잡한도시/마을에서 멀기 때문에
☐ ☐ ☐ ☐
The cost of living here is low. 물가가 낮아서 ☐ ☐ ☐ ☐
The cool climate is ideal for studying. 시원한 기후가 공부하기에 이상적이라서
☐ ☐ ☐ ☐
The people are nice and friendly. 사람들이 친절하고 친근감있어서 ☐ ☐ ☐ ☐
Other reasons? (기타 이유) _________________________________ 20. If there is anything else that you feel is interesting or important about your language background or language use, please comment below. (당신의 언어환경과 언어사용에 있어서 흥미있는 점이나 중요하다고 생각하는 점이 있다면, 아래에 답변에 주시기 바랍니다.)

176
PART C 21. Do you have additional questions that you feel are not included above? If yes, please write down your questions and answers on separate sheets. (위에 포함되지 않은 추가적인 문항이 있으십니까? 만약 그렇다면 당신의 질문과 답을 따로 나눠드린 시트에 적어주시기 바랍니다.)

177
Appendix 2. Language background questionnaire (LBQ) for Filipino student participants Contact Information: Name: ________________________ Email: _____________________ Mobile No.: ________________________ Today’s
date: _____________________
Please answer the following questions to the best of your knowledge. PART A 1. Sex: _______ 2. Date of birth: _______ (year) __________(month) ______(day) 3. Nationality: _______________________ 4. Native Language: _________________ 5. Highest education attainment:
Elementary school ☐ Middle school ☐ High school ☐ University ☐ Others, please specify: _______________________________________
6. Please state your current address in Baguio City. ____________________________________________________________________ 7. Have you ever lived abroad?
☐ Yes ☐ No If your answer is No, please proceed to Question 9. 8. List all the countries you have lived in for six months or more. Also, indicate the duration (in number of years and months) of your stay in each country.
Length of stay Country Years Months
_________________________ _______ _______ _________________________ _______ _______ _________________________ _______ _______
9a. Where is your family living right now? _________________________________ 9b. Where in the Philippines are you (and your family) from? Region I ☐ Region VIX ☐ Region II ☐ Region X ☐ Region III ☐ Region XI ☐ Region IV-A ☐ Region XII ☐ Region IV-B ☐ NCR ☐ Region V ☐ CAR ☐ Region VI ☐ CARAGA ☐ Region VII ☐ ARMM ☐

178
Region VIII ☐ Others: ____________________________ 9c. How long did you live there? ________(years) ________(months) 10. Please state your parents’ occupation: Father’s occupation: ____________________
Mother’s occupation: ____________________ PART B 11. How long have you been studying English? ________(years) ________(months) 12. List all the places (cities/countries) where you had previously learned English. Also, list the nationalities of your previous English teachers. You may arrange them in the chronological order.
Length of study
City/Country Years Months Nationality of your English teacher
____________________ _______ _______ __________________ ____________________ _______ _______ __________________
13a. Have you studied / Do you speak any languages other than English and Filipino?
☐ Yes ☐ No If your answer is No, please proceed to Question 14. 13b. Please list the other languages you have studied and then rate your language ability for each.
Language Poor Average Good Very Good 1. ☐ ☐ ☐ ☐ 2. ☐ ☐ ☐ ☐ 3. ☐ ☐ ☐ ☐
14. Please rate your English Language skills:
Skill Poor Average Good Very Good 1. Reading ☐ ☐ ☐ ☐ 2. Writing ☐ ☐ ☐ ☐ 3. Speaking ☐ ☐ ☐ ☐ 4. Listening ☐ ☐ ☐ ☐
15. What do you think is the most important skill that you want to develop? You may rank the choices below, 1 – highest; 4 – lowest. Reading ______ Writing ______
Speaking ______ Listening ______ 16a. Do you think you have a Filipino accent in your English? If so, please rate the strength of your accent according to the following scale:
No accent Very Little A Little Intermediate Heavy Very Heavy
☐ ☐ ☐ ☐ ☐ ☐

179
16b. Do you think you have an American accent in your English? If so, please rate the strength of your accent according to the following scale:
No accent Very Little A Little Intermediate Heavy Very Heavy
☐ ☐ ☐ ☐ ☐ ☐ 17. How have you been learning/practising English up to this point?
18. What are your reasons for studying in Baguio? Please check the appropriate response.
Strongly disagree Disagree Agree Strongly
agree The schools are good in Baguio. ☐ ☐ ☐ ☐ It is a good escape from Manila and other busy cities/towns in the country.
☐ ☐ ☐ ☐
The cost of living here is low. ☐ ☐ ☐ ☐
The cool climate is ideal for studying. ☐ ☐ ☐ ☐
The people are nice and friendly. ☐ ☐ ☐ ☐
Other reasons? _________________________________ 19. If there is anything else that you feel is interesting or important about your language background or language use, please comment below. PART C 20. Do you have additional questions that you feel are not included above? If yes, please write down your questions and answers on separate sheets.
Always Most of the time Sometimes Never
Formal classroom instruction ☐ ☐ ☐ ☐ Learning independently using textbooks/educational materials
☐ ☐ ☐ ☐
Interacting with my family ☐ ☐ ☐ ☐ Interacting with my Korean friends ☐ ☐ ☐ ☐
Interacting with my Filipino friends ☐ ☐ ☐ ☐
Through the Internet: Social networking (Facebook, Twitter, etc.) ☐ ☐ ☐ ☐
Reading websites written in English ☐ ☐ ☐ ☐
Through online English learning websites ☐ ☐ ☐ ☐

180
Appendix 3. Language background questionnaire (LBQ) for Singapore-based Korean participants 언어환경 설문지 Contact Information (연락처 정보)
Name(성함) ____________________ Email (이메일) __________________
Mobile No. (핸드폰번호) ____________________
Today’s date (오늘 날짜)
__________________
PART A 1. Sex (성별) _______ 2. Date of birth (생년월일) _______ (year 년) __________(month 월) ______(day 일) 3. Nationality (국적) _______________________ 4. Native Language (모국어) ________________ 5. Highest education attainment (최종학력):
Elementary school (초등학) ☐ Middle school (중학) ☐ High school (고등학) ☐ University (대학) ☐ Others (기타): _______________________________________
6. Please state your current address in Singapore. (싱가포르 내 주소를 기입해 주세요) ____________________________________________________________________ 7. How long have you been living in Singapore? _______ (years) _______ (months) (싱가포르에서 얼마 동안 사셨습니까?) (년) (개월) 8. List all the countries you have lived in for six months or more. Also indicate the duration (in number of years and months) of your stay in each country. (6개월 이상 거주했던 모든 도시를 기입해주세요. 각 나라에 거주했던 기간도 기입바랍니다.)
Duration (거주기간) Country (국가) Years (년) Months (개월)
_________________________ _______ _______ _________________________ _______ _______
9a. Where is your family living right now? _________________________________ (현재 당신의 가족들은 어디에서 살고 있습니까?) 9b. Where in Korea are you (and your family) from? (한국의 어느 지역 출신입니까?) Seoul (서울) ☐ Gyeonggi-do (경기도) ☐

181
Busan (부산) ☐ Gangwon-do (강원도) ☐ Daegu (대구) ☐ N. Chungcheong (충청북도) ☐ Incheon (인천) ☐ S. Chungcheong (충청남도) ☐ Gwangju (광주) ☐ N. Jeolla (전라북도) ☐ Daejeon (대전) ☐ S. Jeolla (전라남도) ☐ Ulsan (울산) ☐ N. Gyeongsang (경상북도) ☐ Jeju (제주) ☐ S. Gyeongsang (경상남도) ☐ Others (기타): _____________________________________________
9c. How long did you live there? ________(years) ________(months) (그 곳에서 얼마 동안 사셨습니까?) (년) (개월) 10. Please state your parents’ occupation: (부모님의 직업을 기입해주세요.) Father’s occupation (아버지 직업): _____________________________
Mother’s occupation (어머니 직업): _____________________________ PART B 11. How long have you been studying English? ________(years) ________(months) (영어를 얼마나 공부해오셨습니까?) (년) (개월) 12a. List all the places (cities/countries) where you had previously learned English. Also, list the nationalities of your previous English teachers. You may arrange them in the chronological order. (이전에 영어를 배웠던 모든 곳(도시/나라)과 영어선생님의 국적을 기입해 주세요. 순서대로 적어주시길 부탁드립니다.)
Duration (거주기간) City/Country (도시/국가)
Years (년) Months (개월)
Nationality of your English teacher
(영어선생님의 국적) __________________ _______ _______ ________________ __________________ _______ _______ ________________ __________________ _______ _______ ________________
12b. In your opinion, which nationality best taught you English language? (어느국적의 선생님이 영어를 제일 잘 가르쳤다고 생각하십니까?)
My _____________________ (nationality 국적) teacher best taught me English Language.
( )출신 선생님이 영어를 제일 잘 가르쳤다고 생각합니다. 13a. Have you studied any languages other than Korean and English? (한국어와 영어 이외에 다른 언어를 공부하신적이 있으십니까?)
☐ Yes (네) ☐ No (아니오) If your answer is No, please proceed to Question 16. (만약 아니라면, 16번문항부터 진행해주세요.) 13b. Please list the other languages you have studied and rate your language ability for each. (당신이 할 수 있는 다른외국어의 종류와 능력정도를 기입하여 주시기 바랍니다.)
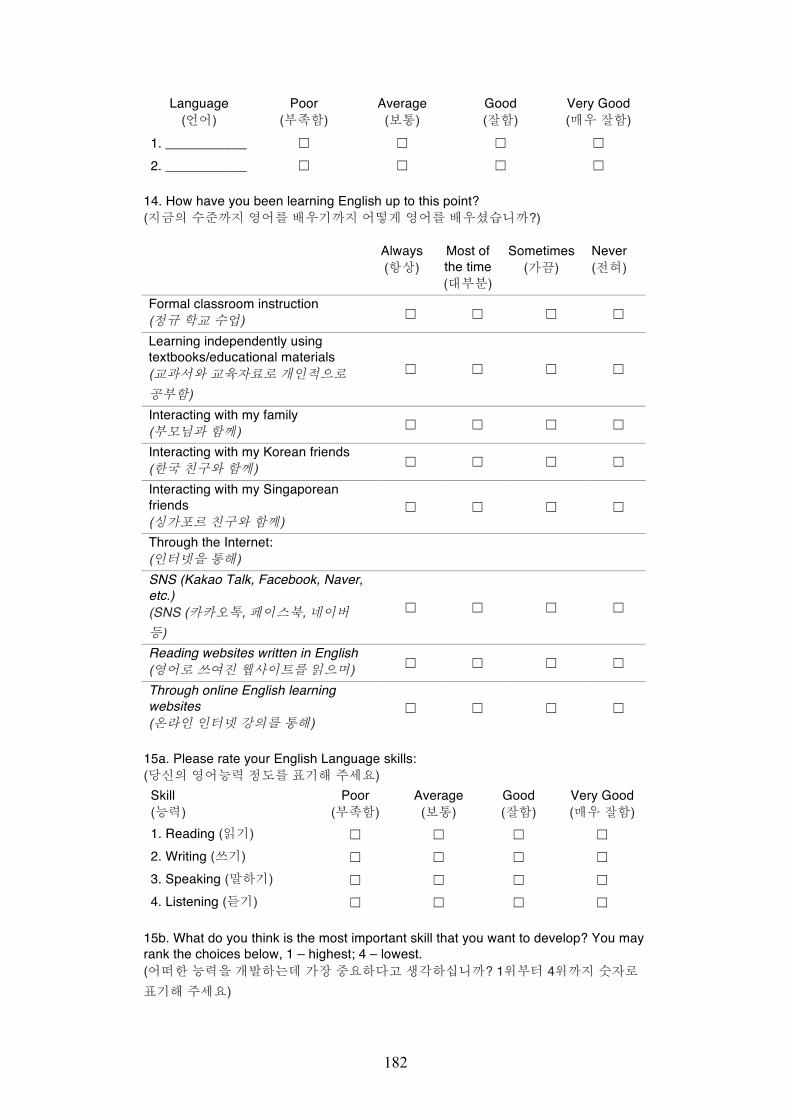
182
Language (언어)
Poor (부족함)
Average (보통)
Good (잘함)
Very Good (매우 잘함)
1. ___________ ☐ ☐ ☐ ☐ 2. ___________ ☐ ☐ ☐ ☐
14. How have you been learning English up to this point? (지금의 수준까지 영어를 배우기까지 어떻게 영어를 배우셨습니까?)
15a. Please rate your English Language skills: (당신의 영어능력 정도를 표기해 주세요) Skill (능력)
Poor (부족함)
Average (보통)
Good (잘함)
Very Good (매우 잘함)
1. Reading (읽기) ☐ ☐ ☐ ☐ 2. Writing (쓰기) ☐ ☐ ☐ ☐ 3. Speaking (말하기) ☐ ☐ ☐ ☐ 4. Listening (듣기) ☐ ☐ ☐ ☐
15b. What do you think is the most important skill that you want to develop? You may rank the choices below, 1 – highest; 4 – lowest. (어떠한 능력을 개발하는데 가장 중요하다고 생각하십니까? 1위부터 4위까지 숫자로 표기해 주세요)
Always (항상)
Most of the time (대부분)
Sometimes (가끔)
Never (전혀)
Formal classroom instruction (정규 학교 수업) ☐ ☐ ☐ ☐
Learning independently using textbooks/educational materials (교과서와 교육자료로 개인적으로 공부함)
☐ ☐ ☐ ☐
Interacting with my family (부모님과 함께) ☐ ☐ ☐ ☐
Interacting with my Korean friends (한국 친구와 함께) ☐ ☐ ☐ ☐
Interacting with my Singaporean friends (싱가포르 친구와 함께)
☐ ☐ ☐ ☐
Through the Internet: (인터넷을 통해)
SNS (Kakao Talk, Facebook, Naver, etc.) (SNS (카카오톡, 페이스북, 네이버 등)
☐ ☐ ☐ ☐
Reading websites written in English (영어로 쓰여진 웹사이트를 읽으며) ☐ ☐ ☐ ☐
Through online English learning websites (온라인 인터넷 강의를 통해)
☐ ☐ ☐ ☐

183
Reading (읽기) ______ Writing (쓰기) ______ Speaking (말하기) ______ Listening (듣기) ______
16a. Please rate your Korean Language skills: (당신의 한국어구사 능력을 표기해 주세요) Skill (능력)
Poor (부족함)
Average (보통)
Good (잘함)
Very Good (매우 잘함)
1. Reading (읽기) ☐ ☐ ☐ ☐ 2. Writing (쓰기) ☐ ☐ ☐ ☐ 3. Speaking (말하기) ☐ ☐ ☐ ☐ 4. Listening (듣기) ☐ ☐ ☐ ☐
16b. Do you think your Korean accent is good? (당신의 한국어 억양은 좋다고 생각하십니까?)
Poor (부족함)
Average (보통)
Good (잘함)
Very Good (매우 잘함)
☐ ☐ ☐ ☐ 17a. Do you think you have a Korean accent in your English? If so, please rate the strength of your accent according to the following scale: (당신의 한국어 억양이 영어를 말할 때 반영된다고 생각하십니까? 만약 그렇다면 얼마나 많이 반영이 된다고 생각하는지 표기해 주시기 바랍니다.)
No accent (한국어억양 없음)
Very Little (거의 없음)
A Little (조금)
Intermediate (중간)
Heavy (많이)
Very Heavy (아주 많이)
☐ ☐ ☐ ☐ ☐ ☐ 17b. Do you think you have a Singaporean accent in your English? If so, please rate the strength of your accent according to the following scale: (싱가포르 발음 억양이 영어를 말할 때 반영되있다고 생각하십니까? 만약 그렇다면 얼마나 많이 반영이 되었다고 생각하는지 표기해 주시기 바랍니다.)
No accent (한국어억양 없음)
Very Little (거의 없음)
A Little (조금)
Intermediate (중간)
Heavy (많이)
Very Heavy (아주 많이)
☐ ☐ ☐ ☐ ☐ ☐ 18. What are your reasons for studying English? Please check the appropriate response. (영어를 공부하는 목적이 무엇입니까? 적절한 답변을 체크해 주시기 바랍니다.)
Strongly disagree
(절대 동의하지 않음)
Disagree (동의하지 않음)
Agree (동의함)
Strongly agree (매우 공감)
I need English to speak with anybody from anywhere in the world. (나는 세계각지의 여러 사람과 이야기하기 위해 영어공부를 한다.)
☐ ☐ ☐ ☐

184
I need English to get high grades in school. (나는 학교에서 좋은 성적을 받기 위해 영어공부를 한다.)
☐ ☐ ☐ ☐
I need English to enter a good school and to get a better job. (나는 좋은 학교에 들어가고 좋은 직업을 갖기 위해 영어공부를 한다.)
☐ ☐ ☐ ☐
I need English because I enjoy talking to foreign friends. (나는 외국인 친구들과 대화하는 것을 좋아해서 영어공부를 한다.)
☐ ☐ ☐ ☐
I don’t know why I need English. (나는 영어가 왜 필요한지 모르겠다.) ☐ ☐ ☐ ☐
Other reasons? (기타 이유) _________________________________ 19. What are your reasons for studying in Singapore? Please check the appropriate response. (싱가포르에서 공부하는 이유가 무엇입니까? 적절한 답변을 체크해 주시기 바랍니다.)
Strongly disagree
(절대 동의하지 않음)
Disagree (동의하지 않음)
Agree (동의함)
Strongly agree (매우 공감)
The schools are good in Singapore. 싱가포르에 서학교가 좋아서 ☐ ☐ ☐ ☐
It is a good escape from Korea/other cities. 대한민국나 다른 복잡한도시/마을에서 멀기 때문에
☐ ☐ ☐ ☐
The cost of living here is low. 물가가 낮아서 ☐ ☐ ☐ ☐
The weather is nice. 날씨가 좋은 ☐ ☐ ☐ ☐
The people are nice and friendly. 사람들이 친절하고 친근감있어서 ☐ ☐ ☐ ☐
Other reasons? (기타 이유) _________________________________ 20. If there is anything else that you feel is interesting or important about your language background or language use, please comment below. (당신의 언어환경과 언어사용에 있어서 흥미있는 점이나 중요하다고 생각하는 점이 있다면, 아래에 답변에 주시기 바랍니다.) PART C 21. Do you have additional questions that you feel are not included above? If yes, please write down your questions and answers on separate sheets. (위에 포함되지 않은 추가적인 문항이 있으십니까? 만약 그렇다면 당신의 질문과 답을 따로 나눠드린 시트에 적어주시기 바랍니다.)

185

186

187

188