speech perception the speech chain - ucsb speech...– speech coding – speech recognition • try...
TRANSCRIPT
1
Digital Speech ProcessingDigital Speech Processing——Lecture 4Lecture 4
1
Speech PerceptionSpeech Perception--Auditory Models, Sound Auditory Models, Sound Perception Models, MOS Perception Models, MOS
MethodsMethods
Topics to be CoveredTopics to be Covered• Range of human hearing• Auditory mechanisms—the human ear and how
it converts sound to auditory representations• The Ensemble Interval Histogram (EIH) model of
2
The Ensemble Interval Histogram (EIH) model of hearing
• Speech perception and what we know about physical and psychophysical measures of sound
• Auditory masking• Sound and word perception in noise
Speech PerceptionSpeech Perception• understanding how we hear sounds and how
we perceive speech leads to better design and implementation of robust and efficient systems for analyzing and representing speech
• the better we understand signal processing in the human auditory system the better we can
3
the human auditory system, the better we can (at least in theory) design practical speech processing systems– speech coding– speech recognition
• try to understand speech perception by looking at the physiological models of hearing
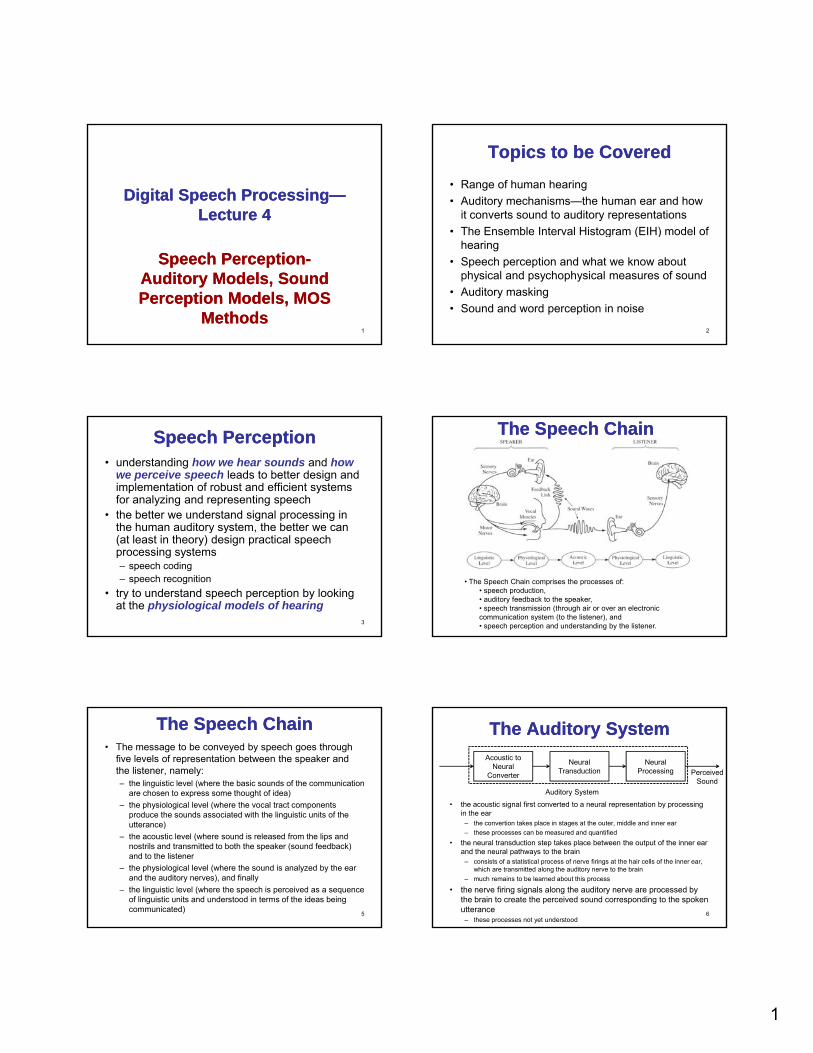
The Speech ChainThe Speech Chain
• The Speech Chain comprises the processes of:• speech production, • auditory feedback to the speaker, • speech transmission (through air or over an electronic communication system (to the listener), and • speech perception and understanding by the listener.
The Speech ChainThe Speech Chain• The message to be conveyed by speech goes through
five levels of representation between the speaker and the listener, namely:– the linguistic level (where the basic sounds of the communication
are chosen to express some thought of idea)– the physiological level (where the vocal tract components
produce the sounds associated with the linguistic units of the p gutterance)
– the acoustic level (where sound is released from the lips and nostrils and transmitted to both the speaker (sound feedback) and to the listener
– the physiological level (where the sound is analyzed by the ear and the auditory nerves), and finally
– the linguistic level (where the speech is perceived as a sequence of linguistic units and understood in terms of the ideas being communicated)
5
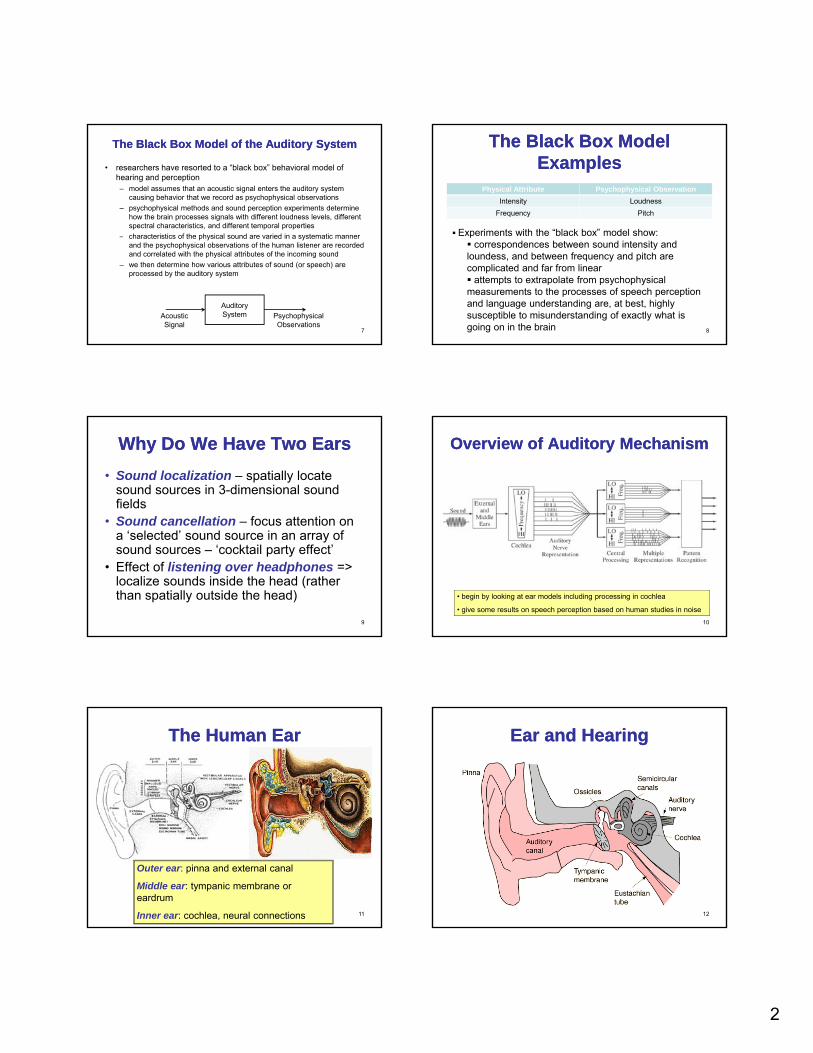
The Auditory SystemThe Auditory System
• the acoustic signal first converted to a neural representation by processing in the ear
Acoustic to Neural
Converter
Neural Transduction
Neural Processing Perceived
SoundAuditory System
– the convertion takes place in stages at the outer, middle and inner ear– these processes can be measured and quantified
• the neural transduction step takes place between the output of the inner ear and the neural pathways to the brain
– consists of a statistical process of nerve firings at the hair cells of the inner ear, which are transmitted along the auditory nerve to the brain
– much remains to be learned about this process
• the nerve firing signals along the auditory nerve are processed by the brain to create the perceived sound corresponding to the spoken utterance
– these processes not yet understood6
2
The Black Box Model of the Auditory SystemThe Black Box Model of the Auditory System
• researchers have resorted to a “black box” behavioral model of hearing and perception– model assumes that an acoustic signal enters the auditory system
causing behavior that we record as psychophysical observations– psychophysical methods and sound perception experiments determine
how the brain processes signals with different loudness levels, different spectral characteristics, and different temporal propertiesh t i ti f th h i l d i d i t ti– characteristics of the physical sound are varied in a systematic manner
and the psychophysical observations of the human listener are recorded and correlated with the physical attributes of the incoming sound
– we then determine how various attributes of sound (or speech) are processed by the auditory system
7
Auditory SystemAcoustic
SignalPsychophysical Observations
The Black Box Model The Black Box Model ExamplesExamples
Physical Attribute Psychophysical ObservationIntensity Loudness
Frequency Pitch
Experiments with the “black box” model show:
8
Experiments with the black box model show:correspondences between sound intensity and
loundess, and between frequency and pitch are complicated and far from linear
attempts to extrapolate from psychophysical measurements to the processes of speech perception and language understanding are, at best, highly susceptible to misunderstanding of exactly what is going on in the brain
Why Do We Have Two EarsWhy Do We Have Two Ears• Sound localization – spatially locate
sound sources in 3-dimensional sound fields
• Sound cancellation – focus attention on
9
a ‘selected’ sound source in an array of sound sources – ‘cocktail party effect’
• Effect of listening over headphones => localize sounds inside the head (rather than spatially outside the head)
Overview of Auditory MechanismOverview of Auditory Mechanism
10
• begin by looking at ear models including processing in cochlea
• give some results on speech perception based on human studies in noise
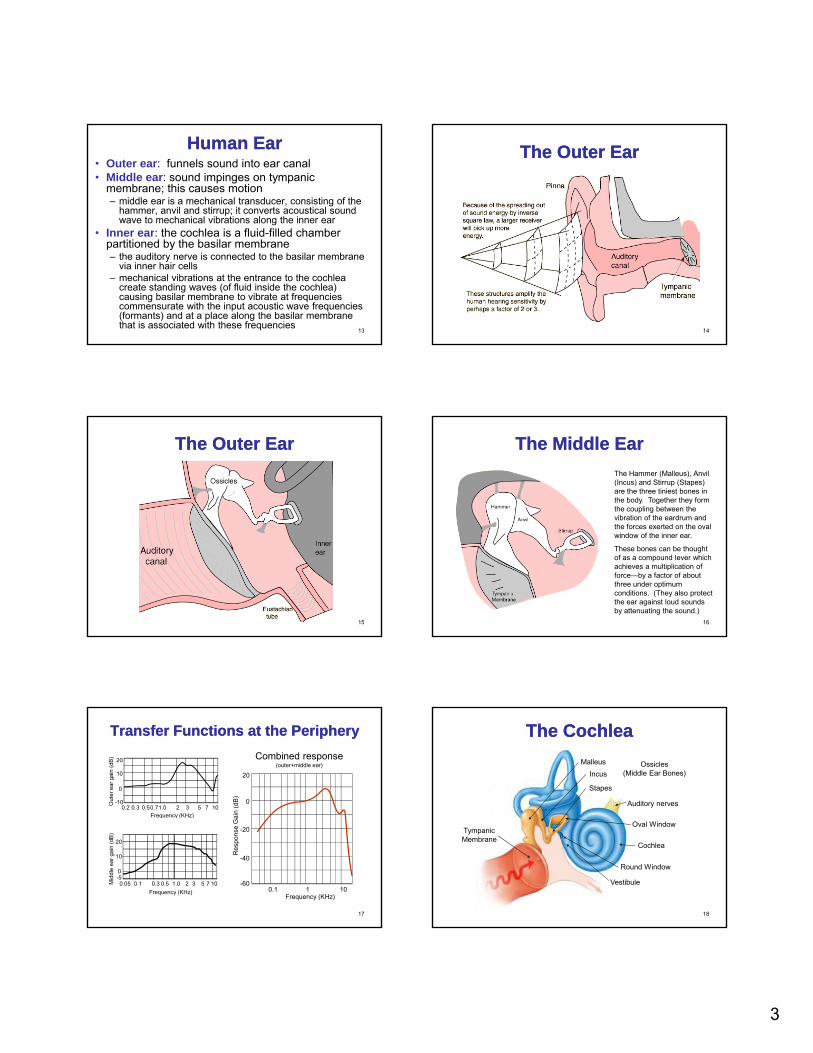
The Human EarThe Human Ear
11
Outer ear: pinna and external canal
Middle ear: tympanic membrane or eardrum
Inner ear: cochlea, neural connections
Ear and HearingEar and Hearing
12
3
Human EarHuman Ear• Outer ear: funnels sound into ear canal• Middle ear: sound impinges on tympanic
membrane; this causes motion– middle ear is a mechanical transducer, consisting of the
hammer, anvil and stirrup; it converts acoustical sound wave to mechanical vibrations along the inner ear
• Inner ear: the cochlea is a fluid-filled chamber
13
Inner ear: the cochlea is a fluid filled chamber partitioned by the basilar membrane– the auditory nerve is connected to the basilar membrane
via inner hair cells– mechanical vibrations at the entrance to the cochlea
create standing waves (of fluid inside the cochlea) causing basilar membrane to vibrate at frequencies commensurate with the input acoustic wave frequencies (formants) and at a place along the basilar membrane that is associated with these frequencies
The Outer EarThe Outer Ear
14
The Outer EarThe Outer Ear
15
The Middle EarThe Middle EarThe Hammer (Malleus), Anvil (Incus) and Stirrup (Stapes) are the three tiniest bones in the body. Together they form the coupling between the vibration of the eardrum and the forces exerted on the oval
16
the forces exerted on the oval window of the inner ear.
These bones can be thought of as a compound lever which achieves a multiplication of force—by a factor of about three under optimum conditions. (They also protect the ear against loud sounds by attenuating the sound.)
Out
er e
ar g
ain
(dB
)
0.2 0.3 0.5 1.00.7 2 3 5 107Frequency (KHz)
20
10
0
-10
Transfer Functions at the PeripheryTransfer Functions at the Periphery
20
0
ain
(dB
)
Combined response(outer+middle ear)
17
q y ( )
Mid
dle
ear g
ain
(dB
)
0.1 0.3 0.5 1.00.05 2 3 5 107Frequency (KHz)
20
10
0-5
-20
-40
-600.1 1 10
Frequency (KHz)
Res
pons
e G
a
The CochleaThe CochleaMalleus
Incus
Stapes
Ossicles(Middle Ear Bones)
Auditory nerves
18
Oval Window
Vestibule
TympanicMembrane
Round Window
Cochlea
4
The Inner EarThe Inner EarThe inner ear can be thought of as two organs, namely the semicircular canals which serve as the body’s balance organ and the cochlea which serves as the body’s
i h ti
19
microphone, converting sound pressure signals from the outer ear into electrical impulses which are passed on to the brain via the auditory nerve.
The Auditory NerveThe Auditory Nerve
20
Taking electrical impulses from the cochlea and the semicircular canals, the auditory nerve makes connections with both auditory areas of the brain.
Cochlear Filters(Implicit)
Vestibular System
Oval Window
Perilymph
MalleusIncus Stapes
Middle Ear Cavity
Middle and Inner EarMiddle and Inner Ear
21
Auditory Nerves
IHC IHCInner
Hair Cells
BasilarMembrane
RoundWindow
Eustachian Tube
Tympanic Membrance
Expanded view of middle and inner ear mechanics
• cochlea is 2 ½ turns of a snail-like shape
• cochlea is shown in linear format
Schematic Representation of the Schematic Representation of the EarEar
22
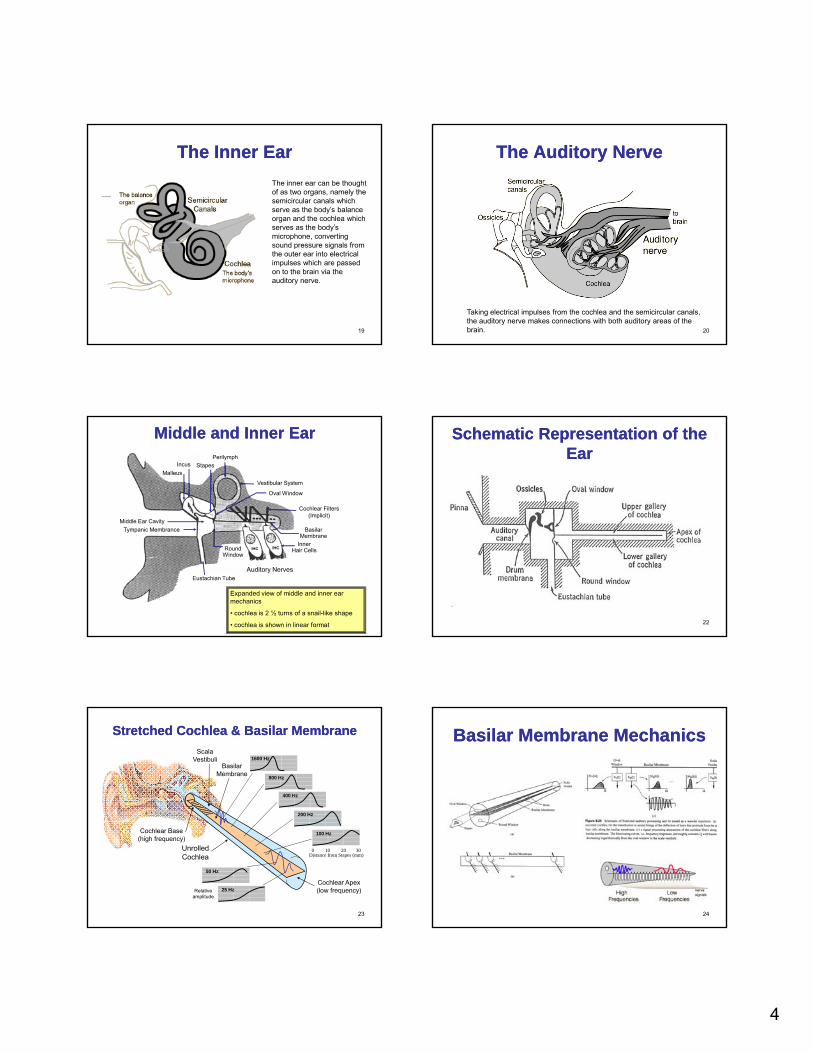
Stretched Cochlea & Basilar MembraneStretched Cochlea & Basilar Membrane
1600 Hz
800 Hz
400 Hz
200 Hz
BasilarMembrane
ScalaVestibuli
23
100 Hz
50 Hz
25 Hz
0 10 20 30Distance from Stapes (mm)
Cochlear Apex(low frequency)
Cochlear Base(high frequency)
UnrolledCochlea
Relative amplitude
Basilar Membrane MechanicsBasilar Membrane Mechanics
24
5
Basilar Membrane MechanicsBasilar Membrane Mechanics• characterized by a set of frequency responses at different points
along the membrane• mechanical realization of a bank of filters• filters are roughly constant Q (center frequency/bandwidth) with
logarithmically decreasing bandwidth• distributed along the Basilar Membrane is a set of sensors called
Inner Hair Cells (IHC) which act as mechanical motion-to-neural
25
Inner Hair Cells (IHC) which act as mechanical motion to neural activity converters
• mechanical motion along the BM is sensed by local IHC causing firing activity at nerve fibers that innervate bottom of each IHC
• each IHC connected to about 10 nerve fibers, each of different diameter => thin fibers fire at high motion levels, thick fibers fire at lower motion levels
• 30,000 nerve fibers link IHC to auditory nerve• electrical pulses run along auditory nerve, ultimately reach higher
levels of auditory processing in brain, perceived as sound
Basilar Membrane MotionBasilar Membrane Motion• the ear is excited by the input
acoustic wave which has the spectral properties of the speech being produced– different regions of the BM respond
maximally to different input frequencies => frequency tuning occurs along BM
26
occurs along BM– the BM acts like a bank of non-
uniform cochlear filters – roughly logarithmic increase in BW of
filters (<800 Hz has equal BW) => constant Q filters with BW decreasing as we move away from cochlear opening
– peak frequency at which maximum response occurs along the BM is called the characteristic frequency
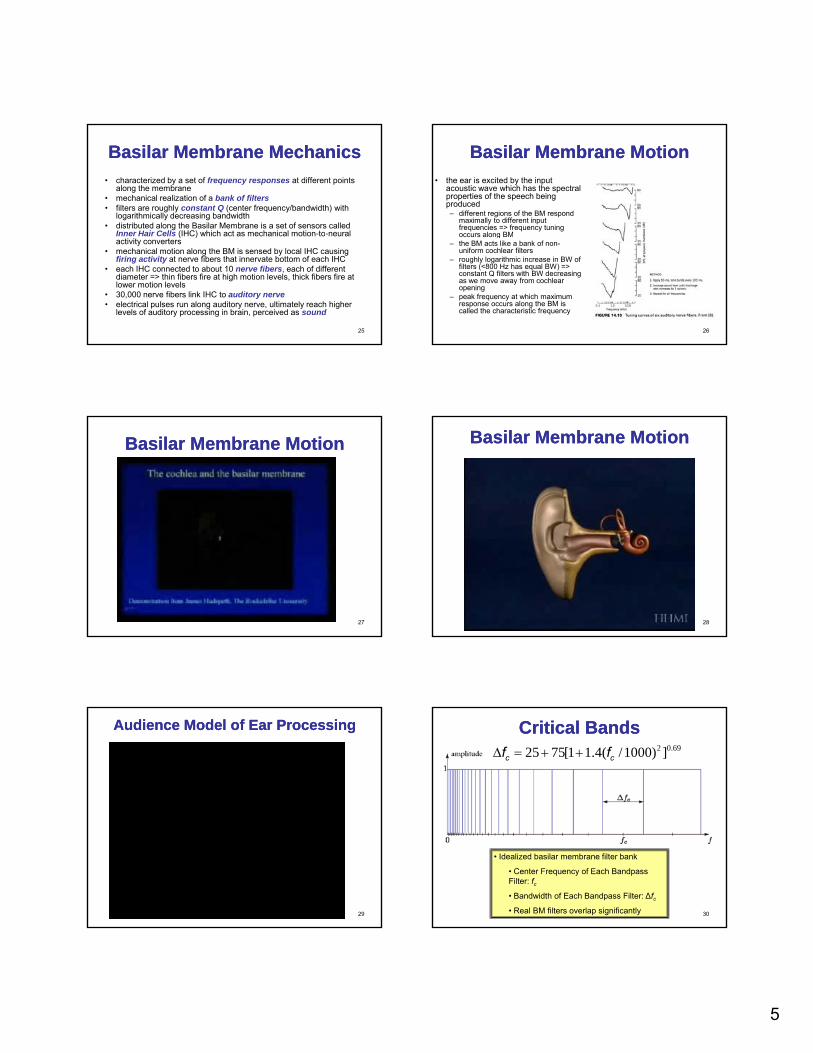
Basilar Membrane MotionBasilar Membrane Motion
27
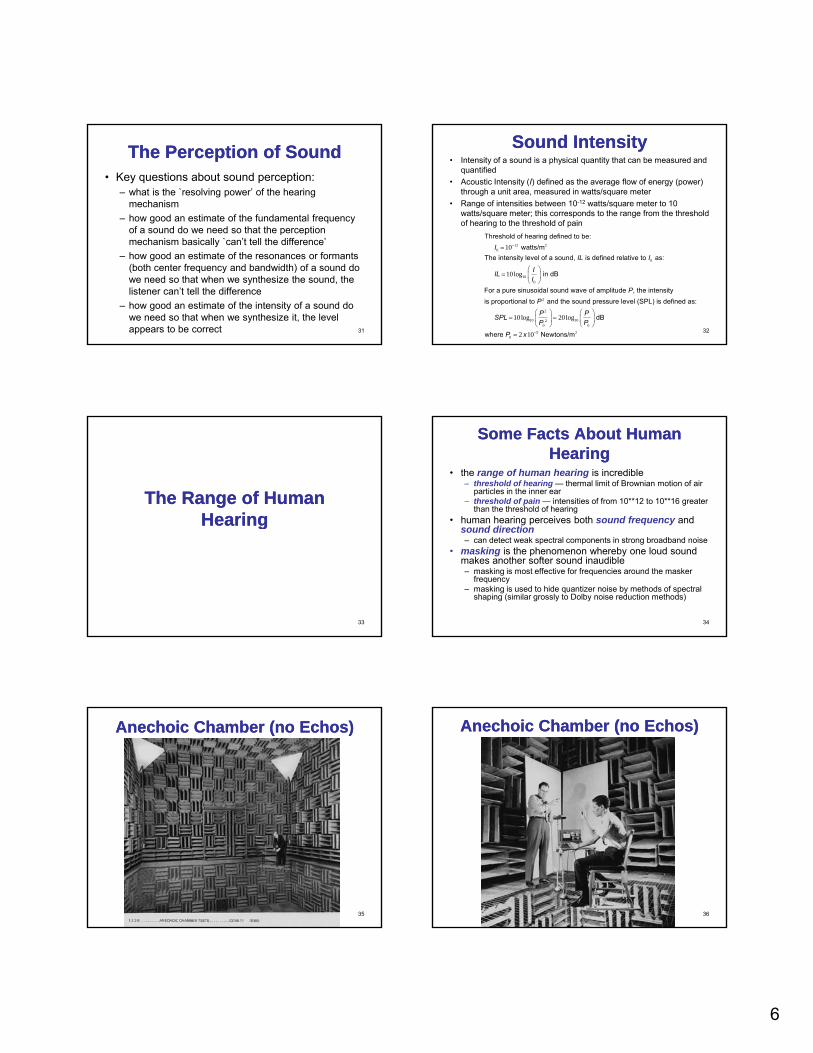
Basilar Membrane MotionBasilar Membrane Motion
28
Audience Model of Ear ProcessingAudience Model of Ear Processing
29
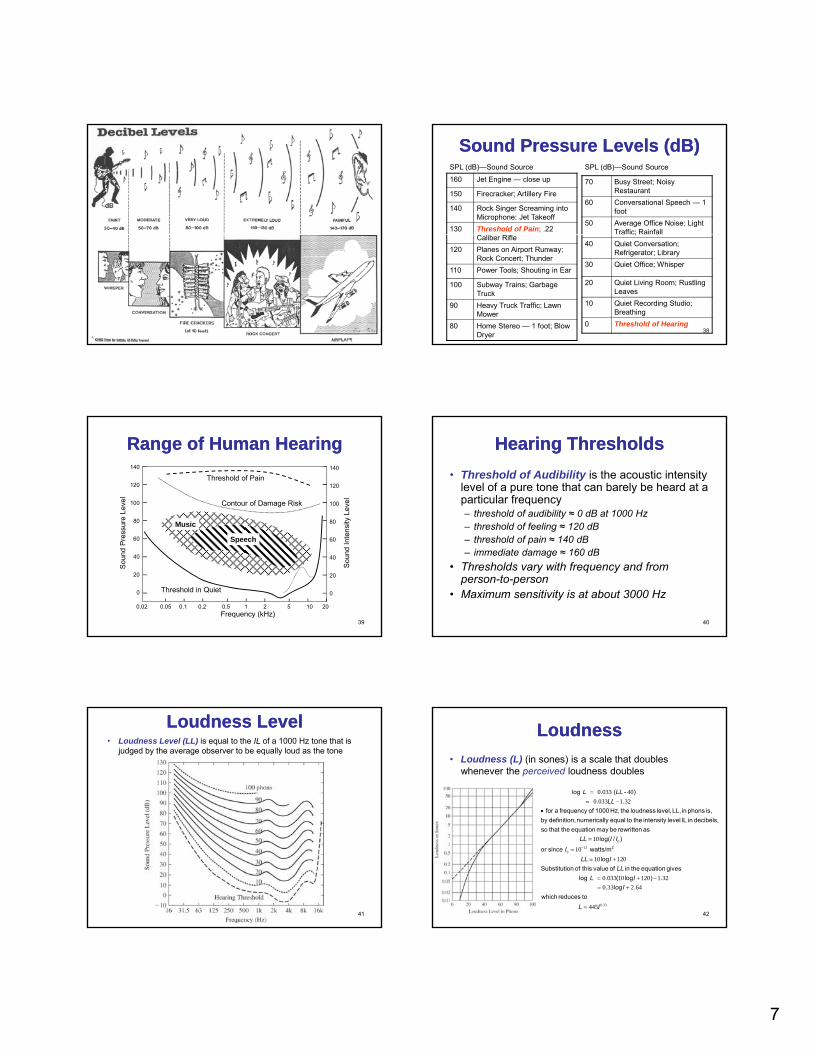
Critical BandsCritical Bands2 0.6925 75[1 1.4( /1000) ]c cf fΔ = + +
30
• Idealized basilar membrane filter bank
• Center Frequency of Each Bandpass Filter: fc• Bandwidth of Each Bandpass Filter: Δfc• Real BM filters overlap significantly
6
The Perception of SoundThe Perception of Sound• Key questions about sound perception:
– what is the `resolving power’ of the hearing mechanism
– how good an estimate of the fundamental frequency of a sound do we need so that the perception p pmechanism basically `can’t tell the difference’
– how good an estimate of the resonances or formants (both center frequency and bandwidth) of a sound do we need so that when we synthesize the sound, the listener can’t tell the difference
– how good an estimate of the intensity of a sound do we need so that when we synthesize it, the level appears to be correct 31
Sound IntensitySound Intensity• Intensity of a sound is a physical quantity that can be measured and
quantified• Acoustic Intensity (I) defined as the average flow of energy (power)
through a unit area, measured in watts/square meter• Range of intensities between 10-12 watts/square meter to 10
watts/square meter; this corresponds to the range from the threshold of hearing to the threshold of pain
Th h ld f h i d fi d t b
32
12 20
0
100
10
10log
Threshold of hearing defined to be: watts/mThe intensity level of a sound, is defined relative to as:
in dB
For a pure sinusoidal sound wave of amplitude ,
−=
⎛ ⎞= ⎜ ⎟
⎝ ⎠
IIL I
IILI
P2
2
10 1020 0
5 20
10 log 20log
2 10
the intensityis proportional to and the sound pressure level (SPL) is defined as:
dB
where Newtons/m−
⎛ ⎞ ⎛ ⎞= =⎜ ⎟ ⎜ ⎟
⎝ ⎠ ⎝ ⎠=
P
P PSPLP P
P x
The Range of Human The Range of Human HearingHearinggg
33
Some Facts About Human Some Facts About Human HearingHearing
• the range of human hearing is incredible– threshold of hearing — thermal limit of Brownian motion of air
particles in the inner ear– threshold of pain — intensities of from 10**12 to 10**16 greater
than the threshold of hearing• human hearing perceives both sound frequency and
d di ti
34
sound direction– can detect weak spectral components in strong broadband noise
• masking is the phenomenon whereby one loud sound makes another softer sound inaudible– masking is most effective for frequencies around the masker
frequency– masking is used to hide quantizer noise by methods of spectral
shaping (similar grossly to Dolby noise reduction methods)
Anechoic Chamber (no Echos)Anechoic Chamber (no Echos)
35
Anechoic Chamber (no Echos)Anechoic Chamber (no Echos)
36
7
37
Sound Pressure Levels (dB)Sound Pressure Levels (dB)160 Jet Engine — close up
150 Firecracker; Artillery Fire
140 Rock Singer Screaming into Microphone: Jet Takeoff
130 Threshold of Pain; .22
70 Busy Street; Noisy Restaurant
60 Conversational Speech — 1 foot
50 Average Office Noise; Light Traffic; Rainfall
SPL (dB)—Sound Source SPL (dB)—Sound Source
38
Caliber Rifle120 Planes on Airport Runway;
Rock Concert; Thunder110 Power Tools; Shouting in Ear
100 Subway Trains; Garbage Truck
90 Heavy Truck Traffic; Lawn Mower
80 Home Stereo — 1 foot; Blow Dryer
;40 Quiet Conversation;
Refrigerator; Library30 Quiet Office; Whisper
20 Quiet Living Room; Rustling Leaves
10 Quiet Recording Studio; Breathing
0 Threshold of Hearing
Range of Human HearingRange of Human Hearing
ure
Leve
l
sity
Lev
el
140
120
80
100
Threshold of Pain
Music
Contour of Damage Risk
140
120
80
100
39
0.02 0.05 0.1 0.2 0.5 1 2 5 10 20Frequency (kHz)
Soun
d Pr
essu
Soun
d In
tens
60
40
20
0
Music
Speech
Threshold in Quiet
60
40
20
0
Hearing ThresholdsHearing Thresholds• Threshold of Audibility is the acoustic intensity
level of a pure tone that can barely be heard at a particular frequency– threshold of audibility ≈ 0 dB at 1000 Hz
threshold of feeling ≈ 120 dB
40
– threshold of feeling ≈ 120 dB– threshold of pain ≈ 140 dB– immediate damage ≈ 160 dB
• Thresholds vary with frequency and from person-to-person
• Maximum sensitivity is at about 3000 Hz
Loudness LevelLoudness Level• Loudness Level (LL) is equal to the IL of a 1000 Hz tone that is
judged by the average observer to be equally loud as the tone
41
LoudnessLoudness• Loudness (L) (in sones) is a scale that doubles
whenever the perceived loudness doubles
0 033 400 033 1 32
log . ( - ). .
for a frequency of 1000 Hz, the loudness level, LL, in phons is,b d fi i i i ll l h i i l l IL i d ib l
L LLLL
== −
•
42
by definition, numerically equal to the intensity level IL in decibels,so that the
0
120
10
1010 120
0 033 10 120 1 320 33 2 64
445
2
equation may be rewritten aslog( / )
or since watts/mlog
Substitution of this value of in the equation giveslog . ( log ) .
. log .which reduces to
LL I I
ILL I
LLL I
I
L I
−
=
=
= +
= + −= +
= 0 33.
8
PitchPitch• pitch and fundamental frequency are not the same
thing• we are quite sensitive to changes in pitch
– F < 500 Hz, ΔF ≈ 3 Hz– F > 500 Hz, ΔF/F ≈ 0.003
43
• relationship between pitch and fundamental frequency is not simple, even for pure tones– the tone that has a pitch half as great as the pitch of a 200 Hz
tone has a frequency of about 100 Hz– the tone that has a pitch half as great as the pitch of a 5000 Hz
tone has a frequency of less than 2000 Hz• the pitch of complex sounds is an even more complex
and interesting phenomenon
PitchPitch--The Mel ScaleThe Mel Scale
44
10( ) 3322log (1 /1000)
( ) 1127 log (1 / 700)
Pitch Alternatively, we can approximate curve as:Pitch e
mels f
mels f
= +
= +
Perception of FrequencyPerception of Frequency• Pure tone
– Pitch is a perceived quantity while frequency is a physical one (cycle per second or Hertz)
– Mel is a scale that doubles whenever the perceived pitchdoubles; start with 1000 Hz = 1000 mel, increase frequency of tone until listener perceives twice the pitch (or decrease until half the pitch) and so on to find mel Hz relationship
45
until half the pitch) and so on to find mel-Hz relationship– The relationship between pitch and frequency is non-linear
• Complex sound such as speech– Pitch is related to fundamental frequency but
not the same as fundamental frequency; the relationship is more complex than pure tones
• Pitch period is related to time.
Tone MaskingTone Masking
46
Pure Tone MaskingPure Tone Masking• Masking is the effect whereby some sounds are made less
distinct or even inaudible by the presence of other sounds• Make threshold measurements in presence of masking tone;
plots below show shift of threshold over non-masking thresholds as a function of the level of the tone masker
) 100
47
200 400 1000 2000 5000 200 400 1000 2000 5000Frequency (Hz) Frequency (Hz)
100 dB 100 dB
80 dB80 dB
60 dB 60 dB
40 dB 40 dB
Thre
shol
d Sh
ift (d
B)
80
60
40
20
0
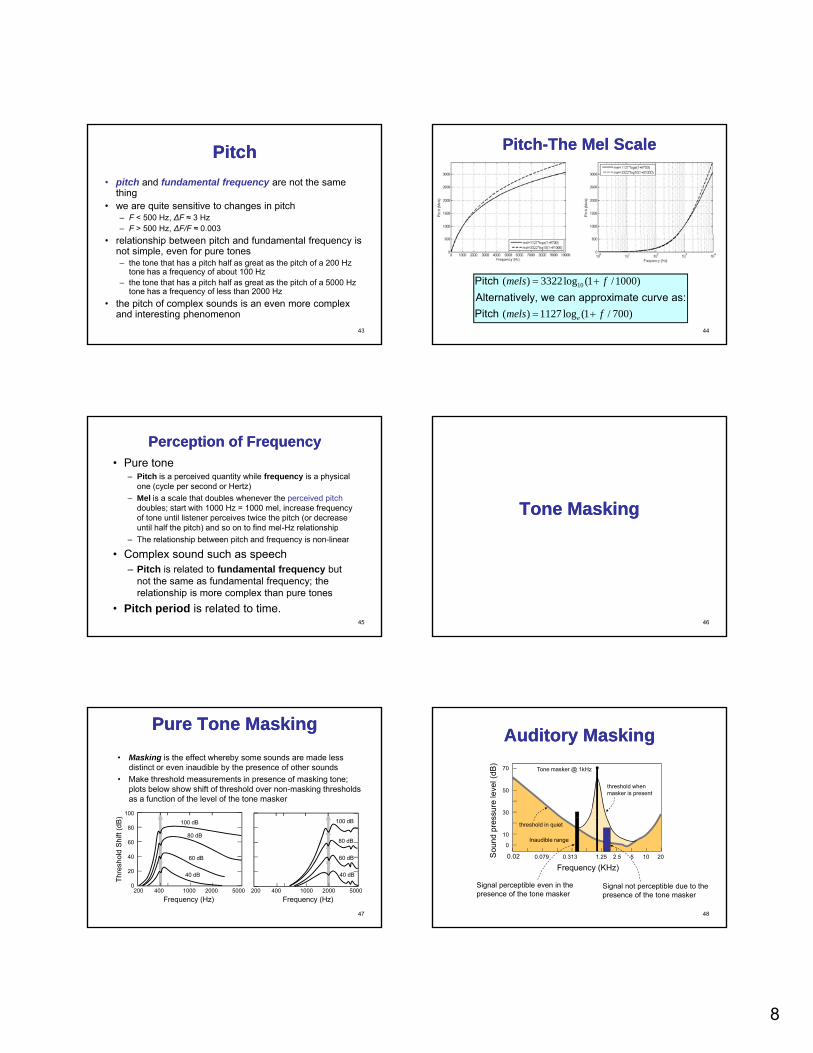
Auditory MaskingAuditory Masking
50
70
30
ssur
e le
vel (
dB)
Tone masker @ 1kHz
threshold when masker is present
48
200.313 1.25 2.5 5 100.0790.02
10
0
Sou
nd p
res
Frequency (KHz)
threshold in quiet
Inaudible range
Signal not perceptible due to the presence of the tone masker
Signal perceptible even in the presence of the tone masker
9
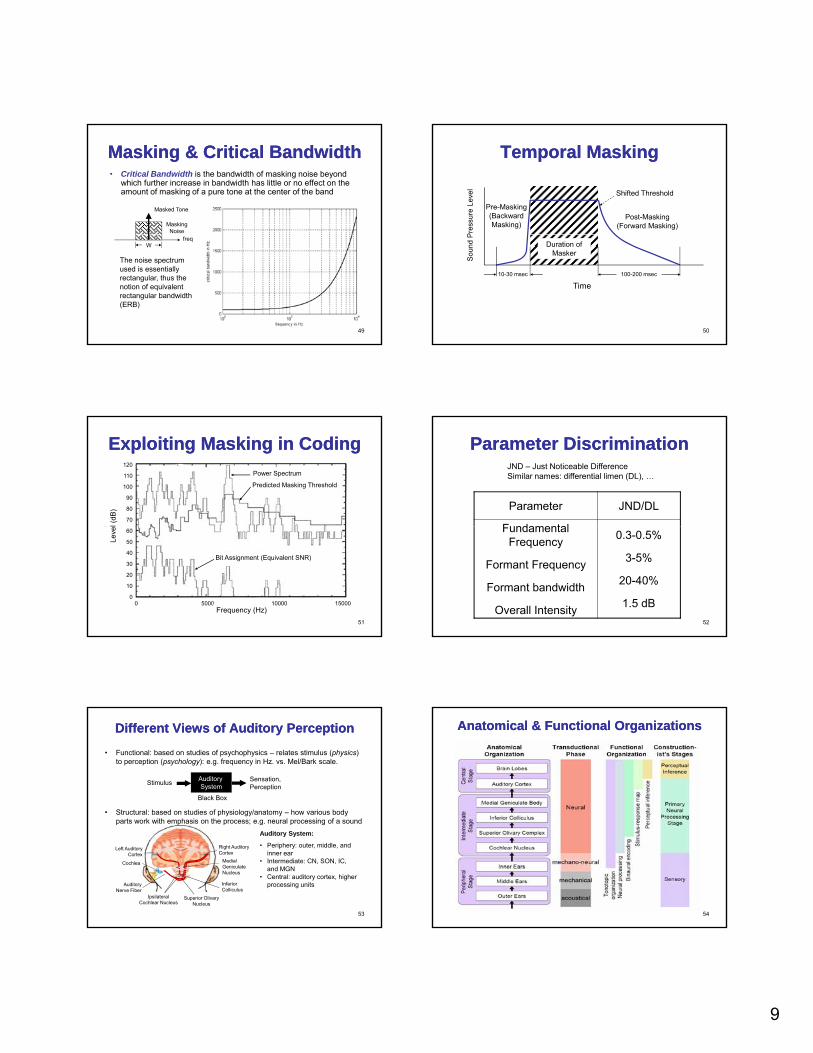
• Critical Bandwidth is the bandwidth of masking noise beyond which further increase in bandwidth has little or no effect on the amount of masking of a pure tone at the center of the band
Masked Tone
MaskingNoise
Masking & Critical BandwidthMasking & Critical Bandwidth
49
freqW
The noise spectrum used is essentially rectangular, thus the notion of equivalent rectangular bandwidth (ERB)
Temporal MaskingTemporal Masking
Post-Masking(Forward Masking)
Pre-Masking(Backward Masking)
Shifted Threshold
Pres
sure
Lev
el
50
Time100-200 msec10-30 msec
Duration of Masker
Soun
d P
Exploiting Masking in CodingExploiting Masking in Coding120
110
100
90
80
70
l (dB
)
Power Spectrum
Predicted Masking Threshold
51
60
50
40
30
20
10
0
Leve
l
0 5000 10000 15000Frequency (Hz)
Bit Assignment (Equivalent SNR)
Parameter DiscriminationParameter DiscriminationJND – Just Noticeable DifferenceSimilar names: differential limen (DL), …
Parameter JND/DL
Fundamental
52
Fundamental Frequency
Formant Frequency
Formant bandwidth
Overall Intensity
0.3-0.5%
3-5%
20-40%
1.5 dB
• Functional: based on studies of psychophysics – relates stimulus (physics) to perception (psychology): e.g. frequency in Hz. vs. Mel/Bark scale.
• Structural: based on studies of physiology/anatomy – how various body
Different Views of Auditory PerceptionDifferent Views of Auditory Perception
Auditory System
Black Box
Stimulus Sensation, Perception
53
parts work with emphasis on the process; e.g. neural processing of a soundAuditory System:
• Periphery: outer, middle, and inner ear
• Intermediate: CN, SON, IC, and MGN
• Central: auditory cortex, higher processing units
Right AuditoryCortex
MedialGeniculateNucleus
InferiorColliculus
Superior OlivaryNucleus
Ipsilateral Cochlear Nucleus
AuditoryNerve Fiber
Cochlea
Left AuditoryCortex
Anatomical & Functional OrganizationsAnatomical & Functional Organizations
54
10
Auditory ModelsAuditory Models
55
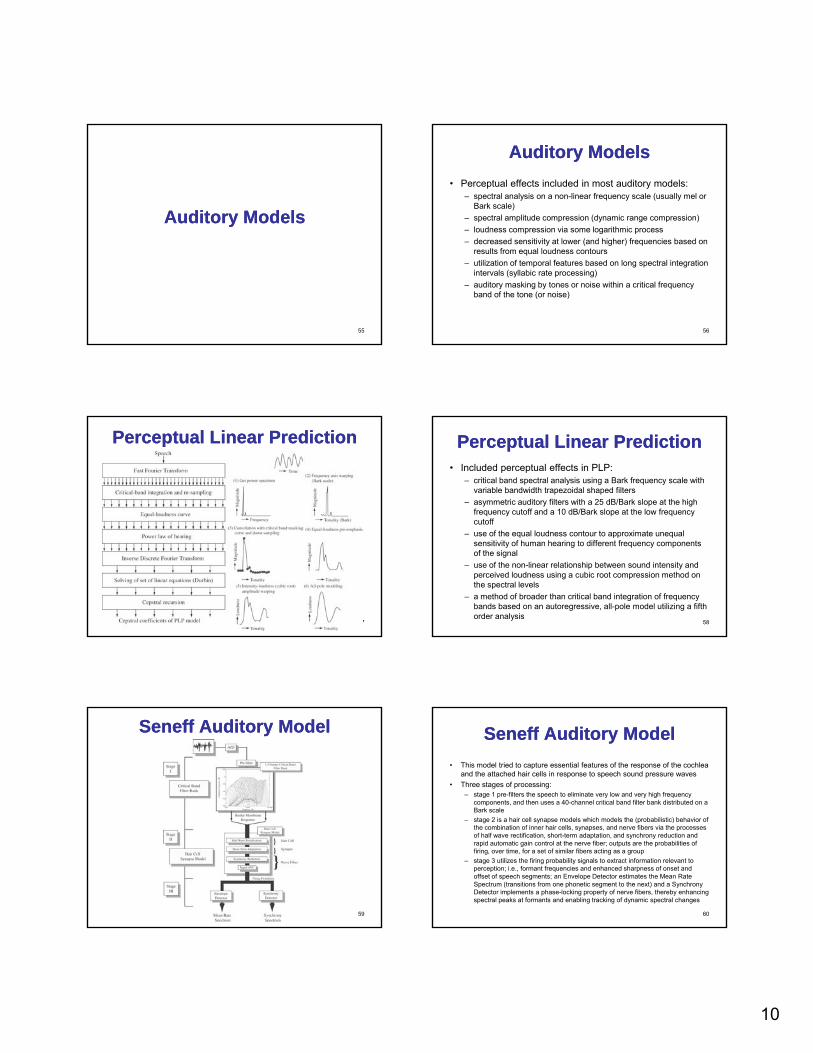
Auditory ModelsAuditory Models• Perceptual effects included in most auditory models:
– spectral analysis on a non-linear frequency scale (usually mel or Bark scale)
– spectral amplitude compression (dynamic range compression)– loudness compression via some logarithmic process– decreased sensitivity at lower (and higher) frequencies based on
results from equal loudness contours– utilization of temporal features based on long spectral integration
intervals (syllabic rate processing)– auditory masking by tones or noise within a critical frequency
band of the tone (or noise)
56
Perceptual Linear PredictionPerceptual Linear Prediction
57
Perceptual Linear PredictionPerceptual Linear Prediction• Included perceptual effects in PLP:
– critical band spectral analysis using a Bark frequency scale with variable bandwidth trapezoidal shaped filters
– asymmetric auditory filters with a 25 dB/Bark slope at the high frequency cutoff and a 10 dB/Bark slope at the low frequency cutoff
– use of the equal loudness contour to approximate unequal sensitivity of human hearing to different frequency components of the signal
– use of the non-linear relationship between sound intensity and perceived loudness using a cubic root compression method on the spectral levels
– a method of broader than critical band integration of frequency bands based on an autoregressive, all-pole model utilizing a fifth order analysis
58
SeneffSeneff Auditory ModelAuditory Model
59
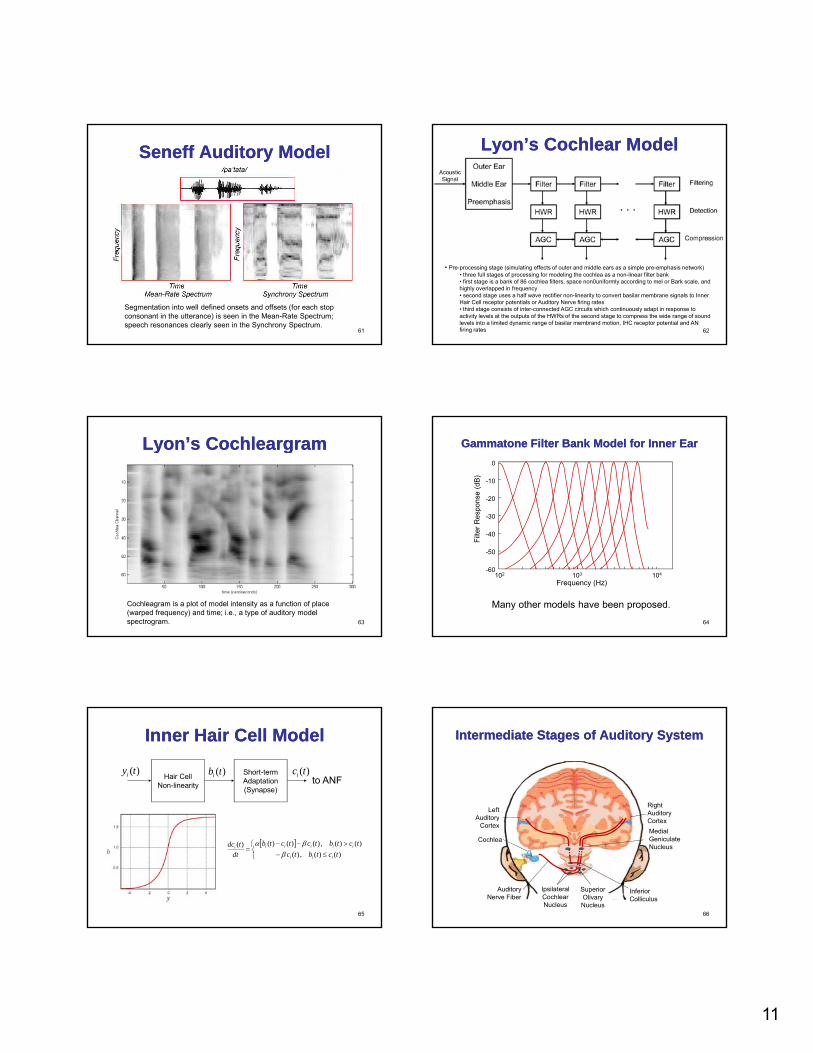
SeneffSeneff Auditory ModelAuditory Model• This model tried to capture essential features of the response of the cochlea
and the attached hair cells in response to speech sound pressure waves• Three stages of processing:
– stage 1 pre-filters the speech to eliminate very low and very high frequency components, and then uses a 40-channel critical band filter bank distributed on a Bark scalet 2 i h i ll d l hi h d l th ( b bili ti ) b h i f– stage 2 is a hair cell synapse models which models the (probabilistic) behavior of
the combination of inner hair cells, synapses, and nerve fibers via the processes of half wave rectification, short-term adaptation, and synchrony reduction and rapid automatic gain control at the nerve fiber; outputs are the probabilities of firing, over time, for a set of similar fibers acting as a group
– stage 3 utilizes the firing probability signals to extract information relevant to perception; i.e., formant frequencies and enhanced sharpness of onset and offset of speech segments; an Envelope Detector estimates the Mean Rate Spectrum (transitions from one phonetic segment to the next) and a Synchrony Detector implements a phase-locking property of nerve fibers, thereby enhancing spectral peaks at formants and enabling tracking of dynamic spectral changes
60
11
SeneffSeneff Auditory ModelAuditory Model
61
Segmentation into well defined onsets and offsets (for each stop consonant in the utterance) is seen in the Mean-Rate Spectrum; speech resonances clearly seen in the Synchrony Spectrum.
Lyon’s Cochlear ModelLyon’s Cochlear Model
62
• Pre-processing stage (simulating effects of outer and middle ears as a simple pre-emphasis network)• three full stages of processing for modeling the cochlea as a non-linear filter bank• first stage is a bank of 86 cochlea filters, space non0uniformly according to mel or Bark scale, and highly overlapped in frequency• second stage uses a half wave rectifier non-linearity to convert basilar membrane signals to Inner Hair Cell receptor potentials or Auditory Nerve firing rates• third stage consists of inter-connected AGC circuits which continuously adapt in response to activity levels at the outputs of the HWRs of the second stage to compress the wide range of sound levels into a limited dynamic range of basilar membrand motion, IHC receptor potential and AN firing rates
Lyon’s Lyon’s CochleargramCochleargram
63
Cochleagram is a plot of model intensity as a function of place (warped frequency) and time; i.e., a type of auditory model spectrogram.
Res
pons
e (d
B)
0
-10
-20
-30
Gammatone Filter Bank Model for Inner EarGammatone Filter Bank Model for Inner Ear
64
Filte
r
-40
-50
-60102 104103
Frequency (Hz)
Many other models have been proposed.
Inner Hair Cell ModelInner Hair Cell Model
Hair CellNon-linearity
Short-term Adaptation(Synapse)
)(tyi )(tci)(tbi to ANF
65
[ ]⎩⎨⎧
≤−>−−
=)()(,)(
)()(,)()()()(tctbtc
tctbtctctbdt
tdciii
iiiiii
ββα
Intermediate Stages of Auditory SystemIntermediate Stages of Auditory System
RightAuditoryLeft
Auditory
66
CortexMedialGeniculateNucleus
InferiorColliculus
SuperiorOlivaryNucleus
IpsilateralCochlearNucleus
AuditoryNerve Fiber
Cochlea
AuditoryCortex
12
evel
, dB
SPL
100
80
60
40
20
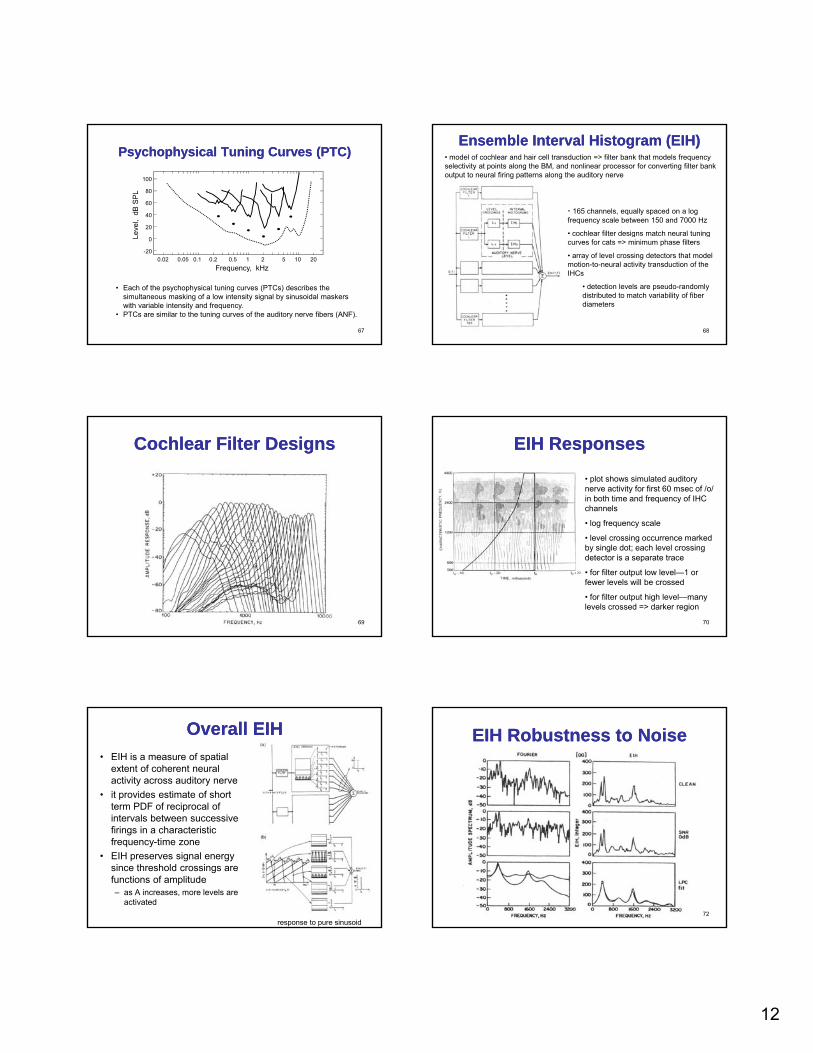
Psychophysical Tuning Curves (PTC)Psychophysical Tuning Curves (PTC)
67
Frequency, kHz
Le
0.02 0.10.05 0.50.2 521 10 20
0
-20
• Each of the psychophysical tuning curves (PTCs) describes the simultaneous masking of a low intensity signal by sinusoidal maskers with variable intensity and frequency.
• PTCs are similar to the tuning curves of the auditory nerve fibers (ANF).
Ensemble Interval Histogram (EIH)Ensemble Interval Histogram (EIH)• model of cochlear and hair cell transduction => filter bank that models frequency selectivity at points along the BM, and nonlinear processor for converting filter bank output to neural firing patterns along the auditory nerve
• 165 channels, equally spaced on a log frequency scale between 150 and 7000 Hz
• cochlear filter designs match neural tuning
68
cochlear filter designs match neural tuning curves for cats => minimum phase filters
• array of level crossing detectors that model motion-to-neural activity transduction of the IHCs
• detection levels are pseudo-randomly distributed to match variability of fiber diameters
Cochlear Filter DesignsCochlear Filter Designs
69
EIH ResponsesEIH Responses
• plot shows simulated auditory nerve activity for first 60 msec of /o/ in both time and frequency of IHC channels
• log frequency scale
70
g q y
• level crossing occurrence marked by single dot; each level crossing detector is a separate trace
• for filter output low level—1 or fewer levels will be crossed
• for filter output high level—many levels crossed => darker region
Overall EIHOverall EIH• EIH is a measure of spatial
extent of coherent neural activity across auditory nerve
• it provides estimate of short term PDF of reciprocal of intervals between successive
71
intervals between successive firings in a characteristic frequency-time zone
• EIH preserves signal energy since threshold crossings are functions of amplitude– as A increases, more levels are
activated
response to pure sinusoid
EIH Robustness to NoiseEIH Robustness to Noise
72
13
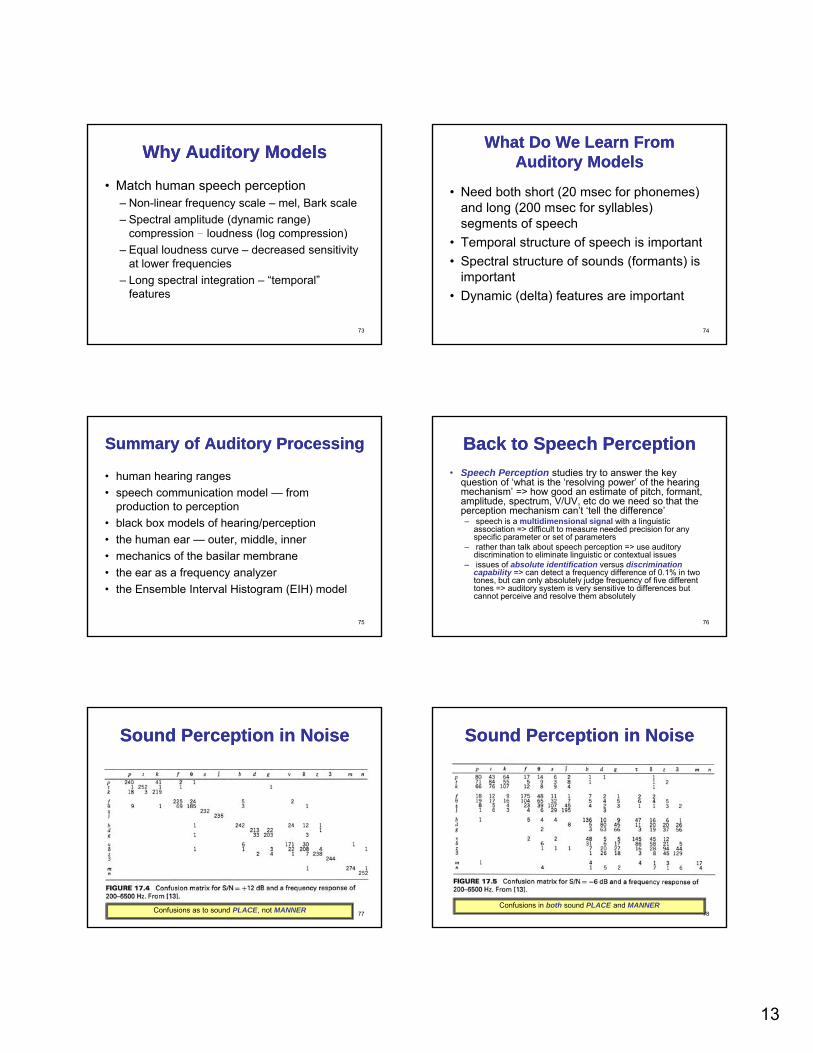
Why Auditory ModelsWhy Auditory Models
• Match human speech perception– Non-linear frequency scale – mel, Bark scale– Spectral amplitude (dynamic range)
compression – loudness (log compression)
73
compression loudness (log compression)– Equal loudness curve – decreased sensitivity
at lower frequencies– Long spectral integration – “temporal”
features
What Do We Learn From What Do We Learn From Auditory ModelsAuditory Models
• Need both short (20 msec for phonemes) and long (200 msec for syllables) segments of speech
74
• Temporal structure of speech is important• Spectral structure of sounds (formants) is
important• Dynamic (delta) features are important
Summary of Auditory ProcessingSummary of Auditory Processing
• human hearing ranges• speech communication model — from
production to perception• black box models of hearing/perception
75
black box models of hearing/perception• the human ear — outer, middle, inner• mechanics of the basilar membrane• the ear as a frequency analyzer• the Ensemble Interval Histogram (EIH) model
Back to Speech PerceptionBack to Speech Perception• Speech Perception studies try to answer the key
question of ‘what is the ‘resolving power’ of the hearing mechanism’ => how good an estimate of pitch, formant, amplitude, spectrum, V/UV, etc do we need so that the perception mechanism can’t ‘tell the difference’– speech is a multidimensional signal with a linguistic
i ti diffi lt t d d i i f
76
association => difficult to measure needed precision for any specific parameter or set of parameters
– rather than talk about speech perception => use auditory discrimination to eliminate linguistic or contextual issues
– issues of absolute identification versus discrimination capability => can detect a frequency difference of 0.1% in two tones, but can only absolutely judge frequency of five different tones => auditory system is very sensitive to differences but cannot perceive and resolve them absolutely
Sound Perception in NoiseSound Perception in Noise
77Confusions as to sound PLACE, not MANNER
Sound Perception in NoiseSound Perception in Noise
78Confusions in both sound PLACE and MANNER
14
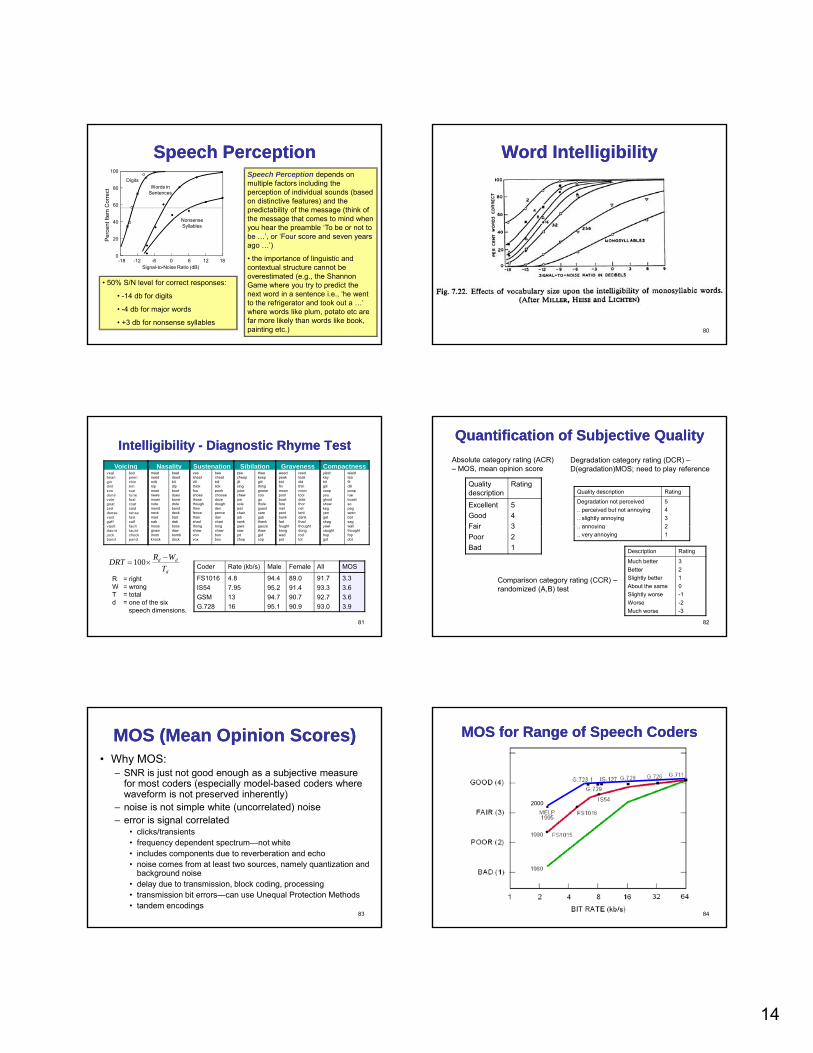
Speech PerceptionSpeech PerceptionSpeech Perception depends on multiple factors including the perception of individual sounds (based on distinctive features) and the predictability of the message (think of the message that comes to mind when you hear the preamble ‘To be or not to b ’ ‘F d
NonsenseSyllables
Words inSentences
Digits
100
80
60
40
rcen
t Ite
m C
orre
ct
79
be …’, or ‘Four score and seven years ago …’)
• the importance of linguistic and contextual structure cannot be overestimated (e.g., the Shannon Game where you try to predict the next word in a sentence i.e., ‘he went to the refrigerator and took out a …’ where words like plum, potato etc are far more likely than words like book, painting etc.)
• 50% S/N level for correct responses:
• -14 db for digits
• -4 db for major words
• +3 db for nonsense syllables
-18 -12 -6 0 6 12 180
20Pe
Signal-to-Noise Ratio (dB)
Word IntelligibilityWord Intelligibility
80
Intelligibility Intelligibility -- Diagnostic Rhyme TestDiagnostic Rhyme Test
feel peen chin tint sue tune foal coat said tense fast calf fault
veal bean gin dint zoo dune vole goat zed dense vast gaff vault
Voicingbee cheat bill tick pooh choose doze dough den pence dan chad tong
vee sheet vill thick foo shoes those though then fence than shad thong
Sustenationthee keep gilt thing goose coo go thole guest care gab thank gauze
zee cheep jilt sing juice chew joe sole jest chair jab sank jaws
Sibilationbeat deed bit dip boot dues bone dote bend deck bad dab boss
meat need mitt nip moot news moan note mend neck mad nab moss
Nasalityreed teak did thin noon tool dole thor net tent dank thad thought
weed peak bid fin moon pool bowl fore met pent bank fad fought
Gravenesswield tea fit dill poop rue boast so peg wren bat sag wall
yield key hit gill coop you ghost show keg yen gat shag yawl
Compactness
81
d
dd
TWRDRT −
×=100
fault taunt chock pond
vault daunt jock bond
tong chaw bon box
thong shaw von vox
gauze thaw got cop
jaws saw jot chop
boss daw bombdock
moss gnaw mom knock
thought dong rod tot
fought bong wad pot
wall thought fop dot
yawl caught hop got
Coder Rate (kb/s) Male Female All MOS
FS1016IS54GSMG.728
4.87.951316
94.495.294.795.1
89.091.490.790.9
91.793.392.793.0
3.33.63.63.9
R = rightW = wrongT = totald = one of the six
speech dimensions.
Quantification of Subjective QualityQuantification of Subjective QualityAbsolute category rating (ACR) – MOS, mean opinion score
Quality description Rating
Degradation not perceived.. perceived but not annoying.. slightly annoying
annoying
5432
Degradation category rating (DCR) –D(egradation)MOS; need to play reference
Quality description
Rating
ExcellentGoodFair
543
82
.. annoying
.. very annoying 21
Description Rating
Much betterBetterSlightly betterAbout the sameSlightly worseWorseMuch worse
3210-1-2-3
FairPoorBad
321
Comparison category rating (CCR) –randomized (A,B) test
MOS (Mean Opinion Scores)MOS (Mean Opinion Scores)• Why MOS:
– SNR is just not good enough as a subjective measure for most coders (especially model-based coders where waveform is not preserved inherently)
– noise is not simple white (uncorrelated) noisei i l l t d
83
– error is signal correlated• clicks/transients• frequency dependent spectrum—not white• includes components due to reverberation and echo• noise comes from at least two sources, namely quantization and
background noise• delay due to transmission, block coding, processing• transmission bit errors—can use Unequal Protection Methods• tandem encodings
MOS for Range of Speech CodersMOS for Range of Speech Coders
2000
84
15
Speech Perception SummarySpeech Perception Summary• the role of speech perception• sound measures—acoustic intensity, loudness
level, pitch, fundamental frequency• range of human hearing
85
range of human hearing• the mel scale of pitch• masking—pure tones, noise, auditory masking,
critical bandwidths, jnd• sound perception in noise—distinctive features,
word intelligibility, MOS ratings
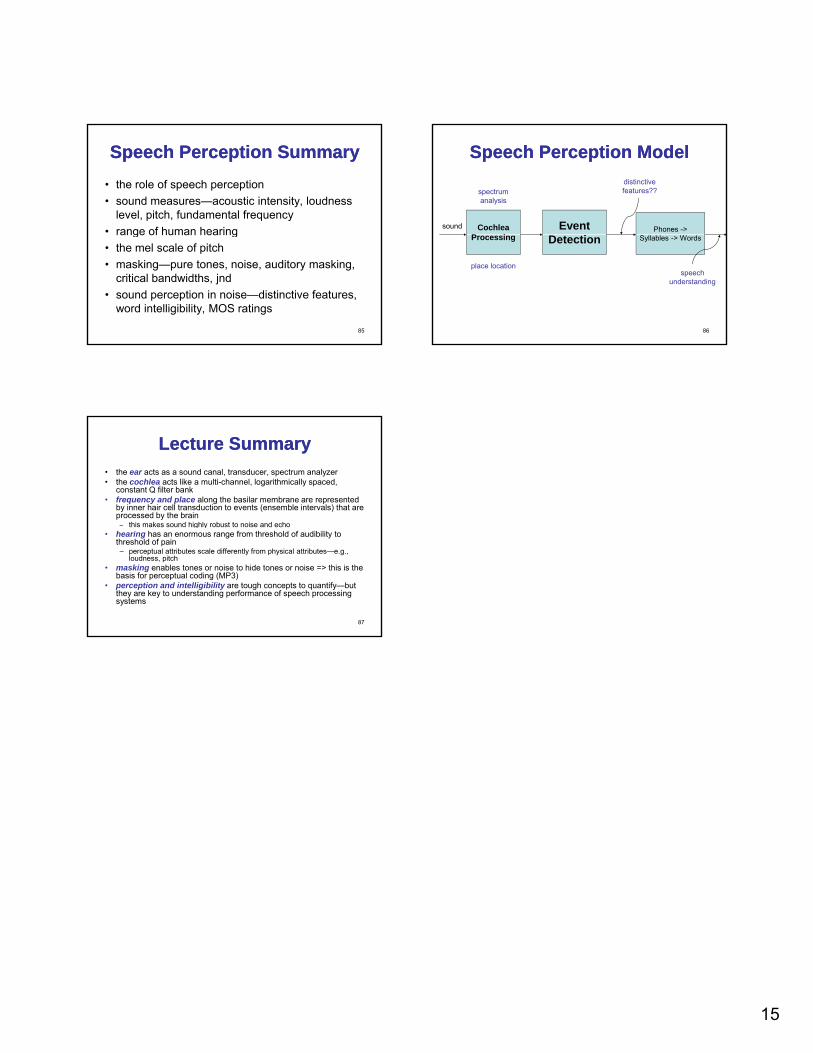
Speech Perception ModelSpeech Perception Model
Cochlea P i
Event Phones -> sound
spectrum analysis
distinctive features??
86
Processing Detection Syllables -> Words
place locationspeech
understanding
Lecture SummaryLecture Summary• the ear acts as a sound canal, transducer, spectrum analyzer• the cochlea acts like a multi-channel, logarithmically spaced,
constant Q filter bank• frequency and place along the basilar membrane are represented
by inner hair cell transduction to events (ensemble intervals) that are processed by the brain– this makes sound highly robust to noise and echo
87
this makes sound highly robust to noise and echo• hearing has an enormous range from threshold of audibility to
threshold of pain– perceptual attributes scale differently from physical attributes—e.g.,
loudness, pitch• masking enables tones or noise to hide tones or noise => this is the
basis for perceptual coding (MP3)• perception and intelligibility are tough concepts to quantify—but
they are key to understanding performance of speech processing systems