spectrum exploitation for non-terrestrial systems ... · pdf file1 commercial in confidence...
TRANSCRIPT
1 Commercial in Confidence
Spectrum exploitation for non-terrestrial systems operating above 10 GHz Final Report This report is commissioned by Ofcom to provide an independent view on the efficient use
of the radio spectrum in the UK. The assumptions, conclusions and recommendations expressed in this report are entirely those of the consultants and should not be attributed
to Ofcom
S. A. Callaghan, B. Boyes, A. Chan, A. Couchman, D. Eden, M. Malkin, A. Taylor, J. Waight, C. J. Walden, S. Ventouras. Radio Communications Research Unit Rutherford Appleton Laboratory Chilton, Didcot Oxfordshire OX11 0QX Tel: +44 (0) 1235 445770 Fax: +44 (0) 1235 446140 On behalf of: CCLRC Rutherford Appleton Laboratory, QinetiQ and EADS Astrium (UK) Ltd.
Commercial in Confidence

Spectrum exploitation for non-terrestrial systems operating above 10 GHz: Final Report
2
March 2007

Spectrum exploitation for non-terrestrial systems operating above 10 GHz: Final Report
3
Table of Contents EXECUTIVE SUMMARY ....................................................................................................................... 4
1 INTRODUCTION........................................................................................................................... 11 1.1 PURPOSE OF THIS STUDY............................................................................................................ 11 1.2 BENEFITS OF SITE DIVERSITY ..................................................................................................... 12 1.3 OUTLINE OF REPORT .................................................................................................................. 12
2 WORK PACKAGE 1: DATA COLLECTION AND PROCESSING ........................................ 13 2.1 EXPERIMENTAL CHARACTERISTICS............................................................................................ 13 2.2 DATA PROCESSING PROCEDURE ................................................................................................. 16 2.3 DATA AVAILABILITY AND HARDWARE RELIABILITY .................................................................. 20
3 WORK PACKAGE 2: ANALYSIS OF COLLECTED DATA FOR SATCOM SYSTEMS ... 22 3.1 CUMULATIVE DISTRIBUTIONS OF ATTENUATION........................................................................ 22 3.2 PERFORMANCE OF SITE DIVERSITY ........................................................................................... 24 3.3 SPECTRUM EFFICIENCY GAINS OF SITE DIVERSITY...................................................................... 30 3.4 CONCLUSIONS ........................................................................................................................... 33
4 WORK PACKAGE 3: ADVANCED RAIN FIELD MODELLING .......................................... 34 4.1 RADAR DATA DESCRIPTION AND PROCESSING............................................................................ 34 4.2 RADAR-DERIVED ATTENUATION ................................................................................................ 39 4.3 FURTHER WORK ......................................................................................................................... 40
5 WORK PACKAGE 4: SATELLITE SITE DIVERSITY IN A COMMERCIAL CONTEXT 41 5.1 INTRODUCTION .......................................................................................................................... 41 5.2 METHODOLOGY & ANALYSIS .................................................................................................... 42 5.3 RESULTS .................................................................................................................................... 48 5.4 CONCLUSIONS AND RECOMMENDATIONS .................................................................................. 63
6 WORK PACKAGE 5: RADAR SYSTEMS.................................................................................. 65 6.1 INTRODUCTION .......................................................................................................................... 65 6.2 METHODOLOGY ......................................................................................................................... 66 6.3 RESULTS .................................................................................................................................... 70 6.4 RELEVANT RESEARCH................................................................................................................ 86 6.5 DISCUSSION ............................................................................................................................... 88 6.6 CONCLUSIONS ........................................................................................................................... 90 6.7 REGULATORY ISSUES ................................................................................................................. 90 6.8 RECOMMENDATIONS ................................................................................................................. 91
7 CONCLUSIONS AND RECOMMENDATIONS ........................................................................ 93
8 REFERENCES ................................................................................................................................ 96
9 APPENDIX A .................................................................................................................................. 98 9.1 ETSI DVB-S2 PERFORMANCE (ES/NO) AS FUNCTION OF CODING AND MODULATION ............. 98 9.2 LINK BUDGETS .......................................................................................................................... 99
10 APPENDIX B................................................................................................................................. 105
Spectrum exploitation for non-terrestrial systems operating above 10 GHz: Final Report
4
Executive Summary
The demand for higher capacity in satellite communication systems requires expansion into the frequency ranges in the Ka-band (20/30 GHz) and above. However, link quality and availability are likely to be severely degraded by the troposphere. Paths at Ka-Band and above are more susceptible to tropospheric propagation impairments than paths at lower frequencies. Lower frequency systems (i.e. systems operating at Ku-Band) simply allocate a fixed fade margin to compensate for fading. As the frequency increases, in a practical system subject to technological and economical limitations, the available fade margin alone is unlikely to compensate for the atmospheric attenuation and fade mitigation techniques (FMT) might have to be employed. Site diversity is a fade mitigation technique where instead of one large ground station, a site configuration uses two or more smaller ground stations separated in space and connected to each other. The spatial structure of rain results in different attenuations at spatially separated ground stations. By choosing the ‘best signal’ a reduction of the fade margin can be achieved when compared with the fade margin of a single ground station. The interest in site diversity has been recently renewed due to significant reduction in the size of ground terminal antennas and other hardware. Whilst existing studies of site diversity refer to balanced situations, i.e. both paths in a diversity pair have identical sensitivity in terms of fade margin, this is not a necessary constraint. In fact, a second path with smaller margin (antenna) can provide a considerable improvement in system performance. Unfortunately, unbalanced diversity system performance which is a more realistic situation has not been explored experimentally. The purpose of this study was:
• To ensure that internationally designed (and operated) satellite based systems in the mm-wave band which are aimed at UK consumers are appropriately designed to take account of the UK climate.
• To inform Ofcom on the operational behaviour of SATCOM mm-wave services and to inform the debate on Radio Spectrum Access.
• To extend the site diversity measurements made with the beacon receivers at Sparsholt and Chilbolton (both in Hampshire, England) and Dundee (Scotland), in order to record a statistically significant database of site diversity measurement in UK.
• To use the multi-parameter meteorological radar CAMRa, based at Chilbolton to provide spatio-temporal data on the evolution and movement of rain fields in order to accurately model those fields.
• To analyse the collected data in terms of first and second order statistics, including cumulative distributions of attenuation, diversity gain and diversity improvement, fade slope, fade duration and the spatio-temporal properties of rain fields, hence improving and validating the current diversity gain and other models used by systems designers for the UK climatic region.
• To illustrate to new communications service providers the viability (availability, reliability, detection probability) of exploiting the mm-wave channel for new non-terrestrial based services e.g. HAPS, UAVs, SATCOMS.
In terms of frequency planning and improved spectrum utilisation, site diversity offers the following benefits:
Spectrum exploitation for non-terrestrial systems operating above 10 GHz: Final Report
5
• Reduced Earth station power is needed to transmit to the satellite because the fade margin required with diversity is less than a single site.
• This reduction in transmit power means that coordination distances between Earth stations and terrestrial links, and the exclusion zone around the Earth station can be reduced, freeing up more geographical space for other terrestrial services.
• The use of site diversity improves availability of higher frequency bands, which will free up lower bands for trading.
Data collection and analysis The Radio Communications Research Unit (RCRU) at the Rutherford Appleton Laboratory (RAL) made site diversity measurements at 20.7 GHz using the beacon carried on the US Department of Defense (DoD) Global Broadcast Service (GBS) satellite UFO-9. Measurements were made at two different sites, Sparsholt and Chilbolton, 7.8 km apart in the south of England, and were begun in October 2003. A third receiver was located in Dundee, Scotland, 600 km north of Chilbolton where measurements were begun in February 2004. The measurements lasted until August 2006. Each of the two sites in the south of England has also a range of supporting meteorological instruments, such as a drop counting rain gauge and instruments to measure wind speed and direction, as well as pressure and temperature. The meteorological measurements provided by these instruments are augmented by the multi-parameter 3 GHz radar, CAMRa, located at Chilbolton. The radar provides detailed information on the presence of rain, cloud and ice along the path to the satellite as well as the area bounded by the melting layer and the slant path from the Sparsholt receiving station. These data provide concurrent information on the spatio-temporal characteristics of the rain fields surrounding the links, leading to a broader understanding of the physical mechanisms that lead to rain fades. This experiment provided the first site diversity measurements to be made in the UK at Ka-band. Most of the previously published results come from experiments carried out in the US, an area with dramatically different climatology. The database produced by this project is long enough to draw the following statistically valid conclusions. It seems that medium range site diversity in southern UK at Ka-band can improve system availability (or equivalently reduce the required fade margin). For example if the Chilbolton station was operating with 5 dB fade margin the outage would be 0.05% in an average year (i.e. 262.8 minutes) , whereas with a site diversity (a second station at 7.5 Km away and with fade margin 5 dB) outage would be improved to 0.0085 % in an average year (i.e. 44.67 %). For long-range site diversity systems (Chilbolton–Dundee) it seems that the two stations are uncorrelated in terms of the atmospheric attenuation. Therefore the benefit from the site-diversity fade mitigation technique is the maximum that can be achieved. However, this benefit is at in the cost of the large distance bearing in mind that the two stations must be connected to each other. ITU-R Rec. 618-8 describes a complete method to estimate the diversity gain and diversity improvement factor, based on the measurements stored in the ITU-R databanks. Diversity improvement factor is the ratio of the single-site time percentage and the diversity percentage at the same attenuation level. Diversity gain is defined as the difference in dB between the single site and diversity attenuation values for the same percentage. Diversity improvement factor and diversity gain are different expressions of the joint statistics (i.e. the percentage of time that the attenuation exceeds at both stations the fade margin) and should be given in terms of the same
Spectrum exploitation for non-terrestrial systems operating above 10 GHz: Final Report
6
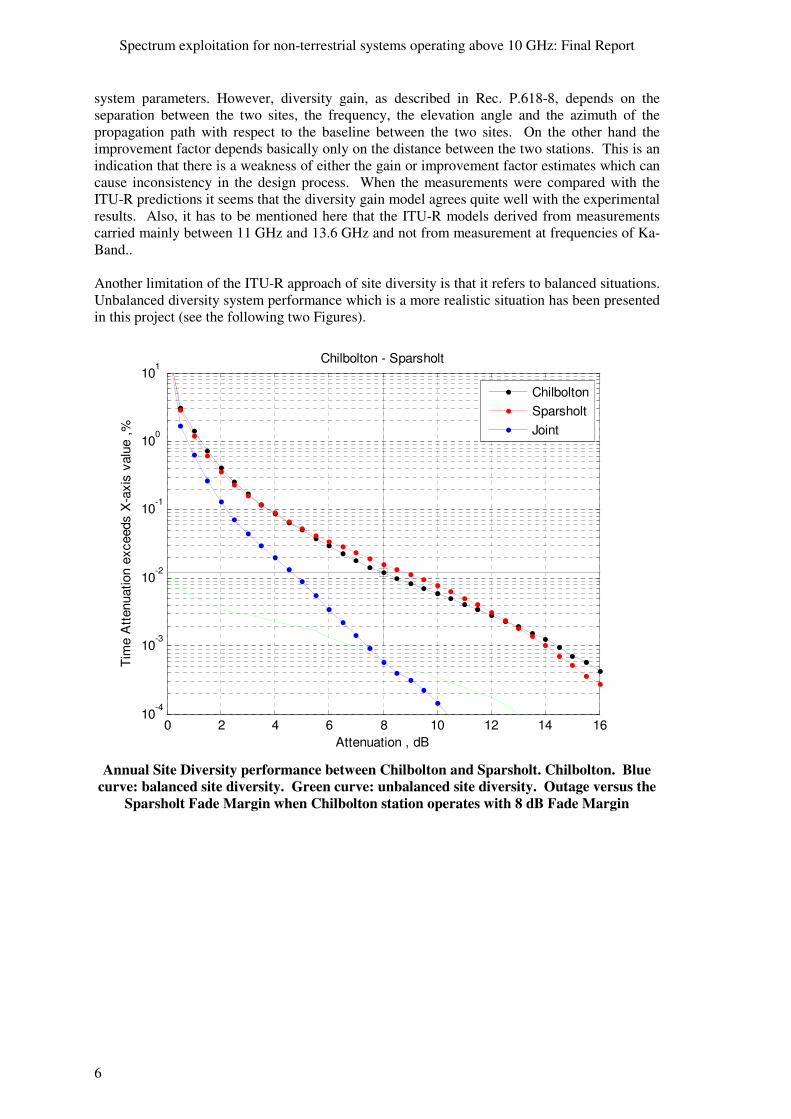
system parameters. However, diversity gain, as described in Rec. P.618-8, depends on the separation between the two sites, the frequency, the elevation angle and the azimuth of the propagation path with respect to the baseline between the two sites. On the other hand the improvement factor depends basically only on the distance between the two stations. This is an indication that there is a weakness of either the gain or improvement factor estimates which can cause inconsistency in the design process. When the measurements were compared with the ITU-R predictions it seems that the diversity gain model agrees quite well with the experimental results. Also, it has to be mentioned here that the ITU-R models derived from measurements carried mainly between 11 GHz and 13.6 GHz and not from measurement at frequencies of Ka-Band.. Another limitation of the ITU-R approach of site diversity is that it refers to balanced situations. Unbalanced diversity system performance which is a more realistic situation has been presented in this project (see the following two Figures).
0 2 4 6 8 10 12 14 1610
-4
10-3
10-2
10-1
100
101
Tim
e A
ttenu
atio
n ex
ceed
s X
-axi
s va
lue
,%
Attenuation , dB
Chilbolton - Sparsholt
ChilboltonSparsholtJoint
Annual Site Diversity performance between Chilbolton and Sparsholt. Chilbolton. Blue
curve: balanced site diversity. Green curve: unbalanced site diversity. Outage versus the Sparsholt Fade Margin when Chilbolton station operates with 8 dB Fade Margin

Spectrum exploitation for non-terrestrial systems operating above 10 GHz: Final Report
7
0 5 10 150
5
10
15
Sparsholt Attenuation , dB
Chi
lbol
ton
Atte
nuat
ion
, dB
-3
-3
-2
-1
0
Join
t E
xcee
danc
e Ti
me
, %
0.001
0.01
0.1
1
Annual joint exceedance time of attenuation (unbalanced case) between Chilbolton and
Sparsholt. As an example scenario the Table below gives the availability of the site diversity system Chilbolton-Sparsholt versus the fade margin of the second station (Sparsholt). The prime station (Chilbolton) operates with a Fade margin of 8 dB. Unbalanced site diversity statistics are useful to define the optimum fade margin for each station. However there are no experimental data or models concerning this realistic application of site diversity.
Sparsholt Station Fade
Margin dB
Site Diversity Outage
%
Site Diversity Availability
%
4 2.4x10⁻³ 99.9976 6 1.5x10⁻³ 99.9985 8 6x10⁻⁴ 99.9994
10 3.5x10⁻⁴ 99.99965
Annual unbalanced site diversity performance between Chilbolton and Sparsholt. Chilbolton fade margin = 8 dB
Spectrum exploitation for non-terrestrial systems operating above 10 GHz: Final Report
8
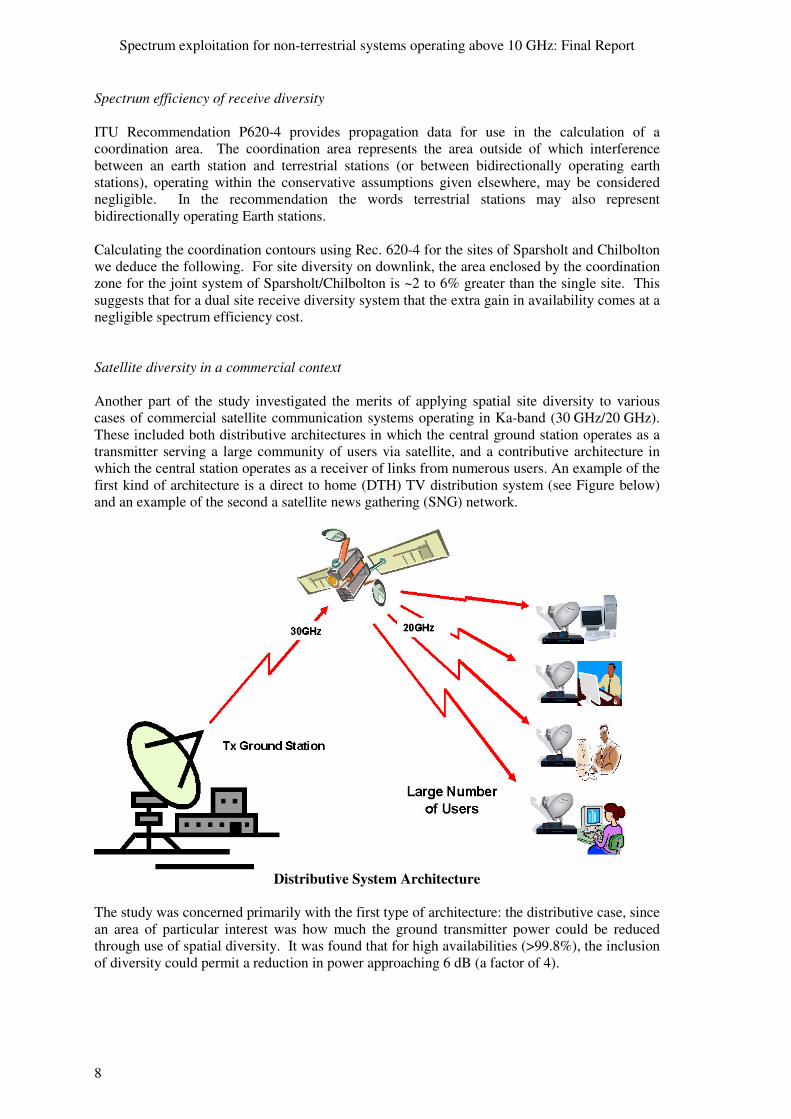
Spectrum efficiency of receive diversity ITU Recommendation P620-4 provides propagation data for use in the calculation of a coordination area. The coordination area represents the area outside of which interference between an earth station and terrestrial stations (or between bidirectionally operating earth stations), operating within the conservative assumptions given elsewhere, may be considered negligible. In the recommendation the words terrestrial stations may also represent bidirectionally operating Earth stations. Calculating the coordination contours using Rec. 620-4 for the sites of Sparsholt and Chilbolton we deduce the following. For site diversity on downlink, the area enclosed by the coordination zone for the joint system of Sparsholt/Chilbolton is ~2 to 6% greater than the single site. This suggests that for a dual site receive diversity system that the extra gain in availability comes at a negligible spectrum efficiency cost. Satellite diversity in a commercial context Another part of the study investigated the merits of applying spatial site diversity to various cases of commercial satellite communication systems operating in Ka-band (30 GHz/20 GHz). These included both distributive architectures in which the central ground station operates as a transmitter serving a large community of users via satellite, and a contributive architecture in which the central station operates as a receiver of links from numerous users. An example of the first kind of architecture is a direct to home (DTH) TV distribution system (see Figure below) and an example of the second a satellite news gathering (SNG) network.
Distributive System Architecture
The study was concerned primarily with the first type of architecture: the distributive case, since an area of particular interest was how much the ground transmitter power could be reduced through use of spatial diversity. It was found that for high availabilities (>99.8%), the inclusion of diversity could permit a reduction in power approaching 6 dB (a factor of 4).

Spectrum exploitation for non-terrestrial systems operating above 10 GHz: Final Report
9
Application of site diversity requires the installation of a second ground station and a communications link between the two stations. This of course results in additional costs, including maintenance. However the study shows that diversity can result in more efficient use of spectrum providing significant cost savings. In a case studied, it was shown that the installation of diversity might pay for itself after 4 years, and there after reduces the service provider’s expenditure by up to 30% per annum. Admittedly the analysis supporting this is was preliminary, and it is therefore recommended that more in depth economic assessments are carried out to confirm these findings. A particular problem with spatial diversity is ensuring continuity of the communications link during switch over between stations. This is problem is particularly difficult for distributive (e.g. DTH TV) systems in which diversification is applied to the transmitting station. A possible solution is the inclusion of buffering within the user receivers to permit data overlap between switch over. Such a solution would require “proof of concept” trials to ensure that it is indeed viable. Radar systems The GBS data collected at Chilbolton and Sparsholt were exploited to determine whether site diversity could be exploited for the migration of radar systems to millimetre-wave frequencies. Time series of data from the GBS receivers at these two sites were applied to simplified radar scenarios, at a range of 110 km and a fixed elevation of 35°, to obtain the probability of detection, P(d), of a single target. Nine months of data from the year 2005 were analysed. An increased P(d) was found when combining data from both sites, indicating the suitability of using spatial diversity data for the modelling of radar performance (see e.g. Figure below). Daily and monthly variations in P(d) were observed. Analysis of longer data sets to study the annual and inter-annual variability of P(d) would be beneficial for the development of modelling tools for longer term predictions.
5 10 15 20 25 300
0.2
0.4
0.6
0.8
1
Time series [Month: 01/2005, Averaging: 28800 samples ]
Time (days)
Pro
babi
lity
of d
etec
tion
(Pd)
20 GHz Chilbolton20 GHz Sparsholt20 GHz Max20 GHz Combined
0 0.1 0.2 0.3 0.4 0.5 0.6 0.7 0.8 0.9 10
0.2
0.4
0.6
0.8
1
Probability of detection (Pd)
Pro
babi
lity
of o
ccur
anc
e
CDF plots [Month: 01/2005, Averaging: 28800 samples ]
20 GHz Chilbolton20 GHz Sparsholt20 GHz Max20 GHz Combined
Time series and CDF plots for January 2005
Spectrum exploitation for non-terrestrial systems operating above 10 GHz: Final Report
10
It should be noted, however, that many radar applications have a much lower elevation than the satellite path for which these measurements were taken. At the lower elevations, the additional path length in the troposphere would lead to increased attenuation, thus reducing the probability of detection. Further work is required to determine whether current GBS data can be extrapolated for use at lower elevations. The migration of radar systems to higher frequencies would free up the already congested spectrum at frequencies between 1 and 10 GHz, where most of the current radar systems reside. For radars with roles in which high-resolution measurements are essential, frequency migration would be highly beneficial, given the availability of increased bandwidths and narrow antenna beamwidths. Similar, frequency migration could potentially reduce radar clutter, given the reduced antenna beamwidths, and that the wider bandwidths would reduce the size of a cell around a target processed by the radar. However, a combination of the lack of technological readiness and the high costs are currently seen as major obstacles to such frequency migration. Nonetheless, a step-by-step compromise may be possible. The migration of those radar types that would benefit the most from operating at higher frequencies should be considered first. The remainder of the systems should then be migrated into fewer frequency allocations. Finally, the freed spectrum should be rationalised into contiguous blocks for new services. Resolution of any technical difficulties in exploiting site diversity for the migration of radar systems to millimetre-wave frequencies is just one step in the direction of its application. It is equally necessary to examine both the national and international regulatory climates and, where required, make changes to enable this use. Initial considerations of ITU and CEPT regulations suggest that the 34GHz is the most suitable for this form of exploitation. In general, no barriers were found contained in the regulations which would make the proposal untenable. General regulations in the form of Articles, Appendices and Recommendations dealing with issues such as classification of emissions, spurious emissions and frequency tolerance will apply. In order that such frequency migration may take place, radar performance prediction tools must be developed to aid system designers in their understanding of the capabilities of radar systems at these higher frequencies, and to gain their support for the migration. Such tools need to be capable of predicting long-range two-way paths at low elevations, and need to take into consideration factors including radar clutter and environmental conditions such as ducting. In conclusion, the data analysis provided a useful first step into the design of radar systems at millimetre-wave frequencies. However, methodologies need to be developed for the extrapolation of the data for application at lower elevation angles.
Spectrum exploitation for non-terrestrial systems operating above 10 GHz: Final Report
11
1 Introduction
The radio spectrum is a finite resource, one that is coming under increasing pressure as the range of applications requiring large bandwidths (such as third-generation mobile, video-conferencing etc.) become more prevalent. The need for more bandwidth has also fuelled the push into higher frequencies, i.e. 10 GHz and above. To make efficient and economic use of these frequencies, new techniques to compensate for rain and cloud fades are required, commonly called fade mitigation techniques (FMT) or fade countermeasures (FCM). Previous systems simply allocated a fixed fade margin to compensate for fading. However, this allocation would not be practical or economical for the high attenuation experienced by the systems using higher frequencies. For Earth-space systems operating at frequencies above 12 GHz, site diversity is a commonly proposed FMT. CCLRC has been making site diversity measurements at 20.7 GHz using the beacon carried on the US Department of Defense (DoD) satellite UFO-9, which delivers information to American armed forces as part of the Global Broadcast Service (GBS). Measurements have been made at two different sites, Sparsholt and Chilbolton, 7.8 km apart in the south of England, and were begun in October 2003. A third receiver was located in Dundee, Scotland, where measurements were begun in February 2004. The GBS experiment has provided the first site diversity measurements to be made in the UK. Most of the previously published results come from experiments carried out in the US, an area with dramatically different climatology. This project builds on the work already started in 2003 with the three sites and investigates medium and long-range site diversity. The database produced by the GBS project is long enough to be statistically significant and capable of dealing with the annual and monthly variability exhibited by previous experiments.
1.1 Purpose of this study
The purpose of this study was:
• To ensure that internationally designed (and operated) satellite based systems in the mm-wave band which are aimed at UK consumers are appropriately designed to take account the UK climate.
• To inform Ofcom on the operational behaviour of SATCOM mm-wave services and to inform the debate on Radio Spectrum Access.
• To continue the site diversity measurements currently being made with the RCRU’s beacon receivers at Sparsholt and Chilbolton (both in Hampshire, England) and Dundee (Scotland), in order to record a statistically significant database of site diversity measurement in UK.
• To use the multi-parameter meteorological radar CAMRa, based at Chilbolton to provide spatio-temporal data on the evolution and movement of rain fields in order to accurately model those fields.
• To analyse the collected data in terms of first and second order statistics, including cumulative distributions of attenuation, diversity gain and diversity improvement, fade slope, fade duration and the spatio-temporal properties of rain fields, hence improving and validating the current diversity gain and other models used by systems designers for the UK climatic region.
• To illustrate to new communications service providers the viability (availability, reliability, detection probability) of exploiting the mm-wave channel for new non-terrestrial based services e.g. HAPS, UAVs SATCOMS
Spectrum exploitation for non-terrestrial systems operating above 10 GHz: Final Report
12
1.2 Benefits of site diversity
In terms of frequency planning and improved spectrum utilisation, site diversity offers the following benefits:
• Reduced Earth station power is needed to transmit to the satellite because the fade margin required with diversity is less than a single site. Results from previous measurements made by CCLRC show that for 20 GHz and 7.5 km separation distance the diversity fade margin is 7 dB less than a single site.
• This reduction in transmit power means that coordination distances between Earth stations and terrestrial links, and the exclusion zone around the Earth station can be reduced, freeing up more geographical space for other terrestrial services.
• The use of site diversity improves availability of higher frequency bands, which will free up lower bands for trading.
This experiment is of particular interest to satellite service providers at present, as more and more systems are being planned which make use of higher frequency bands. Such systems, commonly operating in the 30/20 GHz bands include multimedia broadband access schemes providing high speed Internet access particularly to remote areas not served by terrestrial means (the Digital Divide), and High Definition TV services. The provision of accurate propagation data is important for these services to enable margins to be minimised with confidence and thereby enabling more efficient utilisation of the satellite resource. Currently, other European companies (e.g. Alcatel Space) are working on FMT implementation for future telecommunication systems and are investigating FMT control loop design, simulator development, system aspects, etc. They are interested in any propagation experiment and measurements that can help them better understand what happens when a FMT, like site diversity, is implemented in a system. This experiment will provide propagation data for use by UK satellite companies which will enable them to do their own investigations on this topic, knowing that the measurements are of the right climactic type.
1.3 Outline of report
The remainder of this report is organised as follows: In Section 2 we review the experimental setup and describe the data collection, processing and quality control. Section 3 then elaborates on the data analysis and provides cumulative distributions of attenuation, demonstrating the potential benefits of site diversity. A description of the processing and analysis of data collected with the 3 GHz CAMRa radar at Chilbolton is given in Section 4. A comparison between observed beacon attenuation and its radar derived equivalent is explored to examine the suitability of employing the radar data as input to rain field modelling. In Section 5 we present the findings of a study into the viability and merits of using a system of spatial site diversity on various cases of ground-station/user to satellite (or links). These scenarios are modelled with detailed link budgets which include a complete ITU-R propagation model and interactive analytical tools. This allows an analysis of practical systems in order to realistically demonstrate the advantages and disadvantages of the application of spatial site diversity as a fade mitigation technique (FMT) in a commercial context. Section 6 then utilises the GBS beacon data collected at Sparsholt and Chilbolton to explore whether site diversity could be exploited in the migration of radar systems to millimetre-wave frequencies. Finally Section 7 summarises the conclusions. A number of more detailed descriptions are provided as Appendices.
Spectrum exploitation for non-terrestrial systems operating above 10 GHz: Final Report
13
2 Work Package 1: Data collection and processing
The Radio Communications Research Unit (RCRU) of CCLRC Rutherford Appleton Laboratory has an extensive history of making long-term Earth-space beacon attenuation measurements, including such projects as the Olympus and Italsat measurement campaigns. The GBS experiment was originally funded as part of the Radiocommunications Agency’s core programme, and was itself a replacement for the planned Stentor site diversity project. (The Stentor satellite was unfortunately lost on launch.) Before this project was begun in December 2005, a significant database of site diversity measurements at 20.7 GHz had already been recorded. Of the three sites currently involved in the project, the Chilbolton receiver was installed in August 2003, the Sparsholt receiver was installed in October 2003 (beginning the site diversity measurements) and the Dundee receiver was installed in February 2004. Funding for the previous GBS experiment ended in March 2005. However the receivers were all left switched on and running at risk. This meant that when the current incarnation of the project was started in December 2005, there was some data loss associated with that at-risk period, but overall continuity was maintained. This project report makes full use of the data collected since the beacon receivers were installed, regardless of whether or not the data dates from before the project’s official start. Using the whole database gives us a better understanding of the annual, seasonal and monthly variability associated with attenuation measurements, and hence the impact on site diversity as a fade mitigation technique. Unfortunately, it appears that the satellite was either deliberately moved, lost orbit or the beacon ceased transmitting on the 31st August 2006. Serious efforts were made find to find it, but without success. The database used in this report therefore covers the period of August 2003 to August 2006.
2.1 Experimental characteristics
The RCRU made site diversity measurements at 20.7 GHz using the beacon carried on the US Department of Defense (DoD) satellite UFO-9. The US DoD delivers information to American armed forces via the Global Broadcast Service (GBS) network of satellites. Three satellites containing a Ka-band payload provide near-global broadcast coverage - they are located at ~23oW, 72oE and 172oE. Part of the payload is the Earth-coverage Continuous Wave (CW) beacon that provides uplink level control and uplink-transmit terminal automated tracking. The UFO-9 satellite at ~23 oW was in a slightly inclined (~±3.5 degrees) geostationary orbit so that a ground receiver would need to track the satellite to ensure that it pointed correctly. Since UFO-9 is a military satellite, ephemeris information is not easily available. Due to the cost, it was not practical to implement a tracking system for the receivers; instead wider beamwidth antennas were used so that the complete movement of the satellite could be observed without a need to track it. There was a consequent reduction in receiver gain (6 dB) but there was still sufficient signal to enable a full range of measurements to be made. This also had the effect of introducing a sinusoidal diurnal variation into the recorded data. Our measurements have shown that the GBS receivers have a dynamic range of ~13 dB, which is sufficient to measure attenuation at 20.7 GHz down to time percentages of 0.02% (roughly
Spectrum exploitation for non-terrestrial systems operating above 10 GHz: Final Report
14
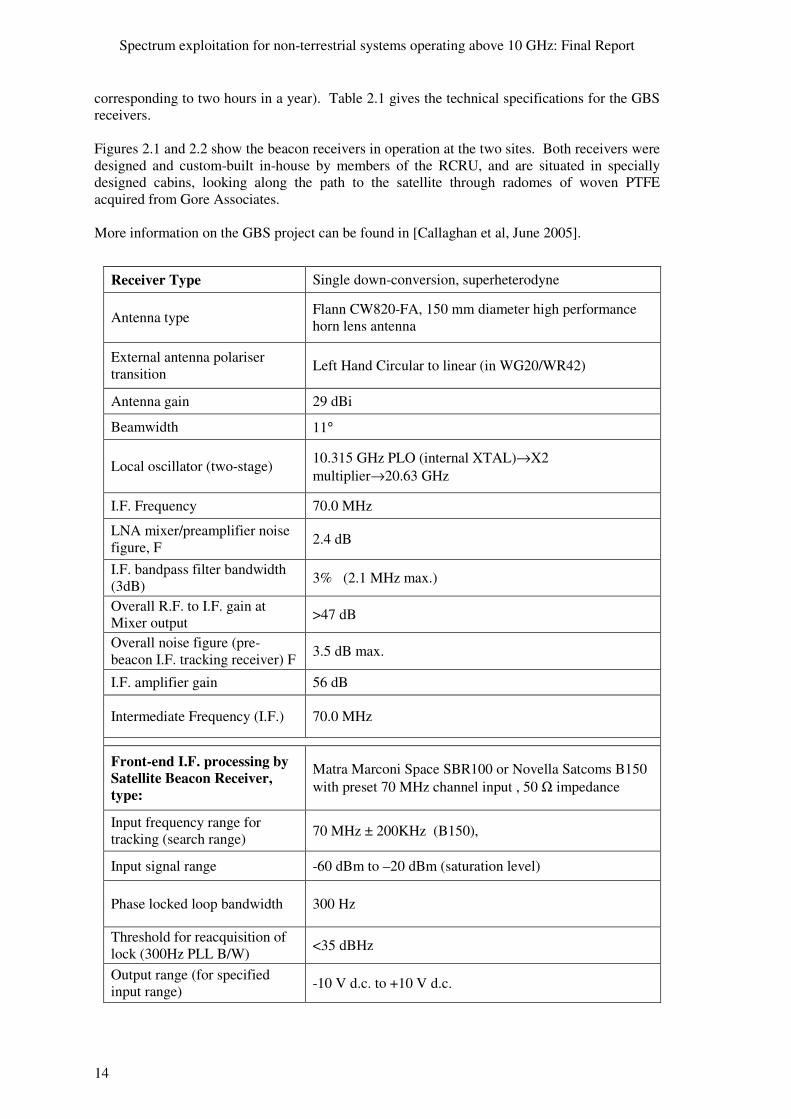
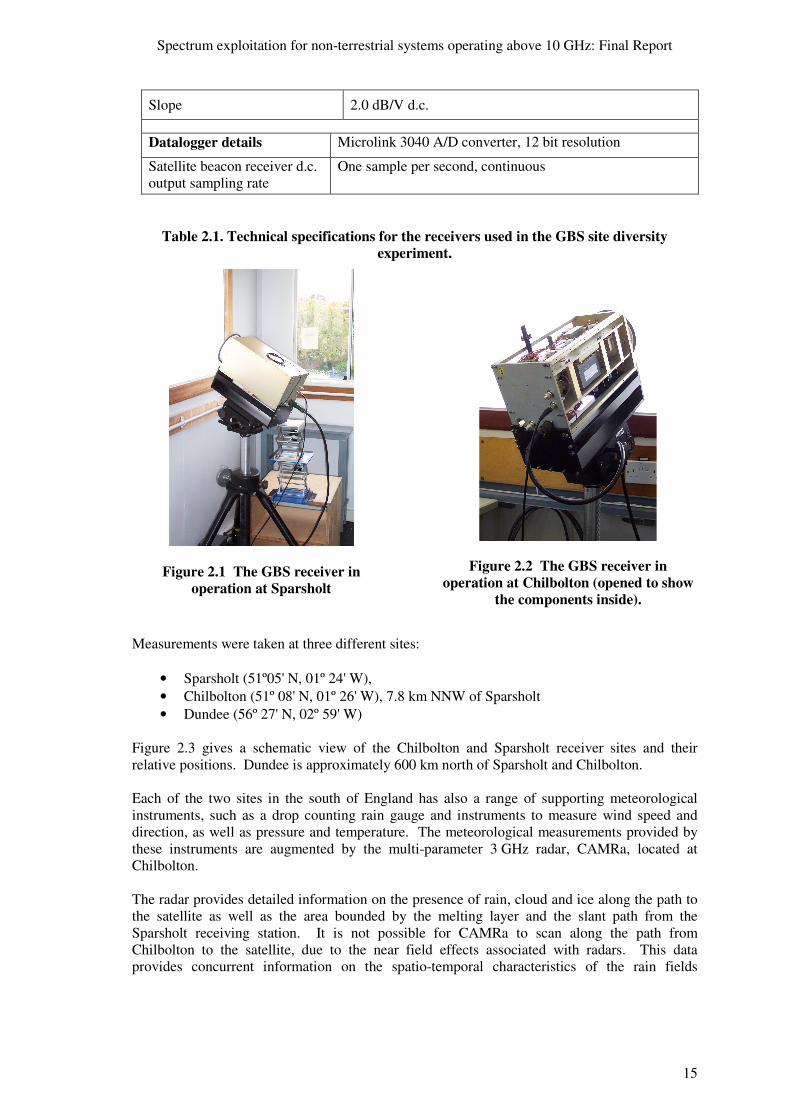
corresponding to two hours in a year). Table 2.1 gives the technical specifications for the GBS receivers. Figures 2.1 and 2.2 show the beacon receivers in operation at the two sites. Both receivers were designed and custom-built in-house by members of the RCRU, and are situated in specially designed cabins, looking along the path to the satellite through radomes of woven PTFE acquired from Gore Associates. More information on the GBS project can be found in [Callaghan et al, June 2005].
Receiver Type Single down-conversion, superheterodyne
Antenna type Flann CW820-FA, 150 mm diameter high performance horn lens antenna
External antenna polariser transition Left Hand Circular to linear (in WG20/WR42)
Antenna gain 29 dBi
Beamwidth 11°
Local oscillator (two-stage) 10.315 GHz PLO (internal XTAL)→X2 multiplier→20.63 GHz
I.F. Frequency 70.0 MHz
LNA mixer/preamplifier noise figure, F 2.4 dB
I.F. bandpass filter bandwidth (3dB) 3% (2.1 MHz max.)
Overall R.F. to I.F. gain at Mixer output >47 dB
Overall noise figure (pre-beacon I.F. tracking receiver) F 3.5 dB max.
I.F. amplifier gain 56 dB
Intermediate Frequency (I.F.) 70.0 MHz
Front-end I.F. processing by Satellite Beacon Receiver, type:
Matra Marconi Space SBR100 or Novella Satcoms B150 with preset 70 MHz channel input , 50 Ω impedance
Input frequency range for tracking (search range) 70 MHz ± 200KHz (B150),
Input signal range -60 dBm to –20 dBm (saturation level)
Phase locked loop bandwidth 300 Hz
Threshold for reacquisition of lock (300Hz PLL B/W) <35 dBHz
Output range (for specified input range) -10 V d.c. to +10 V d.c.
Spectrum exploitation for non-terrestrial systems operating above 10 GHz: Final Report
15
Slope 2.0 dB/V d.c.
Datalogger details Microlink 3040 A/D converter, 12 bit resolution
Satellite beacon receiver d.c. output sampling rate
One sample per second, continuous
Table 2.1. Technical specifications for the receivers used in the GBS site diversity experiment.
Figure 2.1 The GBS receiver in operation at Sparsholt
Figure 2.2 The GBS receiver in operation at Chilbolton (opened to show
the components inside).
Measurements were taken at three different sites:
• Sparsholt (51º05' N, 01º 24' W), • Chilbolton (51º 08' N, 01º 26' W), 7.8 km NNW of Sparsholt • Dundee (56º 27' N, 02º 59' W)
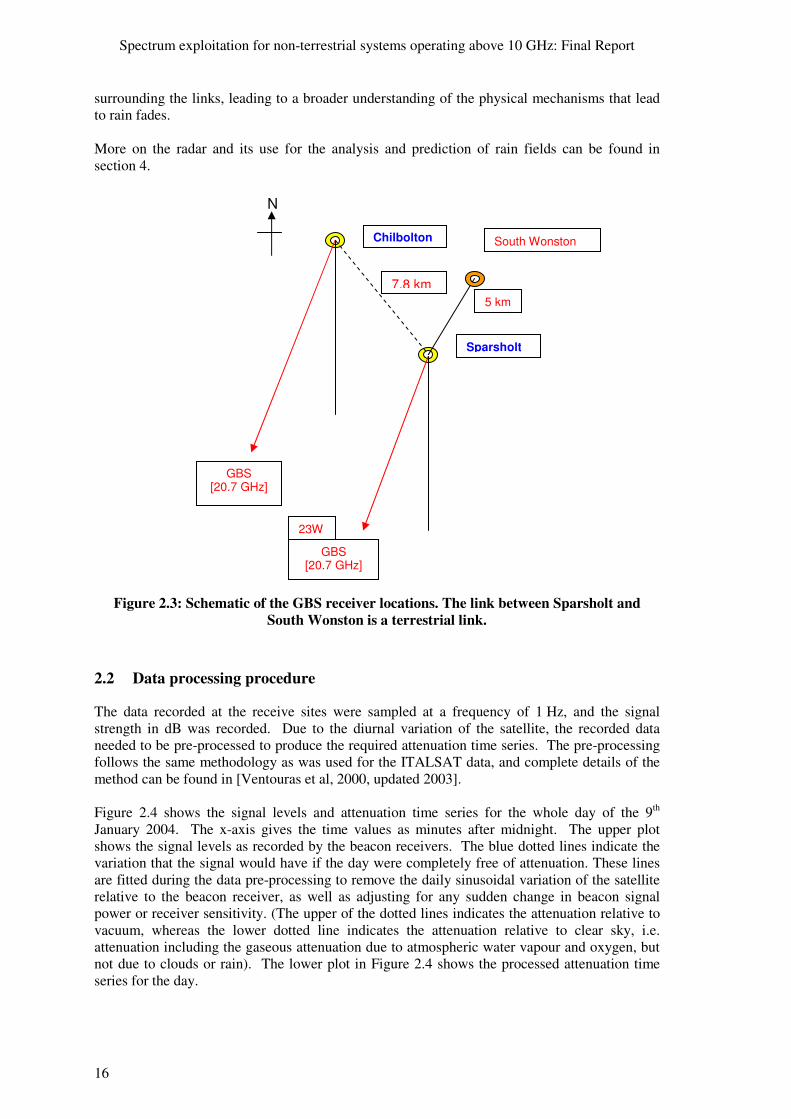
Figure 2.3 gives a schematic view of the Chilbolton and Sparsholt receiver sites and their relative positions. Dundee is approximately 600 km north of Sparsholt and Chilbolton. Each of the two sites in the south of England has also a range of supporting meteorological instruments, such as a drop counting rain gauge and instruments to measure wind speed and direction, as well as pressure and temperature. The meteorological measurements provided by these instruments are augmented by the multi-parameter 3 GHz radar, CAMRa, located at Chilbolton. The radar provides detailed information on the presence of rain, cloud and ice along the path to the satellite as well as the area bounded by the melting layer and the slant path from the Sparsholt receiving station. It is not possible for CAMRa to scan along the path from Chilbolton to the satellite, due to the near field effects associated with radars. This data provides concurrent information on the spatio-temporal characteristics of the rain fields
Spectrum exploitation for non-terrestrial systems operating above 10 GHz: Final Report
16
surrounding the links, leading to a broader understanding of the physical mechanisms that lead to rain fades. More on the radar and its use for the analysis and prediction of rain fields can be found in section 4.
Figure 2.3: Schematic of the GBS receiver locations. The link between Sparsholt and South Wonston is a terrestrial link.
2.2 Data processing procedure
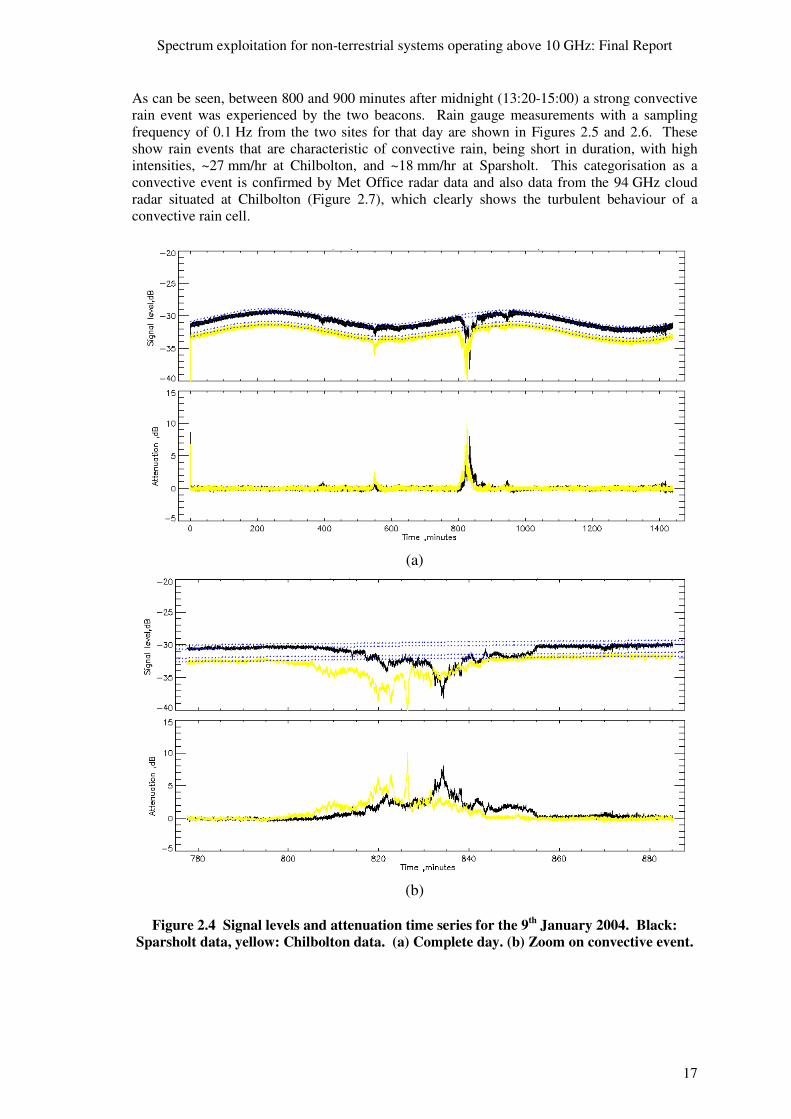
The data recorded at the receive sites were sampled at a frequency of 1 Hz, and the signal strength in dB was recorded. Due to the diurnal variation of the satellite, the recorded data needed to be pre-processed to produce the required attenuation time series. The pre-processing follows the same methodology as was used for the ITALSAT data, and complete details of the method can be found in [Ventouras et al, 2000, updated 2003]. Figure 2.4 shows the signal levels and attenuation time series for the whole day of the 9th January 2004. The x-axis gives the time values as minutes after midnight. The upper plot shows the signal levels as recorded by the beacon receivers. The blue dotted lines indicate the variation that the signal would have if the day were completely free of attenuation. These lines are fitted during the data pre-processing to remove the daily sinusoidal variation of the satellite relative to the beacon receiver, as well as adjusting for any sudden change in beacon signal power or receiver sensitivity. (The upper of the dotted lines indicates the attenuation relative to vacuum, whereas the lower dotted line indicates the attenuation relative to clear sky, i.e. attenuation including the gaseous attenuation due to atmospheric water vapour and oxygen, but not due to clouds or rain). The lower plot in Figure 2.4 shows the processed attenuation time series for the day.
Chilbolton
Sparsholt
GBS [20.7 GHz]
23W
7.8 km
GBS [20.7 GHz]
5 km
South Wonston
N
Spectrum exploitation for non-terrestrial systems operating above 10 GHz: Final Report
17
As can be seen, between 800 and 900 minutes after midnight (13:20-15:00) a strong convective rain event was experienced by the two beacons. Rain gauge measurements with a sampling frequency of 0.1 Hz from the two sites for that day are shown in Figures 2.5 and 2.6. These show rain events that are characteristic of convective rain, being short in duration, with high intensities, ~27 mm/hr at Chilbolton, and ~18 mm/hr at Sparsholt. This categorisation as a convective event is confirmed by Met Office radar data and also data from the 94 GHz cloud radar situated at Chilbolton (Figure 2.7), which clearly shows the turbulent behaviour of a convective rain cell.
(a)
(b)
Figure 2.4 Signal levels and attenuation time series for the 9th January 2004. Black: Sparsholt data, yellow: Chilbolton data. (a) Complete day. (b) Zoom on convective event.