spectrophotometric determination of tiemonium methyl sulfate
TRANSCRIPT

85
Spectrophotometric Determination of Tiemonium Methyl Sulfate, Itopride Hydrochloride and Trimebutine Maleate via Ion Pair Complex Formation and Oxidation Reaction
M. Ayad, M. El-Balkiny, M. Hosny*, Y. Metias
Department of Analytical Chemistry, Faculty of Pharmacy, Zagazig University, Zagazig 44519, Egypt.
Received 13th November 2015; Revised 21th November 2015; Accepted 28th December 2015
ABSTRACTTwo simple and precise spectrophotometric methods were developed for quantitative determination of tiemonium methyl sulfate (TIM), itopride hydrochloride (ITH), and trimebutine maleate (TRM) in both pure and pharmaceutical dosage forms. Method A: Based on oxidation of the studied drugs with ammonium vanadate in sulfuric acid medium resulting in greenish blue color measured at 773 nm for TIM, ITH and TRM. Method B: Involved formation of an ion pair complex between the studied drugs and rose bengal which were measured at 569, 573, 565 nm for TIM, ITH, and TRM, respectively in acetate buffered medium of pH 3.7 using methyl cellulose as a surfactant. The effect of different variables on the involved reactions and the color development were studied and optimized. Beer’s law was obeyed in the range of 20-220 µg ml−1, 3-16 µg ml−1 for TIM, 10-130 µg ml−1, 3-14 µg ml−1 for ITH and 30-170 µg ml−1, 2-12 µg ml−1 for TRM using Methods A and B. Results of the analysis were validated statistically by recovery studies.
Key words: Tiemonium, Itopride, Trimebutine, Vanadate, Rose bengal.
1. INTRODUCTIONTiemonium methyl sulfate or tiemonium methylsulfate (TIM), 4-[3-Hydroxy-3-phenyl-3-(2-thienyl)propyl]-4-methyl-morpholinium methyl sulfate, is quaternary ammonium antimuscarinics which are used in the relief of visceral spasms [1]. The drug is not included in any official pharmacopeias. From the literature survey, there were few methods had been reported for TIM determination using particle-induced X-ray emission [2] and ultraviolet (UV) spectroscopic methods [3] for TIM, its dosage forms and in the presence of its degradation products [4,5]. Chromatographic methods had been applied [6].
Itopride hydrochloride (ITH), N-{p-[2-(Dimethylamino) ethoxy]benzyl} veratramide hydrochloride with is a substituted benzamide with general properties similar to those of metoclopramide that has been used for its prokinetic and antiemetic actions [1]. Several spectrophotometric methods have been reported for estimation of ITH [7,8]. Ion-associate complexes - atomic emission spectrometry [9] and stability indicating spectrofluorimetry [10] had been involved in addition to electrochemical methods as aqueous potentiometric titration [11] and electrogenerated chemiluminescence [12]. High-
performance liquid chromatography (HPLC) methods were reported in the literature for determination of ITH in its pure form and pharmaceutical formulations [13,14]. High-performance thin layer chromatography methods were also developed [15].
Trimebutine maleate (TRM) is chemically known as (2RS)-2-(Dimethylamino)-2phenylbutyl 3,4,5-trimethoxybenzoate(Z)-butenedioate with molecular formula C26H33NO9=503.5 [16]. It has been used as an antispasmodic in the gastrointestinal tract and has indicated for the treatment of irritable bowel syndrome [1]. It can be determined in British Pharmacopoeia by non-aqueous titration using perchloric acid determining endpoint potentiometrically [16]. The literature search revealed different techniques for the analysis of TRM. Derivative spectrophotometry [17] and different reagents used for colorimetric determination of TRM such as cobalt(II)-thiocyanate, molybdenum(V)-thiocyanate [18], Bi(III)-iodide [19], and 2,3-dichloro-5,6-dicyano-1,4-benzoquinone, tetracyanoethylene, 7, 7, 8, 8-Tetracyanoquinodimethane [20] had been applied. Electrochemical methods were also included for its quantitation, e.g., stripping voltammetry [21] and conductometry [22]. Chromatographic methods
Indian Journal of Advances in
Chemical ScienceAvailable online at www.ijacskros.com
Indian Journal of Advances in Chemical Science 4(1) (2016) 85-97
*Corresponding Author: E-mail: [email protected]
Indian Journal of Advances in Chemical Science 4(1) (2016) 85-97
86
were used involving HPLC and capillary zone electrophoresis [23,24].
Ammonium vanadate was used as a reagent for titrimetric determination of some drugs in pure form in pharmaceutical formulations [25,26]. Flow injection assay of phenothiazine neuroleptics in pharmaceutical preparations [27].
Rose bengal had been used for many investigations via spectrofluorometric determination of certain quinolone [28], spectrophotometric methods through either ternary complex formations with certain antihistaminic drugs [29] or ion pair complex formation with clindamycin hydrochloride [30], diltiazem, fluphenazine and dothiepin hydrochloride [31], oxybuprocaine hydrochloride [32].
Few colorimetric methods were previously published for the assay of the cited drugs, in this paper two new and simple visible spectrophotometric methods were used for determination of the cited drugs based on oxidation of them using ammonium vanadate or ion pair formation using rose bengal. The proposed methods had been applied to the assay of these drugs in their dosage forms.
2. EXPERIMENTAL2.1. ApparatusA single cell holder JENWAY 6715 UV/visible spectrophotometer equipped with 10 mm matched quartz cells was employed for all absorbance measurements. Digital analyzer pH meter (USA) was used.
2.2. Chemicals and ReagentsAll solvents and reagents were of analytical reagent grade, bi-distilled water was used throughout the work.1. Samples were generously supplied by their
respective manufactures;• TIM (Adwia Pharmaceutical Industries Co.,
Cairo, Egypt). Its purity was found to be 99.9% as reported from the company
• ITH (Eva Pharma, Cairo, Egypt), its purity was found to be 99.99% according to the comparison method [7]
• TRM (Amoun Pharmaceutical Industries Co., Cairo, Egypt), its purity was found to be 100.0% as reported from the company.And were used as received without further treatment.
Purity tests were carried out by using reported and official methods and were found in the range of the reported value.
2. Ammonium vanadate (Sigma-Aldrich), 5% w/v solution, prepared by dissolving 5 g in 50% v/v sulfuric acid in boiling water bath until dissolve and diluting to 100 ml with the same solvent [30]
3.. Rose bengal (Acros Organics) was used as 0.25,
0.15, 0.1% w/v aqueous solutions for TIM, ITH and TRM, respectively
4. Sulfuric acid (98%) (El-NasrChemical Co., Egypt), 50 v/v sulfuric acid, acetone (99%), ethanol (98%) and methanol (98%) (El-Nasr Chemical Co., Egypt) were used
5. Lactose, sucrose, sodium chloride, silicon dioxide, starch, gum Arabic, magnesium stearate (El-Nasr Chemical Co., Egypt)
6. Methyl cellulose (Prolabo, France) prepared as 0.2% w/v for TIM and ITH, and 0.25 % w/v for TRM aqueous solutions by dissolving the appropriate amount in hot bi-distilled water (80°C) with stirring for 10 min, then chilled to 5°C for 30 min [25]
7. Acetate buffer of pH 3.7: Dissolve 10 g of anhydrous sodium acetate in 300 ml of water, adjust to pH 3.7 with glacial acetic acid and dilute to 1000 ml with water [16].
2.3. Pharmaceutical PreparationsThe following available commercial formulations are subjected to analytical procedure:1. Visceralgine® tablets, Batch No. 0513224 (Sedico
Pharmaceutical Company, Giza, Egypt) labeled to contain 50 mg TIM per tablet
2. Viscera® ampoules, Batch No. 122945 (Amoun Pharmaceutical Industries Co., Cairo, Egypt) labeled to contain 5 mg TIM per 2 ml
3. Garopride® tablets, Batch No. 211094 (Eva Pharma, Cairo, Egypt) labeled to contain 50 mg ITH per tablet
4. Tritone® tablets, Batch No. A24405 (Global Napi Pharmaceuticals, October, Egypt) labeled to contain 200 mg TRM per tablet.
2.4. Working Standard SolutionsFor Method A: Accurately weighed amounts 50, 50, 25 mg of TIM, TRM, and ITH, respectively were dissolved in 25 bi-distilled water in volumetric flasks to prepare 2 mg ml−1 TIM, TRM and 1 mg ml−1 ITH solutions.
For Method B: Aqueous solutions of 200 µg ml−1 of TIM, ITH, TRM were prepared by dissolving 10 mg of drug in 50 ml bi-distilled water in a volumetric flask.
2.5. General Procedures2.5.1. Method ATo different aliquots of working solutions 0.1-1.1 ml, 0.1-1.3 ml, 0.15-0.85 ml equivalent to 20-220 µg, 10-130 µg, and 30-170 µg of TIM, ITH, and TRM, respectively, 2.5 ml of 5% w/v ammonium vanadate was added followed by 3 ml of concentrated sulfuric acid in 10 ml volumetric flasks. The mixture was mixed well and boiled gently for 40 min in water bath, then cooled and diluted to final volume with cold bi-distilled water. Absorbance was measured at 773 nm for the cited drugs against blank (omitting the drug)
Indian Journal of Advances in Chemical Science 4(1) (2016) 85-97
87
and calibration graphs were prepared by plotting absorbance versus concentration of the drugs (Table 1).
2.5.2. Method BInto a series of 10 ml volumetric flasks, aliquots of working solutions 0.15-0.8 ml, 0.15-0.7 ml, 0.1-0.6 ml equivalent to 3-16 µg, 3-14 µg, 2-12 µg were transferred, then 1.5, 1, 1 ml of rose bengal were added followed by 0.4 ml, 0.5 ml, 0.5 ml of acetate buffer pH 3.7 and 0.8, 1.5, 1 ml of methylcellulose for TIM, ITH, and TRM, respectively. In the case of TRM sample was heated at 50°C for 5 min then cooled. Solutions were mixed well and completed to the mark with bi-distilled water. Absorbance was measured at 565, 569, 573 nm for TIM, ITH, and TRM, respectively against reagent blank treated similarly. Calibration graphs were prepared by plotting absorbance versus concentration of the drugs (Table 2).
2.6. Procedures for Pharmaceutical Preparations2.6.1. For Method A2.6.1.1. Procedures for tabletsAbout 10 tablets of analyzed drugs were weighed, grounded into fine powder then amounts equivalent to (20 mg) for TIM, TRM and (10 mg) for ITH were accurately weighed and extracted with bi-distilled water for TRM and with methanol for TIM, ITH followed by filtration after good shaking, washing the residue several times with the same solvent. In the case of methanol, filtrates of TIM, ITH were evaporated, and residue of the drug was dissolved with 10 ml bi-distilled water. Volumes were completed to the mark with bi-distilled water in 10 ml volumetric flasks.
2.6.1.2. Procedures for Ampoule8 ml of Viscera ampoules containing 20 mg of TIM salt were quantitatively transferred into 60 ml
separating funnel, add 5 ml saturated NaOH solution to get base free which was extracted with (3 × 10) ml portions of chloroform after shaking well for 2 min each time. Evaporate the extracted organic solvent, the residue was dissolved in 0.5 ml of 1 M H2SO4 and complete to 10 ml with bi-distilled water in the volumetric flask.
The general procedure was followed, and recovery experiments were performed by standard addition technique as an additional check on the accuracy of the proposed method.
2.6.2. For Method B2.6.2.1. Procedures for tabletsAn accurately weighed quantity of 10 pulverized tablets equivalent to 10 mg for TIM, TRM and ITH were transferred into 50 ml volumetric flasks and were shaken with 20 ml distilled water for the cited drugs then filtered with washing the residue several times with the same solvent. The volumes were completed to the mark with bi-distilled water, and the general procedure was followed:
2.6.2.2. Procedures for ampouleAbout 2 ml of Viscera ampoules equivalent to 5 mg of TIM was transferred into 25 ml volumetric flask and completed to the mark with bi-distilled water.
The assay was completed as under general procedure by applying standard addition technique.
3. RESULT AND DISCUSSION3.1. Method AThe principle of this spectrophotometric method depends on oxidation of analyzed drugs with ammonium vanadate in sulfuric acid medium
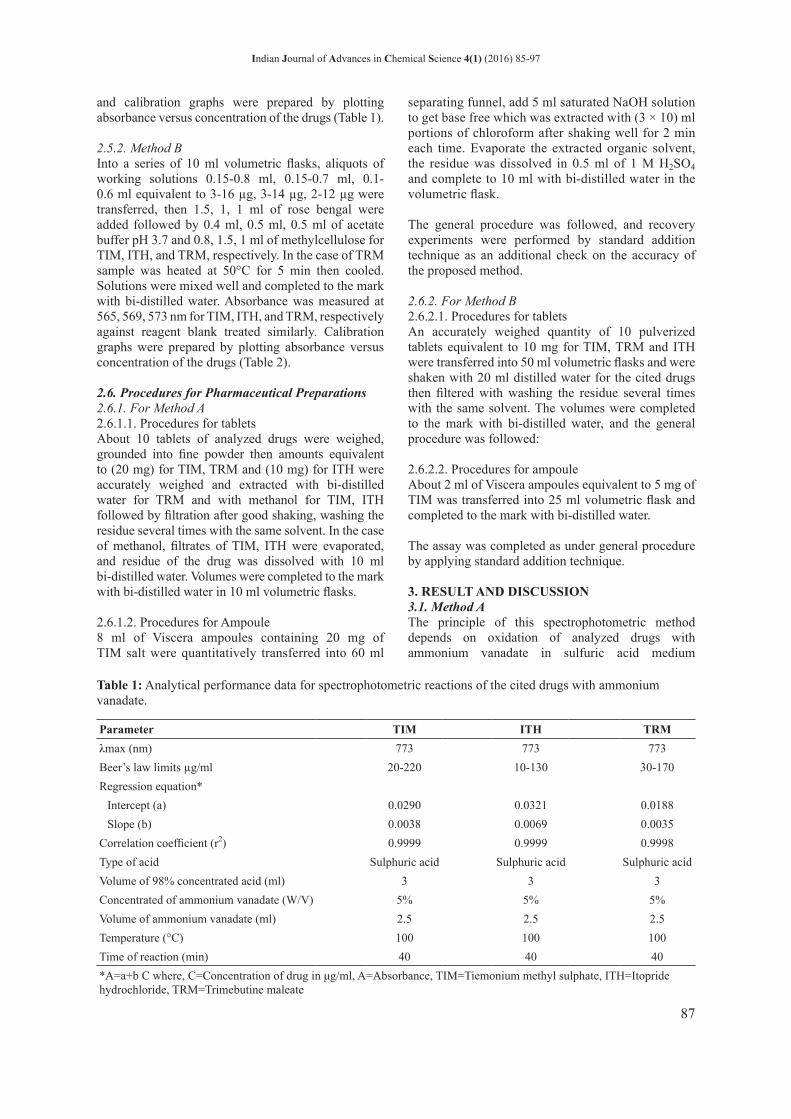
Table 1: Analytical performance data for spectrophotometric reactions of the cited drugs with ammonium vanadate.
Parameter TIM ITH TRMλmax (nm) 773 773 773Beer’s law limits µg/ml 20-220 10-130 30-170Regression equation*
Intercept (a) 0.0290 0.0321 0.0188Slope (b) 0.0038 0.0069 0.0035
Correlation coefficient (r2) 0.9999 0.9999 0.9998Type of acid Sulphuric acid Sulphuric acid Sulphuric acidVolume of 98% concentrated acid (ml) 3 3 3Concentrated of ammonium vanadate (W/V) 5% 5% 5%Volume of ammonium vanadate (ml) 2.5 2.5 2.5Temperature (°C) 100 100 100Time of reaction (min) 40 40 40*A=a+b C where, C=Concentration of drug in μg/ml, A=Absorbance, TIM=Tiemonium methyl sulphate, ITH=Itopride hydrochloride, TRM=Trimebutine maleate

Indian Journal of Advances in Chemical Science 4(1) (2016) 85-97
88
resulting in the development of greenish blue color, which appeared after dilution with bi-distilled water, quantitatively measured at 773 nm for TIM, TRM, and ITH (Figure 1) which was attributed to the vanadium (IV) produced by reduction of vanadium (V) by the selected drugs.
VO2+ + 2H+ + e- → Vo2+ + H2O
Schemes 1-3 show the possible reaction products as predicted from the literature reports and the results of the present work.
3.1.1. Optimization of the reaction conditionsInvestigations were carried out for both methods by changing one variable while keeping the others
Table 2: Analytical performance data for spectrophotometric reactions of the cited drugs with rose bengal.
Parameter TIM ITH TRMλmax (nm) 569 573 565Beer’s law limits µg/ml 3-16 3-14 2-12Regression equation*
Intercept (a) −0.0204 −0.0948 −0.0064Slope (b) 0.0533 0.0653 0.0606
Correlation coefficient (r2) 0.9998 0.9999 0.9999Concentrated of rose Bengal (W/V) 0.25% 0.15% 0.1%Volume of rose Bengal (ml) 1 1.5 1Type of surfactant Methyl cellulose Methyl cellulose Methyl celluloseConcentrated of surfactant (W/V) 0.2% 0.2% 0.25%Volume of surfactant (ml) 0.8 1.5 1pH and type of buffer Acetate buffer 3.7 Acetate buffer 3.7 Acetate buffer 3.7Volume of buffer (ml) 0.4 0.5 0.5Temperature (°C) RT RT 50Reaction time (min) Immediately Immediately -Heating time (min) - - 5Diluting solvent Bi-distilled water*A=a+b C where, C=Concentration of drug in μg/ml, A=Absorbance, TIM=Tiemonium methyl sulphate, ITH=Itopride hydrochloride, TRM=Trimebutine maleate
Figure 1: Absorption spectra of: (a) The cited drugs alone, (b) blank solution and reaction of ammonium vanadate in prescence of sulphuric acid with, (c) 1 ml of 1 mg ml−1 itopride hydrochloride, (d) 0.8 ml of 2 mg ml−1 tiemonium methyl sulphate, (e) 0.4 ml of 2 mg ml−1 trimebutine maleate.
Scheme 1: The possible reaction products of oxidation of tiemonium methyl sulphate.
Scheme 2: The possible reaction products of oxidation of itopride HCl.

Indian Journal of Advances in Chemical Science 4(1) (2016) 85-97
89
constant through a series of experiments to establish the optimum analytical conditions.
3.2. For Method A3.2.1. Effect of reagent concentration and volume2.5 ml of 5% w/v ammonium vanadate was the most suitable concentration for carrying out the assay.
3.2.2. Effect of different acids, concentration and volume of sulfuric acidIt was found that reaction occurred only in a strong acidic medium. Several concentrated acids (nitric, hydrochloric [34%], acetic and sulfuric acids) and without addition more acids were tested. It was found that 3 ml of concentrated sulfuric acid (98%) was preferred because it gave the most intense and stable colored products with distinct maximum in all studied drug concentrations.
3.2.3. Effect of temperature, heating time, and stabilityThe effect of temperature and heating time were studied in the range of 25, 60, 80, 100°C and heating time from 5 to 60 min, maximum absorbance was found at 100°C min in water bath with 40 min heating time. The obtained color was stable for at least 1 h for all drugs at room temperature (25°C±2) which exhibited no absorbance change for an hour.
3.2.4. Effect of order of addition of reactantsThe sequence of addition of reactants can influence the formation of colored product. Three procedures with different orders of components addition were examined, the most suitable sequence was (sulfuric acid, ammonium vanadate then drug) for (II) and (III) but drug (I) show this sequence (drug, ammonium vanadate then sulfuric acid) for the production of the highest color intensity.
3.3. For Method BAcidic dyes were widely used for colorimetric determination of several pharmaceutical compounds with different chemical structures having a basic nitrogen atom. The proposed method is based on binary complex formation between the studied drugs and rose bengal, these complexes were probably formed via electrostatic interaction between the most basic center of the drug molecule and the anionic center of the dye in acidic buffered solution at pH 3.7 to give pink color which exhibit maximum absorption at 569, 573, 565 nm for TIM, ITH, and TRM, respectively, (Figures 2-4). For example, it was found that the reaction proceeds in the ratio of 1:1 of TRM to rose bengal as it has one basic center (amino group) which allow to interact with the carboxylate anion of the dye and the proposed mechanism of the reaction pathway is shown in Schemes 4-6.
Because of the water insolubility of the formed ion pair associate, it is usually extracted with an organic
Figure 2: Absorption spectrum 0.5 ml of 200 µg ml−1 tiemonium methyl sulphate (...), 1 ml of 0.25% rose bengal (− − −) and mixture of them (—).
Figure 3: Absorption spectrum 0.7 ml of 200 µg ml−1 itopride hydrochloride (...), 1.5 ml of 0.15% rose bengal (− − −) and mixture of them (—).
Scheme 3: The possible reaction products of oxidation of trimebutine maleate.
solvent such as chloroform. The extraction steps have some difficulties arising from incomplete extraction and emulsions formation between the two immiscible layers, furthermore; it is time-consuming.
In this work, the water solubility of the formed complex is greatly enhanced by the addition of a surfactant. This enables the direct measurements in the aqueous

Indian Journal of Advances in Chemical Science 4(1) (2016) 85-97
90
solution without the need for extraction steps. All reactions variables were studied to achieve complete reactions formation with maximum sensitivity and highest stability.1. Effect of pH on the ion-pair formations: In order
to establish the optimum pH value for each ion
pair formed, different buffers as acetate, citro-phosphate and borate buffer with different pH (2.8-9.6) as well as ethanolic ace ammonia buffer pH (3.7) [1] were tried. PH (3.7) of acetate buffer gave the highest absorbance values. Hence, 0.5, 0.5, and 0.4 ml of acetate buffer of pH (3.7) were convenient for TIM, ITH, and TRM, respectively.
2. Effect of rose bengal concentration and volume: Using 1 ml of 0.25, 0.1% w/v of rose bengal for TIM, TRM respectively and using 1.5 ml of 0.15% w/v of rose bengal for ITH were enough for maximum color intensity.
3. Effect of surfactant type, concentration and volume: As surfactant increase solubility of ion pair formed, various dispersing agents were studied for example cationic surfactant, e.g., cetrimide, anionic surfactant e.g. sodium lauryl sulfate and non-ionic one as tween 80 and methylcellulose. It was found that 0.8, 1.5 ml of 0.2% w/v of methyl cellulose gave maximum absorbance for TIM, ITH, while 1 ml of 0.25% w/v was convenient for and TRM.
4. Effect of temperature, time and stability: Maximum color intensity was attained immediately at 25°C for TIM, ITH while TRM need 5 min of heating on water bath at 50°C. The intensities of the produced colors were found to be stable for more than 1 h.
5. Effect of diluting solvent: Different diluting solvents were tried as bi-distilled water, acetone, methanol, and ethanol; results indicate that bi-distilled water was the most suitable diluting solvent.
6. Effect of order of addition: The sequence of addition of the constituents of the complex was studied. The most suitable order was drug, methylcellulose, buffer and rose bengal for all drugs.
3.3.1. Stoichiometric relationshipThe molar ratios of the complexes formed between the studied drugs and rose bengal were investigated by applying continuous variation (Job’s) method [33] using non-extractive method and Molar ratio method [34]
Figure 4: Absorption spectrum 0.2 ml of 200 µg ml−1 trimebutine maleate (...), 1 ml of 0.1% rose bengal (− − −) and mixture of them (—).
Scheme 4: The proposed mechanism of the reaction pathway between tiemonium methyl sulphate and rose Bengal.
Scheme 5: The proposed mechanism of the reaction pathway between itopride and rose Bengal.
Scheme 6: The proposed mechanism of the reaction pathway between trimebutine maleate and rose bengal.

Indian Journal of Advances in Chemical Science 4(1) (2016) 85-97
91
using extractive method. Job’s method was applied on equimolar (3 × 10⁻⁴ and 10−4 M) solutions of TIM and TRM, respectively, and rose bengal of the same molarities. Results indicated the existence of (1:1) ion-pair complexes for TIM, TRM. Molar ratio method on equimolar (10−3 M) solutions of TIM, TRM and rose bengal of the same molarity gave the same results which confirmed the existence of an (1:1) ion-pair complexes for TIM, TRM. On applying Job’s method on equimolar (2 × 10⁻⁴) solution of ITH complex and rose bengal, ITH to rose bengal complex was formed in the ratio of 2:3. While applying molar ratio method using equimolar (9 × 10⁻⁴) solution of ITH and rose bengal, the complex was formed in the ratio of 1:1 which was most suitable for an explanation of complex formation in regarding to its stoichiometry. This difference in the result concerned ITH might be due to the interference of the methyl cellulose, with chemical formula [C6H7O2(OH)x(OCH3 y]n, as ITH (Scheme 5) is bulky and planar while TIM, TRM (Schemes 4 and 6) are bulky but branched so their structures hindered their formation of intermolecular hydrogen bond with methyl cellulose.
3.4. Methods ValidationThe validity of the proposed methods were checked by testing linearity, sensitivity, limit of detection (LOD), limit of quantification (LOQ) accuracy, precision and selectivity according to ICH guidelines [35].
3.4.1. LinearityUnder the optimum conditions described, calibration curves for determination of TIM, ITH, and TRM by the proposed methods were constructed by plotting absorbance against concentrations of the drugs. Beer’s law plots were linear with small intercepts and good correlation coefficients indicating good linearity over the working concentration ranges. The regression equations for the results derived using the least-squares method and statistical analysis of data for each drug were listed in Tables 3 and 4.
3.4.2. SensetivityThe LOD was determined by evaluating the lowest amount of the analyte which can be detected but not necessarily quantitated as exact value and the LOQ, LOQ, is the lowest amount of the analyte which can be quantitatively determined with suitable accuracy and precision. LOD and LOQ were evaluated using the following equation according to the ICH:
LODs
= 3 3. LOQ 1s
= 0
Where, σ = the standard deviation of replicate blank responses (under the same conditions as for sample analysis), and S = the slope of the calibration curve.
Table 3: Assay results for determination of the cited drugs (authentic) with ammonium vanadate.
Parameters Method ATIM ITH TRM
Taken µg/ml
Found µg/ml
Recovery* %
Taken µg/ml
Found µg/ml
Recovery* %
Taken µg/ml
Found µg/ml
Recovery* %
20 19.74 98.68 10 9.84 98.41 30 29.49 98.2940 40.53 101.32 30 29.70 98.99 40 38.91 97.29100 99.74 99.74 50 50.42 100.84 80 80.34 100.43160 160.79 100.49 100 98.97 98.97 120 117.77 98.14200 198.42 99.21 110 109.99 99.99 140 138.06 98.61220 221.32 100.60 130 129.55 99.65 160 157.49 98.43
170 168.06 98.86Mean±SD 100.01±0.975 99.47±0.871 98.58±0.955N 6 6 7RSD 0.975 0.876 0.969SE 0.398 0.356 0.361Variance 0.951 0.759 0.912Slope 0.0038 0.0069 0.0035
LOD µg/ml 6.460 3.050 9.596
LOQ µg/ml 19.575 9.242 29.079
ε(×103)** L.Mol−1.cm−1 1.779 2.946 1.850
*Average of three different determinations, **Apparent molar absorptivity was calculated on the basis of the molecular weight of the drug. SD=Standard deviation, RSD=Relative standard deviation, SE=Standard error, LOD=Limit of detection, LOQ=Limit of quantification, TIM=Tiemonium methyl sulphate, ITH=Itopride hydrochloride, TRM=Trimebutine maleate

Indian Journal of Advances in Chemical Science 4(1) (2016) 85-97
92
Table 5: Statistical analysis of results obtained by the proposed methods compared with reported and official methods.
Drug Proposed methods Comparison methodParameters Method A Method B
TIM Mean±SD 100.01±0.975 100.02±0.978 100.22±0.964Variance 0.951 0.957 0.930N 6 6 6Student’s t-test 0.375 (2.228)* 0.357 (2.228)* -F-test 1.023 (5.05)* 1.029 (5.05)* -
ITH Mean±SD 99.47±0.871 100.06±0.986 99.99±0.844Variance 0.759 0.972 0.712N 6 6 6Student’s t-test 1.050 (2.228)* 0.132 (2.228)* -F-test 1.066 (5.05)* 1.365 (5.05)* -
TRM Mean±SD 98.58±0.955 100.18±0.915 99.91±0.585Variance 0.912 0.837 0.342N 7 6 3Student’s t-test 2.197 (2.306)* 0.458 (2.305)* -F-test 2.667 (5.14)* 2.447 (5.79)* -
The corresponding theoretical values for t and F tests at p=0.05. SD=Standard deviation, SE=Standard error, TIM=Tiemonium methyl sulphate, ITH=Itopride hydrochloride, TRM=Trimebutine maleate
LODs and LOQs were calculated as in Tables 3 and 4. The results indicated the sensitivity of the proposed
methods as rose bengal gave relatively higher sensitivities than ammonium vanadate.
Table 4: Assay results for the determination of the cited drugs (authentic) with rose Bengal.
Parameters Method BTIM ITH TRM
Taken µg/ml
Found µg/ml
Recovery* %
Taken µg/ml
Found µg/ml
Recovery* %
Taken µg/ml
Found µg/ml
Recovery* %
3 3.01 100.31 3 3.04 101.48 2 2.04 101.824 3.95 98.69 5 4.93 98.56 3 3.01 100.335 5.02 100.34 7 7.04 100.59 4 3.98 99.596 6.09 101.44 10 9.95 99.51 6 5.95 99.1210 9.91 99.14 12 12.02 100.15 10 10.01 100.0716 16.03 100.19 14 14.01 100.07 12 12.02 100.17
Mean±SD 100.02±0.978 100.06±0.986 100.18±0.915N 6 6 6RSD 0.978 0.985 0.913SE 0.399 0.403 0.374Variance 0.957 0.972 0.837Slope 0.0533 0.0653 0.0606LOD (µg/ml) 0.884 0.940 0.561LOQ (µg/ml) 2.678 2.849 1.699ε(×104)** L.Mol−1.cm−1 1.958 2.0795 2.976*Average of three different determinations. **Apparent molar absorptivity was calculated on the basis of the molecular weight of the drug. SD=Standard deviation, RSD=Relative standard deviation, SE=Standard error, LOD=Limit of detection, LOQ=Limit of quantification, TIM=Tiemonium methyl sulphate, ITH=Itopride hydrochloride, TRM=Trimebutine maleate

Indian Journal of Advances in Chemical Science 4(1) (2016) 85-97
93
3.4.3. Accuracy and precision3.4.3.1. AccuracyThe accuracy of the proposed methods was ascertained by determining pure samples of the cited drugs with reported methods. Statistical analysis of the results obtained by the proposed and comparison methods [3,7,17] showed that the calculated values did not exceed the theoretical ones which indicated no significant differences found between the proposed methods and comparison methods. Statistical comparison of the results was performed using Student’s t-test and variance ratio F-test at 95% confidence level (Table 5).
3.4.3.2. PrecisionIntra-day precision: To determine intra-day precision (repeatability) of the proposed methods, solutions containing four different concentrations (within working ranges) of each drug in its pure form were prepared and analyzed by proposed methods on four successive times in the same day. The values of relative standard deviation were calculated, and Percentages relative error (Er%) of the suggested methods were also calculated using the following equation:
Er% = [(found − added)/added] × 100
Table 6: Precision data for the determination of cited drugs by the proposed methods.
Intra-day Inter-dayAdded (µg/ml) Found±SE (µg/ml) RSD % Er % Found±SE (µg/ml) RSD % Er %Method A
TIM20 19.67±0.329 0.669 −1.64 19.61±0.380 0.775 −1.9740 39.67±0.493 0.995 −0.82 40.66±0.425 0.836 1.6460 60.99±0.375 0.737 1.64 61.12±0.415 0.815 1.86200 196.58±0.501 1.020 −1.71 196.32±0.483 0.985 −1.84
ITH30 29.77±0.463 0.932 −0.77 29.77±0.503 1.013 −0.7750 49.48±0.451 0.911 −1.04 50.38±0.493 0.979 0.77100 98.83±0.145 0.293 −1.17 98.50±0.471 0.956 −1.50110 109.37±0.400 0.805 −0.57 109.62±0.483 0.969 −0.34
TRM30 30.13±0.456 0.908 0.43 29.41±0.456 0.930 −1.9540 40.34±0.292 0.578 0.86 39.63±0.461 0.931 −0.9360 61.13±0.270 0.701 1.88 60.56±0.491 0.973 0.9380 81.27±0.446 0.879 1.59 80.34±0.437 0.871 0.43
Method BTIM
3 2.95±0.442 0.898 −1.56 2.98±0.469 0.945 −0.784 3.94±0.488 0.992 −1.55 3.94±0.488 0.992 −1.555 5.08±0.242 0.477 1.65 4.93±0.496 1.006 −1.3510 10.03±0.354 0.706 0.31 9.87±0.379 0.768 −1.33
ITH7 6.93±0.467 0.944 −1.00 6.99±0.413 0.827 −0.1210 9.99±0.470 0.941 −0.11 10.07±0.488 0.969 0.7412 12.03±0.486 0.969 0.28 12.00±0.401 0.803 −0.0114 14.02±0.490 0.978 0.15 14.08±0.490 0.974 0.59
TRM4 3.98±0.429 0.862 −0.41 3.97±0.429 0.866 −0.835 4.92±0.493 1.002 −1.60 5.09±0.495 0.973 1.786 5.97±0.494 0.994 −0.54 5.91±0.132 0.267 −1.5010 10.09±0.429 0.850 0.89 10.17±0.497 0.977 1.67
RSD=Relative standard deviation, SE=Standard error, TIM=Tiemonium methyl sulphate, ITH=Itopride hydrochloride, TRM=Trimebutine maleate
Indian Journal of Advances in Chemical Science 4(1) (2016) 85-97
94
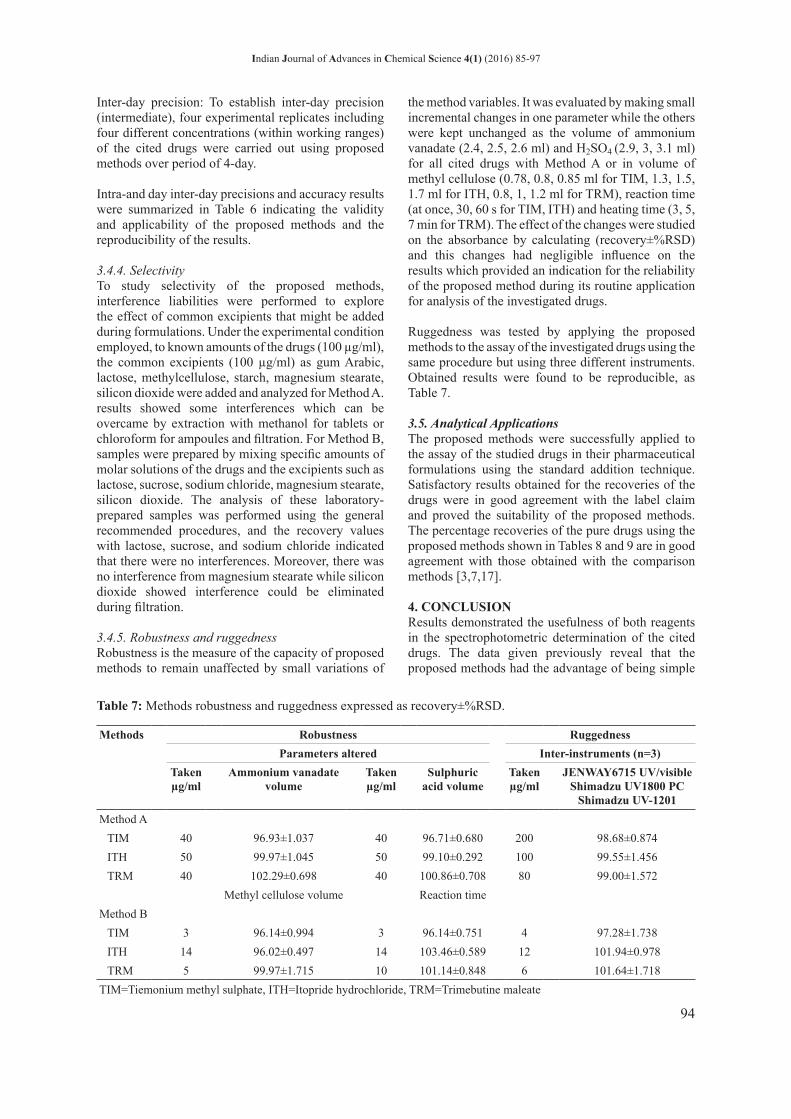
Table 7: Methods robustness and ruggedness expressed as recovery±%RSD.
Methods Robustness RuggednessParameters altered Inter-instruments (n=3)
Taken µg/ml
Ammonium vanadate volume
Taken µg/ml
Sulphuric acid volume
Taken µg/ml
JENWAY6715 UV/visible Shimadzu UV1800 PC
Shimadzu UV-1201Method A
TIM 40 96.93±1.037 40 96.71±0.680 200 98.68±0.874ITH 50 99.97±1.045 50 99.10±0.292 100 99.55±1.456TRM 40 102.29±0.698 40 100.86±0.708 80 99.00±1.572
Methyl cellulose volume Reaction timeMethod B
TIM 3 96.14±0.994 3 96.14±0.751 4 97.28±1.738ITH 14 96.02±0.497 14 103.46±0.589 12 101.94±0.978TRM 5 99.97±1.715 10 101.14±0.848 6 101.64±1.718
TIM=Tiemonium methyl sulphate, ITH=Itopride hydrochloride, TRM=Trimebutine maleate
Inter-day precision: To establish inter-day precision (intermediate), four experimental replicates including four different concentrations (within working ranges) of the cited drugs were carried out using proposed methods over period of 4-day.
Intra-and day inter-day precisions and accuracy results were summarized in Table 6 indicating the validity and applicability of the proposed methods and the reproducibility of the results.
3.4.4. SelectivityTo study selectivity of the proposed methods, interference liabilities were performed to explore the effect of common excipients that might be added during formulations. Under the experimental condition employed, to known amounts of the drugs (100 µg/ml), the common excipients (100 µg/ml) as gum Arabic, lactose, methylcellulose, starch, magnesium stearate, silicon dioxide were added and analyzed for Method A. results showed some interferences which can be overcame by extraction with methanol for tablets or chloroform for ampoules and filtration. For Method B, samples were prepared by mixing specific amounts of molar solutions of the drugs and the excipients such as lactose, sucrose, sodium chloride, magnesium stearate, silicon dioxide. The analysis of these laboratory-prepared samples was performed using the general recommended procedures, and the recovery values with lactose, sucrose, and sodium chloride indicated that there were no interferences. Moreover, there was no interference from magnesium stearate while silicon dioxide showed interference could be eliminated during filtration.
3.4.5. Robustness and ruggednessRobustness is the measure of the capacity of proposed methods to remain unaffected by small variations of
the method variables. It was evaluated by making small incremental changes in one parameter while the others were kept unchanged as the volume of ammonium vanadate (2.4, 2.5, 2.6 ml) and H2SO4 (2.9, 3, 3.1 ml) for all cited drugs with Method A or in volume of methyl cellulose (0.78, 0.8, 0.85 ml for TIM, 1.3, 1.5, 1.7 ml for ITH, 0.8, 1, 1.2 ml for TRM), reaction time (at once, 30, 60 s for TIM, ITH) and heating time (3, 5, 7 min for TRM). The effect of the changes were studied on the absorbance by calculating (recovery±%RSD) and this changes had negligible influence on the results which provided an indication for the reliability of the proposed method during its routine application for analysis of the investigated drugs.
Ruggedness was tested by applying the proposed methods to the assay of the investigated drugs using the same procedure but using three different instruments. Obtained results were found to be reproducible, as Table 7.
3.5. Analytical ApplicationsThe proposed methods were successfully applied to the assay of the studied drugs in their pharmaceutical formulations using the standard addition technique. Satisfactory results obtained for the recoveries of the drugs were in good agreement with the label claim and proved the suitability of the proposed methods. The percentage recoveries of the pure drugs using the proposed methods shown in Tables 8 and 9 are in good agreement with those obtained with the comparison methods [3,7,17].
4. CONCLUSIONResults demonstrated the usefulness of both reagents in the spectrophotometric determination of the cited drugs. The data given previously reveal that the proposed methods had the advantage of being simple

Indian Journal of Advances in Chemical Science 4(1) (2016) 85-97
95
Table 8: Application of standard addition technique for determination of the cited drugs through reaction with ammonium vanadate.
TIM ITH TRMVisceralgine® tablets Viscera® ampoules Garopride® tablets Tritone® tablets
Taken µg/ml
Added µg/ml
Recovery* %
Taken µg/ml
Added µg/ml
Recovery* %
Taken µg/ml
Added µg/ml
Recovery* %
Taken µg/ml
Added µg/ml
Recovery* %
40 - 104.61 40 - 95.39 20 - 102.10 40 - 97.2920 101.32 40 96.71 20 99.93 30 98.29100 103.42 60 96.05 30 100.43 60 99.62120 102.85 80 97.70 40 100.33 80 97.93160 101.64 90 95.61 60 98.77 90 97.84
90 98.37 130 99.82Mean±SD 102.31±0.993 96.52±0.906 99.57±0.938 98.70±0.950N 4 4 5 5SE 0.993 0.453 0.420 0.388V 0.986 0.821 0.880 0.903*Mean of three different experiments. SD=Standard deviation, SE=Standard error, TIM=Tiemonium methyl sulphate, ITH=Itopride hydrochloride, TRM=Trimebutine maleate
in terms of simplicity and applicability to analysis of drugs in their pharmaceutical dosage forms with good accuracy and precision. Moreover, it does not require various elaborate treatment or tedious extraction procedures.
5. REFERENCES1. S. C. Sweetman, (2011) Martindale-The
Complete Drug Reference. 37th ed. London: Pharmaceutical Press, p2642,1889,1932.
2. A. Bejjani, B. Nsouli, K. Zahraman, S. Assi,
Table 9: Application of standard addition technique for determination of the cited drugs through reaction with rose bengal.
TIM ITH TRMVisceralgine® tablets Viscera® ampoules Garopride® tablets Tritone® tablets
Taken µg/ml
Added µg/ml
Recovery* %
Taken µg/ml
Added µg/ml
Recovery* %
Taken µg/ml
Added µg/ml
Recovery* %
Taken µg/ml
Added µg/ml
Recovery* %
3 - 97.19 3 - 99.44 4 - 99.08 3 - 96.204 96.34 6.6 97.41 5 98.25 3 97.85
8.6 96.51 10.4 96.05 5.4 99.77 4 97.3211 97.63 12.4 98.63 6.4 100.21 9 98.99
11.4 96.51 12.6 96.61 8 100.08 10 99.6512.6 97.74 13 96.68 8.4 100.42 11 99.2913 96.90 10 100.28
Mean±SD 96.94±0.607 97.08±0.994 99.83±0.804 98.62±0.993N 6 5 6 5SE 0.248 0.445 0.328 0.444V 0.369 0.988 0.647 0.985*Mean of three different experiments. SD=Standard deviation, SE=Standard error, TIM=Tiemonium methyl sulphate, ITH=Itopride hydrochloride, TRM=Trimebutine maleate
G. Younes, F. Yazbi, (2011) Swift quantification of fenofibrate and tiemonium methylsulfate active ingredients in solid drugs using particle induced X-Ray emission, Advanced Materials Research, 324: 318-323.
3. S. Islam, Md. Wahiduzzaman, S. Islam, Md. Rafiquzzaman, S. K. Kundu, (2014) UV spectroscopic method for estimation of tiemonium methylsulfate 50 MG tablet in bulk and pharmaceutical preparations, International Journal of Pharmaceutical Sciences and

Indian Journal of Advances in Chemical Science 4(1) (2016) 85-97
96
Research, 5: 548-555.4. H. E. Zaazaaa, S. S. Abbasa, Z. A. EL-Sherifb,
B. El-Zeanya, D. A. ELـHaddadb, (2014) Stability indicating spectrophotometric methods for determination of Tiemonium methylsulphate in the presence of its degradation products, Journal of Applied Pharmaceutical Science, 4: 033-045.
5. N. K. Ramadan, L. M. Abd El Halim, H. F. EL Sanabary, M. Y. Salem, (2014) Stability indicating spectrophotometric methods for the determination of tiemonium methylsulphate, International Journal of Drug Development and Research, 6: 160-168.
6. N. K. Ramadan, L. M. Abd El Halim, H. F. EL Sanabary, M. Y. Salem, (2014) Stability indicating chromatographic methods for the determination of tiemonium methylsulphate, International Journal of Advanced Research, 2: 366-376.
7. S. U. Zate, P. I. Kothawade, J. W. Gajbe, A. S. Pramod, S. S. Boraste, (2010) Spectrophotometric method development and validation of itopride hydrochloride in bulk and dosage form, International Journal of Drug Delivery, 2: 340-343.
8. B. Choudhary, A. Goyal, S. L. Khokra, D. Kaushik, (2009) New visible spectrophotometric method for estimation of itopride hydrochloride from tablets using mordant blue 3 reagent, Oriental Journal of Chemistry, 25: 779-781.
9. S. Khalil, (2013) Micro- determination of Itopride hydrochloride in pharmaceutical formulations and urine samples using ICP- atomic emission spectrometry, International Journal of Pharma and Bio Sciences, 4: 786-794.
10. M. Walash, F. Ibrahim, M. I. Eid, S. Abo EL Abass, (2013) Stability-indicating spectrofluorimetric method for determination of itopride hydrochloride in raw material and pharmaceutical formulations, Journal of Fluorescence, 23: 1293-1300.
11. L. Yi, L. Min, W. Xiachong, L. Yulan, (2012) Determination of itopride hydrochloride by nonaqueous potentiometric titration, Drug Standards of China, 4: 278-280.
12. X. Hun, Z. Zhang, (2008) Electrogenerated chemiluminescence sensor for itopride with Ru(bpy)32+-doped silica nanoparticles/chitosan composite films modified electrode, Sensors and Actuators B, 131: 403-410.
13. Y. Sun, Z. Zhang, Z. Xi, Z. Shi, W. Tian, (2009) Determination of itopride hydrochloride by high-performance liquid chromatography with Ru(bpy)32+ electrogenerated chemiluminescence detection, Analyticachimicaacta, 648: 174-177.
14. H. M. El-Fatatry, M. M. Mabrouk, I. I. Hewala, E. H. Emam, (2014) Stability-indicating HPLC-DAD methods for determination of two binary mixtures: Rabeprazole sodium-mosapride citrate and rabeprazole sodium–itopride hydrochloride, Journal of Pharmaceutical
Analysis, 4: 258-269.15. V. V. Dighe, R. T. Sane, S. N. Menon, H. N. Tambe,
S. Pillai, (2006) High-performance thin-layer chromatographic determination of itopride hydrochloride in its pharmaceutical preparation and in the bulk drug, JPC-Journal of Planar Chromatography-Modern TLC, 19: 319-323.
16. The British Pharmacopoeia, (2013) Her Majesty’s Stationery Office. London: H.M.S.O.
17. A. El-Gindy, S. Emara, G. M. Hadad, (2003) Spectrophotometric and liquid chromatographic determination of trimebutine maleate in the presence of its degradation products, Journal of Pharmaceutical and Biomedical Analysis, 33: 231-241.
18. R. El-Shiekh, F. Zahran, A. A. El-Fetouh Gouda, (2007) Spectrophotometric determination of some anti-tussive and anti-spasmodic drugs through ion-pair complex formation with thiocyanate and cobalt (II) or molybdenum (V), Spectrochimica Acta Part A: Molecular and Biomolecular Spectroscopy, 66: 1279-1287.
19. F. M. Abdel-Gawad, (1998) Ion-pair formation of Bi (III)–iodide with some nitrogenous drugs and its application to pharmaceutical preparations, Journal of Pharmaceutical and Biomedical Analysis, 16: 793-799.
20. H. M. Elqudaby, G. G. Mohamed, G. M. El Din, (2014) Analytical studies on the charge transfer complexes of loperamide hydrochloride and trimebutine drugs. Spectroscopic and thermal characterization of CT complexes, Spectrochimica Acta Part A: Molecular and Biomolecular Spectroscopy, 129: 84-95.
21. N. Adhoum, L. Monser, (2005) Determination of trimebutine in pharmaceuticals by differential pulse voltammetry at a glassy carbon electrode, Journal of Pharmaceutical and Biomedical Analysis, 38: 619-623.
22. H. Elqudaby, G. G. Mohamed, G. M. El Din, (2013) Utilization of phosphotungestic acid in the conductometric determination of loperamide hydrochloride and trimebutine antidiarrhea drugs, Journal of Pharmacy Research, 7: 686-691.
23. F. Li, L. Yu, (2001) Determination of trimebutine maleate in rat plasma and tissues by using capillary zone electrophoresis, Biomedical Chromatography, 15: 248-251.
24. H. Zekai, F. Aiping, J. Guoxiang, L. Guanfeng, H. Jing, (2011) Study on detection method of impurity 3, 4, 5-trimethoxy benzoic acid in trimebutine maleate sustained-release tablets, China Pharmaceuticals, 12: 37-38.
25. H. Salem, (2005) Spectrofluorimetric, atomic absorption spectrometric and spectrophotometric determination of some fluoroquinolones, American Journal of Applied Sciences, 2: 719-729.
26. A. A. Gouda, R. El-Shiekh, A. S. Amin,

Indian Journal of Advances in Chemical Science 4(1) (2016) 85-97
97
(2008) Spectrophotometric determination of some anti-tussive drugs and its applications to pharmaceutical formulations, Analytical Chemistry, 7: 757-767.
27. S. M. Sultan, (1991) Flow injection method for the assay of phenothiazine neuroleptics in pharmaceutical preparations using ammonium metavanadate, Analyst, 116: 177-181.
28. M. E. El-Kommos, G. A. Saleh, S. M. El-Gizawi, M. A. Abou-Elwafa, (2003) Spectrofluorometric determination of certain quinolone antibacterials using metal chelation, Talanta, 60: 1033-1050.
29. G. H. Ragab, M. M. El-Henawee, S. S. El-Hay, H. M. Saleh, (2009) Atomic absorption spectrometric and colorimetric methods for determination of certain antihistaminic drugs, Egyptian Journal of Pharmaceutical Sciences, 50: 13-23.
30. A. S. Amin, (1995) Spectrophotometric and conductometric determination of clindamycin
hydrochloride in pure form and in pharmaceutical preparations, Analusis, 23: 415-417.
31. M. M. Hoseny, (2004) Spectrophotometric determination of diltiazem, fluphenazine and dothiepin hydrochloride using chromotrope 2R and rose bengal, Malaysian Journal of Pharmaceutical Sciences, 20: 64-77.
32. A. Gawad, M. Fatma, (1995) Spectrophotometric determination of oxybuprocaine hydrochloride with halofluorescein derivatives, Il Farmaco, 50: 197-200.
33. J. Rose, (1964) Advanced Physiochemical Experiments. Pitman: London, p54.
34. J. H. Yoe, A. L. Jones, (1944) Industrial and Engineering Chemistry. Analytical Edition. Vol. 16. USA: American Chemical Society, p111.
35. International Conference on Harmonisation, (2005) ICH of Technical Requirements for Registration of Pharmaceuticals for Human Use. Geneva, Switzerland: ICH.
*Bibliographical Sketch
Professor Dr. M.M. Hosny, was born in Egypt, She had completed M.Sc. Chemistry (Analytical Chemistry) at Faculty of Pharmacy –Zagazig University, Egypt (1998) and Ph.D. Degree in Chemistry at (2003), then assistant professor from 2003 to 2009 and finally She is a professor of analytical chemistry since 2014, she is presently continuing her research in synthesis of silver and gold nanoparticles, analysis of pharmaceutical preparations using different techniques. She had published 38 research papers in reputable national and international journals.